Article

Experimental and Numerical Study of the Flexural Performance of Spontaneous Combustion Gangue Coarse Aggregate Concrete Laminated Slab

1
School of Civil Engineering, Liaoning Technical University, Fuxin 123000, China
2
Liaoning Key Laboratory of Coal Gangue Resource Utilization and Energy-Saving Building Materials, Liaoning Technical University, Fuxin 123000, China
3
School of Civil Engineering, Beijing Jiaotong University, Beijing 100044, China
4
Shandong Provincial Key Laboratory of Preparation and Measurement of Building Materials, University of Jinan, Jinan 250022, China
5
School of Architecture, Liaoning Vocational University of Technology, Jinzhou 121007, China
6
China State Construction OVERSEAS Development Co., Ltd., Shanghai 200126, China
*
Author to whom correspondence should be addressed.
Buildings 2023, 13(7), 1718; https://doi.org/10.3390/buildings13071718
Submission received: 19 May 2023 / Revised: 29 June 2023 / Accepted: 30 June 2023 / Published: 5 July 2023
(This article belongs to the Section Building Materials, and Repair & Renovation)

Abstract

:
(1) Background: to study the differences in flexural performance and failure characteristics of spontaneous combustion gangue coarse aggregate concrete (SCGAC) laminated slabs and ordinary concrete laminated slabs, comparative flexural performance tests of one ordinary concrete laminated slab and four spontaneous combustion gangue coarse aggregate concrete laminated slabs (SCGACLSs) full-scale specimens were carried out. (2) Methods: The loading method was four-point unidirectional static loading; the failure mode, load–deflection curve, load–reinforcement strain curve, and load–concrete strain curve of each specimen were analyzed. In addition, the load–deflection curve of the five slabs were predicted by ABAQUS. (3) Results: The five laminated slabs showed similar behaviors in terms of failure mode, load–strain curve, load–deflection curve, and deformation and all the properties satisfied the Chinese standard GB50010 (2010). Compared with ordinary concrete laminated slabs, the cracking load of SCGACLS with a precast layer of SCGAC(C30) decreased by 15.2% and the span deflection increased by 28.3% in the ultimate condition; however, when the strength grade of SCGAC of the precast layer was increased to SCGAC(C40), the cracking load increased by 7.8% and the span deflection was similar to that of the ordinary concrete laminated slabs. All specimens conformed to the planar section assumption. In addition, the finite element model (FEM) prediction results showed that the maximum relative errors of load and deflection were <5% and <10%, respectively, indicating that the established FEM had high prediction accuracy. (4) Conclusions: The defects of reduced load-carrying capacity and uncoordinated deformation caused by the different elastic modulus of precast and cast-in-place layer concrete can be compensated by appropriately increasing the strength grade of precast layer concrete of SCGACLSs. The application of SCGACLSs in structures is feasible.

1. Introduction

Coal gangue is the solid waste discharged during coal mining and coal washing [1]. According to the survey, there are about 7 billion tons of coal gangue deposited in China, which causes serious environmental pollution [2]. Spontaneous combustion of coal gangue caused by accumulation also changes its chemical composition. However, relevant studies have shown that the chemical composition of piled spontaneous combustion gangue is similar to natural aggregate (NA). Zhou et al. [3] indicated that spontaneous combustion gangue can be used as aggregate for concrete production. On the other hand, with the advancement of urbanization and the continuous improvement of buildings, roads, and infrastructures, the amount of concrete used in construction has increased dramatically. The demand for natural stone materials as one of the important components of concrete is also increasing day by day. Therefore, searching for alternatives to NA is an urgent problem [4]. If the mountains of spontaneous combustion gangue are prepared into spontaneous combustion gangue aggregate (SCGA) after crushing and screening processes to replace the natural aggregate (NA), it can not only alleviate the local environmental pollution problems but also create comprehensive benefits for society. In addition, the implementation of this program will strongly accelerate the process of solid waste resource recovery.
There has been a great deal of related research conducted by researchers on SCGA and spontaneous combustion gangue aggregate concrete (SCGAC) in recent years. For the study on SCGA, Yang et al. [5] analyzed the chemical and physical properties of SCGA and found that SCGA had significantly fewer harmful components and good volumetric stability compared with uncombusted gangue, which can be prepared into concrete for structural components. Yao et al. [6,7] focused on the classification of SCGA and the mechanical properties of fresh concrete. Querol X et al. [8] found that SCGA had significantly lower bulk and apparent densities and significantly higher water absorption and crushing index but still met the basic requirements of the specification for aggregate properties. For SCGAC, the use of SCGAC was particularly attractive compared with ordinary concrete because of its lightweight properties and therefore a light-aggregate or sub-light-aggregate grade concrete, in addition to other advantages (particularly thermal insulation when low density was used [9], fire resistance [10], good acoustic properties [11], and workability [12]). Wang et al. [13] found that, with the increase in coal gangue dosage, the shrinkage of concrete gradually reduced; with the coal gangue dosage of 30%, 40%, and 50%, coal gangue concrete shrinkage value at 120d compared with the control group of concrete without coal gangue reduced by 6.4%, 9.3%, and 20.8%, respectively. Li et al. [14] studied the early drying shrinkage rate and mass loss rate of coal gangue aggregate concrete and natural aggregate concrete in the case of common water/cement ratio and found that the drying shrinkage value of coal gangue aggregate concrete was greater than that of ordinary aggregate concrete in the early period and tended to be stable in the long-term; however, its shrinkage value conformed to the Standard for Test Methods of Long-term Performance and Durability of Ordinary Concrete (Chinese standard GB/T50082-2019) [15], which indicated that the application of coal gangue aggregate concrete in building structures was feasible. Li et al. [16] took a reinforcement center pull-out test to study the bonding performance of reinforcement and gangue concrete and found that the higher the cube strength of gangue concrete the higher its bond strength (fcu = 27.4 MPa bond strength of gangue concrete for the same level of ordinary concrete 89%).
Although there have been a large number of experimental studies on the mechanical properties of SCGAC, so far there have been few studies on the mechanical behavior of reinforced truss spontaneous combustion gangue concrete laminated slab. Bai et al. [17] conducted an experimental study on the flexural and shear properties of raw gangue concrete beams. According to this report, the ultimate bearing capacity of reinforced concrete beams using 100% raw gangue coarse aggregate was reduced by 4.7% and the flexural stiffness was reduced by 20.4% compared with ordinary reinforced concrete beams. Li et al. [18] conducted tests on the flexural properties of spontaneous combustion gangue steel–concrete composite slab and found that, although the flexural properties of gangue concrete slab were reduced, their ductility was improved. Ma H Y et al. [19] investigated the flexural behavior of reinforced concrete beams with the SCGA. Their study showed that the behavior of the beams was similar to that of ordinary concrete beams and the strain variation in the positive section of the spontaneous combustion gangue aggregate concrete beam during the stressing process was consistent with the assumption of a plane section.
In recent years, green concrete has become one of the hot and frontier topics of interest in the engineering community at the domestic and international levels [20,21,22]. As a “green concrete”, to make SCGAC safely and reliably applied to concrete structures and to vigorously promote the application of green solid waste materials in prefabricated buildings [23,24,25], comprehensive testing and theoretical studies on its structural or component properties are still needed. To study the differences in flexural performance and failure characteristics of SCGACLSs and ordinary concrete laminated slabs, comparative flexural performance tests of one ordinary concrete laminated slab and four SCGACLSs full-scale specimens were carried out; all specimens had cross-sectional dimensions of 600 mm × 130 mm, a length of 2100 mm, and a clear span of 1800 mm. The failure process, cracking load, ultimate load, deflection, and crack development were analyzed through four-point unidirectional static loading and the bearing capacity of each specimen was calculated based on the Code for Design of Concrete Structures (Chinese standard GB50010-2010) [26]. Finally, the finite element model of the SCGACLSs was established by ABAQUS software and the reliability of the model was verified by using the available test data. The established finite element model can effectively predict the flexural performance of SCGACLSs and provide a reference for the design and engineering applications of SCGACLSs.

2. Materials and Methods

2.1. Material

2.1.1. Material Properties

P.O 42.5 grade Ordinary Portland Cement (OPC) produced by Liaoning Daying Cement Group Company was used; the grade of fly ash was II, which met the requirements of Common Portland Cement (Chinese standard GB175-2007) [27]. The main technical parameters of cement and fly ash are shown in Table 1. The mixing water used in the test was city tap water, the fine aggregate was river sand with an apparent density of 2570 kg/m3, and the fineness modulus of sand was 2.70, which met the requirements of Sand for Construction (Chinese standard GB/T 14684-2011) [28]. The coal gangue was taken from the coal gangue mountain of Fuxin Haizhou Mine by crushing, screening, grading, and natural aggregate for ordinary crushed stone, with two kinds of aggregate particle sizes ranging from 5 mm to 20 mm. The physical properties of the two coarse aggregates are shown in Table 2; they met the requirements of Pebble and Crushed Stone for Construction (Chinese standard GB/T14685-2011) [29]; the macroscopic images are shown in Figure 1. The reinforcement bars used in the tests were HRB400 with yield strength of 473 MPa, ultimate strength of 634 MPa, and modulus of elasticity of 200 GPa.

2.1.2. Mix Proportions

According to the previous research on SCGA [30,31,32], it was found that, compared with natural aggregates, SCGA had many defects, such as high porosity, which made the SCGAC mixes have a gradual loss in a slump and could not meet the requirements of the concrete with the large liquidity. In response to this feature, Zhou et al. [33] found that the above problem of excessive time loss could be solved by pre-watering the SCGA 1 h in advance before mixing. The concrete mix ratio is shown in Table 3. It is necessary to emphasize that, although the collapse of each group of concrete was small, its application in precast concrete was sufficient [34].

2.2. Specimen Preparation

2.2.1. Design of Specimens

Based on the National Building Standard Design Drawing “Truss Reinforced Concrete Laminated Slab” (Chinese standard 15G366-1) [35], five laminated unidirectional slabs were designed, namely NCLP1, GCLP1, GNLP1, GNLP2, and GNLP3. The dimensions of all slabs were 2100 mm × 600 mm × 130 mm. For all specimens, the effective span was 1800 mm. The thickness of the precast layer was 70 mm, the thickness of the cast-in-place layer was 60 mm, and the total thickness of the laminate was 130 mm, as shown in Figure 2b. NCLP1: the concrete used for both the precast slab and cast-in-place layer was C30 grade NAC(C30). GCLP1: the concrete used for both the precast slab and cast-in-place layer was C30 grade SCGAC(C30). GNLP1: the concrete used for the precast slab was C30 grade SCGAC(C30) and the concrete used for the cast-in-place layer was C30 grade NAC(C30). GNLP2: the concrete used for the precast slab was C35 grade SCGAC(C35) and the concrete used for the cast-in-place layer was C30 grade NAC(C30). GNLP3: The concrete used for the precast slab was C40 grade SCGAC(C40) and the concrete used for the cast-in-place layer was C30 grade NAC(C30).
Each specimen was equipped with 2-bay reinforcement trusses along the width of the slab. The details of the reinforcement trusses used in the concrete slab are shown in Figure 2c. The distribution reinforcement of each specimen was equipped with HRB400 grade reinforcement with a diameter of 8 mm and a spacing of 200 mm. The longitudinal reinforcement for each specimen was provided with HRB400 grade reinforcement with a diameter of 8 mm and a spacing of 225 mm. The specific parameters of each specimen are shown in Table 4; the details of the laminated slab are shown in Figure 2.

2.2.2. Preparation of Specimens

It was found that the fluidity of SCGAC could not meet the requirements of pumping cast-in-place large fluidity [36,37] and that its collapse degree was small, as mentioned before. On the other hand, the cast-in-place layer as a pressurized layer required high strength and stiffness of concrete. Therefore, SCGAC was used as the precast layer of the laminated slab, while the cast-in-place layer was made of ordinary concrete. The preparation of specimens included six steps: formwork support and reinforcement tying, precast slab concrete casting, brushing at the laminated surface, maintenance of the precast slab, top slab concrete casting, and maintenance completion and demolding. Among them, the purpose of brushing at the laminated surface was to better combine the old and new concrete as a whole and improve the integrity of the laminated slab. After the precast slab was maintained for 28 d, the formwork support was immediately carried out for the casting layer of concrete; after the casting was completed, the surface was plastered and then moved to the maintenance room to continue maintenance for 28 d. When the maintenance was completed, the formwork was removed and the specimen was lifted to the laboratory for flexural testing. At this time, the age of concrete in the precast layer was 56 d and the concrete in the cast-in-place layer was cured for 28 d. In order to prevent shrinkage of the concrete in the precast layer and the concrete in the cast-in-place layer, due to the pouring time difference between the precast layer and the cast-in-place layer, a plastic film was wrapped around the outer surface of each specimen to prevent moisture loss from the specimen. Furthermore, we had to ensure that the cement grade, the same aggregate size, the variety of admixtures, the outside environment, and the vibrating time used for the concrete cast in the cast-in-place layer were consistent with those of the precast layer In order to avoid the interference of these factors to the final experimental results. The specimen preparation process is shown in Figure 3.

2.3. Test Setup and Procedures

2.3.1. Test Setup

A 5000 kN universal testing machine was used to perform bending tests on laminated slab specimens. All stacked specimens were horizontally located and tested. The tests were performed on a portal counterforce frame with loading devices from top to bottom: hydraulic jacks, pressure transducers, distribution beams, and supports. The ATS380 test system was used to collect data [38]. The deflection, cracks, and strains of concrete, longitudinal reinforcement, and reinforcement of the specimens were mainly tested in the experiment. In the experiment, all the laminated specimens were supported by simple support and the flexural load was applied in the form of monotonic continuous graded load based on Code for Design of Concrete Structures (Chinese standard GB50010-2010) [26]. The loading devices are shown in Figure 4.

2.3.2. Test Procedures

Test procedures were performed according to the Standard for Test Methods of Concrete Structures Specifications (Chinese standard GB/50152-2012) [39]. The displacement meters were placed at positions along the span of the test specimen, reinforcement strain gauges were arranged on the longitudinal stressed reinforcement along with the mid-span and 1/4 span positions of the laminated slab, and concrete strain gauges were glued at the mid-span slab side and top and bottom positions of the slab to investigate the effect of strain changes on the concrete [40]. To verify the hypothesis of planar sections, the concrete strain gauges were glued equally spaced along the height direction in the middle of the slab side. Preloading was required before the test; the loading rate was 2 kN/min, which could make each part contact well. In this process, the inspection of each instrument and equipment was also required. After the preloading was completed, the formal loading was performed. Initially, the loading values were 2 kN/min for each stage before the specimen cracked and 3 kN/min for each stage until the member failed after the specimen cracked. The strains in the steel and concrete were automatically recorded by the ATS380 test system at each stage. Crack patterns were also observed and marked with a black marker on the specimen surface during each loading stage [41]. When the upper concrete was crushed, the mid-span deflection reached 1/50 of the net span, or the load-carrying capacity was significantly reduced, the specimen could be considered damaged and loading was stopped. The layout of the concrete strain gauges on the side of the slab and the layout of the reinforcement strain gauges are shown in Figure 5.

3. Results and Analysis

3.1. Failure Modes

We found that five laminated unidirectional slabs presented similar behavior in terms of failure mode, load–strain curve, load–deflection curve, and deformation in the experiment. The failure process had gone through an elastic stage, plastic stage, reinforcement yield, and limit state until failure. The development of cracks on the side of the slab after the damage of each specimen is shown in Figure 6. For the control slab specimen NCLP1, the first crack appeared in the middle third (in the normal bending zone) under a load of 24.3 kN; the cracking load was about 30% of the ultimate load. As the load continued to increase, most of the cracks developed in the constant bending zone and at the contact between the rigid transfer girder and the top of the slab. In addition, bending cracks also developed symmetrically at the span and extended towards the full width of the slab, as shown in Figure 6. As the load continued to increase, the reinforcement yielded [42] and the crack extension became more pronounced. The ultimate displacement of the NCLP1 was 20.46 mm.
For the specimens GCLP1, GNLP1, GNLP2, and GNLP3, the first cracks were observed in the constant bending zone, respectively, at the load of 17.6 kN, 20.6 kN, 23.0 kN, and 26.2 kN. As the load increased, the reinforcement gradually yielded, followed by interfacial cracks appearing in the constant shear zone on both sides of the slab when the load reached 66 kN. In terms of the overall bending response of the slab, there were three different cracking patterns [43]. The first one corresponded to bending cracks (the continuous bending cracks developed in the normal bending zone and gradually extended deeper into the slab). The second one corresponded to bending cracks (the bending cracks in the upper and lower half-slab penetrations, cracks developed first in the upper half-slab at the loading position, then expanded with the interface and developed further in the lower half-slab). The third one corresponded to cracks (the cracks through the entire bottom slab). The specimens GNLP1 and GNLP2 reached the ultimate bearing state when the maximum crack width at the reinforced bar in the pure bending section reached 1.5 mm. Specimens GCLP1 and NCLP1 reached the ultimate state when the longitudinal reinforcement strain reached 0.01. When specimen GNLP3 reached the ultimate load-bearing condition, the strain of mid-span reinforced bars and crack width reached the failure mark almost simultaneously [44].
It was also found in the test that, due to the continuity of the truss steel chord and the abdominal bar, it connected the precast slab and post-cast concrete as a whole, thus improving the overall stiffness and flexural capacity of the laminated slab. Before each specimen reached the ultimate state, GNLP1, GNLP2, and GNLP3 slabs (based on different concrete combinations) did not crack or slip on the laminated surface. After unloading, the maximum crack width of each specimen decreased to 3–6 mm, indicating that the specimen still had a certain deformation recovery ability; the deformation recovery was above 40%.

3.2. The Test Results

The test results of each specimen are shown in Table 5, from which it can be seen that the cracking loads of the five laminated slabs were GCLP1 < GNLP1 < GNLP2 < NCLP1 < GNLP3 in the order from small to large. Compared with specimen NCLP1, the cracking loads of specimens GCLP1, GNLP1, and GNLP2 decreased by 27. 6%, 15.2%, and 5.3%, respectively; however, specimen GNLP3 showed an increase in cracking load by 7.8%. For each specimen deflection, with the increase in concrete strength grade of the bottom slab to C40, the deflections of specimens GNLP3 and NCLP1 were close to 20.50 mm under the ultimate load condition. However, the deflection decreased by 21.9% compared with specimen GNLP1, which was consistent with the result of the cracking load. Compared with NCLP1, the ultimate bearing capacity of GCLP1, GNLP1, and GNLP2 decreased by 5.9%, 4.9%, and 1.4%, respectively, while the ultimate bearing capacity of GNLP3 increased by 3.7%, indicating that the material difference between NAC and SCGAC could be compensated by increasing the strength grade of SCGAC.
It was also found in the experiment that, after increasing the strength grade of precast slab concrete to C40, the unloading of GNLP3 resulted in a significant rebound in the deflection of each slab with a rebound of more than 40%, indicating that the SCGACLSs with reinforced trusses had a good recovery capacity. The ratio of cracking load to ultimate load for each specimen ranged from 0.2 to 0.3; the maximum crack width was 6.1 mm.

3.2.1. Load–Deflection Relationship

The load and mid-span deflection curves for each specimen are shown in Figure 7. All the laminated slabs had similar deflection variation patterns, with three distinct phases [45,46,47,48,49]: elastic working phase, cracked working phase, and damaged phase. In the elastic working phase, the load and deflection values were small and the curves showed approximately straight lines. While in the working phase with cracks, the truss reinforcement carried part of the load and the deflection curve did not show an inflection point. In the damage stage, all the specimens had obvious characteristics before the damage, which was typical of ductile damage (ductile damage meant that the material was subjected to excessive stress that exceeded its yield limit or strength limit, thus producing a large plastic deformation and finally leading to fracture, corresponding to brittle damage) [50]. For different concrete combinations, the span deflection under the same load in the middle and late stages of loading was GNLP1 > GCLP1 > NCLP1; the span deflection of GNLP1 was increased by 28.3% compared with NCLP1. The authors suggest that this was due to the different modulus of elasticity of the two, resulting in a laminate that was worse than the same combination of materials [51]. From the early stage of loading to the ultimate damage, the deflection value of specimen GNLP1 was always larger than that of specimen NCLP1 compared with specimen NCLP1 and the cracking load and ultimate load were also smaller than that of specimen NCLP1. It indicated that the performance of specimens in the form of different concrete combinations was inferior to that of ordinary concrete specimens in the control group; the reason for this was that there was a difference in the value of the elastic modulus of different concrete, which led to the precast slab and the cast-in-place layer not being coordinated. It can be seen that the slope of the GNLP3 curve of the specimen in the pre-loading period was larger than that of other specimens and the curve tended to be close in the later period. This indicated that increasing the concrete strength grade of the precast slab could indeed significantly improve the cracking load of the specimens, which also had a certain improvement on the stiffness and integrity of the specimens. In addition, the related literature shows that the shrinkage of concrete also affects the spanwise deflection and bearing capacity of the laminated slab; the lower the modulus of elasticity, the greater the shrinkage value of concrete [52]. Because different types of concrete can cause shrinkage of two different kinds of concrete due to the difference of aggregates (high water absorption, high crushing value, etc.), taking specimen GNLP1 as an example, the precast and cast-in-place layers were two kinds of concrete with different modulus of elasticity and, although relevant studies have shown that the shrinkage value of SCGAC is in accordance with the specification, we could not ignore that the shrinkage of concrete due to the precast and cast-in-place layers may have caused the cracking load and load carrying capacity of the specimen to decrease. On the other hand, SCGAC, as a new material, would also have a different bond strength to the reinforcement than ordinary concrete, so it could also affect the final results [53].
To sum up: concrete strength grade has more influence on flexural performance and the cracking load of the laminated slab than concrete combination form and the difference in elastic modulus of precast-post-cast layer concrete is the key to ensuring whether the two can work in coordination. At the same time, we cannot ignore the effect of shrinkage of concrete in precast and cast-in-place layers on the bearing capacity of the specimen; the effect of specific elastic modulus and the concrete shrinkage difference on the cracking load of the laminated slab needs further study by scholars.

3.2.2. Load–Reinforcement Strain

The stress–strain curve developed in the longitudinal reinforcement is shown in Figure 8. The trend of each curve was roughly the same, similar to the material propriety relationship curve of HRB reinforcement. The strain values for the elastic stage were below 2365 × 10−6; for the yielding stage they were over 2365 × 10−6. The strain in the midspan of the reinforcement increased linearly with the load in the pre-loading period and, with the cracking of the concrete in the bottom slab, the reinforcement entered the yielding stage. The truss lower chord reinforcement and longitudinal reinforcement in the laminated slab continued to bear the external load and, after the reinforcement reached yielding, until the specimen reached the damage mark. Compared with NCLP1, the longitudinal reinforcement strains of specimens GNLP2 and GNLP3 grew more slowly under the same conditions, which indicated that the strength level of the SCGAC precast slab could be properly increased to delay the yielding of reinforcement under the premise of satisfying the damage criteria. It also indicated that the SCGACLS could be used instead of the ordinary concrete laminated slab, as long as the laminated slab is reasonably designed.

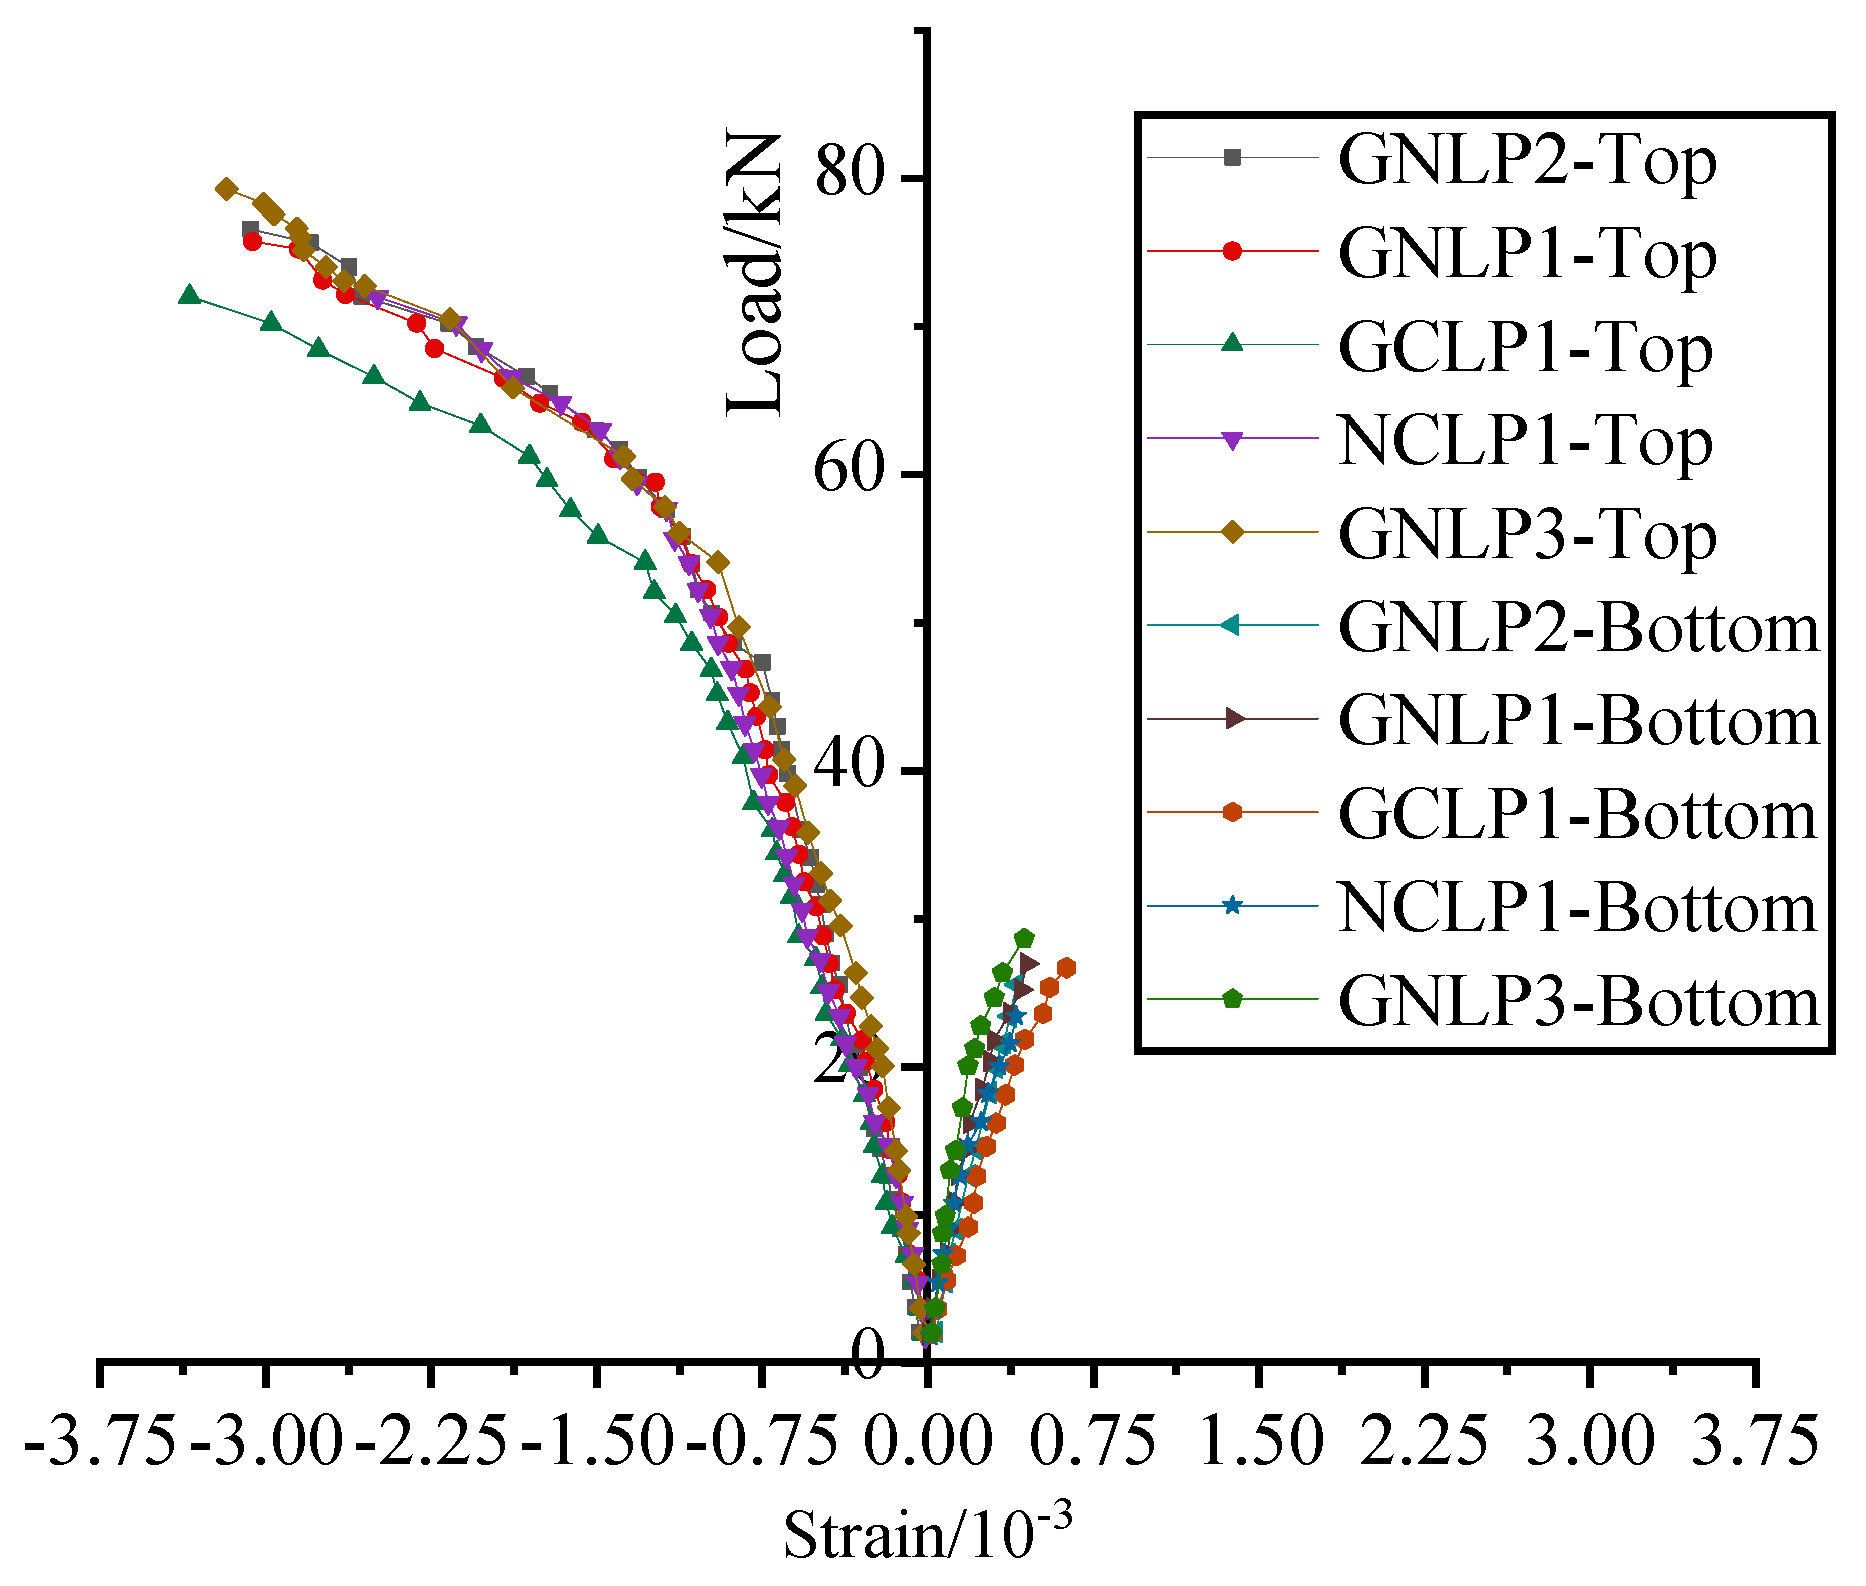
3.2.3. Load–Concrete Compressive Strain

Figure 9 shows the compressive strain curves of the concrete across the top and bottom of the middle slab of each specimen. The curve can be subdivided into the elastic stage and the plastic stage [54]. At the beginning of loading, the load and tensile and compressive strains of concrete increased linearly, indicating that the sectional stiffness remained unchanged and the concrete was in the elastic working stage. After cracking, the bottom concrete strain failed; therefore, the strain slope of the top concrete decreased clearly and the specimen entered the elastic-plastic stage [49]. It also can be seen from Figure 9 that the strain of the GCLP1 specimen increased the most under the same load and there was an obvious unloading section (a straight line approximately) in the load and concrete strain curve of the laminated slab.
In addition, since the laminated slab in this study was a composite material, the theory of deformation between different materials of the laminated slab was also more complex. In addition to experimental or ABAQUS analysis, more novel and powerful numerical methods have been recently proposed to establish the load–strain curves of composite materials, among which the “Galerkin” [55,56] and the “Bezier” [57] methods have been have been proven to have higher accuracy and stability than other numerical methods; therefore, using this method could also replace the previous load–strain curves.

3.2.4. Verification of the Plane Section Hypothesis

The strain variation curves of concrete strains on the slab side in the span of the laminated slab specimen are shown in Figure 10a, where the horizontal coordinate was the concrete longitudinal strain and the vertical coordinate was the height of the specimen from the bottom of the laminated slab; the strain gauges were pasted at 0 mm, 25 mm, 50 mm, 75 mm, 100 mm, and 125 mm from the bottom of the slab in the span. From Figure 10a, it can be seen that the concrete strains on the slab side in the elastic phase were distributed linearly with the height of the section, indicating that the laminated slab forces were in accordance with the assumption of the horizontal section. In Figure 10b, it can be found that, at 0.4 kN, the concrete strains in the span of each specimen on the slab side were a lot less due to the small load, among which the curves of specimens NCLP1, GNLP2, and GNLP3 were very close; the maximum tensile strains did not exceed 20 × 10−6, while the strains of specimens GNLP1 and GCLP1 varied between 30 × 10−6 and 50 × 10−6. As the load increased to 8.0 kN, as shown in Figure 10b, the maximum tensile strain of specimen GNLP1 was separated from the other specimens and the maximum tensile strain was close to 2000 × 10−6, which was because the precast and cast-in-place layers of specimen GNLP1 were two different materials of concrete; the cracking load of specimen GNLP1 was also the smallest due to the difference of elastic modulus of the two, which led to the non-synergistic concrete deformation, which was consistent with the cracking load results in the previous paper. However, this phenomenon can be avoided by increasing the strength level of the precast slab concrete, which could be verified in specimen GNLP3.

4. Bearing Capacity Calculation

4.1. Cracking Load

At present, there is no unified calculation formula for the bending capacity of the SCGACLS. Therefore, according to the Code for Design of Concrete Structures (Chinese standard GB50010-2010) [26] (hereinafter referred to as the Code), the calculation formula for cracking bending moment of concrete is:
M c r = γ f t k W 0
γ = 0.7 + 120 h γ m
where Mcr is the cracking bending moment; γ is the coefficient of influence of the plastic resistance of the section of the concrete element; γm is the basic value of the plastic influence coefficient of concrete member section resistance moment; h is the section height. When h < 400 mm, take h = 400; when h > 1600 mm, take h = 1600 mm; W0 is the elastic resistance moment at the tensile edge of the transformed section of the member; f t k is the standard value of axial tensile strength of concrete and concrete is used in the test for measured tensile strength.
The tensile longitudinal bar in the slab is converted into concrete with an equivalent area according to the elastic modulus ratio n = Es/Ec between the steel bar and the corresponding concrete, which is taken as a homogeneous elastic material. The position of the neutralizing axis x0 is calculated. The converted section area A0 = Ac + (n − 1)·As and the section resistance moment W0 of the tensile edge are given in the following equation.
W 0 = I 0 h X 0
I 0 = b 3 x 0 3 + h x 0 3 + ( n 1 )   A s ( h 0 x 0 ) 2
x 0 = 1 2 b h 2 + n 1 A S h 0 / A 0
By substituting (3)~(5) into Equation (1), the calculated value of the concrete cracking moment can be obtained. The cracking moment Mcr,c and measured cracking moment Mcr,t of the open section of each specimen calculated from the test (1) are shown in Table 6.
As can be seen from Table 6, for GNLP1, GNLP2, and GNLP3 with different concrete combinations, increasing the concrete strength grade of the precast slab had a certain influence on the cracking load of the laminated slab. The theoretically calculated values of each specimen were close to the measured values, which met the basic requirements of relative error. Therefore, it is suggested that the cracking load of the SCGACLS can be approximately calculated according to the calculation method of the cracking load of the ordinary concrete laminated slab.

4.2. Ultimate Load

The calculation formula of the flexural bearing capacity of a normal section of concrete in the Code was selected. It was assumed that the compressive stress distribution of the SCGAC was similar to that of whole cast concrete; the characteristic coefficients of stress graphs K1, K2, and K3 were introduced without considering the stress of concrete in the tensile zone. SCGACLSs under the action of the limit of normal section stress distribution are shown in Figure 11; K1 indicates laminated slab and the ratio of the maximum compressive stress of concrete average, K2 indicates force point pressure zone height and the ratio of compressive zone height, K3 indicates maximum stress and cast-in-place concrete is the ratio of compressive strength of concrete.
When the laminated slab is in the bending limit state, the static equilibrium equation can be obtained from Figure 11:
K 1 K 3 f c b x = f y A S
M U = K 1 K 3 f c b x ( h 0 k 2 x )
where f y is the yield strength of tensile reinforcement; x is the height of the compression zone of the section; h 0 is the effective height of the section; As is the section area of tensile longitudinal reinforcement; b is the cross-section width of the laminated slab. The characteristic coefficients K1, K2, and K3 are determined by referring to modern concrete superposition structure, namely K1 × K3 = 0.75, K2 = 0.45.
The calculation value of normal section bearing capacity Mu,c and the measured value Mu,t of each specimen are compared in Table 7.
Table 7 shows that, among the five test slabs, the maximum difference between the measured value and the calculated value of ultimate bearing capacity appeared in GNLP1, which was 11.28%, and the difference between the other specimens was between 8.56% and 11.23%. The reason for this was that cracks gradually extended upward with the gradual increase in load. The development of cracks was restricted by the abdominal bars of the truss and the abdominal bars made a certain contribution to the bending capacity of the specimens. Therefore, when the calculation model did not consider the action of the truss belly bar, the specimen in the theoretical calculation reached the yield load; the contribution of the truss belly bar to the ultimate bearing capacity remains to be further studied by scholars.
At the same time, the above method to calculate the spontaneous combustion gangue concrete slab bending bearing capacity was based on the results of the short-term load-bearing capacity test, but, in the actual engineering design, the concrete of laminated slab should be considered long-term performance and local characteristics and mechanical properties of the SCGA and reduced elastic modulus test result of the differences. The specific correlation difference coefficient needs to be further studied.

4.3. Crack Calculation

The maximum crack width is calculated according to the formula in the Code, which can be expressed as:
ω m a x = τ l τ s ω m
ω m = α c r ψ σ s E s β ( 1.9 c + 0.08 d e q ρ t e )
ψ = 1.1 0.65 f t k ρ t e σ s
σ s = M 0.87 A S h 0
where τ l is the expansion coefficient of long-term effects, which is 1.0; τ s is the expansion coefficient of short-term crack width, which is 1.66; f t k is the standard value of axial tensile strength of concrete, which is the same as the cracking moment calculated in this paper. The value of M is the same as the bending moment used for deflection. The meanings of other symbols are as described in the Code.
According to Equation (9), the calculated value ω m a x , c of the maximum crack width of each specimen was compared with the measured value ω m a x , t , as shown in Table 8.

5. ABAQUS Simulation Analysis

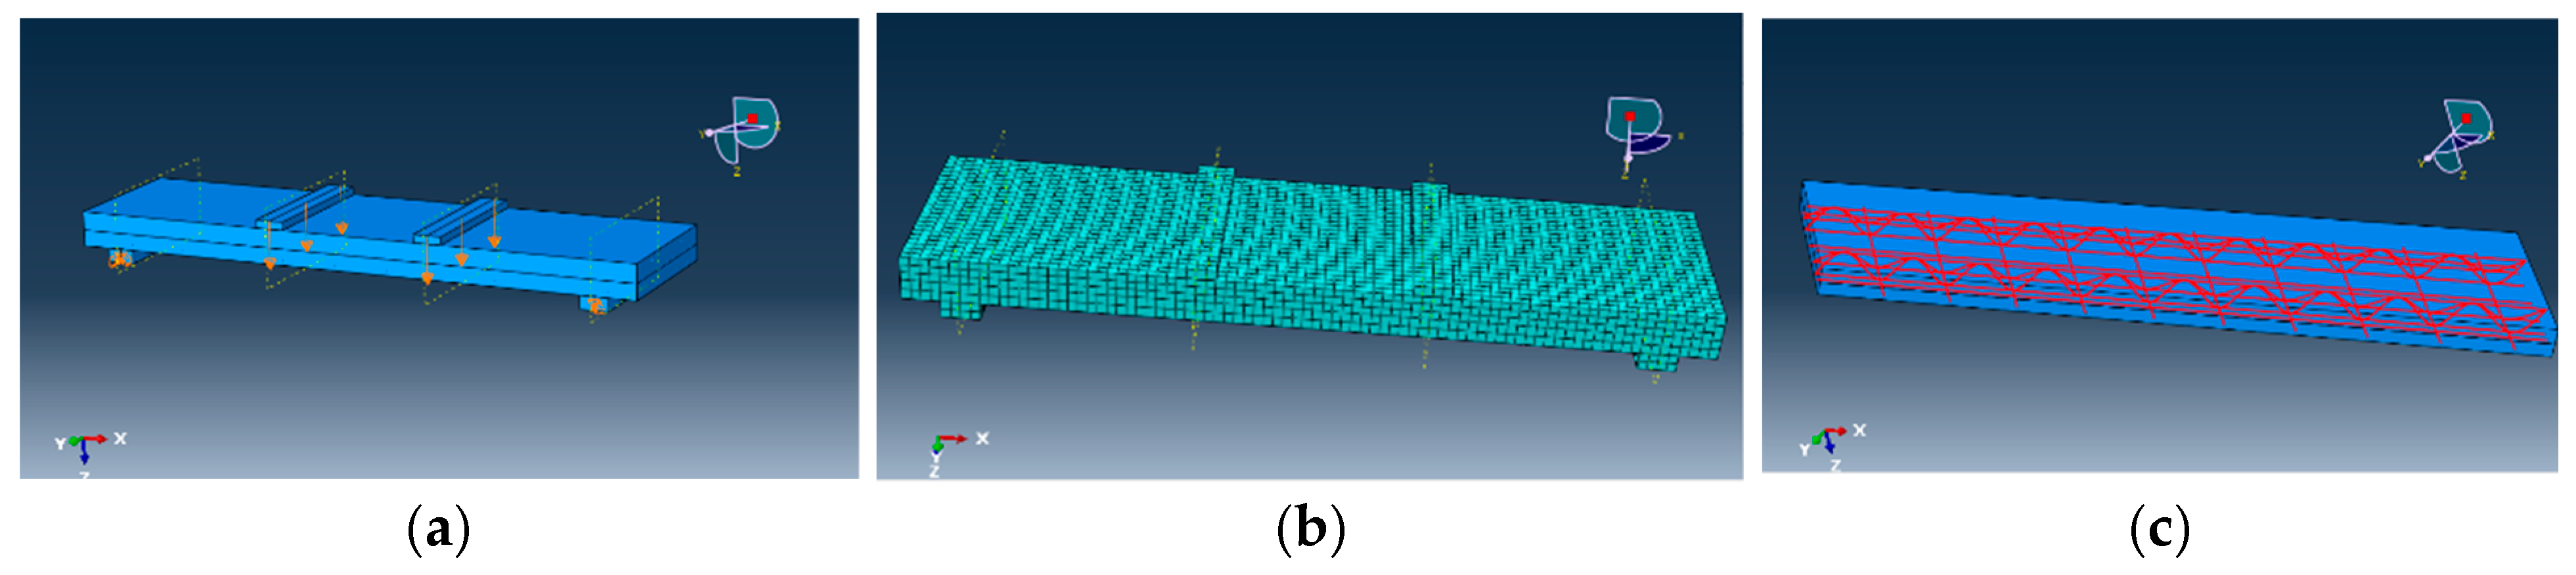
5.1. Finite Element Modeling

ABAQUS software was used to establish a finite element model of the flexural performance of the precast concrete laminated slab. The model mainly included the top slab, bottom slab, support, spacers, truss reinforcement, and other parts. The steel reinforcement was modeled by a T3D2 truss unit and the concrete was modeled by a linear hexahedral unit (C3D8R) in an eight-node reduced integral format [58]. All the reinforcement was embedded in the concrete solid model and the effect of sliding between the reinforcement and concrete was not considered. The upper surface of the precast slab and the lower surface of the top slab were connected by (surface-to-surface) and, for the boundary conditions, the translational degrees of freedom in the X, Y, and Z directions of all nodes at the left edge of the bottom slab were constrained to simulate fixed hinge bearings; meanwhile, the translational degrees of freedom in the Y and Z directions of all nodes at the right edge of the bottom surface were constrained to simulate movable hinge bearings [59] and vertical displacements were applied to the top shim of the model by displacement loading until the model failed. The finite element model is shown in Figure 12.

5.2. Relationship between Stress and Strain of Concrete and Reinforcement in FEM

5.2.1. Concrete

This present study on the compressive principal structure relationship curve of SCGAC is rarely reported; the authors conducted an experimental study on the compressive properties of SCGAC with coarse aggregate based on the existing research [60]; the principal structure model of SCGAC with coarse aggregates of different strength grades was proposed. The modulus of elasticity of SCGAC and NAC were taken from Table 3, based on the previously measured data.
According to [61], the stress–strain curves of all varieties of concrete can be expressed by Equation (12). Based on the experimental data, the curve fitting was carried out based on Marquardt (McQuart method) [62] and the general global optimization method using the software IstOpt; the equations of stress–strain curves of SCGAC of different strength grades were derived, as detailed in Table 9 and Figure 13.
y = a x + ( 3 2 a ) x 2 + ( a 2 ) x 3 , 0 x 1 x b ( x 1 ) 2 + x , x > 1
where x is the ratio of the strain to the peak strain; y is the ratio of the stress to the peak stress.
To verify the accuracy of the fitting formula, three representative groups of SCGAC(C30), SCGAC(C35), and SCGAC(C40) were selected and six specimens of each group were formed and tested for stress–strain curves after 28 d of standard maintenance. Test results: SCGAC(C30) error 5.83%, SCGAC(C35) error 4.92%, and SCGAC(C40) error 7.17%. The calculated values were in good agreement with the measured values, indicating that the stress–strain curves of concrete with different solid waste coarse aggregates established in this paper were of high accuracy and could be used as a database of finite element parts to provide a reference in the actual engineering prediction of the SCGA.

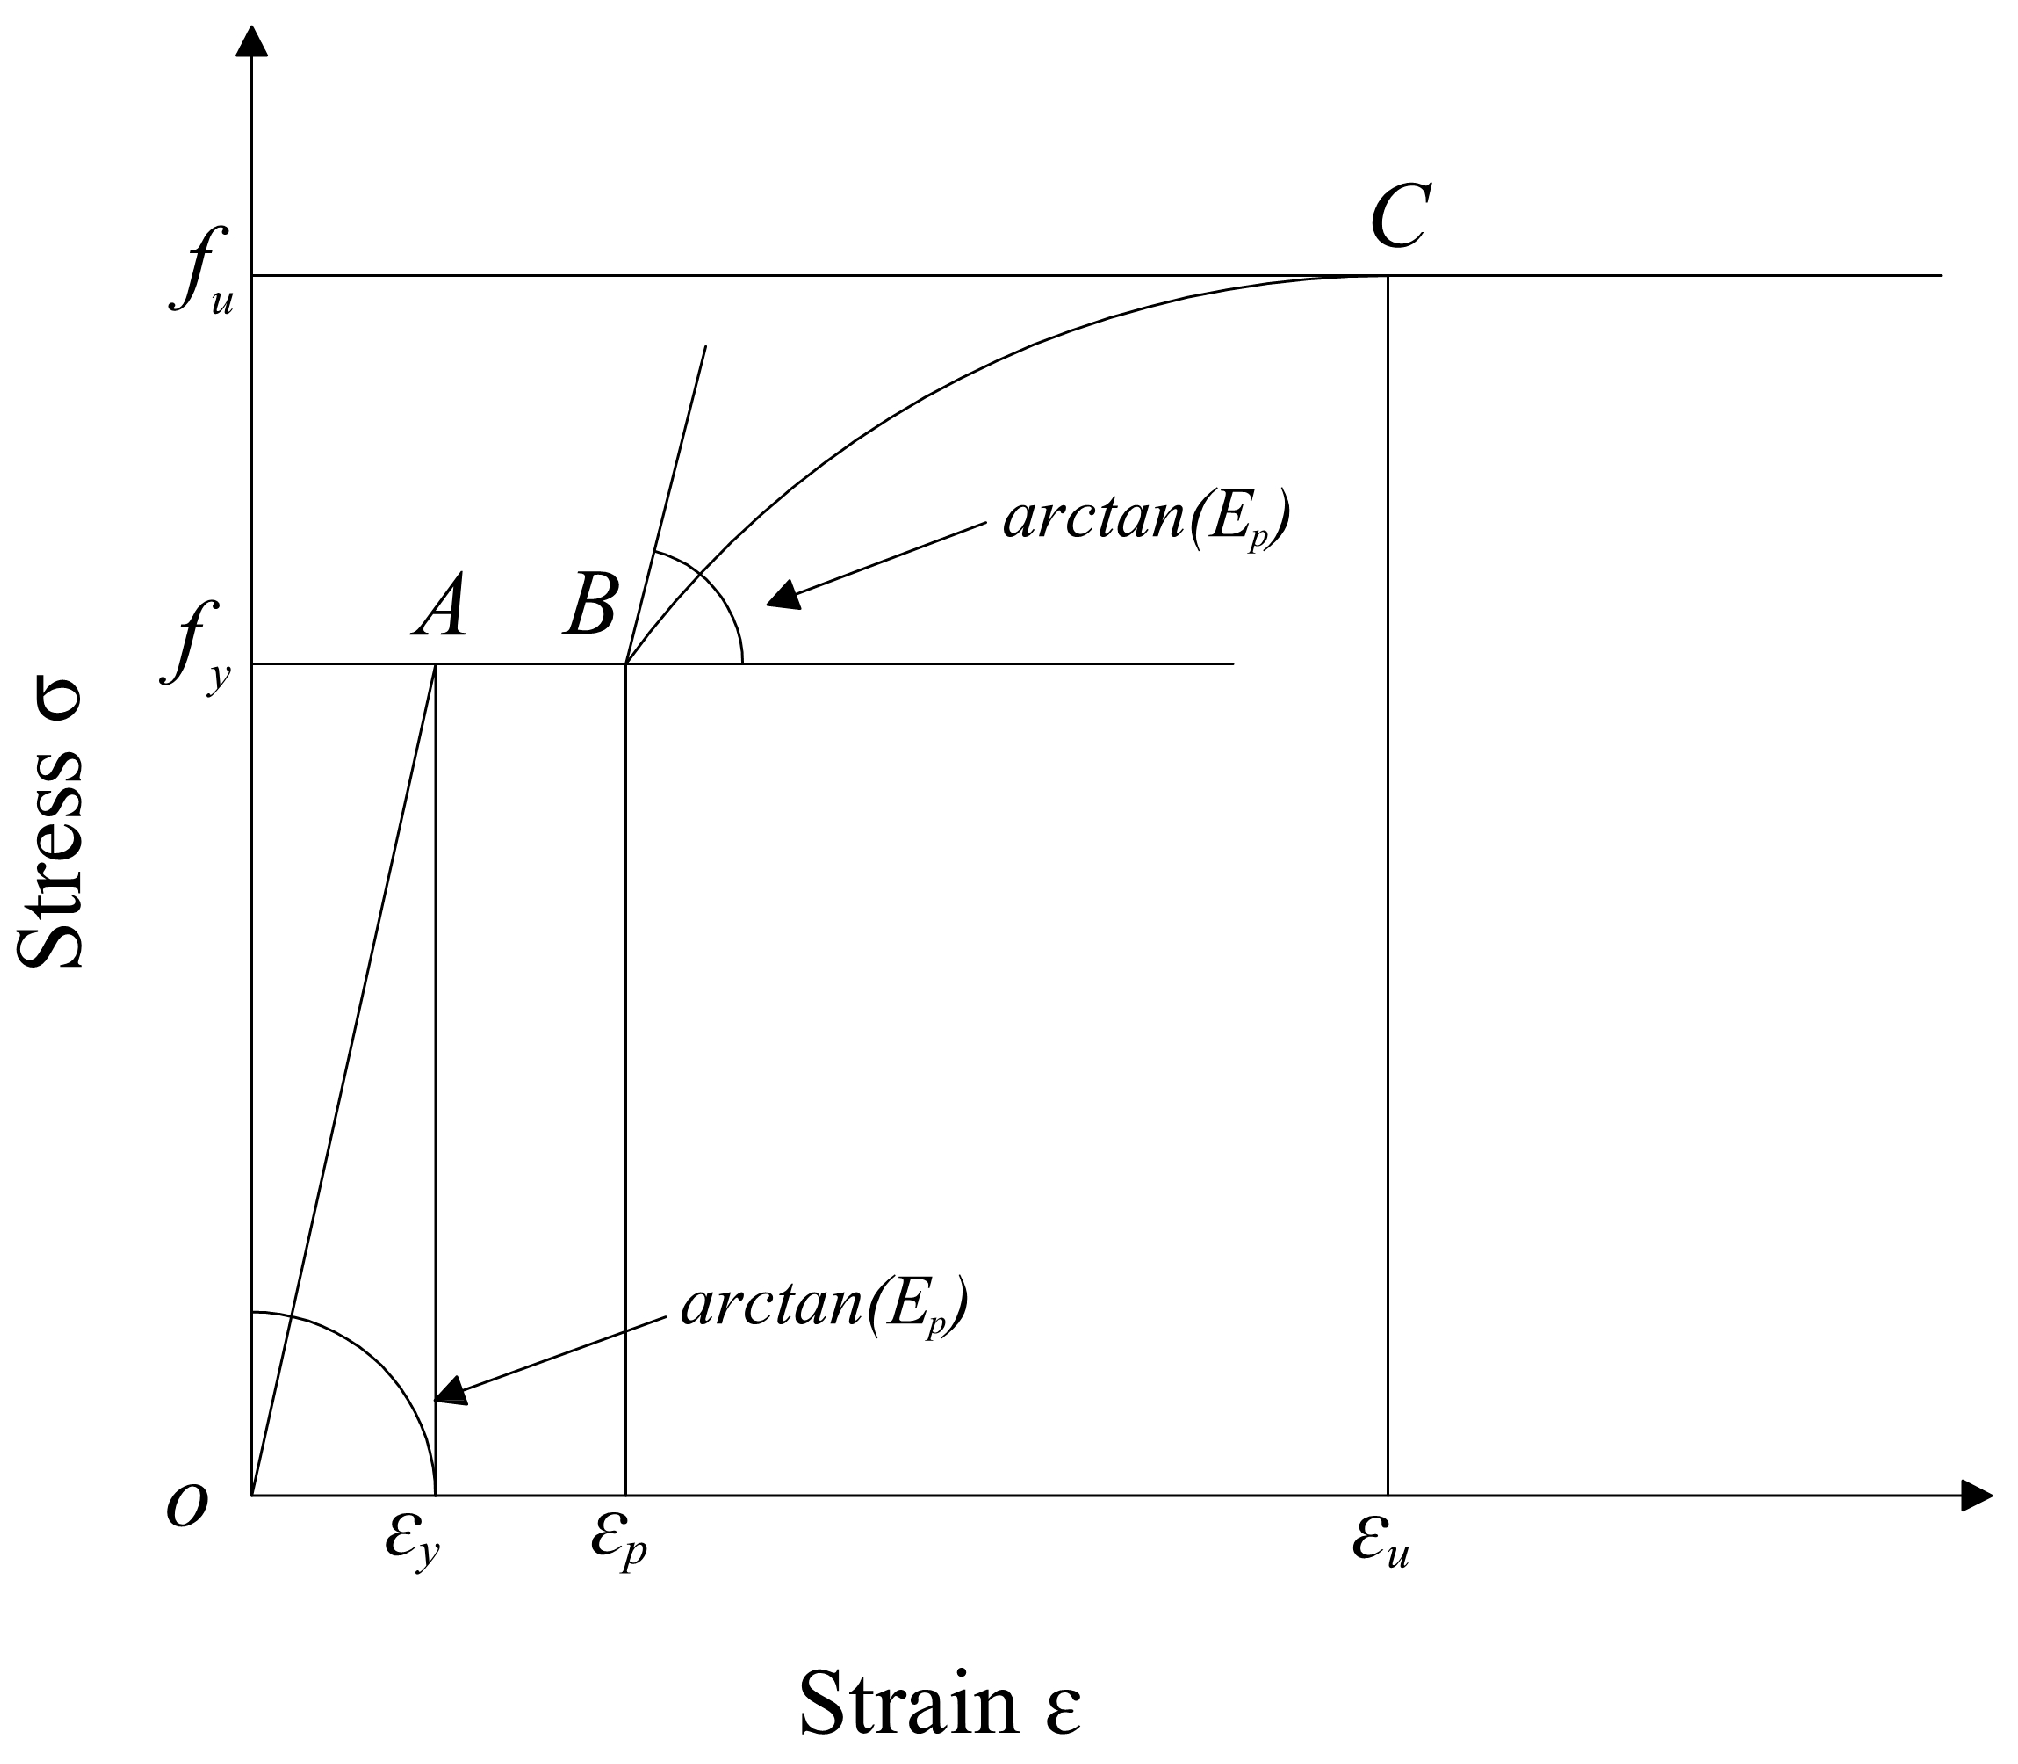
5.2.2. Reinforcement

For the principal structure relationship of the reinforcement, the elastic–plastic model recommended in the literature [63] was used; its stress–strain curve is shown in Figure 14, where the OA section was the elastic phase and the steel reached the yield strength fy at point A. The slope of the OA section was the elastic modulus Es; the BC section was the strengthening phase; the reinforcement phase began at point B. The corresponding strain at point B was εp and the initial elastic modulus Ep was reinforced; the ultimate strength fu was reached at point C and the corresponding strain was εu.

5.3. Simulation Results

5.3.1. Stress Distribution of Concrete and Truss Reinforcement

Taking specimen GNLP2 as an example, according to the concrete stress cloud diagram of each specimen, it can be seen that, as shown in Figure 15a,b, the concrete compressed zone was located at the top layer of concrete between the two supporting and the compressive stress at the center of the top surface was the maximum and decreased continuously with the radiation to the surrounding of the slab. The maximum compressive stress of each specimen model was around 23 MPa, which was less than the ultimate compressive stress of each specimen cast-in-place concrete; thus, there was no concrete breaking in the concrete compressed zone at this time. In addition, compared with the actual process of each specimen, there was no concrete crushing in each cast-in-place specimen when the displacement was loaded to 30 mm, which indicated that the simulation results were consistent with the test phenomenon. As shown in Figure 15c, it can be seen that the bottom longitudinal tensile reinforcement had the maximum stress in the mid-span region and gradually decreased to the sides. The maximum compressive stress was generated on the top compressive reinforcement of the joist reinforcement as well as on the web reinforcement, which indicated that the presence of the joist reinforcement not only bore the longitudinal tensile stress and helped the concrete in the top compressive zone to bear part of the compressive stress but the web also acted as a stress transmitter to make the joist reinforcement work better together as a whole [64]. The maximum stress of the longitudinal tensile reinforcement in each specimen reached about 490 MPa, which exceeded the yield strength of the reinforcement, indicating that the reinforcement had started to yield at this time, showing the same phenomenon as the yielding and sharp increase in deflection of the reinforcement during the actual test. Figure 15d shows the overall deformation of the laminated slab specimen model; as can be seen from the cloud, the overall deflection change was relatively uniform, the deflection in the middle of the span was the largest and decreasing to both ends of the support through the support after the deflection value became the specimen number, indicating that both sides of the specimen buckled, indicating that the simulated deflection cloud and the actual loading deflection distribution law was consistent, further verifying that the established model could be better used for SCGACLS.

5.3.2. Load–Deflection Curve

According to the finite element analysis (FEA) results, the curve of comparing the test and the simulated values of load–deflection for each specimen are shown in Figure 16. The comparison between the finite element calculation results and test results of the ultimate bearing capacity and deflection of each specimen are shown in Table 10. From Figure 16 and Table 10, it can be seen that the ultimate bearing capacity and deflection obtained by FEA were close to the test results; the error of bearing capacity was within 5% and the error of deflection was within 10%. The bearing capacity and deflection obtained from the FEA were larger than the test results, which was mainly because there were some differences between the principal structure model used in the FEA and the actual material principal structure model; the FEA model did not consider the processing and geometric defects of the specimen and the loading and boundary conditions in the FEA model were more idealized than the test.
In summary, the FEA results in terms of load–deflection curve, bearing capacity, and deflection were consistent with the test results and the established FEA model had high accuracy and low error and was used as the basis for the analysis of flexural bearing capacity parameters of the laminated slab.

6. Conclusions

This paper presented an experimental study of the flexural performance of truss-reinforced concrete laminated slab prepared using the SCGA; specifically, five full-size laminated slabs based on four-point bending tests were analyzed in terms of experimental, theoretical, and finite element models. The specific summary is as follows.
  • SCGACLSs went through three phases from the beginning of stress to failure, the elastic working phase, the cracked working phase, and the damaged phase. The failure process, load–strain curve, and load–deflection curve were similar to the ordinary concrete laminated slab. All performances met the requirements of the Chinese standard GB50010 (2010). SCGACLSs can be used as substitutes for the ordinary concrete laminated slab in engineering.
  • The slab with a precast layer of SCGAC(C30) and a cast-in-place layer of C30 ordinary concrete showed a 15.2% decrease in cracking load and a 28.3% increase in mid-span deflection in the ultimate condition compared with an ordinary concrete laminated slab. Therefore, the difference between the modulus of elasticity of the precast layer and that of the cast-in-place layer can be reduced by appropriately increasing the strength grade of the precast layer, which can improve the resistance to cracking and make the deformation more cooperative. At the same time, the effect of concrete shrinkage and the bond strength with reinforcement on the bearing capacity of the laminated slab cannot be ignored; this aspect needs to be studied in depth.
  • The flexural bearing capacity of SCGACLSs can be calculated approximately by the method in Chinese standard GB50010 (2010); the result had a certain safety reserve, for the calculated deflection value was recommended to be corrected by multiplying the correlation coefficient.
  • The finite element simulation results were in good agreement with the test results, the bearing capacity errors were within 5%, the deflection errors were within 10%, and the finite element model established by ABAQUS software could effectively predict the flexural performance of SCGACLSs.

Author Contributions

Conceptualization, M.Z. and K.Z.; methodology, K.Z. and B.Z.; software, Y.G.; validation, K.Z., C.L. (Chao Li) and B.Z.; formal analysis, C.L. (Congqi Luan) and B.Z.; investigation, C.L. (Congqi Luan); resources, M.Z.; data curation, Y.L.; writing—original draft preparation, K.Z.; writing—review and editing, K.Z. and Y.Y.; visualization, Y.L.; project administration, M.Z.; funding acquisition, M.Z. All authors have read and agreed to the published version of the manuscript.

Funding

This research was funded by the National Natural Science Foundation of China (Grant number: U1261122) and the Foundation of Liaoning Province Education Administration (Grant number: LJ2019FL006), Liaoning Technical University (Grant number: LNTU20TD-12).

Data Availability Statement

The data will be required for subsequent finite element parametric analysis, which will be withheld for the time being.

Conflicts of Interest

The authors declare no conflict of interest.

References

  1. Zhang, Y.; Wang, Q.; Zhou, M. Mechanical properties of concrete with coarse spontaneous combustion gangue aggregate (SCGA): Experimental investigation and prediction methodology. Constr. Build. Mater. 2020, 255, 119337. [Google Scholar] [CrossRef]
  2. Dong, Z.; Xia, J.; Fan, C. Activity of calcined coal gangue fine aggregate and its effect on the mechanical behavior of cement mortar. Constr. Build. Mater. 2015, 100, 63–69. [Google Scholar] [CrossRef] [Green Version]
  3. Zhou, M.; Dou, Y.; Zhang, Y. Effects of the variety and content of coal gangue coarse aggregate on the mechanical properties of concrete. Constr. Build. Mater. 2019, 220, 386–395. [Google Scholar] [CrossRef]
  4. Wang, Q.; Li, Z.; Zhang, Y. Influence of coarse coal gangue aggregates on elastic modulus and drying shrinkage behavior of concrete. J. Build. Eng. 2020, 32, 101748. [Google Scholar] [CrossRef]
  5. Yang, S.; Zhou, M.; Zhang, Y. Effect of spontaneous combustion gangue coarse aggregate replacement rate on the fracture toughness of concrete. J. Build. Mater. 2020, 23, 858–864. (In Chinese) [Google Scholar] [CrossRef]
  6. Yao, Z.; Fang, Y.; Kong, W. Experimental study on dynamic mechanical properties of coal gangue concrete. Adv. Mater. Sci. Eng. 2020, 2020, 8874191. [Google Scholar] [CrossRef]
  7. Wang, Y.; Tan, Y.; Wang, Y. Mechanical properties and chloride permeability of green concrete mixed with fly ash and coal gangue. Constr. Build. Mater. 2020, 233, 117166. [Google Scholar] [CrossRef]
  8. Querol, X.; Izquierdo, M.; Monfort, E. Environmental characterization of burnt coal gangue banks at Yangquan, Shanxi Province, China. Int. J. Coal Geol. 2008, 75, 93–104. [Google Scholar] [CrossRef]
  9. Teng, F.; Kan, H.; Zhou, M. Study on bivariate strength formula of spontaneous combustion gangue coarse aggregate concrete. Concrete 2015, 10, 37–39. [Google Scholar] [CrossRef]
  10. Duan, F.; Ma, A.; Xiao, G.; Yin, H. Research progress on the application of coal gangue in high temperature materials. Silic. Bull. 2013, 32, 1811–1816. (In Chinese) [Google Scholar] [CrossRef]
  11. Wang, C.; Hu, X.; Jiang, W. Application and research progress of coal gangue in foam insulation ceramics. Jiangxi Build. Mater. 2020, 254, 13–14. (In Chinese) [Google Scholar]
  12. Wu, X.F.; Zhou, M.; Cui, Z.L. The experiment research on concrete strength influence of spontaneous combustion gangue coarse aggregate. Ind. Constr. 2009, 39, 81–85. (In Chinese) [Google Scholar] [CrossRef]
  13. Wang, Q.; Zhao, Z.; Liu, Y.; Liu, S. Study on the shrinkage properties of coal gangue concrete. Concrete 2015, 312, 68–70. (In Chinese) [Google Scholar]
  14. Li, Y.J.; Cao, S.; Xing, Y.; Lei, C. Experimental study on the drying shrinkage performance of coal gangue aggregate concrete. Concrete 2016, 325, 95–97. (In Chinese) [Google Scholar]
  15. GB/T50082-2009; Standard for Test Methods of Long-term Performance and Durability of Ordinary Concrete. China Architecture & Building Press: Beijing, China, 2009. (In Chinese)
  16. Li, S.J.; Wang, J.H. Experimental study on the bonding performance of reinforced gangue concrete. J. Shenyang Coll. Constr. Eng. 1990, 006, 18–22. (In Chinese) [Google Scholar]
  17. Bai, G.; Zhu, C.; Wang, J. Experimental study on the shear performance of gangue concrete beams. J. Build. Struct. 2020, 41, 49–55. (In Chinese) [Google Scholar]
  18. Li, G.; Chang, C.; Qu, Z.S. Mechanical properties of pressed steel plate-coal gangue concrete composite floor slab. J. Liaoning Univ. Eng. Technol. 2003, 61–63. (In Chinese) [Google Scholar]
  19. Ma, H.Y.; Da, B.; Yu, H.F. Research on Flexural Behavior of Coral Aggregate Reinforced Concrete Beams. China Ocean. Eng. 2018, 32, 98–109. (In Chinese) [Google Scholar] [CrossRef]
  20. Wang, B.; Wang, L.; Li, M. Experimental research on the autogenous shrinkage of MK high performance concrete. J. Wuhan Univ. Technol.-Mater Sci. Ed. 2007, 22, 551–554. [Google Scholar] [CrossRef]
  21. Gao, S.; Zhang, S.; Guo, L. Application of Coal Gangue as a Coarse Aggregate in Green Concrete Production: A Review. Materials 2021, 14, 6803. [Google Scholar] [CrossRef]
  22. Qanber, A.S.G.; Yas, M.H.; Kadhum, M.M. Numerical and Experimental Behavior Analysis of Slabs Strengthened Using Steel Plates and Slurry-Infiltrated Mat Concrete (SIMCON) Laminates. Infrastructures 2023, 8, 85. [Google Scholar] [CrossRef]
  23. Jusoh, S.N.; Mohamad, H.; Marto, A.; Yunus, N.M.; Kasim, F. Segment’s joint in precast tunnel lining design. J. Teknol. 2015, 77, 91–98. [Google Scholar] [CrossRef] [Green Version]
  24. Liu, J.; Wang, B. Experimental study on the flexural performance of monolithic shear walls assembled with mortise and tenon joints under different axial compression ratios. Eng. Mech. 2021, 38, 79–87. [Google Scholar] [CrossRef]
  25. Namazi, E.; Mohamad, H.; Jorat, M.E.; Hajihassani, M. Investigation on the effects of twin tunnel excavations beneath a road underpass. Electron. J. Geotech. Eng. 2011, 16, 441–450. [Google Scholar]
  26. GB/T 50010-2010; Code for Design of Concrete Structures. China Architecture & Building Press: Beijing, China, 2010. (In Chinese)
  27. GB175-2007; Common Portland Cement. Standards Press of China: Beijing, China, 2007. (In Chinese)
  28. GB/T 14684-2011; Sand for Construction. Standards Press of China: Beijing, China, 2011. (In Chinese)
  29. GB/T 14685-2011; Pebble and Crushed Stone for Construction. Standards Press of China: Beijing, China, 2011. (In Chinese)
  30. Zhang, Y.; Xu, Q.; Wang, Q. Axial compressive behavior of circular concrete-filled steel tube stub columns prepared with spontaneous-combustion coal gangue aggregate. J. Build. Eng. 2022, 48, 103987. [Google Scholar] [CrossRef]
  31. Wang, A.; Zhu, W.; Xu, H.; Liu, K. Research progress of coal gangue aggregates for concrete. Silic. Bull. 2019, 38, 2076–2086. (In Chinese) [Google Scholar]
  32. Liu, S.; Liu, H.Q.; Wang, J.L. Experimental study on water absorption of concrete with coarse aggregate of spontaneous combustion coal gangue. Nonmet. Min. 2017, 40, 33–35. (In Chinese) [Google Scholar]
  33. Zhou, M.; Li, G.; Zhang, Q.; Cui, H. Study on the application of spontaneous combustion coal gangue aggregate in ready-mixed concrete. J. Constr. Mater. 2015, 18, 830–835. (In Chinese) [Google Scholar]
  34. Jiang, Q.; Huang, Q.; Chang, S. Quality management and acceptance of assembled concrete structure projects. Eng. Qual. 2016, 34, 5–13. (In Chinese) [Google Scholar]
  35. 15G366-1; Reinforced Truss Concrete Composite Slab. China Architecture Standards Design & Research Institute Co., Ltd.: Beijing, China, 2015.
  36. Wen, X.; Yan, Y. Experimental study on the application of self-combustion gangue as aggregate in construction materials. Concrete 2016, 326, 154–157. (In Chinese) [Google Scholar]
  37. Chen, Y.; Sun, Q.; Wang, N.; Niu, W. Experimental study of self-combustion gangue concrete. Concrete 2014, 300, 63–65. (In Chinese) [Google Scholar]
  38. Latour, M.; Daniello, M.; Landolfo, R. Experimental and numerical study of double-skin aluminum foam sandwich panels in bending. Thin-Walled Struct. 2021, 164, 107894. [Google Scholar] [CrossRef]
  39. GB/T 50152-2012; Standard for Test Methods of Concrete Structures. China Construction Industry Press: Beijing, China, 2012. (In Chinese)
  40. Colombo, I.G.; Colombo, M.; Di Prisco, M. Bending behavior of Textile Reinforced Concrete sandwich beams. Constr. Build. Mater. 2015, 95, 675–685. [Google Scholar] [CrossRef]
  41. Idris, Y.; Ozbakkaloglu, T. Flexural behavior of FRP-HSC-steel composite beams. Thin-Walled Struct. 2014, 80, 207–216. [Google Scholar] [CrossRef]
  42. Falliano, D.; De Domenico, D.; Ricciardi, G. Improving the flexural capacity of extrudable foamed concrete with glass-fiber bidirectional grid reinforcement: An experimental study. Compos. Struct. 2019, 209, 45–59. [Google Scholar] [CrossRef]
  43. Nana, W.S.A.; Bui, T.T.; Limam, A. Experimental and numerical modeling of shear behavior of full-scale RC slab under concentrated loads. In Structures; Elsevier: Amsterdam, The Netherlands, 2017; Volume 10, pp. 96–116. [Google Scholar] [CrossRef]
  44. Huang, Z.; Zhao, Y.; Zhang, J. Punching shear behavior of concrete slab reinforced with CFRP grids. In Structures; Elsevier: Amsterdam, The Netherlands, 2020; Volume 26, pp. 617–625. [Google Scholar] [CrossRef]
  45. Haido, J.H. Flexural behavior of basalt fiber reinforced concrete beams: Finite element simulation with new constitutive relationships. In Structures; Elsevier: Amsterdam, The Netherlands, 2020; Volume 27, pp. 1876–1889. [Google Scholar] [CrossRef]
  46. Mahdi, S.; Ali, M.S.M.; Sheikh, A.H. An investigation into the feasibility of normal and fiber-reinforced ultra-high performance concrete multi-cell and composite sandwich panels. J. Build. Eng. 2021, 41, 102728. [Google Scholar] [CrossRef]
  47. Du, H.; Hu, X.; Meng, Y. Study on composite beams with prefabricated steel bar truss concrete slab and demountable shear connectors. Eng. Struct. 2020, 210, 110419. [Google Scholar] [CrossRef]
  48. Luan, C.; Zhou, M.; Zhou, T. Optimizing the Design Proportion of High-Performance Concrete via UsingResponse Surface Method. Iran. J. Sci. Technol. Trans. Civ. Eng. 2022, 46, 1–15. [Google Scholar] [CrossRef]
  49. Liu, H.; Xu, Q.; Wang, Q. Prediction of the elastic modulus of concrete with spontaneous combustion and rock coal gangue aggregates. In Structures; Elsevier: Amsterdam, The Netherlands, 2020; Volume 28, pp. 774–785. [Google Scholar] [CrossRef]
  50. He, D.; Zhang, Z.; Zhang, D. Analysis of ultimate bearing capacity of concrete laminated flexural members. Henan Sci. 2010, 28, 709–712. (In Chinese) [Google Scholar]
  51. Qiu, J.; Zhu, M.; Zhou, Y. Effect and mechanism of coal gangue concrete modification by fly ash. Constr. Build. Mater. 2021, 294, 123563. [Google Scholar] [CrossRef]
  52. Zeng, M.; Chen, W.; Su, Q. Analysis of shrinkage self-stress in precast combined box girder section concrete. Struct. Eng. 2015, 31, 41–48. (In Chinese) [Google Scholar]
  53. Khalid Heiza, A.N.; Meleka, N.; Tayel, M. State-of-the art review: Strengthening of reinforced concrete structures–different strengthening techniques. In Proceedings of the Sixth International Conference on Nano-Technology in Construction, Asyut, Egypt, 22–24 March 2014; Volume 6, pp. 22–24. [Google Scholar]
  54. Wu, F.; Huang, H.; Chen, W. Experimental study on the force performance of prefabricated ribbed thin concrete laminated slab members. Civ. Constr. Environ. Eng. 2011, 33, 7–12, 19. (In Chinese) [Google Scholar]
  55. Belardi, V.G.; Fanelli, P.; Vivio, F. Structural analysis of transversally loaded quasi-isotropic rectilinear orthotropic composite circular plates with Galerkin method. Procedia Struct. Integr. 2018, 8, 368–378. [Google Scholar] [CrossRef]
  56. Belardi, V.G.; Fanelli, P.; Vivio, F. Bending analysis with Galerkin method of rectilinear orthotropic composite circular plates subject to transversal load. Compos. Part B Eng. 2018, 140, 250–259. [Google Scholar] [CrossRef]
  57. Kabir, H.; Aghdam, M.M. A robust Bézier-based solution for nonlinear vibration and post-buckling of random checkerboard graphene nano-platelets reinforced composite beams. Compos. Struct. 2019, 212, 184–198. [Google Scholar] [CrossRef]
  58. Ukanwa, K.; Mohamad, N.; Lim, J.B.P. Computational finite element modeling of structural behaviors of precast sandwiched foamed concrete slab. Open J. Civ. Eng. 2015, 5, 220. [Google Scholar] [CrossRef] [Green Version]
  59. Tian, J.; Wang, M. Experimental and numerical study of continuous span concrete composite slabs. In Structures; Elsevier: Amsterdam, The Netherlands, 2021; Volume 34, pp. 827–839. [Google Scholar] [CrossRef]
  60. Shafieifar, M.; Farzad, M.; Azizinamini, A. Experimental and numerical study on mechanical properties of Ultra-High-Performance Concrete (UHPC). Constr. Build. Mater. 2017, 156, 402–411. [Google Scholar] [CrossRef]
  61. Guo, Z.; Shi, X. Principles and Analysis of Reinforced Concrete; Tsinghua University Press: Beijing, China, 2003; pp. 2–21. [Google Scholar]
  62. Cai, Q.; Lin, X.F.; Yu, G.Q. Influence of detection location on the accuracy of heat transfer coefficient identification of walls by McQuart method. Wall Mater. Innov. Build. Energy Effic. 2014, 185, 58–61. (In Chinese) [Google Scholar]
  63. Katwal, U.; Tao, Z.; Hassan, M.K. Finite element modeling of steel-concrete composite beams with profiled steel sheeting. J. Constr. Steel Res. 2018, 146, 1–15. [Google Scholar] [CrossRef]
  64. Rehman, A.; Masood, A.; Akhtar, S. Experimental and numerical investigation into flexural bond strength of RC beams exposed to elevated temperature. Constr. Build. Mater. 2021, 282, 122630. [Google Scholar] [CrossRef]
Figure 1. (a) Preparation process of spontaneous combustion gangue aggregate (SCGA); (b) SCGA; (c) natural aggregates (NA).
Buildings 13 01718 g001
Figure 2. Details of the laminated slab. (a) The layout of reinforcement in the laminated slab; (b) Section X-X; (c) Section Y-Y.
Buildings 13 01718 g002
Figure 3. The preparation process of specimens. (a) Formwork support and reinforcement tying; (b) concrete pouring of the precast slab; (c) brushing at the laminated surface; (d) maintenance of the precast slab; (e) concrete pouring of the top slab; (f) maintenance completion and demolding.
Buildings 13 01718 g003
Figure 4. The loading devices. (a) Test setup layout; (b) picture of the test equipment; (c) the ATS380 test system; (d) pressure sensor (500 kN); (e) hydraulic jack and rolling supports; (f) rigid transfer girder and displacement meter (unit: mm).
Buildings 13 01718 g004aBuildings 13 01718 g004b
Figure 5. (a) The layout of the concrete strain gauges on the side of the slab; (b) the layout of the reinforcement strain gauges.
Buildings 13 01718 g005
Figure 6. The development of cracks on the side of the slab after the damage.
Buildings 13 01718 g006
Figure 7. The load and mid-span deflection curves for each specimen.
Buildings 13 01718 g007
Figure 8. Load and longitudinal reinforcement strain curve.
Buildings 13 01718 g008
Figure 9. Load and concrete strain curve.
Buildings 13 01718 g009
Figure 10. (a) Concrete strain development curve on the slab side of the laminated slab for each specimen. (b) Comparison between specimens at specific loads.
Buildings 13 01718 g010
Figure 11. Stress distribution of normal cross-section of the laminated slab in limit state specimen.
Buildings 13 01718 g011
Figure 12. Finite element model. (a) Boundary conditions; (b) mesh division; (c) truss reinforcement embedded in concrete.
Buildings 13 01718 g012
Figure 13. Fitting relationship between compressive stress and strain of SCGAC.
Buildings 13 01718 g013
Figure 14. Stress–strain curve model of reinforcement.
Buildings 13 01718 g014
Figure 15. (a) Concrete strain clouds of the bottom slab; (b) concrete strain clouds of the top slab; (c) truss steel stress cloud; (d) whole deformation diagram of the laminated slab.
Buildings 13 01718 g015
Figure 16. Comparison of test and simulated values of load–deflection curves for each specimen.
Buildings 13 01718 g016
Table 1. Main properties of OPC and fly ash.
CategoryGrade Specific Surface Area (m2/kg)Density
(kg/m3)
Setting Time (min)StabilityMgO
(%)
f-Cao
(%)
SO3
(%)
3 d
Strength (MPa)
28 d Strength (MPa)
InitialFinalfcufcffcufcf
OPC42.53703020245308qualified2.80.832.927.96.2351.89.6
Fly ash8252347---1.566.071.04----
Notes: fcu—compressive strength, fcf—flexural strength.
Table 2. Basic physical properties of two types of coarse aggregates.
CharacterApparent Density (kg/m3)Bulk Density (kg/m3)Void Ratio (%)Water Absorption Ratio (%)Crushing Ratio (%)
Category Loose Packing DensityCompact Stack Density
NA27431520168045.660.835.28
SCGA22761075122052.777.5521.20
Notes: NA—natural aggregate; SCGA—spontaneous combustion gangue aggregate.
Table 3. Mix design of concrete (kg/m3).
CategoryCementFly AshWaterWater ReducerCoarse AggregateAdditional WaterFine AggregateCompressive
Strength
(MPa)
Ec
(GPa)
Slump
(mm)
NAC(C30)320801843.3870095034.2 17.350
SCGAC(C30)320801756.68208292430.814.520
SCGAC(C35)360901787.38008086635.915.825
SCGAC(C40)376941717.47697176941.117.435
Note: NAC(C30)—natural aggregate concrete of C30; SCGAC(C30)—spontaneous combustion gangue aggregate concrete of C30; Ec—elastic modulus.
Table 4. Parameters of each laminated slab.
Specimen NumberMaterial and Grade of Precast Layer Concrete Material and Grade of Cast-in-Place Layer ConcreteTransverse Distribution ReinforcementLongitudinal ReinforcementNumber of Steel Trusses
NCLP1NAC(C30)NAC(C30)8#2008#2252
GCLP1SCGAC(C30)SCGAC(C30)8#2008#2252
GNLP1SCGAC(C30)NAC(C30)8#2008#2252
GNLP2SCGAC(C35)NAC(C30)8#2008#2252
GNLP3SCGAC(C40)NAC(C30)8#2008#2252
Table 5. Test results of each specimen.
Specimen NumberPrecast Slab MaterialCast-in-Place Layer MaterialLc (kN)Lu (kN)Du (mm)Dut (mm)W (mm)
NCLP1NAC(C30)NAC(C30)24.381.120.4610.14.0
GCLP1SCGAC(C30)SCGAC(C30)17.676.325.0912.46.1
GNLP1SCGAC(C30)NAC(C30)20.677.426.2413.56.0
GNLP2SCGAC(C35)NAC(C30)23.080.226.3212.85.7
GNLP3SCGAC(C40)NAC(C30)26.284.120.5011.53.8
Note: Lc—the cracking load (including self-weight of the rigid transfer girder, etc.); Lu—the ultimate load; Du—the failing deflection; Dut—the residual deflection after unloading; W—the maximum crack width.
Table 6. Calculated value and the measured value of the laminated slab cracking load.
Specimen NumberMcr,t (kN·m)Mcr,c (kN·m)Relative Error (%)
NCLP17.297.847.54
GCLP15.285.453.22
GNLP16.185.953.72
GNLP26.906.821.16
GNLP37.868.082.80
Table 7. Calculated value and the measured value of the ultimate load of the test slab.
Specimen Number M U , c / (kN·m) M U , t / (kN·m) Relative Error/%
NCLP121.8924.3310.03
GCLP120.3222.8911.23
GNLP120.6923.3211.28
GNLP221.9424.068.81
GNLP323.0725.238.56
Table 8. The calculated value and the measured value of the maximum crack width of the test slab.
Specimen Number M
(kN·m)
ω m a x , c
(mm)
ω m a x , t
(mm)
Relative Error (%)
NCLP114.590.460.436.98
GCLP114.590.670.692.90
GNLP114.590.660.618.20
GNLP214.590.550.5010.00
GNLP314.590.410.3710.81
Table 9. Fitting equation between compressive stress and strain of SCGAC.
Strength GradeFitting EquationAccuracy
SCGAC(C30) y = 1.4508 x + ( 3 2.9016 ) x 2 + ( 1.4508 2 ) x 3 ,   0 x 1 x 0.5113 ( x 1 ) 3 + x ,   x > 1 R2 = 0.997152
R2 = 0.958898
SCGAC(C35) y = 0.9773 x + ( 3 1.9546 ) x 2 + ( 0.9773 2 ) x 3 ,   0 x 1 x 1.1297 ( x 1 ) 3 + x ,   x > 1 R2 = 0.999039
R2 = 0.987701
SCGAC(C40) y = 1.1313 x + ( 3 2.2626 ) x 2 + ( 1.1313 2 ) x 3 ,   0 x 1 x 0.5842 ( x 1 ) 3 + x ,   x > 1 R2 = 0.999039
R2 = 0.987701
Table 10. Comparison of simulated and tested values of the ultimate loads of laminated slab.
Specimen NumberP1 (kN)P2 (kN)Relative Error (%)D1 (mm)D2 (mm)Relative Error (%)
NCLP182.381.11.4721.7320.466.21
GCLP178.576.32.8827.5425.099.76
GNLP178.877.41.8127.8726.246.21
GNLP283.380.23.8727.0926.322.93
GNLP384.984.10.9521.1220.503.02
P1—simulated values of the ultimate loads; P2—tested values of the ultimate loads; D1—simulated values of deflection; D2—tested values of deflection.
Disclaimer/Publisher’s Note: The statements, opinions and data contained in all publications are solely those of the individual author(s) and contributor(s) and not of MDPI and/or the editor(s). MDPI and/or the editor(s) disclaim responsibility for any injury to people or property resulting from any ideas, methods, instructions or products referred to in the content.

