Abstract
Different functional areas within general hospitals have varying environmental requirements, with relatively high energy consumption. A comprehensive evaluation of the operational performance’s rationality is of great significance in hospitals’ energy conservation efforts. This study conducted an annual post-occupancy evaluation of a general hospital located in a hot summer and cold winter area in east of China. Two hundred and seventy-eight valid online satisfaction questionnaires, sixty valid point-to-point questionnaires, indoor environment data of each typical season, and energy consumption data were obtained. The overall indoor environment of the selected hospital met the standard requirements. The results showed that occupant satisfaction was influenced by gender, working hours, and length of stay. The annual energy consumption level of this building was 84.7 kWh/m2, which is significantly lower than that of other public general hospitals in China and general hospitals in developed countries. The energy consumption of the inpatient department was directly related to the hospital days, with an increase of 12.2 kWh/m2 for every 1000 additional hospital days. A new indoor environment quality (IEQ) model and a new comprehensive evaluation model for energy efficiency were established. Overall, the outpatient department exhibited superior performance compared to the inpatient department. These evaluation models can help owners and decision-makers in the identification of environmental performance in hospitals.
1. Introduction
The indoor environment plays a crucial role in the physical and mental well-being as well as the comfort of building occupants. In creating a favorable indoor environment in the hospital, a significant amount of energy is consumed in lighting, air conditioning, equipment sockets, power, and other aspects. Hospital buildings, being one of the vital public buildings, serve the functions of diagnosis, treatment, and scientific research. In China, general hospitals are the predominant type, with a total of 20,133 in 2020, accounting for 57% of the total number of hospital institutions, followed by specialized hospitals, accounting for 25% of the total number [1].
Large general hospitals dominate the general hospital category, offering multiple functions, such as inpatient department, outpatient department, emergency department, and administrative office. Improving the indoor environment of hospitals is essential in reducing infections and increasing the satisfaction of patients and doctors.
1.1. Energy Demand in Hospital
Energy consumption is a critical concern during hospital operation due to the continuous operation, energy-intensive systems, and large number of users [2]. It is widely believed that hospital buildings have the highest energy consumption among major commercial buildings [3]. In China’s comprehensive hospitals, daily energy consumption is mainly dominated by electricity, accounting for 66%, followed by gas [4]. Key medical equipment, such as computer tomography (CT) and magnetic resonance imaging (MRI) are major electricity consumers in hospitals [5]. Notably, healthcare activity, such as hospitalization stays, emergency actions, surgeries [6] and maintenance [7], air conditioning, and air cleaning consume about 40% of the total electricity. Furthermore, different departments of hospital had different energy demands [8]. Therefore, balancing the conflict between indoor environment quality (IEQ) and energy consumption in hospitals reasonably is crucial.
Some researchers have analyzed the benchmark of hospital energy consumption [9] and the factors that influence energy consumption [10,11]. Both electricity and heat consumption in hospitals are positively related to the number of doctors, beds, and medical operations performed [12]. When considering the energy efficiency evaluation, there are three methods, including bill-based methods, monitoring-based methods, and dynamic simulations [13,14,15]. Bill-based methods are the best option to guarantee minimal and general results [15]. Additionally, the energy consumption per unit areas or energy consumption intensity was the most common energy consumption evaluation indicator [13,16]. Using bill-based methods, it is found that the layout patterns of hospital buildings also have a significant impact on energy efficiency [17].
Other researchers have proposed energy-saving strategies for hospital buildings from another perspective, such as air conditioning energy conservation [18,19,20] and innovative retrofitting strategies [21,22,23]. Given that different IEQ levels can lead to different levels of satisfaction and energy consumption, it is crucial to evaluate IEQ, satisfaction, and energy consumption at different building levels simultaneously [2].
1.2. Indoor Environment in Hospital
Numerous studies have been conducted on the indoor environment in hospitals. It was broadly recognized that thermal environment is one of the fundamental factors of the indoor environment and the effects of temperature on the comfort, well-being, safety, and health of both the patients and the health care personnel [24]. It is believed that individual differences in thermal comfort widely existed, and no consistent conclusions could be drawn on the size and significance of inter-group gaps in the preferred thermal environment between different kinds of people [25]. ASHRAE (American Society of Heating, Refrigerating and Air-Conditioning Engineers) updated the standard 170-2021 ventilation of health care facilities in 2021, providing key guidance on ventilation requirements for health care industry facilities [26]. For patient room, public waiting room, and treatment room, the design temperature is generally set as 21–24 °C. Due to the heavier gown requirements used by the surgical team, the design temperature is set as 20–24 °C in operating room. The design relative humidity is less than 60% in patient room and treatment room, while it is less than 65% in public waiting room.
It is generally accepted that different occupants in hospitals require different thermal comfort conditions, especially in hospitals [27,28]. A study on thermal comfort among hospital workers in Malaysia showed that 49% of the occupants were satisfied with the thermal environment, and the neutral temperature was 26.4 °C [29]. A study found that the mean comfort operative temperatures for patients and visitors in Malaysian hospitals were estimated to be 25.3 °C and 25.5 °C, respectively [30]. A field study on inpatient buildings during summer showed that the air temperature ranged from 22 to 24 °C, and the absolute humidity frequently exceeded 12.5 g/kg [31]. A study on a semi-open hospital building in Shenzhen revealed that the indoor environment in that area was in a state of high temperature and humidity for an extended period, with a corresponding low dissatisfaction rate [32]. A study from air-conditioned environments in hot climates indicated that the neutral temperature was 25.6 °C by the predicted mean vote [33]. However, few of them covered all the seasons [2]. Predicted mean vote (PMV) model could not be applied to users of tropical hospital buildings, especially medical staff. The acceptable temperature range for patients, visitors, and medical staff is 21.8–27.9 °C, 22.0–27.1 °C, and 24.1–25.6 °C, respectively, which is higher than that recommended by the official Thai standard [27]. A survey of pregnant women in hospital in Italy also revealed a wide gap between TSV (thermal sensation vote) and PMV [34], due to the use of a standardized metabolic unit from the standard. One study has confirmed that the health conditions of patients have a highly significant impact on their thermal sensation, overall comfort, and perception of air quality. However, other characteristics, such as age, gender, and length of hospital stay did not affect other thermal comfort parameters. In contrast, a study of postpartum patients from Romania documented a significant difference in the thermal vote between different age groups and body mass index categories [35].
Air quality in hospitals is crucial for the health of staff and visitors. Results from three hospitals indicated that indoor CO2 and total volatile organic compounds (TVOCs) concentration exceeded outdoor concentrations in both summer and winter [36]. A study from a Turkish hospital suggested that the proportion of sick syndrome in the building was over 23%, and the probability of unhealthy skin symptoms caused by the space with no airflow increased by 1.82 times [37]. A field measurement of volatile organic compounds (VOCs) including 47 hospital rooms in a Finland hospital showed that the concentration of VOCs was relatively low [38].
Several researchers have proposed the evaluation of indoor environment quality by integrating multiple aspects, including thermal, air quality, light, and acoustic in office [39], school [40], and residential building [41]. However, few of them considered the hospital buildings.
1.3. Occupant Satisfaction in Hospital
Most existing studies have analyzed occupants’ perceptions of various aspects of the indoor environment quality, indoor decoration, and management service. A study conducted in Singapore found that all occupant groups expressed the greatest dissatisfaction with acoustic environment [42]. A study from Italy showed that in the maternity ward the main cause of noise disturbance was activities in the corridors and that this disturbance was usually repeated throughout the night [43]. A study from Iraq demonstrated that the four key factors to create a satisfying healing environment in general hospitals were interior appearance, comfort and control, views, and privacy [44]. A study conducted in the USA compared staff perceptions of LEED-certified healthcare facilities versus conventional hospitals and found that those working in the LEED facilities reported higher levels of comfort and satisfaction [45]. Another study conducted in regions with cold winters and hot summers in China found that user satisfaction with air quality was lowest in large hospitals with inadequate space and crowded staff [46].
Several studies on occupant satisfaction in hospitals have focused on evaluating services, property management, and organizational qualities. For instance, personal issues were found to be the most significant factor influencing patient satisfaction scores [47]. In a pre-post descriptive study, families and staff reported greater satisfaction with the newly redesigned hospital environment compared to the old one [48]. Additionally, playing appropriate music using aromatherapy and providing earplugs to patients can improve occupants’ satisfaction. Furthermore, giving patients control over the indoor environment can significantly enhance their satisfaction with the hospital surroundings [49].
While some researchers have concentrated on designing the space planning [50] and layout of hospitals, Ma et al. examined the public and occupant perceptions of the functional settings of outdoor spaces. Their results revealed that a lack of alignment between the outdoor space and users’ emerging functional needs led to low satisfaction and high expectations [51]. A study conducted at inpatient units of a public hospital in Malaysia indicated that the respondents were dissatisfied with the space planning and furniture [52].
1.4. Aim of This Study
In summary, existing general hospitals in China face various challenges related to IEQ, energy consumption, and user satisfaction. These challenges include excessive CO2 concentration, high PM2.5 concentration, bacteria, dense human flow, and low user satisfaction. Hospital equipment and high energy density contribute to significant building energy consumption intensity. The indoor environment, satisfaction, and energy consumption characteristics of different departments in the hospital have not been effectively mastered, and their correlation in hospitals remains insufficient. There is no clear and consistent conclusion as to the significance and size of inter-group differences in occupant satisfaction (between different jobs, working hours, gender, etc.), and most studies focus on thermal environments [25]. Furthermore, at present, most studies only selected one factor of energy consumption or environment to carry out in-depth analysis, resulting in a lack of comprehensive evaluation. Balancing the relationship between satisfaction, IEQ, and energy consumption is crucial for building energy efficiency, leading to a lack of targeted guidance for the design and operation of general hospital buildings [53]. The framework of this study is depicted in Figure 1. The novelty and originality of the paper was as follows:
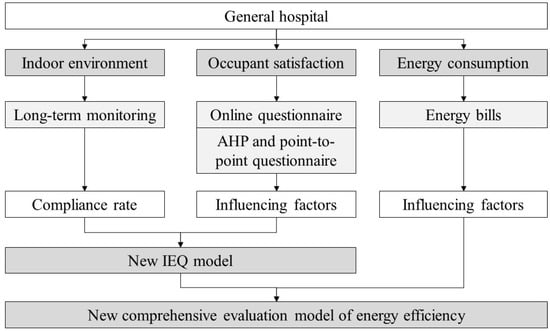
Figure 1.
Framework of this study.
The study is being conducted to perform actual operation performance tests on typical general hospital buildings in east of China, to obtain first-hand building long-term operation data. First, we will analyze the basic characteristics of annual satisfaction, indoor environment, and energy consumption in general hospitals, to clarify the influencing factors of satisfaction and energy demand. Then, we will establish a new IEQ model for hospitals in the hot summer and cold winter zone of China. Finally, we will establish a new comprehensive evaluation model for hospitals, including energy consumption, indoor environment, and satisfaction. This can help in evaluating the operating performance of hospitals reasonably and finding the service problem.
2. Materials and Methods
2.1. Measurement Plan
2.1.1. Indoor Environment Measurement
To provide basic indoor environmental data for comprehensive evaluation, the study conducted long-term monitoring of the indoor environment (as shown in Table 1), including thermal, air quality, light, and acoustic environment. The parameters measured included air temperature, relative humidity, CO2 concentration, PM2.5 concentration, illuminance, color rendering index, color temperature, and sound pressure. The hospital has been operational for over 6 years without undergoing significant renovations. As the indoor water pollutant concentration adheres to standard requirements, TVOC and formaldehyde levels were not monitored separately. Monitoring of the indoor environment was conducted separately for both the outpatient and inpatient departments. The study focused on three specific areas within the outpatient department: The outpatient hall, waiting hall, and consulting room. As all areas within the inpatient department meet the unified high-rise standard floor, one floor was selected for monitoring purposes. During monitoring, instruments were placed on the desks of doctors and nurses in the consulting room and outpatient hall, as well as in the waiting room. For the ward, instruments were positioned on the wall beside the bed, while those at the nurse’s station were placed on the nurse’s table. Environmental parameters were monitored at maximum intervals of 10 min, and average values were recorded every 10 min. As illuminance was significantly impacted by environmental changes, on-site real-time measurement methods were adopted. The monitoring period lasted for a minimum of two typical weeks per season. For this study, the selected summer period ranged from 19 July to 1 August 2021, the selected transition period was from 18 October to 31 October 2021, and the selected winter period was from 20 December 2021 to 2 January 2022. Table 2 presents the instruments and accuracies used in the monitoring process, while Table 3 shows the compliance rates of the indoor environment parameters according to relevant Chinese standards.

Table 1.
Plan of indoor environment measurement.

Table 2.
Sensors and their accuracies.

Table 3.
Standard limits of indoor environment parameters in China.
Outdoor temperature and humidity data were obtained from the national meteorological station, located approximately 10.4 km away from the hospital in a direct line. The data were collected at hourly intervals. Additionally, data on outdoor PM2.5 were obtained from the nearest local weather station in Hangzhou City, approximately 4.9 km away from the hospital in a direct line. The outdoor PM2.5 data were collected at hourly intervals.
2.1.2. Questionnaires and Analysis Method
To depict the occupant satisfaction, the study distributed questionnaires to long-term staff and visitors of the building through the internet. Due to the impact of the COVID-19 epidemic, this study excluded inpatient department patients. The questionnaire included users’ basic information, satisfaction level, and sense of control, as detailed in Table 4. A 7-point Likert scale [58] was employed in this study to measure satisfaction, following the CBE survey [59]. Users were asked to rate their satisfaction level on a scale ranging from very dissatisfied to very satisfied.

Table 4.
The content of questionnaires.
The reliability of the satisfaction questionnaire grading data was analyzed using Cronbach’s α coefficient value test. According to Cronbach’s α, the reliability effect was categorized as follows: 0.80–0.90 as very good, 0.70–0.80 as good, 0.65–0.70 as the minimum acceptable value, and 0.60–0.65 as invalid. To compare the satisfaction data of users from different backgrounds, the independent T-test and ANOVA were used. When ANOVA was employed, the LSD(L) module was utilized to generate the significance coefficient when the variances were aligned, and Dunnett’s T3 module was used to generate the significance coefficient when the variances were not aligned. All statistical analyses were performed using SPSS version 20 (IBM Inc., Armonk, NY, USA), and significance was set at 0.05.
2.1.3. Energy Data
The study included energy consumption statistics for primary energy sources (natural gas, coal) and secondary energy sources (electricity, oil). However, this building solely relies on electricity and does not utilize natural gas or any other types of energy. The tested building did not have a building energy management system (BEMS) installed; therefore, energy consumption data were obtained through regular meter readings. The energy consumption quota and calculation method for medical institutions were based on the quota and calculation method of energy consumption for medical institutions DB33/T 738-2021 [60]. Energy consumption includes the actual consumption of various physical amounts of energy in medical institutions, such as air conditioning, lighting, elevators, hot water energy, and medical equipment. The data collected consisted of the annual/monthly power consumption of hospital buildings, as well as the annual/monthly power consumption of departments or floors.
2.2. Comprehensive Evaluation Model for Energy Efficiency and IEQ Model
Based on the models proposed by Geng et al. [61] and Weng et al. [62], we proposed a new comprehensive evaluation model for energy efficiency. The building operation performance was comprehensively evaluated using two aspects: Energy consumption and indoor environment quality. Indoor environment quality evaluation includes two aspects: The compliance rate of objective environmental parameters and subjective satisfaction. The calculations were as follows:
where Ctemp is the compliance rate of the air temperature; Chumidity is the compliance rate of the relative humidity; CCO2 is the compliance rate of the CO2 concentration; CPM2.5 is the compliance rate of the PM2.5 concentration; Cilluminance is the compliance rate of the illuminance; Csound is the compliance rate of the sound pressure level; IEQoverall is the overall environment score; a1 is the weight coefficient of temperature; a2 is the weight coefficient of humidity; a3 is the weight coefficient of air quality; a4 is the weight coefficient of light environment; a5 is the weight coefficient of acoustic environment; EUI is the energy consumption per unit area; Elimit is the limit value of energy consumption from guidelines; EUI’ is the normalized energy consumption per unit area; h0 is the reference service time, which is 8 h for outpatient department and 24 h for inpatient department in this study; and hr is the actual service time.
The analytic hierarchy process (AHP) method was used to calculate the weight coefficients of different aspects of IEQ. The questionnaires were conducted by point-to-point measurement, which indicates that the indoor environment was measured when the satisfaction votes were asked. The objects included temperature, humidity, air quality, light environment, and acoustic environment. The participants were asked to compare the importance of different factors in pairs and give an evaluation score from 1 to 9: “1” indicates that two elements have equal importance compared to each other; “3” indicates that compared to the two elements, one element is slightly more important than the other; “5” indicates that compared to the two elements, one element is significantly more important than the other; “7” indicates that compared to the two elements, one element is more important than the other; “9” indicates that compared to the two elements, one element is extremely important compared to the other; 2, 4, 6, and 8 are the median values in the adjacent judgments mentioned above. The subjective questionnaire is shown in Table 5.

Table 5.
Excerpt of the AHP questionnaire for weights of IEQ (the grey areas are not required).
Due to the direct impact of usage time on building energy consumption, Equation (2) was used to correct the evaluation of energy consumption by considering the direct impact of usage duration on energy consumption intensity. To create a good indoor environment, it is bound to consume more energy. The performance evaluation results based on IEQ, EUI, and the grading of comprehensive evaluation are classified into five levels (A–E) according to a previous study [63]. These levels are shown in Figure 2, with Level A representing optimal performance. To achieve Level A, the IEQ must be at least 0.67. The purpose of this classification is to encourage the improvement of indoor environment and reasonably control the energy consumption. Even if the energy consumption is low, but the IEQ is poor, it will not be defined as an excellent level.
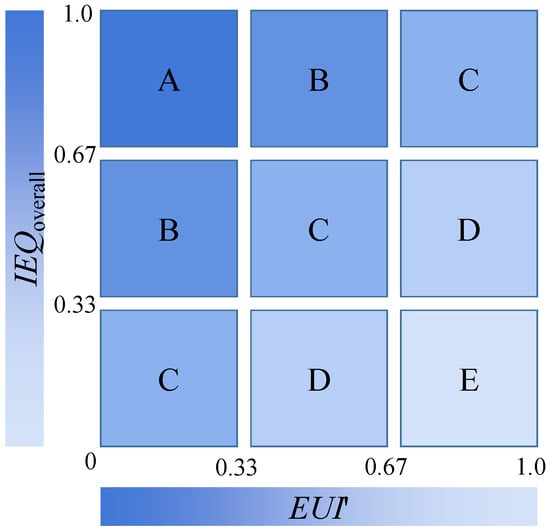
Figure 2.
The grading of comprehensive evaluation for operating performance.
2.3. Case Building
The hospital selected for this study is the Hangzhou Integrative Medicine Hospital, established in 1956. It is a modern and comprehensive facility that combines medical treatment, scientific research, teaching, prevention, and health care services. The hospital is situated at No. 25 Shenjia Road, North East New Road, Hangzhou City, with a construction area of more than 20,000 square meters. It was opened in 2015, and the standard photos and layouts of the hospital can be seen in Figure 3 and Figure 4, respectively. Background information regarding the hospital is provided in Table 6. The outpatient department is located on the West side and comprises five low-rise buildings that are interconnected. The hospital has approximately 500 employees and is a second-level standard integrated traditional Chinese and Western medicine hospital.
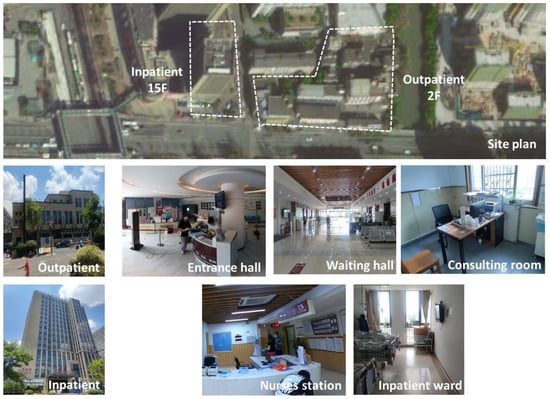
Figure 3.
Site layout and internal and external photos of the selected hospital.
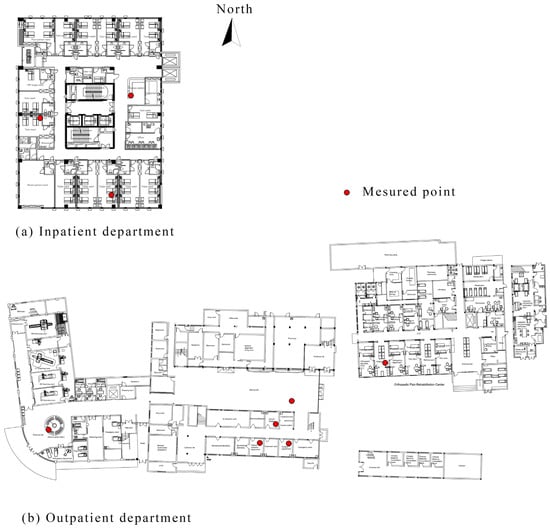
Figure 4.
Standard floor of the (a) inpatient and (b) outpatient department.

Table 6.
Information of the selected hospital.
3. Results
3.1. Indoor Environment
3.1.1. Thermal Environment
The distribution of air temperature and relative humidity is depicted in Figure 5.
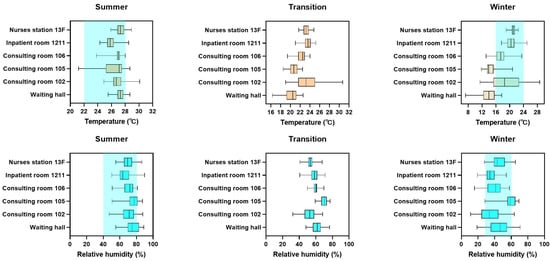
Figure 5.
The distribution of air temperature and relative humidity in different areas of the hospital (the blue highlights mean the requirement of standard).
Air temperature: Most of the time in summer, the temperature remained within the standard limits. However, some rooms, such as the nurse’s station and consulting room 102, had temperatures exceeding 28 °C. During the transition season, the inpatient department experienced more temperature-related issues than the outpatient department. In winter, almost all areas in the inpatient department met the standard requirements, but the outpatient department failed to meet the standard for a significant amount of time. Specifically, the temperature was lower than 16 °C for several days, particularly in the waiting room and consulting room 105.
Relative humidity: The outpatient and inpatient departments had relatively high humidity levels in the summer, with values frequently exceeding 50% and occasionally reaching 80%. Relative humidity ranged from 40% to 70% in the inpatient department and from 30% to 75% in the outpatient department during the transition season. The outpatient department’s relative humidity remained relatively stable due to some rooms having internal windows. In winter, relative humidity fluctuated sharply between 10% and 70%, particularly in the outpatient department, where there were significant differences in humidity levels between rooms. Room 105 had the highest relative humidity in the outpatient department, while room 102 had the lowest average relative humidity.
3.1.2. Air Quality
The distribution of CO2 and PM2.5 concentrations is depicted in Figure 6.
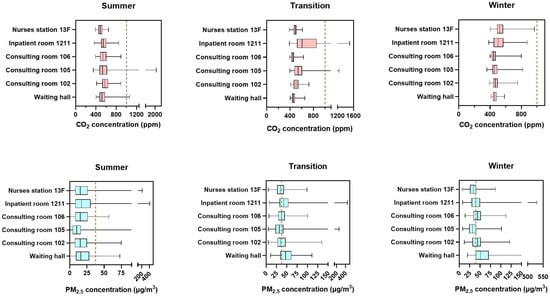
Figure 6.
The distribution of CO2 and PM2.5 concentrations in different areas of the hospital.
CO2 concentration: During three typical seasons, CO2 concentration generally remained below the limit of 1000 ppm. However, it fluctuated significantly across different rooms and seasons. In summer, the CO2 concentration peak was observed in consulting room 105, approaching 2000 ppm. Similarly, in the transition season, the room also showed high CO2 concentration, reaching over 1200 ppm. However, in winter, the measured data did not exceed 1000 ppm. Inpatient room 1211 had a peak CO2 concentration close to 1600 ppm during the transition season. Additionally, in winter, the CO2 concentration was generally higher in nurses’ stations and wards of the inpatient department compared to the main functional rooms in the outpatient department.
PM2.5 concentration: PM2.5 concentration generally exceeded the standard in the transition season and winter, with levels reaching 35 μg/m3 and 40 μg/m3, respectively. In summer, the indoor PM2.5 concentration was at its lowest, around 20 μg/m3. Ward 1211 had high peak PM2.5 levels in all three seasons, with levels exceeding 400 μg/m3.
3.1.3. Light Environment
To eliminate the influence of outdoor lighting, the test was conducted in an artificial lighting environment with all curtains closed and lighting equipment enabled. The light environment data of different rooms were collected and averaged to obtain the results presented in Table 7.

Table 7.
The results of illuminance in different areas of the hospital.
Ground illumination requirements were not met only in the nurse’s station and consulting room 105, whereas none of the offices met the basic requirements for desktop illumination. All rooms had high color temperatures of around 6000. The entrance hall curtains could not be fully opened, resulting in markedly different measurements from those of other rooms.
3.1.4. Acoustic Environment
Since the hospital building is frequently occupied and has many people using it, conducting a closed-windows experiment and controlling the users’ activities was challenging. To capture the construction noise’s long-term impact, the study employed a full-day monitoring approach on a typical day. The method involved recording the average value of the background noise level every 5 min and calculating the average value for up to 4 h when users were not present. The average noise level during daily operations was also measured for up to 4 h. The test results are presented in Table 8.

Table 8.
The results of A-weighted sound pressure level in different areas of the hospital.
The indoor noise levels of both the outpatient and inpatient departments were almost at the standard limit during quiet nighttime conditions. During daytime operations, the noise level in the outpatient department was particularly high, especially in the entrance hall, where it reached 62 dB, 7 dB above the standard limit. Outpatient room 106 also reached 62 dB, while the other offices ranged from 50–55 dB. The consulting room and entrance had noise levels that were 5–7 dB higher than the standard limit, while the noise level in the waiting hall was close to the standard limit. In the inpatient rooms, the noise levels were 2–4 dB higher than the standard limit both during the day and at night. During the day, the noise level at the nurse’s station was 53 dB, significantly higher than that of the inpatient room on the same floor, while at night, the noise level was close to that of the inpatient room.
3.2. Occupant Satisfaction
The study was conducted in accordance with the Declaration of Helsinki and approved by the Institutional Review Board of Hangzhou Integrative Medicine Hospital. Through online means, 399 questionnaires were acquired for the survey. Upon eliminating logistics and office personnel as well as incomplete questionnaires, 278 valid questionnaires were collected. Of the total, 109 questionnaires were from outpatient staff, 150 from inpatient staff, and 19 from visitors. The details of the respondents can be seen in Table 9.

Table 9.
The background information of respondents.
The present study found that nearly 80% of the interviewees were female, with a majority of them being young individuals under the age of 40. Of the responding outpatient staff, close to half were between the ages of 31 and 40, while over 70% of the inpatient staff were under 30. Moreover, a significant proportion of the study participants reported no history of smoking. Outpatient staff were predominantly doctors, while inpatient staff were mainly nurses. Of the respondents from the outpatient department, 42.2% reported working more than 40 h per week in the building, compared to 58% of those from the inpatient department, indicating a difference in work hours. With regard to work location, 40% of outpatient staff spent most of their time in the consulting room, while 15.6% and 13.8% spent the majority of their time in the treatment room and doctor’s office, respectively. Among inpatient staff, 46% spent most of their time at the nurse’s station, 28% spent most of their time in the ward, and 20% in the doctor’s office. Notably, the majority of visitors were below 50 years of age.
The reliability effect of the quantitative satisfaction data of this questionnaire is 0.959, indicating that the questionnaire has high reliability.
The T-test was employed to compare the satisfaction levels of individuals with different genders in various environments and services. The results of the analysis are presented in Table 10. The findings indicated that women reported higher levels of satisfaction than men in relation to temperature, humidity, air quality, work efficiency, and temperature control. Notably, the difference in satisfaction levels related to temperature was most pronounced (95% CI: 0.34–1.06), while the differences in satisfaction levels related to air quality (95% CI: 0.01–0.71) and temperature control (95% CI: 0.02–0.65) were relatively small. Gender was not found to have a significant effect on other aspects of satisfaction.

Table 10.
T-test results of sex on different satisfactions.
The one-way analysis of variance (ANOVA) was conducted to examine the variations in satisfaction levels among distinct groups. The outcomes, as presented in Table 11, demonstrate that there are noteworthy differences in the satisfaction levels of different individuals with respect to the acoustic environment, overall environment, and interior space design. Regarding satisfaction with the acoustic environment, a significant difference was observed between the staff of the inpatient department and those of the outpatient department, and between visitors and the staff of the outpatient department. Additionally, concerning overall satisfaction and interior space design, there were noteworthy differences between the staff of the inpatient department and those of the outpatient department. No significant differences were found among the various groups in other satisfaction dimensions.

Table 11.
The ANOVA results of different respondents on different satisfactions.
The present study utilized one-way analysis of variance (ANOVA) to investigate the potential differences in staff satisfaction based on their length of stay in the organization. The analysis revealed a statistically significant difference in satisfaction levels with operation and maintenance (p = 0.012) among staff members who had stayed for less than 10 and more than 40 h. However, no significant effects were detected on other aspects of satisfaction.
Furthermore, the study explored the relationship between the number of working years and staff satisfaction, as presented in Table 12. Results indicated significant differences in satisfaction levels among respondents with different working years. Pair-based comparisons revealed a rapid decline in satisfaction levels among those who have worked for more than 5 years. Specifically, significant differences were found between staff who have worked for more than 5 years and those who have worked for 1–2 years or 3–5 years in satisfaction with humidity and work efficiency. Additionally, significant differences were detected between respondents with more than 5 years of experience and the other three groups in satisfaction with air, temperature control, overall environment, and interior space design. Notably, staff members who have worked for more than 5 years differed significantly from those who have worked for 3–5 years regarding satisfaction with the light environment. Finally, significant differences were observed between staff members who have worked for more than 5 years and those who have worked for less than 1 year or 3–5 years regarding their satisfaction with operations and maintenance.

Table 12.
The ANOVA results of working years on different satisfactions.
3.3. Energy Consumptiom
By manually recording the electricity meter data, monthly electricity costs for the building in 2021 were obtained, and the results are shown in Figure 7. The annual energy consumption level per unit area of the buildings was 84.7 kWh/m2. Notably, the monthly variation in energy consumption for the outpatient department was significantly lower than that of the inpatient department. The overall annual energy consumption intensity per unit area of the inpatient department was observed to be approximately 2.7 times higher than that of the outpatient department.
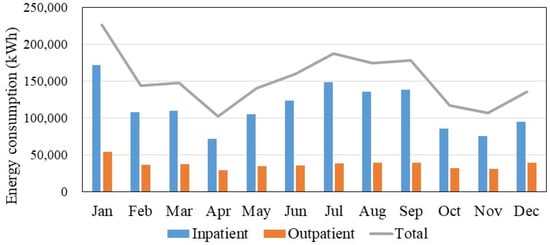
Figure 7.
The monthly change in energy use of the selected hospital.
Figure 8 displays the results of the regression analysis conducted between monthly daily energy use per square meter and monthly average outdoor air temperature. The findings revealed that energy density decreases with a decrease in air temperature when the outdoor average monthly temperature was below 15 °C, and this decrease was observed to be similar in both the inpatient and outpatient departments. However, the inpatient department exhibits a higher energy consumption rate of 11–26% compared to the outpatient department. Conversely, when the monthly average outdoor temperature exceeds 15 °C, energy density increases with the rise in outdoor temperature. Notably, the inpatient department exhibits a significantly higher rate of energy use increase than the outpatient department, and the gap in energy density also widens rapidly.
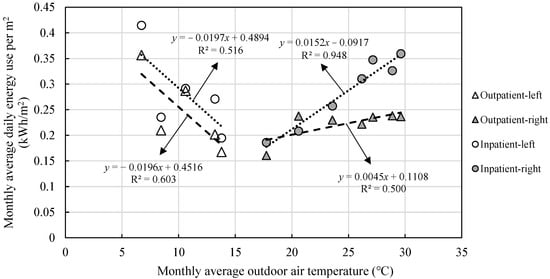
Figure 8.
The regression results between monthly daily energy use per square meters and monthly average outdoor air temperature.
Figure 9 illustrates that despite the standard floor area being constant at 867 m2, there was a considerable variation in energy consumption across different inpatient floors. The 6th floor exhibited the highest energy consumption, while the energy consumption of the other floors was comparable, apart from the unoccupied 14th and 15th floors.
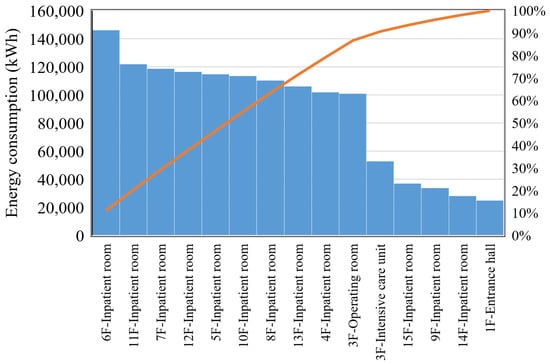
Figure 9.
The total energy consumption across different inpatient floors.
To investigate the underlying causes of the energy consumption differences across inpatient floors, the least squares method was utilized to establish a correlation between energy consumption of standard floors and hospital days. The findings are presented in Figure 10, indicating a significant positive correlation between energy consumption and hospital days. Specifically, a rise of 12.2 kWh/m2 was observed for every 1000 bed days.
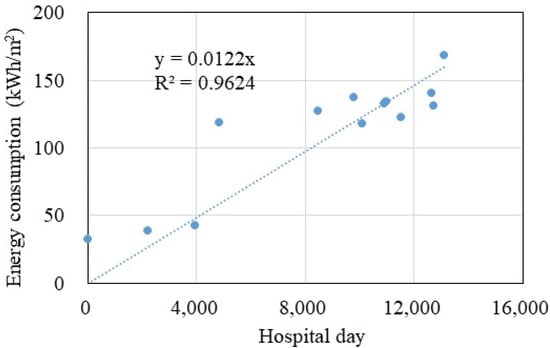
Figure 10.
The regression results between energy consumption per square meter and hospital day across different inpatient floors.
Figure 11 depicts that the outpatient department’s energy consumption was primarily dominated by the medical imaging department and extensive medical examination equipment, resulting in significantly higher energy consumption levels than other departments. Other departments exhibited similar energy consumption patterns, primarily driven by air conditioning, computer equipment, and lighting usage. Based on the respective usage areas of different departments, Figure 12 displays the calculated energy consumption density for each department. The outcomes reveal that the medical imaging department’s energy consumption intensity soared to 930 kWh/m2·a, significantly exceeding the remaining departments. In contrast, most outpatient departments, such as ophthalmology and gynecology, with few medical instruments, had energy consumption intensities below 100 kWh/m2·a.
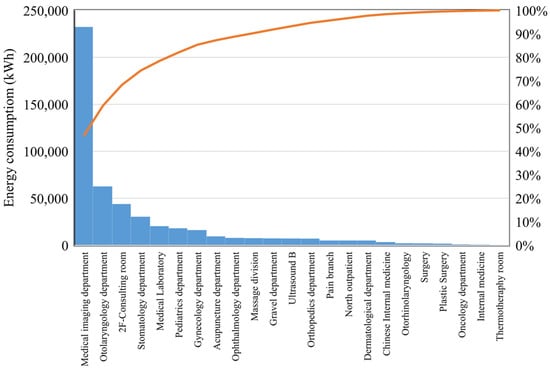
Figure 11.
Annual total energy consumption per square meter across various outpatient departments.
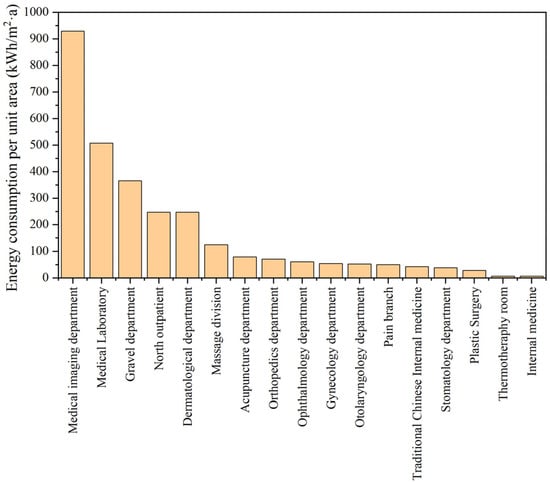
Figure 12.
Annual energy consumption per square meter across various outpatient departments.
3.4. Validation of IEQ Model
To verify the reliability of IEQ evaluation model, the point-to-point environment test and questionnaire survey were carried out. There were 60 point-to-point participants included in total. The IEQ and the vote on overall satisfaction given by occupants within different rooms were analyzed, as shown in Table 13. In AHP analysis, the pairwise discriminant matrix was as follows:

Table 13.
The results of IEQ value and mean overall vote in different rooms.
The random consistency ratio is 0.0197. It is believed that the results of the AHP have satisfactory consistency, and the allocation of weight coefficients is very reasonable. Finally, a1, a2, a3, a4, and a5 were 0.18, 0.12, 0.26, 0.07, and 0.37, respectively. It was found that the acoustic environment was the main factor that influenced indoor environment, followed by the air quality and temperature. According to Equation (1), the IEQoverall and overall satisfaction mean values calculated in different rooms were compared. The correlation between the mean vote attributed to rooms and IEQoverall was found in Figure 13. In general, the mean votes attributed to rooms were consistent with the goodness of IEQoverall, which was the combined thermal, acoustic, air quality, and light environment indicator. R2 values obtained were 0.55, which was acceptable.
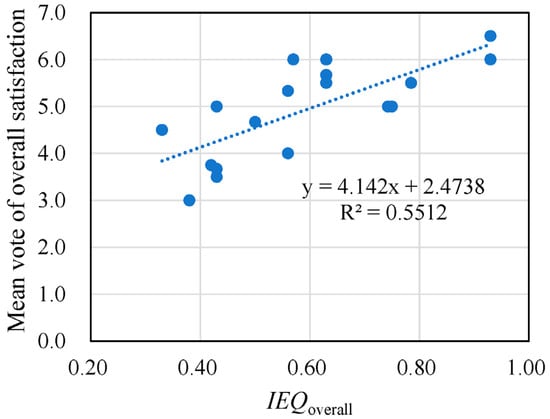
Figure 13.
The relationship between the mean vote and IEQoverall among different rooms.
3.5. Comprehensive Evaluation Model of Operating Performance
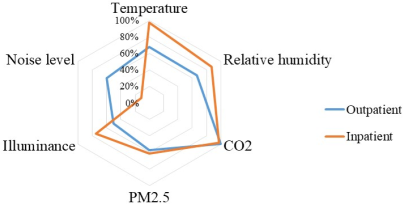
According to Table 3, the compliance rates of various indoor environment parameters were calculated, which are presented in Table 14. Additionally, the satisfaction rates for different aspects of the indoor environment were computed and summarized.

Table 14.
Comparison of operating performance in outpatient and inpatient.
In the outpatient department, the compliance rates for CO2 concentration and PM2.5 concentration were comparable to those observed in the inpatient department. However, the illuminance, air temperature, and relative humidity in the inpatient department exhibited superior compliance rates compared to those in the outpatient department. Furthermore, the compliance rate for noise level was considerably higher in the outpatient department relative to the inpatient department. Notably, a disparity was identified between the objective compliance rate and user satisfaction rate, particularly concerning the acoustic satisfaction and compliance rate for noise levels in the inpatient department.
Based on Equations (1) and (2), IEQ and EUI were calculated, as presented in Table 14 and Figure 14. Elimit in this study was 100 kWh/m2, according to the quota and calculation method of energy consumption for medical institutions DB33/T 738-2021 [60]. Due to its minimal effect on IEQ, the high-energy consumption associated with medical imaging was not considered when assessing building performance. Outpatient department operated for 8 h, while the inpatient department operated for 24 h.
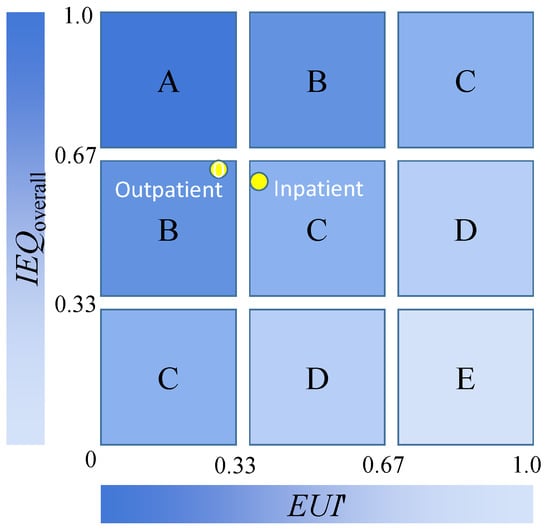
Figure 14.
The comprehensive evaluation results of different departments in the selected hospital.
IEQoverall of the outpatient department was slightly higher than that of the inpatient department. However, the EUI′ of inpatient department was slightly higher than that of the outpatient department. The result of comprehensive evaluation of outpatient department was degree B, while it was degree C in inpatient department.
4. Discussion
This study presented the indoor environment, satisfaction, and energy consumption status of a Chinese general hospital and analyzed the influencing factors of satisfaction and energy consumption. Long-term indoor environmental monitoring provided basic data for IEQ evaluation. The following sections will analyze the differences in satisfaction and energy consumption results between this study and existing studies. The limitations of this study are also discussed.
4.1. Comparison of Satisfaction in Hospitals
In this study, the satisfaction of patients was missing. Gender has different impacts on different satisfaction levels, and compared with existing research, there was currently no consistent conclusion. It was most likely influenced by other factors, such as participants and climate. Females tend to have higher satisfaction than males in this study, especially on thermal environment and air quality. Pregnant women and the elderly are generally more sensitive to thermal environments, most likely due to differences in clothing, metabolic rate, etc. [25].
It was found that the satisfaction results were related to the length of stay in the hospital. Visitors had the best satisfaction, while the staff who have worked for more than 5 years tend to have lower satisfaction with indoor environments and work efficiency. This was consistent with a study from Turkey, which showed that the nurses who were bound by a contract had higher satisfaction than permanent staff (p < 0.05) [64]. It seems that we need to conduct the survey research on staff with longer working years to identify the problems in the future.
4.2. Comparison of Hospital Building Energy Consumption
This study investigated the comprehensive energy consumption of hospitals at all levels in China and compared it with the comprehensive energy consumption of hospitals in different countries around the world. The results were shown in Table 15.

Table 15.
The comparison of energy consumption in different hospitals in different regions.
The study found significant variations in the energy consumption of hospitals of different sizes and regions, resulting in considerable fluctuations in the outcomes. Additionally, the energy consumption of selected general hospital was significantly lower than that of China’s large public Grade-III hospitals, possibly due to the difference in energy structure. Specifically, gas consumption in Grade-III hospitals is higher, which leads to a relatively higher comprehensive energy consumption level.
The general trend suggests that Chinese large general hospitals consumed less energy compared to hospitals in foreign countries. Surprisingly, even large public Grade-III hospitals in China demonstrated significantly lower energy consumption levels than their counterparts in Spain, the UK, and the United States. Moreover, the energy consumption levels of China’s large general hospitals were found to be similar to those in Malaysia and Greece. However, conducting a comprehensive comparison of the results was challenging due to the scarcity of essential data related to staff, beds, and hospital days across different studies. In the future, it is necessary to conduct more in-depth research on the differences and reasons for energy consumption among hospitals in different countries.
Hospital energy consumption exhibits certain patterns in time and space. As shown in Figure 8, the weather conditions directly affect the energy consumption. Meanwhile, hospital days were correlated with the energy consumption of inpatient departments. Additionally, the energy consumption of outpatient departments, except for the medical imaging department and the intensive care units, were similar to the regular office [8]. Due to the unique energy consumption characteristics of the medical imaging department and the intensive care units, it is recommended to conduct a zoning evaluation in hospital energy consumption evaluation.
4.3. Limitations and Future Research Directions
In this study, due to the limitations of building energy management hardware conditions, different energy consumption components were not examined. The detailed energy consumption rules of hospital buildings lack data, and can only be explained according to experience and common sense. The data samples of the inpatient department are limited, and there may be bias in the judgment of the indoor environment. The results of this study show that the building energy consumption of hospitals in China was significantly lower than that of hospitals in Europe and the United States, but the underlying differences and reasons for this difference have not been effectively analyzed. Considering the huge differences in building scale and medical level, this comparison still has certain limitations.
At present, according to the requirements of hospital operation performance evaluation, most studies only selected one factor of energy consumption or environment to carry out in-depth analysis, resulting in a lack of comprehensive evaluation. This study supplemented this content, but it was only a case study, lacking the comparison of hospitals of different types and scales in various climate zones, and the robustness and rationality of the evaluation method should be verified further. In the future, it will be necessary to carry out a large-scale or refined energy consumption analysis to further verify the causes and contrast the differences between energy consumption and environment to provide guidance for the management of hospital building energy consumption.
5. Conclusions
This study conducted an annual post-occupancy evaluation on satisfaction, indoor environment, and energy consumption of a representative private comprehensive hospital in Zhejiang Province, and obtained 278 valid satisfaction questionnaires, annual indoor environment data, and annual monthly energy consumption data. A new comprehensive energy-environment evaluation model was established to evaluate energy efficiency. A new IEQ model for the hospital was proposed and verified.
Concerning the indoor environment, the overall indoor environment of the building met the standard requirements, but the temperature of the outpatient department in winter was significantly below standard, and user comfort was low. The ground illuminance met the basic requirements, but the desktop illuminance level was low and did not meet the standard requirements. The indoor noise level was slightly higher than the standard limit, and the nurse’s station, outpatient hall, and some outpatient rooms seriously exceeded the standards IEQoverall of outpatient, which was equal to that of inpatient.
In terms of satisfaction, visitors had the highest level of satisfaction, followed by inpatient staff, while outpatient staff had the lowest level of satisfaction. The satisfaction results were related to the length of stay in the hospital. Users’ subjective satisfaction was used to validate the effectiveness of the IEQ evaluation model.
In terms of energy consumption, the annual energy consumption level of this building was 84.7 kWh/m2, which is significantly lower than that of other public general hospitals and foreign general hospitals. Outpatient department’s energy consumption was primarily dominated by the medical imaging department and extensive medical examination equipment, resulting in significantly higher energy consumption levels than other departments. The energy consumption of the inpatient department was directly related to the hospital day. For every 1000 hospital days, the energy consumption of the inpatient department increased by 12.2 kWh/m2. When analyzing energy consumption in different hospitals, hospital day should be introduced to correct energy consumption.
The acoustic environment was the main factor that influenced indoor environment, followed by the air quality and temperature. The outpatient department’s IEQoverall was marginally better than that of the inpatient department in the selected hospital. Overall, the outpatient department exhibited superior performance compared to the inpatient department, although the difference was not substantial. Due to the unique energy demand, it is recommended to conduct a detailed zoning evaluation in hospital energy consumption evaluation. The comprehensive evaluation model for energy efficiency proposed in this study can effectively evaluate both the building environment and energy consumption, providing guidance for building operation and maintenance.
Author Contributions
Conceptualization, methodology, analysis, investigation, writing—original draft, writing—review and editing, Y.S.; writing—review and editing, project administration, supervision, S.K.; writing—review and editing, methodology, project administration, supervision, K.N.; investigation, data curation, writing—review and editing, J.Z.; writing—review and editing, software, S.N. All authors have read and agreed to the published version of the manuscript.
Funding
This research received no external funding.
Institutional Review Board Statement
The study was conducted in accordance with the Declaration of Helsinki, and approved by the Institutional Review Board of Hangzhou Integrative Medicine Hospital (protocol code XZX2020081501).
Informed Consent Statement
Informed consent was obtained from all subjects involved in the study.
Data Availability Statement
The correspondence author will provide the research data when asked.
Acknowledgments
Thanks to the property managers and respondents for their support in this study. Thanks to the help from Jiantao Weng in Hangzhou City University.
Conflicts of Interest
The authors declare no conflict of interest.
References
- National Health Commission of the People’s Republic of China. China Health Statistics Yearbook 2021; National Health Commission of the People’s Republic of China: Beijing, China, 2021.
- Yuan, F.; Yao, R.; Sadrizadeh, S.; Li, B.; Cao, G.; Zhang, S.; Zhou, S.; Liu, H.; Bogdan, A.; Croitoru, C.; et al. Thermal comfort in hospital buildings—A literature review. J. Build. Eng. 2022, 45, 103463. [Google Scholar] [CrossRef]
- Thinate, N.; Wongsapai, W.; Damrongsak, D. Energy performance study in Thailand hospital building. In Proceedings of the 4th International Conference on Power and Energy Systems Engineering, Berlin, Germany, 25–29 September 2017; pp. 255–259. [Google Scholar]
- Shen, C.; Zhao, K.; Ge, J. Analysis of building energy consumption in a hospital in the hot summer and cold winter area. In Proceedings of the ICAE2018, Nara, Japan, 17–22 June 2018; pp. 3735–3740. [Google Scholar]
- Heye, T.; Knoerl, R.; Wehrle, T.; Mangold, D.; Cerminara, A.; Loser, M.; Plumeyer, M.; Degen, M.; Luthy, R.; Brodbeck, D.; et al. The energy consumption of radiology: Energy- and cost-saving opportunities for CT and MRI operation. Radiology 2020, 295, 593–605. [Google Scholar] [CrossRef] [PubMed]
- García-Sanz-Calcedo, J.; Gómez-Chaparro, M.; Sanchez-Barroso, G. Electrical and thermal energy in private hospitals: Consumption indicators focused on healthcare activity. Sustain. Cities Soc. 2019, 47, 101482. [Google Scholar] [CrossRef]
- García-Sanz-Calcedo, J.; Gómez-Chaparro, M. Quantitative analysis of the impact of maintenance management on the energy consumption of a hospital in Extremadura (Spain). Sustain. Cities Soc. 2017, 30, 217–222. [Google Scholar] [CrossRef]
- Christiansen, N.; Kaltschmitt, M.; Dzukowski, F. Electrical energy consumption and utilization time analysis of hospital departments and large scale medical equipment. Energy Build. 2016, 131, 172–183. [Google Scholar] [CrossRef]
- Dadi, D.; Introna, V.; Santolamazza, A.; Salvio, M.; Martini, C.; Pastura, T.; Martini, F. Private hospital energy performance benchmarking using energy audit data: An Italian case study. Energies 2022, 15, 806. [Google Scholar] [CrossRef]
- Borges de Oliveira, K.; dos Santos, E.F.; Neto, A.F.; de Mello Santos, V.H.; de Oliveira, O.J. Guidelines for efficient and sustainable energy management in hospital buildings. J. Clean. Prod. 2021, 329, 129644. [Google Scholar] [CrossRef]
- Fotovatfard, A.; Heravi, G. Identifying key performance indicators for healthcare facilities maintenance. J. Build. Eng. 2021, 42, 102838. [Google Scholar] [CrossRef]
- Cygańska, M.; Kludacz-Alessandri, M. Determinants of electrical and thermal energy consumption in hospitals according to climate zones in Poland. Energies 2021, 14, 7585. [Google Scholar] [CrossRef]
- Fitriani, I.; Sangadji, S.; Kristiawan, S.A. Energy efficiency evaluation of hospital building office. In Proceedings of the International Conference on Science and Applied Science (Engineering and Educational Science) 2016, Solo, Indonesia, 19 November 2016; p. 012067. [Google Scholar]
- Panagiotou, D.K.; Dounis, A.I. Comparison of hospital building’s energy consumption prediction using Artificial Neural Networks, ANFIS, and LSTM network. Energies 2022, 15, 6453. [Google Scholar] [CrossRef]
- Koulamasa, C.; Kalogerasa, A.P.; Pacheco-Torresb, R.; Casillasc, J.; Ferrarini, L. Suitability analysis of modeling and assessment approaches in energy efficiency in buildings. Energy Build. 2018, 158, 1662–1682. [Google Scholar] [CrossRef]
- Abu Bakar, N.N.; Hassan, M.Y.; Abdullah, H.; Rahman, H.A.; Abdullah, M.P.; Hussin, F.; Bandi, M. Energy efficiency index as an indicator for measuring building energy performance: A review. Renew. Sustain. Energy Rev. 2015, 44, 1–11. [Google Scholar] [CrossRef]
- Shi, Y.; Yan, Z.; Li, C.; Li, C. Energy consumption and building layouts of public hospital buildings: A survey of 30 buildings in the cold region of China. Sustain. Cities Soc. 2021, 74, 103247. [Google Scholar] [CrossRef]
- Abd Rahman, N.M.; Lim, C.H.; Fazlizan, A. Optimizing the energy saving potential of public hospital through a systematic approach for green building certification in Malaysia. J. Build. Eng. 2021, 43, 103088. [Google Scholar] [CrossRef]
- Cacabelos-Reyes, A.; López-González, J.L.; González-Gil, A.; Febrero-Garrido, L.; Eguía-Oller, P.; Granada-Álvarez, E. Assessing the energy demand reduction in a surgical suite by optimizing the HVAC operation during off-use periods. Appl. Sci. 2020, 10, 2233. [Google Scholar] [CrossRef]
- Teke, A.; Timur, O. Assessing the energy efficiency improvement potentials of HVAC systems considering economic and environmental aspects at the hospitals. Renew. Sustain. Energy Rev. 2014, 33, 224–235. [Google Scholar] [CrossRef]
- Gaspari, J.; Fabbri, K.; Gabrielli, L. A study on parametric design application to hospital retrofitting for improving energy savings and comfort conditions. Buildings 2019, 9, 220. [Google Scholar] [CrossRef]
- Prada, M.; Prada, I.F.; Cristea, M.; Popescu, D.E.; Bungau, C.; Aleya, L.; Bungau, C.C. New solutions to reduce greenhouse gas emissions through energy efficiency of buildings of special importance-Hospitals. Sci. Total Environ. 2020, 718, 137446. [Google Scholar] [CrossRef]
- Hama Radha, C. Retrofitting for improving indoor air quality and energy efficiency in the hospital building. Sustainability 2023, 15, 3464. [Google Scholar] [CrossRef]
- Salonen, H.; Kurnitski, J.; Kosonen, R.; Hellgren, U.-M.; Lap Palainen, S.; Peltokorpi, A.; Reijula, K.; Morawska, L. The effects of the thermal environment on occupants’ responses in health care facilities: A literature review. In Proceedings of the 9th International Conference on Indoor Air Quality, Ventilation & Energy Conservation in Buildings, Seoul, Republic of Korea, 23–26 October 2016. [Google Scholar]
- Wang, Z.; de Dear, R.; Luo, M.; Lin, B.; He, Y.; Ghahramani, A.; Zhu, Y. Individual difference in thermal comfort: A literature review. Build. Environ. 2018, 138, 181–193. [Google Scholar] [CrossRef]
- ASHRAE 170-2021; Ventilation of Health Care Facilities. ANSI/ASHRAE/ASHE: Atlanta, GA, USA, 2021.
- Sattayakorn, S.; Ichinose, M.; Sasaki, R. Clarifying thermal comfort of healthcare occupants in tropical region: A case of indoor environment in Thai hospitals. Energy Build. 2017, 149, 45–57. [Google Scholar] [CrossRef]
- Khodakarami, J.; Nasrollahi, N. Thermal comfort in hospitals—A literature review. Renew. Sustain. Energy Rev. 2012, 16, 4071–4077. [Google Scholar] [CrossRef]
- Yau, Y.H.; Chew, B.T. Thermal comfort study of hospital workers in Malaysia. Indoor Air 2009, 19, 500–510. [Google Scholar] [CrossRef] [PubMed]
- Khalid, W.; Zaki, S.A.; Rijal, H.B.; Yakub, F. Investigation of comfort temperature and thermal adaptation for patients and visitors in Malaysian hospitals. Energy Build. 2019, 183, 484–499. [Google Scholar] [CrossRef]
- Tang, H.; Ding, J.; Li, C.; Li, J. A field study on indoor environment quality of Chinese inpatient buildings in a hot and humid region. Build. Environ. 2019, 151, 156–167. [Google Scholar] [CrossRef]
- Tang, H.; Ding, J.; Lin, Z. On-site measurement of indoor environment quality in a Chinese healthcare facility with a semi-closed hospital street. Build. Environ. 2020, 173, 106637. [Google Scholar] [CrossRef]
- Alotaibi, B.S.; Lo, S.; Southwood, E.; Coley, D. Evaluating the suitability of standard thermal comfort approaches for hospital patients in air-conditioned environments in hot climates. Build. Environ. 2020, 169, 106561. [Google Scholar] [CrossRef]
- Fabbri, K.; Gaspari, J.; Vandi, L. Indoor thermal comfort of pregnant women in hospital: A case study evidence. Sustainability 2019, 11, 6664. [Google Scholar] [CrossRef]
- Rus, T.; Nemeti, G.; Domnita, F.V.; Goidescu, I.G.; Muresan, D. Indoor thermal environment evaluation of postpartum patients in a tertiary level maternity in Romania during summer. Sci. Technol. Built Environ. 2021, 27, 948–959. [Google Scholar] [CrossRef]
- Chamseddine, A.; Alameddine, I.; Hatzopoulou, M.; El-Fadel, M. Seasonal variation of air quality in hospitals with indoor–outdoor correlations. Build. Environ. 2019, 148, 689–700. [Google Scholar] [CrossRef]
- Babaoglu, U.T.; Sezgin, F.M.; Yag, F. Sick building symptoms among hospital workers associated with indoor air quality and personal factors. Indoor Built Environ. 2020, 29, 645–655. [Google Scholar] [CrossRef]
- Hyttinen, M.; Rautiainen, P.; Ruokolainen, J.; Sorvari, J.; Pasanen, P. VOCs concentrations and emission rates in hospital environment and the impact of sampling locations. Sci. Technol. Built Environ. 2021, 27, 986–994. [Google Scholar] [CrossRef]
- Wong, L.T.; Mui, K.W.; Hui, P.S. A multivariate-logistic model for acceptance of indoor environmental quality (IEQ) in offices. Build. Environ. 2008, 43, 1–6. [Google Scholar] [CrossRef]
- Catalina, T.; Iordache, V. IEQ assessment on schools in the design stage. Build. Environ. 2012, 49, 129–140. [Google Scholar] [CrossRef]
- Mui, K.W.; Tsang, T.W.; Wong, L.T.; William Yu, Y.P. Evaluation of an indoor environmental quality model for very small residential units. Indoor Built Environ. 2018, 28, 470–478. [Google Scholar] [CrossRef]
- Lam, B.; Fan, E.M.P.; Ooi, K.; Ong, Z.-T.; Hong, J.Y.; Gan, W.-S.; Ang, S.Y. Assessing the perceived indoor acoustic environment quality across building occupants in a tertiary-care public hospital in Singapore. Build. Environ. 2022, 222, 109403. [Google Scholar] [CrossRef]
- Secchi, S.; Setola, N.; Marzi, L.; Amodeo, V. Analysis of the acoustic comfort in hospital: The case of maternity rooms. Buildings 2022, 12, 1117. [Google Scholar] [CrossRef]
- Mahmood, F.J.; Tayib, A.Y. Healing environment correlated with patients’ psychological comfort: Post-occupancy evaluation of general hospitals. Indoor Built Environ. 2019, 30, 180–194. [Google Scholar] [CrossRef]
- Kim, S.-K.; Hwang, Y.; Lee, Y.S.; Corser, W. Occupant comfort and satisfaction in green healthcare environments: A survey study focusing on healthcare staff. J. Sustain. Dev. 2015, 8, 156–173. [Google Scholar] [CrossRef]
- Liu, Y.; Wang, Z.; Zhang, Z.; Hong, J.; Lin, B. Investigation on the indoor environment quality of health care facilities in China. Build. Environ. 2018, 141, 273–287. [Google Scholar] [CrossRef]
- Park, S.; Xu, J.; Manes, M.R.; Carrier, A.; Osborne, R. What determinants affect inpatient satisfaction in a post-acute care rehabilitation hospital? Arch. Phys. Med. Rehabil. 2022, 104, 270–276. [Google Scholar] [CrossRef] [PubMed]
- Kotzer, A.M.; Zacharakis, S.K.; Raynolds, M.; Buenning, F. Evaluation of the built environment: Staff and family satisfaction pre- and post-occupancy of the children’s hospital. Health Environ. Res. Des. 2011, 4, 60–78. [Google Scholar] [CrossRef] [PubMed]
- Shen, X.; Zhang, H.; Li, Y.; Qu, K.; Zhao, L.; Kong, G.; Jia, W. Building a satisfactory indoor environment for healthcare facility occupants: A literature review. Build. Environ. 2023, 228, 109861. [Google Scholar] [CrossRef]
- Manca, S.; Bonaiuto, M.; Fornara, F. Perceived hospital environment quality indicators: The case of healthcare places for terminal patients. Buildings 2022, 13, 57. [Google Scholar] [CrossRef]
- Ma, M.; Adeney, M.; Long, H. Functional settings of hospital outdoor spaces and the perceptions from public and hospital occupant during COVID-19. Healthcare 2021, 9, 1534. [Google Scholar] [CrossRef]
- Aljunid, S.S.; Taib, M.Z.M.; Samah, Z.A. Occupants’ satisfaction towards interior design quality at inpatient units of public hospitals in Malaysia: A sustainable development framework. Int. J. Environ. Sustain. Dev. 2020, 19, 320–331. [Google Scholar] [CrossRef]
- Wang, T.; Li, X.; Liao, P.-C.; Fang, D. Building energy efficiency for public hospitals and healthcare facilities in China: Barriers and drivers. Energy 2016, 103, 588–597. [Google Scholar] [CrossRef]
- GB/T18883-2022; Standards for Indoor Air Quality. State Administration for Market Regulation; State Standardization Administration: Beijing, China, 2022.
- T/ASC 02-2021; Assessment Standard for Healthy Building. The Architectural Society of China: Beijing, China, 2021.
- GB 50034-2013; Standard for Lighting Design of Buildings. Ministry of Housing and Urban-Rural Development of the People’s Republic of China: Beijing, China, 2013.
- GB 50118-2010; Code for Design of Sound Insulation of Civil Buildings. Ministry of Housing and Urban-Rural Development of the People’s Republic of China, General Administration of Quality Supervision, Inspection and Quarantine of the People’s Republic of China: Beijing, China, 2010.
- Joshi, A.; Kale, S.; Chandel, S.; Pal, D. Likert scale: Explored and explained. Br. J. Appl. Sci. Technol. 2015, 7, 396–403. [Google Scholar] [CrossRef]
- Zagreus, L.; Huizenga, C.; Arens, E.; Lehrer, D. Listening to the occupants: A Web-based indoor environmental quality survey. Indoor Air 2004, 14, 65–74. [Google Scholar] [CrossRef]
- DB33/T 738—2021; The Quota & Calculation Method of Energy Consumption for Medical Institution. Zhejiang Provincial Administration of Market Supervision: Hangzhou, China, 2021.
- Geng, Y.; Lin, B.R.; Zhu, Y.X. Comparative study on indoor environmental quality of green office buildings with different levels of energy use intensity. Build. Environ. 2020, 168, 106482. [Google Scholar] [CrossRef]
- Weng, J.; Zhang, Y.; Chen, Z.; Ying, X.; Zhu, W.; Sun, Y. Field measurements and analysis of indoor environment, occupant satisfaction, and sick building syndrome in university buildings in hot summer and cold winter regions in China. Int. J. Environ. Res. Public Health 2022, 20, 554. [Google Scholar] [CrossRef]
- Ge, J.; Luo, X.; Lu, J. Evaluation system and case study for carbon emission of villages in Yangtze River Delta region of China. J. Clean. Prod. 2017, 153, 220–229. [Google Scholar] [CrossRef]
- Golbasi, Z.; Kelleci, M.; Dogan, S. Relationships between coping strategies, individual characteristics and job satisfaction in a sample of hospital nurses: Cross-sectional questionnaire survey. Int. J. Nurs. Stud. 2008, 45, 1800–1806. [Google Scholar] [CrossRef]
- Jain, N.; Burman, E.; Stamp, S.; Shrubsole, C.; Bunn, R.; Oberman, T.; Barrett, E.; Aletta, F.; Kang, J.; Raynham, P.; et al. Building performance evaluation of a new hospital building in the UK: Balancing indoor environmental quality and energy performance. Atmosphere 2021, 12, 115. [Google Scholar] [CrossRef]
- Fifield, L.J.; Lomas, K.J.; Giridharan, R.; Allinson, D. Hospital wards and modular construction: Summertime overheating and energy efficiency. Build. Environ. 2018, 141, 28–44. [Google Scholar] [CrossRef]
- González González, A.; García-Sanz-Calcedo, J.; Salgado, D.R. A quantitative analysis of final energy consumption in hospitals in Spain. Sustain. Cities Soc. 2018, 36, 169–175. [Google Scholar] [CrossRef]
- Bawaneh, K.; Ghazi Nezami, F.; Rasheduzzaman, M.; Deken, B. Energy consumption analysis and characterization of healthcare facilities in the United States. Energies 2019, 12, 3775. [Google Scholar] [CrossRef]
- Saidur, R.; Hasanuzzaman, M.; Yogeswaran, S.; Mohammed, H.A.; Hossain, M.S. An end-use energy analysis in a Malaysian public hospital. Energy 2010, 35, 4780–4785. [Google Scholar] [CrossRef]
- Bakaimis, B.; Papanikolaou, I. Electrical energy saving policies, initiatives, results, challenges and lessons learned for the Grevena hospital. Procedia Environ. Sci. 2017, 38, 882–889. [Google Scholar] [CrossRef]
Disclaimer/Publisher’s Note: The statements, opinions and data contained in all publications are solely those of the individual author(s) and contributor(s) and not of MDPI and/or the editor(s). MDPI and/or the editor(s) disclaim responsibility for any injury to people or property resulting from any ideas, methods, instructions or products referred to in the content. |
© 2023 by the authors. Licensee MDPI, Basel, Switzerland. This article is an open access article distributed under the terms and conditions of the Creative Commons Attribution (CC BY) license (https://creativecommons.org/licenses/by/4.0/).
