Article

A Study on the Applicability and Accuracy of the Discrete Element Method for Plates Based on Parameter Sensitivity Analysis

1
Jiangsu Key Laboratory Environmental Impact and Structural Safety in Engineering, China University of Mining and Technology, Xuzhou 221116, China
2
Xuzhou Key Laboratory for Fire Safety of Engineering Structures, China University of Mining and Technology, Xuzhou 221116, China
*
Author to whom correspondence should be addressed.
Buildings 2023, 13(6), 1567; https://doi.org/10.3390/buildings13061567
Submission received: 11 May 2023 / Revised: 2 June 2023 / Accepted: 14 June 2023 / Published: 20 June 2023

Abstract

:
In order to verify the accuracy and applicability of the discrete element method (DEM) in dealing with geometrically large deformations of continuous plate structures, both a single-parameter analysis and an orthogonal design method were adopted to analyze the displacement responses of the plate structures and were compared with those calculated using the finite element method (FEM). The single-parameter change condition involved the thickness-to-width ratio, elastic modulus, or Poisson’s ratio, while the multi-parameter change included boundary conditions, dimensions, load forms, thickness-to-width ratio, elastic modulus, and Poisson’s ratio. The results showed that displacements of the target locations were basically identical to those obtained according to FEM, with a maximum error of less than 5% under the single-parameter change condition. The maximum displacement error of the plate structures calculated using the DEM and FEM, respectively, was 4.212%, and the mean error and extreme difference of error parameters were 2.633% and 2.184%, respectively. These results indicate that the displacements of the plate structures calculated using the DEM were highly consistent with those obtained according to the FEM. Additionally, single-parameter changes and multi-parameter changes barely influenced the accuracy and suitability of the DEM in solving displacement response problems of plate structures. Therefore, the DEM is applicable in terms of dealing with displacement response problems of plate structures.

1. Introduction

As a common type of structure in daily life, the plate structure is widely used in engineering, aerospace, ships, water conservancy, and other fields, and investigations on the corresponding structural deformations under various loads are of great significance. The commonly used plate calculation theories include the classical thin plate theory based on elastic surface differential equations [1], the thin plate theory based on Kirchhoff’s hypothesis of straight normal lines [2], and the Reissner–Mindlin moderately thick plate theory based on the consideration of transverse shear deformation, the method of which needs to construct interpolation functions and is highly required in terms of element continuity [3,4]. For the geometrically nonlinear problem of plates, the effect of membrane stress on the plate surface needs to be considered. The control equations and deformation coordination equations are both complex high-order differential equation systems, which are difficult to solve. Therefore, power series solutions and trigonometric series solutions are usually used for simple calculations of plates, during the process of which nonlinear equation systems are solved at a slow convergence speed [5,6,7]. In engineering practice, due to the complexity of the load and boundary conditions of the plate structure, it is difficult to obtain accurate results by using analytical methods. Numerical methods are mostly used for analysis, including meshless methods [8], boundary element methods [9], and finite element methods [10]. Among them, the finite element method is widely used, and scholars have proposed various computational formats, such as the total Lagrangian method (TL) and the updated Lagrangian method (UL) [11,12,13,14,15,16,17]. With the development of computer technology, the finite element method has become the most commonly used numerical analysis method in the field of engineering structures, and its calculation accuracy and efficiency are widely recognized. In the finite element method, the structural deformations are reflected by node displacements, the solution process of which needs to construct continuous shape functions and the calculation domain and displacement field need to be kept continuous because inappropriate displacement patterns may make it difficult to accurately simulate the mechanical behaviors of the structures. For example, a single element type is often not applicable for solving problems involving plates with different thicknesses, and certain low-order elements are usually inaccurate in terms of simulating the bending deformations of the plate structures due to the phenomenon of “shear locking”. For geometrically nonlinear problems, it is necessary to invert the structural stiffness matrix and repeat and iterative solutions, often encountering computational inefficiencies due to non-convergence.
The traditional discrete element method (DEM) has been developed for more than 40 years, initially proposed as a numerical calculation method for solving problems in granular mechanics such as rocks and soils [18]. The method discretizes an object into a collection of rigid particles and simulates the object under certain kinds of loads by tracking the positions of the particles according to the force–displacement relationship between adjacent particles and the kinematic equations. Timsina and Christy proposed the Applied Element Method (AEM) to analyze the fracture and collapse of reinforced concrete [19] and masonry structures [20] under cyclic loads. LE et al. [21] used the discrete element method to simulate damage and crack propagation in composite plates, eventually realizing simulations of fiber delamination and fracturing. KUMAR et al. [22,23] studied the influence of the microstructural characteristics of discrete particles on the macroscopic behavior of structures and used the discrete element method to simulate the buckling of compressed cylinders. Professor Ye Jihong’s research group [24,25,26,27,28,29] proposed a DEM model for truss structures and derived an expression of the spring contact stiffness coefficient for truss DEM, which was also applied to the vibration, buckling, large deformation, and elastoplastic analyses of frame and grid shell structures. To address the mechanical responses of plate structures under different loading conditions, Guo [30] proposed a single-layer particle arrangement plate discrete element method and derived the contact spring stiffness coefficient between particles based on the principle of energy conservation. Displacement continuity and deformation compatibility were not required by adopting the above-mentioned method, thereby avoiding convergence issues. Additionally, the discrete particles were purely rigid and did not undergo any deformations themselves, and their rotation and translation were independent of each other. Therefore, the DEM was applicable for solving problems involving plates with varying thicknesses, and there was no such phenomenon of “shear locking”.
Sensitivity analysis methods are commonly used to determine the influence degree of different parameters on target performance, including single-parameter sensitivity analysis methods [31,32] and multi-parameter sensitivity analysis methods [33,34], which respectively consider the influence of a single-parameter variation and the coupling of multiple parameter variations on the control target performance. Cavaliere [35] employed a commercial multi-objective optimization tool to precisely determine the weight of each parameter on the reduction behavior and found that temperature was the main factor influencing the time to total reduction. Batou [36] studied a new model updating method, which updated each model parameter separately by constructing a measurement output transformation that was only sensitive to itself for each parameter. Zhang M [37] proposed an algebraic and direct method for solving the sensitivity of complex modal parameters of asymmetric systems and verified its effectiveness and correctness through single-parameter numerical experiments and multi-parameter numerical experiments. Wang et al. [38] examined the effects of hydrogen relative humidity, air relative humidity, operating temperature, and the air stoichiometry ratio on the performance of polymer electrolyte membrane fuel cells through orthogonal experimental design.
Reference [30] provided stiffness coefficients of contact elements in the single-layer particle arrangement plate discrete element method and developed a plate discrete element calculation program in Fortran. However, the generality of this algorithm has not been validated. In this investigation, sensitivity analysis methods are adopted to analyze the influence of different parameter variations on the accuracy and applicability of plate deformations based on the discrete element method and deformations of the plate structures based on the DEM were also compared with those calculated according to the finite element method. The influence of parameter variations on the accuracy of a plate-deformation-based discrete element method is analyzed, providing a basis for further verifying the universality of the algorithm.

2. Basic Theory of the DEM for a Plate

2.1. The Model of the DEM for a Plate

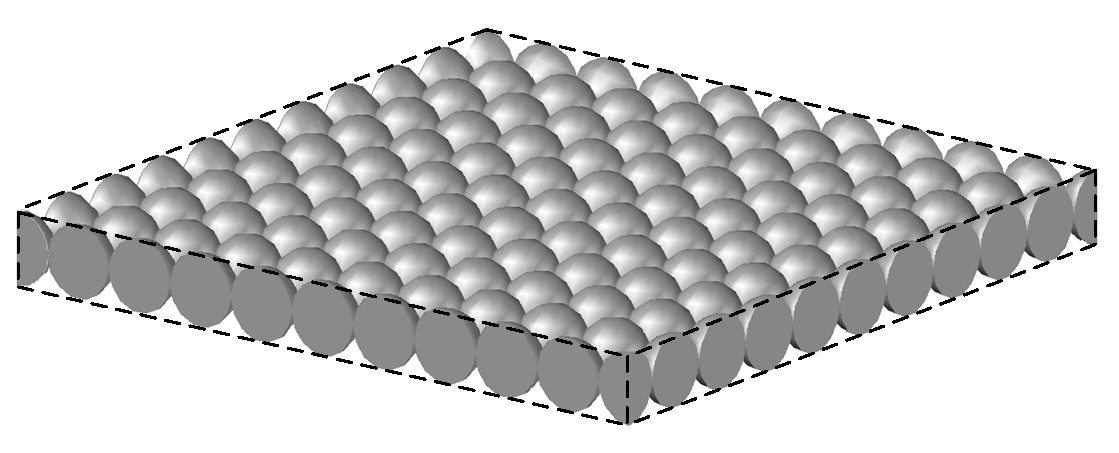
The model of a square plate based on DEM is created by discretizing the plate into a row of spherical particles, which can be divided into corner particles, edge particles, and interior particles according to the corresponding positions, as illustrated in Figure 1. It should be noted that determinations of the particle radius are related to the sizes of the plate surface rather than plate thickness.
In the plate discrete element model, adjacent particles are connected by artificially defined zero-length springs to form the basic analysis unit of the discrete plate element, namely the contact element. According to the location of the contact element, the contact element can be divided into edge contact, interior contact, and diagonal contact. The diagonal contact element only contains one normal spring, while other contacts contain six springs, including one normal, two tangential, one torsion, and two bending springs, as shown in Figure 2.
All particle movements follow Newton’s second law. Take a discrete particle α as an example, and assume that it is connected with other n units, and the external force and external moment acting on particle α are Fext and Mext, respectively. According to Newton’s second law, the equation of motion for particle α can be expressed as:
{ m α d 2 r d t 2 = j = 1 n F j int + F e x t J α d ω d t = j = 1 n M j int + M e x t
In the equation, mα and Jα represent the mass and inertia moment of particle α, respectively. r and ω represent the displacement vector and angular velocity vector of particle α. F j i n t and M j i n t represent the contact force and contact torque generated by the j-th unit adjacent to particle α, and t represents time.

2.2. Calculation of Internal Forces in Contact Elements

It can be obtained from Figure 2 that the material properties and deformation of the contact element are closely related to the zero-length spring of the contact point between the two particles. The stiffness of each spring along different directions is independent and does not affect each other. By combining Equation (1) with the central difference method, the relative linear displacement and relative angular displacement between the two particles in the contact element can be obtained. By adopting Equation (2), the incremental internal force at the contact point can also be calculated. According to the principle of force translation, the contact force is transferred to the center of the particle and integrated to obtain the internal force at the center of the particle.
Δ S = K e Δ U
In the equation, ΔS represents the incremental internal force of the contact element, including internal force and internal moment; ΔU represents the incremental relative displacement between the two particles of the contact element under the local coordinate system, including relative linear displacement and angular displacement. Ke represents the elastic stiffness matrix of the contact element, which includes three translational and three rotational stiffness for both edge and internal contacts, and only one normal stiffness for diagonal contacts, and the corresponding values can be calculated through the following equations [30].
E d g e   c o n t a c t :   { K n = E h 2 ( 1 + μ ) K τ 1 = ( 1 3 μ ) E h 8 ( 1 μ 2 ) K τ 2 = E h 4 ( 1 + μ ) K n θ = E h 3 24 ( 1 + μ ) K τ 1 θ = E h 3 24 ( 1 μ 2 ) K τ 2 θ = E R 2 h 6 ( 1 μ 2 )
I n t e r i o r   c o n t a c t :   { K n = E h 1 + μ K τ 1 = ( 1 3 μ ) E h 4 ( 1 μ 2 ) K τ 2 = E h 2 ( 1 + μ ) K n θ = E h 3 12 ( 1 + μ ) K τ 1 θ = E h 3 12 ( 1 μ 2 ) K τ 2 θ = E R 2 h 3 ( 1 μ 2 )
D i a g o n a l   c o n t a c t : K j = μ E h 1 μ 2
In the equation, E, h, μ, and R represent the elastic modulus, thickness, Poisson’s ratio, and particle radius of the plate, respectively.

3. Theory of Parameter Sensitivity Analysis

When using the discrete element method to analyze the deformation characteristics of plate structures, uncertainties in model input may lead to uncertainties in the accuracy of output results. The sensitivity analysis method investigates and analyzes the influence of various input uncertainties on the output uncertainties of the model [39], including single-parameter sensitivity analysis and multi-parameter sensitivity analysis.

3.1. Single-Parameter Sensitivity Analysis

Single-parameter sensitivity analysis is a method to investigate the influences of changes in a single parameter on the performance of the control objective within a certain range while keeping other parameters constant. It is also known as perturbation analysis. Single-parameter sensitivity analysis has been widely used in the fields of structure and materials due to easy operation and intuitive understanding.

3.2. Multi-Parameter Sensitivity Analysis

Multi-parameter sensitivity analysis considers the interaction between parameters, resulting in more reasonable and scientific results. Common methods for multi-parameter sensitivity analysis include the full factorial method and orthogonal design method.

3.2.1. Full Factorial Method

The key to the full factorial method is comparisons and analyses of all design combinations under different operating levels with various influential factors, which are able to provide a large amount of data for parameter analysis to accurately evaluate the interaction between parameter factors. It is commonly used for multi-parameter analysis when there are few parameters and levels to be considered for parameter interaction. Full factorial design requires a combination of n1 × n2 … × ni … × nj, where ni represents the number of levels for the i-th factor, and j represents the number of design parameters. Figure 3a shows a three-parameter, three-level full factorial design with a total of 27 combination sample points.

3.2.2. Orthogonal Design Method

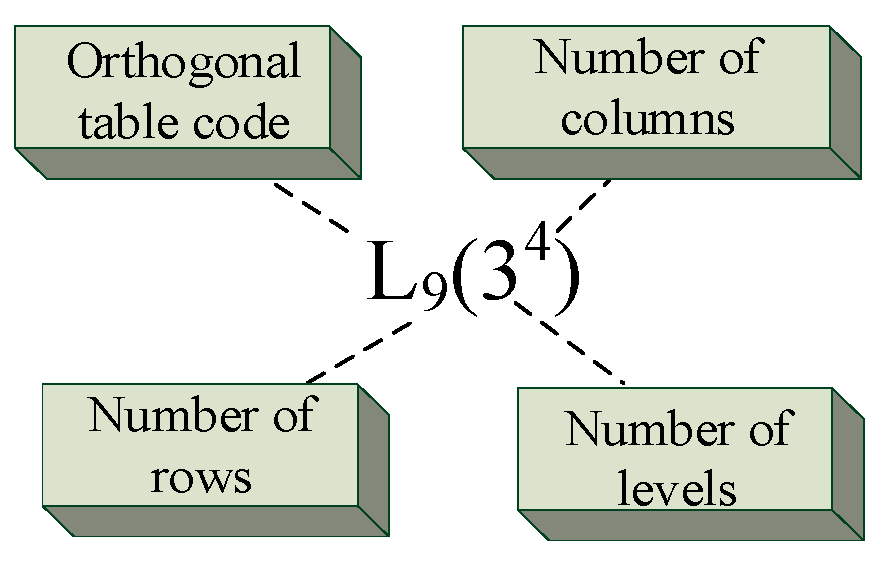
If there are too many model parameters and the parameters have multiple operating levels, using a full factorial design will result in a large number of operating combinations, which leads to a huge computational burden. The orthogonal design method selects representative parameters from each parameter and operating level to combine and judges the interaction effects between parameters and the corresponding influences on control objectives. Figure 3b shows a three-parameter, three-level orthogonal design with a total of nine combination sample points. Therefore, the orthogonal design method is an efficient design method for arranging multiple parameter combinations scientifically and is characterized by uniform dispersion, regularity, and comparability. The orthogonal design method can significantly reduce the number of analysis samples while considering the interaction of multiple parameters. Figure 4 shows the form and code meanings of orthogonal tables, and Table 1 is a four-parameter, three-level orthogonal table, which shows that the number of occurrences of each parameter operating level in any column is the same, and the arrangement of numbers in any two columns is complete and balanced.

4. Parameter Sensitivity Analysis

In this paper, a rectangular plate is used as the fundamental numerical model, as illustrated in Figure 5. The discrete element method was employed to calculate the deformations of the plate under varying parameter conditions and was compared with those obtained from the finite element method to validate the accuracy of the algorithm based on DEM. The finite element method considers the effect of in-plane membrane stress by enabling large deflection. The discrete element method uses particle centroid displacement as the basic quantity since the displacements obtained by solving the motion equation itself are reflections of force responses of the structure. Similarly, the finite element method also reflects the structure deformations through the nodal displacements. Therefore, using displacement as a reference for comparison between the two methods is more convenient and intuitive.

4.1. Influences of Single-Parameter Changes

When considering the influence of a single-parameter change, the plate thickness-to-width ratio, elastic modulus, and Poisson’s ratio were respectively applied to Equations (3)–(5) as basic analysis parameters to investigate the influences of single-parameter changes on the accuracy of the algorithm. For the model shown in Figure 5, the values of a and b were set to be 0.3 m, and ρ was set to be 7850 kg/m3. The boundary conditions of the simulation model included a four-edge simple support and a four-edge fixed support. A uniform load q was applied to the plate by using a static loading method. There were 21 particles and 420 contact elements in the discrete element model, as shown in Figure 6. The radius of the spherical particles was 15 mm. The time step, Δt, was set to be 1 × 10⁻⁶ s, and the total calculation time was 0.5 s.

4.1.1. Thickness-to-Width Ratio

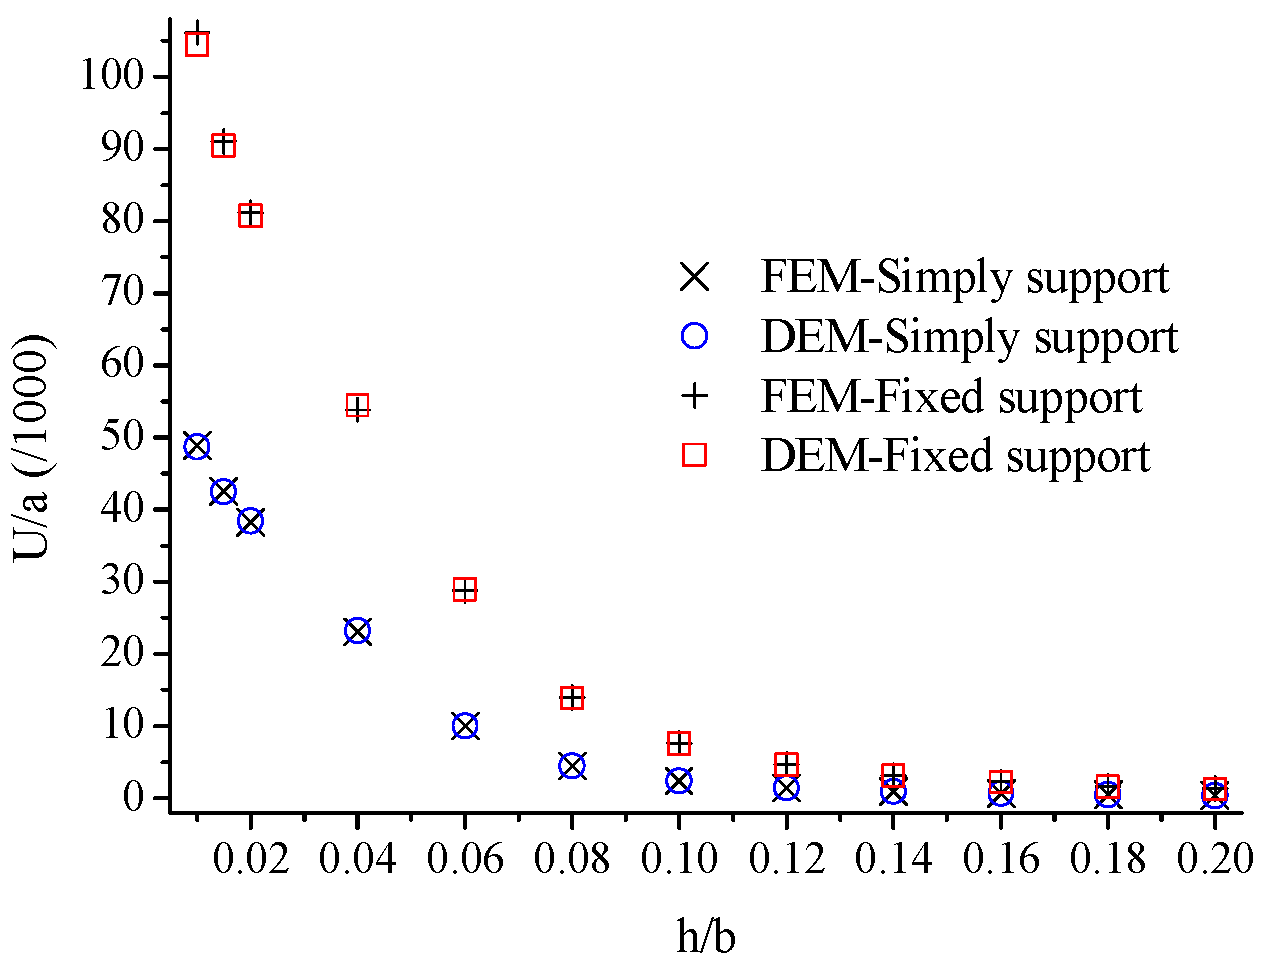
In dealing with deformation problems of loaded plates by using the finite element method, plates were classified based on their thickness-to-width ratio into the following categories: (1) thick plates: 1/8 < h/b < 1/5; (2) thin plates: 1/80 < h/b < 1/8; and (3) membrane: 1/100 < h/b < 1/80. In this investigation, when solid186 elements were employed to simulate thick plates based on FEM, the shear effect along the thickness direction of the plate was considered. When Shell181 elements were used for thin plates and membranes, the in-plane stress of the membrane was considered to avoid the phenomenon of “shear locking” in the plate. The selection of finite element analysis elements for plates of different thicknesses in the subsequent examples followed this rule. For the displacement response problem of plates with different thicknesses and loads, no special treatment is needed when using the discrete element method. For four-edge simply supported and four-edge fixed boundary conditions, the uniformly distributed load, q, on the plate was set to be 9.6 × 10⁶ Pa and 9.6 × 10⁷ Pa, respectively, with the elastic modulus E = 2.1 × 10¹¹ Pa and Poisson’s ratio μ = 0.24. According to the range of plate thickness, the thickness-to-width ratio h/b was set to be 0.01, 0.015, 0.02, 0.04, 0.06, 0.08, 0.1, 0.12, 0.14, 0.16, 0.18, and 0.2, respectively. The discrete element method was used to calculate the deflection-to-span ratio at the center point of the plate with different thickness-to-width ratios, and the results were compared with those obtained based on FEM.
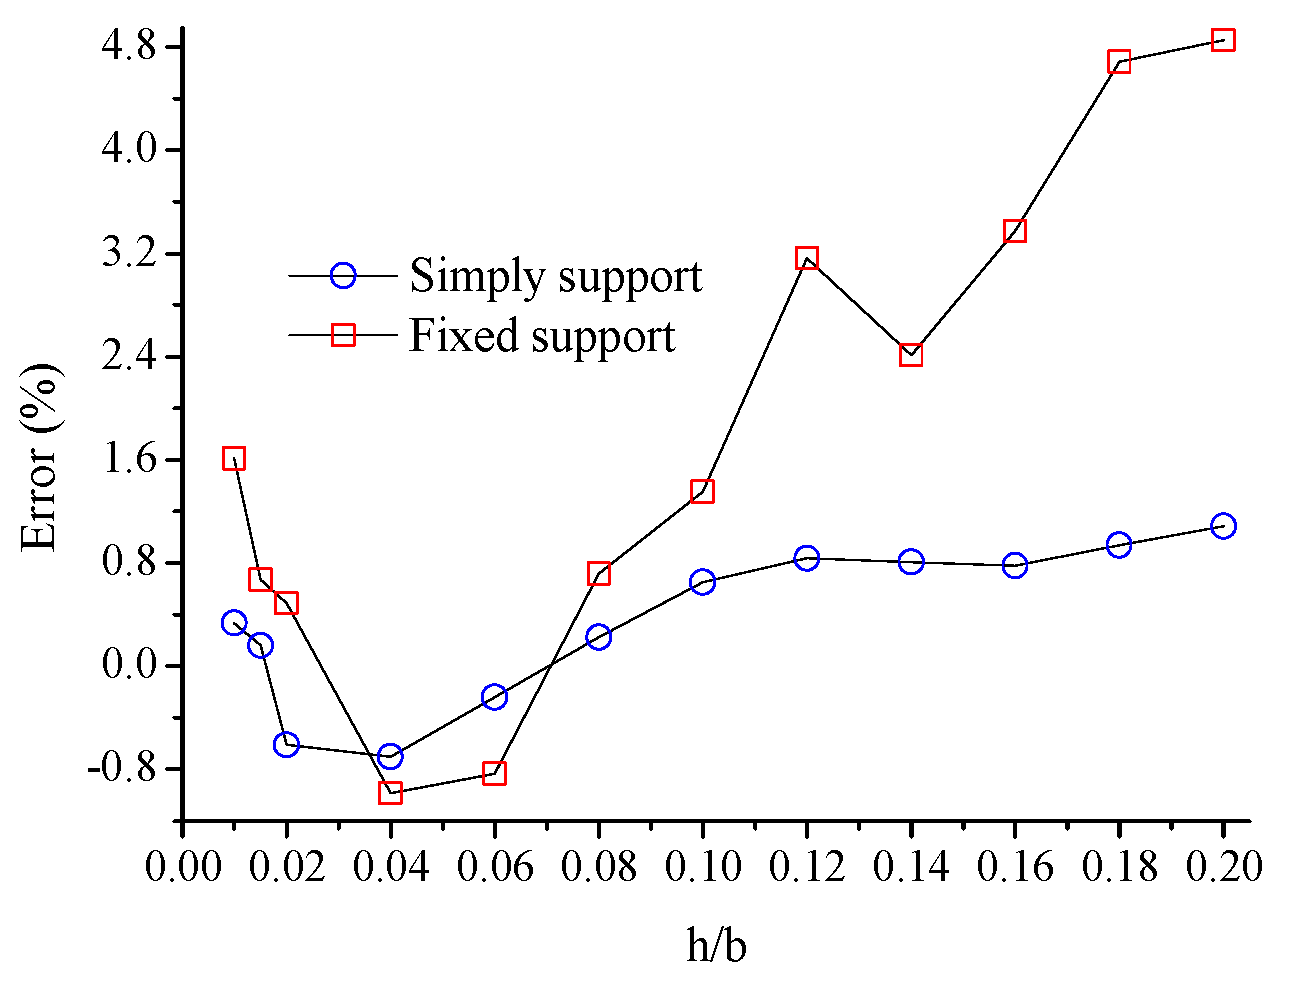
According to Figure 7, it is evident that plates with smaller thicknesses exhibited larger deflections. Bending deformations of the plate were obvious, and the in-plane membrane stress could not be ignored. As the plate thickness increased, shear deformations along the thickness direction became significant. The results obtained from the displacement response analyses of plates with different thicknesses, as shown in Figure 7 and Figure 8, using the discrete element calculation were in good agreement with those obtained using the finite element calculation. With increasing plate thickness, structural deformations reduced, and the calculation error slightly increased but remained within 5%. Compared to the finite element method, the discrete element method for plates did not require changing the element type for plates of different thicknesses, and it minimized the occurrence of “shear locking”. Therefore, within the range of plate properties, the thickness did not significantly affect the accuracy and applicability of the discrete element algorithm for plates.

4.1.2. Elastic Modulus

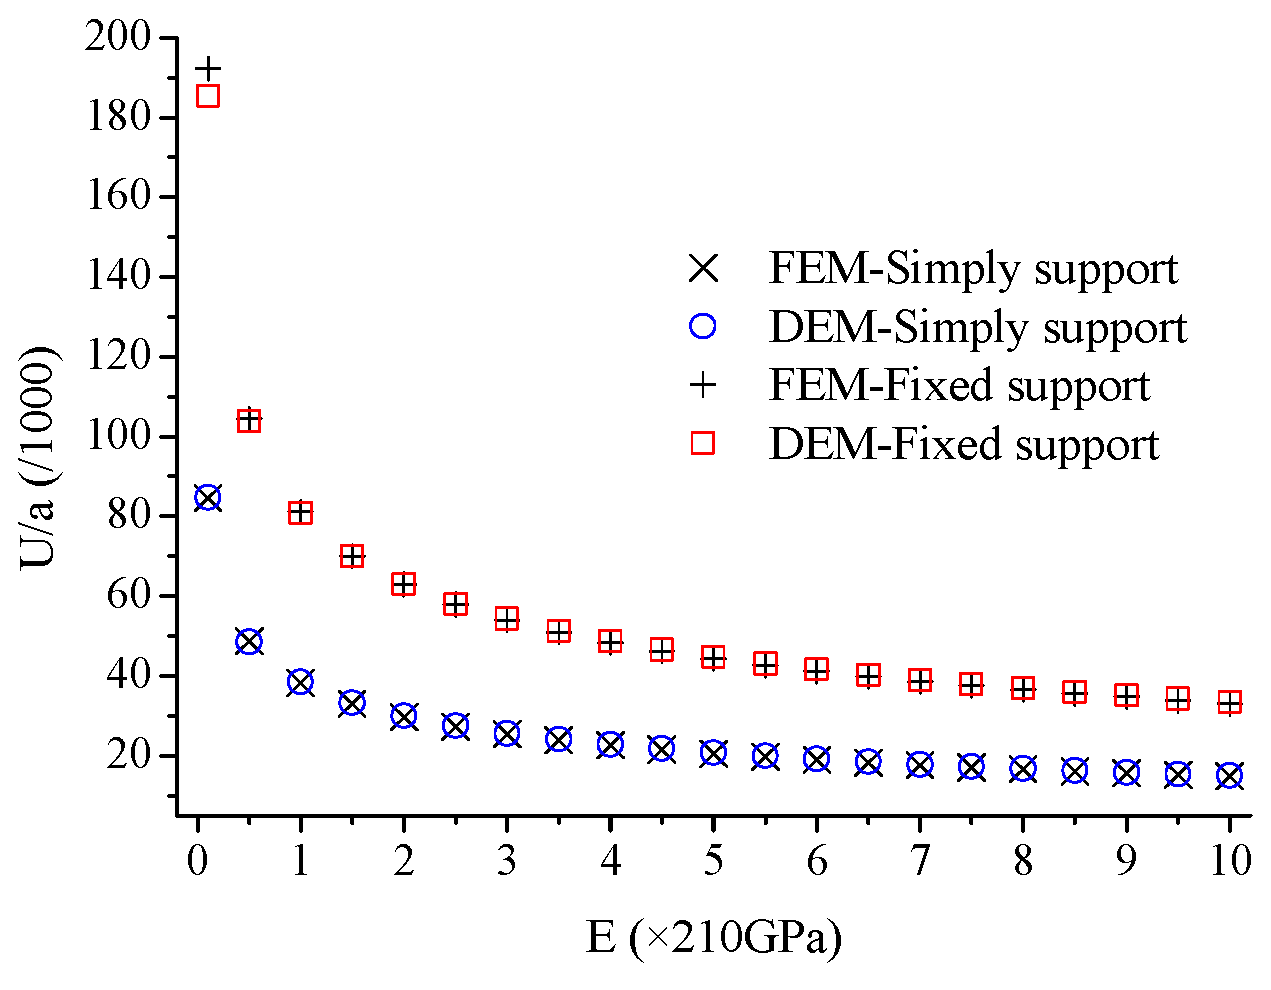
For square plates with the boundary conditions of four-edge simple support and four-edge fixed support, the uniformly distributed loads applied on the plate were set to be 9.6 × 10⁶ Pa and q = 9.6 × 10⁷ Pa, respectively. The plate thickness, h, was set to be 6 mm and the Poisson’s ratio, μ, was set to be 0.24. The basic elastic modulus of the plate, E0, under both boundary conditions, was set to be 2.1 × 10¹¹ Pa, and the range of the elastic modulus varies from 0.1 E0 to 10.0 E0 with a decrement of 0.5 E0, the variation process of which included small and large deformations of the plate and a total of 21 analysis scenarios. The discrete element method was used to calculate changes in the deflection-span ratio of the center point of the square plate with different elastic moduli, and the corresponding results were compared with those obtained according to the finite element method.
It can be observed from Figure 8 that the deflections of the plate were large with decreasing elastic modulus, the bending deformation effect was significant, and the stress of the in-plane membrane cannot be ignored. It can also be observed from Figure 9 and Figure 10 that both algorithms considered the effect of in-plane membrane stress and the results obtained based on the discrete element method and the finite element method were basically consistent with a maximum DEM–FEM error of 3.54%, indicating that the variation of elastic modulus had little effect on the accuracy and applicability of the DEM algorithm.

4.1.3. Poisson’s Ratio

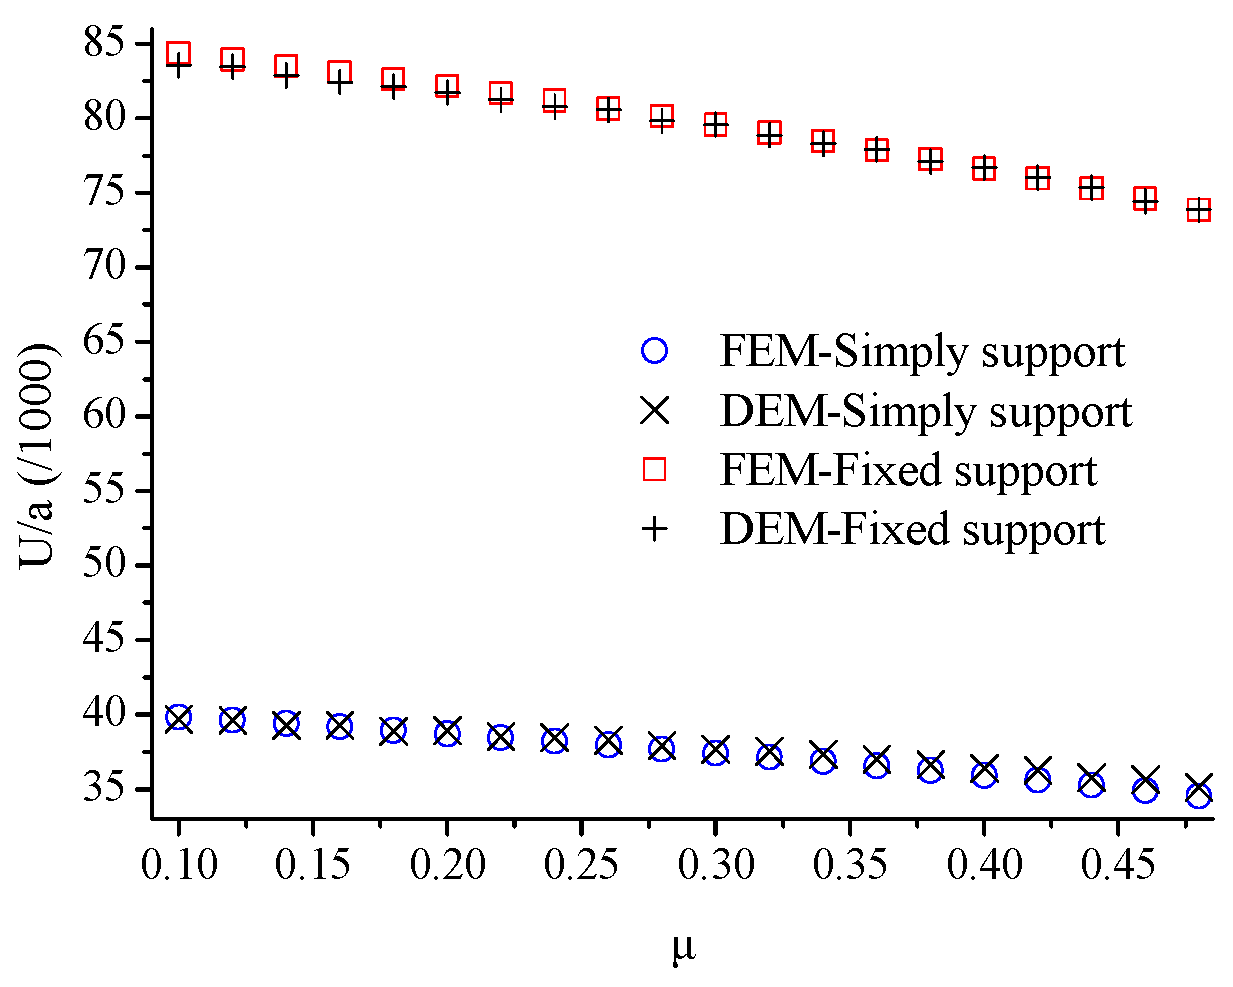
As a material property of the plate itself, Poisson’s ratio also affects its own bending stiffness under unchanged external loads. For square plates with a boundary condition of four-edge simple support and four-edge fixed support, the uniformly distributed loads, q, applied on the plate were set to be 9.6 × 10⁶ Pa and 9.6 × 10⁷ Pa, respectively. Plate thickness, h, was set to be 6 mm, and elastic modulus, E, was set to be 2.1 × 10¹¹ Pa. Poisson’s ratio ranged from 0.1 to 0.48, with a decrement of 0.02, covering the Poisson’s ratio range of commonly used materials. A total of 20 analysis scenarios were considered. The discrete element method was used to calculate the changes in the deflection–span ratio of the center point of the thin plate only when Poisson’s ratio changed, and the corresponding results were compared with those obtained according to the finite element method.
Changes in Poisson’s ratio alter the bending stiffness of the plate, thereby affecting the deflection degrees of the plate under loads. As shown in Figure 11 and Figure 12, as Poisson’s ratio increased, deflections at the center of the plate slightly decreased. The results obtained from the discrete element calculation and finite element calculation were essentially consistent, with a maximum error of −2.11%, which indicated that changes in Poisson’s ratio had little effect on the accuracy and applicability of the DEM algorithm.

4.2. Influences of Multi-Parameter Changes

In addition to the thickness-to-width ratio, elastic modulus, and Poisson’s ratio, differences in plate boundary conditions, size effects, and load forms may also affect the applicability of the DEM algorithm. To further verify the universality of the DEM algorithm, the orthogonal design method was adopted to analyze the influences of multi-parameter changes on the accuracy and applicability of the DEM algorithm. The values of each parameter were determined as follows.

4.2.1. Boundary Conditions

Common boundary conditions of a rectangular plate include one-sided, two-sided, three-sided, and four-sided constraints, which can be classified as simple support and fixed support. Determinations of boundary conditions are not only related to the number of constrained sides but also the distributions of fixed and simple supports. To confirm the DEM algorithm’s applicability to any boundary condition, a mixed boundary form was applied that considers the influences of various factors, as presented in Table 2.

4.2.2. Plate Dimensions

There is a wide range of plate sizes in engineering, spanning from small plate components to large plate materials. According to the relevant literature, the plate lengths of the corresponding simulation model varied from 0.3 m to 10 m. In this investigation, five representative and diverse plate sizes (a × b) were chosen: 0.3 m × 0.3 m, 1.2 m × 0.6 m, 2 m × 2 m, 4 m × 1 m, and 10 m × 10 m, which considered both plate size effect and aspect ratios.

4.2.3. Form of Loading

Five common types of loads in engineering were selected for analyses, including uniformly distributed loads, concentrated loads, line loads, impact loads, and harmonic loads. Impact loads and harmonic loads were uniformly distributed on the entire plate surface, and the time-displacement curves of DEM–FEM were obtained by comparing the results obtained based on DEM and FEM transient analysis. The other load forms were analyzed by using static loading, and the load-deflection ratio curves of DEM–FEM were obtained by comparing the results obtained according to DEM and FEM static analysis. The position of the line load and concentrated load and the displacement tracking points are shown in Table 2, and the loading method is shown in Figure 13. To obtain obvious deformations of the plate, load values were increased as much as possible while ensuring the convergence condition of the finite element analysis.

4.2.4. Thickness-to-Width Ratio

Plates with a thickness-to-width ratio in the range of 0.125–0.2 are considered thick plates, while those with a thickness-to-width ratio in the range of 0.0125–0.125 are classified as thin plates, and those with a thickness-to-width ratio in the range of 0.01–0.0125 are regarded as membranes. To ensure the broad representativeness of parameter values, the thickness-to-width ratio factors of 0.01, 0.04, 0.1, 0.16, and 0.2 were used. Details about the computation units used for finite element analysis can be found in Section 4.1.1.

4.2.5. Elastic Modulus

The properties of common materials used in engineering are listed in Table 3. It shows that the elastic modulus of commonly used plates is less than 200 GPa. To ensure the broad representativeness of parameter values, five levels of elastic modulus were used, with values of 0.005 GPa, 50 GPa, 100 GPa, 150 GPa, and 200 GPa.

4.2.6. Poisson’s Ratio

Table 4 shows that the Poisson’s ratios of the commonly used materials in engineering are typically between 0.1 and 0.48. To ensure the generality and representativeness of the parameter values, five levels of Poisson’s ratio were chosen, which are 0.1, 0.24, 0.3, 0.4, and 0.48.
In this study, the orthogonal design method was utilized to comprehensively evaluate the effect of multi-parameter changes on the accuracy and applicability of the DEM algorithm. The levels of each parameter are summarized in Table 4. The orthogonal design method was performed on six parameters, where each parameter had five levels to reduce the number of analyzed cases from 15,625(56) cases obtained from the full-factorial method to 25(52) combinations obtained from the orthogonal design method. This significantly reduced the computational workload and enabled the interaction between parameters to be considered. The representativeness of the orthogonal design lay in the following aspects: (1) each column contained all levels of the respective parameter with equal frequency; (2) all possible combinations of any two columns occurred; and (3) due to the orthogonality of the orthogonal table, the test combinations were evenly distributed in the full-factorial design combinations. The orthogonal design combinations are shown in Table 5. The discrete element analysis results of each operating condition were compared with the corresponding finite element analysis results to calculate the errors between the two algorithms when considering multi-parameter changes. The DEM–FEM error comparison rules were as follows: for harmonic load, the error was compared based on the deflection peak value of the two algorithms; for impact load, the error was compared based on the stable solutions of the two algorithms; for other loads, the error was compared based on the final results of the two algorithms.
Table 5 shows that compared to the finite element results, the discrete element method can maintain high accuracy even when considering multi-parameter changes, such as boundary conditions, dimensions, load forms, thickness-to-width ratio, elastic modulus, and Poisson’s ratio. In addition, the discrete element method did not require a change in element type for plates with different thicknesses. The error of maximum and mean values for each parameter level were 4.212% and 2.633% respectively, indicating that the DEM provided precise solutions to the displacement response problem of a loaded plate. The maximum range of the mean value for each parameter level was 2.184%, demonstrating the stability of the DEM algorithm. The deformation history curves of displacement tracking points under different conditions are illustrated in Figure 14. The DEM accurately tracked the displacement response of rectangular plates under loads, with no significant impact on the accuracy and applicability of the algorithm when considering multi-parameter changes. These findings confirm the universality of the DEM algorithm in solving deformation problems of rectangular plates under various loads.

5. Conclusions

In this investigation, both single-parameter analysis and orthogonal design methods were employed to analyze the impacts of relevant parameters on the displacement response of a rectangular plate under loading, utilizing the discrete element method. The following conclusions were drawn:
(1) The deformations of the plate were calculated and compared using the DEM and FEM through single-parameter analysis with varying thickness-to-width ratios, elastic modulus, or Poisson’s ratios. The discrete element method for plates did not require a change in element type when the thickness-to-width ratio changed. With an increase in the thickness-to-width ratio, the deflection gradually decreased, and the FEM–DEM calculation error remained within 5%. Similarly, when the elastic modulus or Poisson’s ratio changed, both methods considered the effect of membrane stress, with a maximum error of 3.54% and −2.11%, respectively. These results indicated that the variations in individual parameters had minimal impact on the accuracy and applicability of the DEM algorithm.
(2) To account for parameter interactions and their influence on the accuracy of the DEM algorithm, an orthogonal design method was adopted with five levels for six parameters: boundary conditions, dimensions, load forms, thickness-to-width ratio, elastic modulus, and Poisson’s ratio. The displacement responses of the plate structure under loading were calculated for each combination and compared with the corresponding finite element results. Compared to the finite element method, the maximum error for the analysis scenarios was 4.212%. Furthermore, the mean error and extreme difference for each parameter level were 2.633% and 2.184%, respectively. The static and dynamic displacement response curves of each working condition exhibited a high degree of consistency with those obtained according to the finite element method, further validating the universality of the plate discrete element method in addressing the force response problems in continuous medium plate structures.

Author Contributions

Conceptualization, methodology, software, validation, writing—original draft, writing, F.G.; supervision, funding acquisition, writing, J.Y. All authors have read and agreed to the published version of the manuscript.

Funding

This research was funded by the National Natural Science Foundation of China (Grant No. 51978655).

Data Availability Statement

Data sharing is not applicable to this article.

Conflicts of Interest

The authors declare no conflict of interest.

References

  1. Bourada, M.; Bouadi, A.; Bousahla, A.A.; Senouci, A.; Bourada, F.; Tounsi, A.; Mahmoud, S.R. Buckling behavior of rectangular plates under uniaxial and biaxial compression. Struct. Eng. Mech. 2019, 70, 113–123. [Google Scholar]
  2. Bohinc, U.; Brank, B.; Ibrahimbegovics, A. Discretization error for the Discrete Kirchhoff plate finite element approximation. Comput. Methods Appl. Mech. Eng. 2014, 269, 415–436. [Google Scholar] [CrossRef]
  3. Nguyen-Xuan, H. A polygonal finite element method for plate analysis. Comput. Struct. 2017, 188, 45–62. [Google Scholar] [CrossRef]
  4. Kikis, G.; Dornisch, W.; Klinkel, S. Adjusted approximation spaces for the treatment of transverse shear locking in isogeometric Reissner-Mindlin shell analysis. Comput. Methods Appl. Mech. Eng. 2019, 354, 850–870. [Google Scholar] [CrossRef]
  5. Enshaeian, A.; Rofooei, F. Geometrically nonlinear rectangular simply supported plates subjected to a moving mass. Acta Mech. 2014, 225, 595–608. [Google Scholar] [CrossRef]
  6. Kovalenko, M.D.; Abrukov, D.A.; Menshova, I.V.; Kerzhaev, A.P.; Yu, G.M. Exact solutions of boundary value problems in the theory of plate bending in a half-strip: Basics of the theory. Z. Für Angew. Math. Und Phys. 2019, 70, 98. [Google Scholar] [CrossRef]
  7. Papkov, S.; Banerjee, J.R. A New Method for Free Vibration Analysis of Triangular Isotropic and Orthotropic Plates of Isosceles Type Using an Accurate Series Solution. Mathematics 2023, 11, 649. [Google Scholar] [CrossRef]
  8. Belinha, J.; Aires, M. Elastoplastic Analysis of Plates with Radial Point Interpolation Meshless Methods. Appl. Sci. 2023, 12, 12842. [Google Scholar] [CrossRef]
  9. Morse, L.; Mallardo, V.; Sharif-Khodaei, Z.; Aliabadi, F.M.H. Shape Optimisation of Assembled Plate Structures with the Boundary Element Method. Aerospace 2022, 9, 381. [Google Scholar] [CrossRef]
  10. Burman, E.; Hansbo, P.; Larson, M.G. A simple approach for finite element simulation of reinforced plates. Finite Elem. Anal. Des. 2023, 142, 51–60. [Google Scholar] [CrossRef]
  11. Trinh, M.C.; Jun, H. A higher-order quadrilateral shell finite element for geometrically nonlinear analysis. Eur. J. Mech. A-Solids 2021, 89, 104283. [Google Scholar] [CrossRef]
  12. Lee, C.; Lee, D.H.; Lee, P.S. The strain-smoothed MITC3+ shell element in nonlinear analysis. Comput. Struct. 2022, 265, 106768. [Google Scholar] [CrossRef]
  13. Wu, B.; Pagani, A.; Filippi, M.; Chen, W.Q.; Carrera, E. Large-deflection and post-buckling analyses of isotropic rectangular plates by Carrera Unified Formulation. Int. J. Non-Linear Mech. 2019, 116, 18–31. [Google Scholar] [CrossRef]
  14. Rezaiee, P.M.; Arabie, E.; Masoodi, A.R. A triangular shell element for geometrically nonlinear analysis. Acta Mech. 2018, 229, 323–342. [Google Scholar] [CrossRef]
  15. Ansarir, R.; Hasrati, E.; Shakouri, A.H. Nonlinear large deformation analysis of shells using the variational differential quadrature method based on the six-parameter shell theory. Int. J. Non-Linear Mech. 2018, 106, 130–143. [Google Scholar] [CrossRef]
  16. Onkar, A.K. Nonlinear buckling analysis of damaged laminated composite plates. J. Compos. Mater. 2019, 53, 3111–3126. [Google Scholar] [CrossRef]
  17. Ko, Y.; Leep, S.; Bathe, K.J. The MITC4+ shell element in geometric nonlinear analysis. Comput. Struct. 2017, 185, 1–14. [Google Scholar] [CrossRef]
  18. Cundall, P.A.; Strack, O.D.L. A discrete numerical model for granular assemblies. Geotechnique 1979, 29, 47–65. [Google Scholar] [CrossRef]
  19. Timsina, K.; Krishna, C.G.; Meguro, K. Sociotechnical Evaluation of the Soft Story Problem in Reinforced Concrete Frame Buildings in Nepal. J. Perform. Constr. Facil. 2021, 35, 04021019. [Google Scholar] [CrossRef]
  20. Christy, D.L.; Pillai, T.M.M.; Nagarajan, P. Analysis of Brick Masonry Wall using Applied Element Method. In Proceedings of the International Conference on Recent Advances in Materials, Mechanical and Civil Engineering, Hyderabad, India, 1–2 June 2017. [Google Scholar]
  21. Le, B.D.; Dau, F.; Charles, J.L. Modeling damages and cracks growth in composite with a 3D discrete element method. Compos. Part B Eng. 2016, 91, 615–630. [Google Scholar] [CrossRef] [Green Version]
  22. Kumar, R.; Rommel, S.; Jauffres, D. Effect of packing characteristics on the discrete element simulation of elasticity and buckling. Int. J. Mech. Sci. 2016, 110, 14–21. [Google Scholar] [CrossRef]
  23. Mathews, A.K.; Khan, A.; Sharma, B.; Kumar, S.; Kumar, R. A numerical investigation of granular shock waves over a circular cylinder using the discrete element method. J. Fluid Mech. 2022, 936, A11. [Google Scholar] [CrossRef]
  24. Ye, J.H.; Qi, N. Progressive collapse simulation based on DEM for single-layer reticulated domes. J. Constr. Steel Res. 2017, 128, 721–731. [Google Scholar]
  25. Ye, J.H.; Xu, L.L. Member Discrete Element Method for Static and Dynamic Responses Analysis of Steel Frames with Semi-Rigid Joints. Appl. Sci. 2017, 7, 714. [Google Scholar] [CrossRef] [Green Version]
  26. Ye, J.H.; Zhang, M. Buckling behavior of single-layer reticulated shells based on member discrete element method. J. Build. Struct. 2019, 40, 50–57. (In Chinese) [Google Scholar]
  27. Qi, N.; Ye, J.H. Nonlinear Dynamic Analysis of Space Frame Structures by Discrete Element Method. Appl. Mech. Mater. 2014, 638–640, 1716–1719. [Google Scholar] [CrossRef]
  28. Xu, L.L.; Ye, J.H. DEM Algorithm for Progressive Collapse Simulation of Single-Layer Reticulated Domes under Multi-Support Excitation. J. Earthq. Eng. 2017, 23, 18–45. [Google Scholar] [CrossRef]
  29. Xu, Q.; Ye, J.H. An adaptively coupled DEM–FEM algorithm for geometrical large deformation analysis of member structures. Comput. Part. Mech. 2019, 7, 947–959. [Google Scholar] [CrossRef]
  30. Guo, F.; Ye, J.H. Contact Model and Elastic Deformation Analysis of Plate Structure Based on the Discrete Element Method. Arch. Appl. Mech. 2022, 92, 2513–2523. [Google Scholar] [CrossRef]
  31. Borgonovo, E. A Methodology for Determining Interactions in Probabilistic Safety Assessment Models by Varying One Parameter at a Time. Risk Anal. 2010, 30, 385–399. [Google Scholar] [CrossRef]
  32. Proppe, C. Local reliability based sensitivity analysis with the moving particles method. Reliab. Eng. Syst. Saf. 2021, 207, 107269. [Google Scholar] [CrossRef]
  33. Frey, H.C.; Patil, S.R. Identification and review of sensitivity analysis methods. Risk Anal. 2010, 22, 553–578. [Google Scholar] [CrossRef]
  34. Kamal, M.; Inel, M. Correlation between Ground Motion Parameters and Displacement Demands of Mid-Rise RC Buildings on Soft Soils Considering Soil-Structure-Interaction. Buildigs 2021, 11, 125. [Google Scholar] [CrossRef]
  35. Cavaliere, P.; Perrone, A.; Marsano, D.; Primavera, V. Hydrogen-Based Direct Reduction of Iron Oxides Pellets Modeling. Steel Res. Int. 2023, 94, 2200791. [Google Scholar] [CrossRef]
  36. Batou, A. A sensitivity-based one-parameter-at-a-time model updating method. Mech. Syst. Signal Process. 2019, 122, 247–255. [Google Scholar] [CrossRef] [Green Version]
  37. Zhang, M.; Yu, L.; Xu, X. New Sensitivity Analysis Methods for Complex Modal Parameters in Asymmetrical Damped System. AIAA J. 2021, 59, 3165–3172. [Google Scholar] [CrossRef]
  38. Wang, B.H.; Deng, C. Investigation of the effect of humidity at both electrode on the performance of PEMFC using orthogonal test method. Int. J. Hydrogen Energy 2019, 44, 13737–13743. [Google Scholar] [CrossRef]
  39. Zhang, K.; Lu, Z.; Cheng, L. A new framework of variance based global sensitivity analysis for models with correlated inputs. Struct. Saf. 2015, 55, 1–9. [Google Scholar] [CrossRef]
Figure 1. DEM model of the plate structure.
Buildings 13 01567 g001
Figure 2. Contact element.
Buildings 13 01567 g002
Figure 3. The method of sensitivity analysis: (a) full factor design; (b) orthogonal design.
Buildings 13 01567 g003
Figure 4. Orthogonal table form and code meaning.
Buildings 13 01567 g004
Figure 5. Rectangle plate model.
Buildings 13 01567 g005
Figure 6. DEM model of the square plate.
Buildings 13 01567 g006
Figure 7. The effect of thickness-to-width ratio variation on the deflection-to-span ratio of the plate.
Buildings 13 01567 g007
Figure 8. Influence of different thickness-to-width ratios on DEM–FEM error.
Buildings 13 01567 g008
Figure 9. Change in the deflection-to-span ratio of the plate center point under different elastic moduli.
Buildings 13 01567 g009
Figure 10. Influence of elastic modulus variation on DEM–FEM error.
Buildings 13 01567 g010
Figure 11. Change in the deflection-to-span ratio of the plate center point under different Poisson’s ratios.
Buildings 13 01567 g011
Figure 12. Influence of Poisson’s ratio variation on DEM–FEM error.
Buildings 13 01567 g012
Figure 13. Loading mode.
Buildings 13 01567 g013
Figure 14. Deformation curve of the displacement tracking point under various working conditions.
Buildings 13 01567 g014aBuildings 13 01567 g014b
Table 1. Orthogonal representation.
Operating CombinationParameter
ABCD
11111
21222
31333
42123
52231
62312
73132
83213
93321
Table 2. Information about different boundary conditions.
BoundaryFixedSimplyDisplacement Tracking PointPosition of
Line Load
Position of Point Load
Cantilever plateAB\CCDC
Two adjacent edgesABADCCDC
Two opposite edgesABCDEFGE
Three edgesABAD, BCHCDH
Four edgesAB, CDBC, ADEFGE
Table 3. Properties of commonly used materials.
MaterialE (GPa)μMaterialE (GPa)μ
Alloy steel2060.25–0.3Cast steel1750.31–0.34
Lead1700.42Aluminum alloy710.3
Rolled aluminum690.32–0.36Concrete14–230.1–0.18
Nylon2.830.4Rubber0.007840.48
Table 4. Analyzed parameters and levels.
ParametersLevel 1Level 2Level 3Level 4Level 5
1Boundary conditionsCantilever plateTwo adjacentTwo opposite Three edgesFour edges
2Plate dimensions (m)0.3 × 0.31.2 × 0.62 × 24 × 110 × 10
3Form of loadingUniformly distributedLine loadConcentrated loadImpactHarmonic
4Thickness-to-width ratio0.010.040.10.160.2
5Elastic modulus (GPa)0.00550100150200
6Poisson’s ratio0.10.240.30.40.48
Table 5. Orthogonal design table for L25(56).
Operating
Combination
BoundaryDimensionForm of
Loading
h/bEμError *
Y (%)
11111110.239
22222220.918
33333331.063
4444444−2.342
55555552.002
61234510.838
72345121.359
83451233.102
94512344.212
105123452.805
111352410.187
122413520.474
133524132.762
144135241.623
155241350.424
161425310.460
17253142−2.884
18314253−1.736
194253140.865
205314251.747
21154321−2.652
222154321.538
233215430.546
244321544.121
255432152.559
Mean value1 ** (%)0.8751.8111.6422.1542.1540.875
Mean value2 ** (%)1.4350.7182.2131.9222.0081.435
Mean value3 ** (%)1.8420.9801.7941.5721.5401.842
Mean value4 ** (%)2.6332.1001.7031.8451.7532.633
Mean value5 ** (%)1.9072.9031.5391.1981.8341.907
Range *** (%)1.7572.1840.6740.9560.6141.757
* The calculation formula for error is as follows: Error = (UFEM − UDEM)/UFEM × 100%, where U represents the deflection value at the analysis scenario. ** The mean value is denoted by Qij, where i and j represent the level number and parameter number, respectively. Qij indicates the mean error of the j-th parameter at the i-th level under the orthogonal combination. For example, Q11 = (|Y1| + |Y6| + |Y11| + |Y16| + |Y21|)/5, which reflects the influence degrees of parameter level changes on the target value. *** The range is calculated as Range = max{Qj} − min{Qj}, which provides an estimate of the magnitude of the target value fluctuation due to parameter changes.
Disclaimer/Publisher’s Note: The statements, opinions and data contained in all publications are solely those of the individual author(s) and contributor(s) and not of MDPI and/or the editor(s). MDPI and/or the editor(s) disclaim responsibility for any injury to people or property resulting from any ideas, methods, instructions or products referred to in the content.