
Experimental Simulation of Deformation Effect Propagation Due to Explosion on the Surface of a Small-Scale Model


Abstract
1. Introduction
2. Materials and Methods
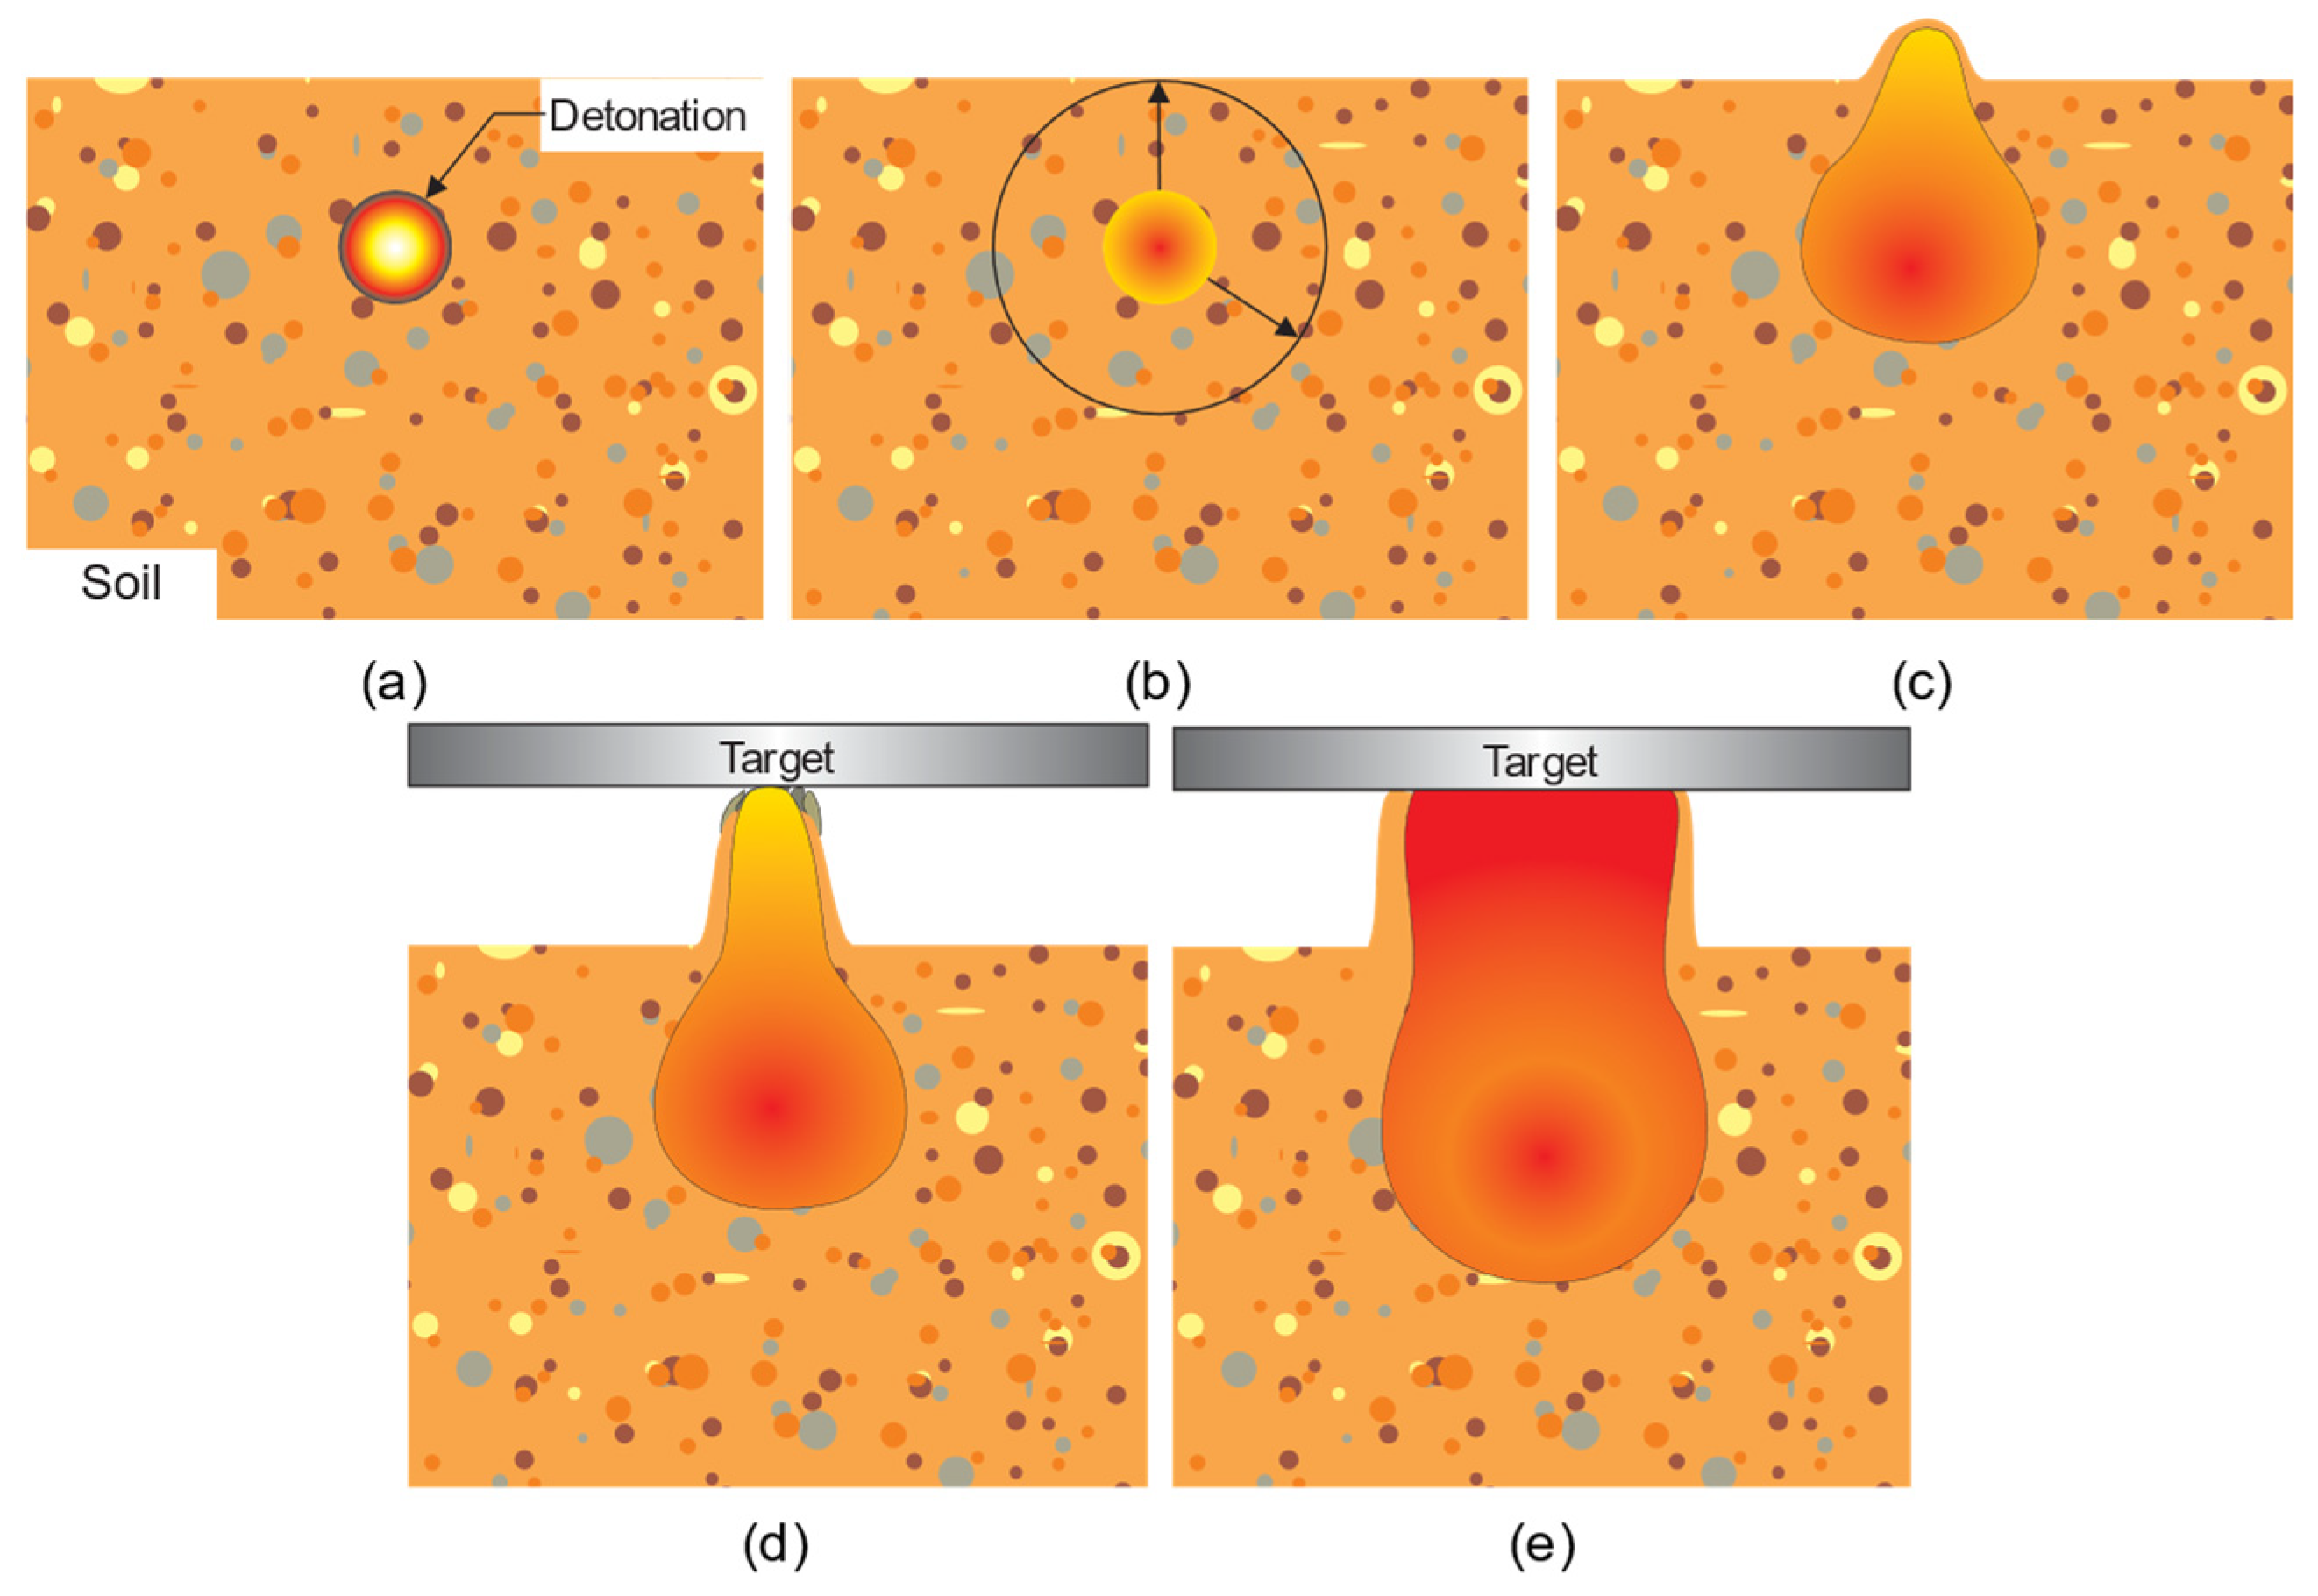
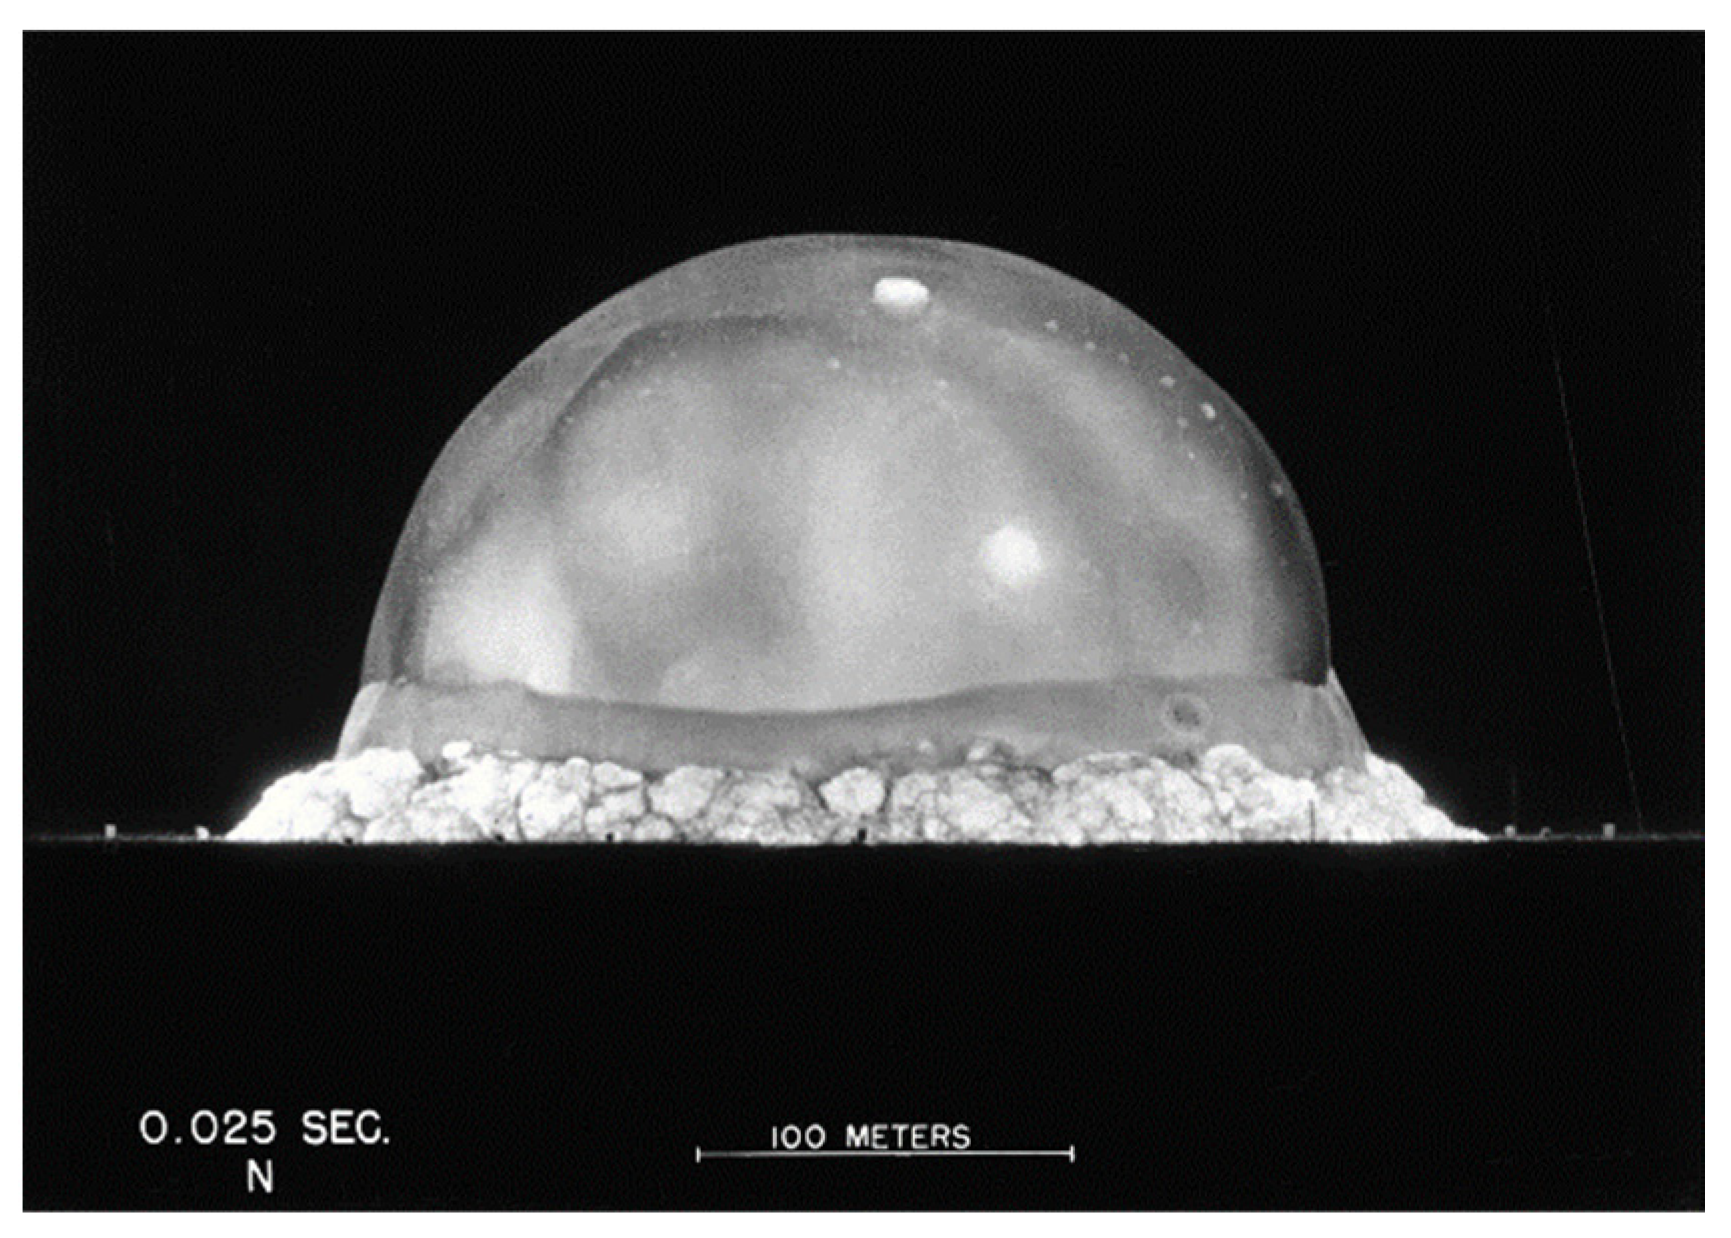
2.1. Determination of Explosion Energy
- C—based on small-scale measurements, C = 1033 represents the ratio between time and radius;
- ρ—ambient air density;
- r; t—measured data.
2.2. Seismic Wave Types
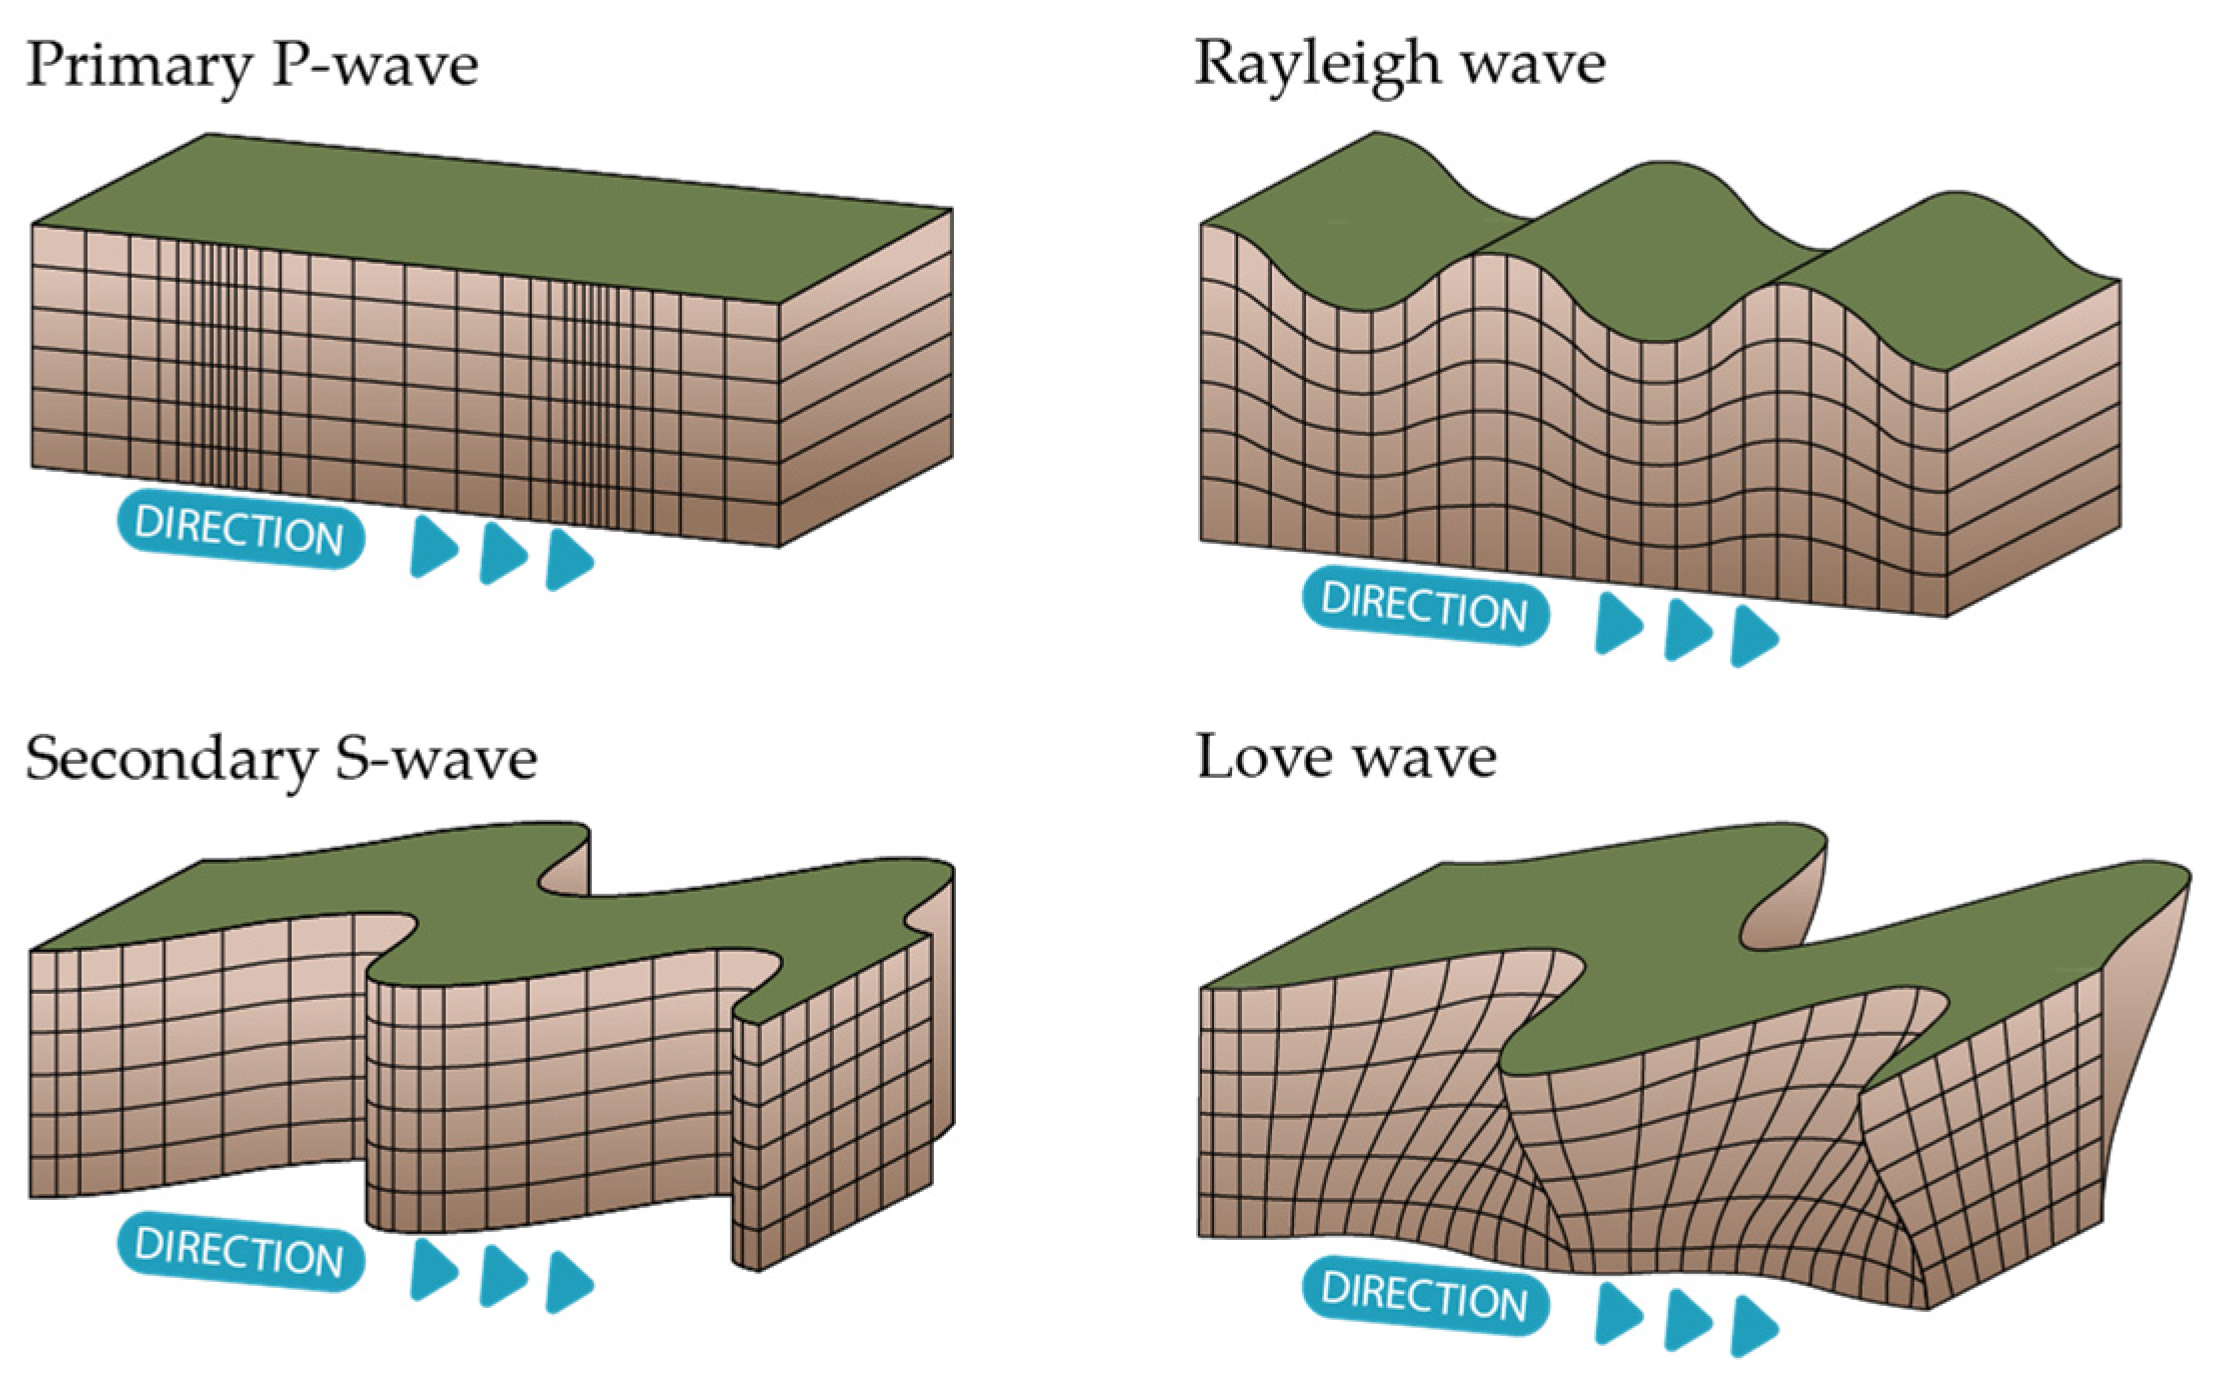
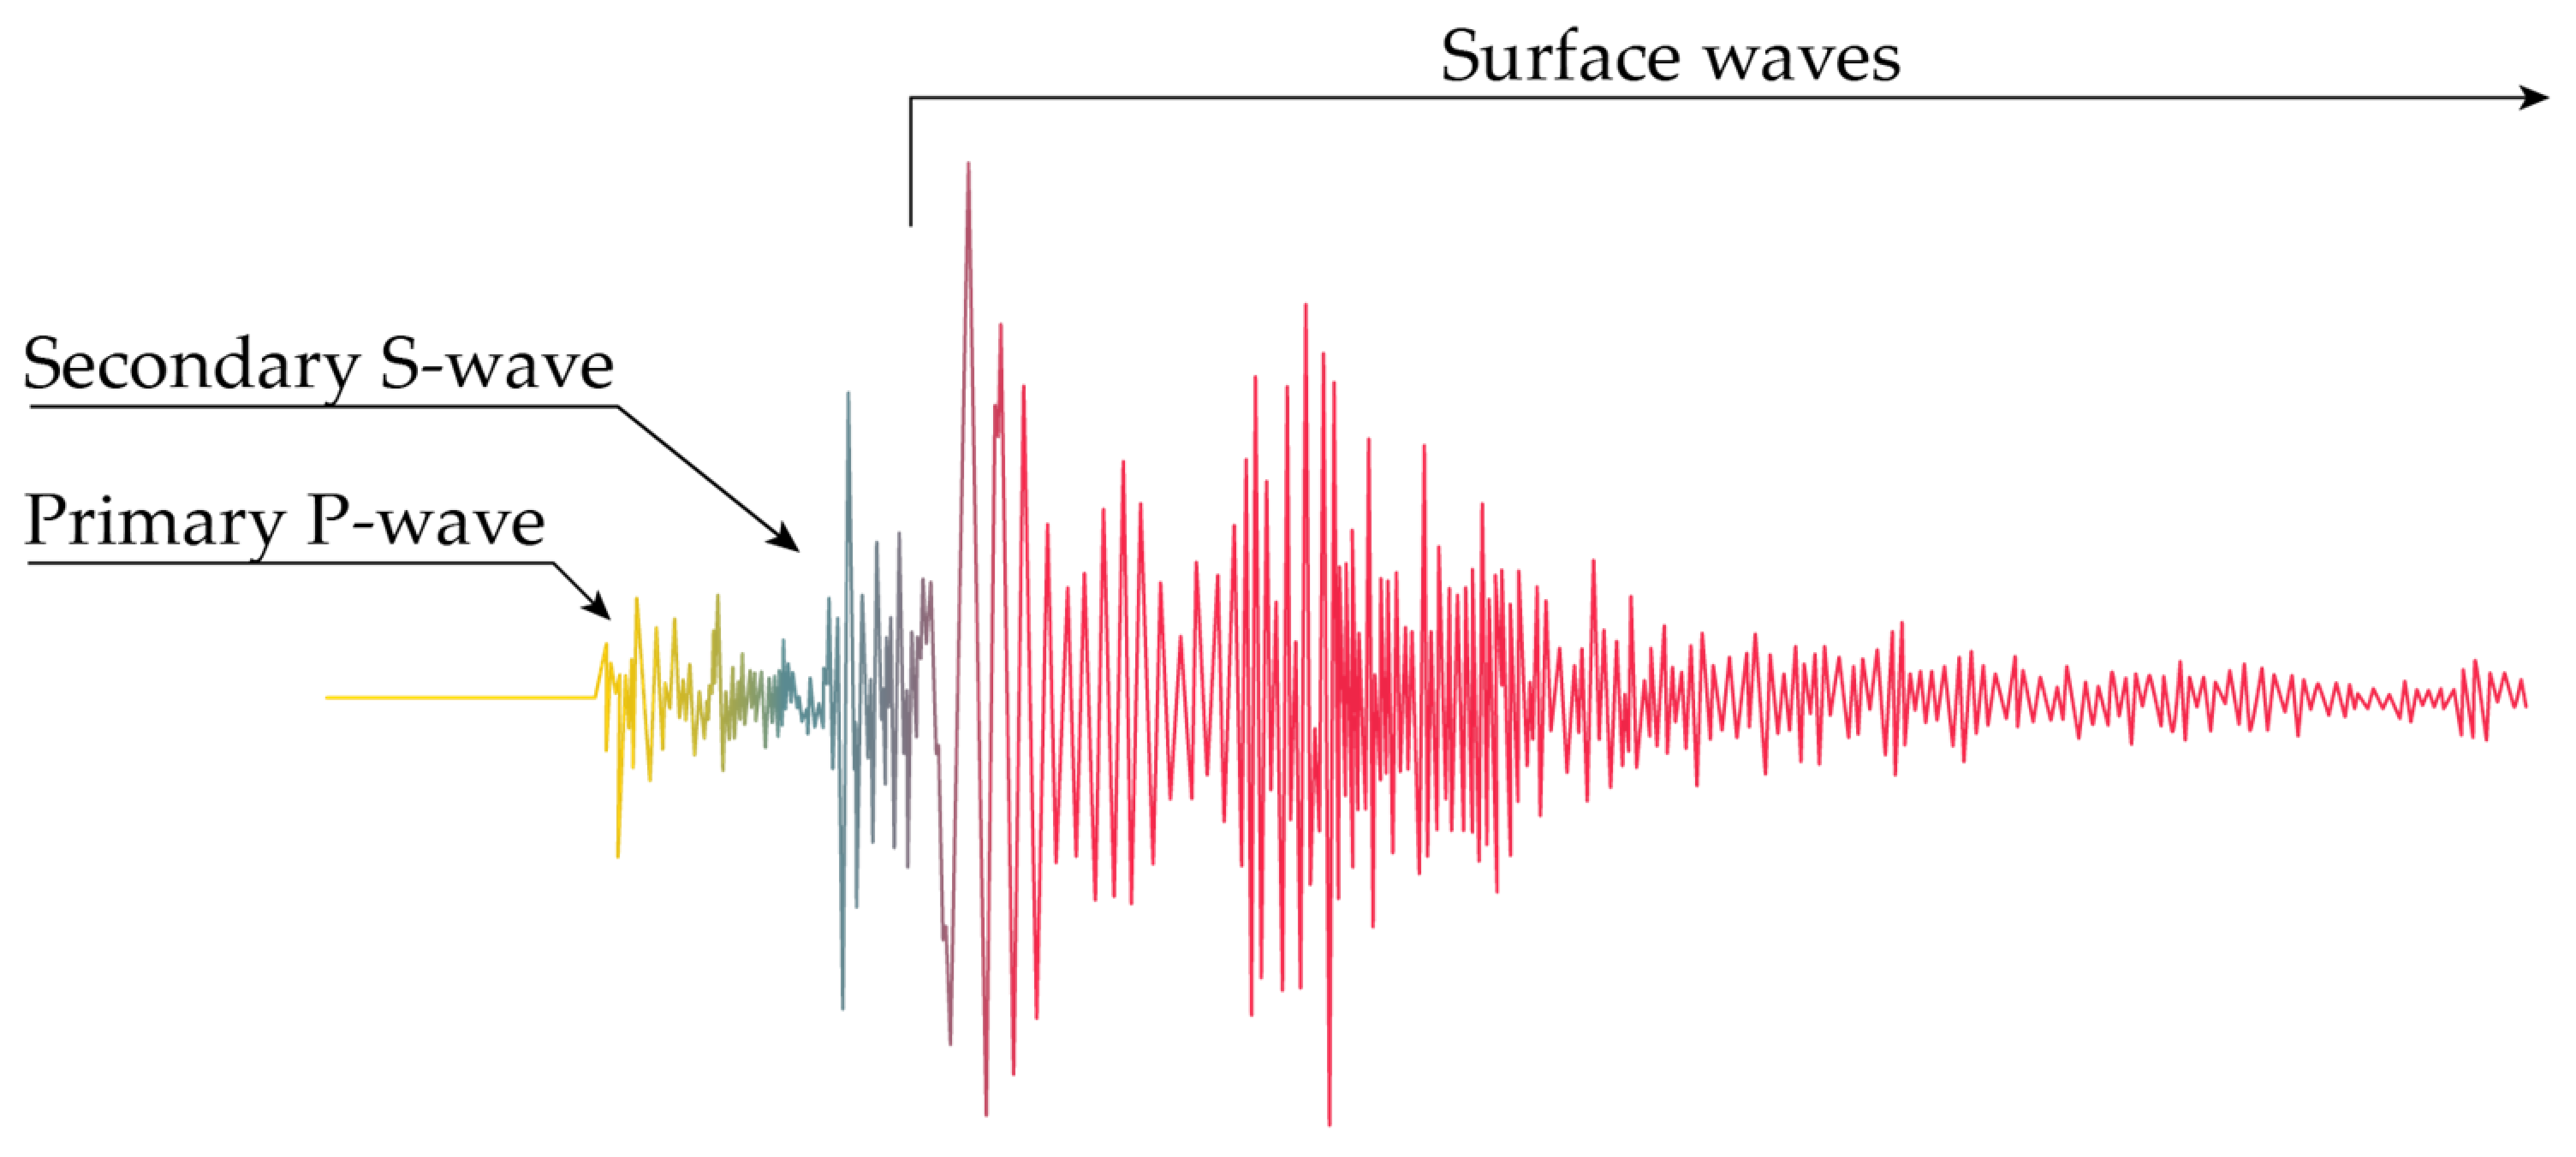
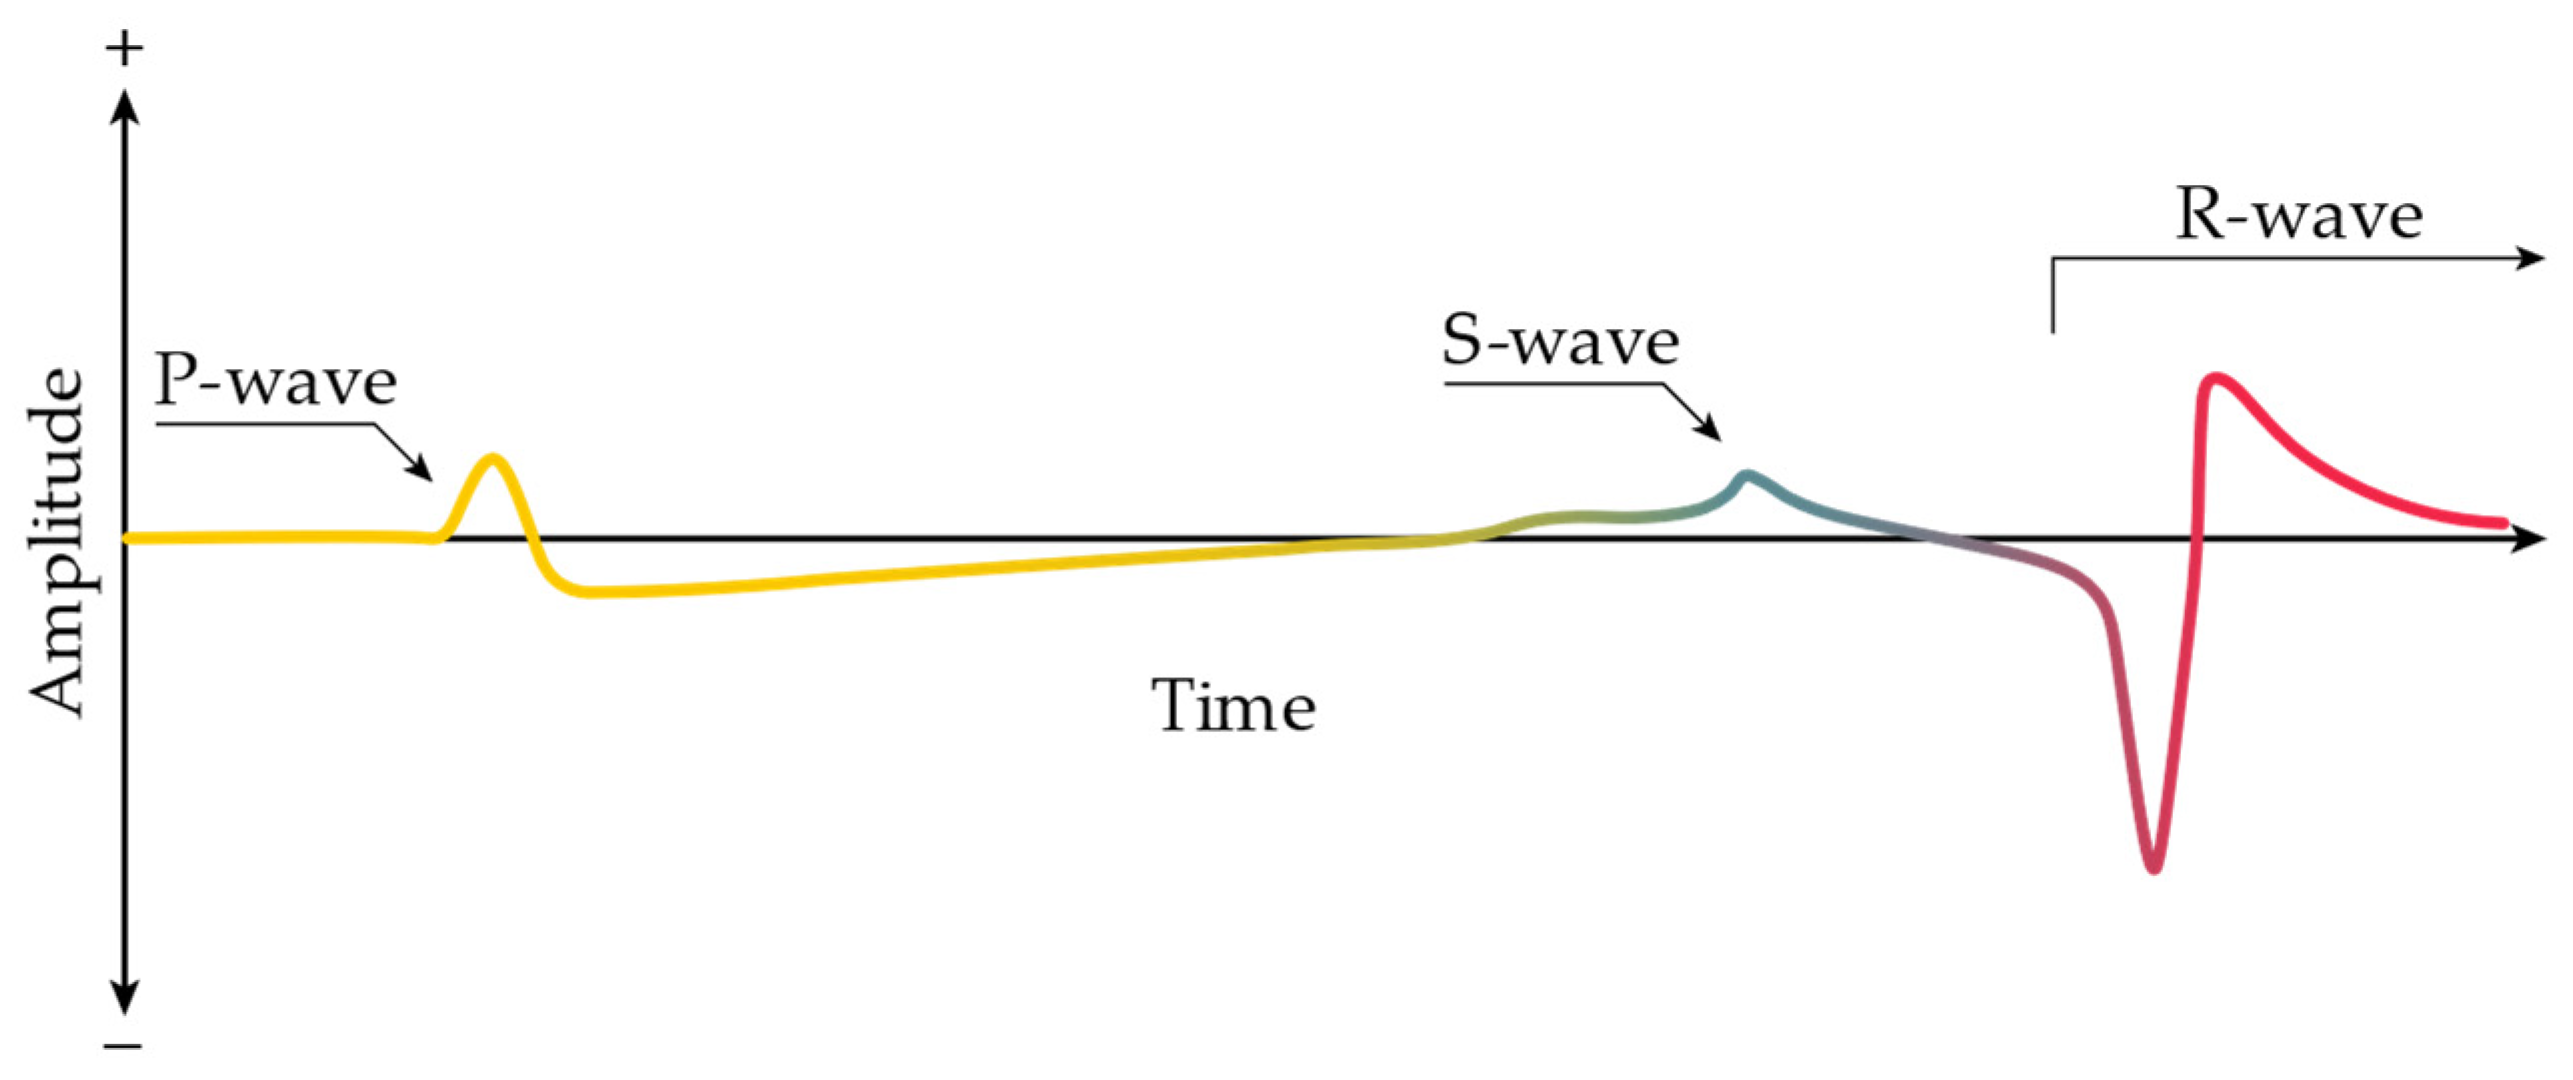
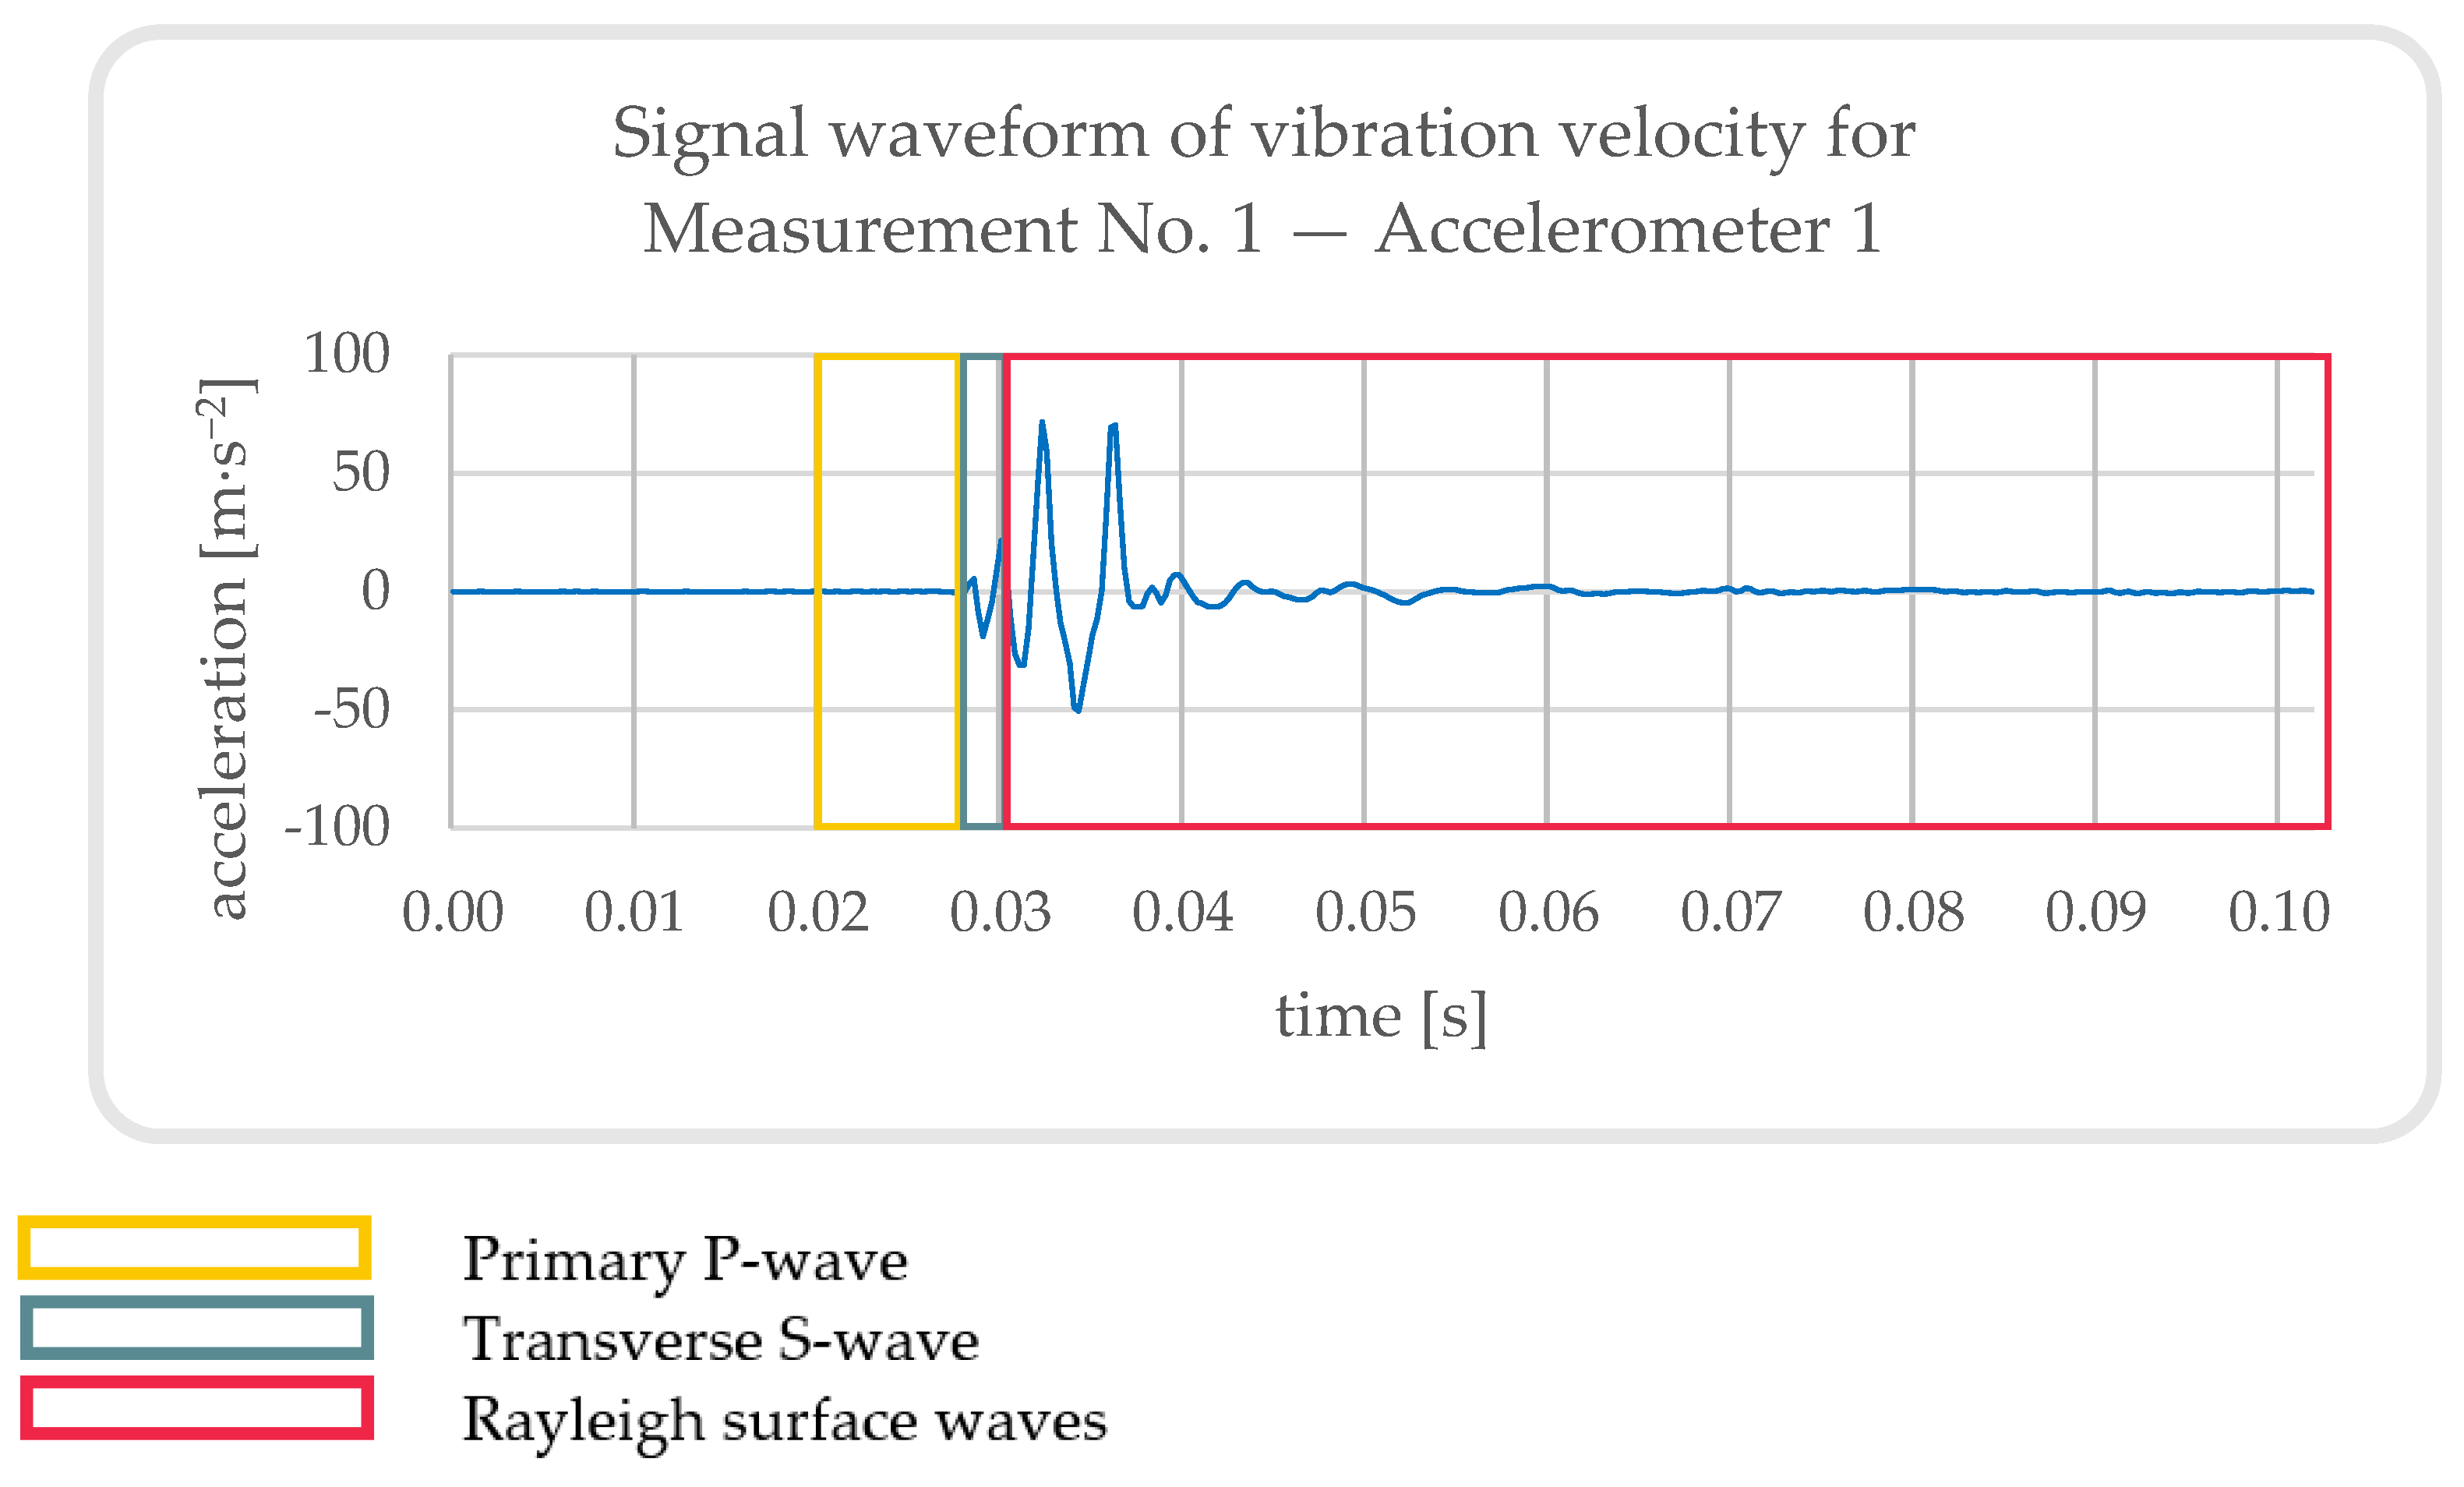
- Longitudinal P-waves—primary. These are the fastest type of waves and reach the accelerometers first. Both P-waves and pressure waves move in the same direction. The material that is affected by a pressure wave moves forward and then back along the same path as the wave when it reaches a certain point.
- Transverse S-waves—secondary. In the case of accelerometers, they arrive as secondary signals. When the wave passes through the material, the point of propagation moves from side to side or up and down.
- Love waves—surface waves. Like S-waves they oscillate the surface from side to side in the direction they propagate.
- Rayleigh waves—the second type of surface waves. As a result, the surface moves simultaneously in both vertical and horizontal directions. Due to their potential for causing significant damage to buildings and other structures, these waves are extremely dangerous [12].
2.3. Explosives
2.3.1. Pyrotechnic Compositions
2.3.2. Fireworks
- Category F1—this category is considered to be very low risk and noise levels are negligible. Only persons over the age of 15 are permitted to purchase this product. This includes, e.g., sparklers, fountains, and buzzers.
- Category F2—represents a low level of danger and minimal noise levels.A person must be at least 18 years of age in order to purchase this product. Among these items are, for example, cannons, rockets, compacts, and fountains.
- Category F3—presents a medium level of danger and the noise level is not harmful to human health. The product is only available to persons over the age of 21. A few examples of this type of fireworks would be firecrackers, compacts and rockets.
- Category F4—a major level of danger is associated with this category, which includes professional pyrotechnics that are available only to qualified users [14].
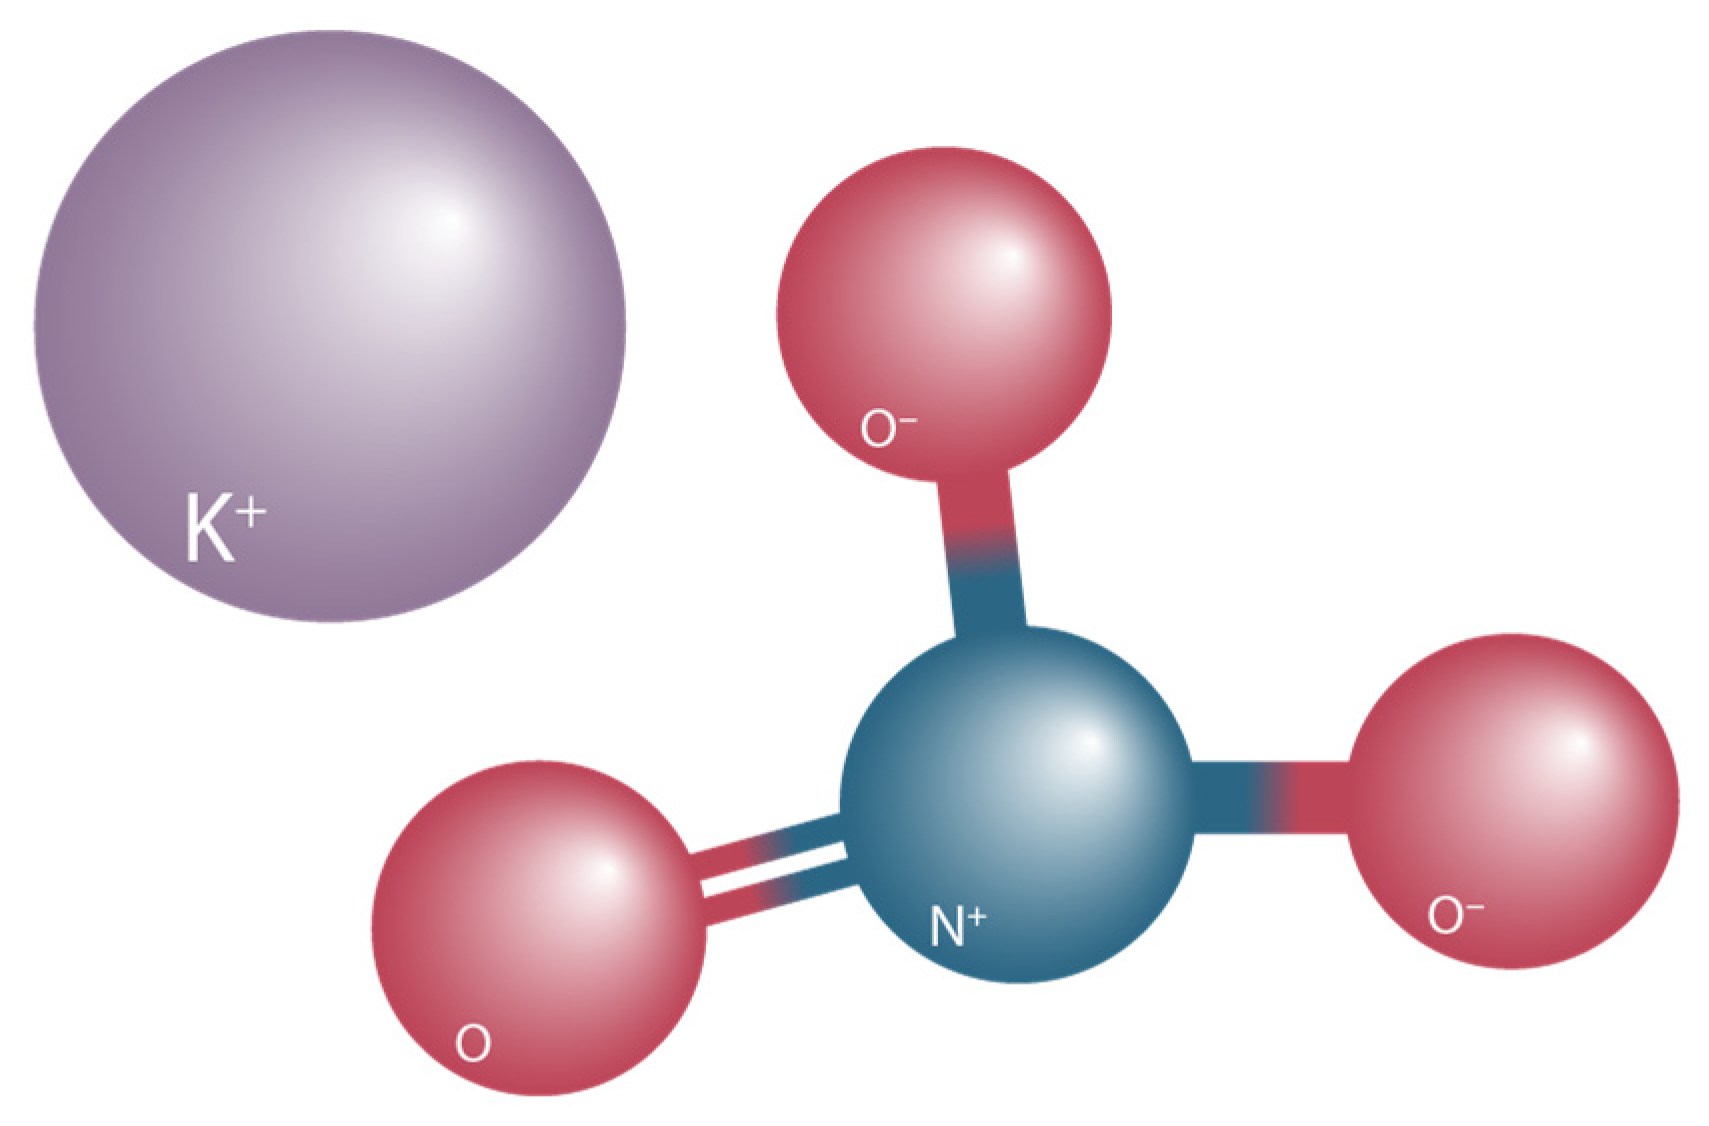
2.3.3. K01M Booming Carpet
2.4. Experimental Measurement
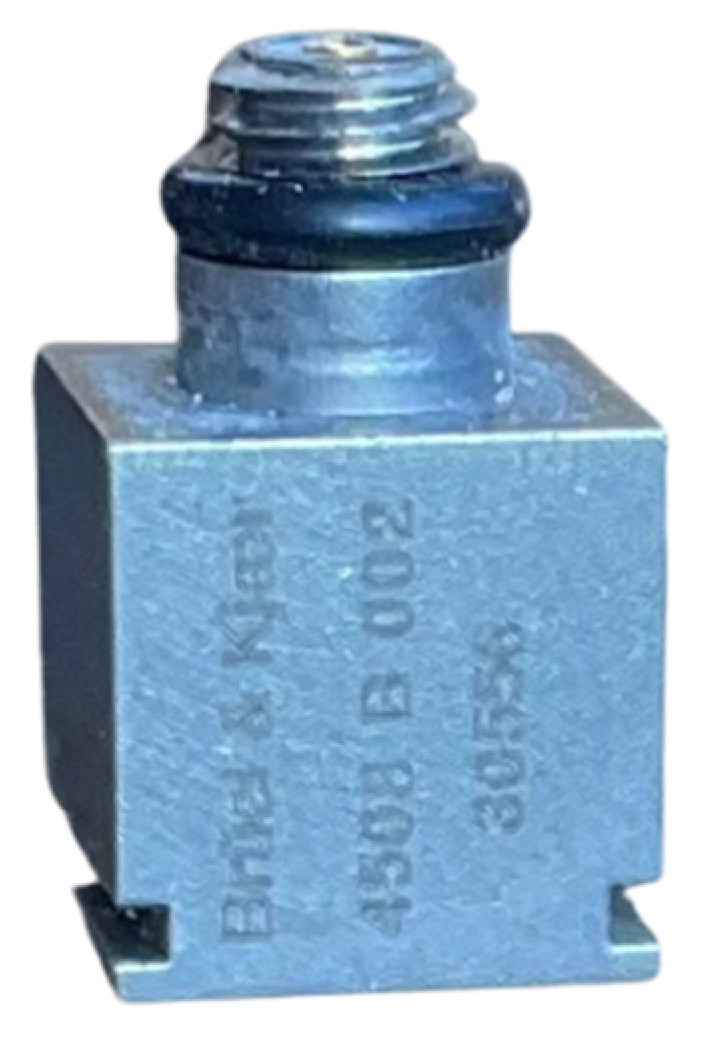
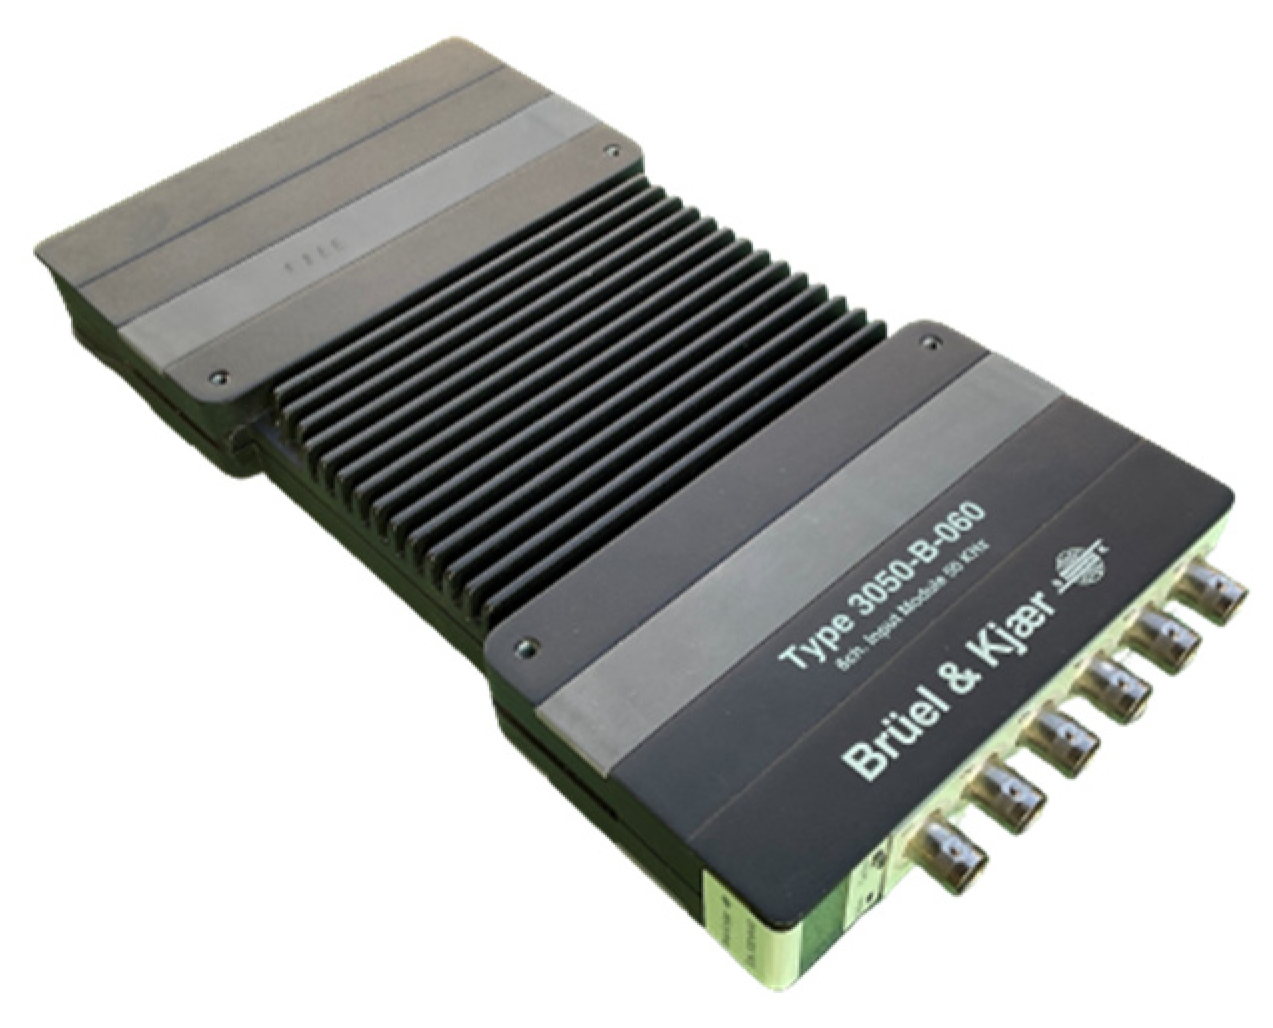
2.4.1. Description of Measurement Equipment
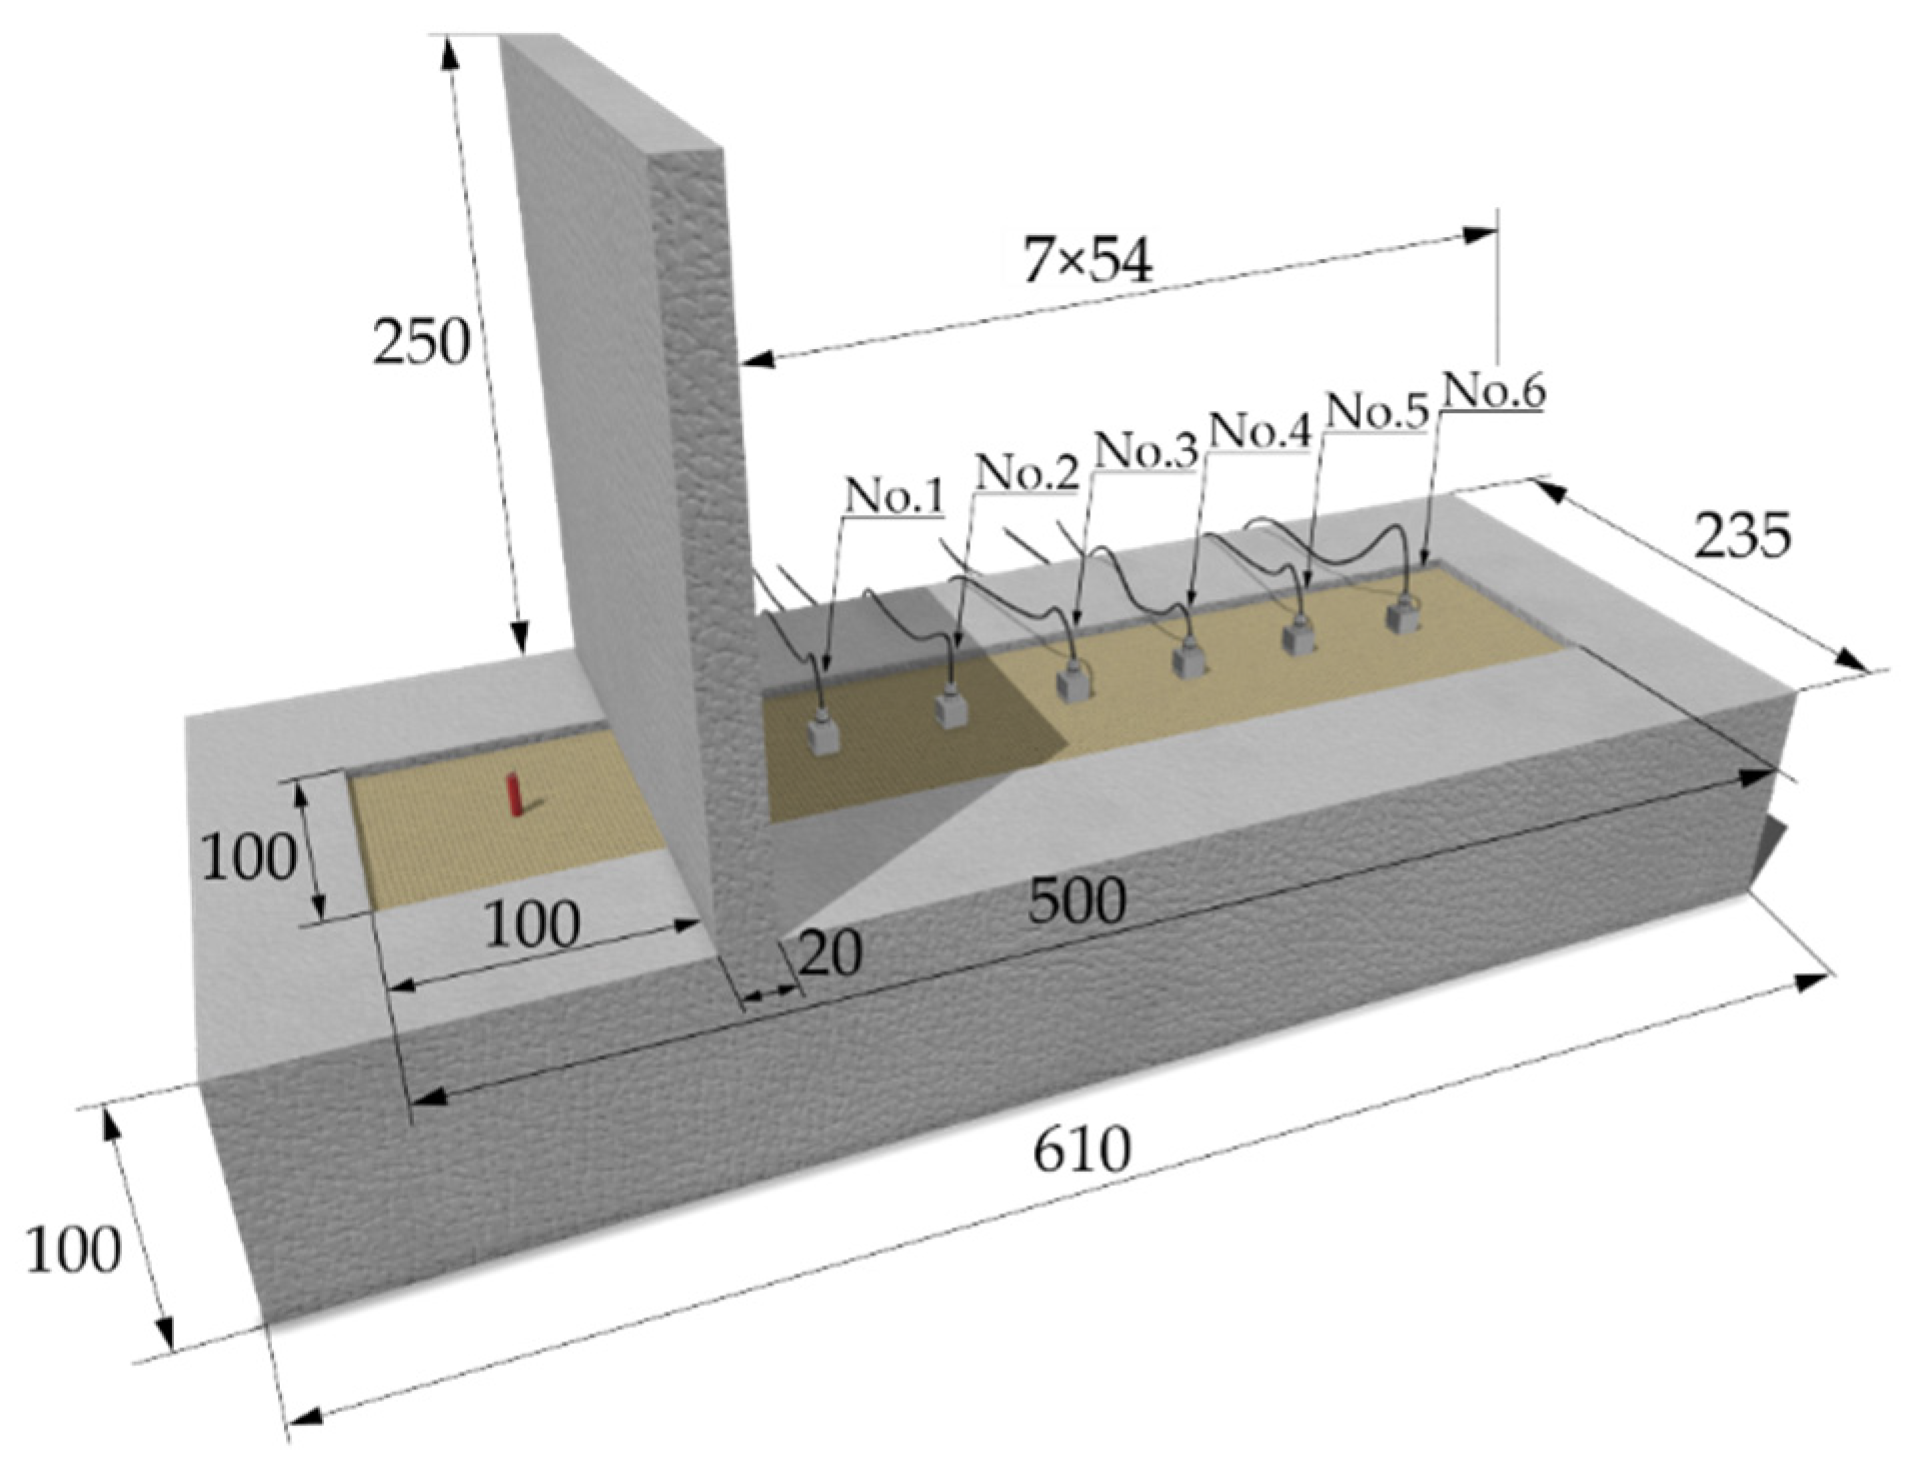
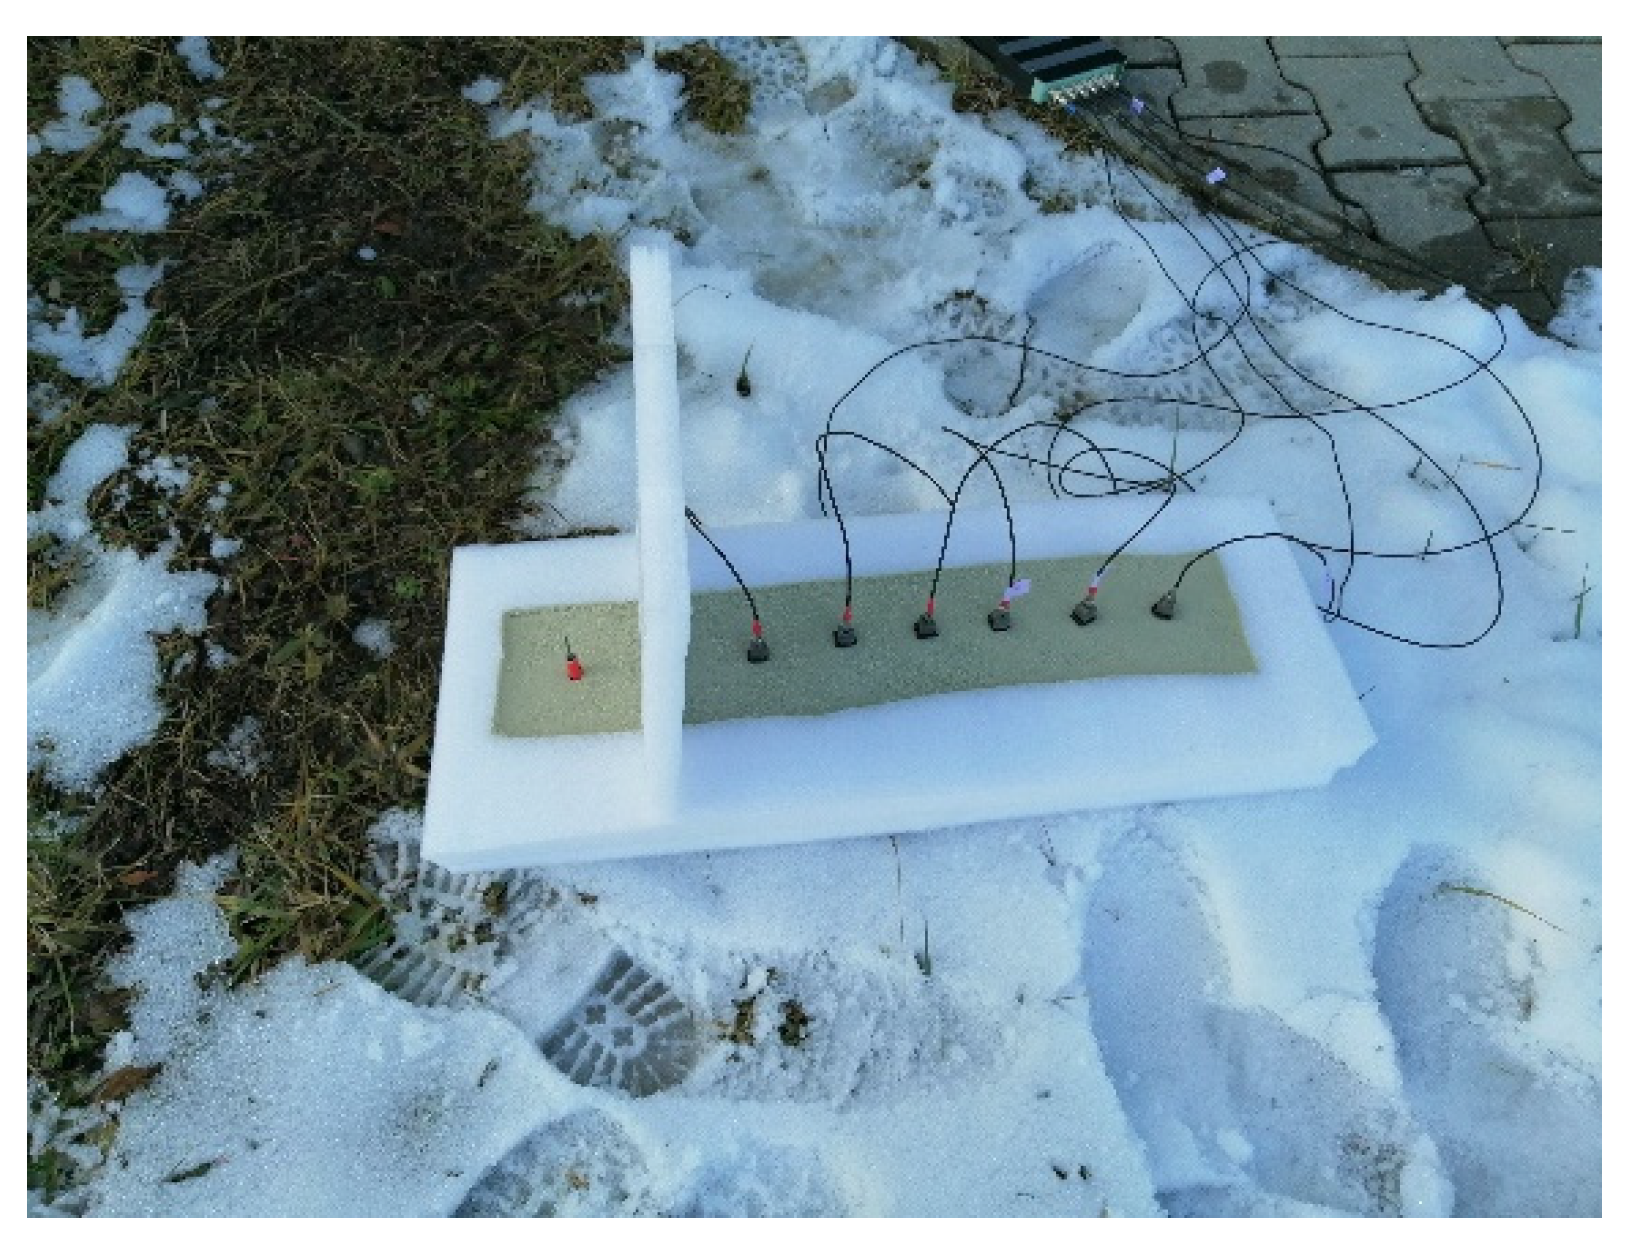
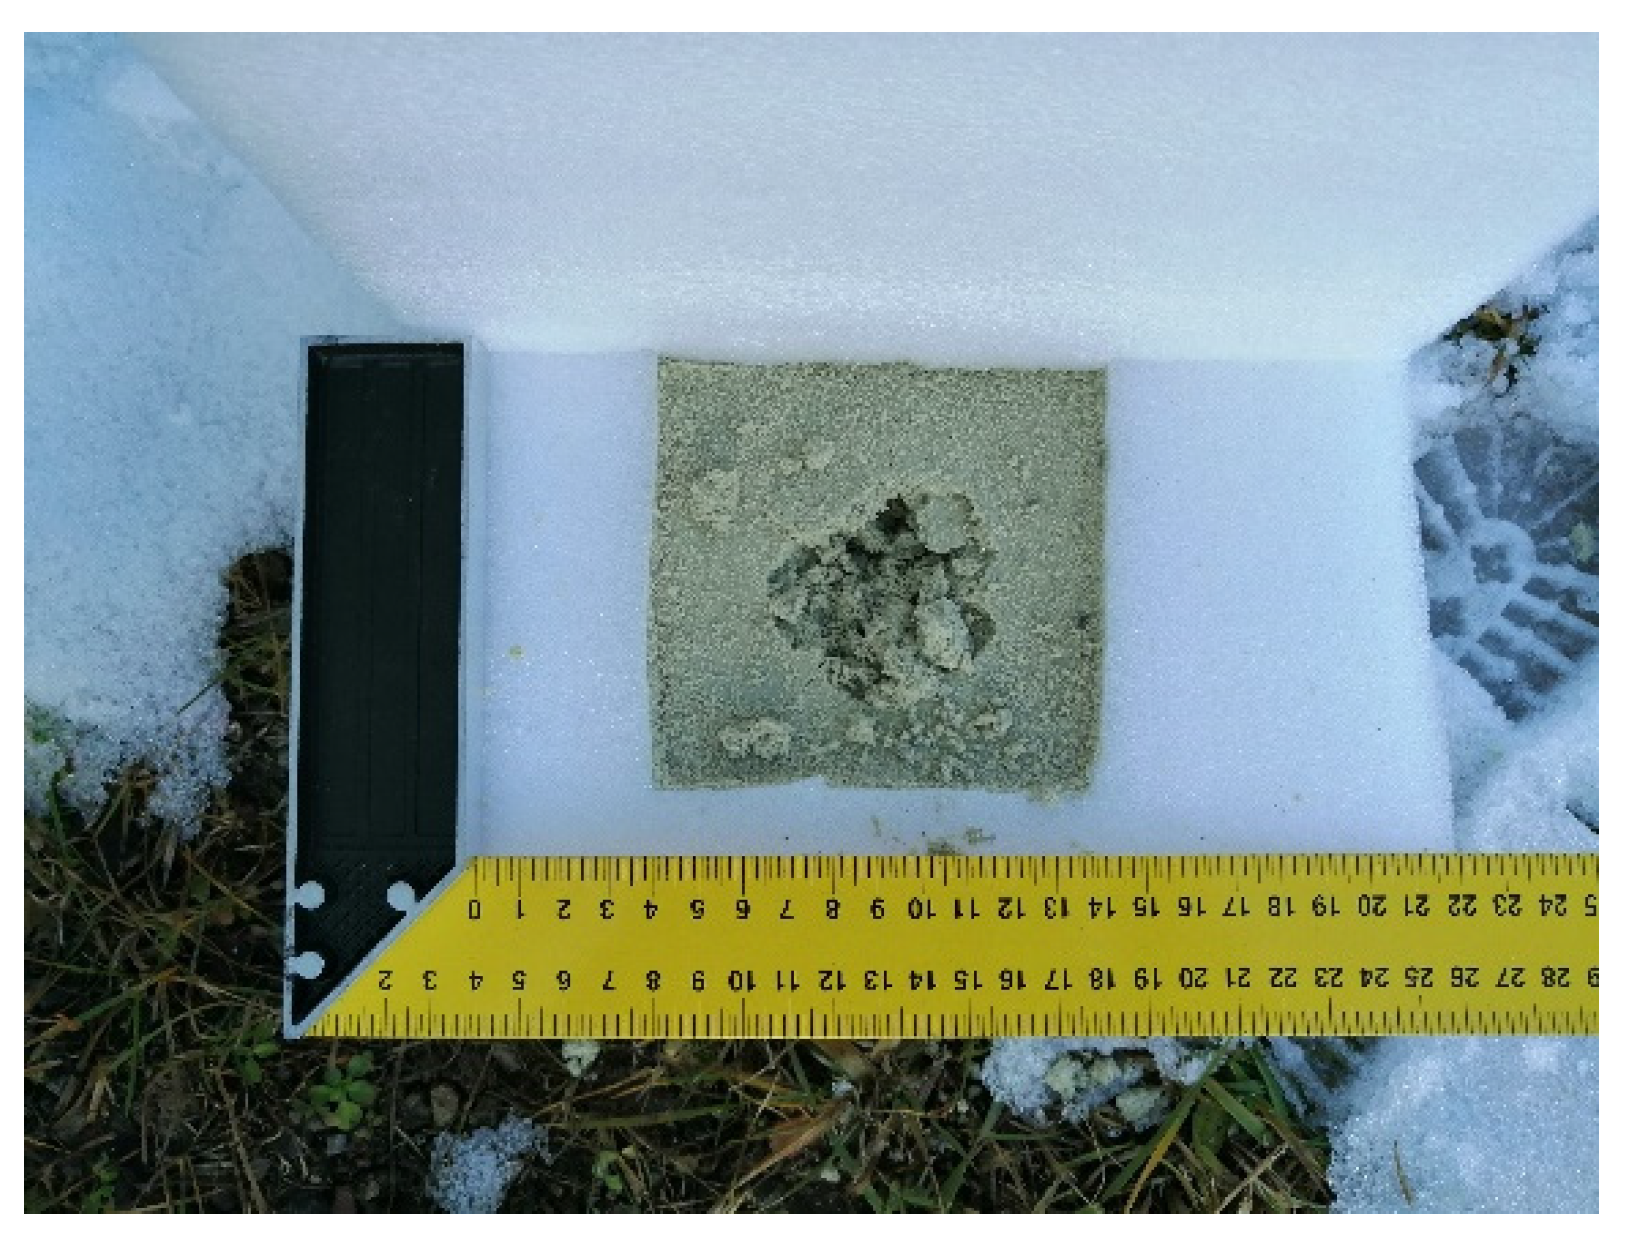
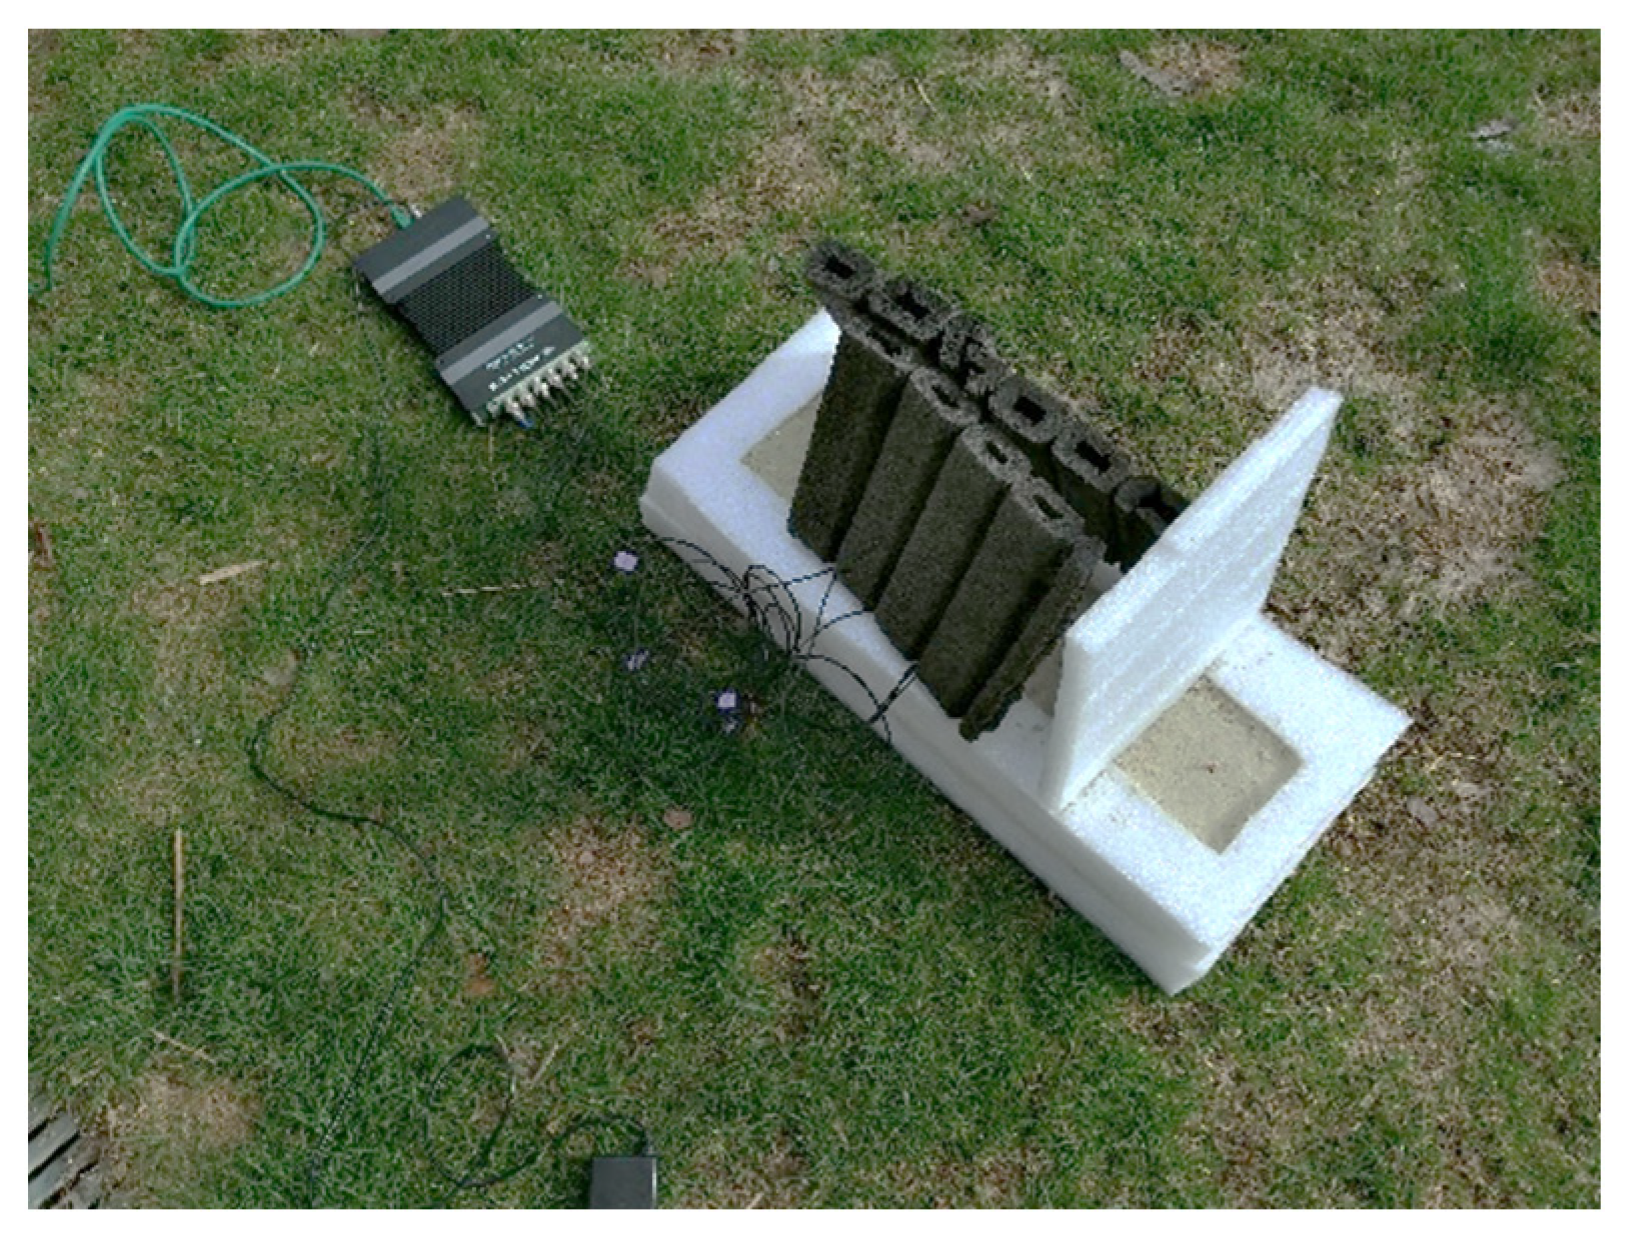
2.4.2. Small-Scale Model
2.4.3. Measurement Methodology
2.4.4. Determination of the Scaling Coefficient
3. Results
4. Discussion
5. Conclusions
Author Contributions
Funding
Informed Consent Statement
Data Availability Statement
Acknowledgments
Conflicts of Interest
References
- Sakurai, A. Blast Wave Theory; Wisconsin Univ-Madison Mathematics Research Center: Madison, WI, USA, 1964; p. 1. [Google Scholar]
- Diaz, J.S.; Rigby, S.E. Blast wave kinematics: Theory, experiments, and applications. Shock Waves 2022, 32, 405–415. [Google Scholar] [CrossRef]
- Sapozhnikov, V.B.; Foufoula-Georgiou, E. Experimental evidence of dynamic scaling and indications of self-organized criticality in braided rivers. Water Resour. Res. 1997, 33, 1983–1991. [Google Scholar] [CrossRef]
- Zhao, X. Fundamental Experimental Studies in Scaling, Blast Mitigation and Material Processing; University of South Carolina: Columbia, SC, USA, 2013. [Google Scholar]
- Taylor, G. The transformation of a blast wave by a very intense explosion. Proc. R. Soc. A 1950, 201, 159–174. [Google Scholar]
- Jack, W.H.; Armendt, B.F., Jr. Measurements of Normally Reflected Shock Parameters from Explosive Charges under Simulated High Altitude Conditions; U.S. Army Materiel Command, Ballistics Research Laboratories, Aberdeen Proving Ground: Maryland, MD, USA, 1965; Report No. 1280. [Google Scholar]
- Vrba, P. Základy Problematiky Výbuchu a Jejich Vlivl na Stavební Konstrukce. Available online: https://concrete.fsv.cvut.cz/phdworkshop/proceedings/2020/pdf/Vrba_Pavel.pdf (accessed on 1 October 2022).
- Fay, S. Characterisation of Blast Loading for Shallow Buried Explosives. Ph.D. Thesis, University of Sheffield, Sheffield, UK, 3 September 2020. [Google Scholar]
- Janíček, M.; Drahovzal, P. Pyrotechnik v Boji Proti Terorismu, 1st ed.; Deus: Praha, Česká Republika, 2001. [Google Scholar]
- University of Toronto. Available online: https://www.atmosp.physics.utoronto.ca/people/codoban/PHY138/Mechanics/dimensional.pdf (accessed on 1 October 2022).
- Atomicarchive.com. Available online: https://www.atomicarchive.com/science/effects/thermal-radiation.html (accessed on 1 October 2022).
- ScienceNewsExplores. Available online: https://www.snexplores.org/article/explainer-seismic-waves-come-different-flavors (accessed on 1 October 2022).
- Field, S.Q. Boom!: The Chemistry and History of Explosives; Chicago Review Press: Chicago, IL, USA, 2017. [Google Scholar]
- Český Úřad pro Zkoušení Zbraní a Střeliva. Available online: https://www.cuzzs.cz/cs/akreditovana-certifikace-pyrotechniky/ (accessed on 1 October 2022).
- Durham Instruments. Available online: https://disensors.com/product/bk-type-4508-b-002-piezoelectric-ccld-accelerometer-teds-1000-mv-g-1-slot-top-connector-excl-cable/ (accessed on 1 October 2022).
- SPECMAN. Available online: http://www.specman.pt/assets/lan-xi2.pdf (accessed on 1 October 2022).
- Metra Mess- und Frequenztechnik in Radebeul, e.K. Available online: https://www.mmf.de/manual/vc21mane.pdf (accessed on 1 October 2022).
- SIGVIEW. Available online: https://sigview.com/ (accessed on 1 October 2022).
- STEM MAYHEM. Available online: https://www.stemmayhem.com/how-does-kinetic-sand-work/ (accessed on 1 October 2022).
- Courtney, C.E. Mechanical Behavior of Materials, 2nd ed.; Waveland Press, Inc.: Long Grove, IL, USA, 2005. [Google Scholar]
- IOPscience. Available online: https://iopscience.iop.org/article/10.1088/0960-1317/24/3/035017/pdf (accessed on 1 October 2022).
- Zyskowski, A.; Sochet, I.; Mavrot, G.; Bailly, P.; Renard, J. Study of the explosion process in a small scale experiment—Structural loading. J. Loss Prev. Process Ind. 2004, 17, 291–299. [Google Scholar] [CrossRef]
- Zhao, C.; Wang, Q.; Lu, X.; Huang, X.; Mo, Y.L. Blast resistance of small-scale RCS in experimental test and numerical analysis. Eng. Struct. 2019, 199, 109610. [Google Scholar] [CrossRef]
- Hassan, Z.A.; Ibrahim, A.; Nor, N.M. Feasibility of a small-scale test apparatus in measuring blast intensity of shallow buried charge detonation in in-situ soil. Sci. Technol. Energetic Mater. 2019, 80, 229–236. [Google Scholar]
- Sadot, O.; Ram, O.; Nof, E.; Kochavi, E.; Ben-Dor, G. Small-scale blast wave experiments by means of an exploding wire. In Blast Effects; Springer: Cham, Germany, 2018; pp. 141–170. [Google Scholar]
- Scalise, M.; Pitarka, A.; Louie, J.N.; Smith, K.D. Effect of random 3D correlated velocity perturbations on numerical modeling of ground motion from the Source Physics Experiment. Bull. Seismol. Soc. Am. 2021, 111, 139–156. [Google Scholar] [CrossRef]
- Zhuang, X.; Zong, Z.; Huang, Y.; Wang, P. Analysis of the Installation Effect on the Axial Performance of Pressure-Grouted Helical Piles in Clay by Small-Scale Model Tests. Buildings 2022, 12, 992. [Google Scholar] [CrossRef]
- Nujaim, M.; Belem, T.; Giraud, A. Experimental Tests on a Small-Scale Model of a Mine Stope to Study the Behavior of Waste Rock Barricades during Backfilling. Minerals 2020, 10, 941. [Google Scholar] [CrossRef]
- Caçoilo, A.; Mourão, R.; Belkassem, B.; Teixeira-Dias, F.; Vantomme, J.; Lecompte, D. Blast wave assessment in a compound survival container: Small-scale testing. Multidiscip. Digit. Publ. Inst. Proc. 2018, 2, 540. [Google Scholar]
- Papán, D.; Valašková, V.; Drusa, M. Numerical and experimental case study of blasting works effect. In IOP Conference Series: Earth and Environmental Science; IOP Publishing: Bristol, UK, 2016; Volume 44, p. 052052. [Google Scholar]
- Ainalis, D.; Kaufmann, O.; Tshibangu, J.P.; Verlinden, O.; Kouroussis, G. Modelling the source of blasting for the numerical simulation of blast-induced ground vibrations: A review. Rock Mech. Rock Eng. 2017, 50, 171–193. [Google Scholar] [CrossRef]
- Trajkovski, J.; Kunc, R.; Perenda, J.; Prebil, I. Minimum mesh design criteria for blast wave development and structural response-MMALE method. Lat. Am. J. Solids Struct. 2014, 11, 1999–2017. [Google Scholar] [CrossRef]
- Trajkovski, J.; Perenda, J.; Kunc, R. Blast response of Light Armoured Vehicles (LAVs) with flat and V-hull floor. Thin-Walled Struct. 2018, 131, 238–244. [Google Scholar] [CrossRef]
- Trajkovski, J.; Kunc, R.; Prebil, I. Blast response of centrally and eccentrically loaded flat-, U-, and V-shaped armored plates: Comparative study. Shock Waves 2017, 27, 583–591. [Google Scholar] [CrossRef]


| Frequency | Amplitude 1 m·s−2 | Amplitude 2 m·s−2 |
|---|---|---|
| 15.92 Hz | 1.1813 | 2.3387 |
| 40 Hz | 1.4208 | 2.7480 |
| 80 Hz | 1.4085 | 2.7809 |
| 0 Hz | 1.3988 | 2.7759 |
| 320 Hz | 1.3897 | 2.7599 |
| 640 Hz | 1.4201 | 2.7716 |
| 1280 Hz | 1.4053 | 2.7592 |
| Frequency | Amplitude 1 m·s−2 | Amplitude 2 m·s−2 |
|---|---|---|
| 15.92 Hz | 32.631 | 62.751 |
| 40 Hz | 32.736 | 63.163 |
| 80 Hz | 31.959 | 62.595 |
| 160 Hz | 30.902 | 62.066 |
| 320 Hz | 30.832 | 62.511 |
| 640 Hz | 31.238 | 63.855 |
| 1280 Hz | 31.424 | 62.525 |
| Frequency | Ratio CSV/WAV 1 m·s–2 | Ratio CSV/WAV 2 m·s–2 |
|---|---|---|
| 15.92 Hz | 3.62018 × 10⁻⁵ | 3.72695 × 10⁻⁵ |
| 40 Hz | 4.34018 × 10⁻⁵ | 4.35065 × 10⁻⁵ |
| 80 Hz | 4.40721 × 10⁻⁵ | 4.44269 × 10⁻⁵ |
| 160 Hz | 4.52657 × 10⁻⁵ | 4.47250 × 10⁻⁵ |
| 320 Hz | 4.50733 × 10⁻⁵ | 4.41506 × 10⁻⁵ |
| 640 Hz | 4.54607 × 10⁻⁵ | 4.34046 × 10⁻⁵ |
| 1280 Hz | 4.47206 × 10⁻⁵ | 4.41295 × 10⁻⁵ |
| Average: | 4.34566 × 10⁻⁵ | 4.30875 × 10⁻⁵ |
| Final coefficient: | 4.3272 × 10⁻⁵ | |
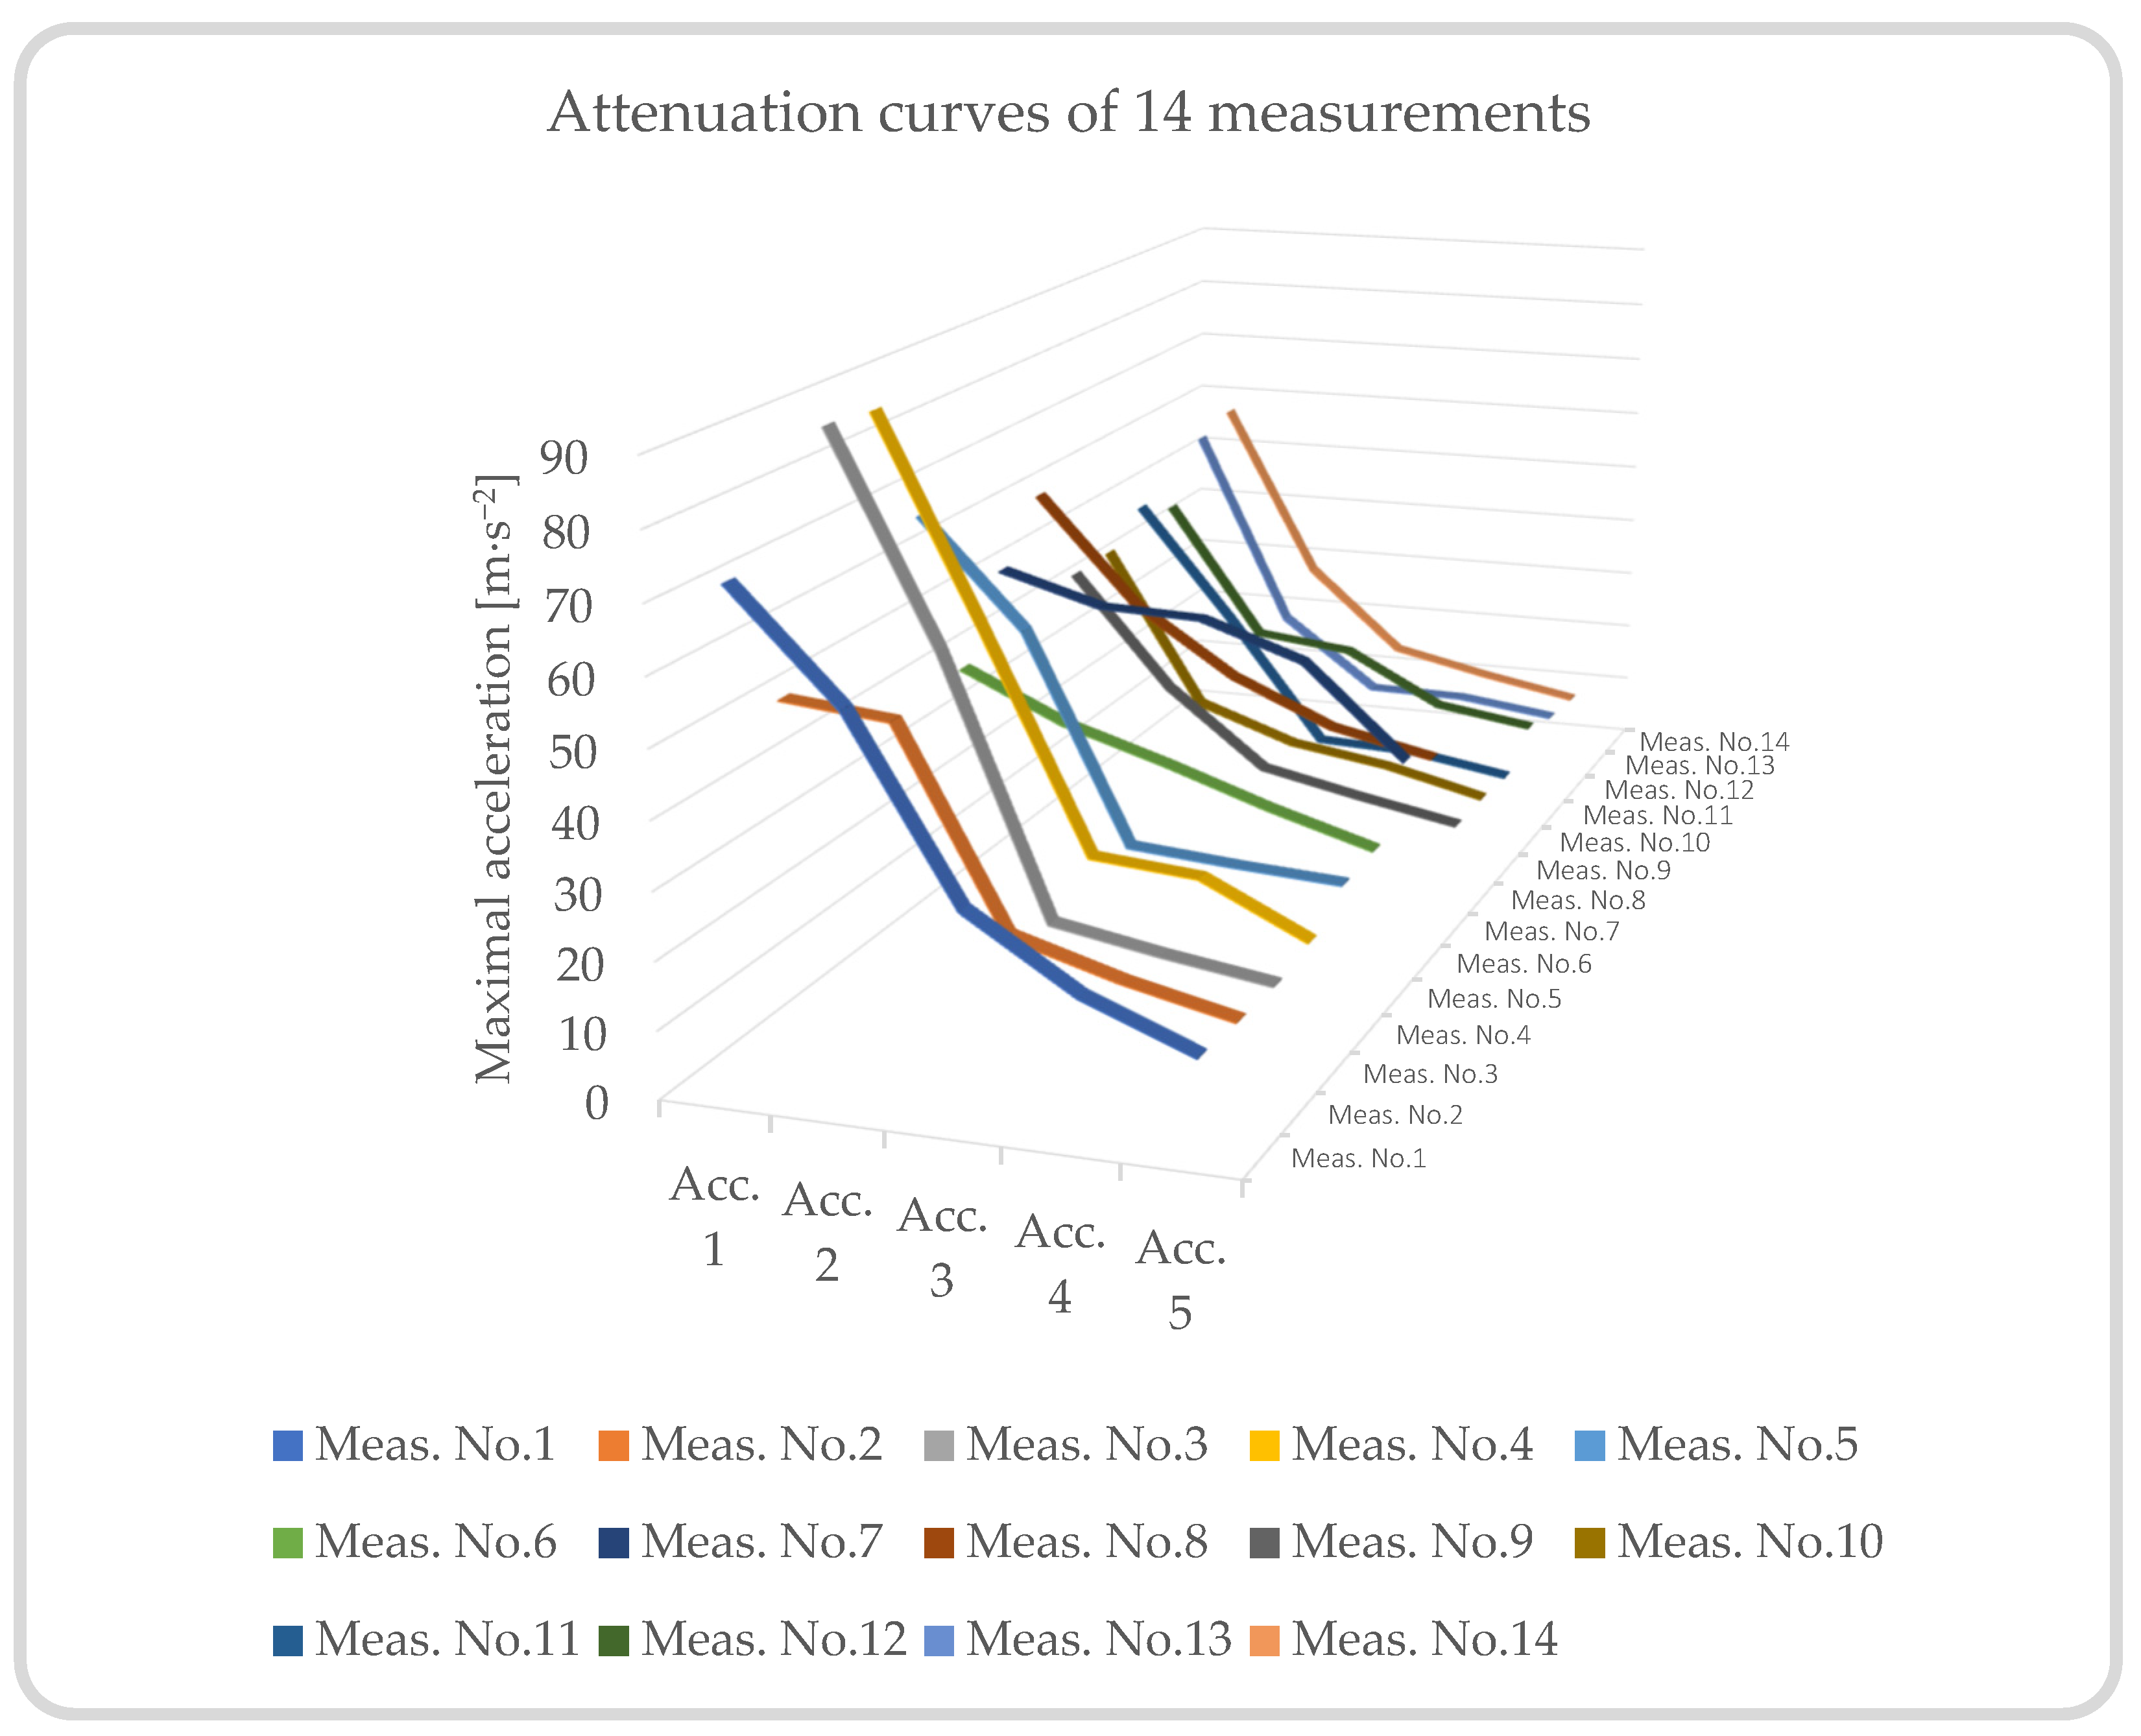
| Maximum Amplitude | |||||
|---|---|---|---|---|---|
| Accelerometer 1 | Accelerometer 2 | Accelerometer 3 | Accelerometer 4 | Accelerometer 5 | |
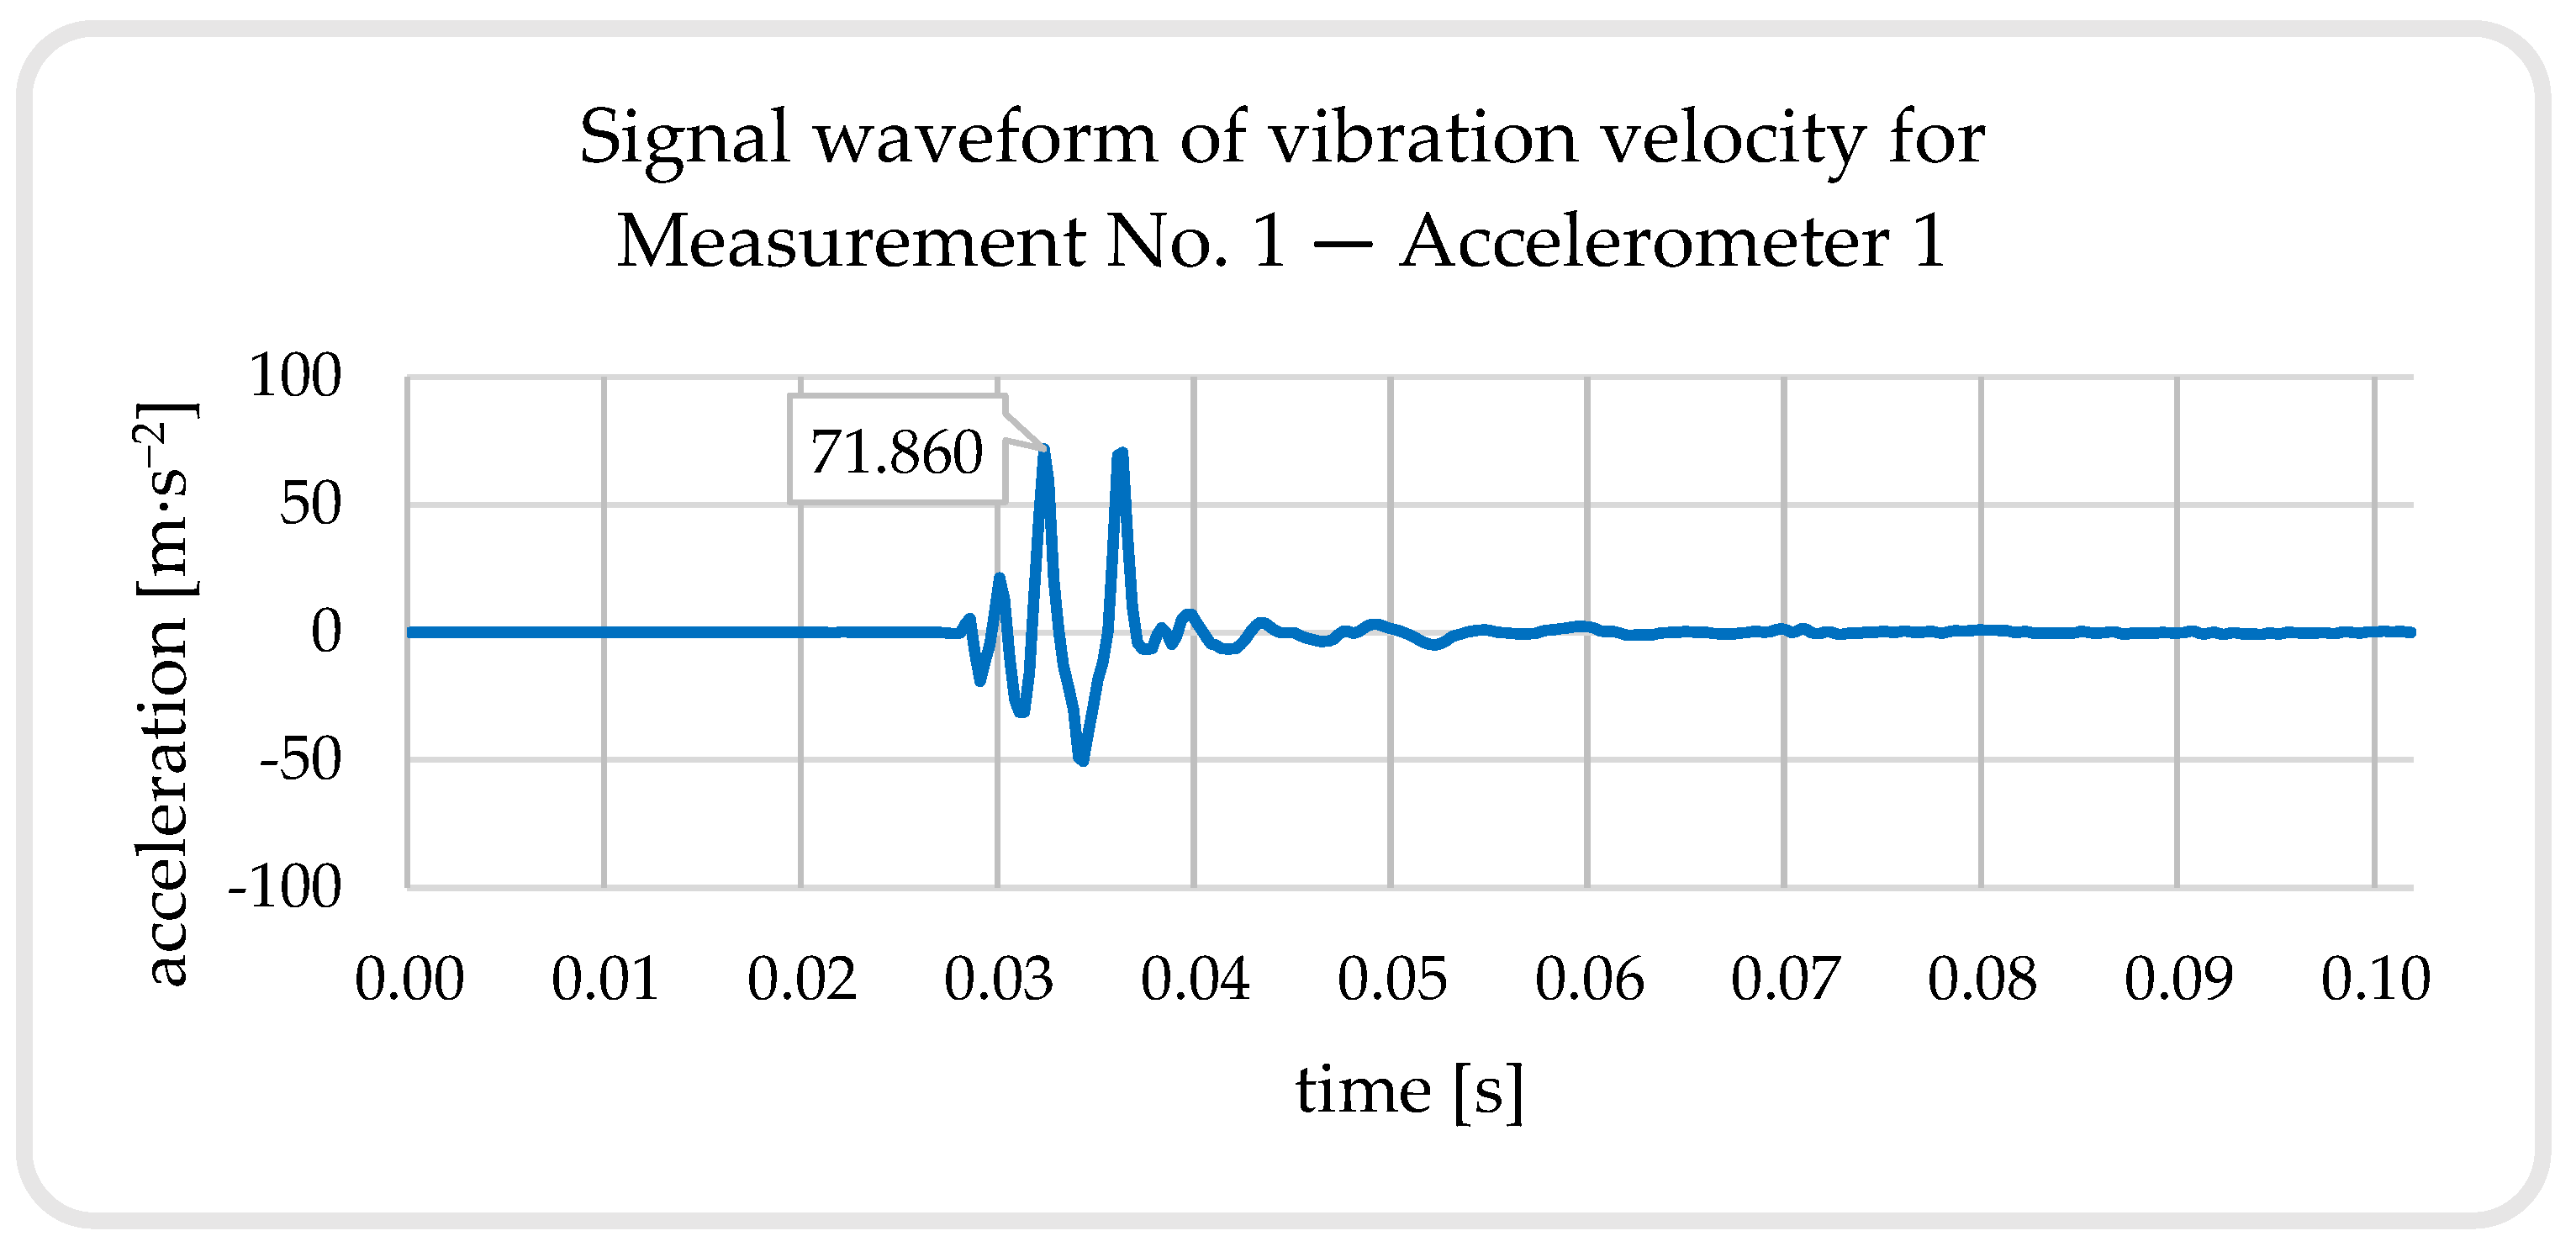
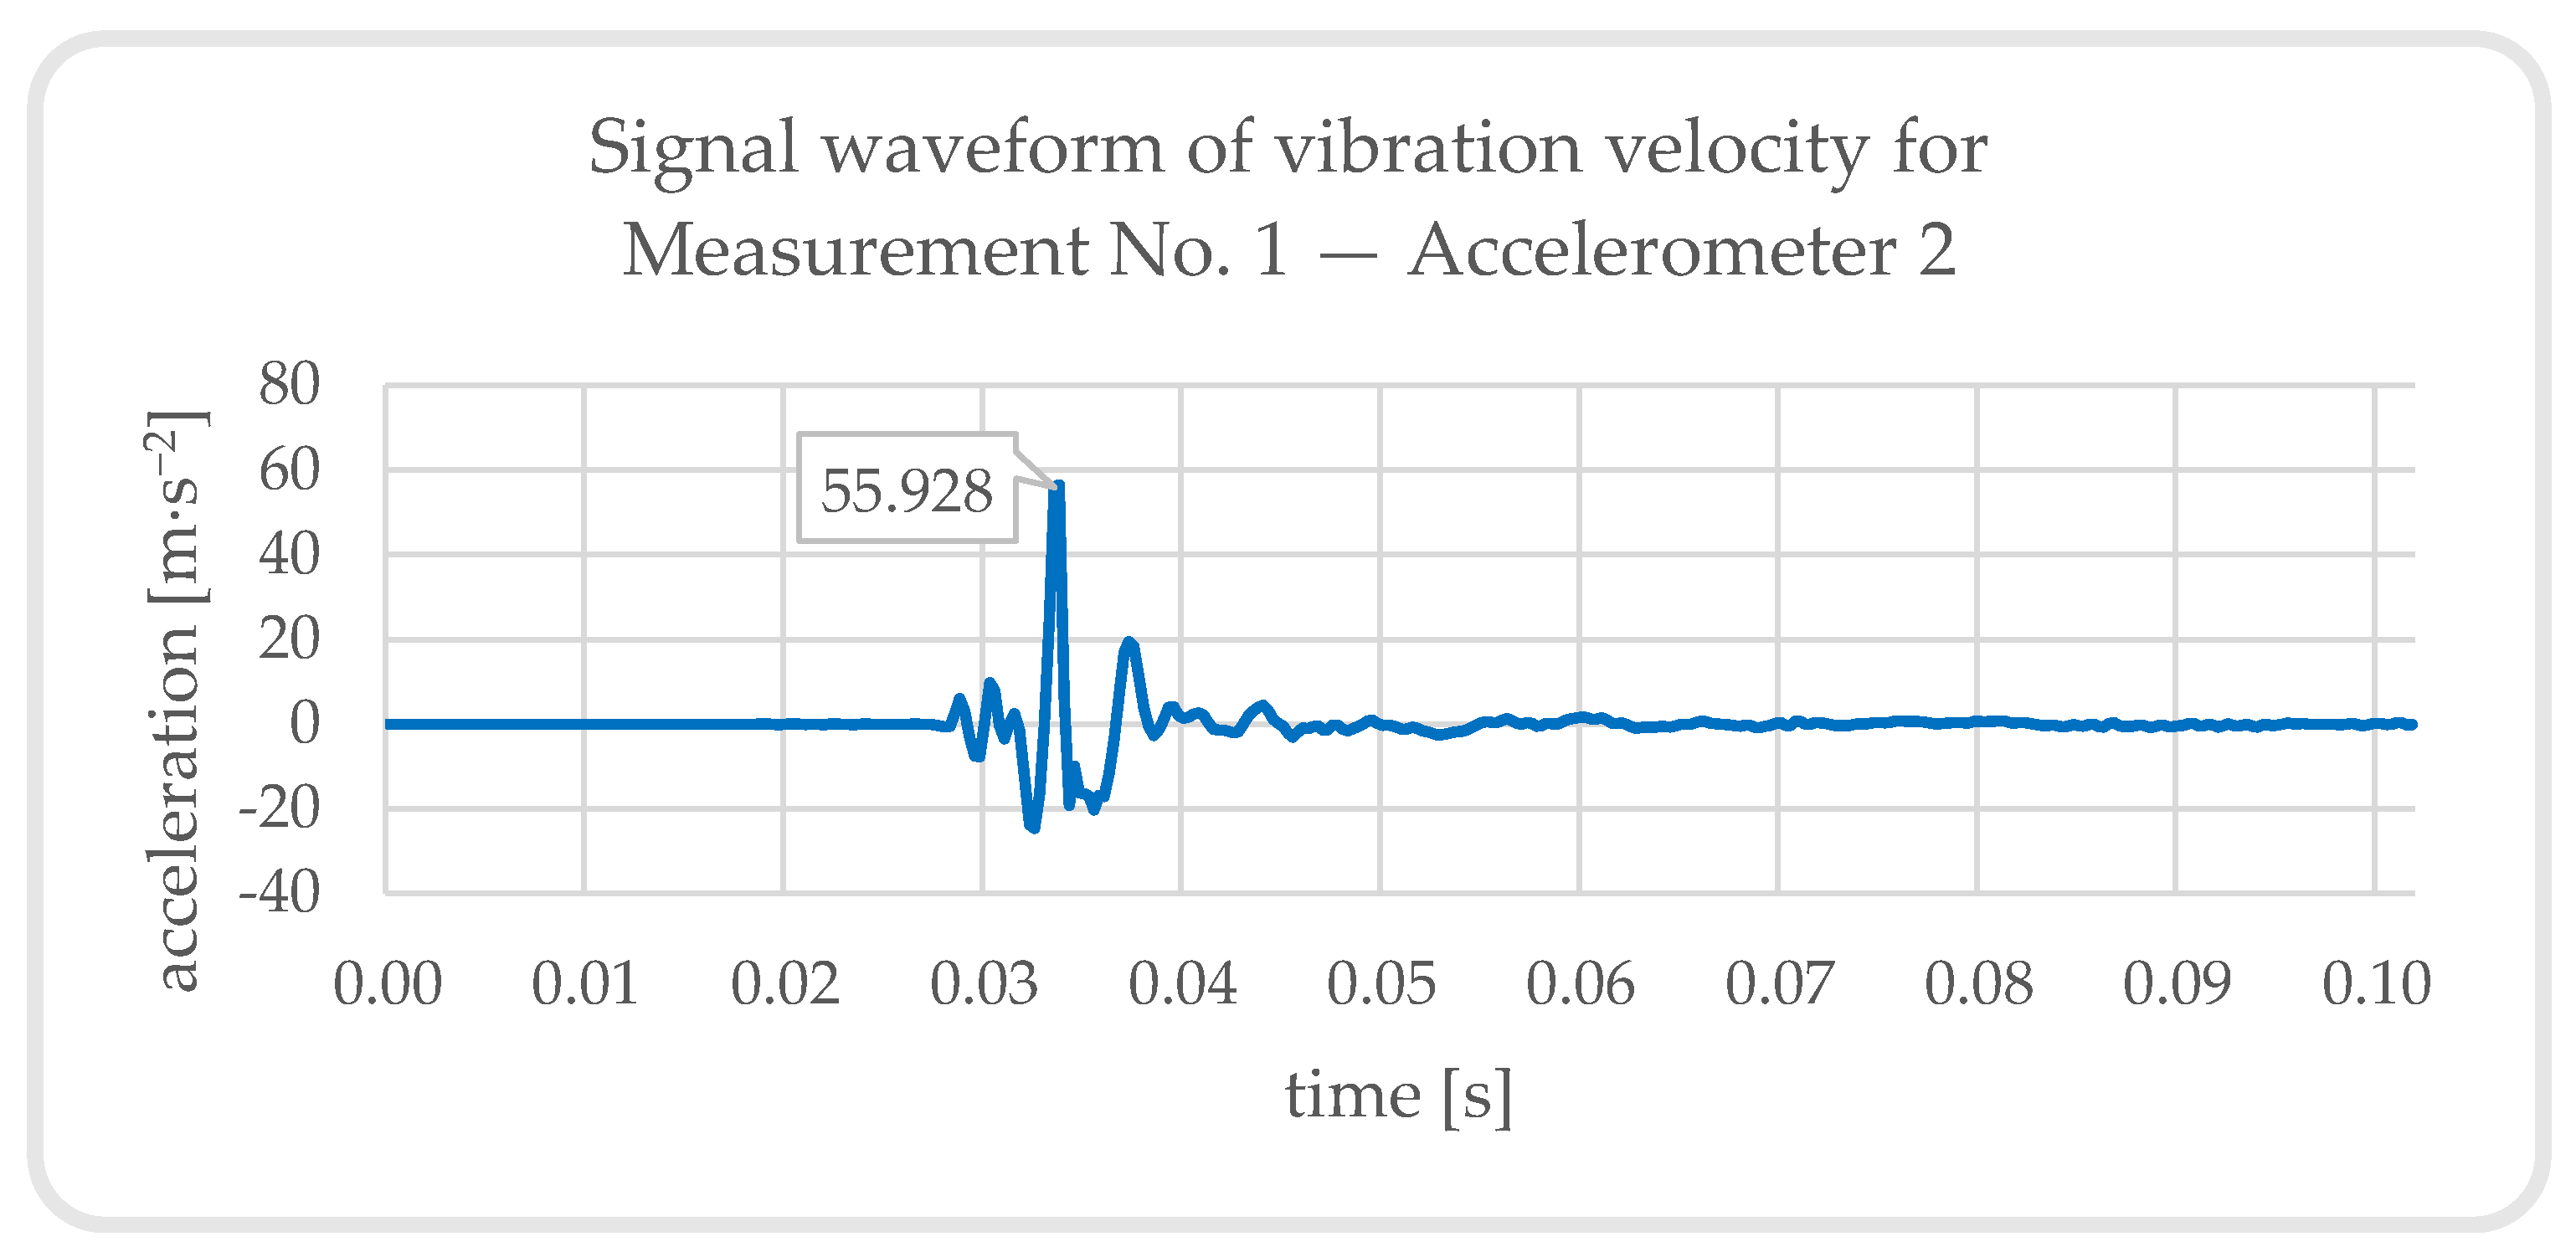
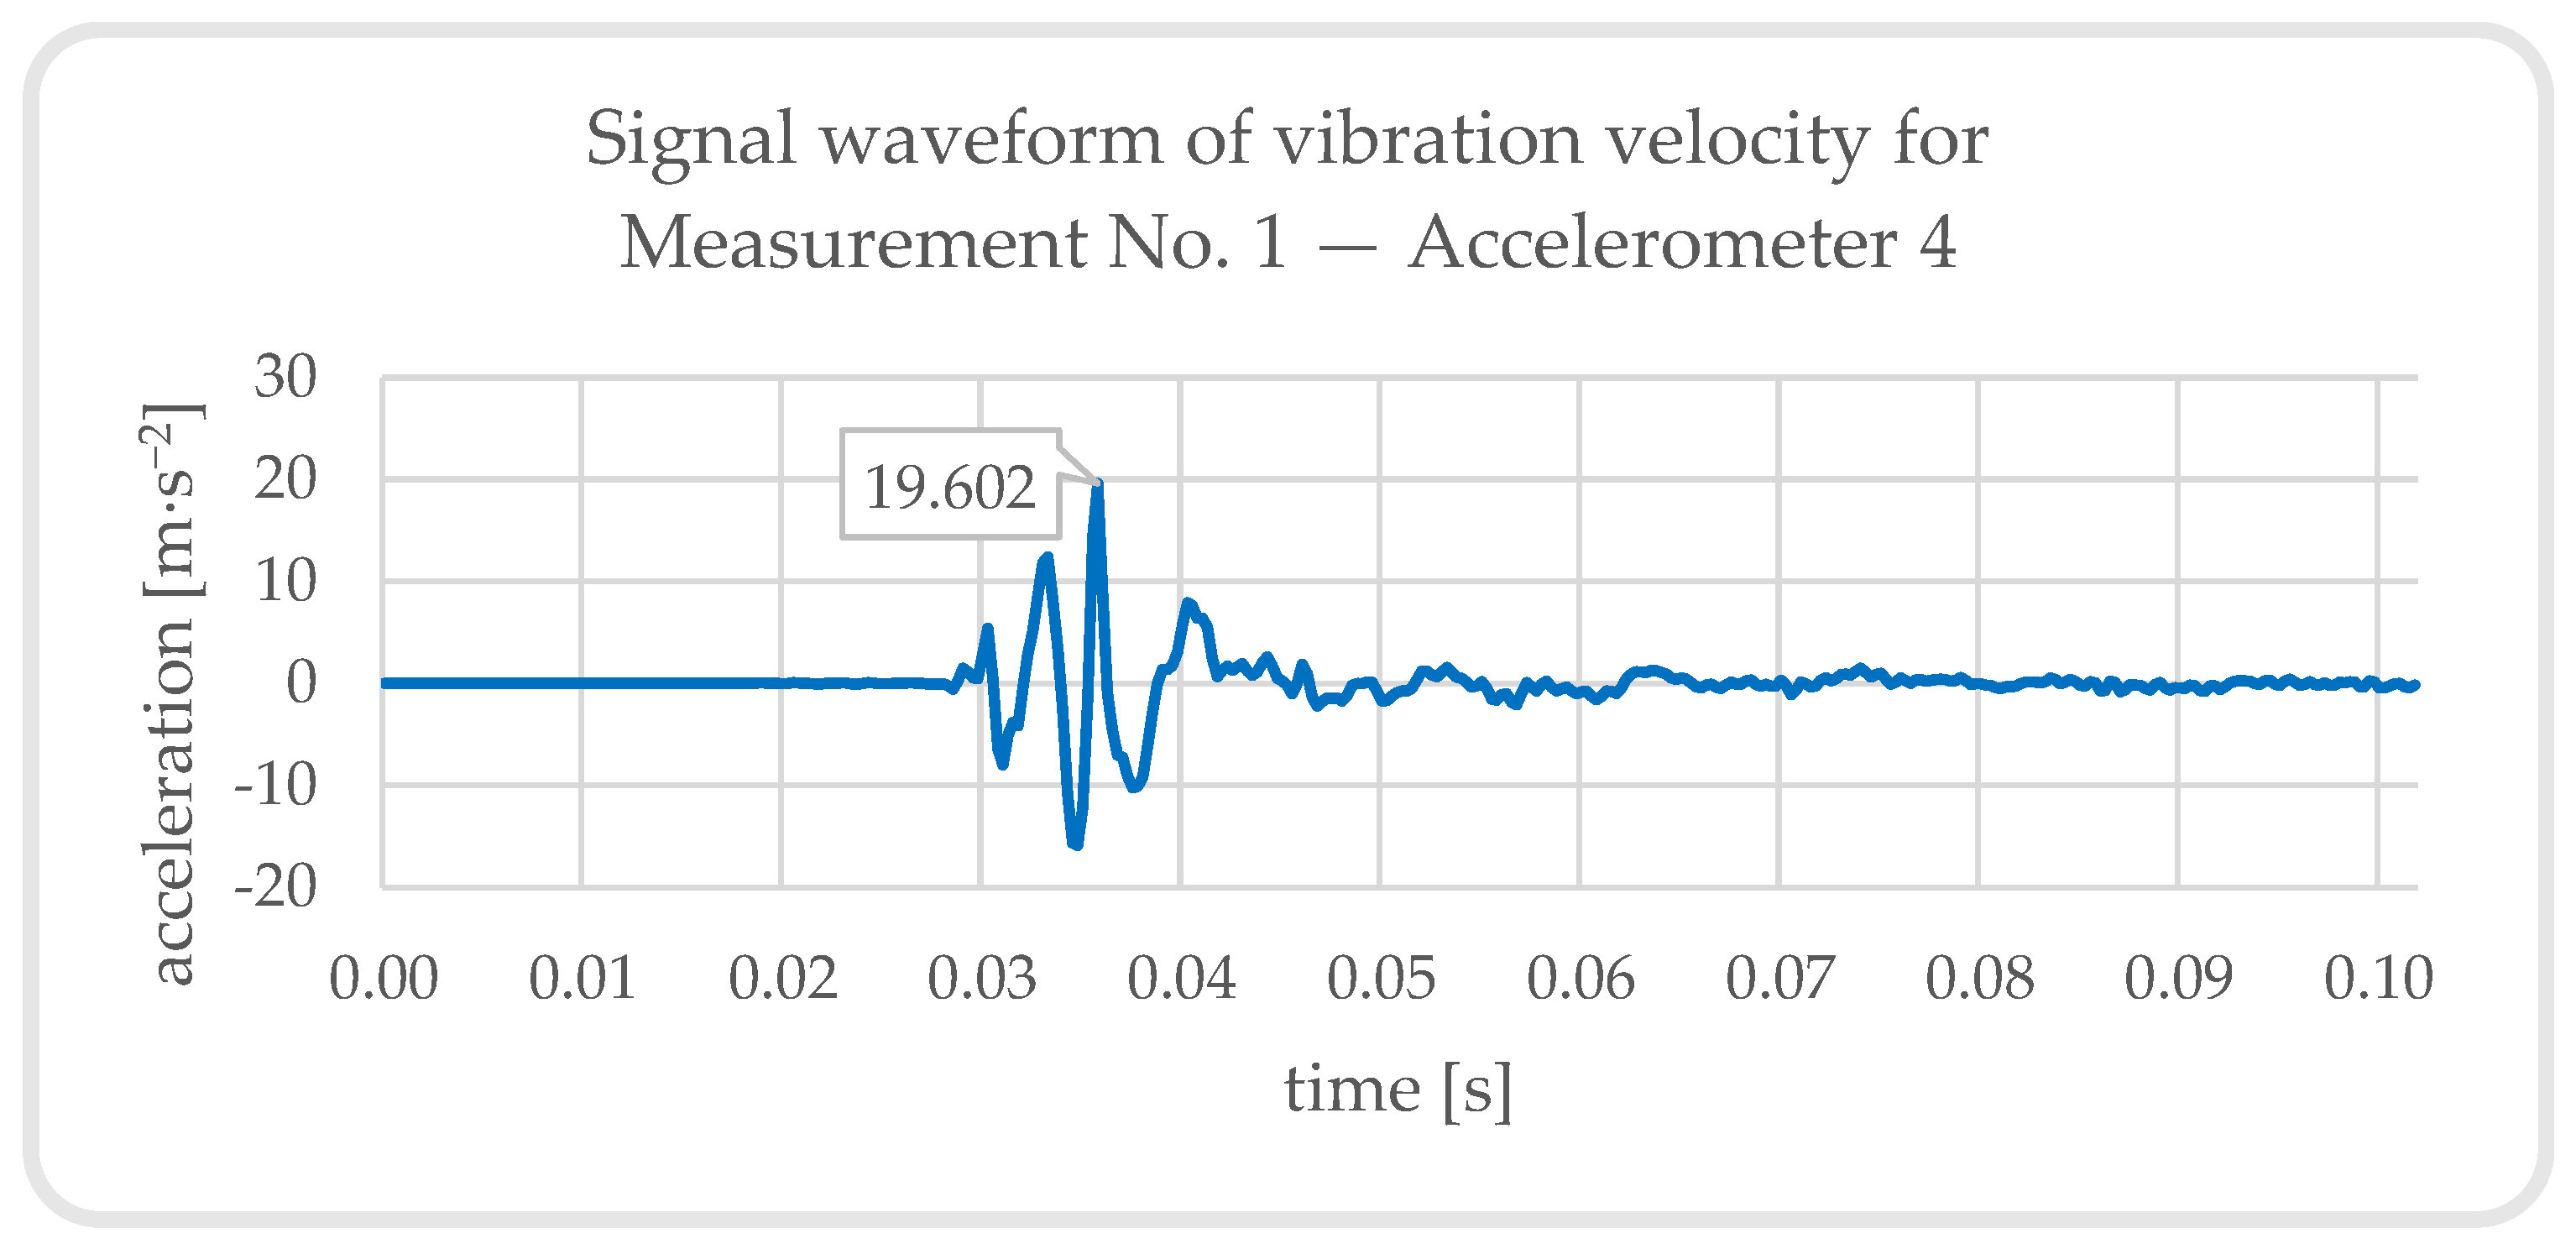
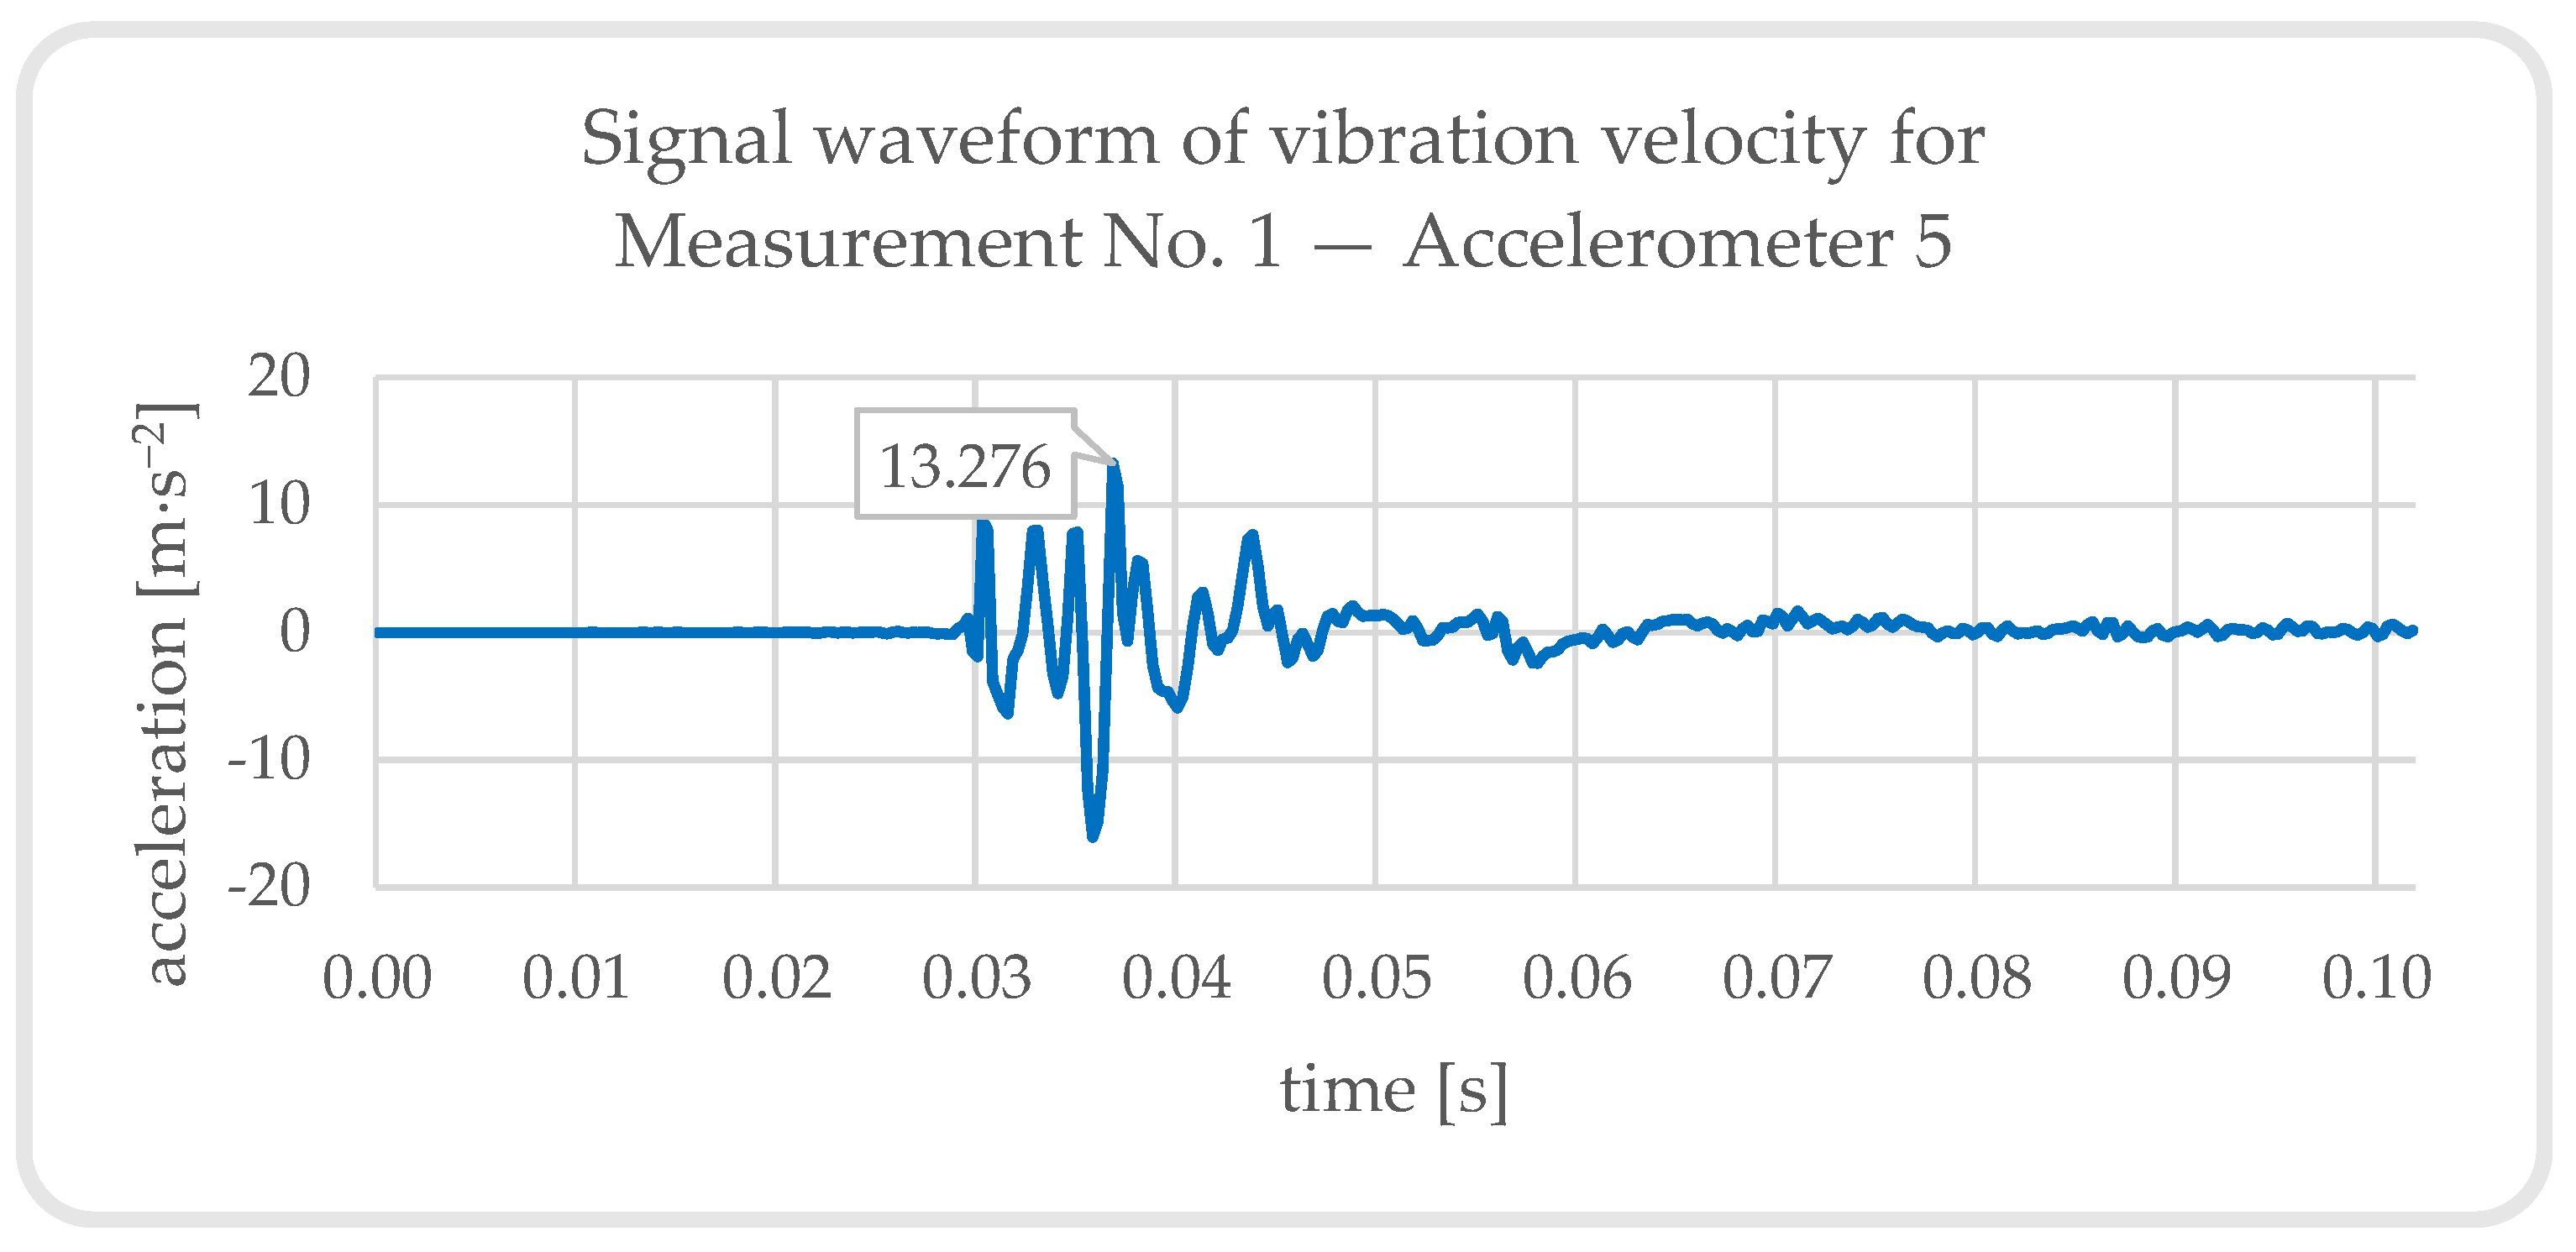
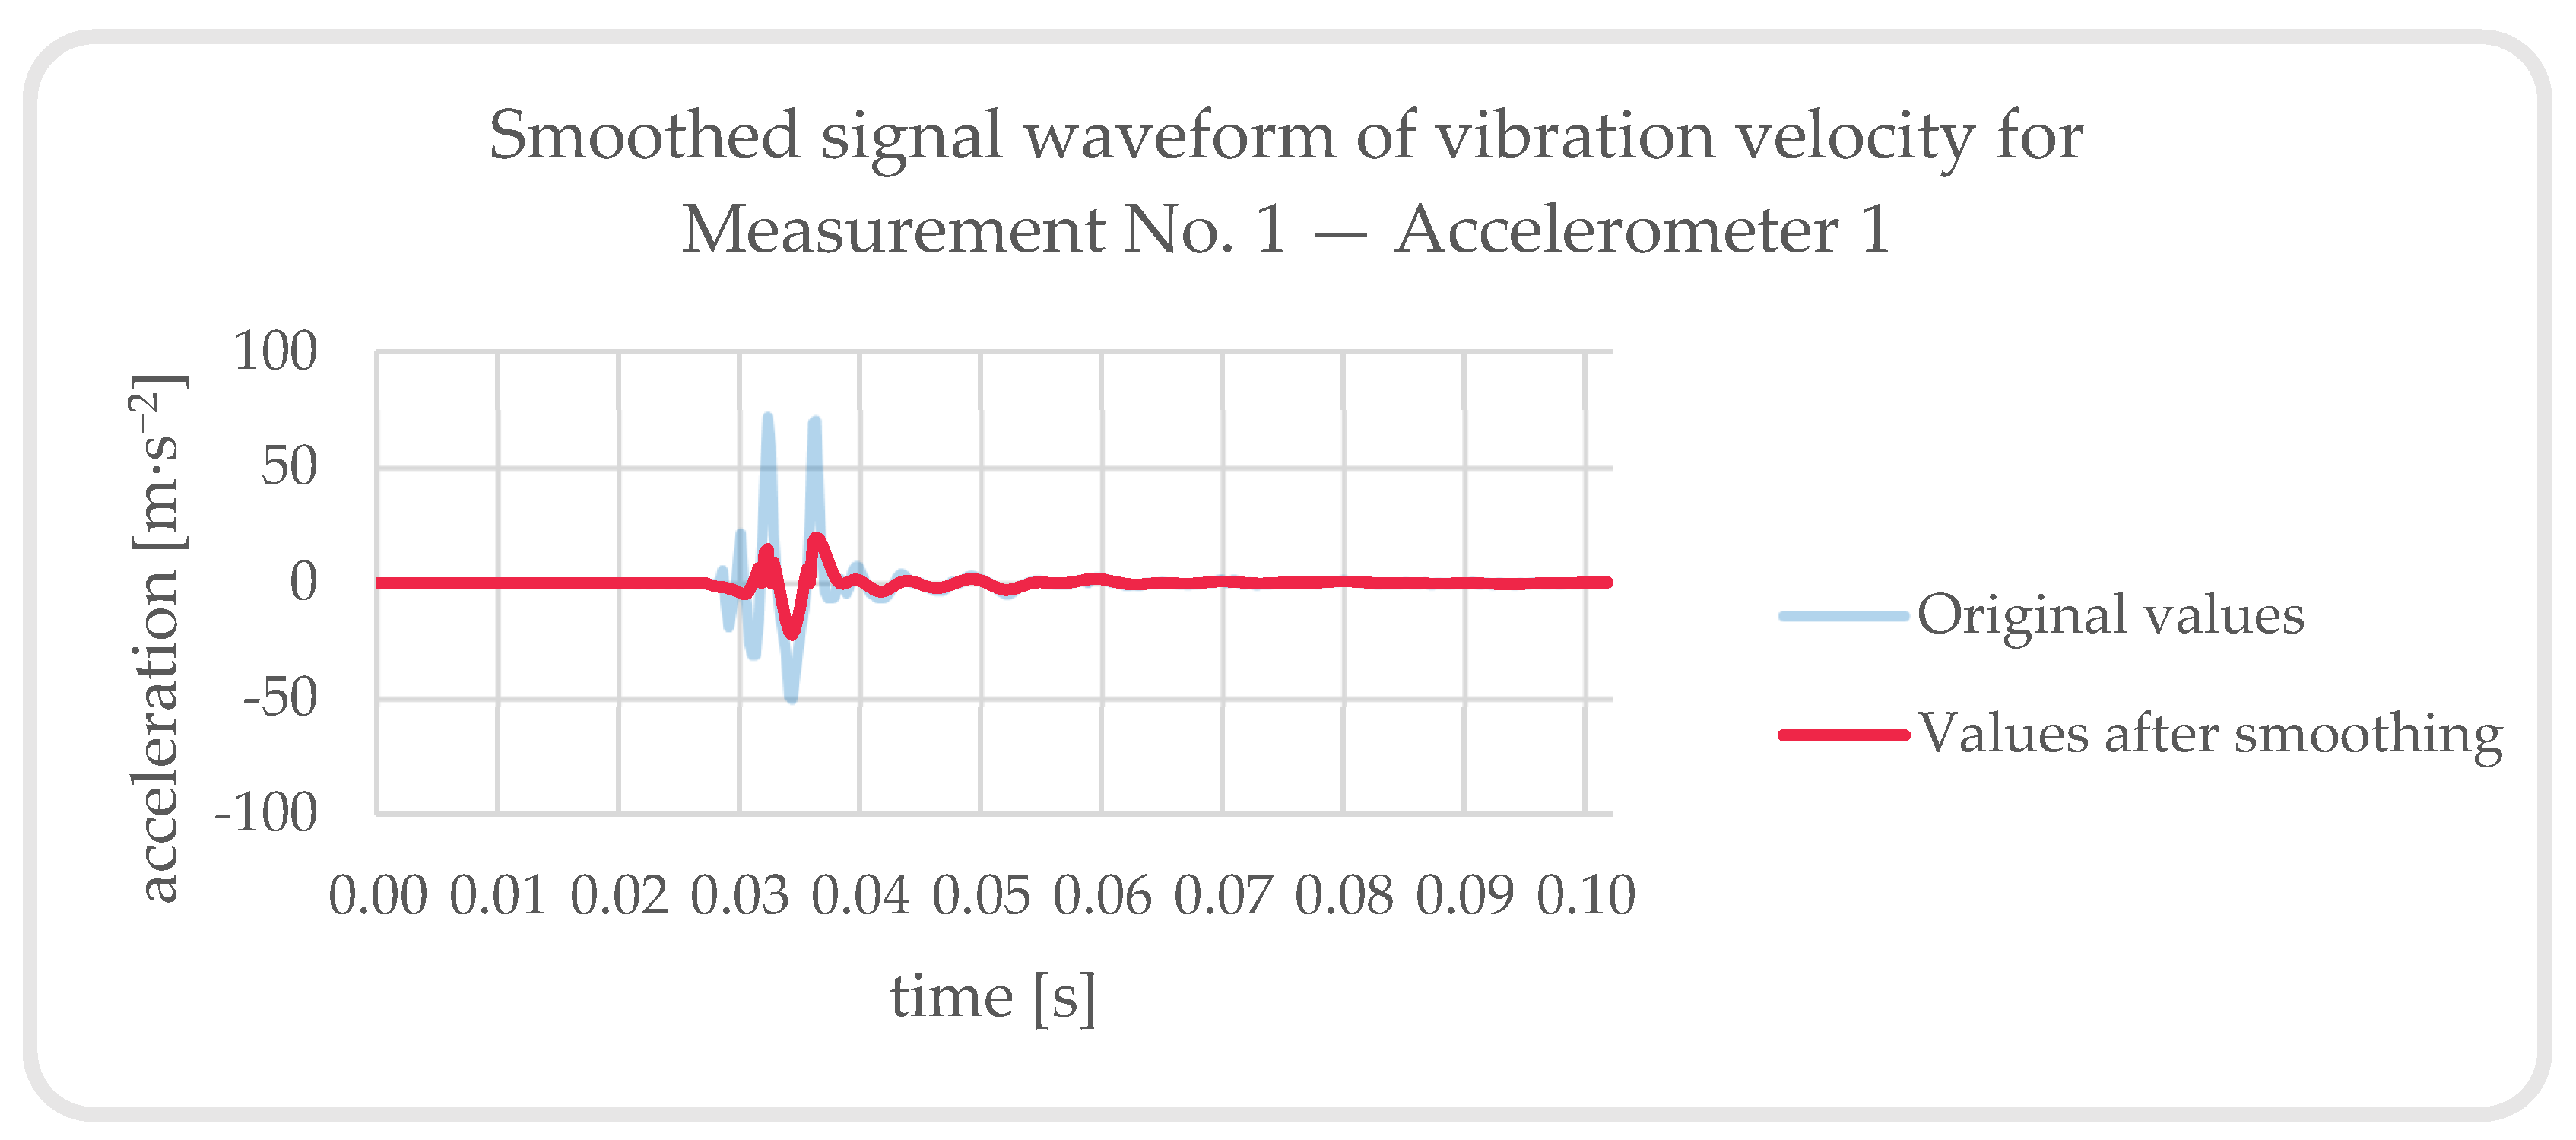
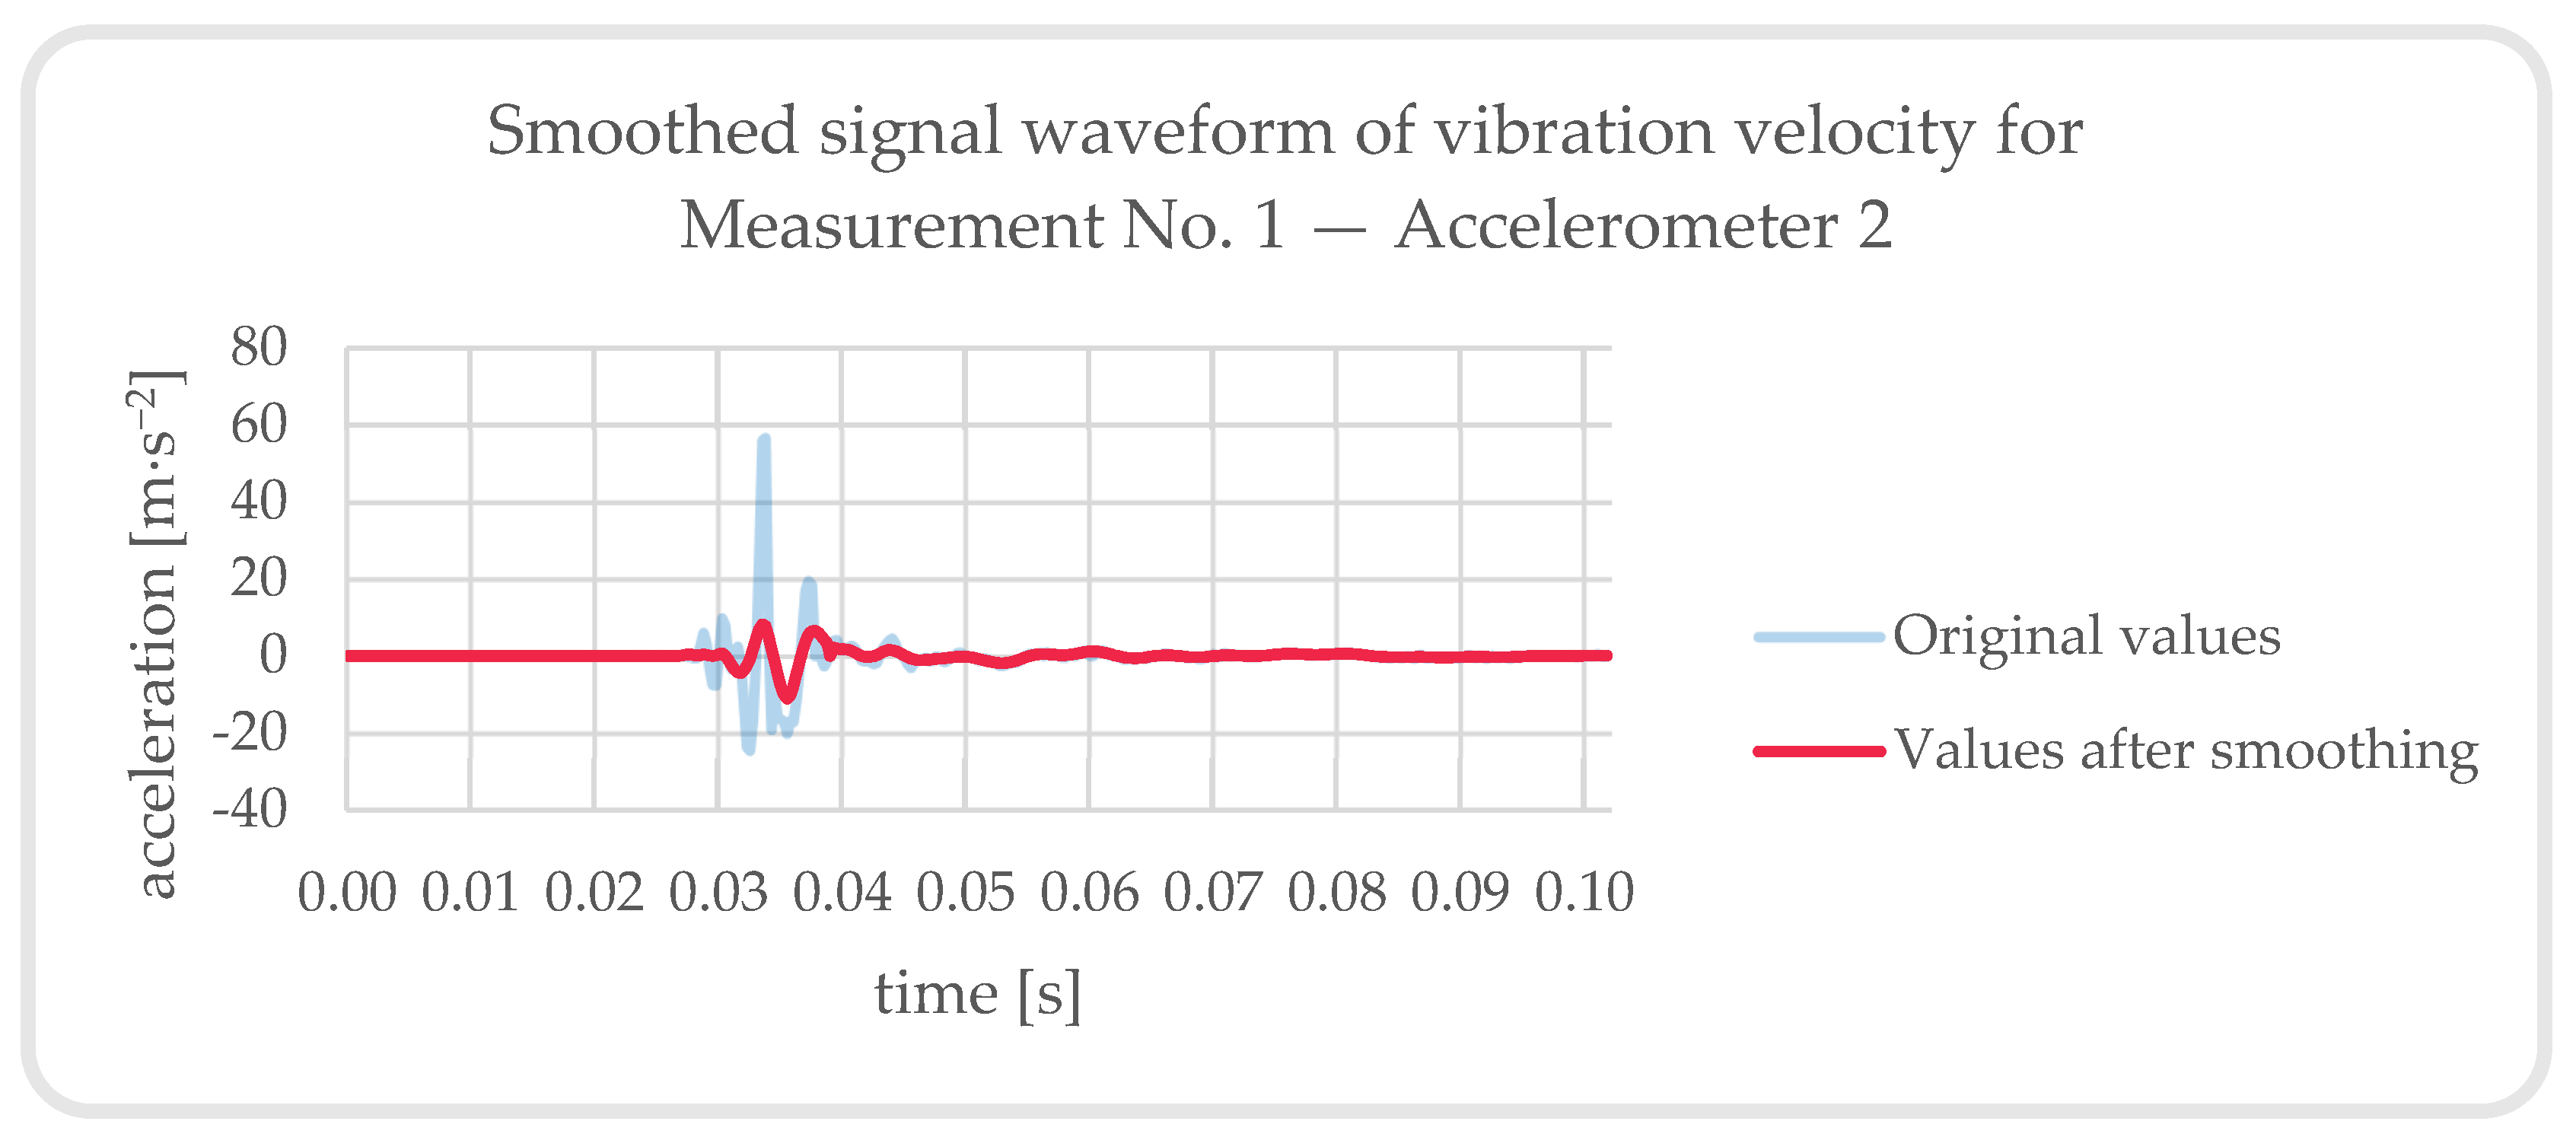
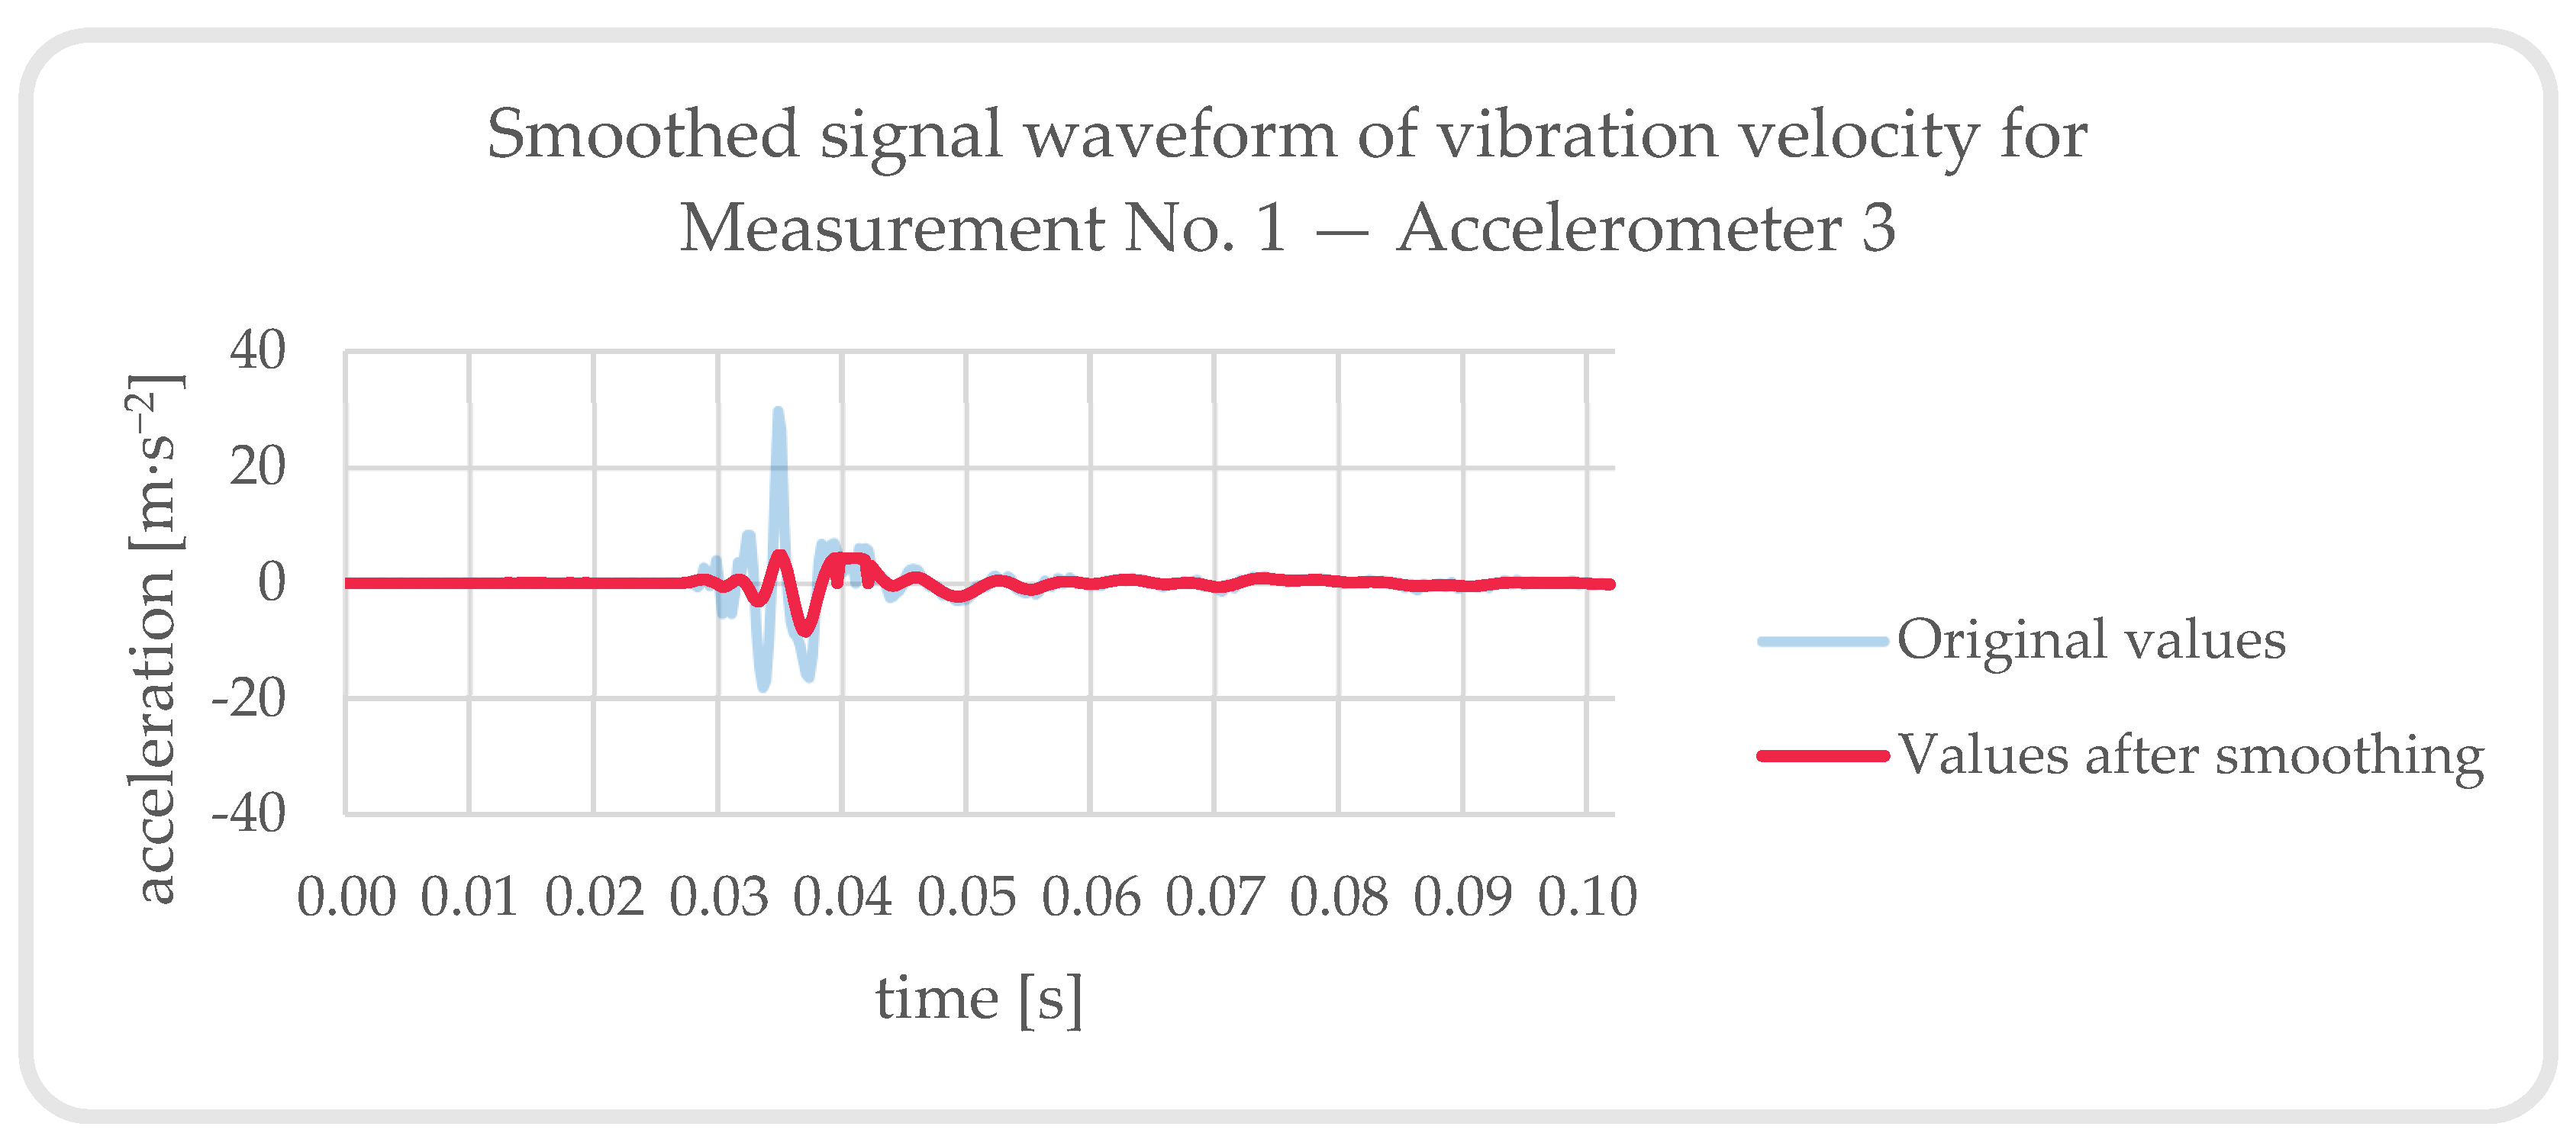
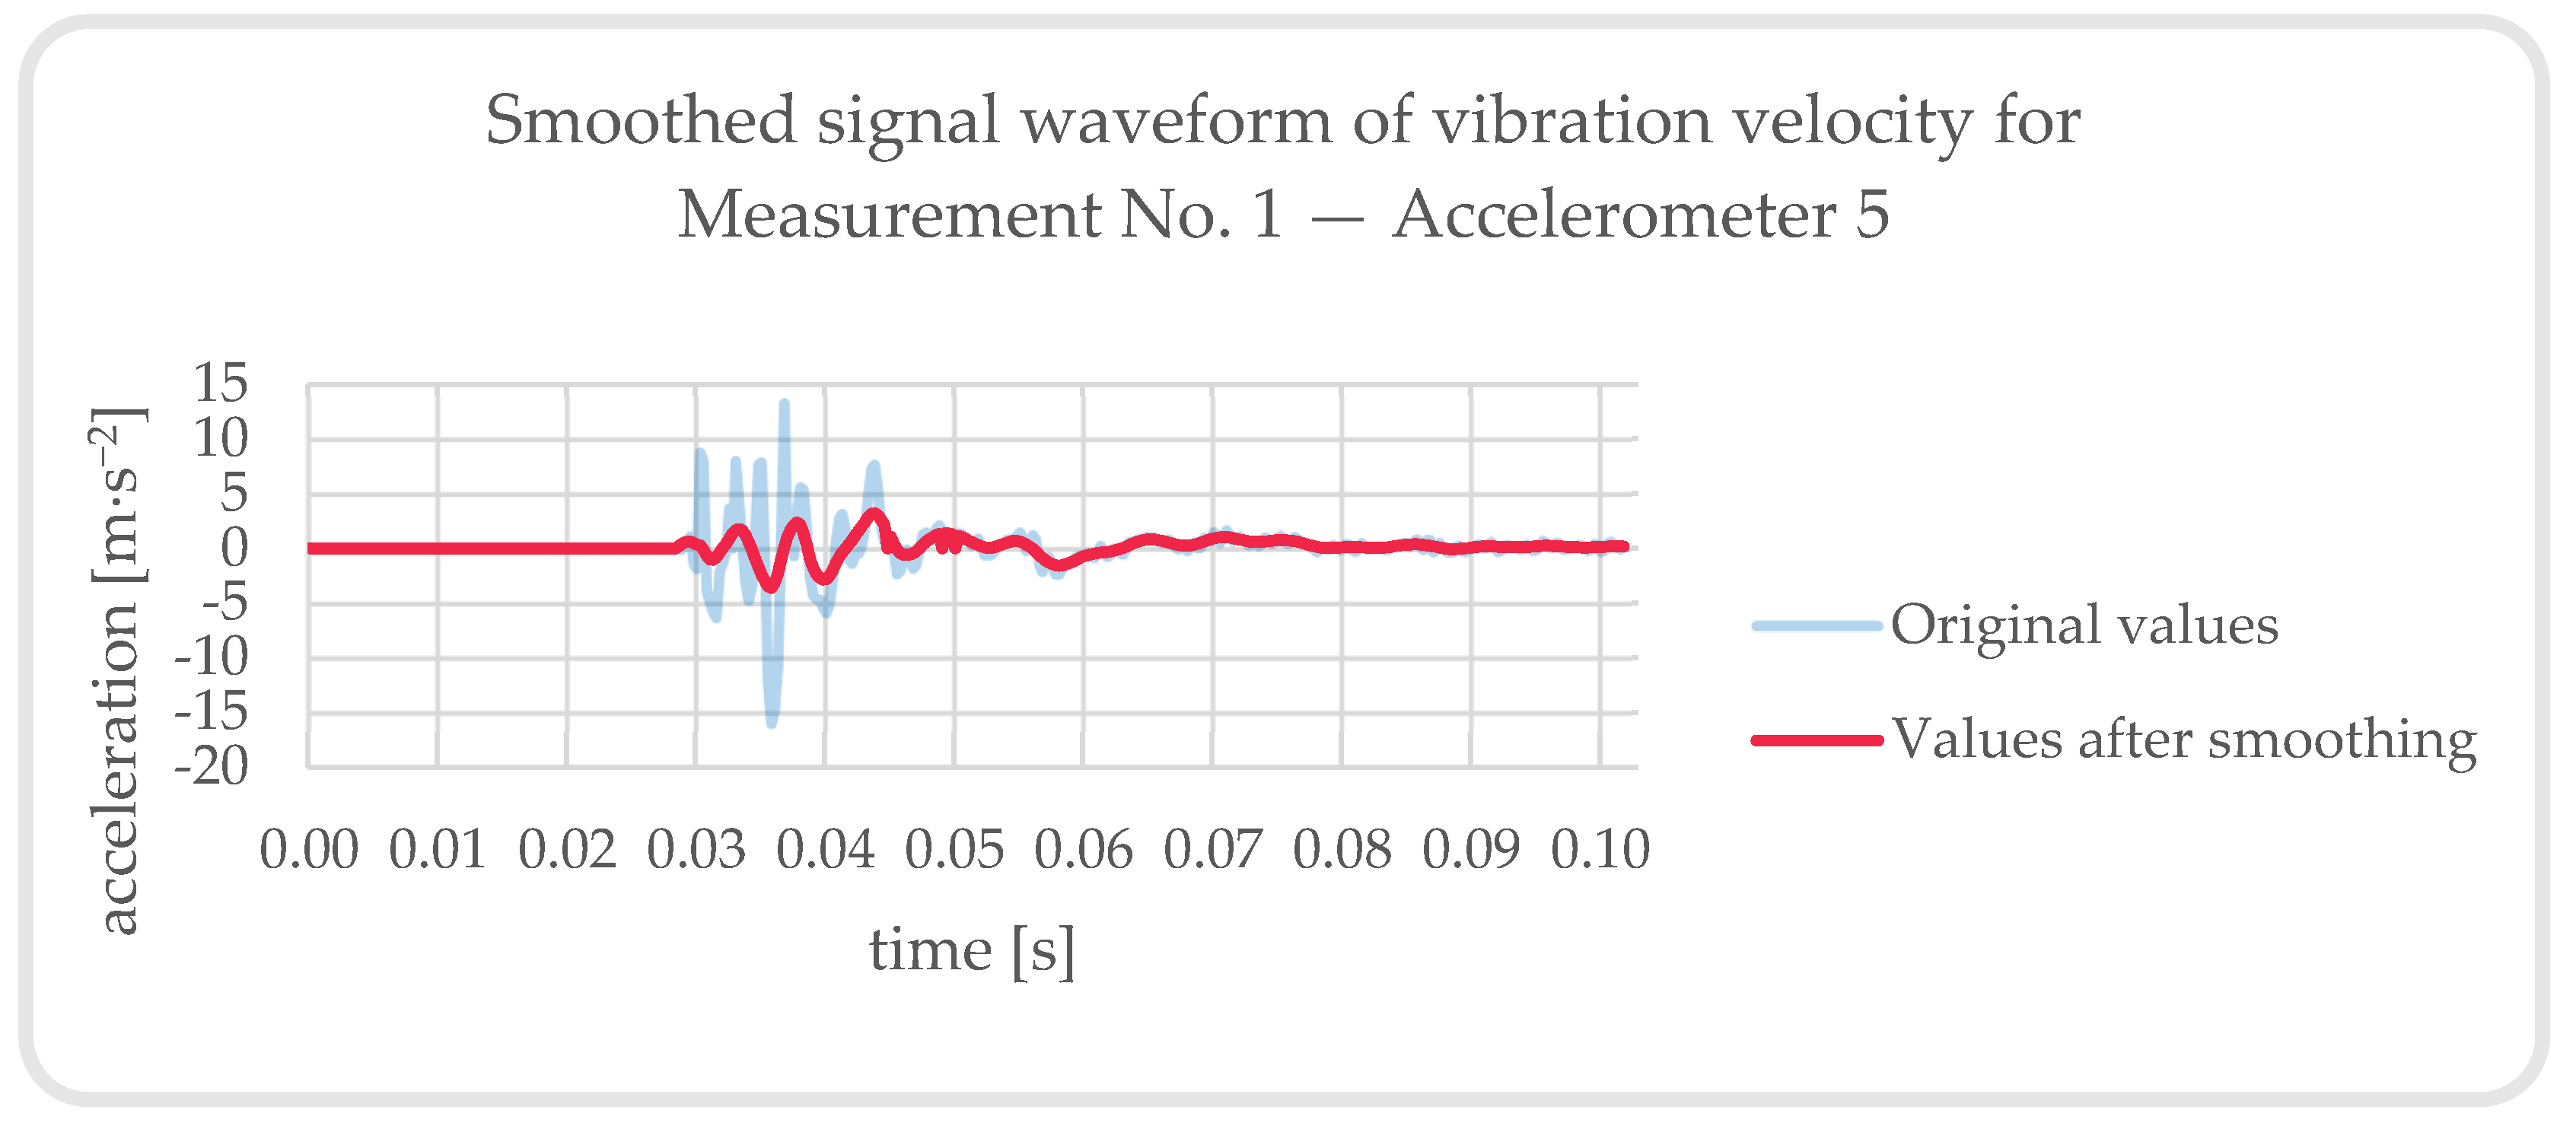
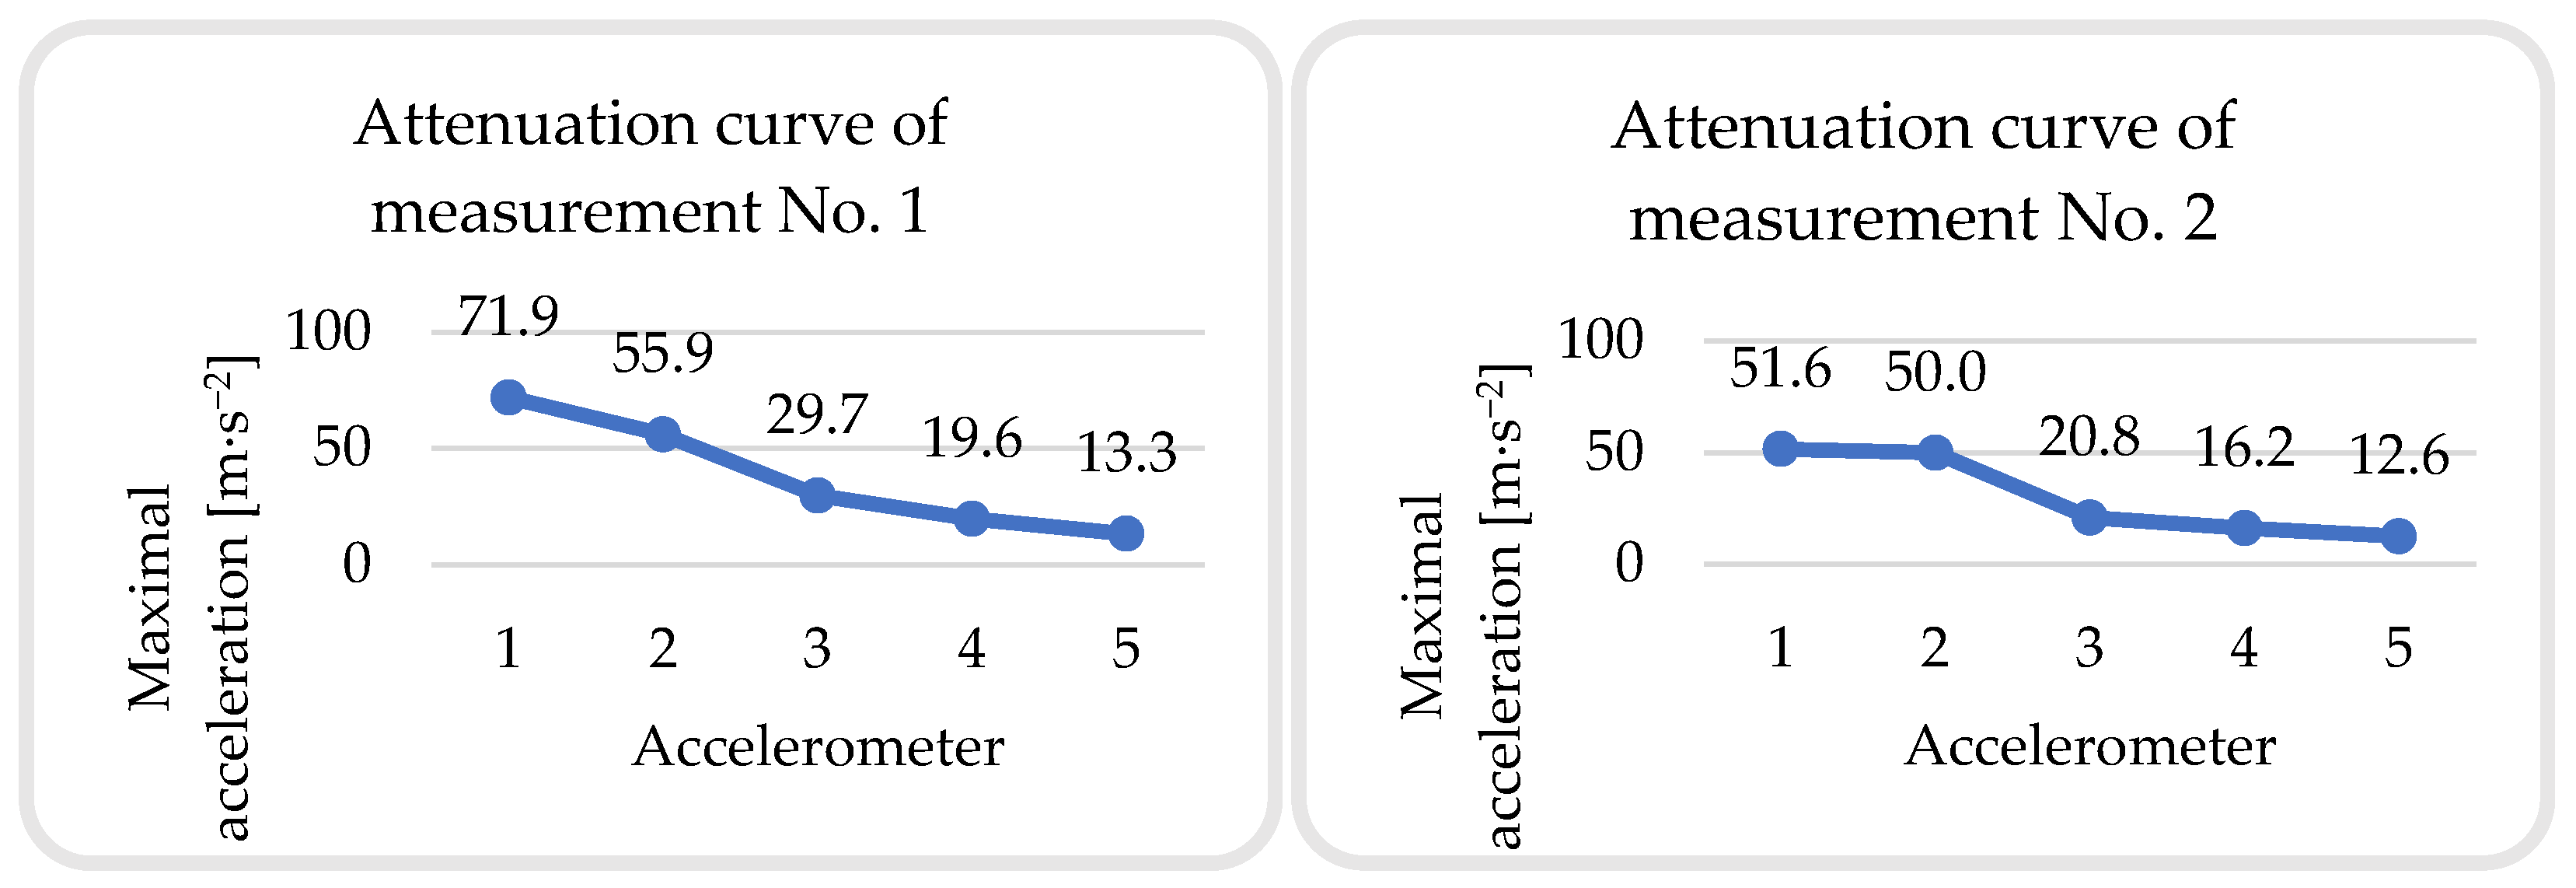
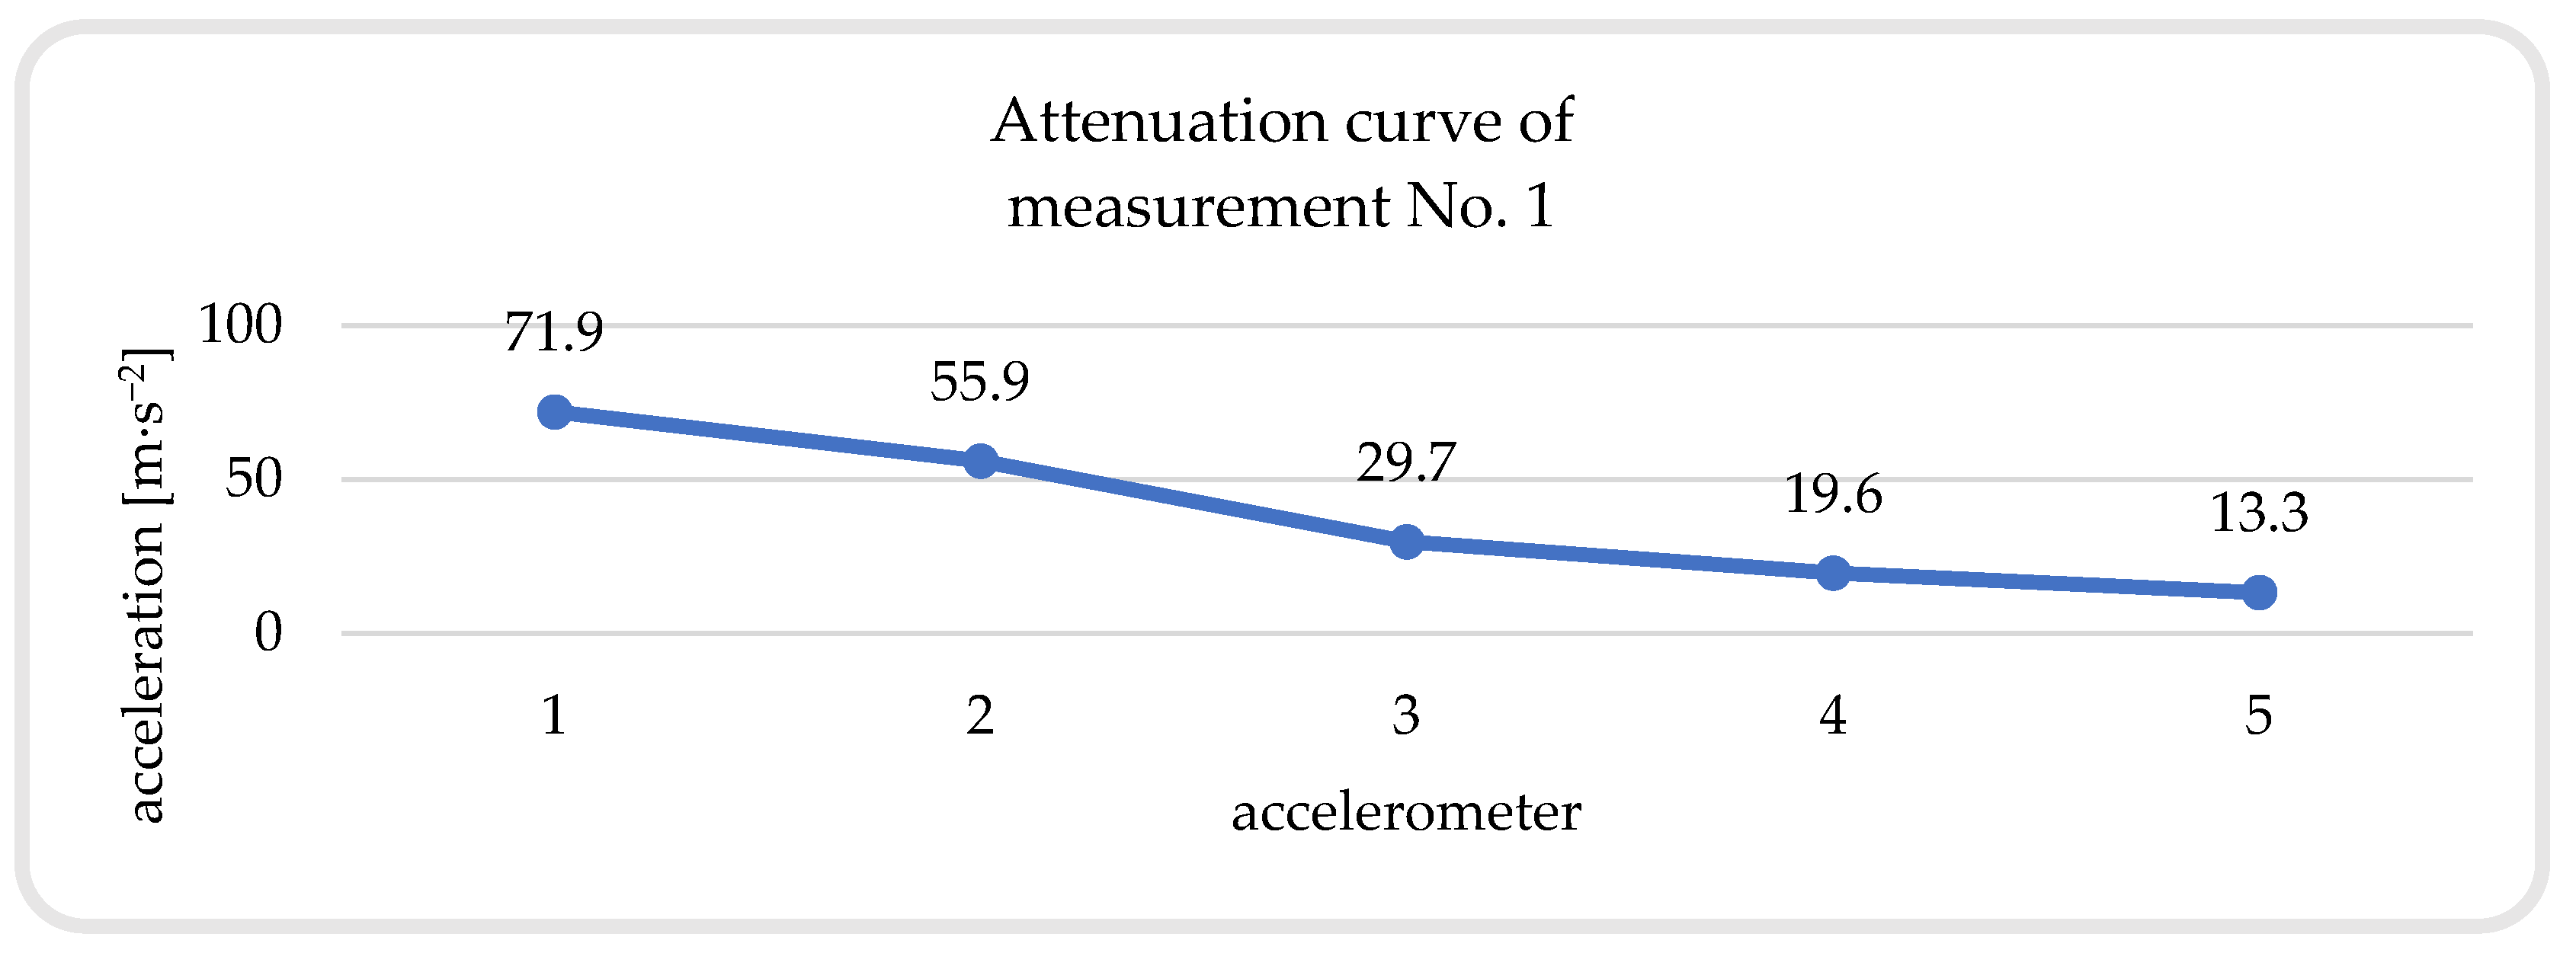
| Measurement No.1 | 71.860 | 55.928 | 29.723 | 19.602 | 13.276 |
| Measurement No.2 | 51.600 | 50.000 | 20.848 | 16.176 | 12.559 |
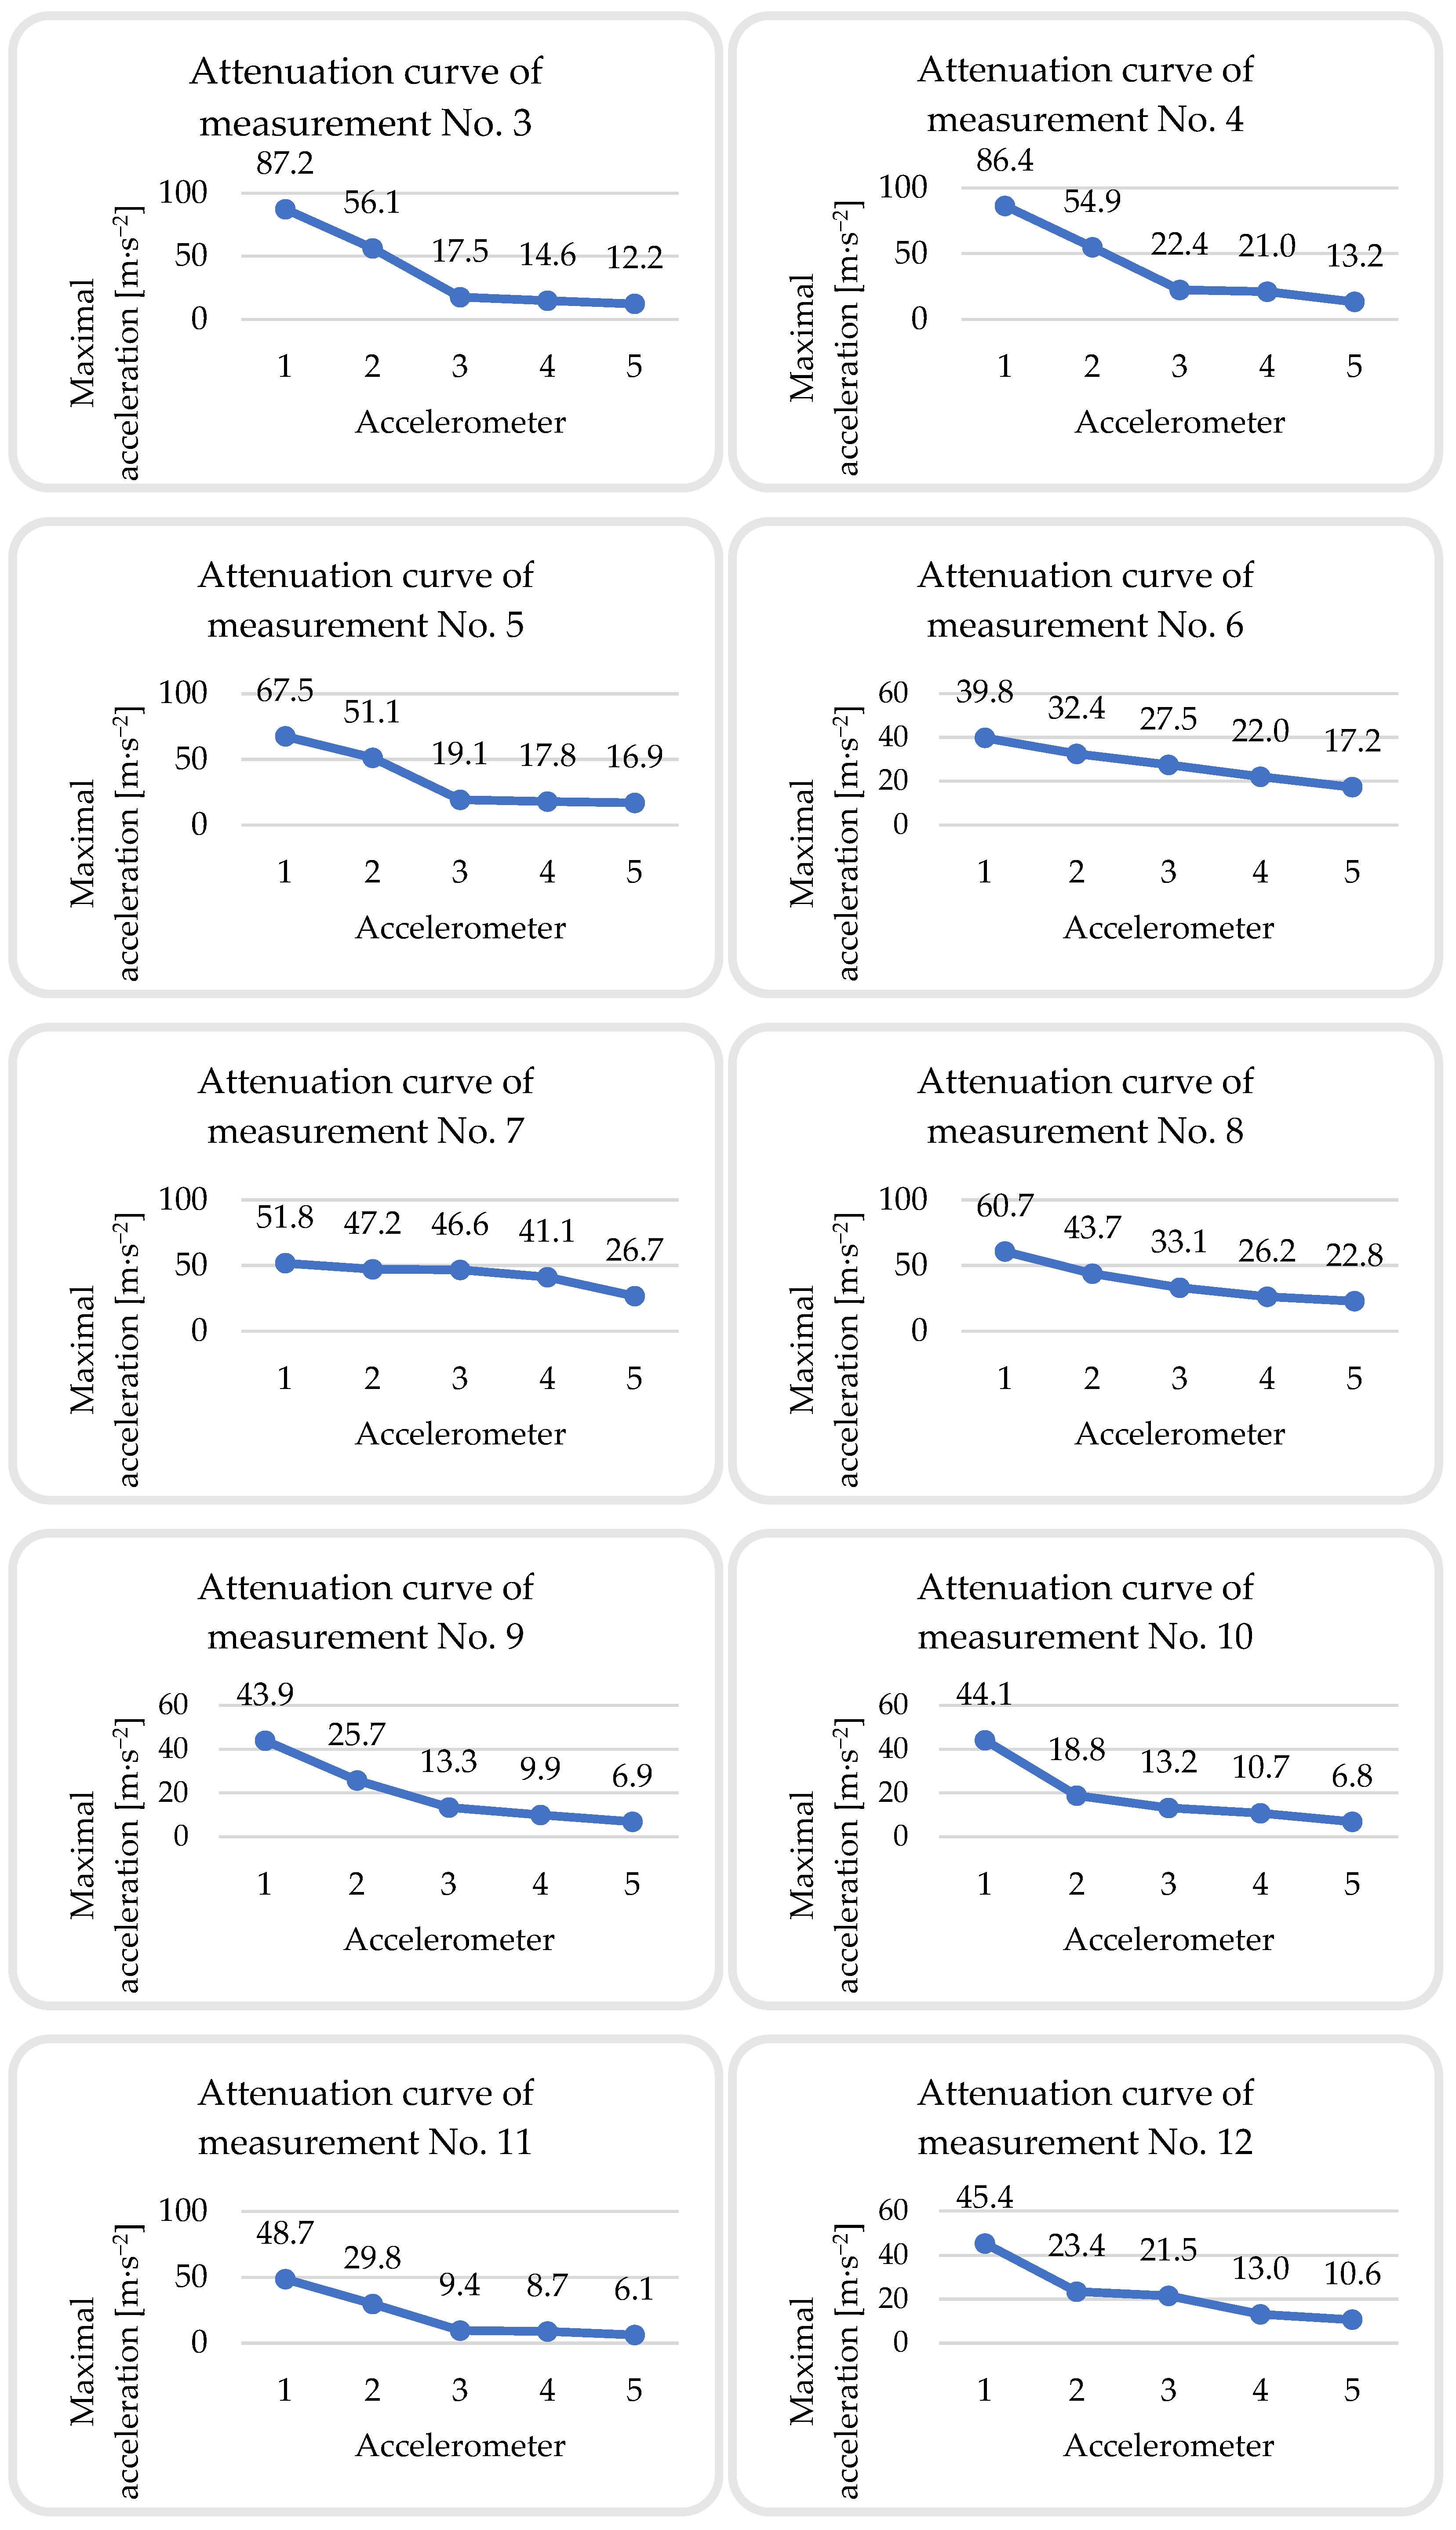
| Measurement No.3 | 87.200 | 56.100 | 17.456 | 14.600 | 12.196 |
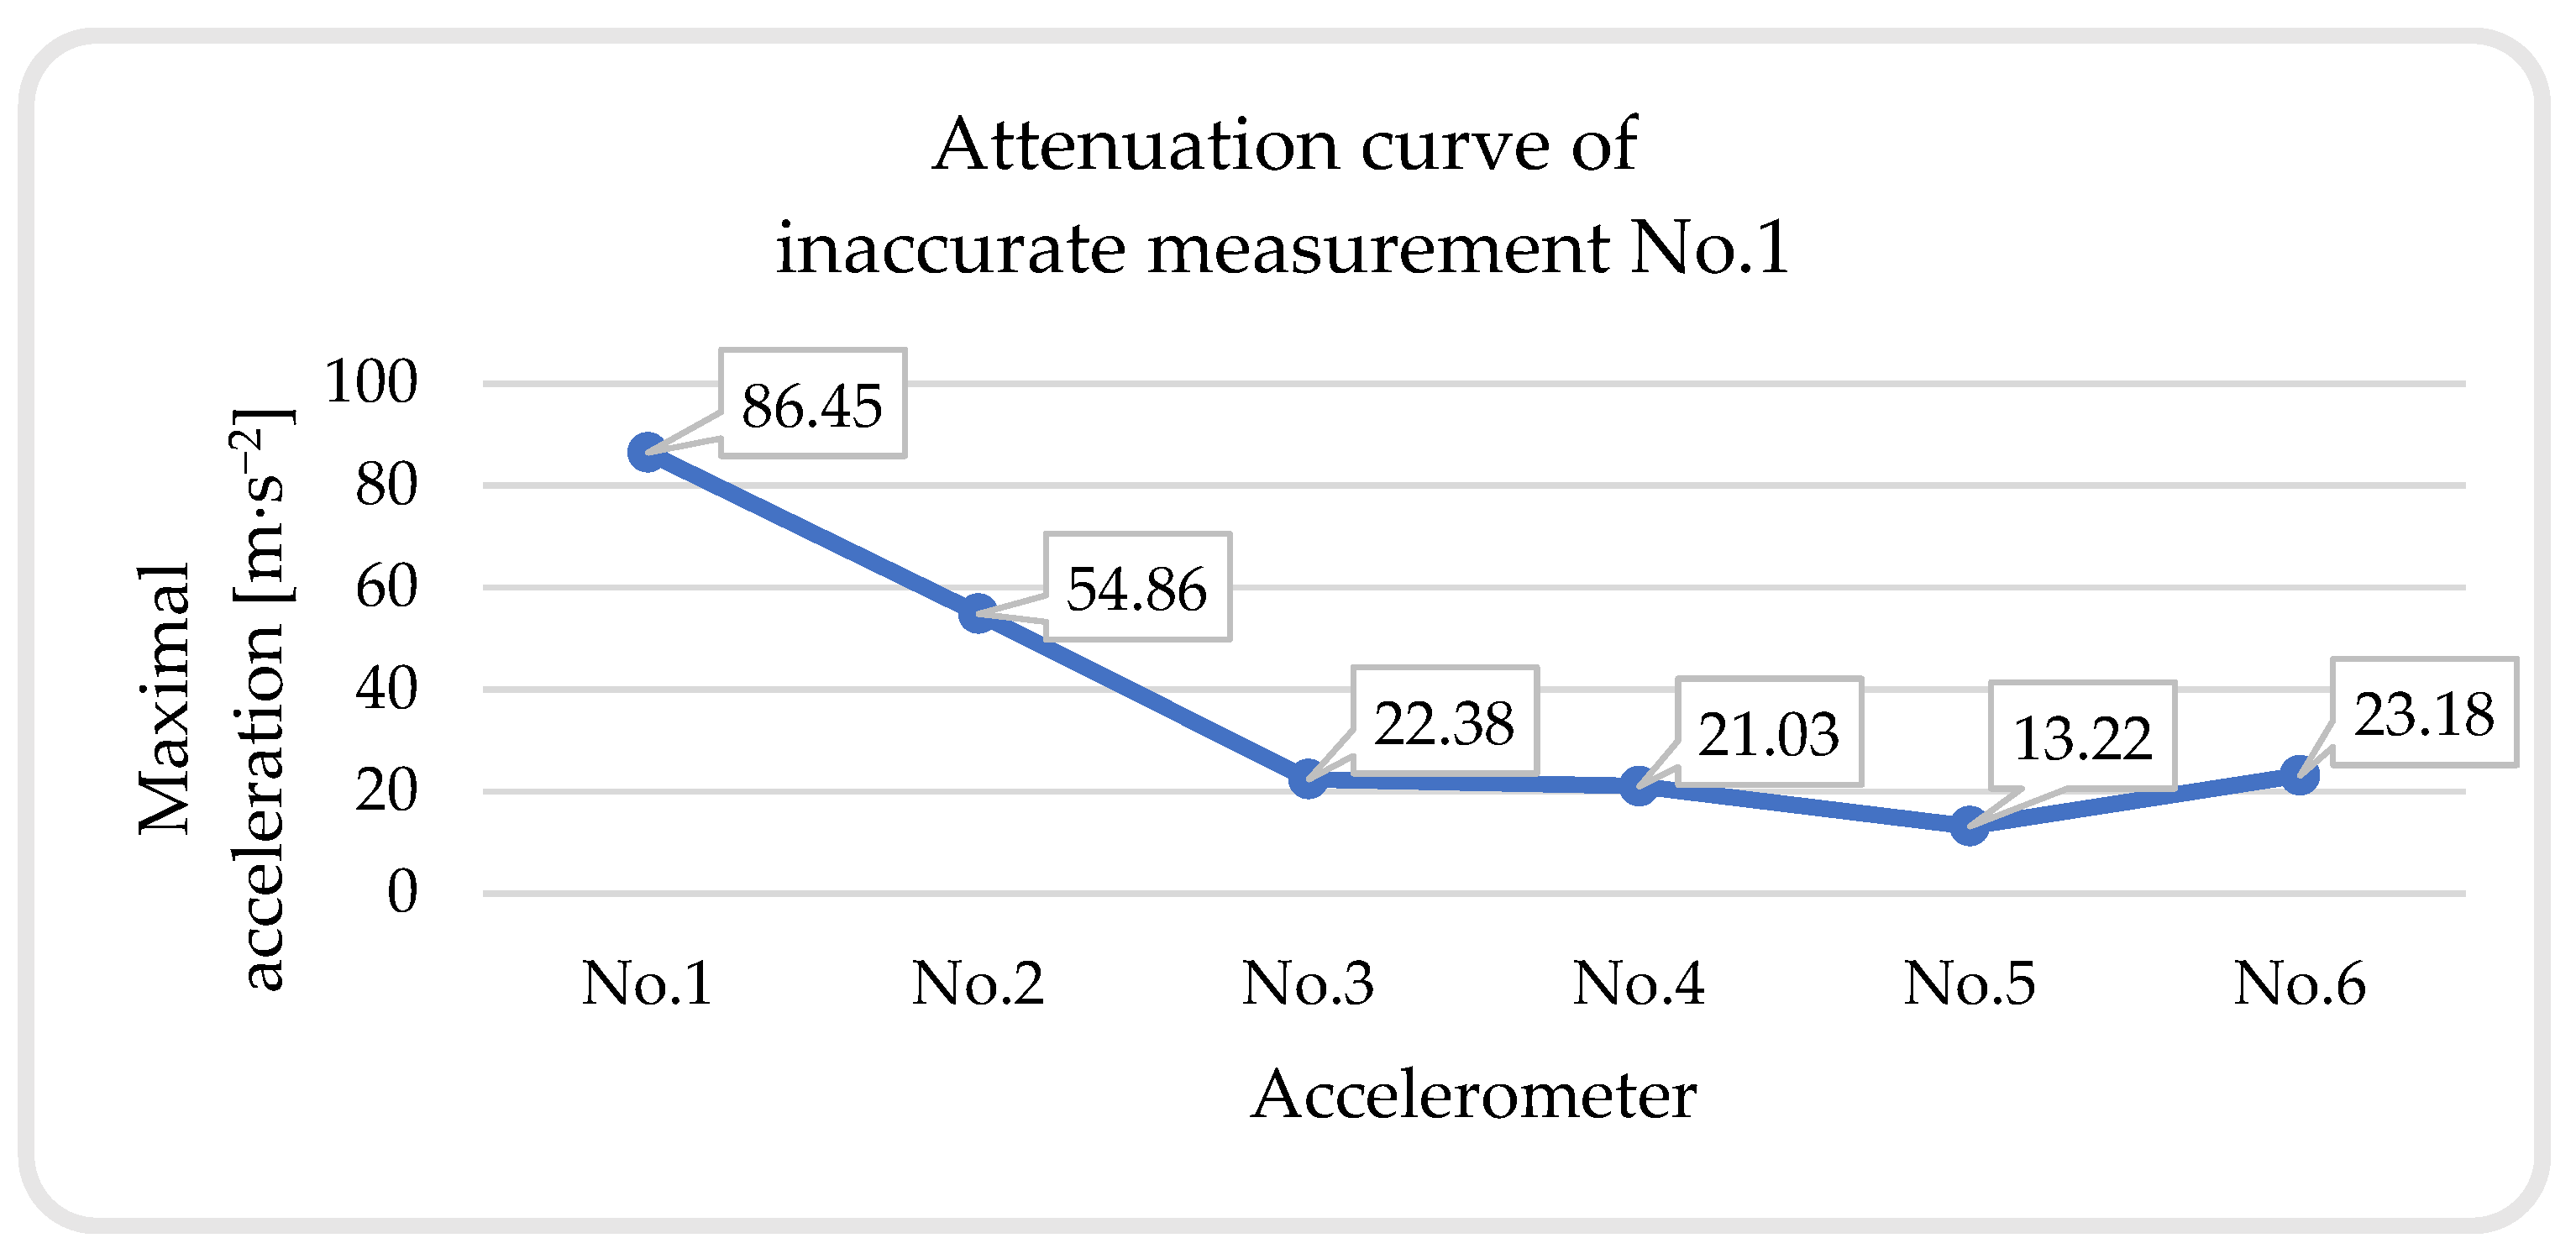
| Measurement No.4 | 86.400 | 54.900 | 22.384 | 21.030 | 13.216 |
| Measurement No.5 | 67.500 | 51.100 | 19.134 | 17.848 | 16.873 |
| Measurement No.6 | 39.762 | 32.391 | 27.452 | 22.000 | 17.248 |
| Measurement No.7 | 51.800 | 47.200 | 46.600 | 41.106 | 26.651 |
| Measurement No.8 | 60.700 | 43.700 | 33.099 | 26.171 | 22.750 |
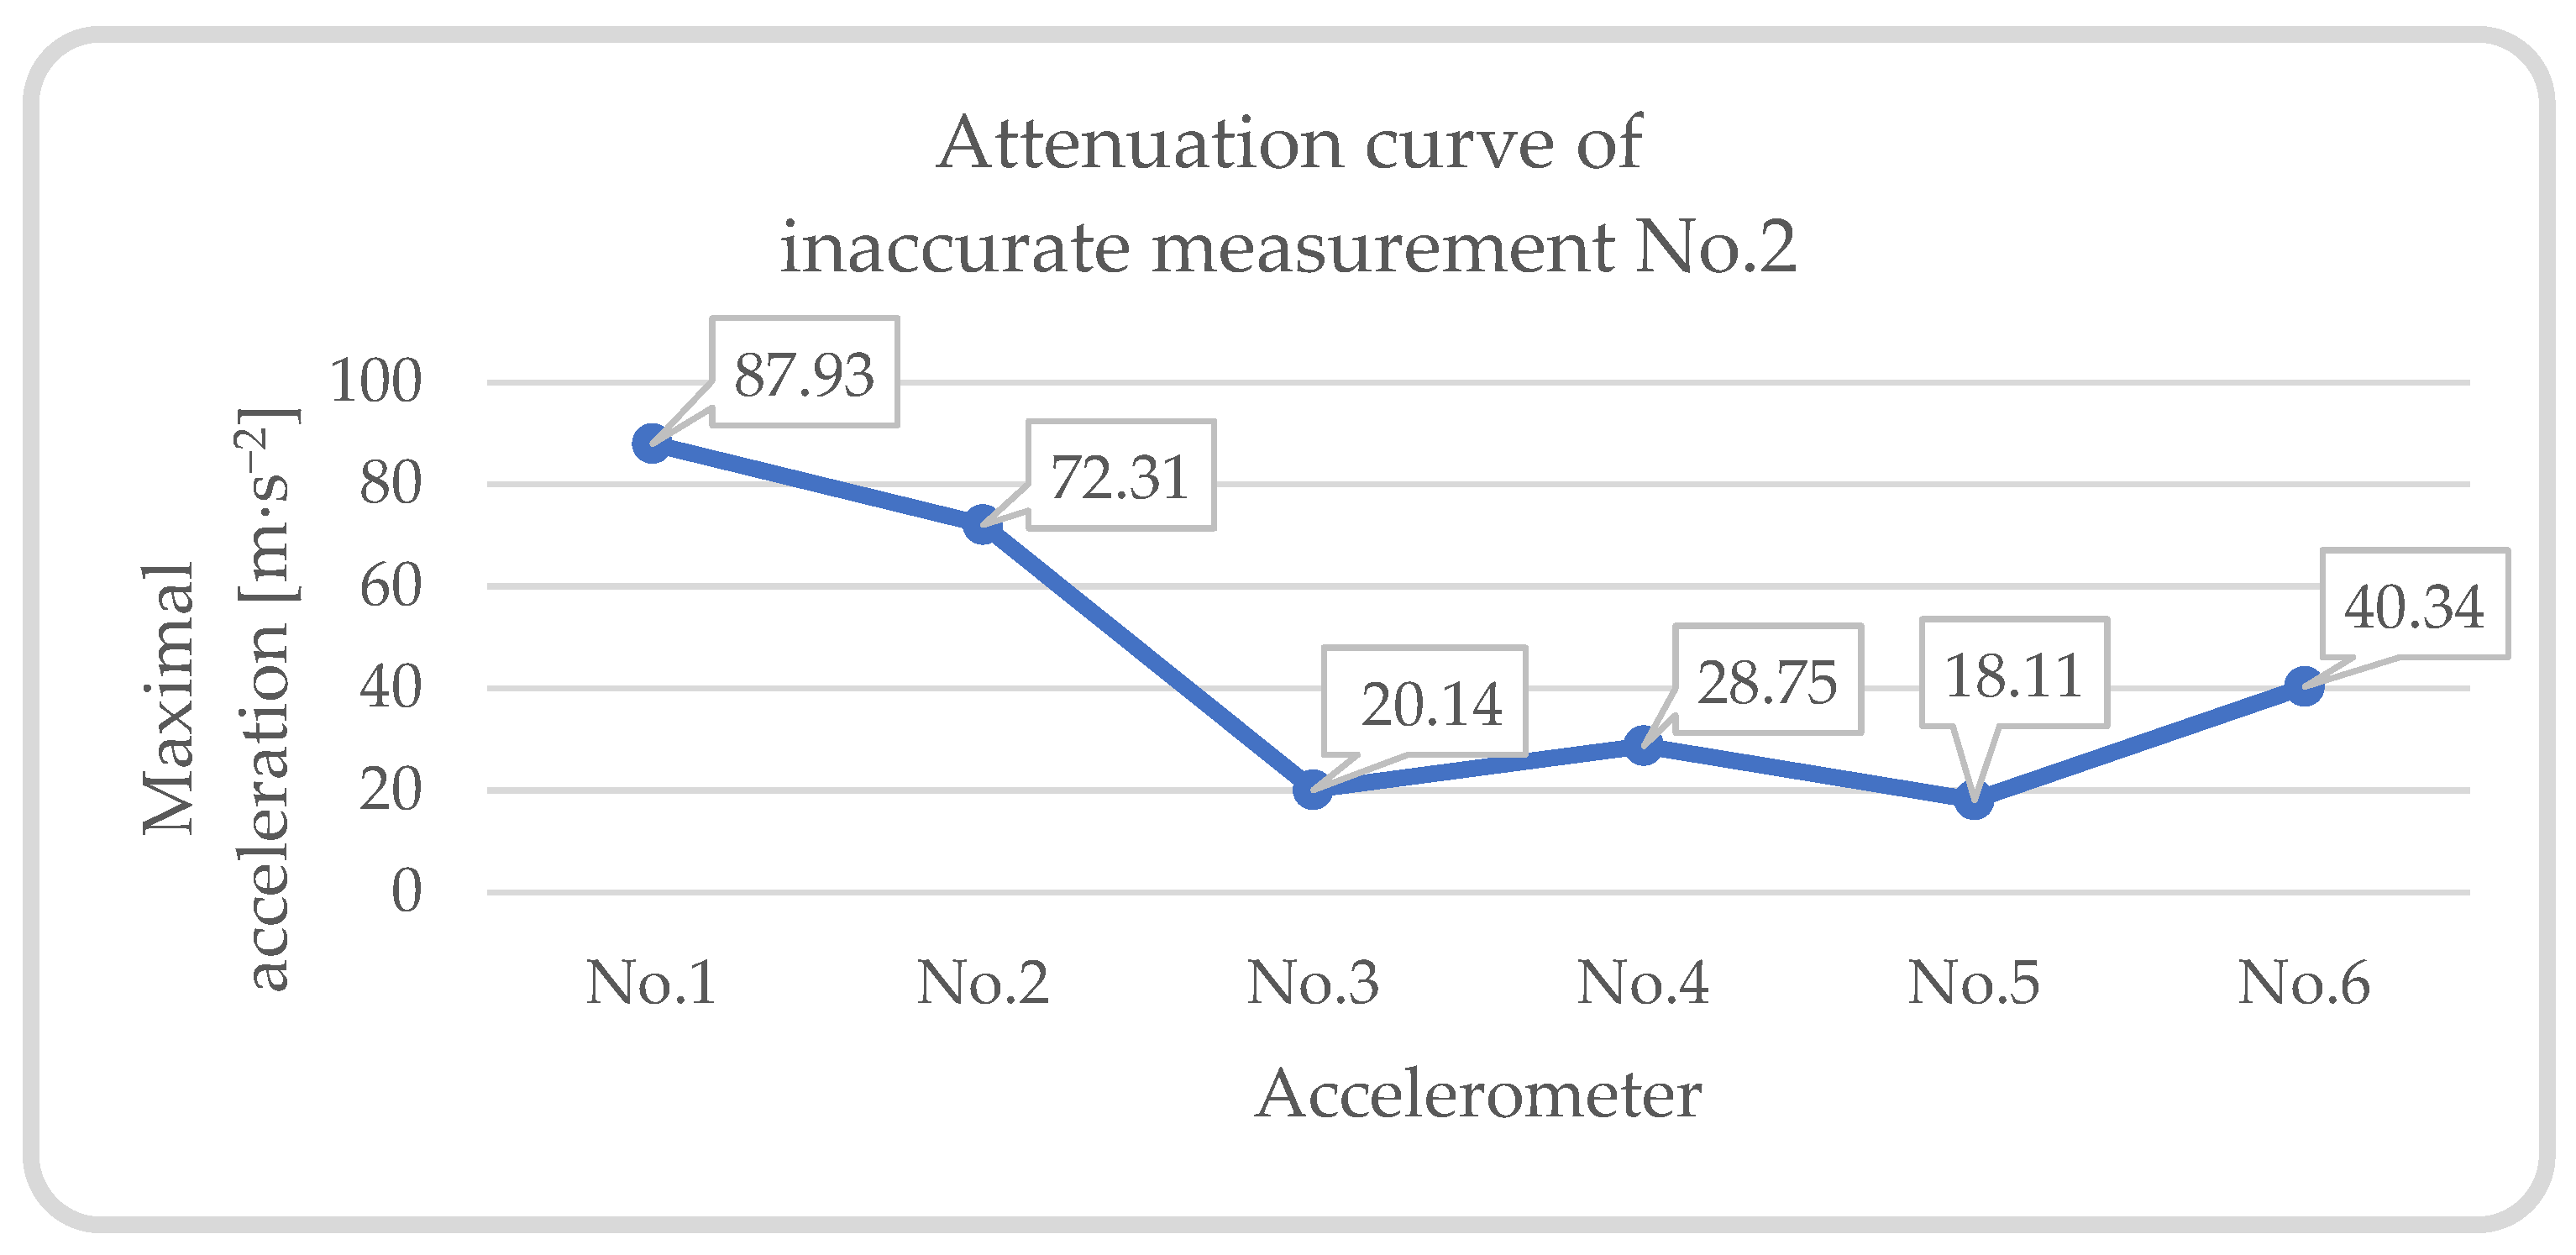
| Measurement No.9 | 25.737 | 43.900 | 13.322 | 9.110 | 6.868 |
| Measurement No.10 | 44.100 | 18.827 | 13.205 | 10.713 | 6.845 |
| Measurement No.11 | 48.700 | 29.779 | 9.406 | 8.743 | 6.092 |
| Measurement No.12 | 45.400 | 23.395 | 21.538 | 13.041 | 10.611 |
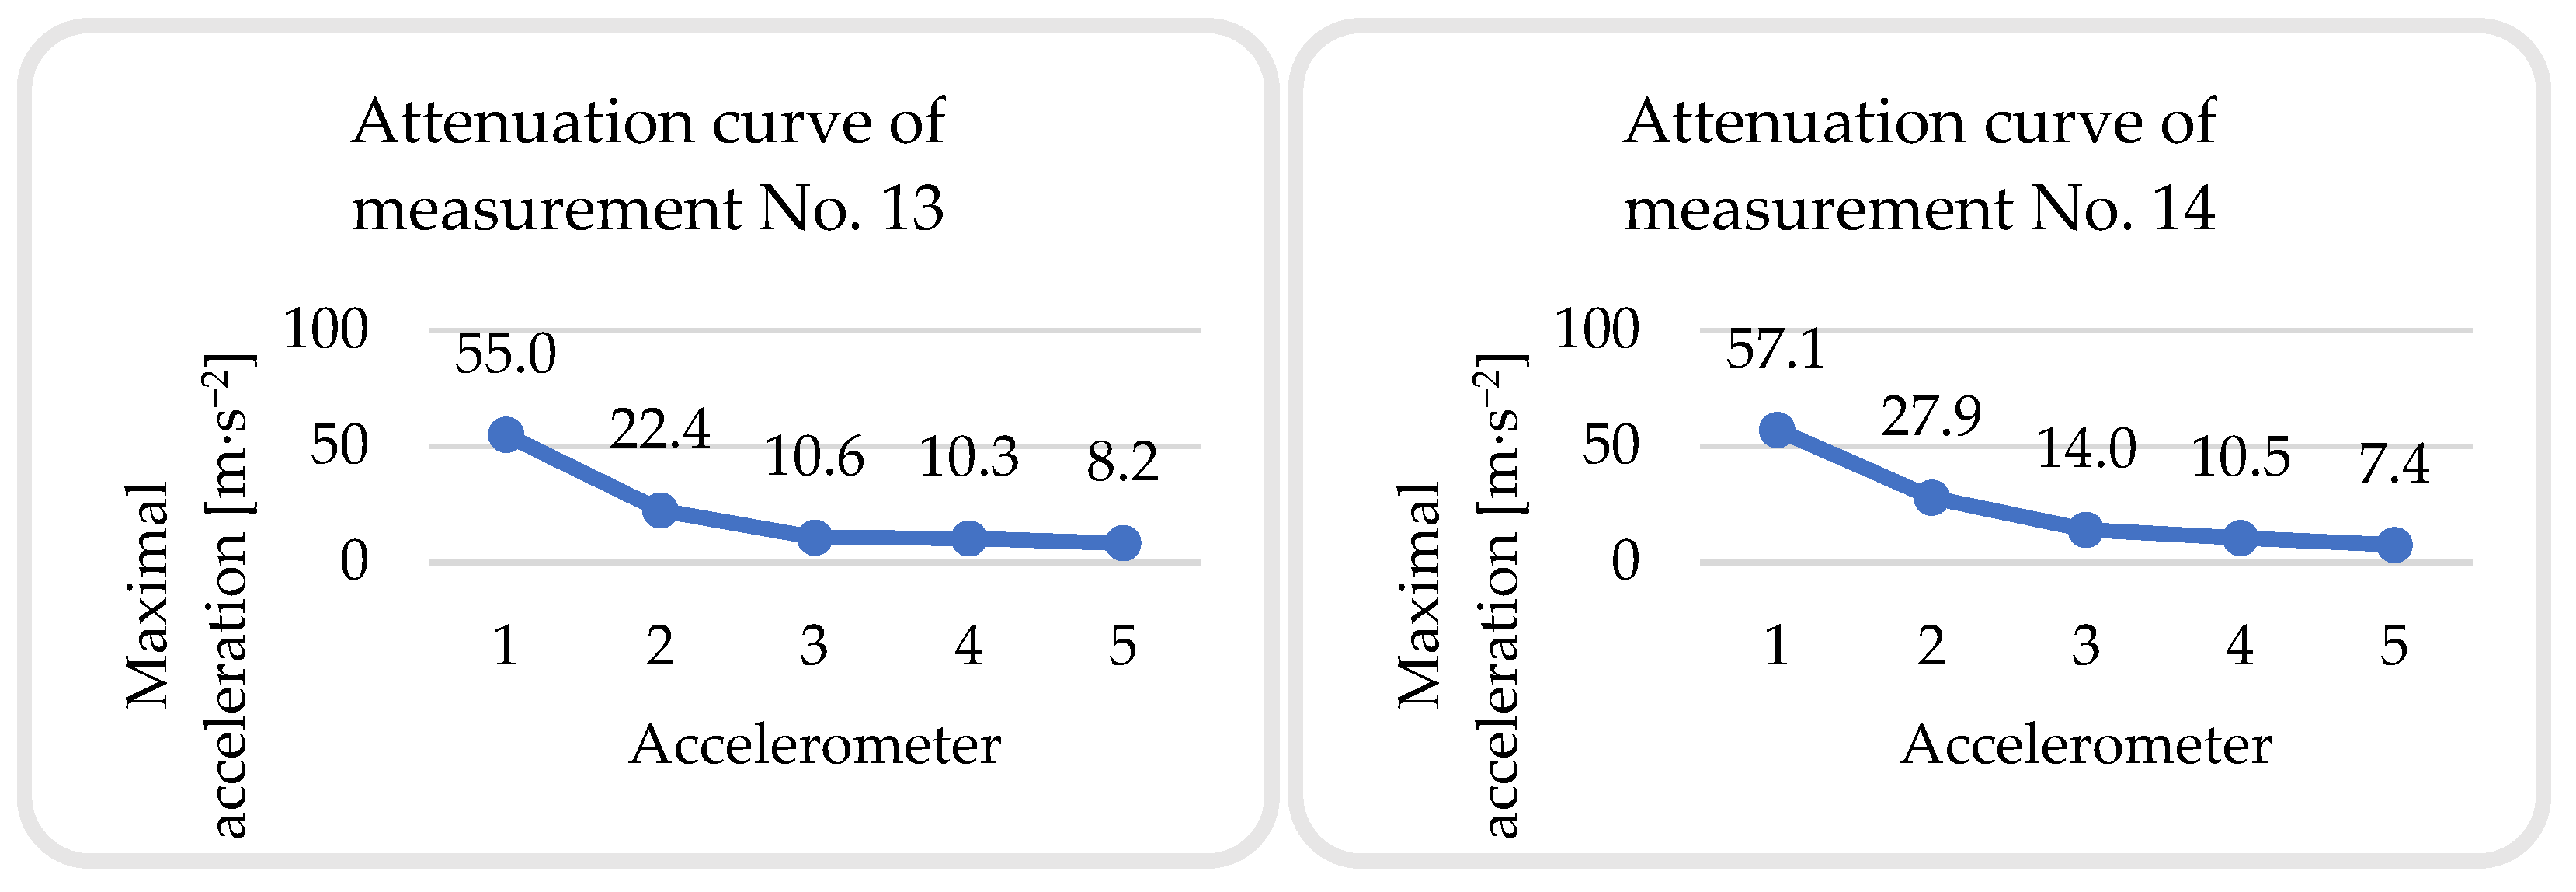
| Measurement No.13 | 55.000 | 22.376 | 10.584 | 10.313 | 8.211 |
| Measurement No.14 | 57.100 | 27.925 | 14.023 | 10.470 | 7.439 |
Disclaimer/Publisher’s Note: The statements, opinions and data contained in all publications are solely those of the individual author(s) and contributor(s) and not of MDPI and/or the editor(s). MDPI and/or the editor(s) disclaim responsibility for any injury to people or property resulting from any ideas, methods, instructions or products referred to in the content. |
© 2023 by the authors. Licensee MDPI, Basel, Switzerland. This article is an open access article distributed under the terms and conditions of the Creative Commons Attribution (CC BY) license (https://creativecommons.org/licenses/by/4.0/).
Share and Cite
Papán, D.; Brozová, E.; Papánová, Z. Experimental Simulation of Deformation Effect Propagation Due to Explosion on the Surface of a Small-Scale Model. Buildings 2023, 13, 1566. https://doi.org/10.3390/buildings13061566
Papán D, Brozová E, Papánová Z. Experimental Simulation of Deformation Effect Propagation Due to Explosion on the Surface of a Small-Scale Model. Buildings. 2023; 13(6):1566. https://doi.org/10.3390/buildings13061566
Chicago/Turabian StylePapán, Daniel, Emma Brozová, and Zuzana Papánová. 2023. "Experimental Simulation of Deformation Effect Propagation Due to Explosion on the Surface of a Small-Scale Model" Buildings 13, no. 6: 1566. https://doi.org/10.3390/buildings13061566
APA StylePapán, D., Brozová, E., & Papánová, Z. (2023). Experimental Simulation of Deformation Effect Propagation Due to Explosion on the Surface of a Small-Scale Model. Buildings, 13(6), 1566. https://doi.org/10.3390/buildings13061566