Article

Optimizing Truss Structures Using Composite Materials under Natural Frequency Constraints with a New Hybrid Algorithm Based on Cuckoo Search and Stochastic Paint Optimizer (CSSPO)

Department of Civil and Architectural Engineering, University of Miami, Coral Gables, FL 33146-0630, USA
*
Author to whom correspondence should be addressed.
Buildings 2023, 13(6), 1551; https://doi.org/10.3390/buildings13061551
Submission received: 15 May 2023 / Revised: 11 June 2023 / Accepted: 16 June 2023 / Published: 18 June 2023

Abstract

:
This article highlights the absence of published paradigms hybridized by The Cuckoo Search (CS) and Stochastic Paint Optimizer (SPO) for optimizing truss structures using composite materials under natural frequency constraints. The article proposes a novel optimization algorithm called CSSPO for optimizing truss structures made of composite materials, known as fiber-reinforced polymer (FRP) composites, to address this gap. Optimization problems of truss structures under frequency constraints are recognized as challenging due to their non-linear and non-convex search spaces that contain numerous local optima. The proposed methodology produces high-quality optimal solutions with less computational effort than the original methods. The aim of this work is to compare the performance of carbon FRP (CFRP), glass FRP (GFRP), and steel using a novel hybrid algorithm to provide valuable insights and inform decision-making processes in material selection and design. Four benchmark structure trusses with natural frequency constraints were utilized to demonstrate the efficiency and robustness of the CSSPO. The numerical analysis findings indicate that the CSSPO outperforms the classical SPO and exhibits comparable or superior performance when compared to the SPO. The study highlights that implementing CFRP and GFRP composites in truss construction leads to a notable reduction in weight compared to using steel.

1. Introduction

In the last few decades, a plethora of metaheuristic optimization approaches have been created to address diverse engineering problems. These algorithms explore the search space pseudo-randomly based on certain guiding principles without requiring gradient information. Due to their superior performance, lower computational requirements, and shorter processing times compared to deterministic algorithms, metaheuristic algorithms have gained popularity in various fields [1,2,3,4,5]. These algorithms rely on simple concepts and can quickly adapt to different domains. In contrast, deterministic algorithms can become trapped in local optima, especially if they lack randomness in later stages. Including random elements in metaheuristic algorithms can help avoid local optima and explore the search space more effectively. Gradient descent algorithms are generally better suited for direct and simple problems that require gradient information. However, the convergence rate of metaheuristic algorithms is often slower than that of gradient descent algorithms, which can be seen as a drawback [6].
The Genetic Algorithm (GA) [7], Particle Swarm Optimization (PSO) [8], Waterwheel Plant Algorithm (WWPA) [9], Coati Optimization Algorithm (COA) [10], Grey Wolf Optimizer (GWO) [11], Growth Optimizer (GO) [12], Artificial Rabbits Optimization [13], Wild Horse Optimizer (WHO) [14], Circle Search Algorithm (CSA) [15], and Mountain Gazelle Optimizer (MGO) [16] are some of the well-established metaheuristic optimization algorithms. These algorithms have demonstrated their effectiveness in diverse domains, efficiently tackling a broad range of problem types.
Optimizing truss structures is a tough challenge that requires the consideration of multiple design objectives and constraints [17]. One crucial constraint in truss design is the natural frequency limitation, which limits the maximum allowable frequency of vibration that a structure can undergo without experiencing significant deformation or damage. Optimizing trusses while satisfying natural frequency constraints requires a thorough understanding of the interaction between design parameters and the natural frequency [18].
Knowledge of structural dynamics has shown that the natural frequency is a crucial factor that significantly impacts a structure’s performance. The development of optimal truss designs based on their dynamic behavior has emerged as a complex area of research. The determination of natural frequencies is a crucial aspect in understanding the dynamic behavior of a structure. In the last few decades, there has been an upward trend of interest in truss improvements based on frequency constraints. Controlling the natural frequencies of a truss is essential to prevent the resonance phenomenon and improve its structural performance. However, it is also necessary to ensure that engineering structures are as lightweight as possible, which conflicts with frequency constraints and complicates truss optimization. It is imperative to employ an efficient optimization technique for these topics that adheres to primary frequency constraints. Consequently, researchers are dedicating substantial efforts in this field [19].
Creating truss structures that are both lightweight and high performing is crucial for numerous engineering applications, such as those found in aerospace, automotive, and civil engineering. Recently, the use of pultruded fiber-reinforced polymer (FRP) materials in truss structures has gained significant attention due to their excellent mechanical properties, including high strength-to-weight ratio, corrosion resistance, and durability. However, designing an optimal FRP truss that meets various design constraints, such as natural frequency limitations, can be a novel and challenging task [20].
The generalized normal distribution optimization (GNDO) algorithm was proposed by Khodadadi and Mirjalili [21] for the optimal weight design of truss structures with frequency constraints. Due to the abundance of local optima and the non-convex character of the search space, optimization problems of this kind are well recognized for being difficult. This study aimed to investigate the efficacy of the GNDO algorithm for addressing the aforementioned issues. The GNDO algorithm’s performance was evaluated using three benchmark truss optimization problems that had frequency constraints. The results obtained from the numerical analysis suggest that the GNDO algorithm exhibits high levels of dependability, consistency, and effectiveness in the context of structural optimization problems, surpassing other metaheuristic algorithms in terms of performance.
Tiknov and Safnov [22] addressed the challenge of enhancing the distribution of carbon fiber in hybrid glass and carbon FRP components that form a statically determinate regular elastic truss structure for airplanes. The authors suggested a modified genetic algorithm that integrates with mathematical induction. To ensure the optimality of the process, the proposed a method that focuses on minimizing structural material costs while also satisfying the requirements of elastic strength.
Kaveh et al. [23] presented an upgraded version of The Slime Mould Algorithm, referred to as ISMA, which was designed to optimize truss structure sizes while also taking into account constraints related to the natural frequency. The algorithm known as Slime Mould was derived from the study of the morphological transformations exhibited by the acellular slime mould physarum polycephalum during its foraging activities. This algorithm has been effectively employed in a range of optimization problems across the fields of science and industry. The standard Slime Mould Algorithm might exhibit slow and premature convergence towards suboptimal solutions, particularly when dealing with problems of larger scales. In order to address these challenges, the ISMA has proposed the implementation of two notable enhancements. The efficacy and resilience of the ISMA has been exhibited through the utilization of three benchmark dome trusses with natural frequency constraints.
Liu et al. [24] introduced a new approach to enhancing the search capability of The Fruit Fly Optimization Algorithm (FOA) by implementing a memory-based search strategy. Additionally, an improved Deb rule (IDeb) was utilized to improve the computational efficiency of FOAs while dealing with constraints. Instead of a fixed search radius, the proposed strategy dynamically determined the vision search radius for each fruit fly by incorporating knowledge from both the swarm and individuals. The IDeb rule was founded on the principle of FOA elitism and effectively reduces redundant analyses throughout optimization while maintaining the high quality of the optimal solution. This study offered four optimization problems for trusses with frequency constraints to assess the effectiveness of the method. The findings suggested that the integration of standard and proposed search tactics in funding opportunity announcements (FOAs) yielded the most optimal outcome. The implementation of the IDeb rule had resulted in a notable enhancement in the computational efficiency of FOAs utilized in structural optimization.
A study introduced a metaheuristic approach known as The Modified Simulated Annealing Algorithm (MSAA) [25] to optimize the size and shape of truss structures while ensuring that they meet frequency constraints. The Modified Simulated Annealing Algorithm (MSAA) is an upgraded version of The Simulated Annealing Algorithm. It incorporates three notable modifications, namely preliminary exploration, a search step, and a new acceptance probability. The efficacy of the MSAA was assessed through the analysis of six benchmark truss optimization problems that incorporated frequency constraints. The computational results indicated that MSAA outperformed other contemporary metaheuristics approaches to optimization in terms of efficiency, stability, and reliability.
Ho-Huu [26] developed a novel approach to differential evolution (DE) that addresses truss structures’ shape and size optimization challenges while adhering to frequency constraints. The new approach, which was suggested, represents a refined version of the DE algorithm that incorporates two significant enhancements. The roulette wheel selection was initially employed as a substitute for random selection in the mutation phase, as observed in the conventional differential evolution approach. Moreover, a technique based on elitism was used to replace the traditional selection approach during the selection phase to enhance the convergence rate of the method. The efficacy and reliability of the proposed approach were demonstrated using five numerical instances. The findings indicated that the algorithm put forth outperformed several optimization techniques documented in the existing literature.
The main contribution in [18] was the proposition of an enhanced iteration of The Symbiotic Organisms Search (ISOS) Algorithm, initially developed to tackle the difficulties mentioned earlier. The main inspiration for this advancement was to augment the exploitative tendencies of the initial SOS algorithm. Although the original algorithm successfully stimulated exploration to evade local solutions, it regretfully had an adverse effect on solution precision. This study analyzed the feasibility and efficiency of ISOS, utilizing six benchmark planar/space trusses. The results were subsequently compared to those of other meta-heuristics. According to the experimental findings, the ISOS algorithm exhibited more reliability and efficiency than the conventional SOS algorithm and different modern algorithms.
In order to enhance the efficacy and efficiency of addressing optimization issues related to truss shape and size while adhering to frequency constraints, a Niche Hybrid Parallel Genetic Algorithm (NHPGA) [27] was proposed. The novel methodology was designed with the objective of reducing the computational cost while simultaneously enhancing the solution’s accuracy. The NHPGA achieved these objectives by integrating the advantages of parallel computing, simplex search, and a genetic algorithm with the niche technique. The efficacy of The Nondominated Sorting Hybrid Pareto Genetic Algorithm (NHPGA) in reducing computational time and producing high-quality solutions was demonstrated through various truss optimization examples. The NHPGA exhibits potential as an algorithmic framework that integrates the robust and global search characteristics of The Genetic Algorithm, the powerful exploitation capacity of simplex search, and the rapid computation capability of parallel computing.
Recently, the study [28] aimed to enhance the efficacy of The Conventional Particle Swarm Optimization Algorithm by integrating the proficient phasor theory in mathematics and a comprehensive learning strategy for three-dimensional truss structures. Throughout the course of optimization, a phase angle was incorporated, which employed periodic sine and cosine functions to represent the fundamental parameters that define velocities. The velocities were derived from a designated exemplar’s velocity, which was selected from the prior optimal positions of all particles. The aforementioned methodology expedited the acquisition of knowledge pertaining to the collective behavior of the swarm particles. Furthermore, it enabled the determination of the most secure and advantageous size distribution of the structural elements, while taking into account the external forces and inherent frequency conditions. Notably, this was achieved despite the presence of limited computational resources. The design methodology under consideration effectively resolved diverse design benchmarks in practical-scale engineering applications that encompassed three-dimensional space. The findings indicated that the algorithm exhibits high levels of precision and resilience when compared to a range of contemporary metaheuristic methods that have emerged in the field.
These studies collectively demonstrated the effectiveness of stochastic optimization algorithms in resolving various structural design challenges. According to the No-Free Lunch (NFL) [29] theorem, no optimization algorithm can solve all optimization issues, allowing scientists to propose new or improve existing algorithms to solve optimization challenges. The NFL theorem states that while current algorithms in literature can solve a wide range of optimization problems, they cannot solve all optimization problems. It has become popular to combine two or more algorithms instead of creating novel optimization techniques. This approach, known as algorithm hybridization, can overcome the limitations of one algorithm by leveraging the advantages of another algorithm.
This paper presents a study on optimizing FRP truss structures under natural frequency constraints with the hybridization of CS [30] and SPO [31] as a novel metaheuristic algorithm. The study’s main objective is to determine the optimal design parameters that satisfy the natural frequency limitations while minimizing the weight of the truss with CSSPO. The paper’s novel contributions are as follows:
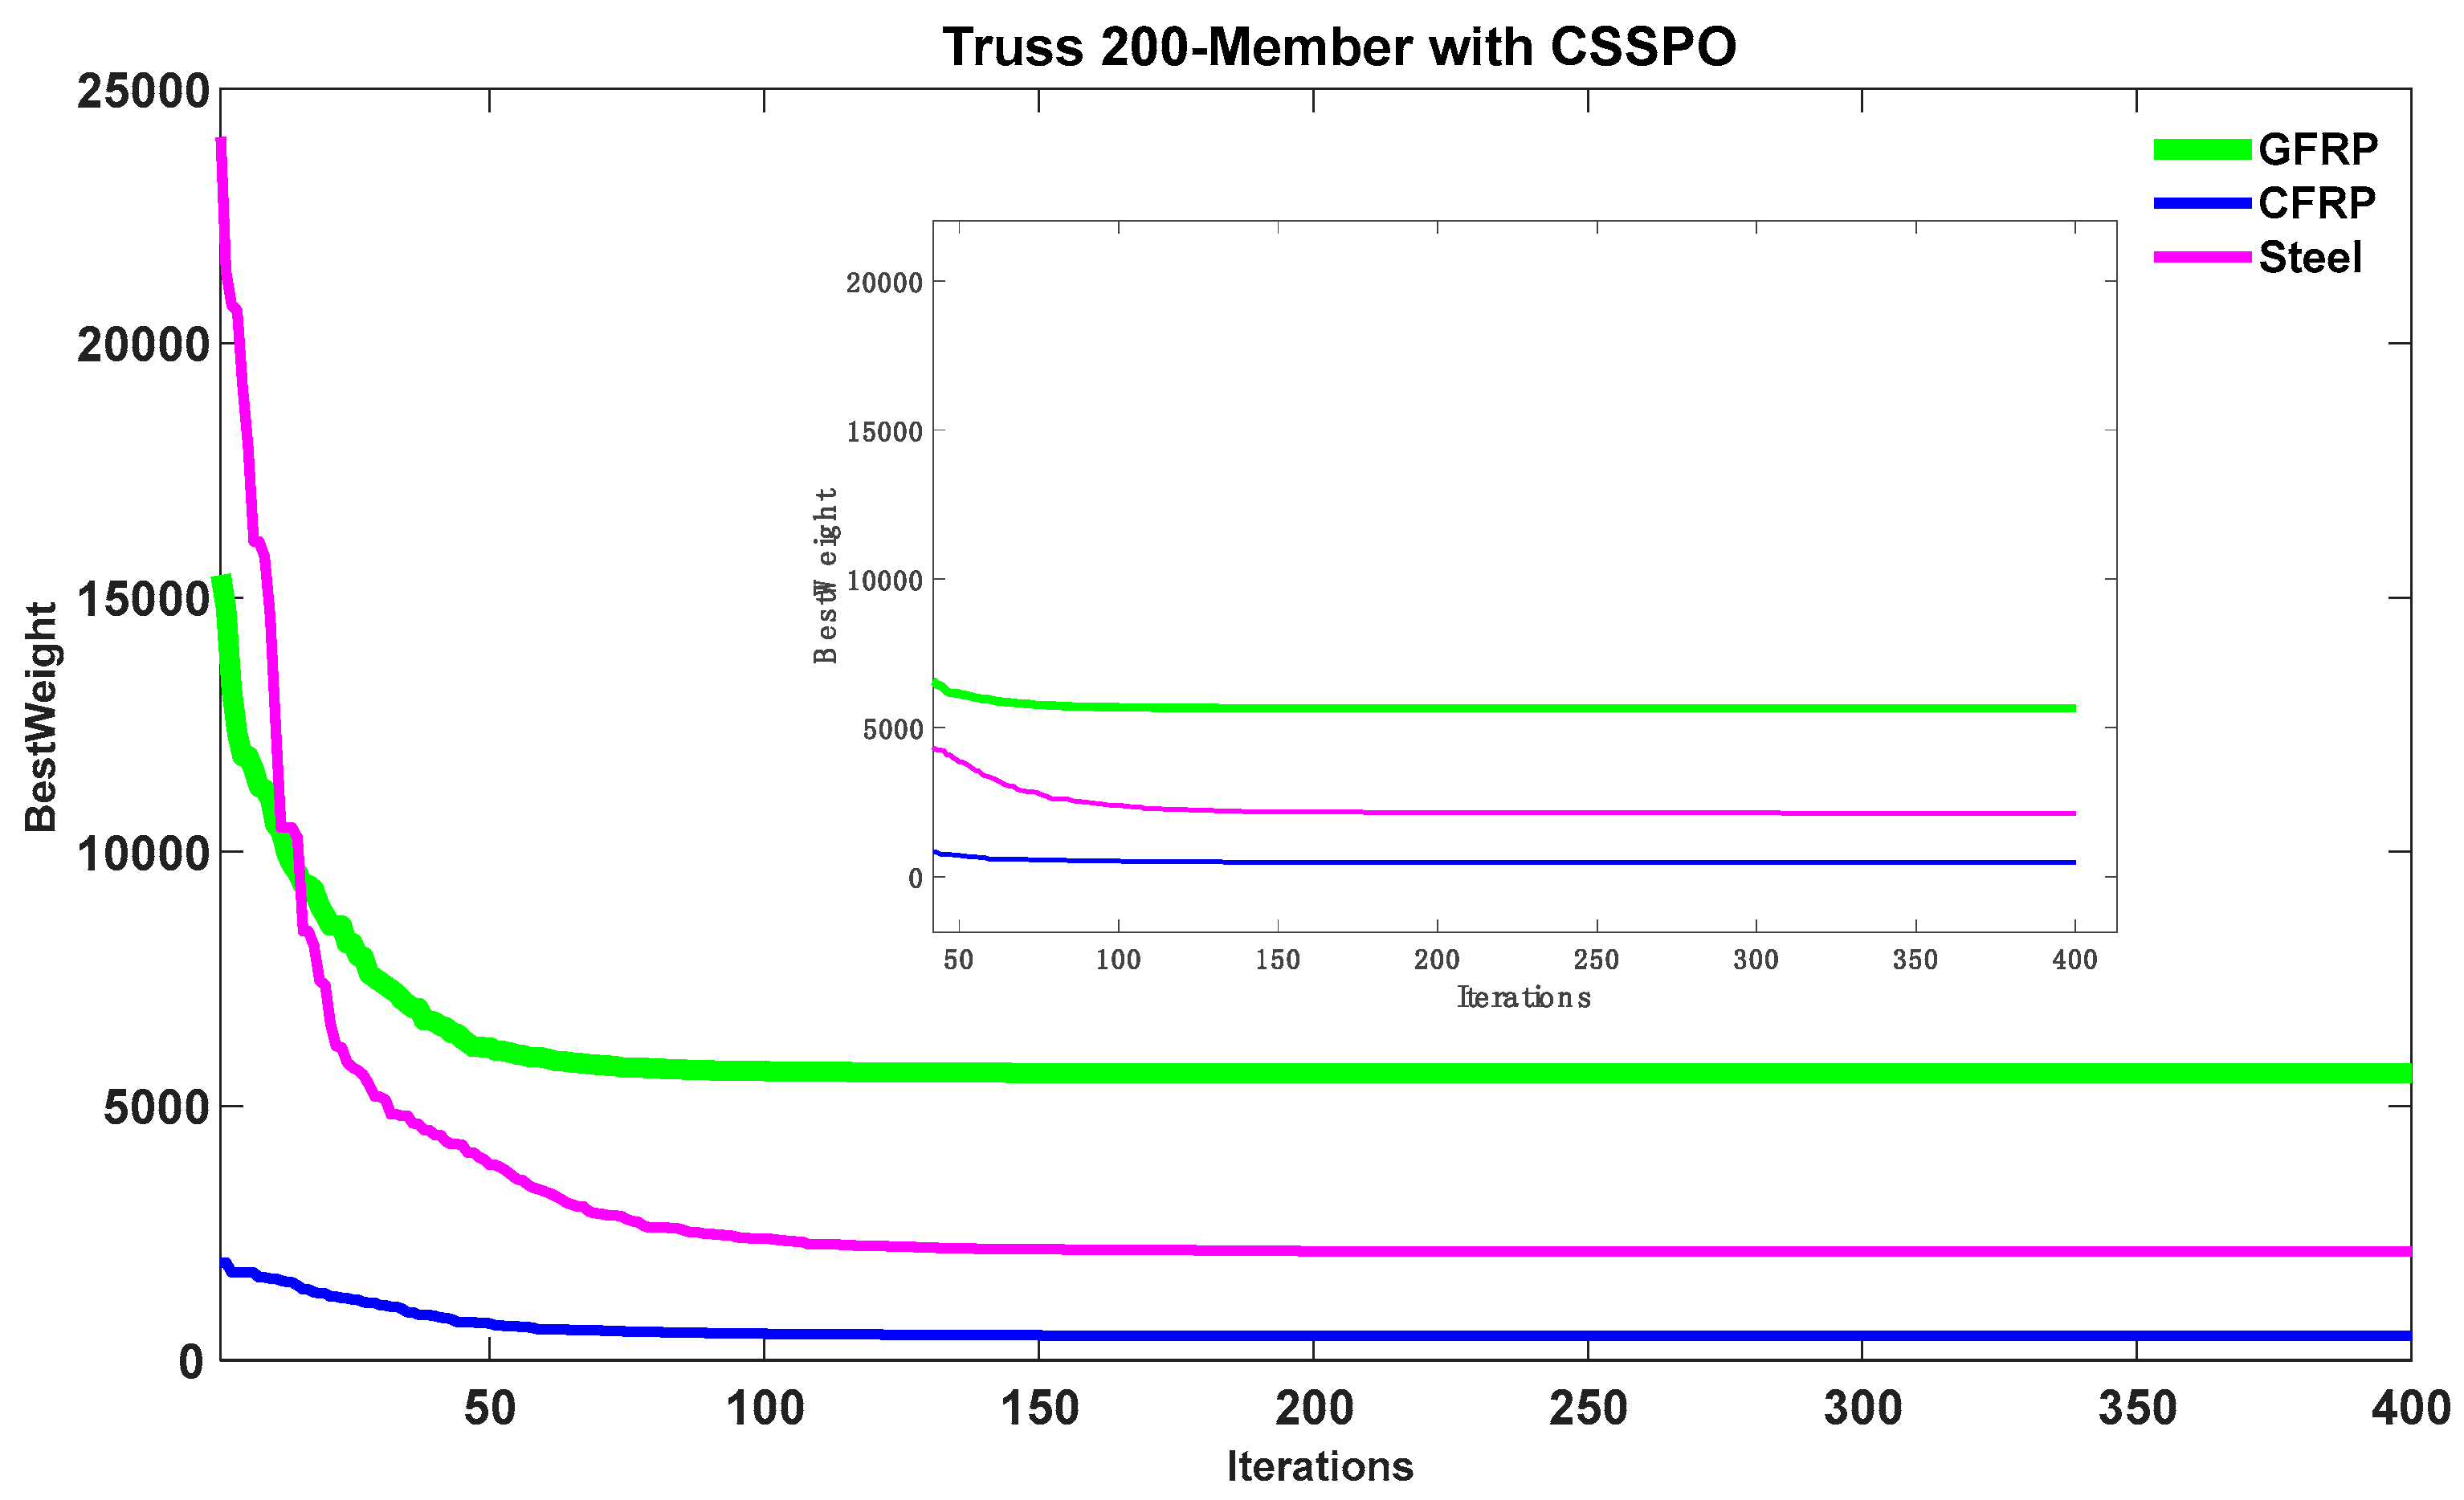
  • The study compared truss structures made of various materials (i.e., CFRP, GFRP, and steel).
  • The study used composite material for the optimization of truss design for the first time.
  • A novel hybrid of the SPO algorithm called the CSSPO was created, and its strength and robustness were validated by optimizing through the optimization of four different truss structures.
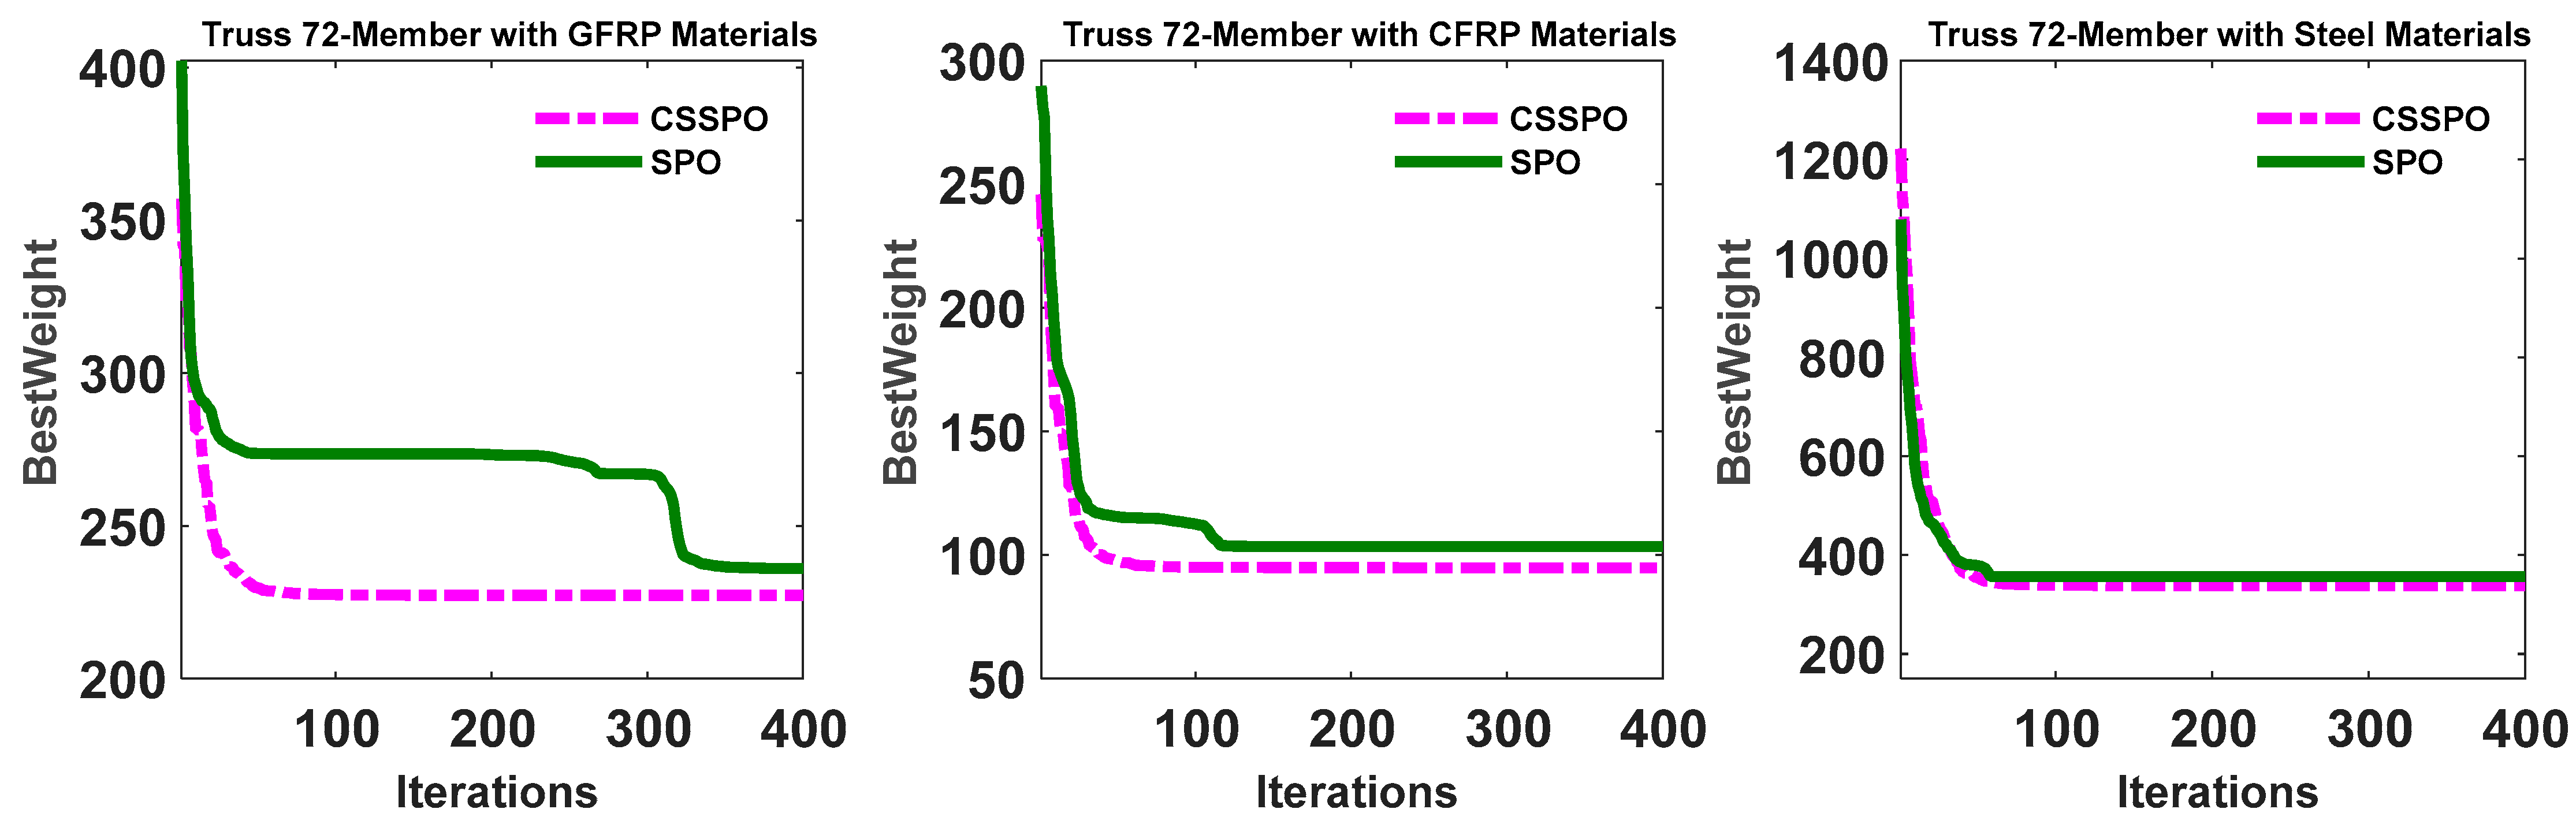
  • The CSSPO algorithm was shown to outperform the original SPO algorithm.
  • Truss structures made of composite materials resulted in a lighter weight.
The remaining sections of this paper are organized in the following manner: the different types of FRPs are briefly described in Section 2. Section 3 explains the terms related to the definition of truss structures. Section 4 presents the standard SPO and CS and introduces the CSSPO algorithm. Section 5 discusses the results and evaluations of the experiments carried out on four structure problems. Section 6 explains the statical results for all examples. Finally, Section 7 concludes the paper and discusses future work.

2. Composite Materials

Over the past few decades, pultruded fiber-reinforced polymer (FRP) elements have been widely employed in the construction of civil structures due to their numerous advantages. These advantages include a higher strength-to-weight ratio, corrosion-free properties, durability, and lower maintenance. Within the realm of truss structures, FRP materials are gaining some popularity due to their consideration of sustainability. The main benefits are their high strength-to-weight ratio, corrosion resistance, and durability [22]. FRP composites can be created using a variety of fibers, including glass, carbon, aramid, basalt, and resins such as epoxy, polyester, and vinyl ester. The choice of fibers and resins depends primarily on the desired outcome and the cost of the FRP products. While FRP composites possess different mechanical properties, they are often used as replacements for traditional steel or concrete structures in harsh environments [32]. Carbon and glass fibers are the most used in civil engineering applications.

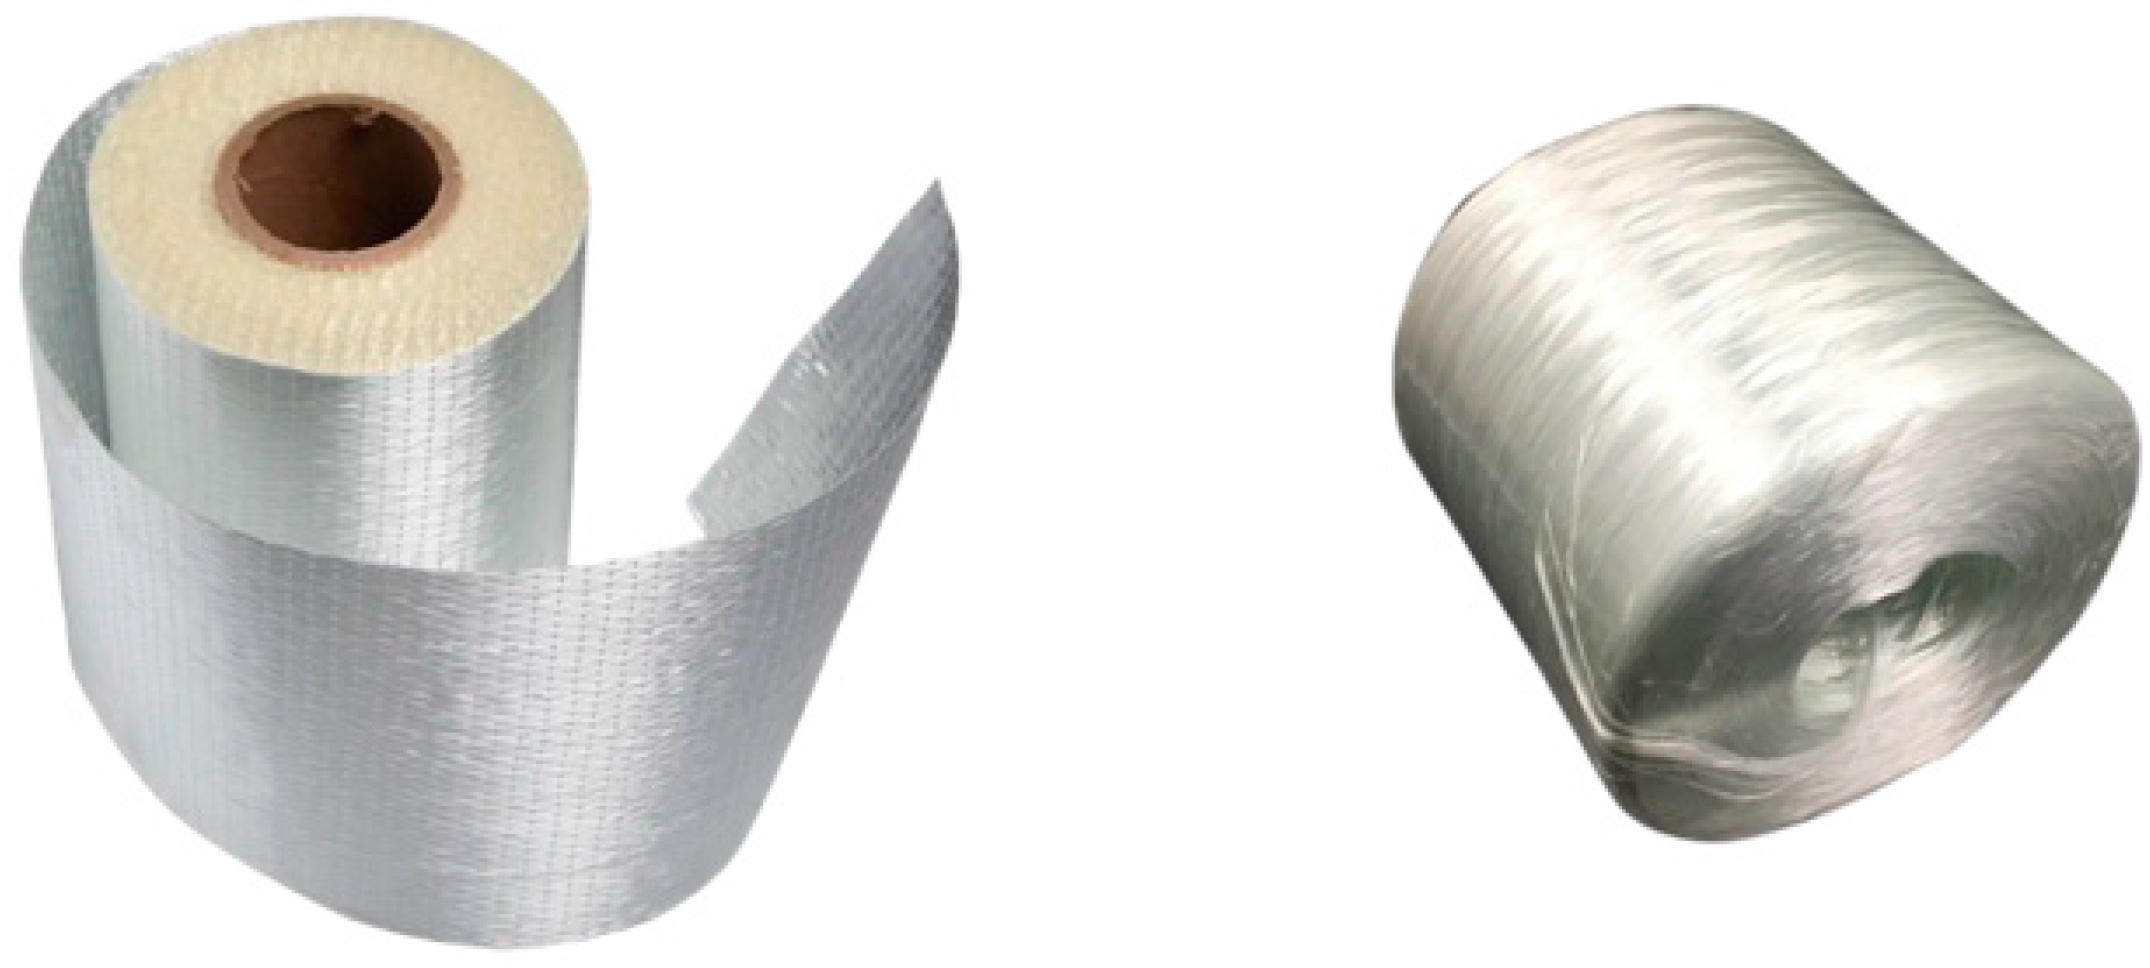
2.1. Glass Fiber Reinforced Polymer (GFRP)

Glass fiber, shown in Figure 1, is the most used fiber in FRP composites. Although it generally possesses lower mechanical properties than carbon and aramid fibers, it is significantly less expensive than carbon when utilized as a reinforcement in polymer composites. Glass fibers are offered in different variants, namely the S-type (structural type), which exhibits superior strength compared to other types, the E-type (electrical type), which has low alkali material, high mechanical characteristics, and is cost-effective, and the C-type (chemical resistance type), which demonstrates high resistance to corrosion and chemicals [33]. Glass fiber is characterized by its anti-corrosion properties, affordability, and high tensile strength. Nonetheless, it is important to note that the utilization of glass fibers is subject to certain constraints. These include comparatively inadequate mechanical properties in comparison to other fibers, such as carbon and aramid fibers, as well as reduced stiffness, low fatigue resilience, and susceptibility to chemicals in severe hygrothermal environments.

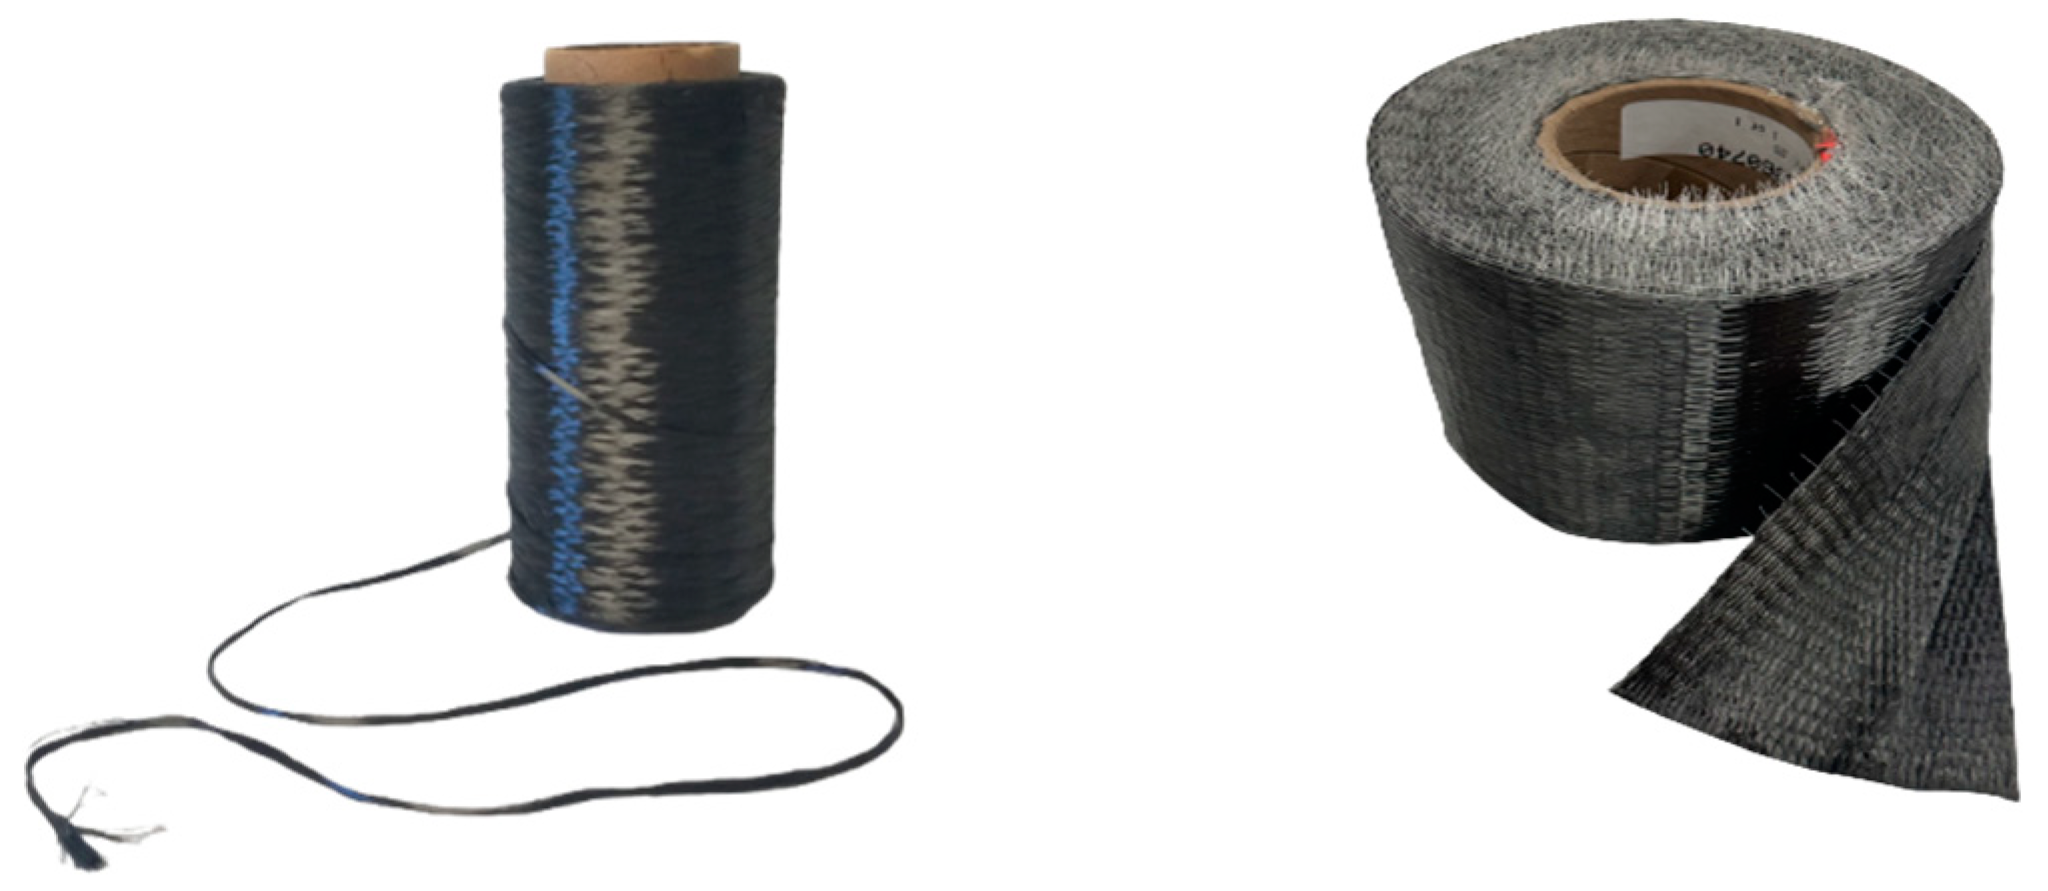
2.2. Carbon Fiber Reinforced Polymer (CFRP)
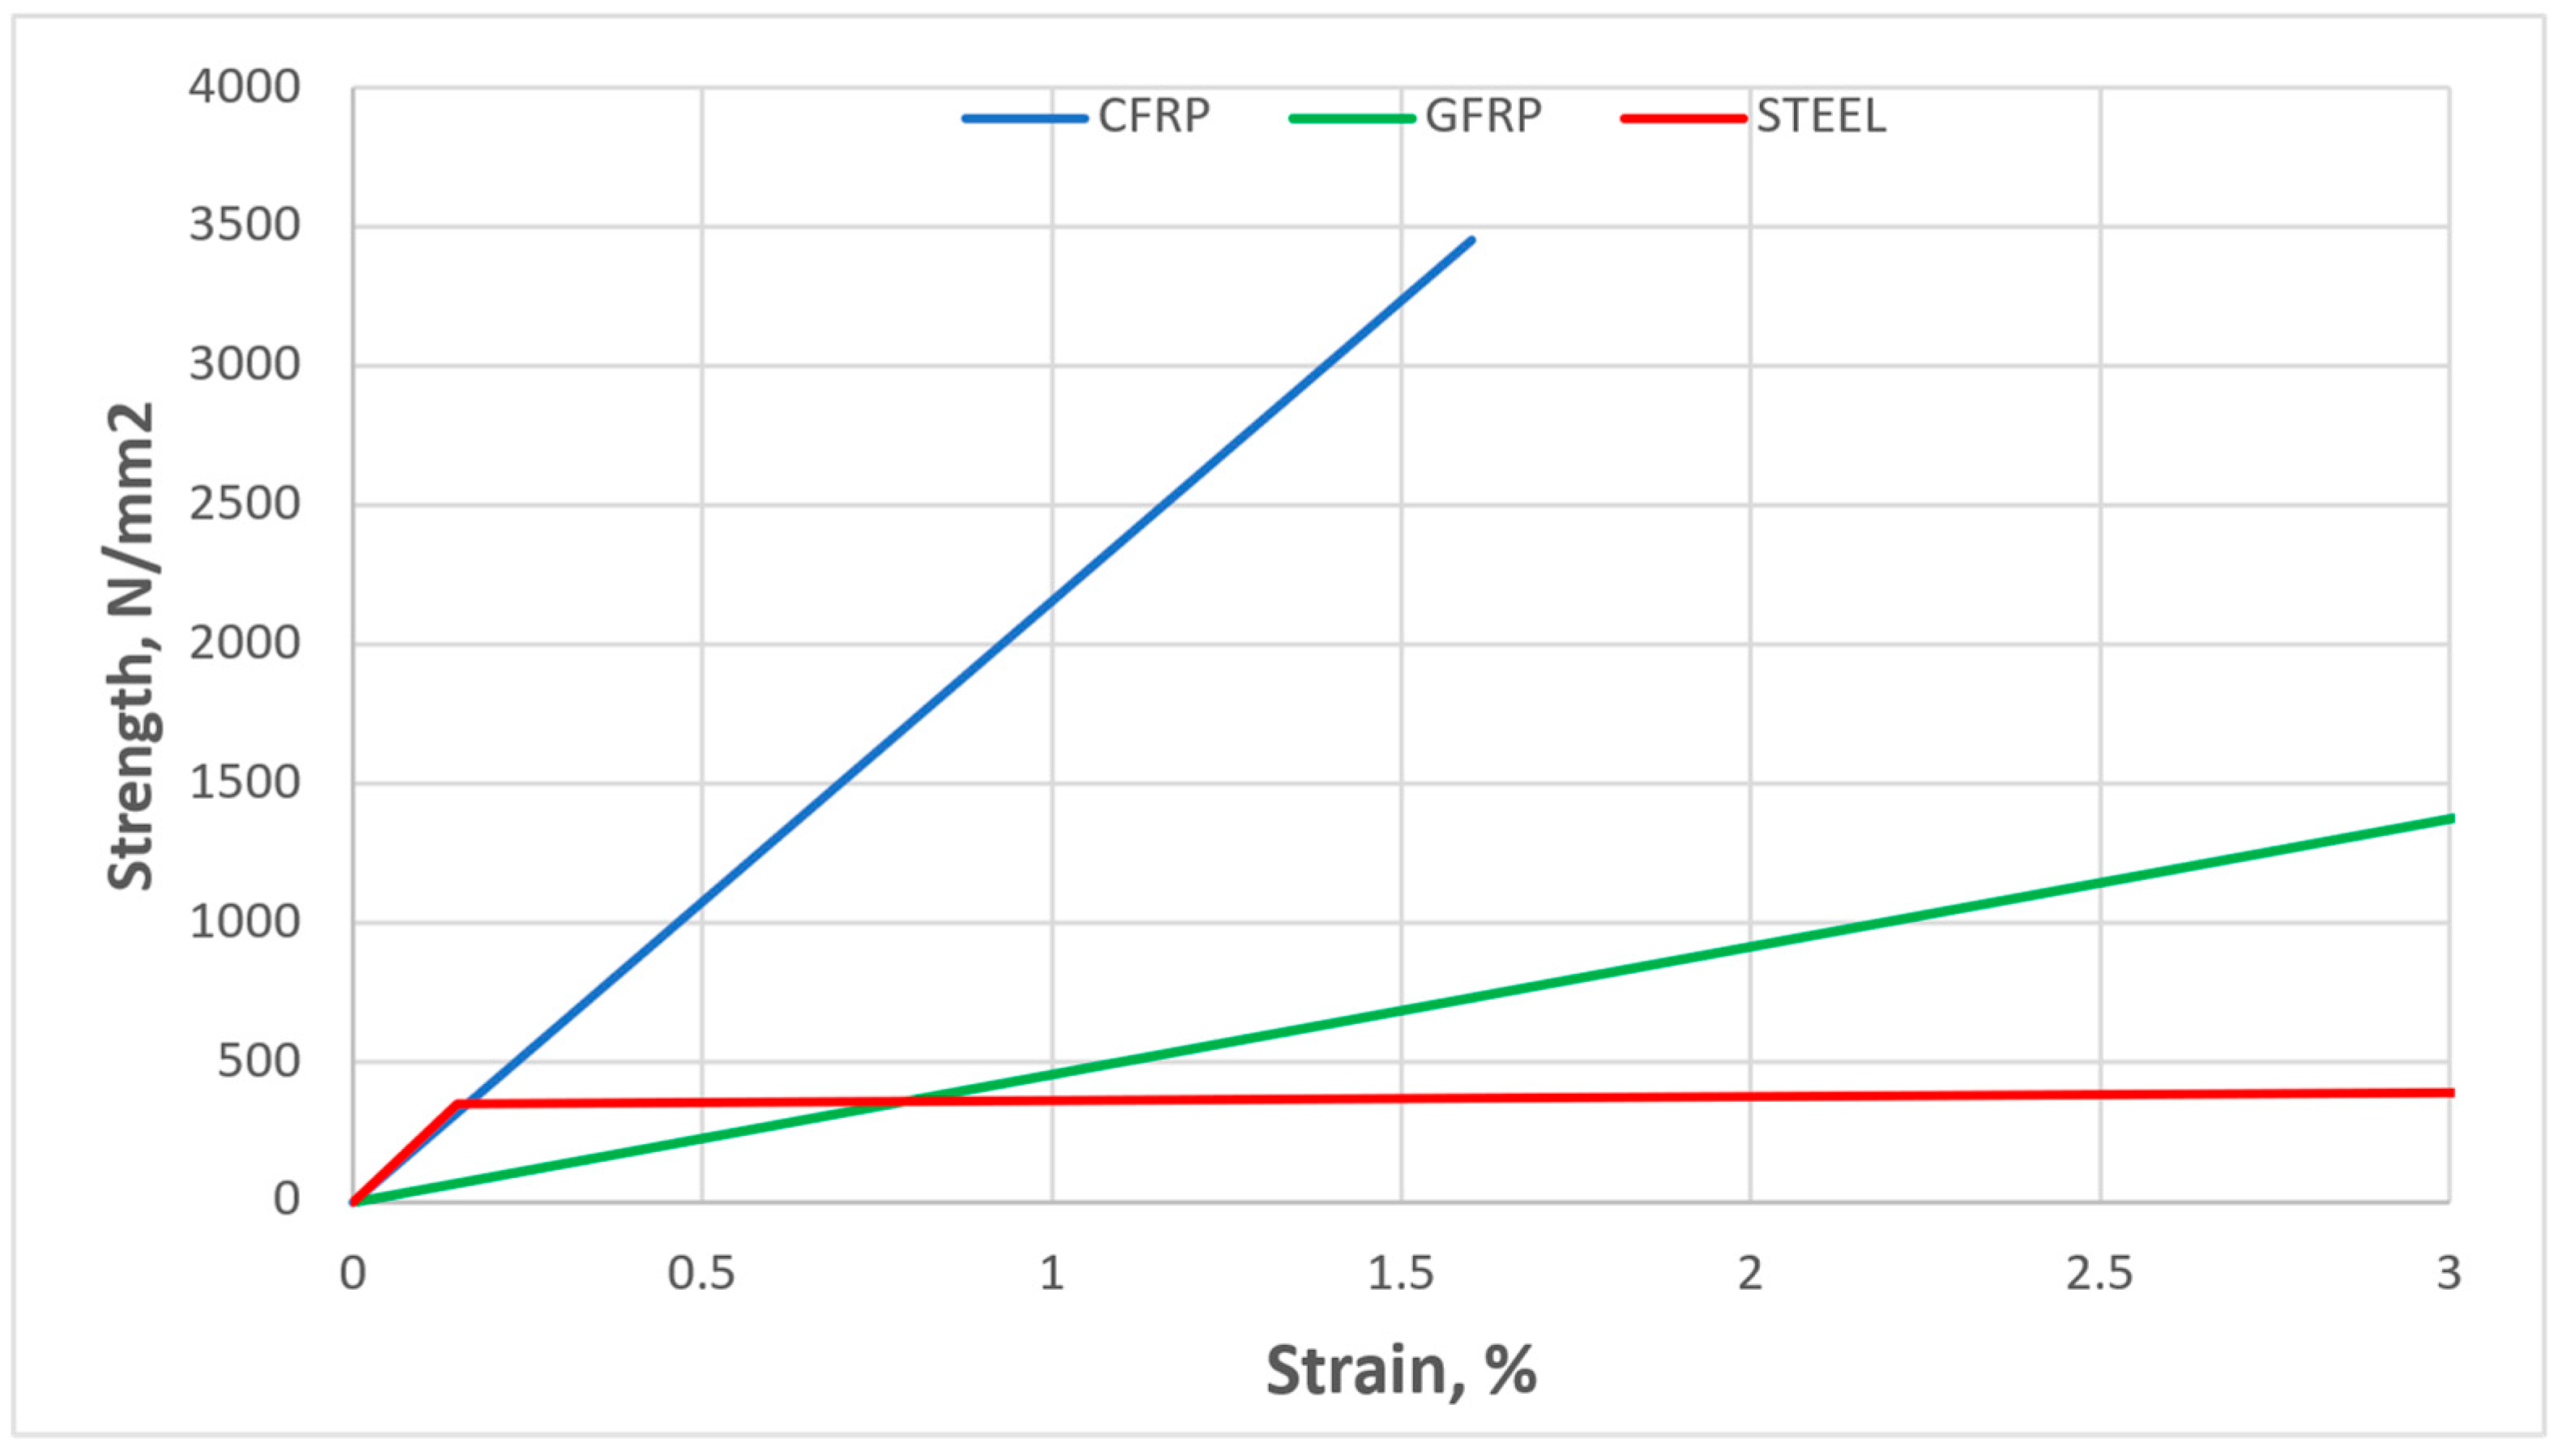
The utilization of carbon fibers is mainly found in sophisticated composite applications and aerospace, owing to their exceptional stiffness and strength-to-weight ratio (refer to Figure 2). These materials exhibit resistance to elevated temperatures, fatigue, corrosion, and chemical breakdown. The mechanical characteristics of carbon fibers may exhibit significant variability based on the raw materials utilized in the production process. The essential characteristics of carbon fibers include elevated tensile strength-to-weight ratio, elevated tensile stiffness-to-weight ratio, improved resistance to fatigue and stress rupture, high dimensional stability, low abrasion, a low coefficient of thermal expansion, effective vibration damping, high resistance to corrosion, and chemical inertness. While carbon fibers possess numerous advantages, they also have some disadvantages, such as high cost, low strain to failure, electrical conductivity, electromagnetic properties, and limited potential use in specific applications [34].
The characteristics of FRP materials are subject to considerable variation based on their distinct formulation, components, and production techniques. Typical and idealized GFRP, CFRP, and steel stress–strain curves are illustrated in Figure 3, while the density and modulus of elasticity, as adopted in this study, are shown in Table 1.

2.3. FRP Properties

FRP materials have a low density, resulting in a high strength-to-weight ratio, which is highly significant in transportation and various structural applications. Compared to steel, CFRP and GFRP possess strength-to-weight ratios several times higher and are also lighter. In summary, the distinct characteristics of FRP, including its high strength-to-weight ratio and low density, offer advantages in handling, transportation, and insulation. These features play a significant role in reducing the weight of truss structures [33].
Compared to steel structures, FRP composites also have a higher stiffness-to-weight ratio, making them a preferred material for truss bridge structures [33]. However, deflection is the main outstanding issue for FRP trusses and space frames that need to withstand heavy loads.
Considering aging infrastructure, exploring and implementing innovative materials to extend these structures’ lifespan is crucial. New resin formulations and fibers are being developed with the aim of creating enhanced materials that can endure challenging environmental and loading circumstances. Despite the potential benefits of FRP composites, their limited fire resistance remains a significant concern that hinders their widespread application.

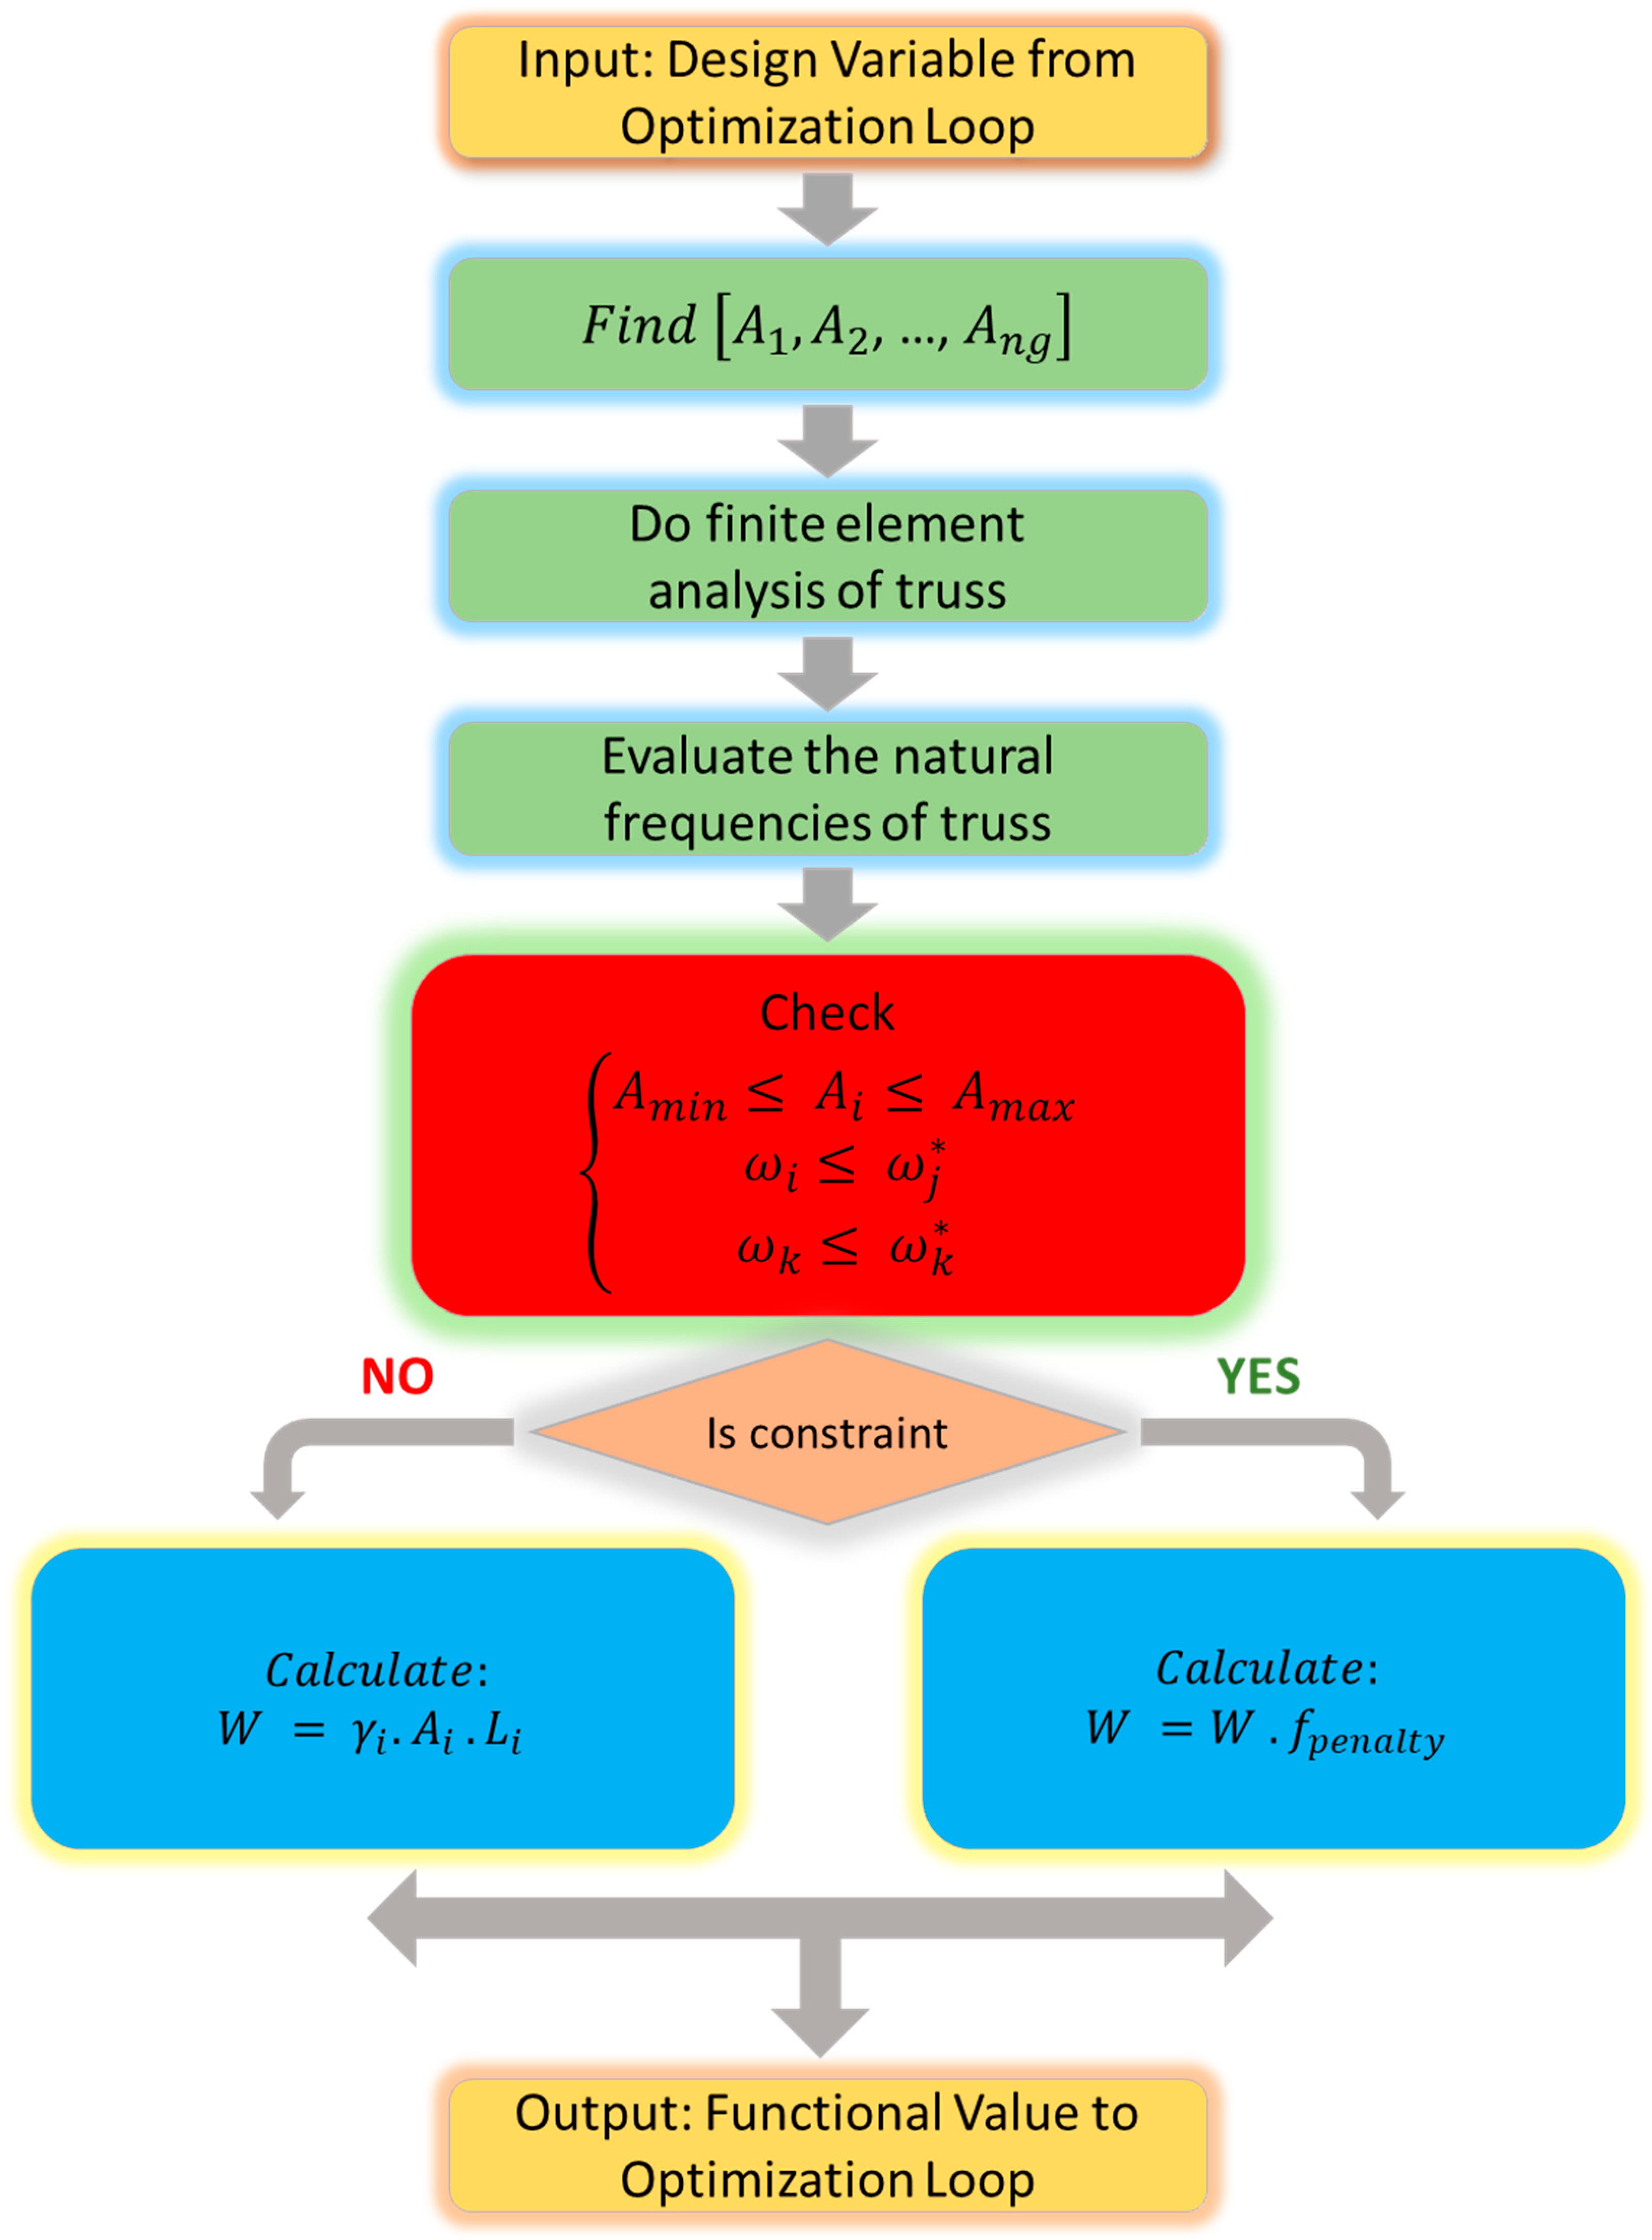
3. Definition of Truss Structures Optimization

This section describes the development of an optimization formulation for truss structures with multiple constraints on natural frequencies. Figure 4 presents a flowchart of the truss optimization problem. Optimizing truss structures involves determining the optimal cross-sectional ( A i ) values to minimize the weight ( W ) of the structure. The resulting design must meet the following criteria [35]:
    F i n d                                                       [ x 1 ,     x 2 ,   ,   x n g ]
M i n i m i z e         W ( { x } ) = i = 1 n m γ i · A i · L i ( x )
S u b j e c t e d   t o             { x min x i x max ω j ω j * ω k ω k *
In the above Equation, { X } represents the set of design variables, while ng specifies the number of design variables and n m indicates the range of structural members. The structure’s weight is denoted by W ( { x } ) , and the members’ material density, length, and cross-sectional area are represented by γ i , L i and x i , respectively. The jth and kth natural frequencies of the truss are stated as ω j (with an upper bound of ω j * ) and ω k (with a lower bound of ω k * ).
The ideal function for addressing the constraints arising from the fundamental principle and ease of implementation is commonly known as:
f p e n a l t y ( X ) = ( 1 + ε 1 · ν ) ε 2
ν = i = 1 n max   [ 0 , ν i ]
In the equation, ν denotes the total number of violated constraints, while the constants ε 1 and ε 2 are chosen to balance the exploration and exploitation rates of the search space. In this scenario, ε 1 is assigned a value of 1, while ε 2 is selected to decrease both penalties and cross-sections. At the outset of the search process, ε 2 is initialized to 1.5 and is then gradually increased to 3, as described in [36].

4. Methodology

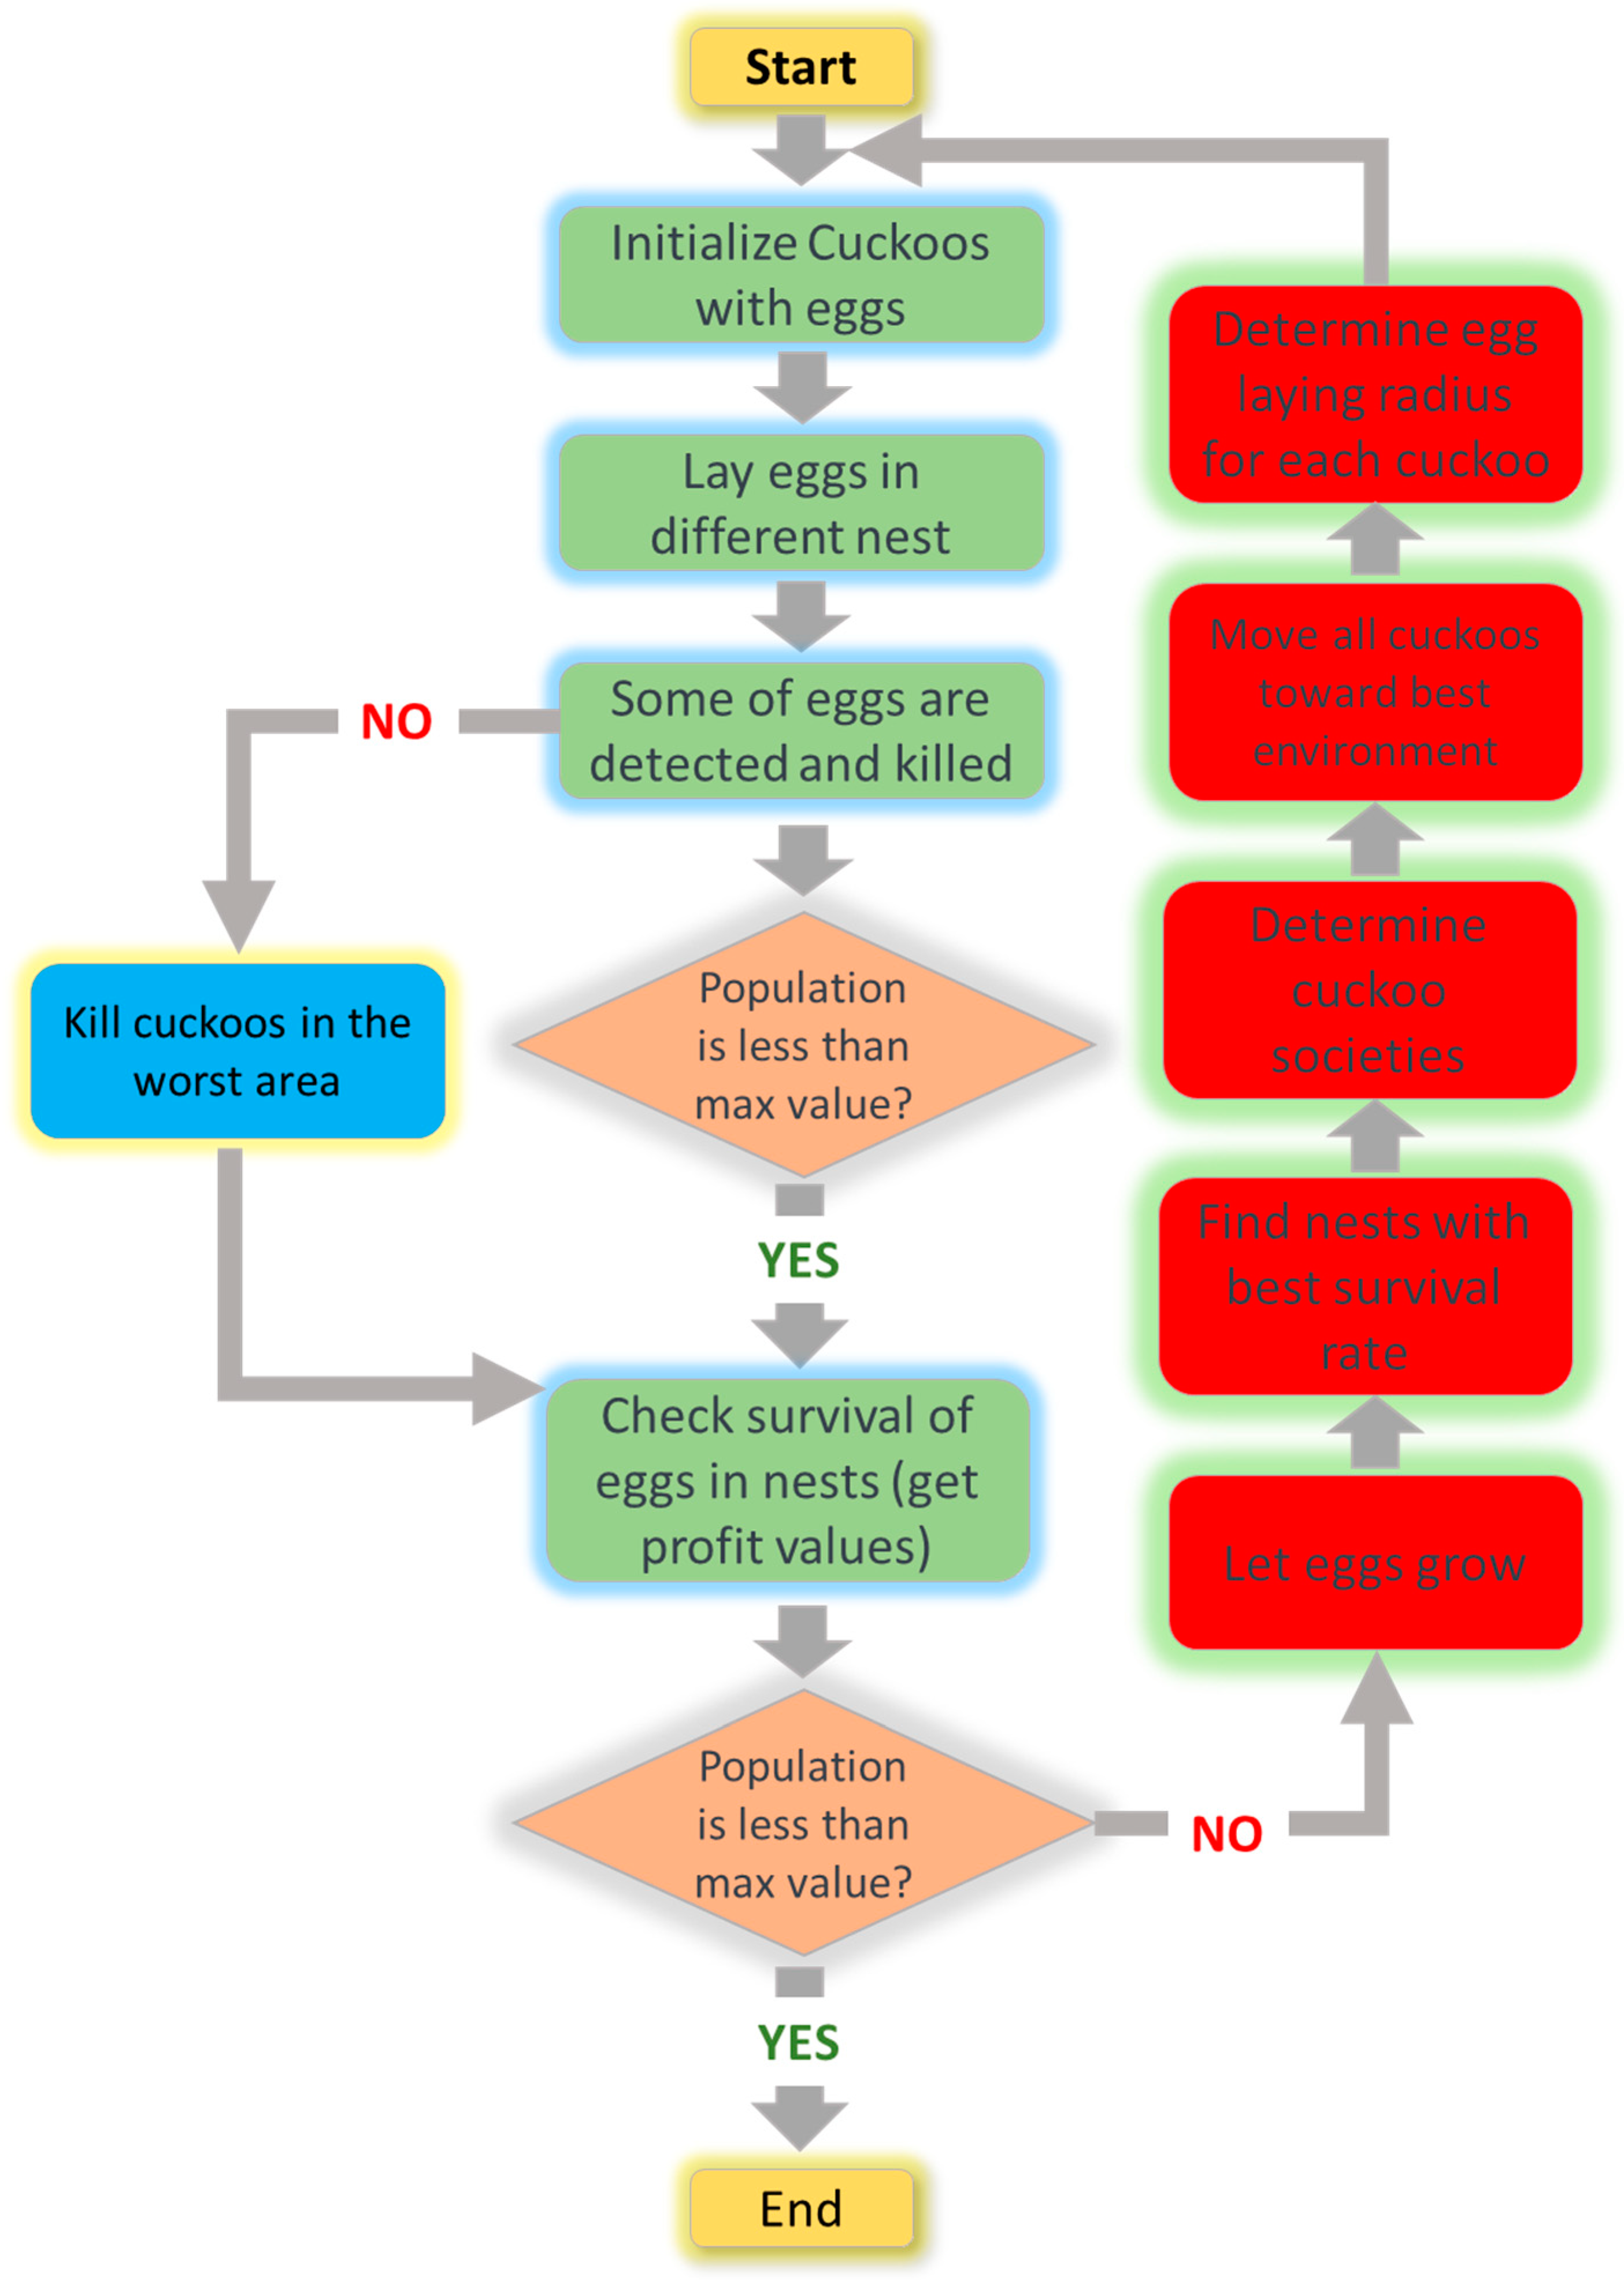
4.1. Cuckoo Search (CS)

The Cuckoo Search (CS) algorithm is a metaheuristic technique that draws inspiration from nature. It was originally created by Yang and Deb [30]. The methodology is founded on the brood parasitic behavior that has been observed in certain species of cuckoos. Cuckoos are a fascinating avian species, notable not only for their melodious vocalizations but also for their extremely aggressive reproductive tactics. Certain species, such as the ani and Guira cuckoos, exhibit communal nesting behavior and may engage in the removal of foreign eggs to enhance the likelihood of successful hatching. The cuckoo search algorithm is founded upon three fundamental principles. Initially, it is important to note that each individual cuckoo lays a single egg at a time and subsequently places it within a nest at randomly. Next, the nests containing eggs of superior quality are chosen for the succeeding generation. The quantity of host nests currently available is established and remains constant. Figure 5 shows the flowchart of the cuckoo search algorithm. The likelihood of a host bird discovering a cuckoo’s egg is determined by a probability value that falls within the range of 0 to 1 [37].
An initial population of host nest positions, M = [ X 1 ; X 2 ; X 3 ; ; X m ] , is generated in a random distribution throughout the multi-dimensional host nest. Each solution X is represented by a D -dimensional vector. The cuckoo then randomly selects a host nest position to deposit its egg, using a random walk known as Levy flights. The equations for this process are given in Equations (6) and (7).
V p q t + 1 = V p q t + S p q × L e v y ( λ ) × α
L e v y ( λ ) = |   Γ ( 1 + λ ) sin Π λ 2 Γ 1 + λ 2 λ 2 1 λ 2   | 1 λ
In the equations given above, p , f , and q are randomly selected indices from the sets { 1 ,   2 ,   ,   m } ,   { 1 ,   ,   m } , and { 1 ,   2 ,   ,   D } , respectively. Here, D represents the number of optimized parameters, while m represents the total population of host nest positions. The constant value, denoted by A , is used where 1     λ     3 . The current generation number is represented by t , and a is a randomly generated number that falls within the range of 1   t o   1 . Additionally, s > 0 represents the step size. The choice of an appropriate step size is crucial, as a large value will generate a new solution that is too far away from the previous solution, while a small value will produce a change that is not significant enough to improve the search efficiency. Therefore, the step size is calculated using Equation (8).
S p q = V p q t V f q t
The cuckoo uses Equation (8) to determine the appropriate step size and select a host nest to lay its egg. After the egg is laid, it is evaluated. The host bird then uses Equation (9) to determine the likelihood of identifying an alien egg based on the quality associated with that particular egg.
P r o p = 0.9 F ( I ) m a x   ( F i t ) + 0.1
In Equation (9), F ( I ) represents the fitness value of solution p , which is proportional to the quality of the egg in the nest position p . The value P r o p represents the survival probability rate of the cuckoo’s egg. If a random probability value P that falls within the range of [ 0 ,   1 ] is greater than P r o p , the host bird identifies the egg as alien and proceeds to destroy it or abandon the nest. In this case, the cuckoo must find a new host’s nest, located in a new position, using Equation (10) in order to lay its egg. If the probability value P is less than or equal to P r o p , the egg survives and remains in the nest to contribute to the next generation based on the fitness function.
X p = X P m i n   + r a n d ( 0 ,   1 ) ( X P m a x X P m i n )
X P m i n and X P m a x   refer to the lower and upper boundaries, respectively, of the parameters that are being optimized.

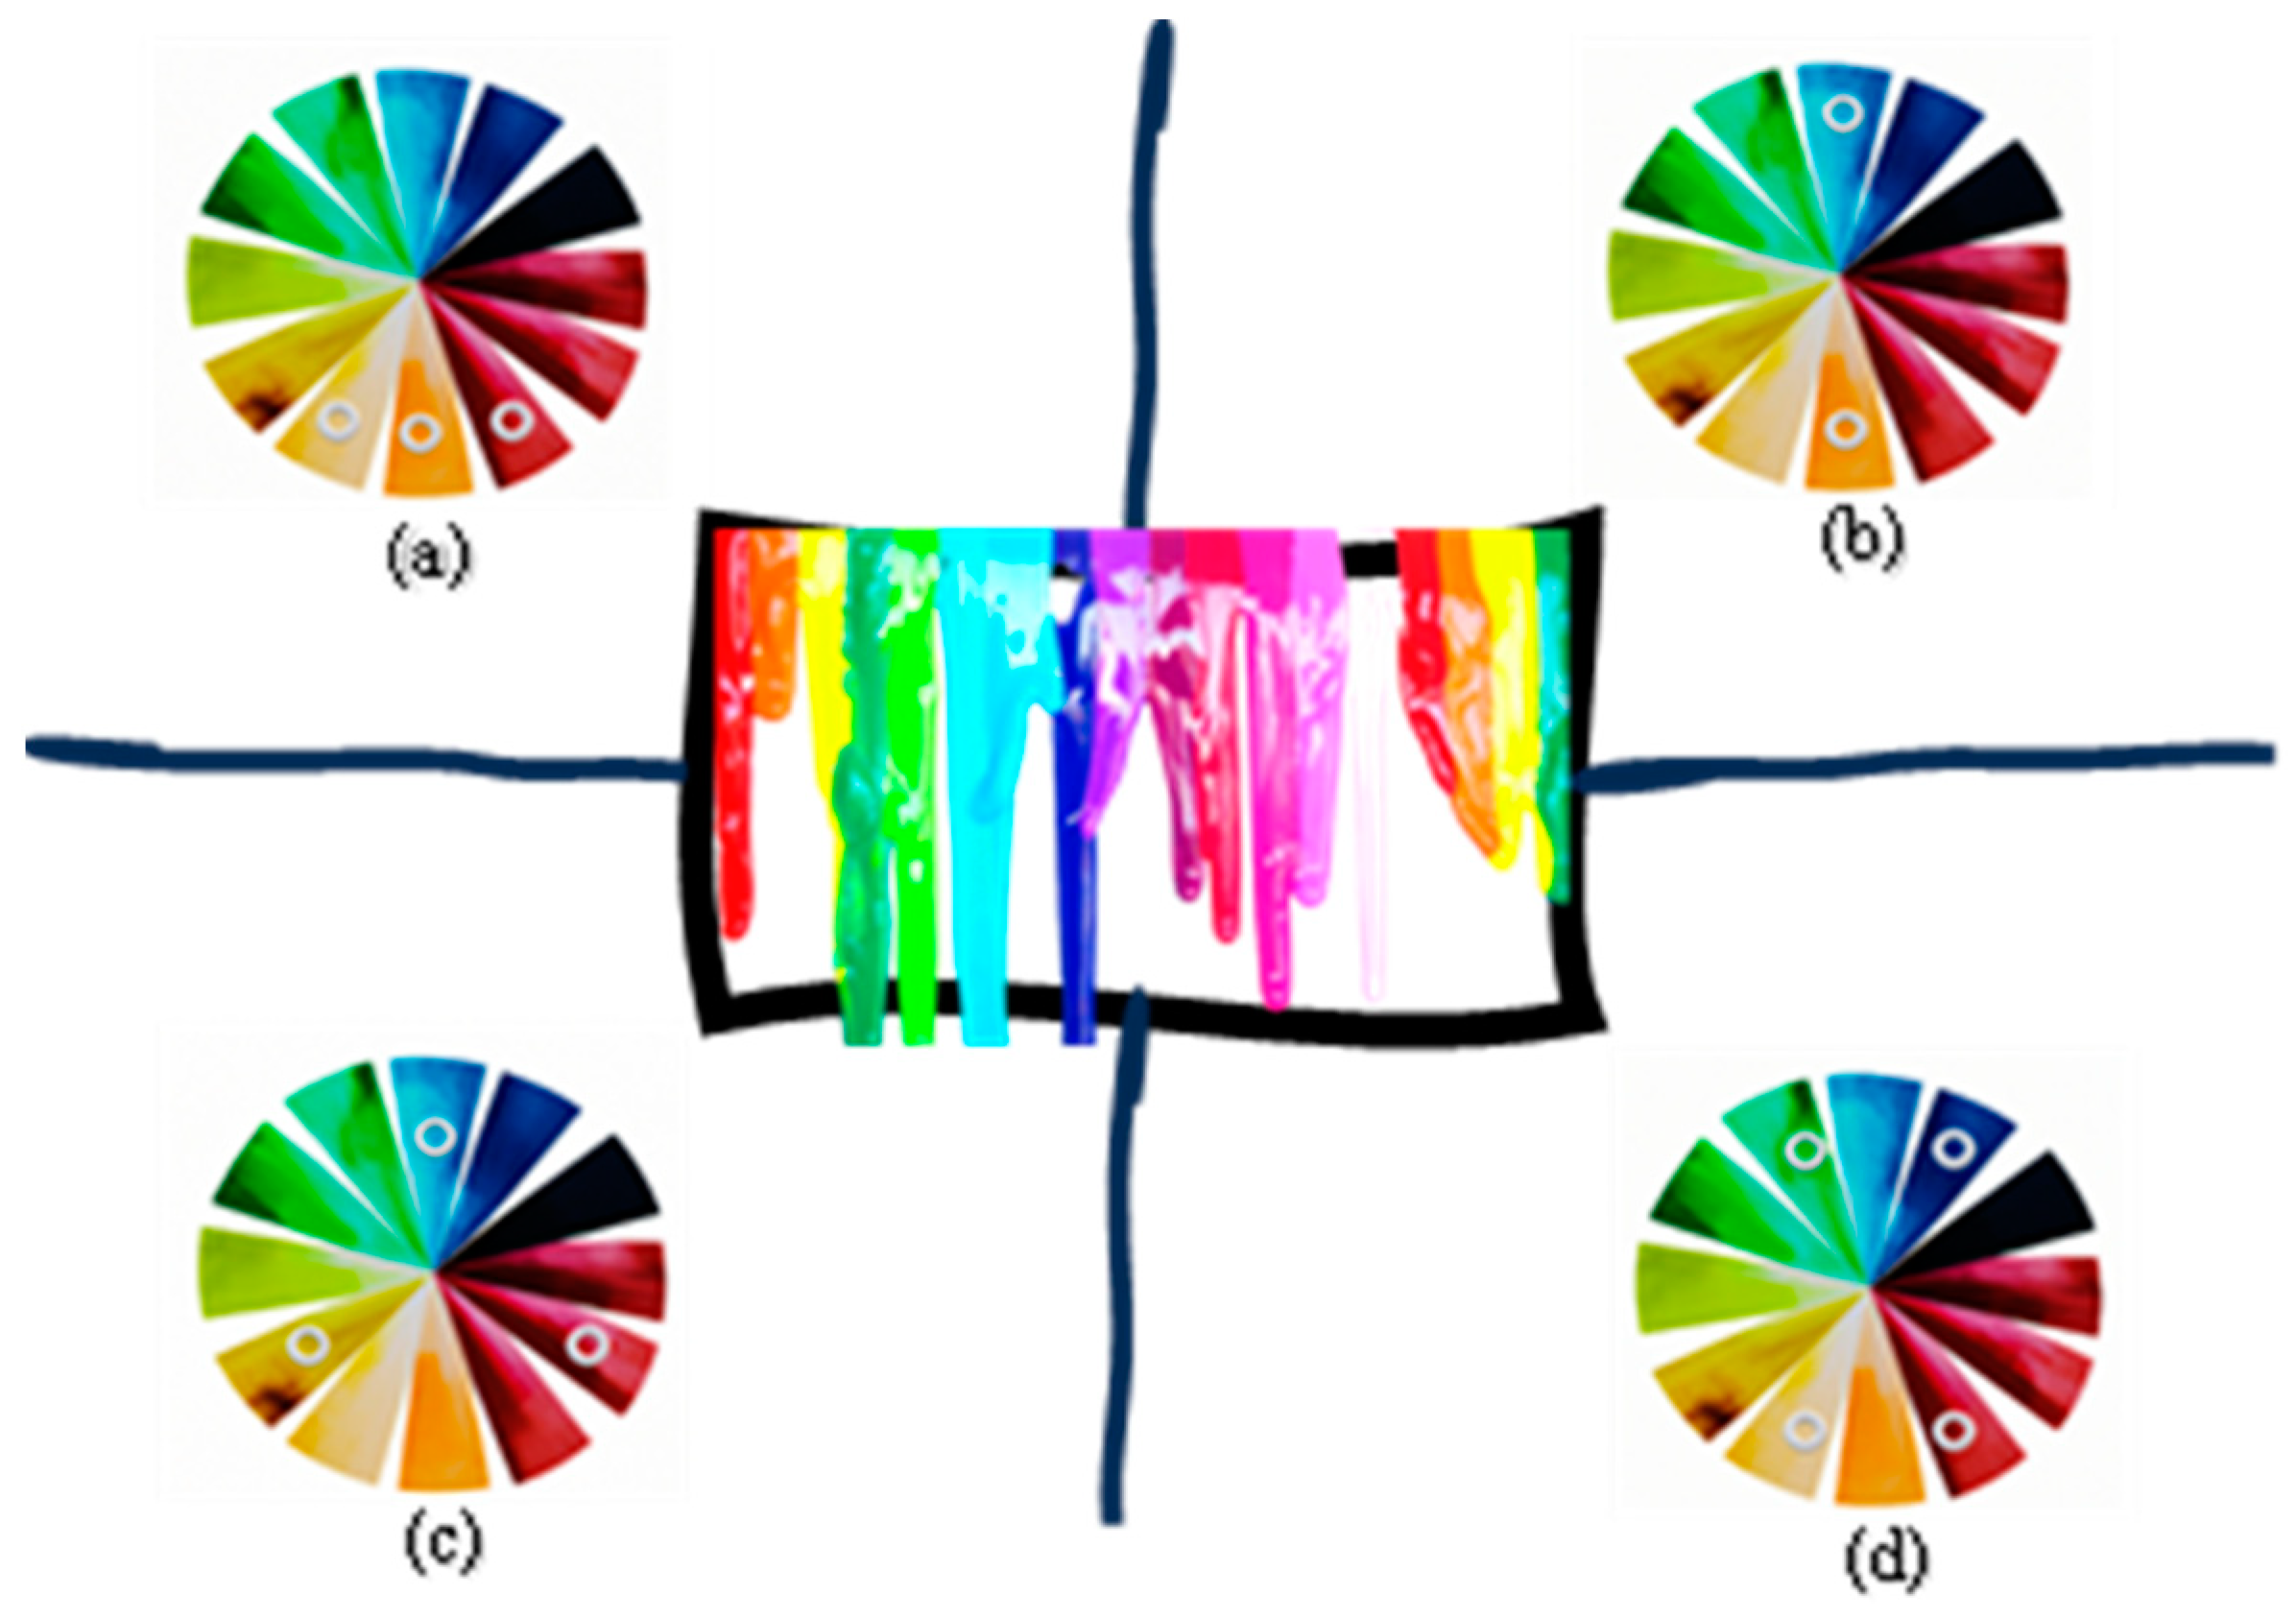
4.2. Stochastic Paint Optimizer (SPO)

The Stochastic Paint Optimizer (SPO) [38] is a metaheuristic technique that was first created in 2020. It leverages color theory to optimize artwork. The algorithm involves several key steps, including generating initial paints, clustering, merging, and determining when to stop. The search space in the algorithm is defined as a canvas, with paints serving as solutions that comprise various colors as design variables. These paints are evaluated based on their beauty index, which reflects their objective function values. Since colors significantly impact how viewers perceive artwork, each color is assigned a score or value based on its position in the color wheel’s primary, secondary, or tertiary categories. These categories are considered equal; therefore, no additional parameters are necessary for the algorithm. To create a new population, the SPO algorithm combines stochastic solutions, where colors are blended to form a new one [38]. The diagram depicted in Figure 6 illustrates four fundamental methods of color combination that are based on the principle of the color wheel. Each of these techniques has the ability to generate novel colors ( C i n e w ).
The following sections will provide a description and explanation of the mathematical concepts employed in the SPO for the purpose of simulating color combination patterns.

4.2.1. Analogous Combination Technique

Mixing of three adjacent colors on the color wheel, as depicted in Figure 6a, is utilized to achieve this color mixing technique. The SPO employs the following equation to accomplish this:
C n e w 1 = C i + r a n d · ( C i + 1 C i 1 )
The variables C i 1 , C i , and C i + 1 denote three solutions selected from the population, while r a n d is a randomly generated vector within the domain of [0, 1].

4.2.2. Complementary Combination Technique

Complementary colors are employed when blending colors using this method, as illustrated in Figure 6b. To replicate this process in the SPO, a primary color C P , a tertiary color ( C T ) , and an already-existing color C i are randomly selected. Equation (12) is employed to achieve this outcome.
C n e w 2 = C i + r a n d · ( C P C T )
The symbols used in the equation correspond to the following: C P refers to a primary color, C T signifies a tertiary color, C i denotes an already existing color, and rand represents a vector that is randomly generated within the interval of [0, 1].

4.2.3. Triadic Combination Technique

The approach involves producing novel colors by blending the evenly spaced colors around the color wheel (see Figure 6c). In the SPO, this is accomplished through the following method:
C n e w 3 = C i + r a n d · ( C P + C S + C T 3 )
The variables used in the equation correspond to the following: C P signifies a primary color, C S represents a secondary color, C T denotes a tertiary color, C i refers to an existing color, and r a n d represents a vector that is randomly generated within the range of [0, 1].

4.2.4. Tetradic Combination Technique

This color blending technique selects four complementary colors from rectangular arrangements on the color wheel, as shown in Figure 6d. The SPO implements this approach through the use of Equation (14):
C n e w 4 = C i + ( r a n d 1 · C P + r a n d 2 · C S + r a n d 3 · C T + r a n d 4 · C r a n d 4 )
C r a n d = L B + r a n d · ( U B L B )
where LB and UB represent the minimum and maximum bounds of the design variable, and r a n d 1 , r a n d 2 , r a n d 3 , and r a n d 4 are four random vectors within the range [0, 1]. The stochastic paint optimizer flowchart algorithm is illustrated in Figure 7.

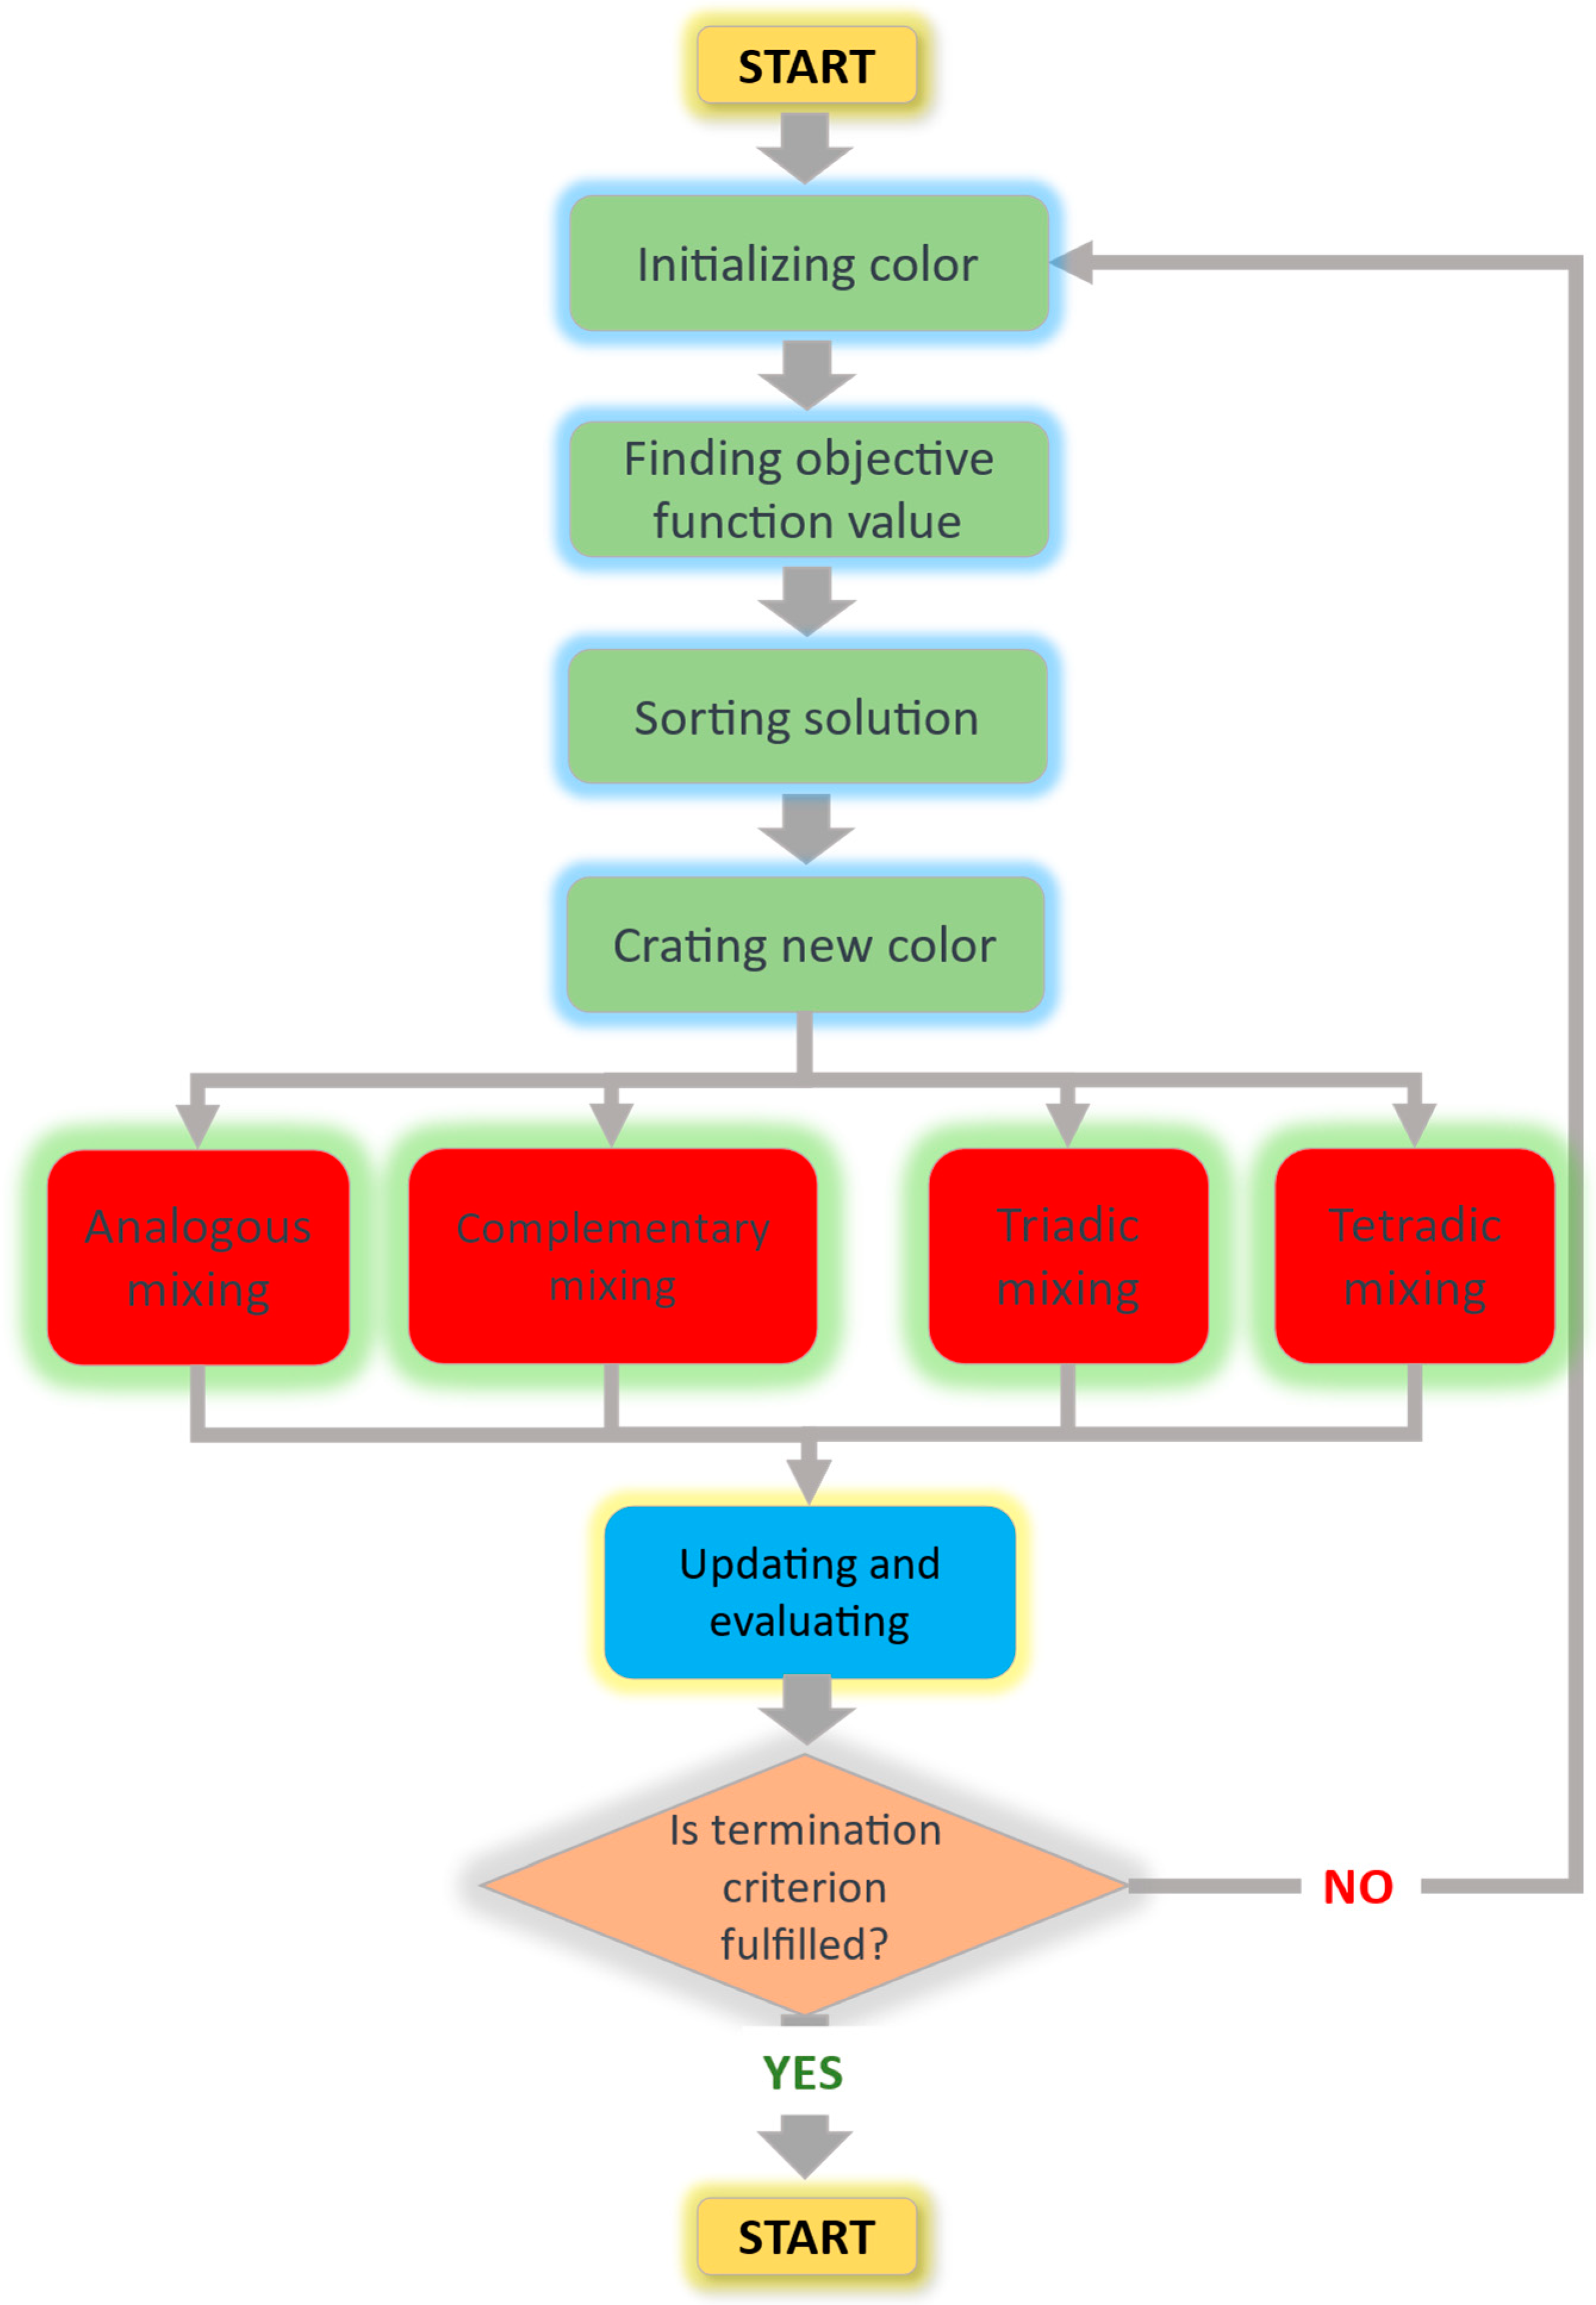
4.3. The Hybrid of Cuckoo Search-Stochastic Paint Optimizer (CSSPO)

The CSSPO algorithm uses the SPO method as a starting point for a set number of iterations. The best solution obtained from SPO is then passed onto the CS algorithm, which serves as an intensification process to enhance the search and overcome the slow convergence of SPO. The CSSPO algorithm balances the CS algorithm’s global exploration and the SPO method’s deep exploitation, improving overall performance. The Levy flight in CSSPO is more effective in exploring the search space, as it can cover longer distances than the traditional random searching method. Thus, the Levy flight replaces the random searching method in the SPO algorithm, resulting in the modified CSSPO algorithm. This algorithm has two parameters which are set as references (Population Size = 50, Beta = 2/3). The CSSPO algorithm benefits from the lowest parameter tuning, so the number of parameters that should be tuned is at the minimum. The CSSPO algorithm follows the same steps as the standard SPO algorithm until line 9 in Algorithm 1. Then, the CS method in Algorithm 1 is applied as an intensification process to refine the best solution obtained from the previous stage in the standard SPO algorithm.
Algorithm 1: Pseudo-code of CSSPO
Inputs: The number of colors (pop size)
Outputs: The best location of colors and their objective values
1.   Initialize the random colors
2.   Find the objective values
3.   For (it<itMax) Do
4.         Divide colors into three groups randomly
5.        for every color
6.           Create new colors (combine colors)
7.          Sort the fitness of all colors
8.          Find the best colors
9.          Build new nests at new locations using Levy flight
10.           Retain the best solutions (nests with quality solutions)
11.         Rank the solutions and find the current best solution
12.       End for
13. End For (Termination criteria are satisfied)
14. Return the best solution

5. Structural Examples

This section demonstrates the effectiveness of FRPs compared with steel for CSSPO by examining several common structural optimization problems. The results obtained using CSSPO are compared to those obtained using SPO. Natural frequency is an important property to consider when optimizing truss structures, as it describes the frequency at which the structure will vibrate when subjected to external forces or disturbances. In the context of structural optimization, natural frequency constraints are essential to ensure that the resulting design is both structurally sound and capable of withstanding the dynamic loads or vibrations it may experience over its lifespan. The termination criterion that relied on the maximum count of function evaluations is utilized to guarantee an impartial comparison. Problems are addressed individually, each undergoing 30 rounds of runs. The examination is carried out employing the CSSPO, using a similar number of analyses and representatives to maintain fair competition. In addition, the previously cited references contribute additional control parameters for the comparative algorithms. To preserve fairness in the competition, both the CSSPO and SPO are applied over a similar range of evaluations and representatives. The natural frequency constraints are applied to four truss designs: a 37-member planar bridge, a 72-member space truss, a 120-member dome truss, and a 200-member planar truss. These constraints, material properties, and cross-sectional area constraints are essential parameters that must be considered during optimization to achieve a design that meets the necessary performance requirements while minimizing weight or maximizing other design objectives. The constraints of these problems are shown in Table 2. The algorithm was implemented using MATLAB 2022b software, while the trusses were solved using SAP2000 v14.1. The process of optimization entailed the utilization of the application programming interface (API). A Macintosh machine running MacOS Big Sur and equipped with an Intel Core i9 processor running at 2.3 GHz, 16 GB of RAM at 2400 MHz DDR4, and the aforementioned software was used to perform the optimization calculations.

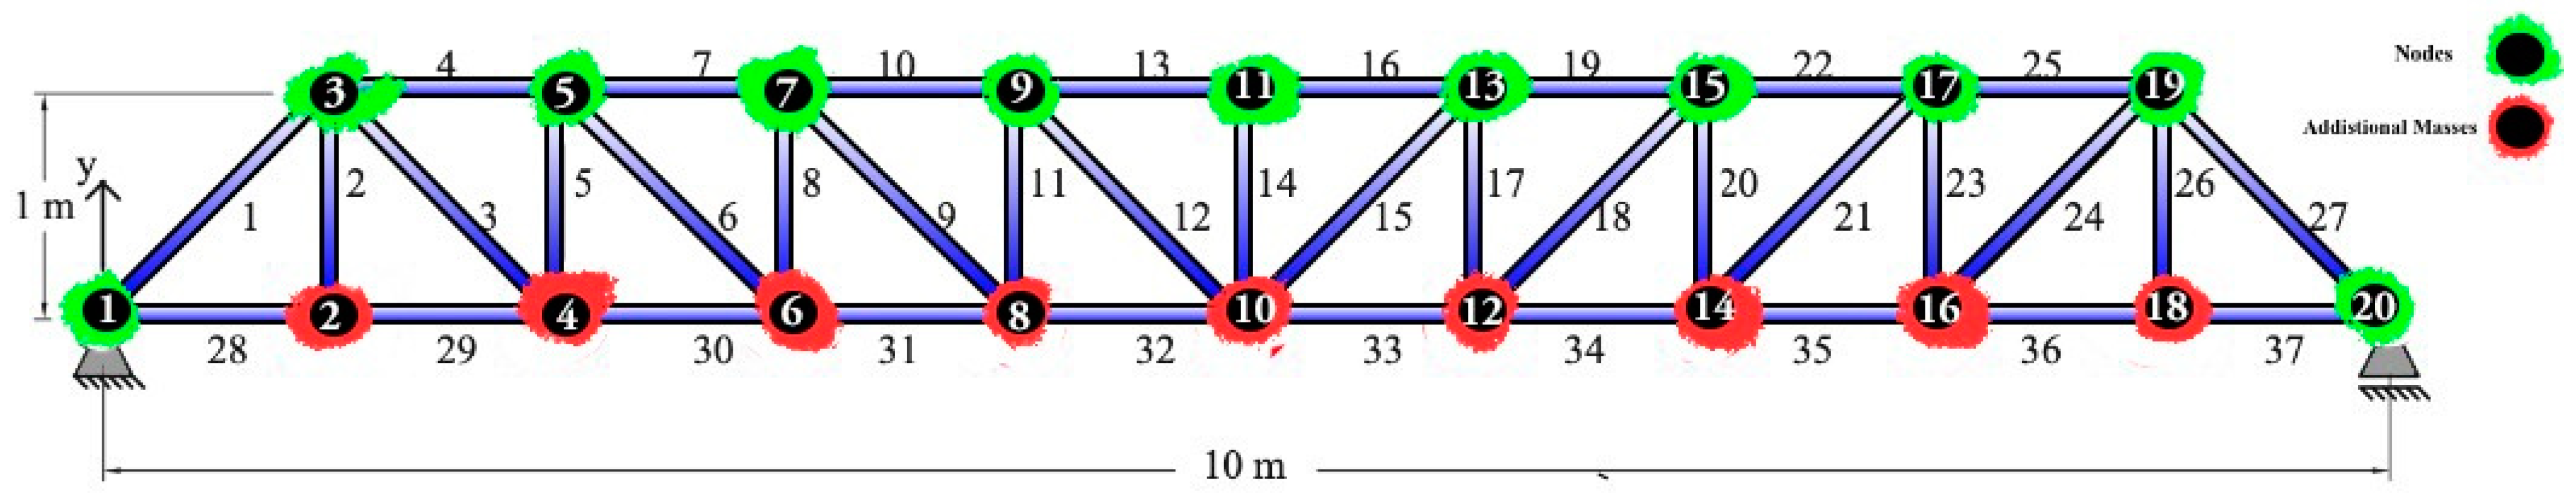
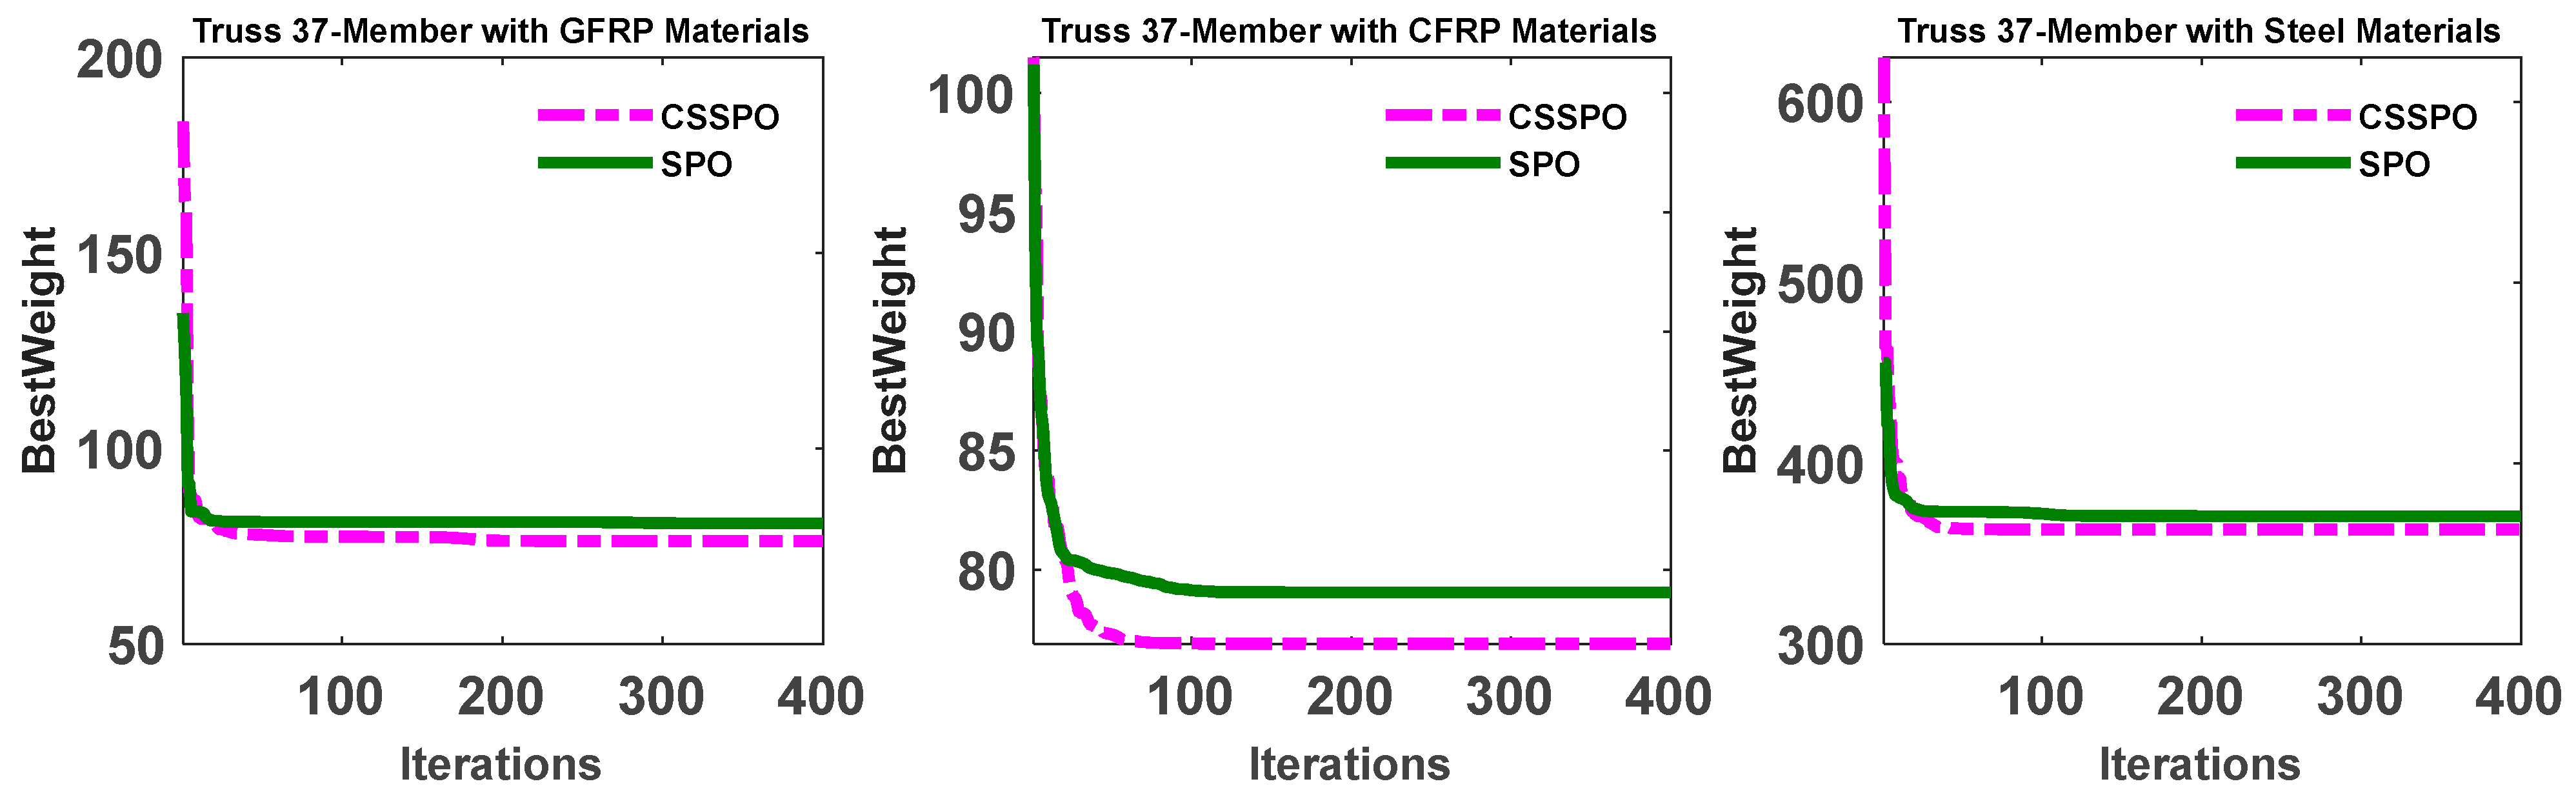
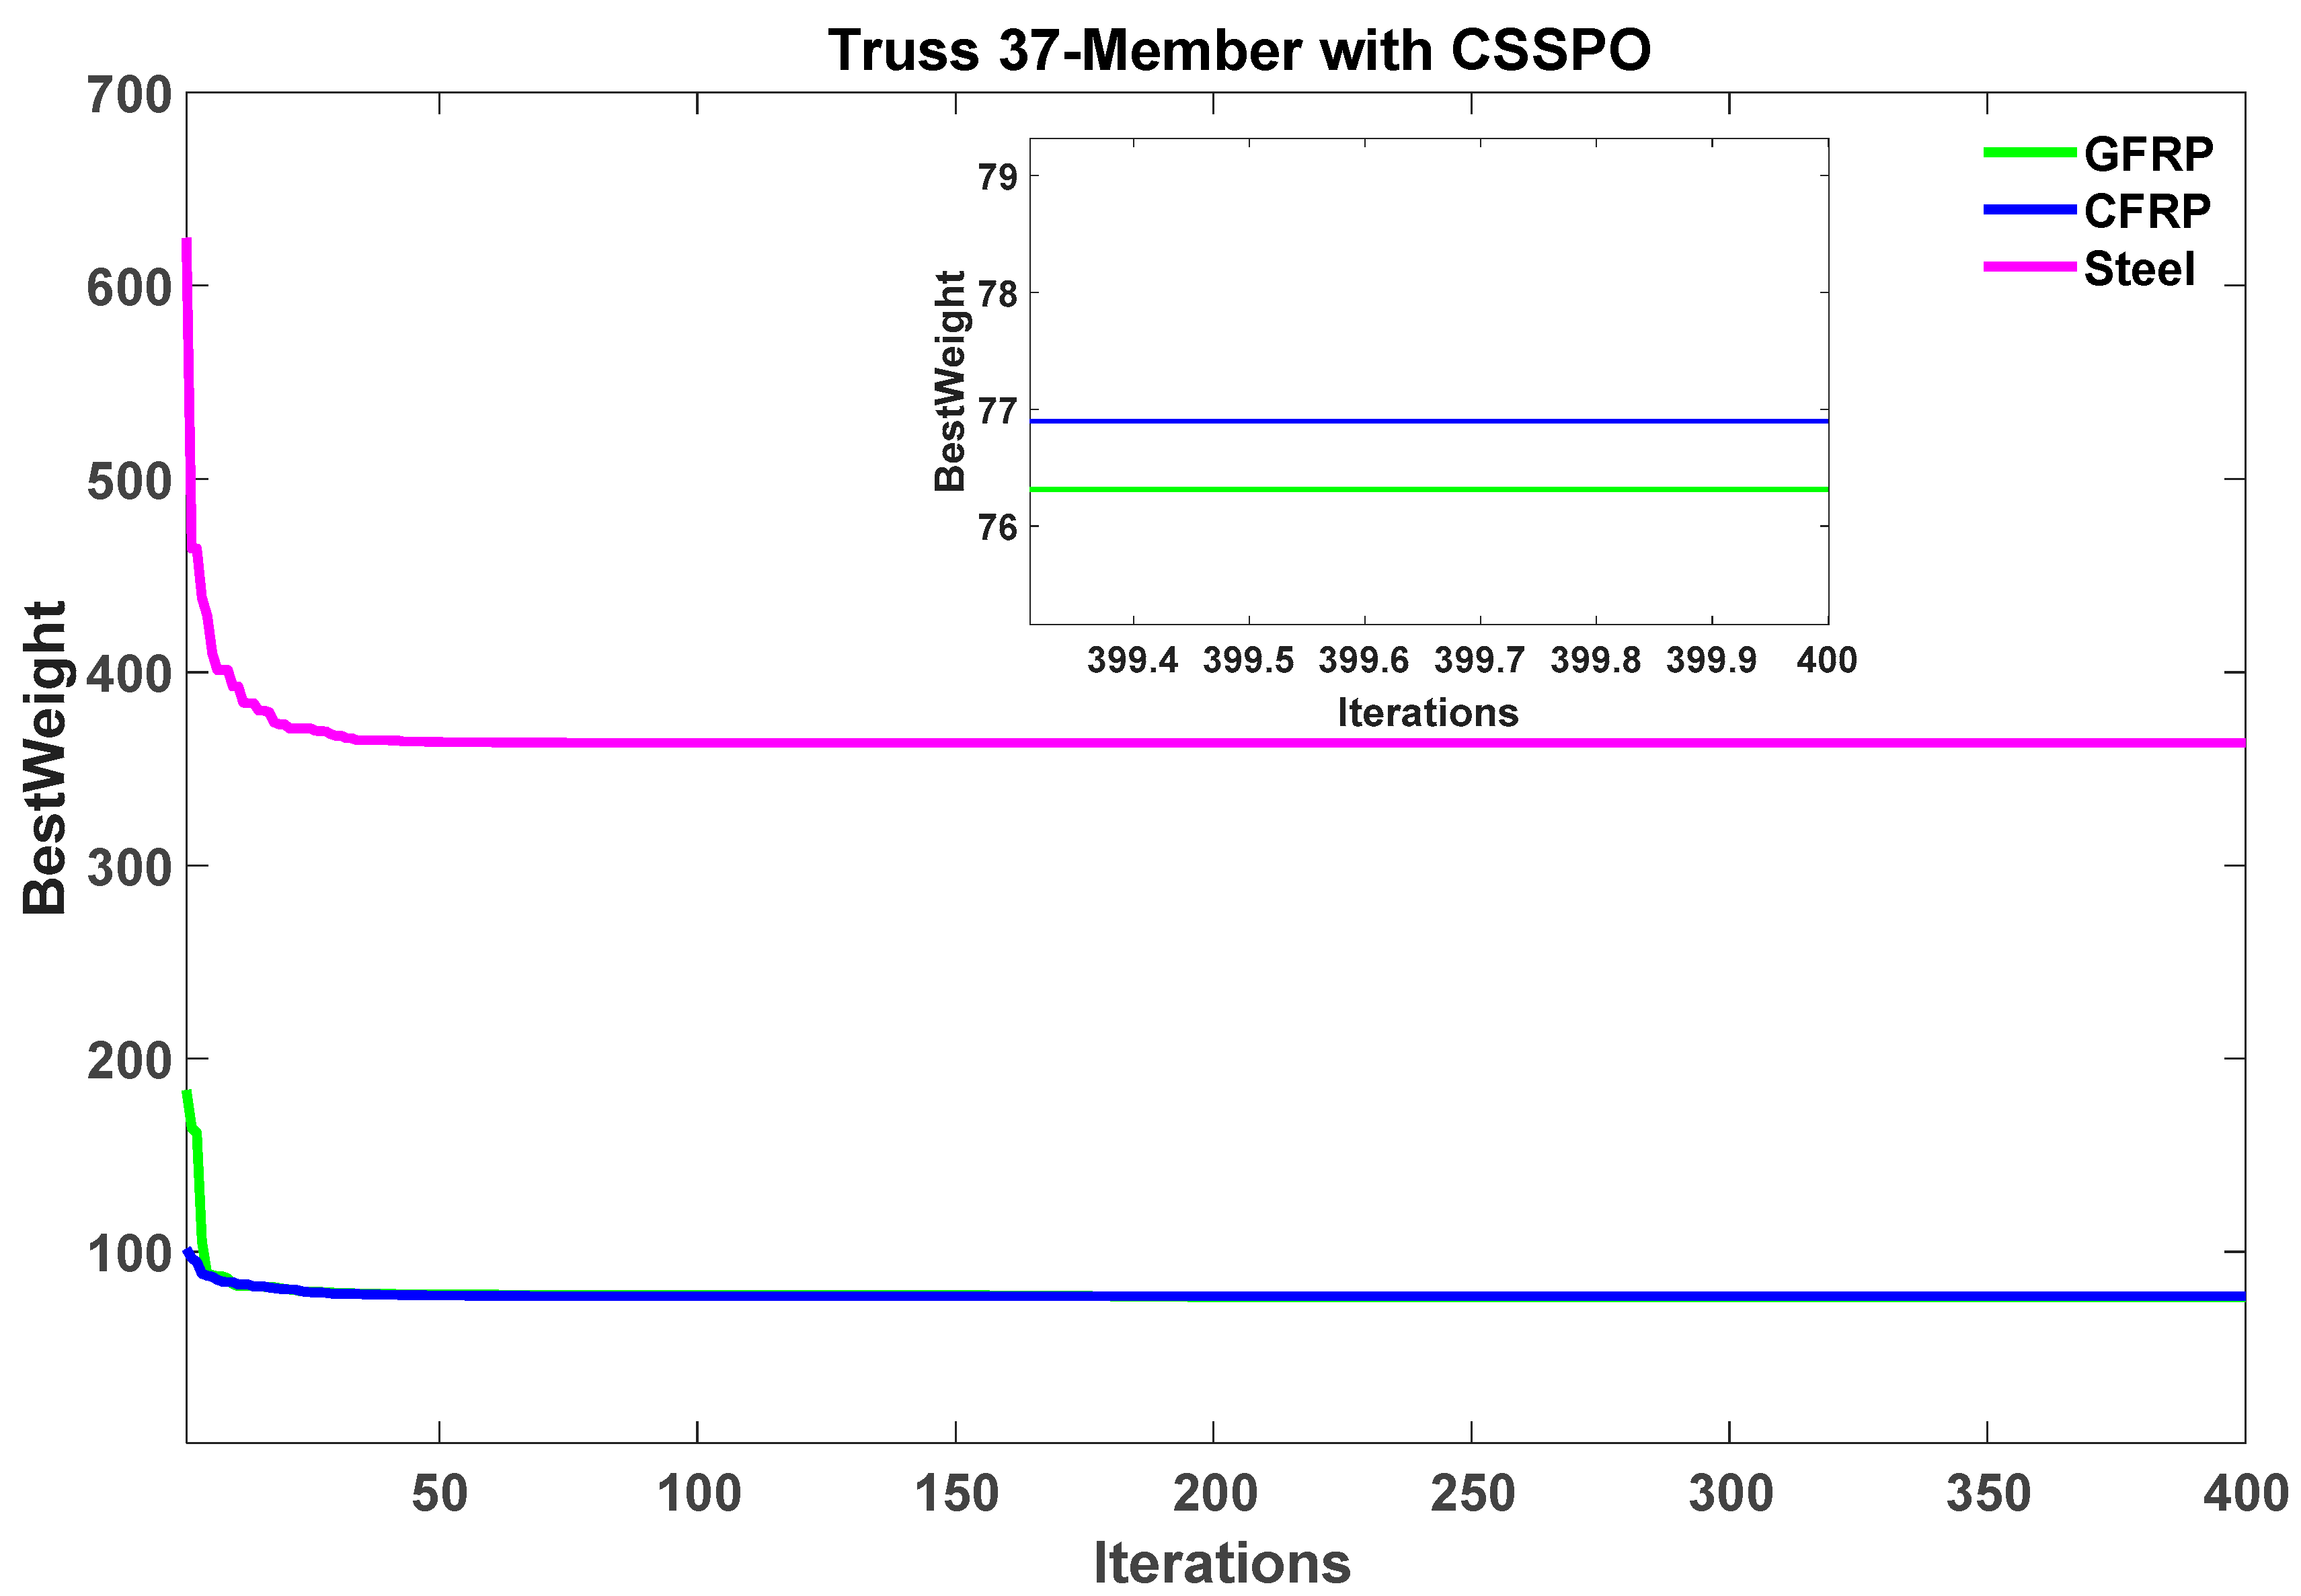
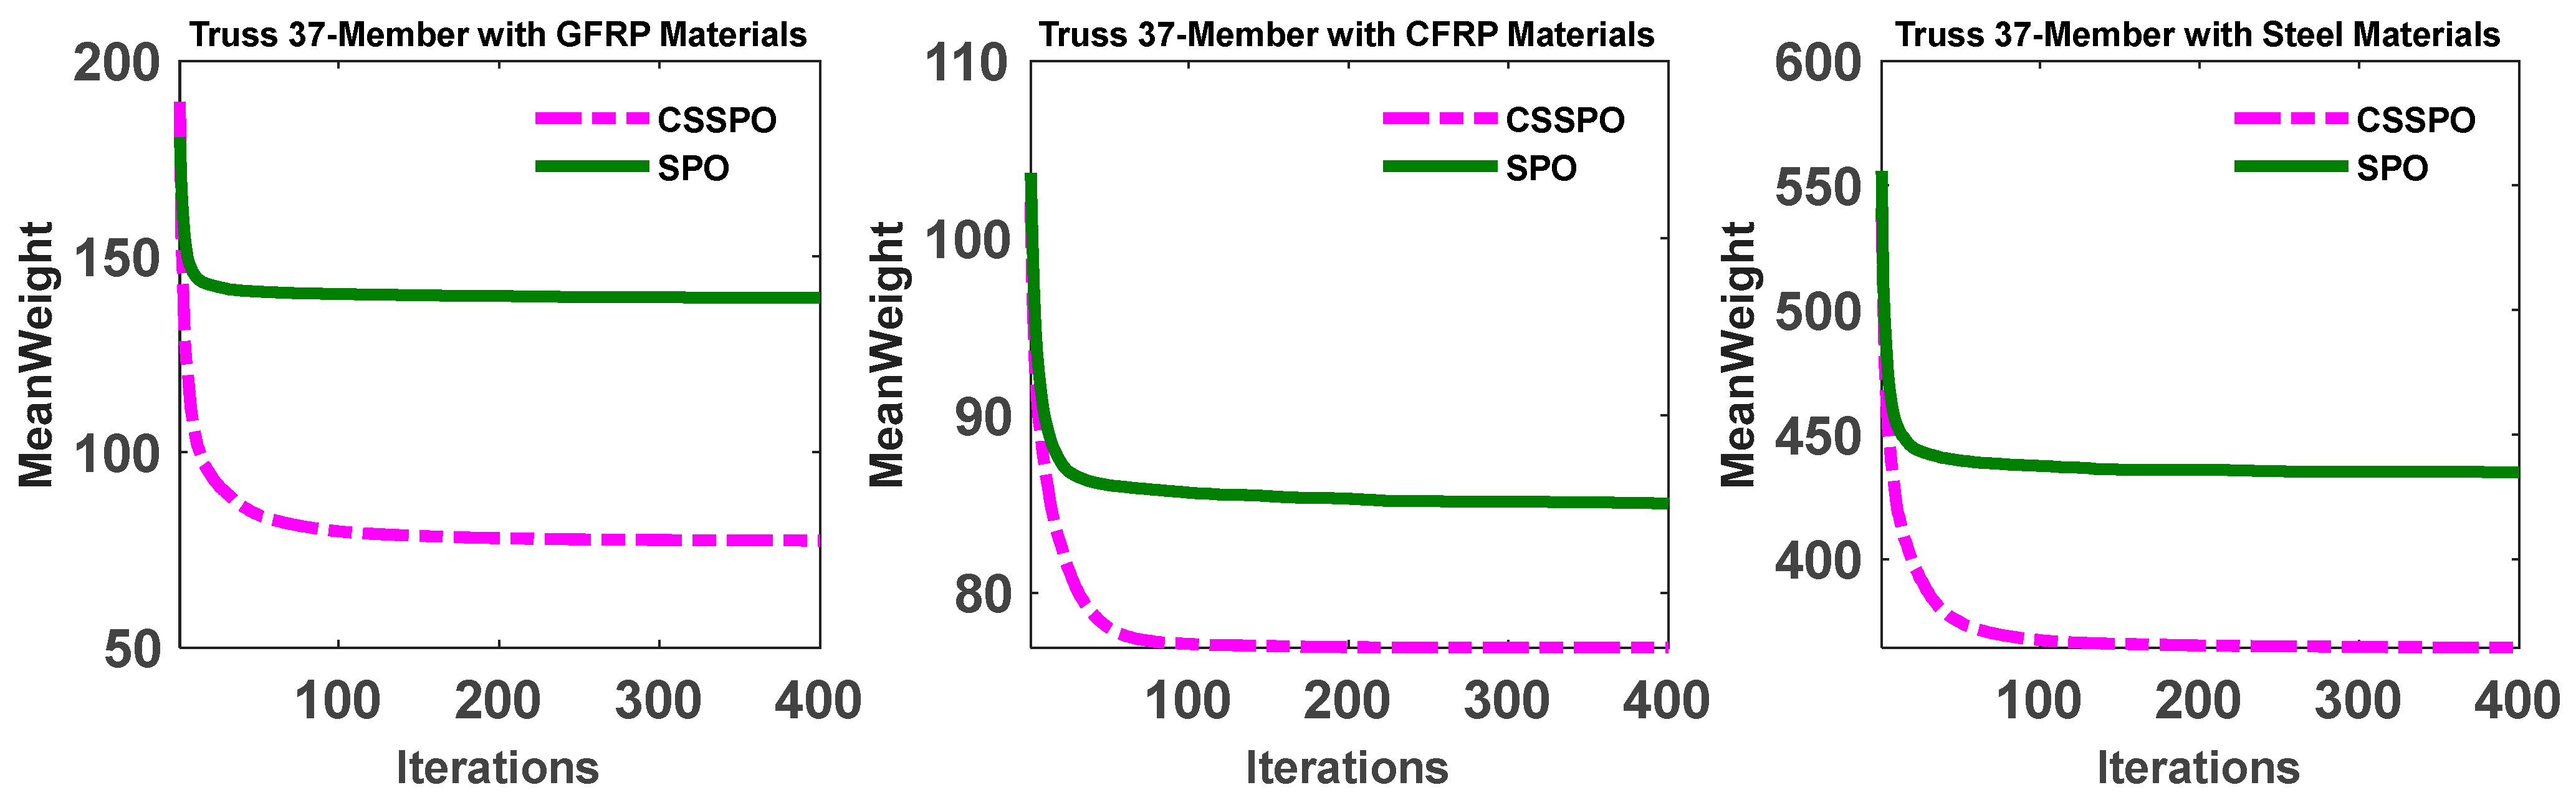
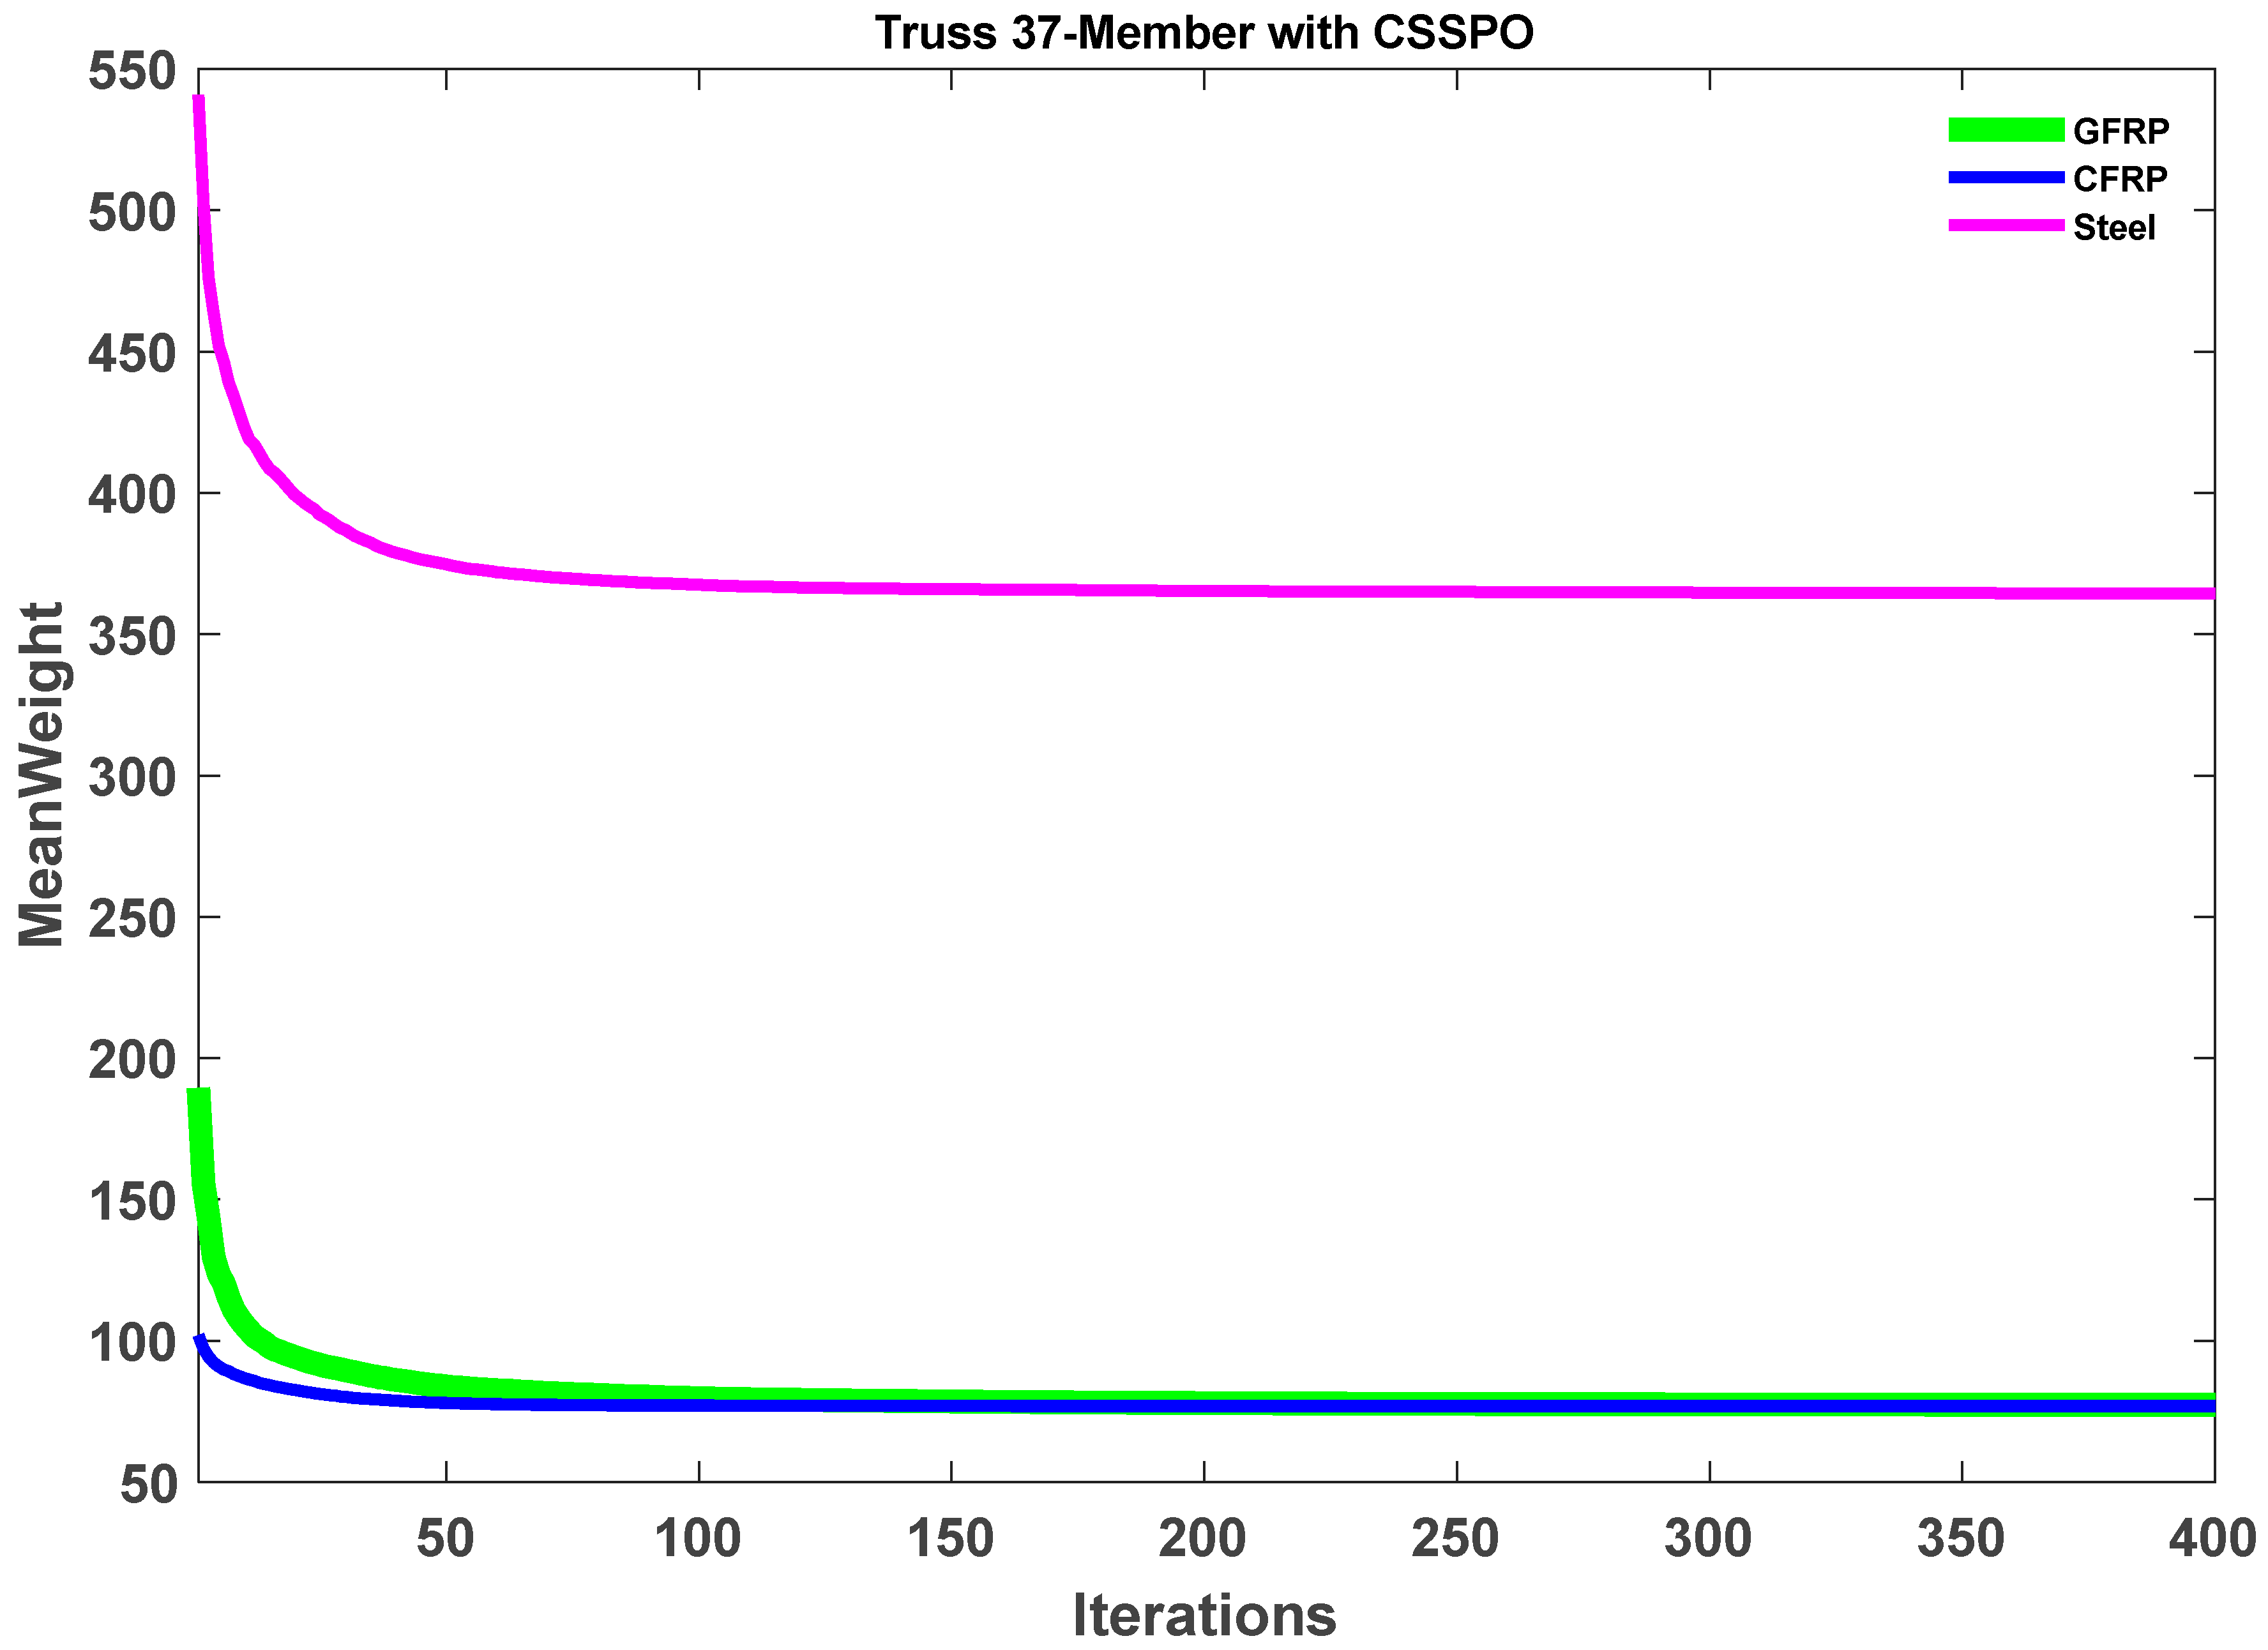
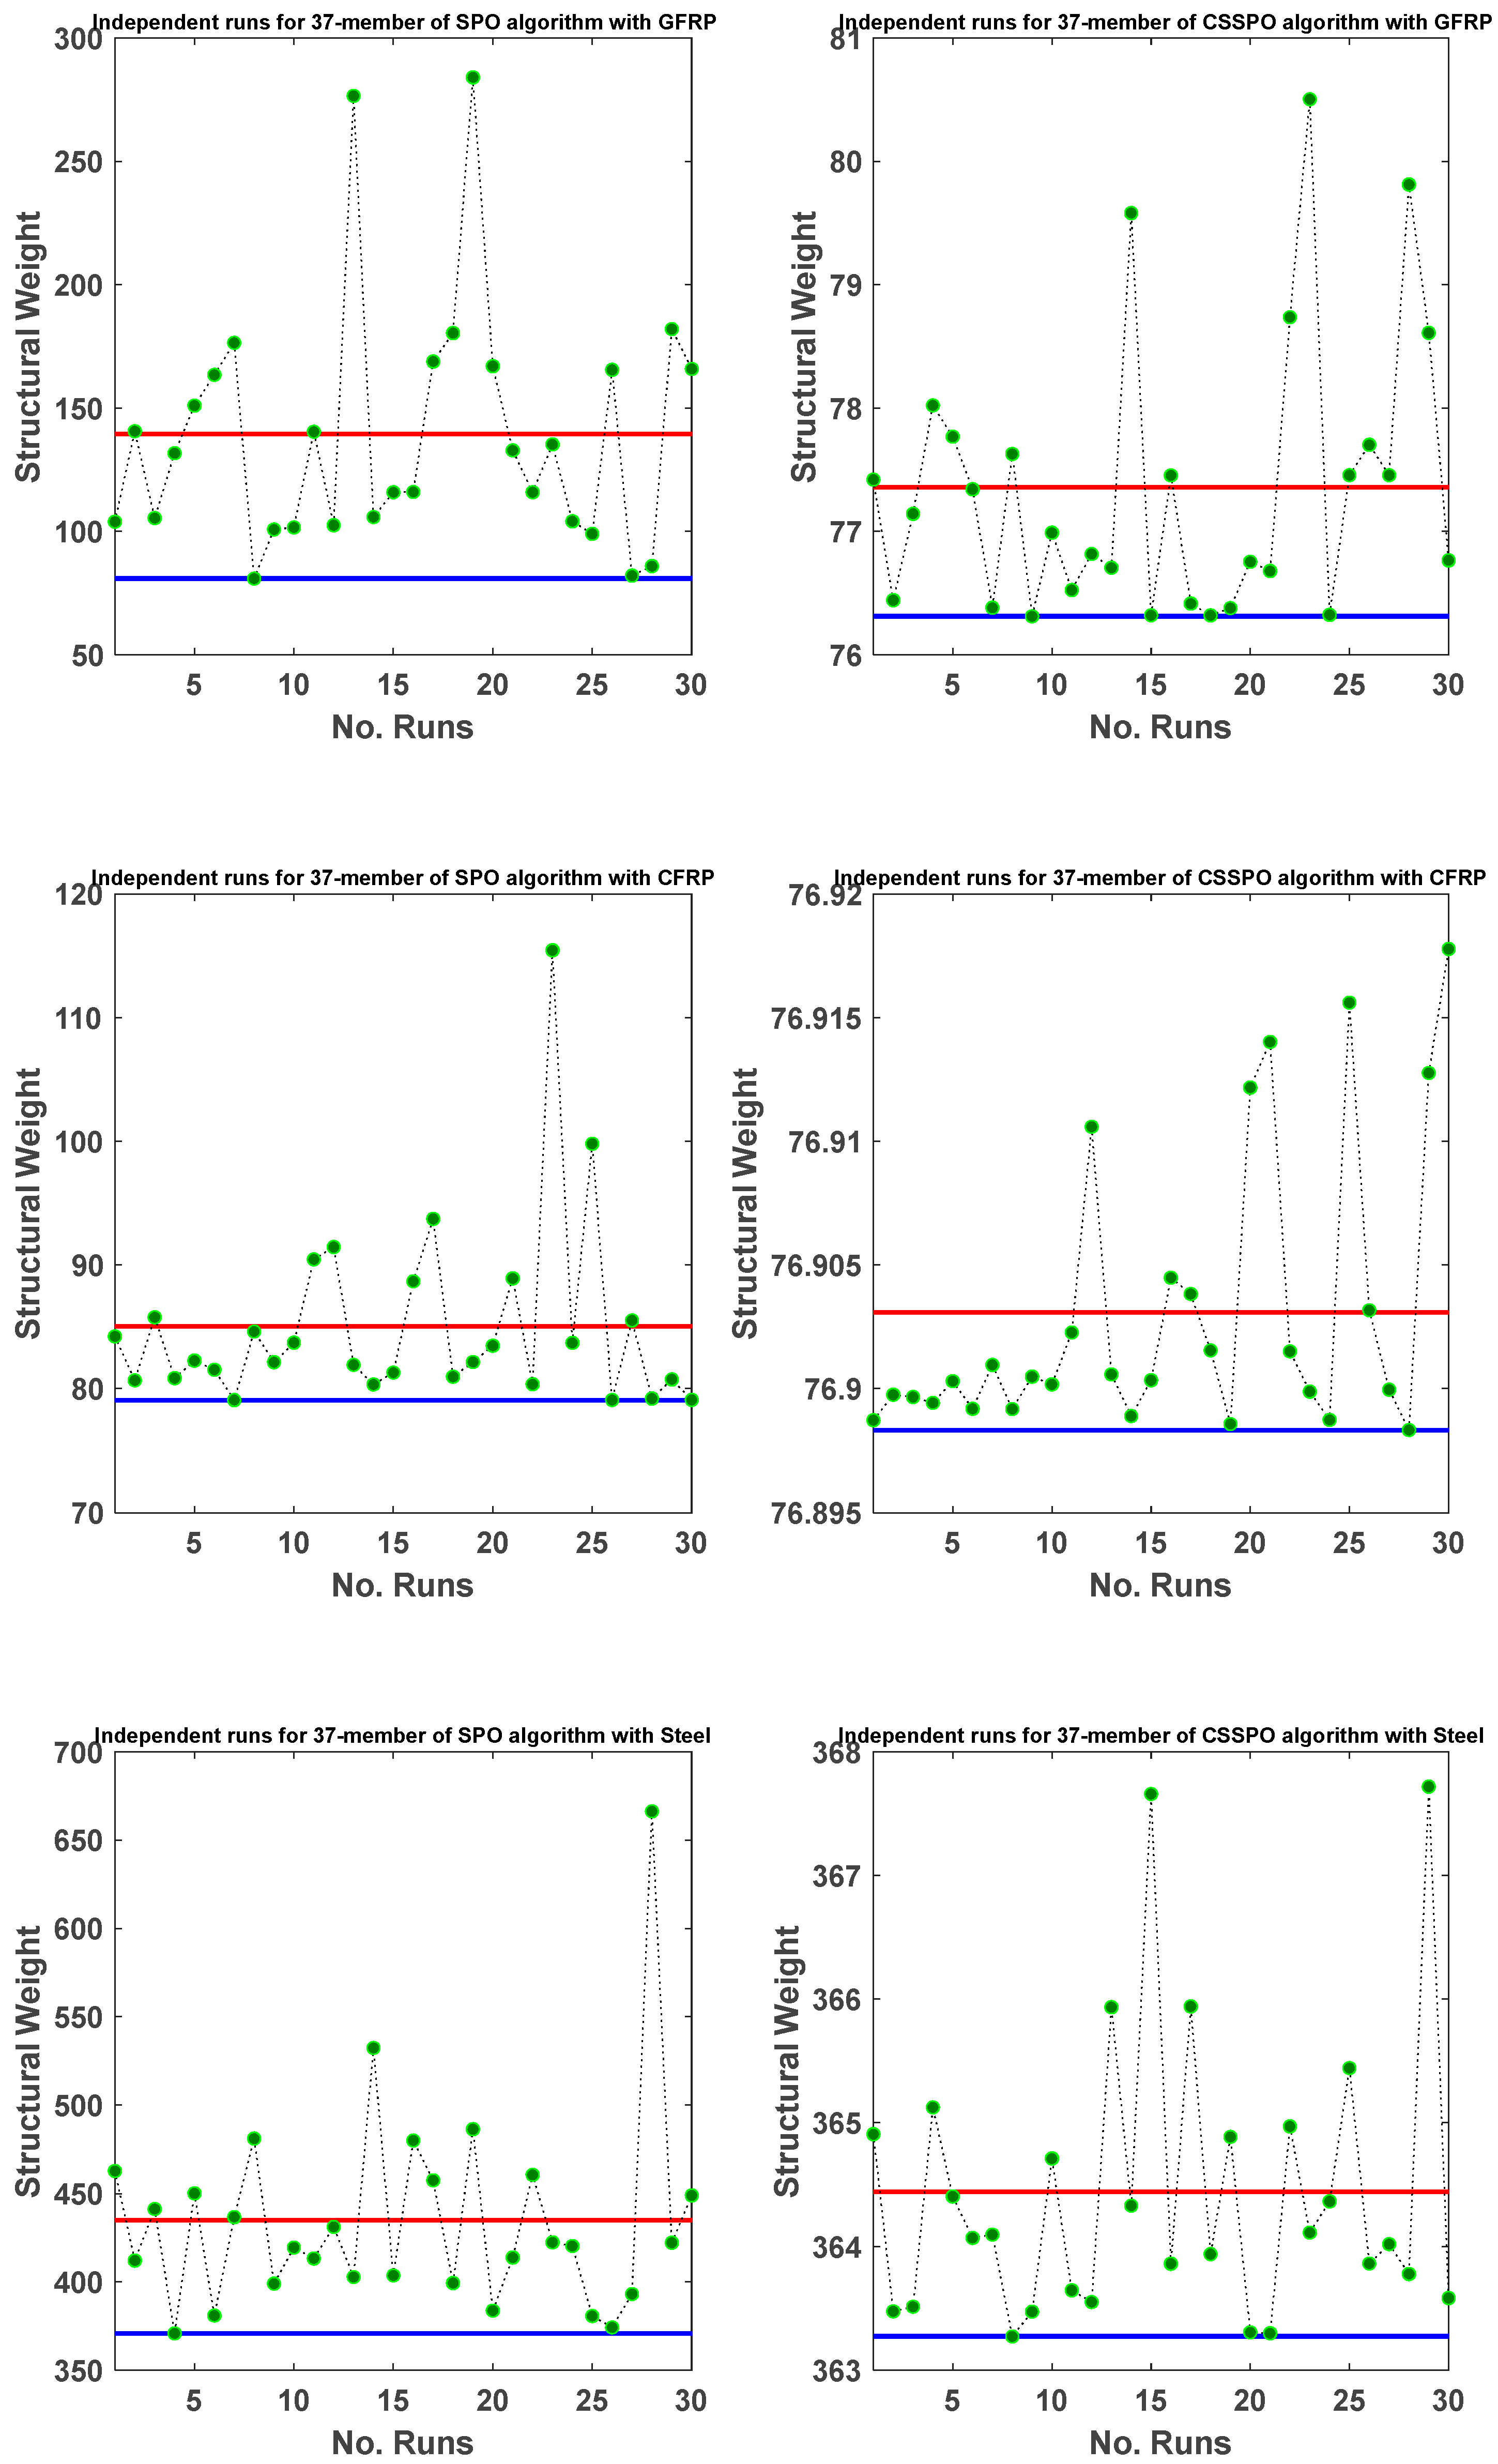
5.1. A 37-Member Planar Truss

The first instance presented in this subsection is the weight minimization of a planar 37-member truss structure, as depicted in Figure 8. Wang et al. [27] were the first to examine this case study, and many others have subsequently followed similar methods. Table 1 presents the material properties for this problem, which involves 14 sizes and 5 design variables. A mass of 10 kg , referred to as the lumped mass, is added to the bottom nodes of the bridge, the cross-sectional areas of the lower chord members are 0.4   cm 2 , and the remaining members are assumed to have a cross-section of 1   cm 2 . All nodes of the upper chord can be moved along the y-axis while maintaining the structure’s symmetry. Different composite materials are used to optimize this structure. In this section, the 37-member planar bridge under natural frequency constraints is optimized using the SPO and CSSPO with a population size of 50 and 20,000 function number evaluations.
The results illustrated in Table 3 indicate that the CSSPO algorithm outperforms the SPO algorithm for GFRP, CFRP, and steel materials, with the best results achieved with CSSPO for all materials. The composite materials, GFRP and CFRP, showed competitive results compared to steel. The optimal weight obtained was 76.3119 kg for GFRP and 76.8983 kg for CFRP using the CSSPO algorithm. The results demonstrate that the CSSPO algorithm outperforms SPO. The standard deviation for all materials with the CSSPO was considerably less than with SPO, indicating that CSSPO is more reliable than SPO. Figure 9 depicts the convergence curve of the best weight for SPO and CSSPO with different materials. In addition, this figure demonstrates that composite materials were more optimal in weight than steel. The convergence curve of the best weight for CSSPO was significantly better than SPO, as shown in Figure 9. According to this figure, CSSPO requires less function evaluation for reaching the best solution. Moreover, the results of the CSSPO for all materials are compared in Figure 10. In the rankings, GFRP secured the top spot, with CFRP achieving a commendable second place. In summary, this figure demonstrates the superiority of composite materials.
Figure 11 presents the convergence curve of the mean weight for the SPO and CSSPO approaches with GFPP, CFRP, and steel materials. The results demonstrate that the CSSPO outperforms SPO. Figure 12 is given to further demonstrate the performance of the different materials. This figure displays the mean weight for the CSSPO for all composite materials across 30 distinct runs. The figure indicates that CFRP and GFRP materials achieved the best and most competitive results. Figure 13 illustrates the outcomes of 30 distinct runs for the SPO and CSSPO. In this figure, the minimum achieved result is represented by the blue line, while the red line represents the average of all 30 runs. The results indicate that the CSSPO is able to approximate the average weight value closely, and that most of the results were near the best solution. Table 4 provides the first three natural frequencies obtained by the SPO and CSSPO algorithms. This table demonstrates that the algorithms met the satisfactory constraints for this problem.

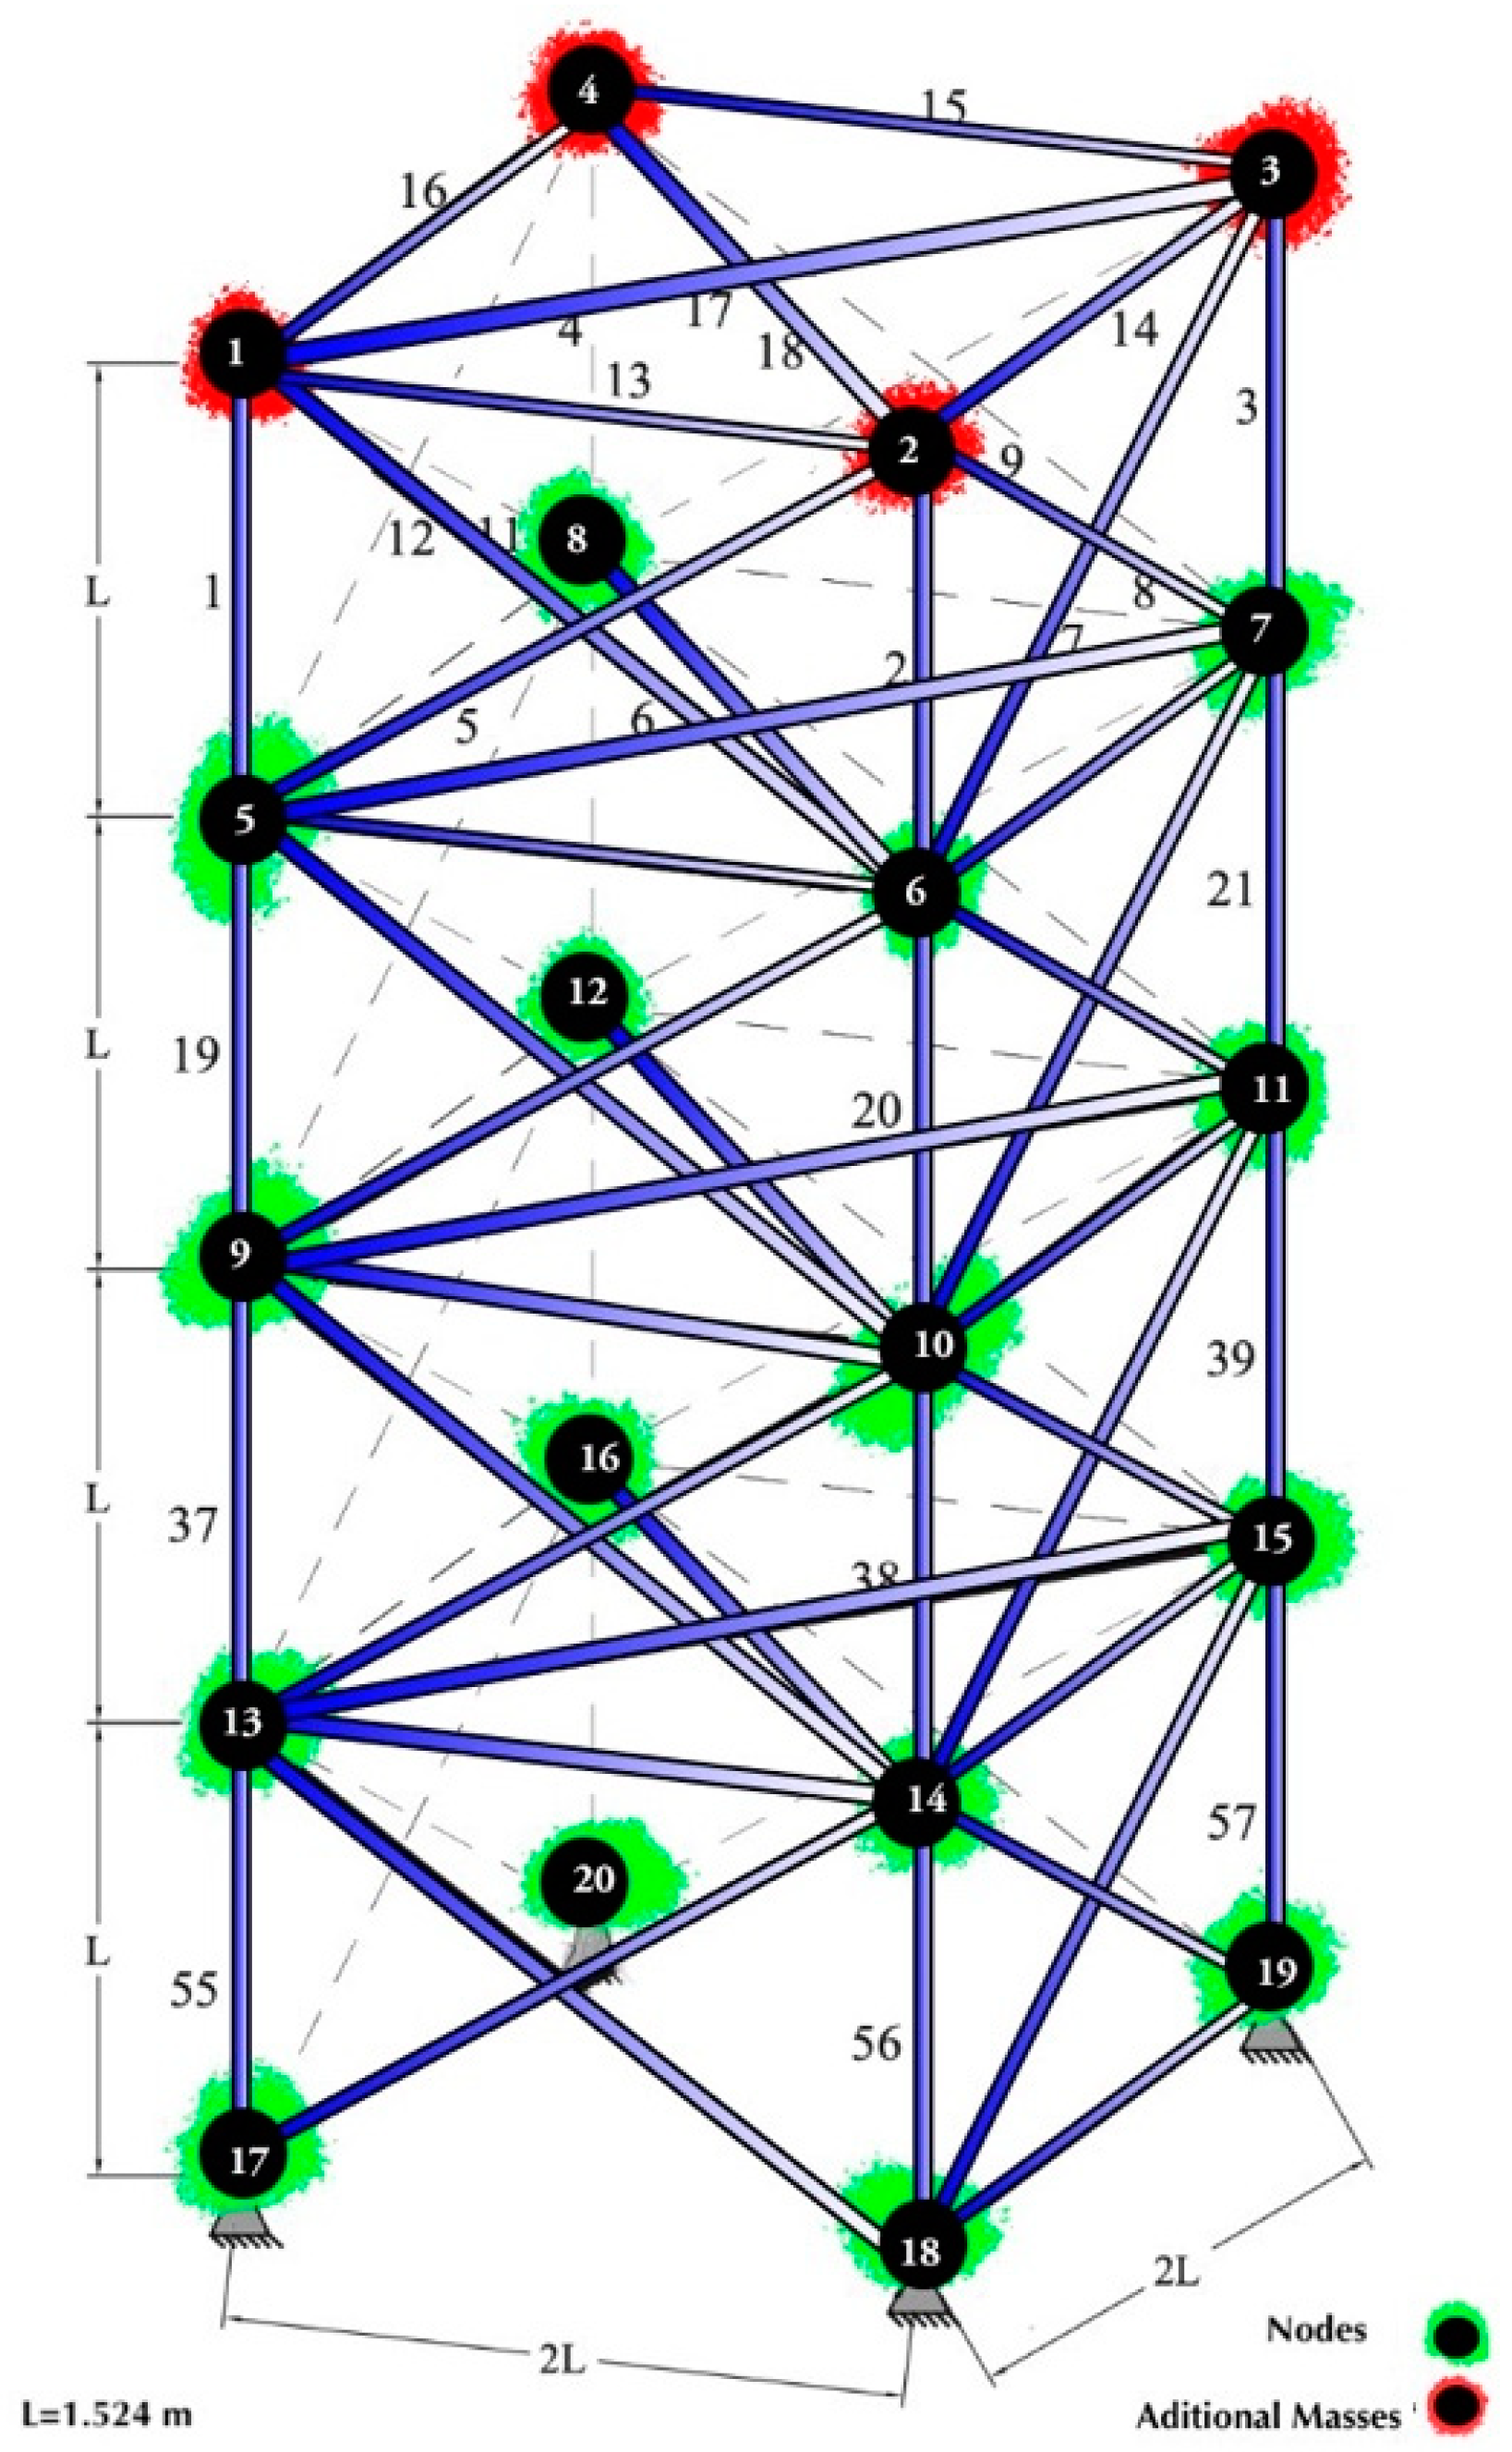
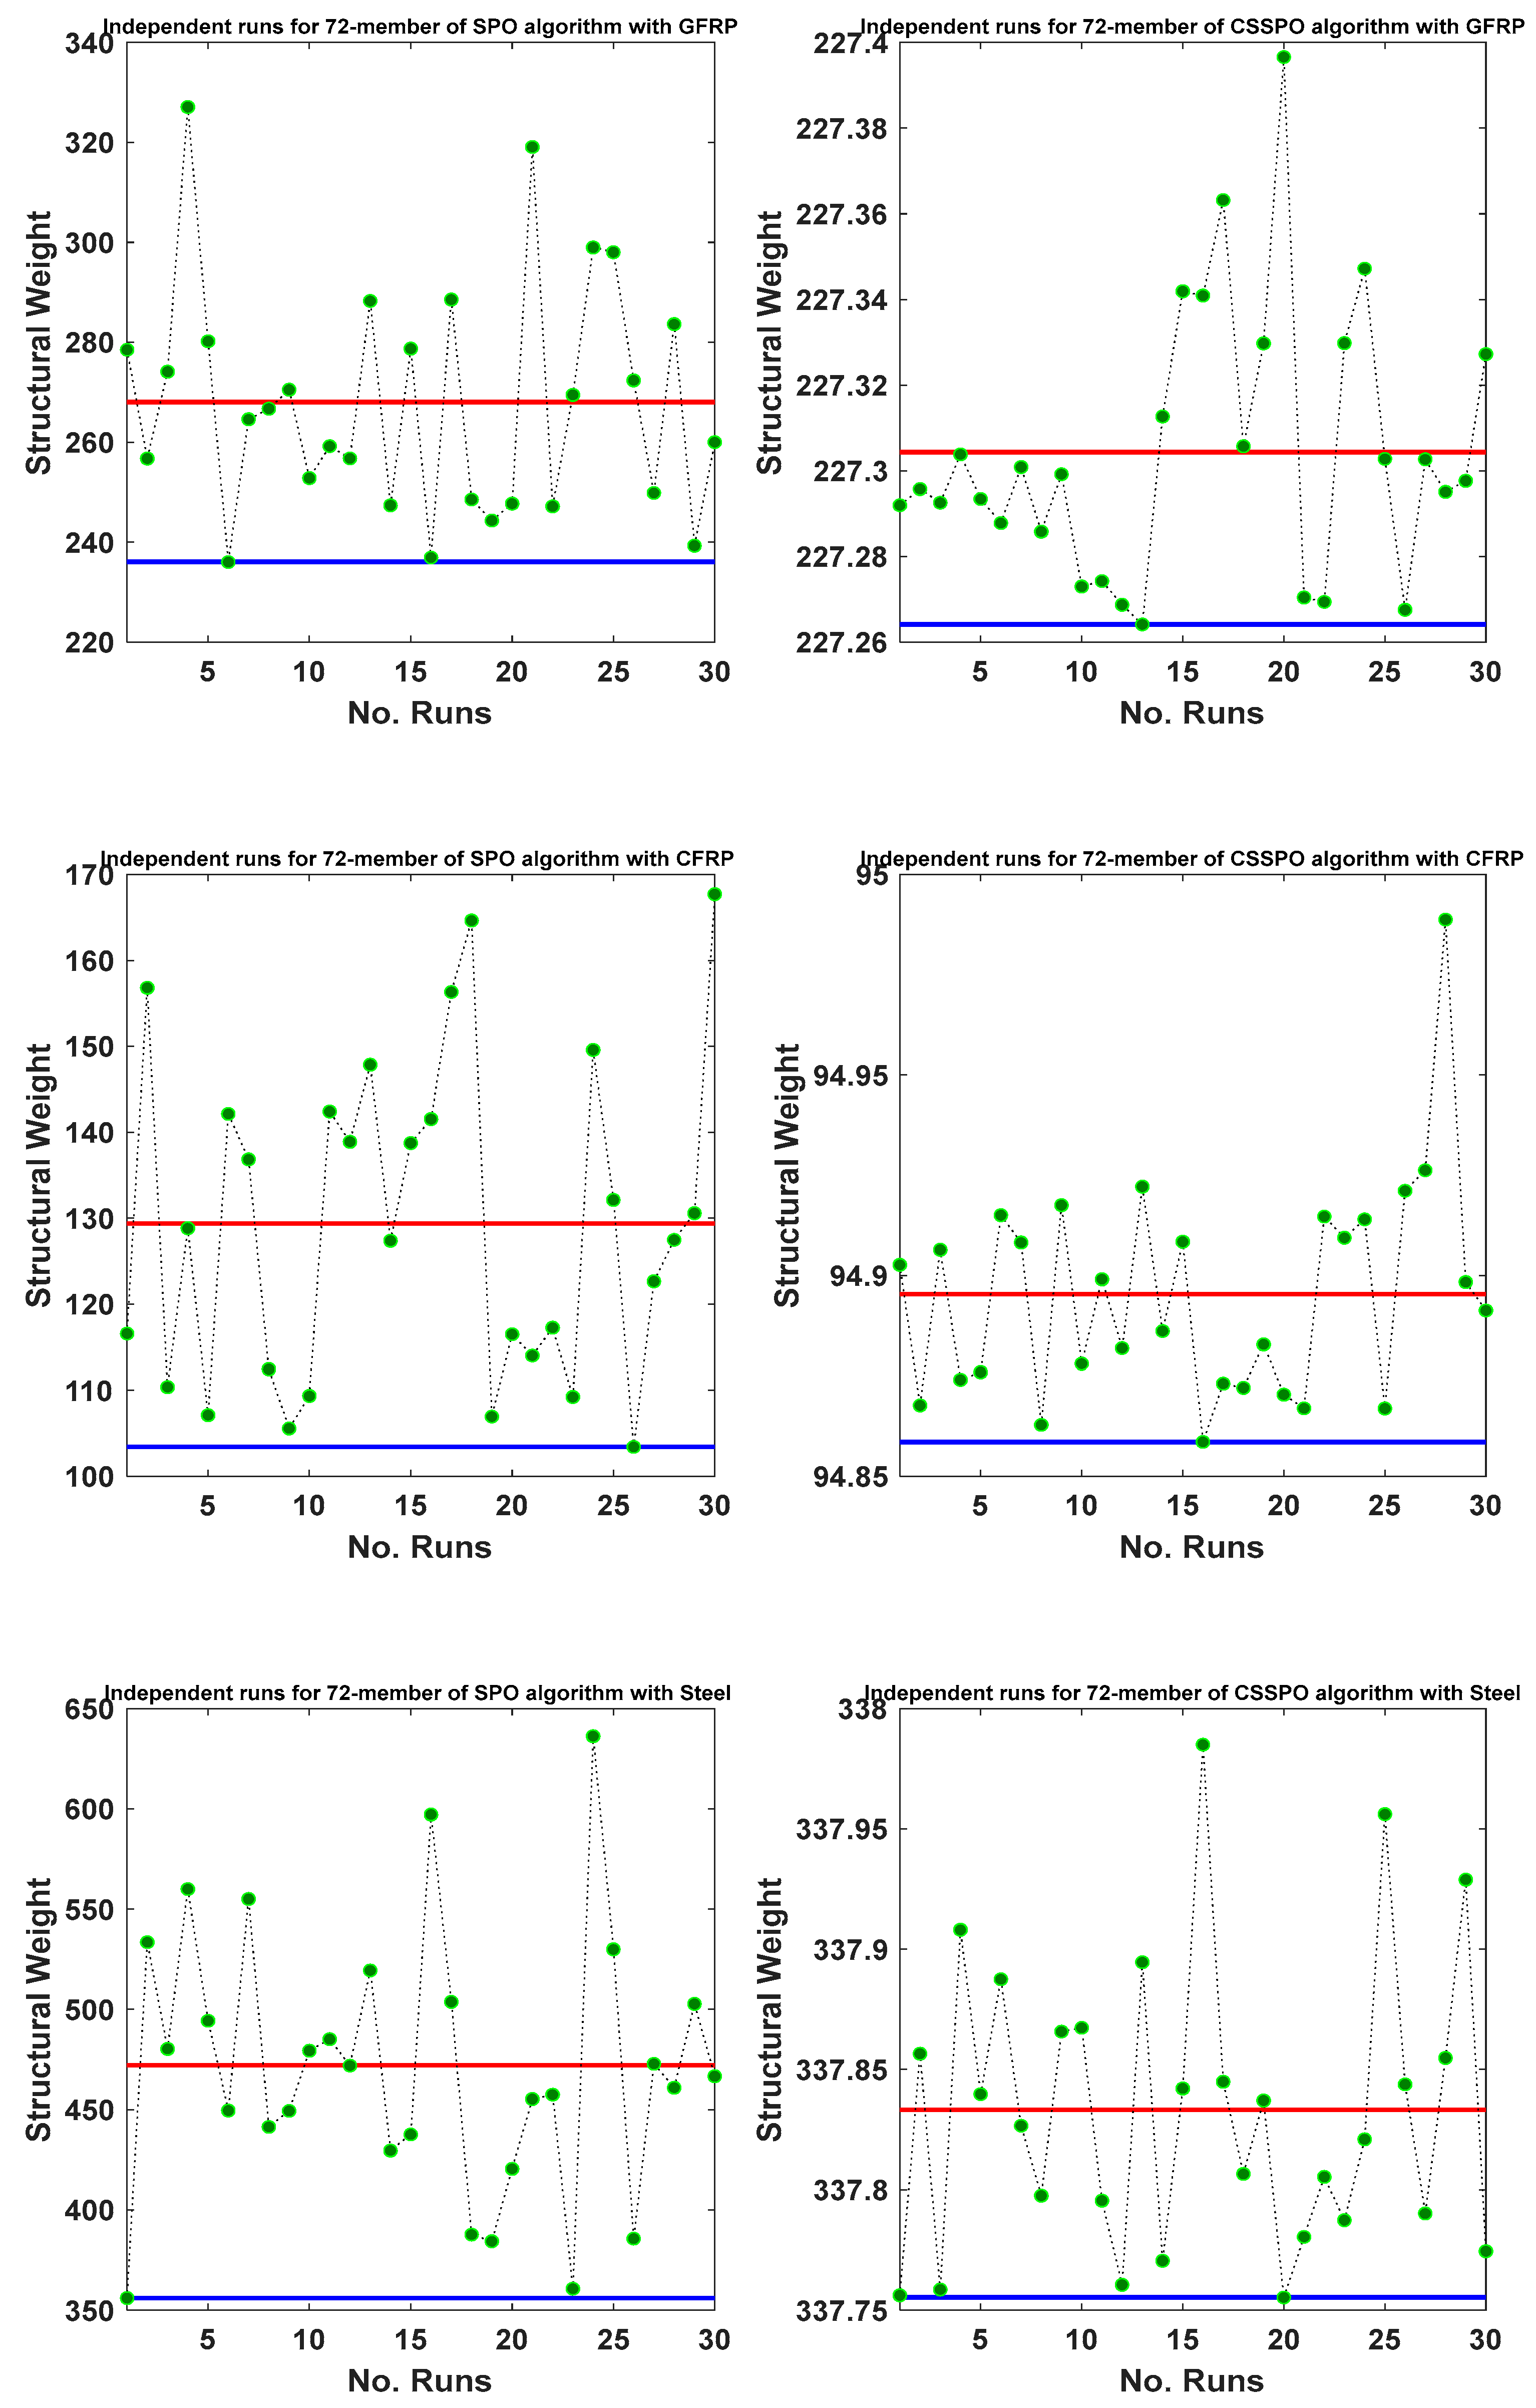
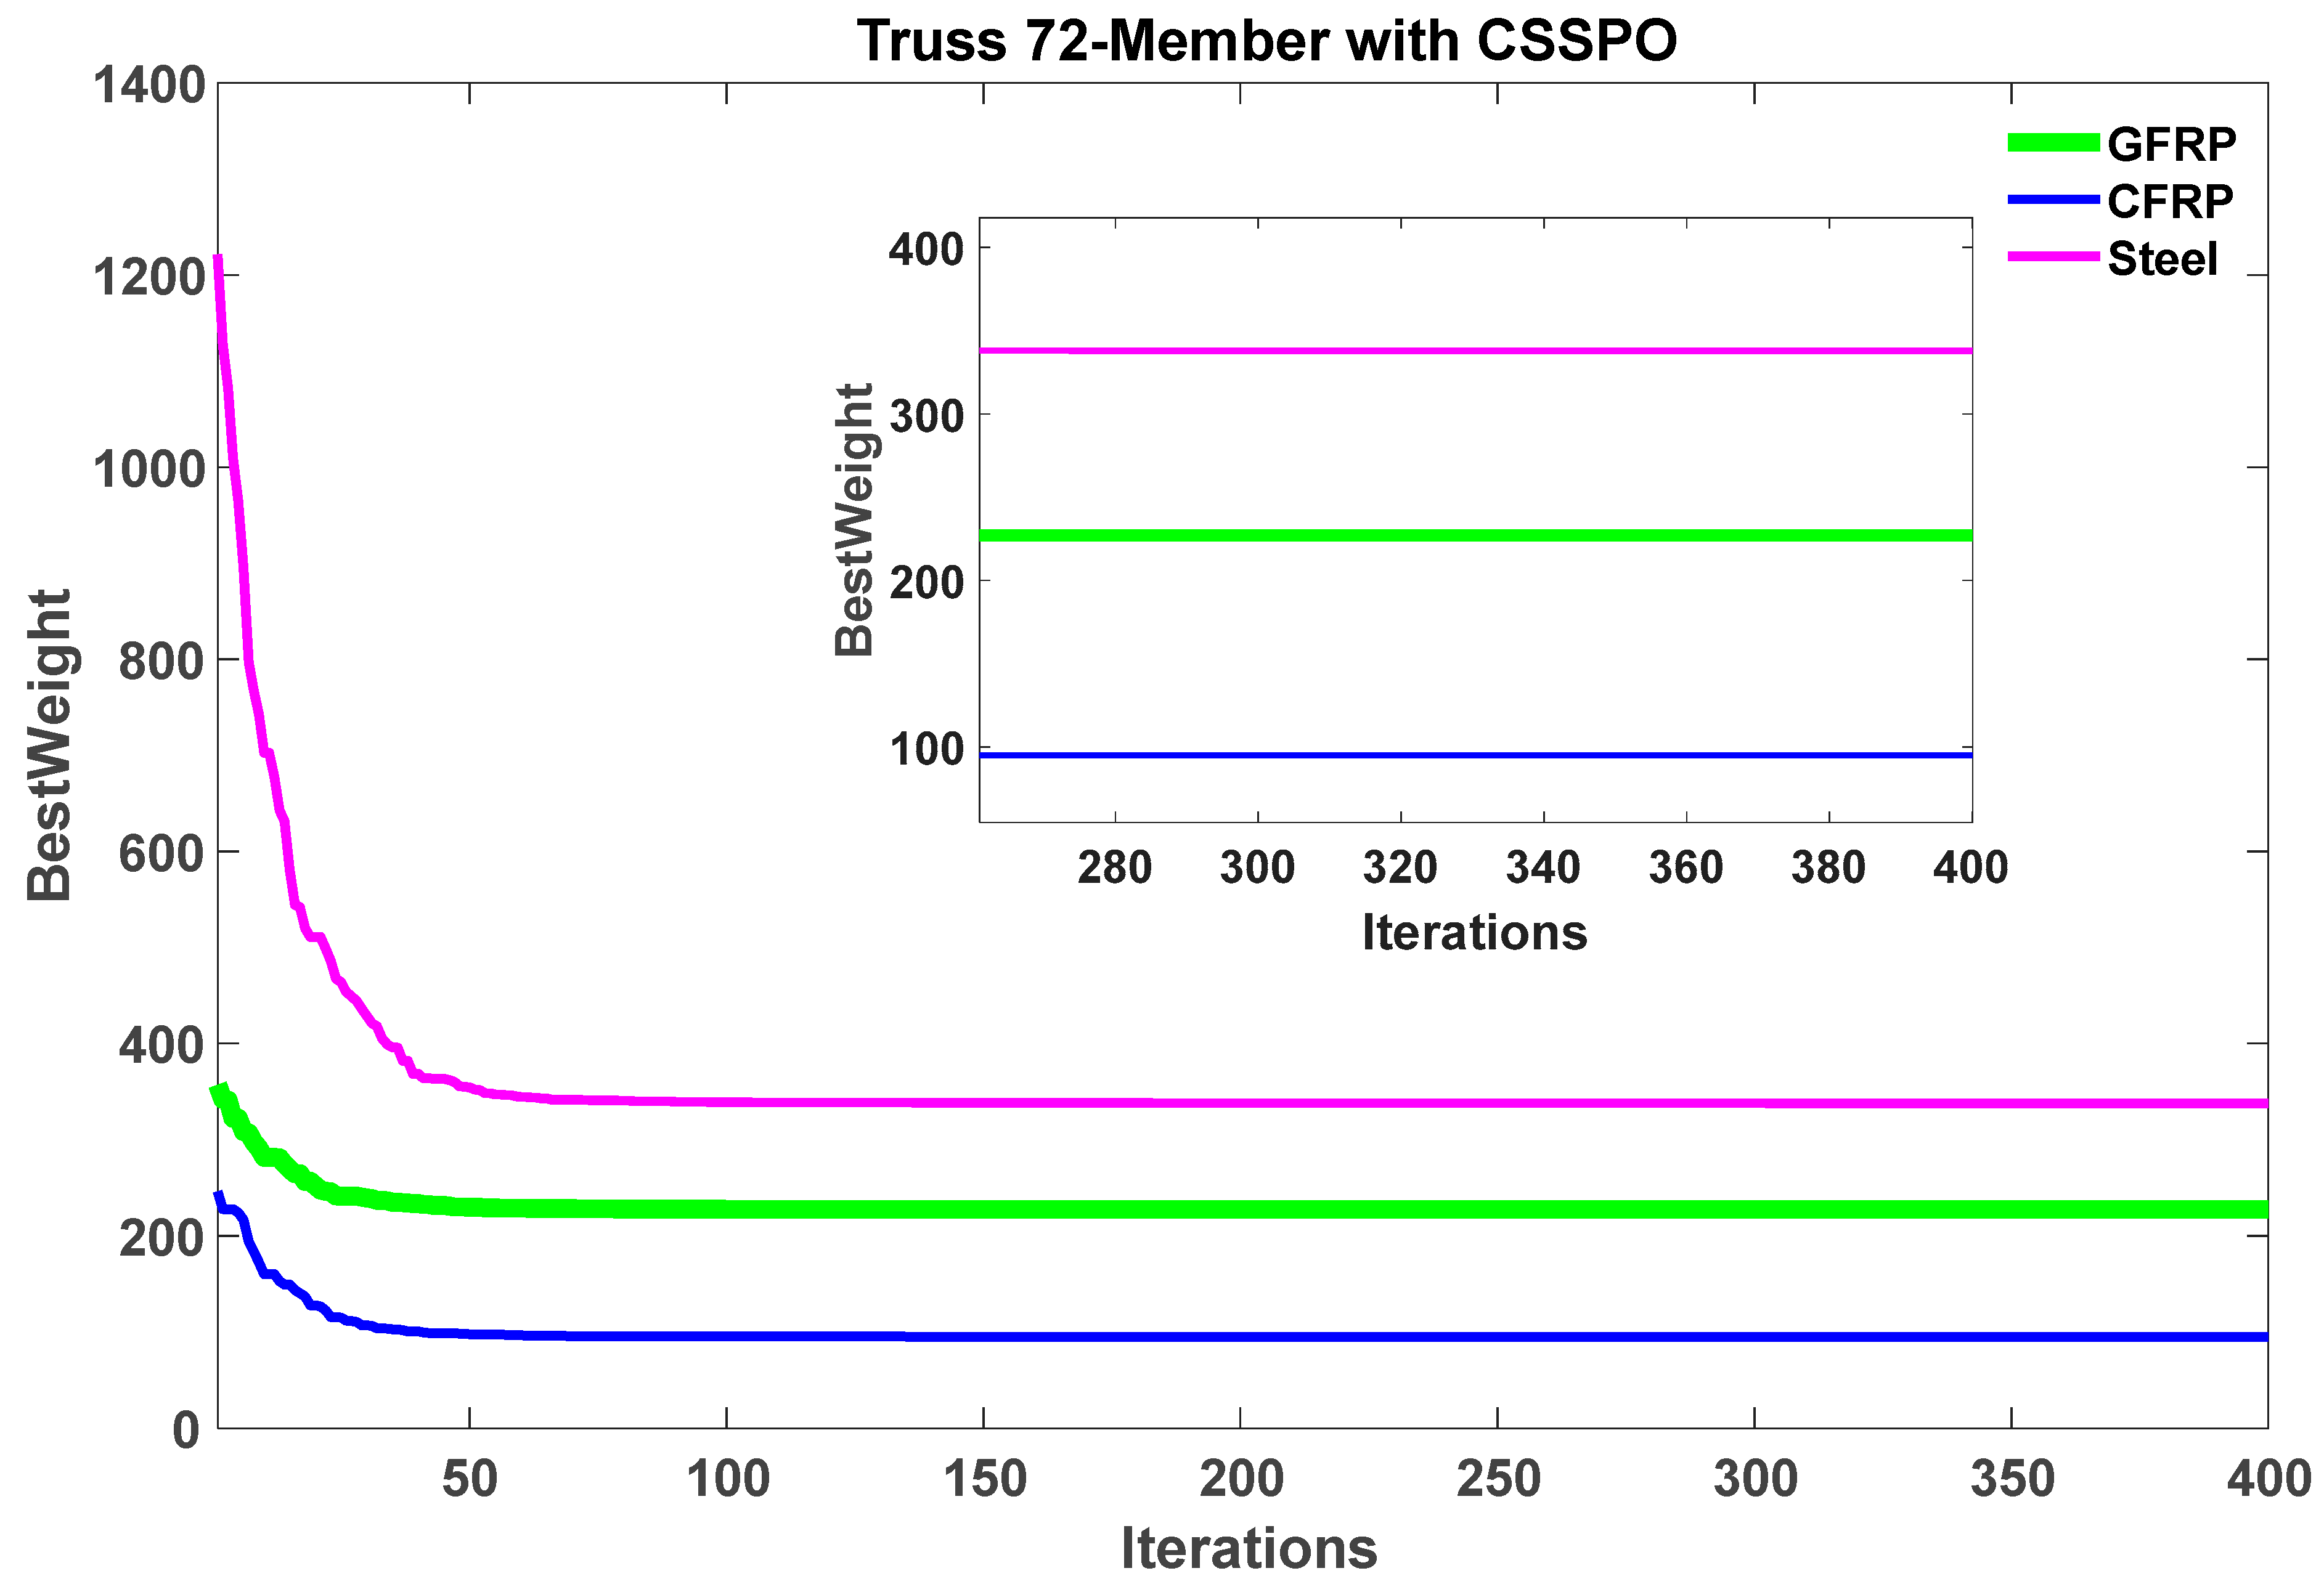
5.2. A 72-Member Space Truss

The second example in this section involves the weight minimization of a spatial truss with 72-members, as illustrated in Figure 14. This problem has 16 sizing variables due to the structural symmetry, and the material characteristics and boundaries for this case are summarized in Table 2. Four non-structural masses of 10 kg are added to nodes 1–4. The SPO and CSSPO algorithms are evaluated for this problem with natural frequency constraints.
The optimization results of the SPO and CSSPO were compared using different materials (GFRP, CFRP, and steel), with a population size of 50 and 20,000 function evaluations. All statistical results and the number of function evaluations obtained from 30 runs are presented in Table 5. The outcomes of 30 distinct runs for SPO and CSSPO are shown in Figure 15. This figure displays the minimum achieved outcome, represented by the blue line, and the average of all 30 runs, represented by the red line. Therefore, most of the results are close to each other between the best and mean lines. The figure demonstrates that the solution obtained using the CSSPO with CFRP was much better than for other materials. The CSSPO approach yielded the best results, with weights of 227.2641 kg , 94.8585 kg , and 337.7553 kg , while the SPO algorithm produced weights of 236.0334 kg , 103.4361 kg , and 356.0184 kg for GFRP, CFRP, and steel, respectively (refer to Table 5).
According to Table 5, the CSSPO algorithm with CFRP material performed the best among its competitors, with the lowest optimal weight of 94.8585 kg , the lowest average weight of 94.8953 kg , and the highest accuracy of SD = 0.0271. In comparison, GFRP ranked second, with an optimal weight of 227.2641 kg , an average weight of 227.3044 kg , and a standard deviation of 0.0311. The results indicate that CSSPO is more reliable and produces superior results compared to the other results reported in the literature. Additionally, the findings demonstrate that using CFRP and GFRP is more efficient than steel. Based on Table 6, the presented method’s natural frequency constraints were strictly satisfied for all bounds.
Figure 16 depicts the best weight convergence curves for the SPO and CSSPO with GFRP, CFRP, and steel for a 72-member truss. This figure demonstrates that the CSSPO outperforms the SPO. Based on this figure, the CSSPO for all materials requires lower function evaluations than the SPO. The best convergence curves for CFRP, GFRP, and steel are compared with each other in Figure 17. According to the details presented in the figure, CFRP was determined to be a feasible solution and had attained the highest weight ranking among all the materials examined in this study. In addition, it was observed that CFRP exhibited the lowest mean weight when employing the CSSPO compared to the other materials cited (see Figure 18). This figure indicates that the convergence rate of the CSSPO is better than that of the SPO. Figure 19 shows that CFRP ranked second among its competitors, with an average weight of 94.8953 kg . In addition, steel fell behind GFRP in the rankings, placing it at the bottom of the material list.

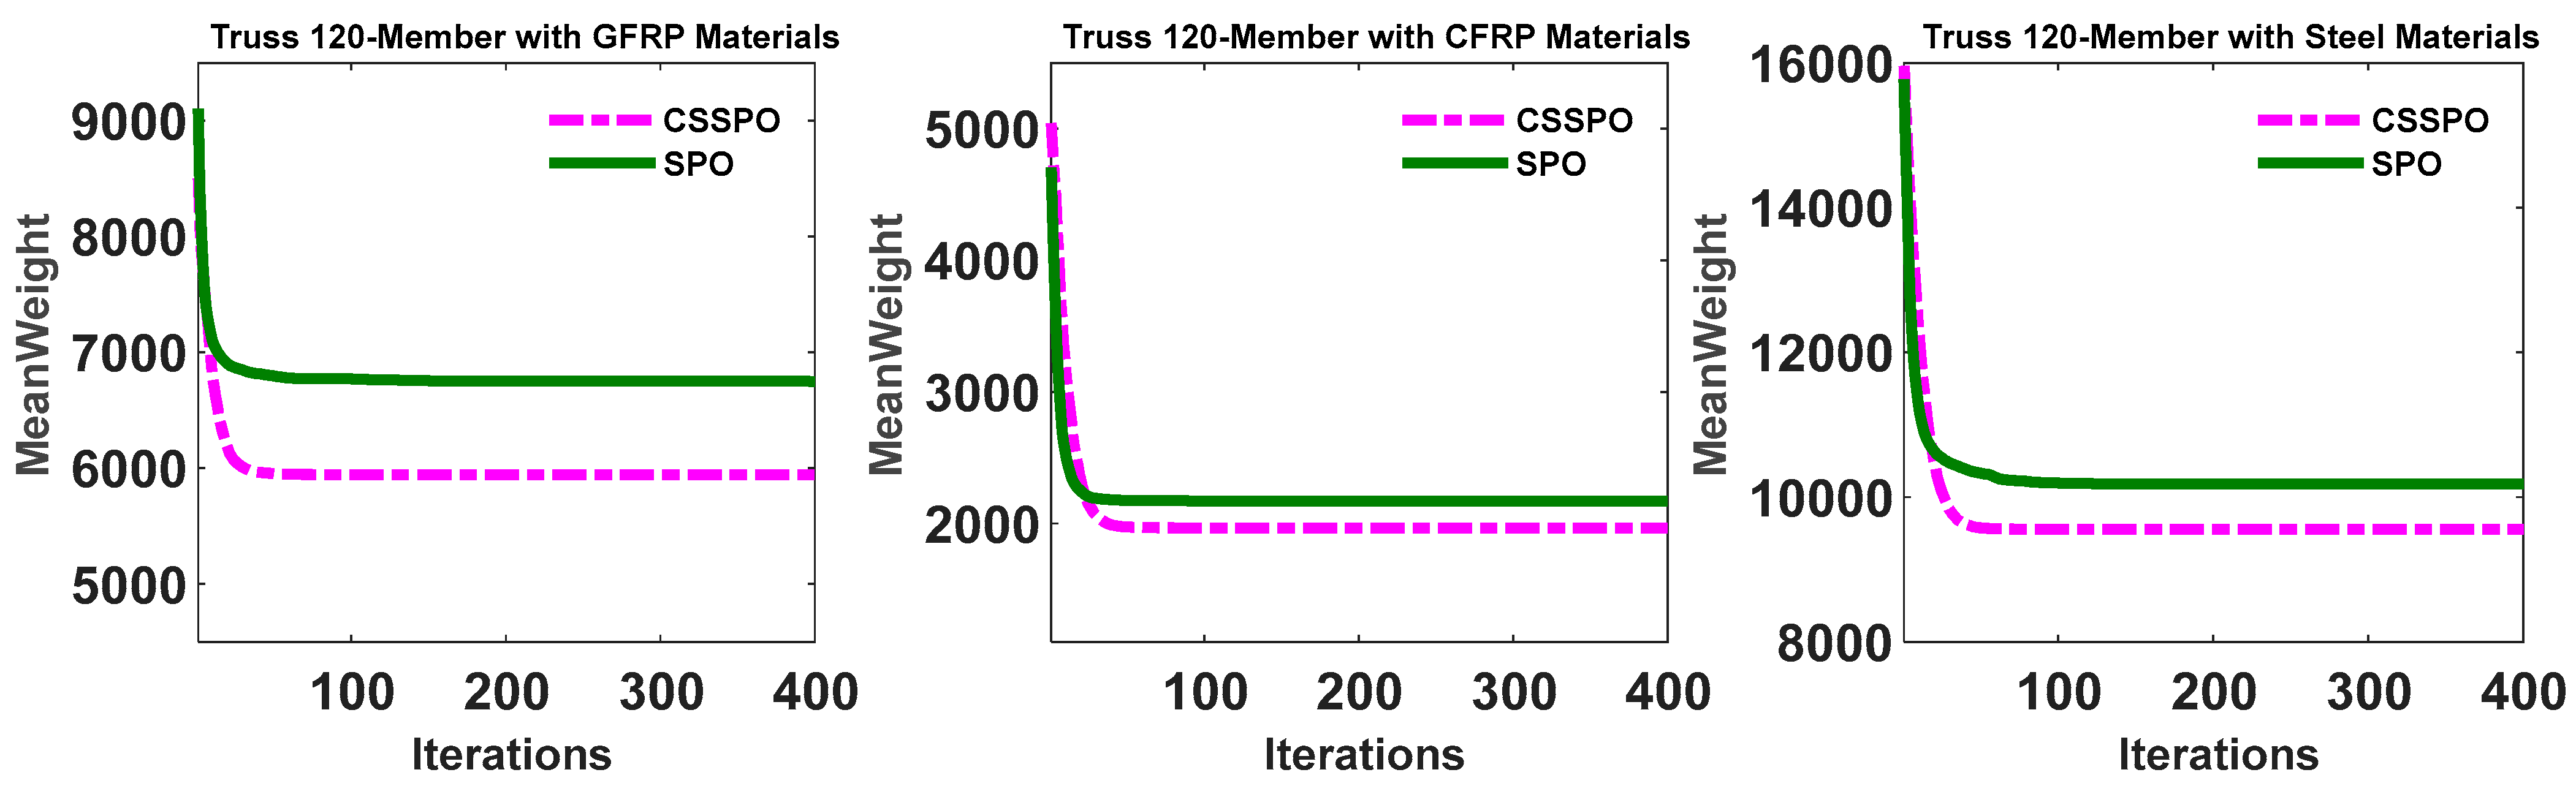
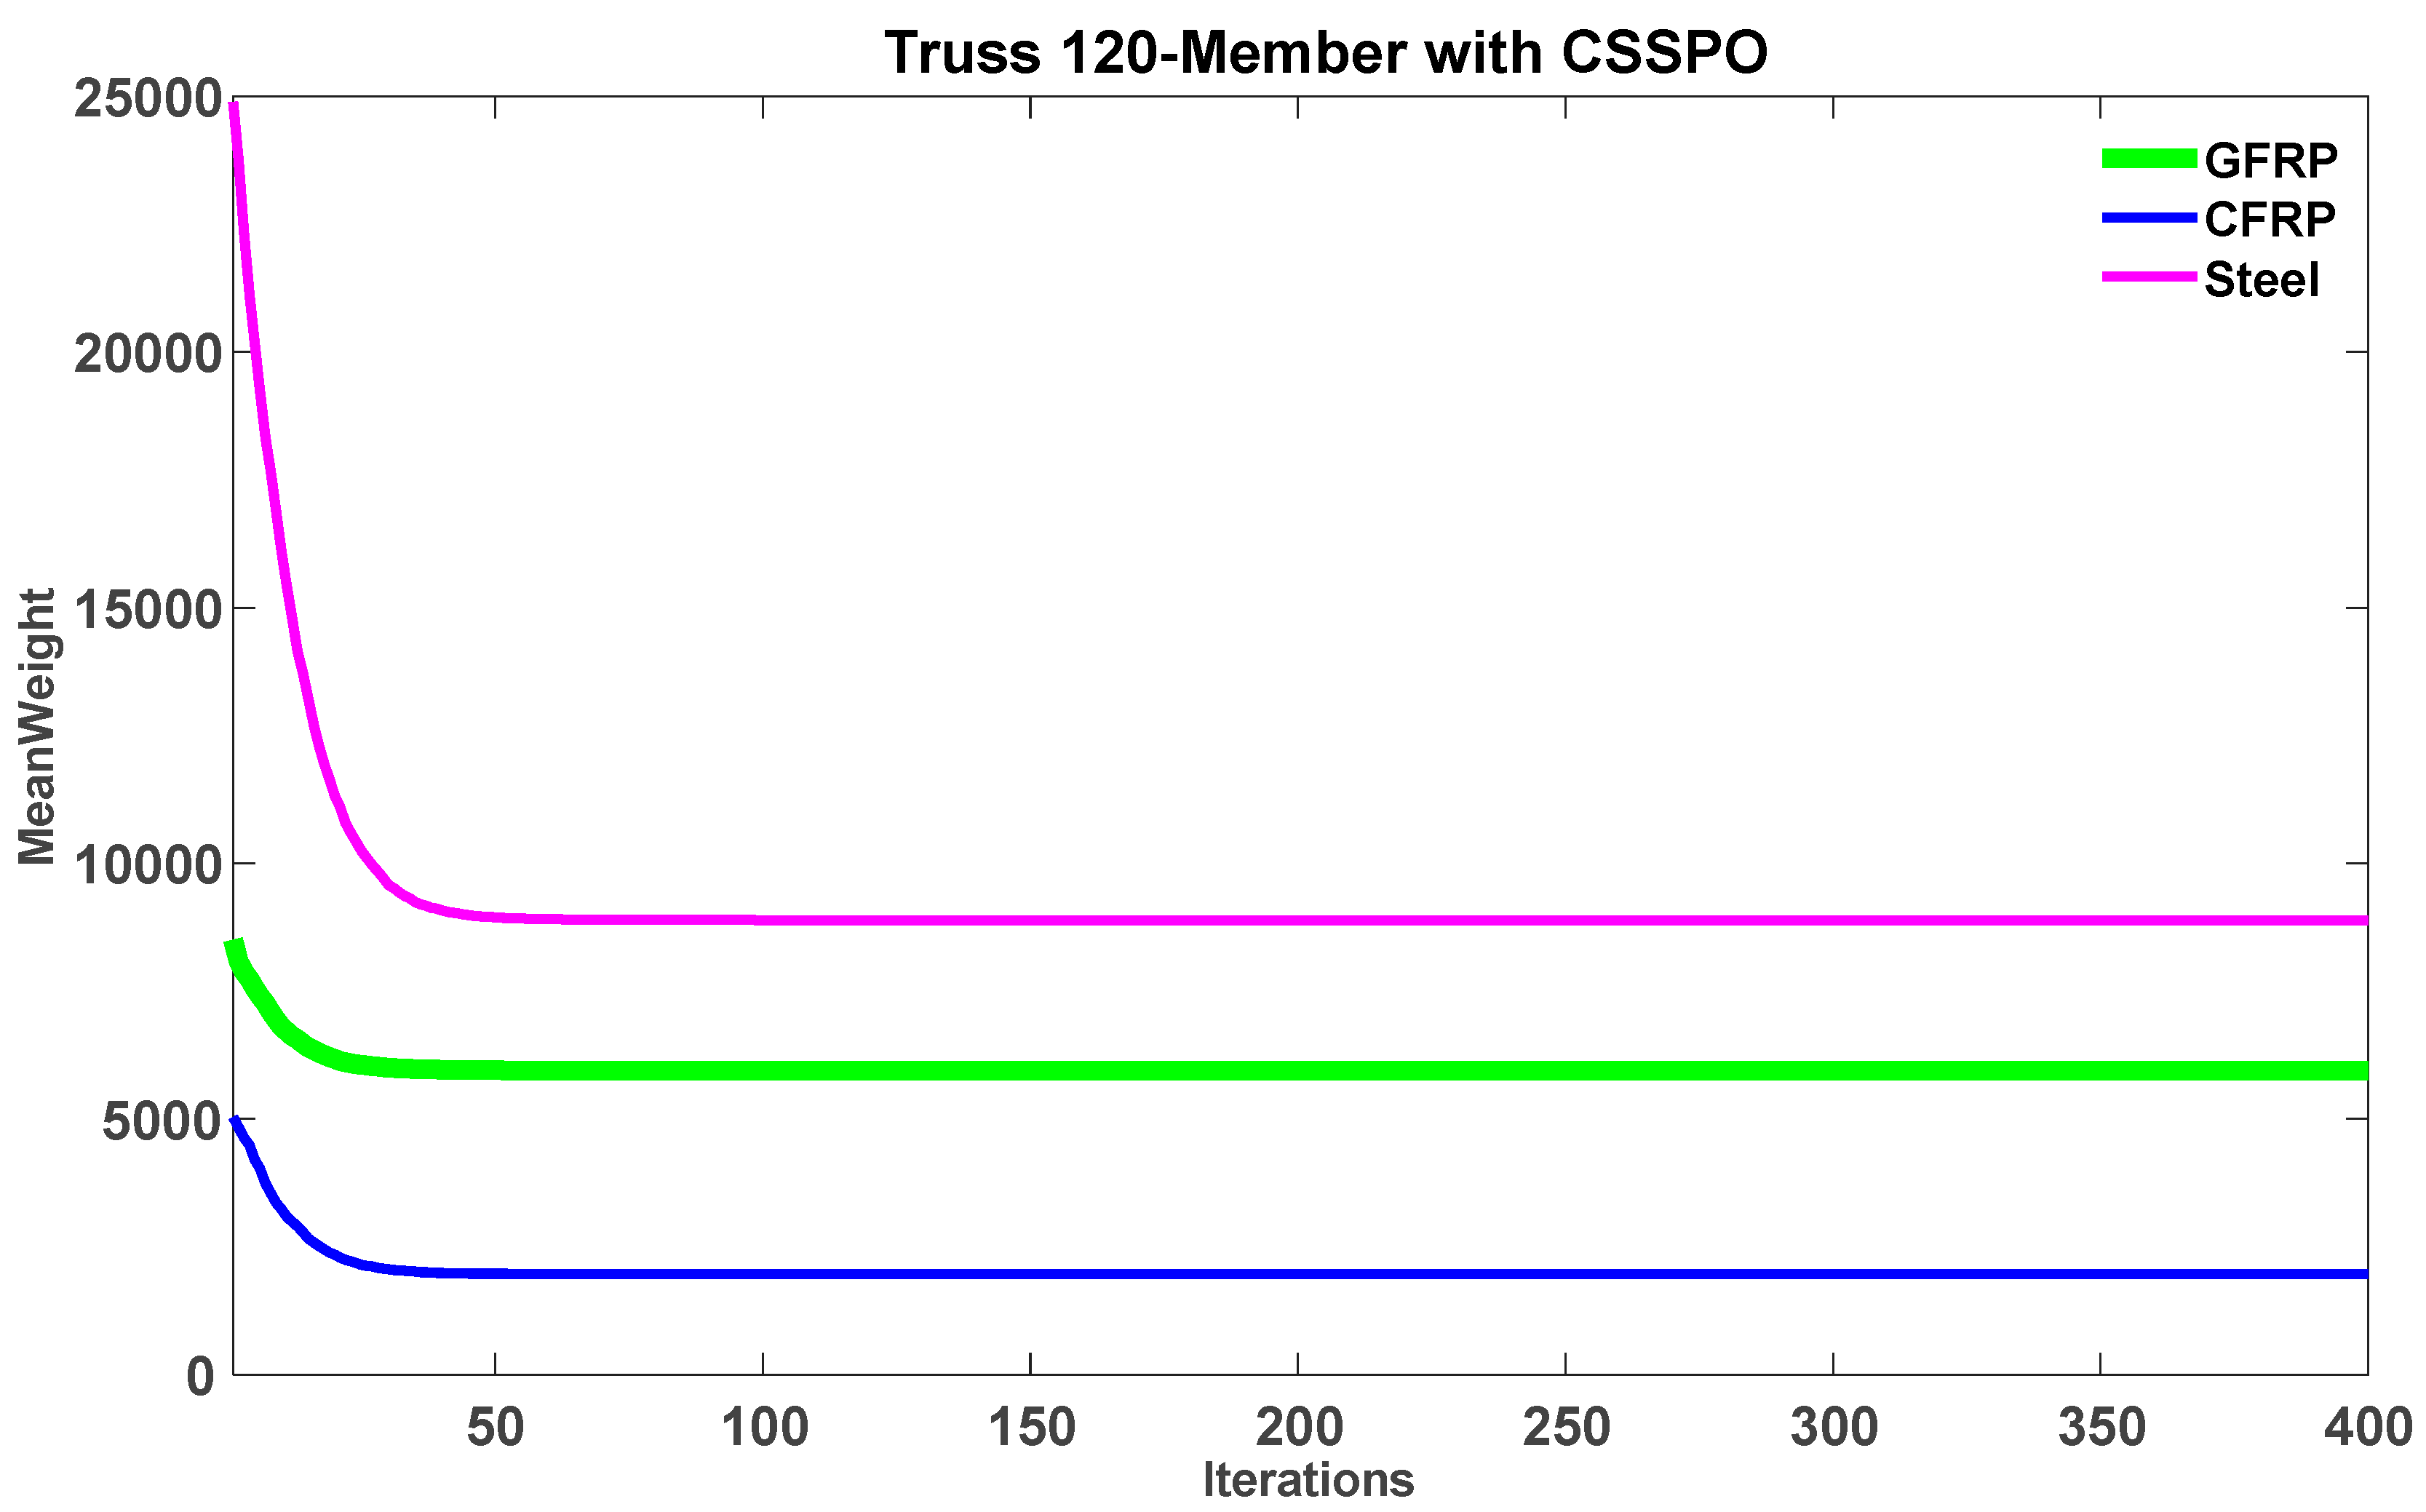
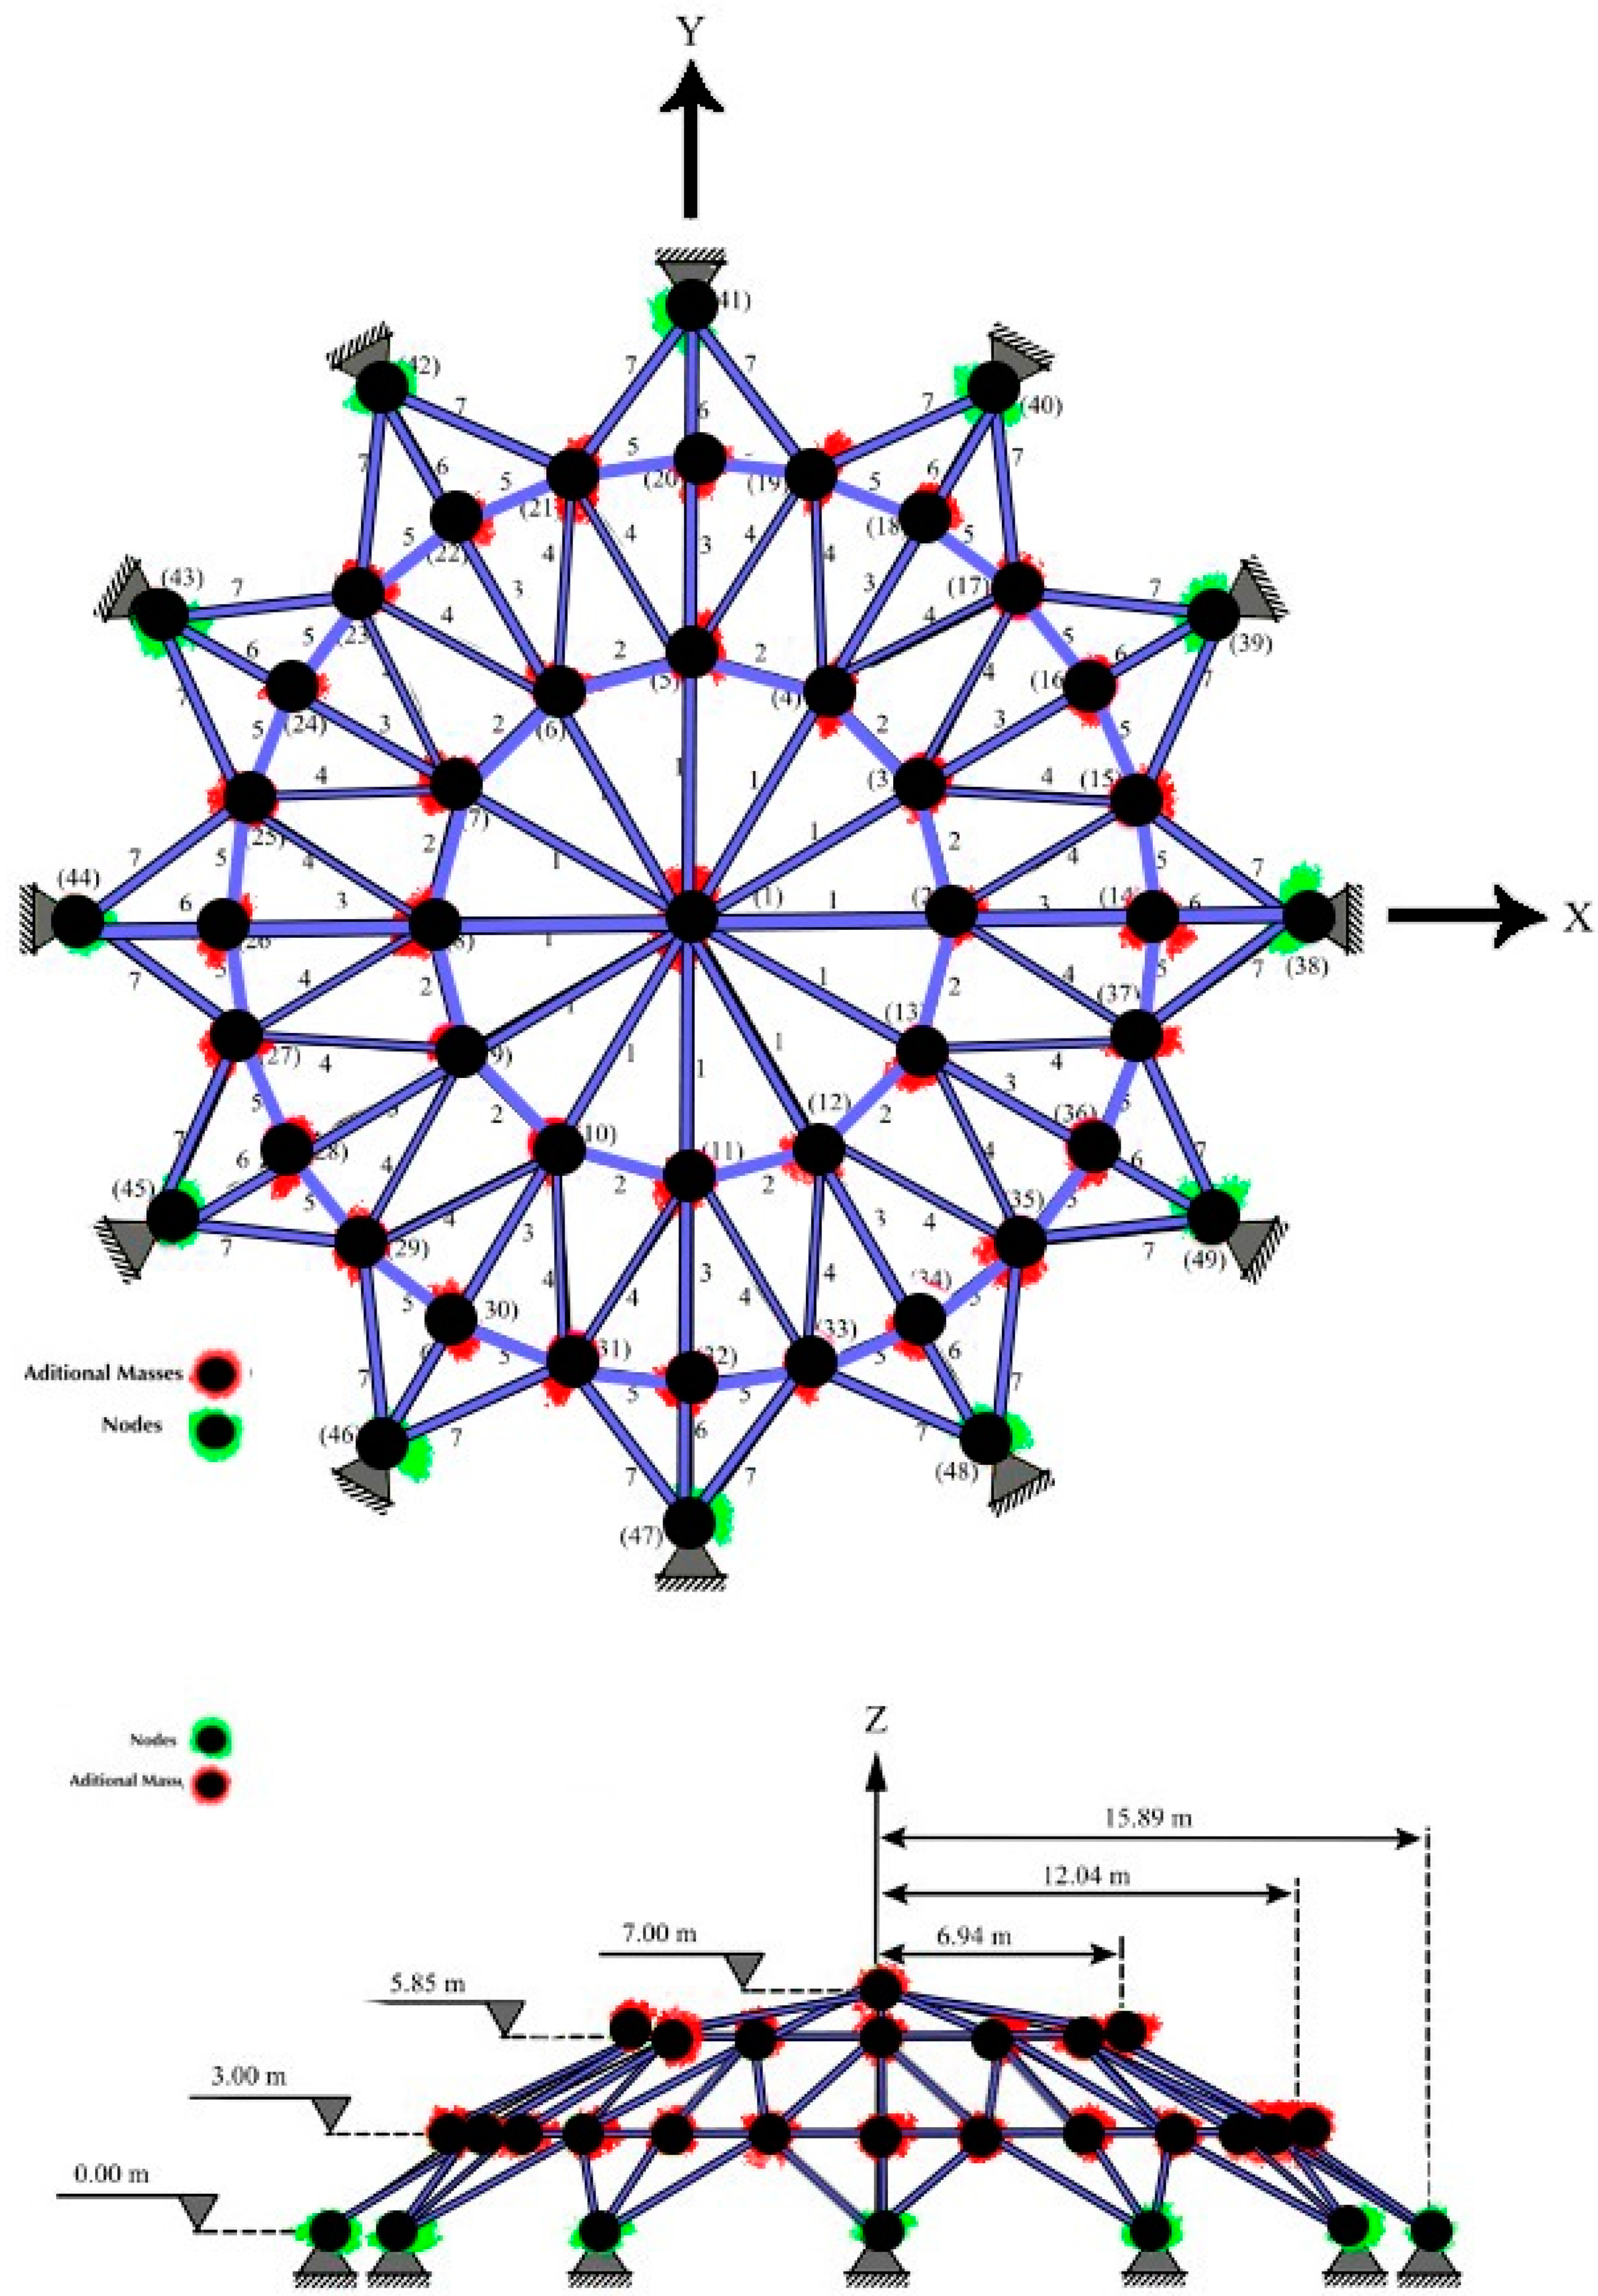
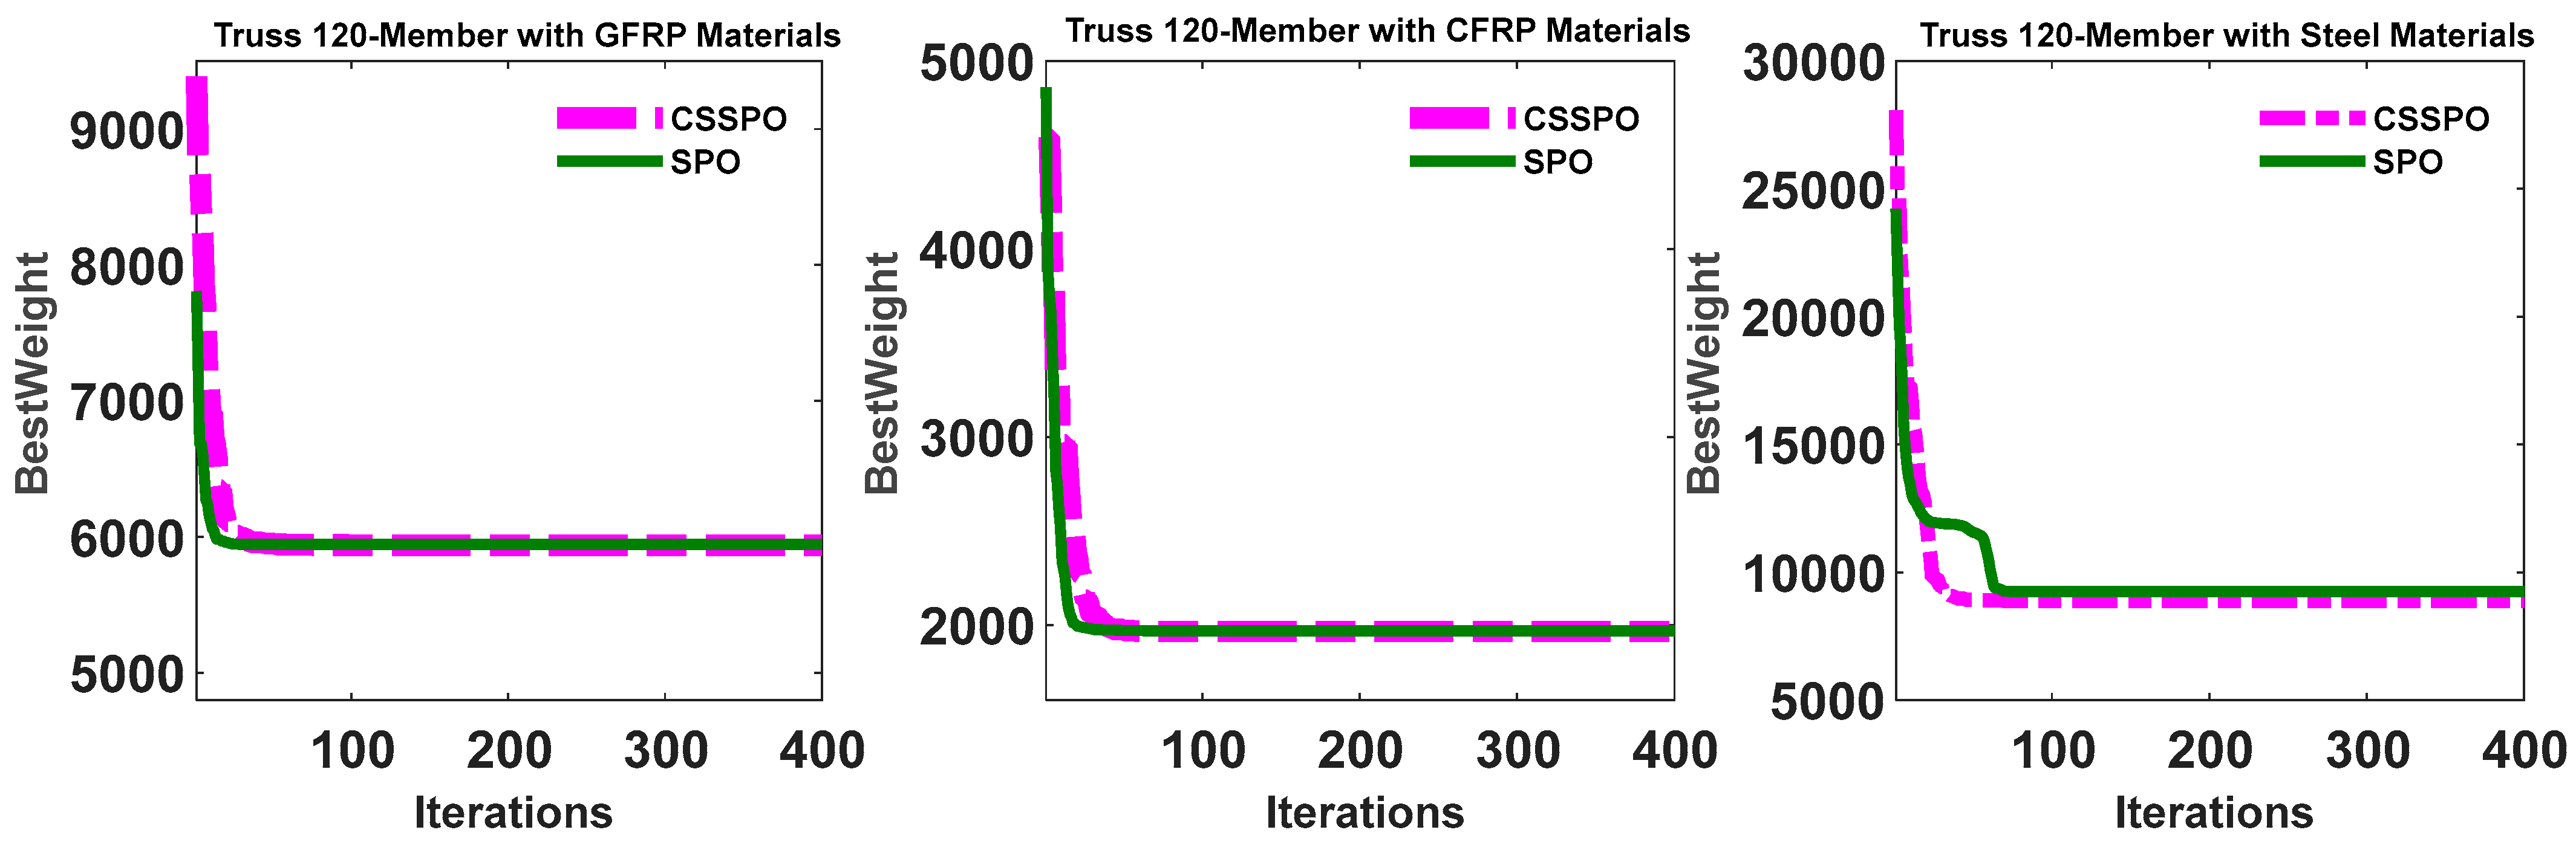
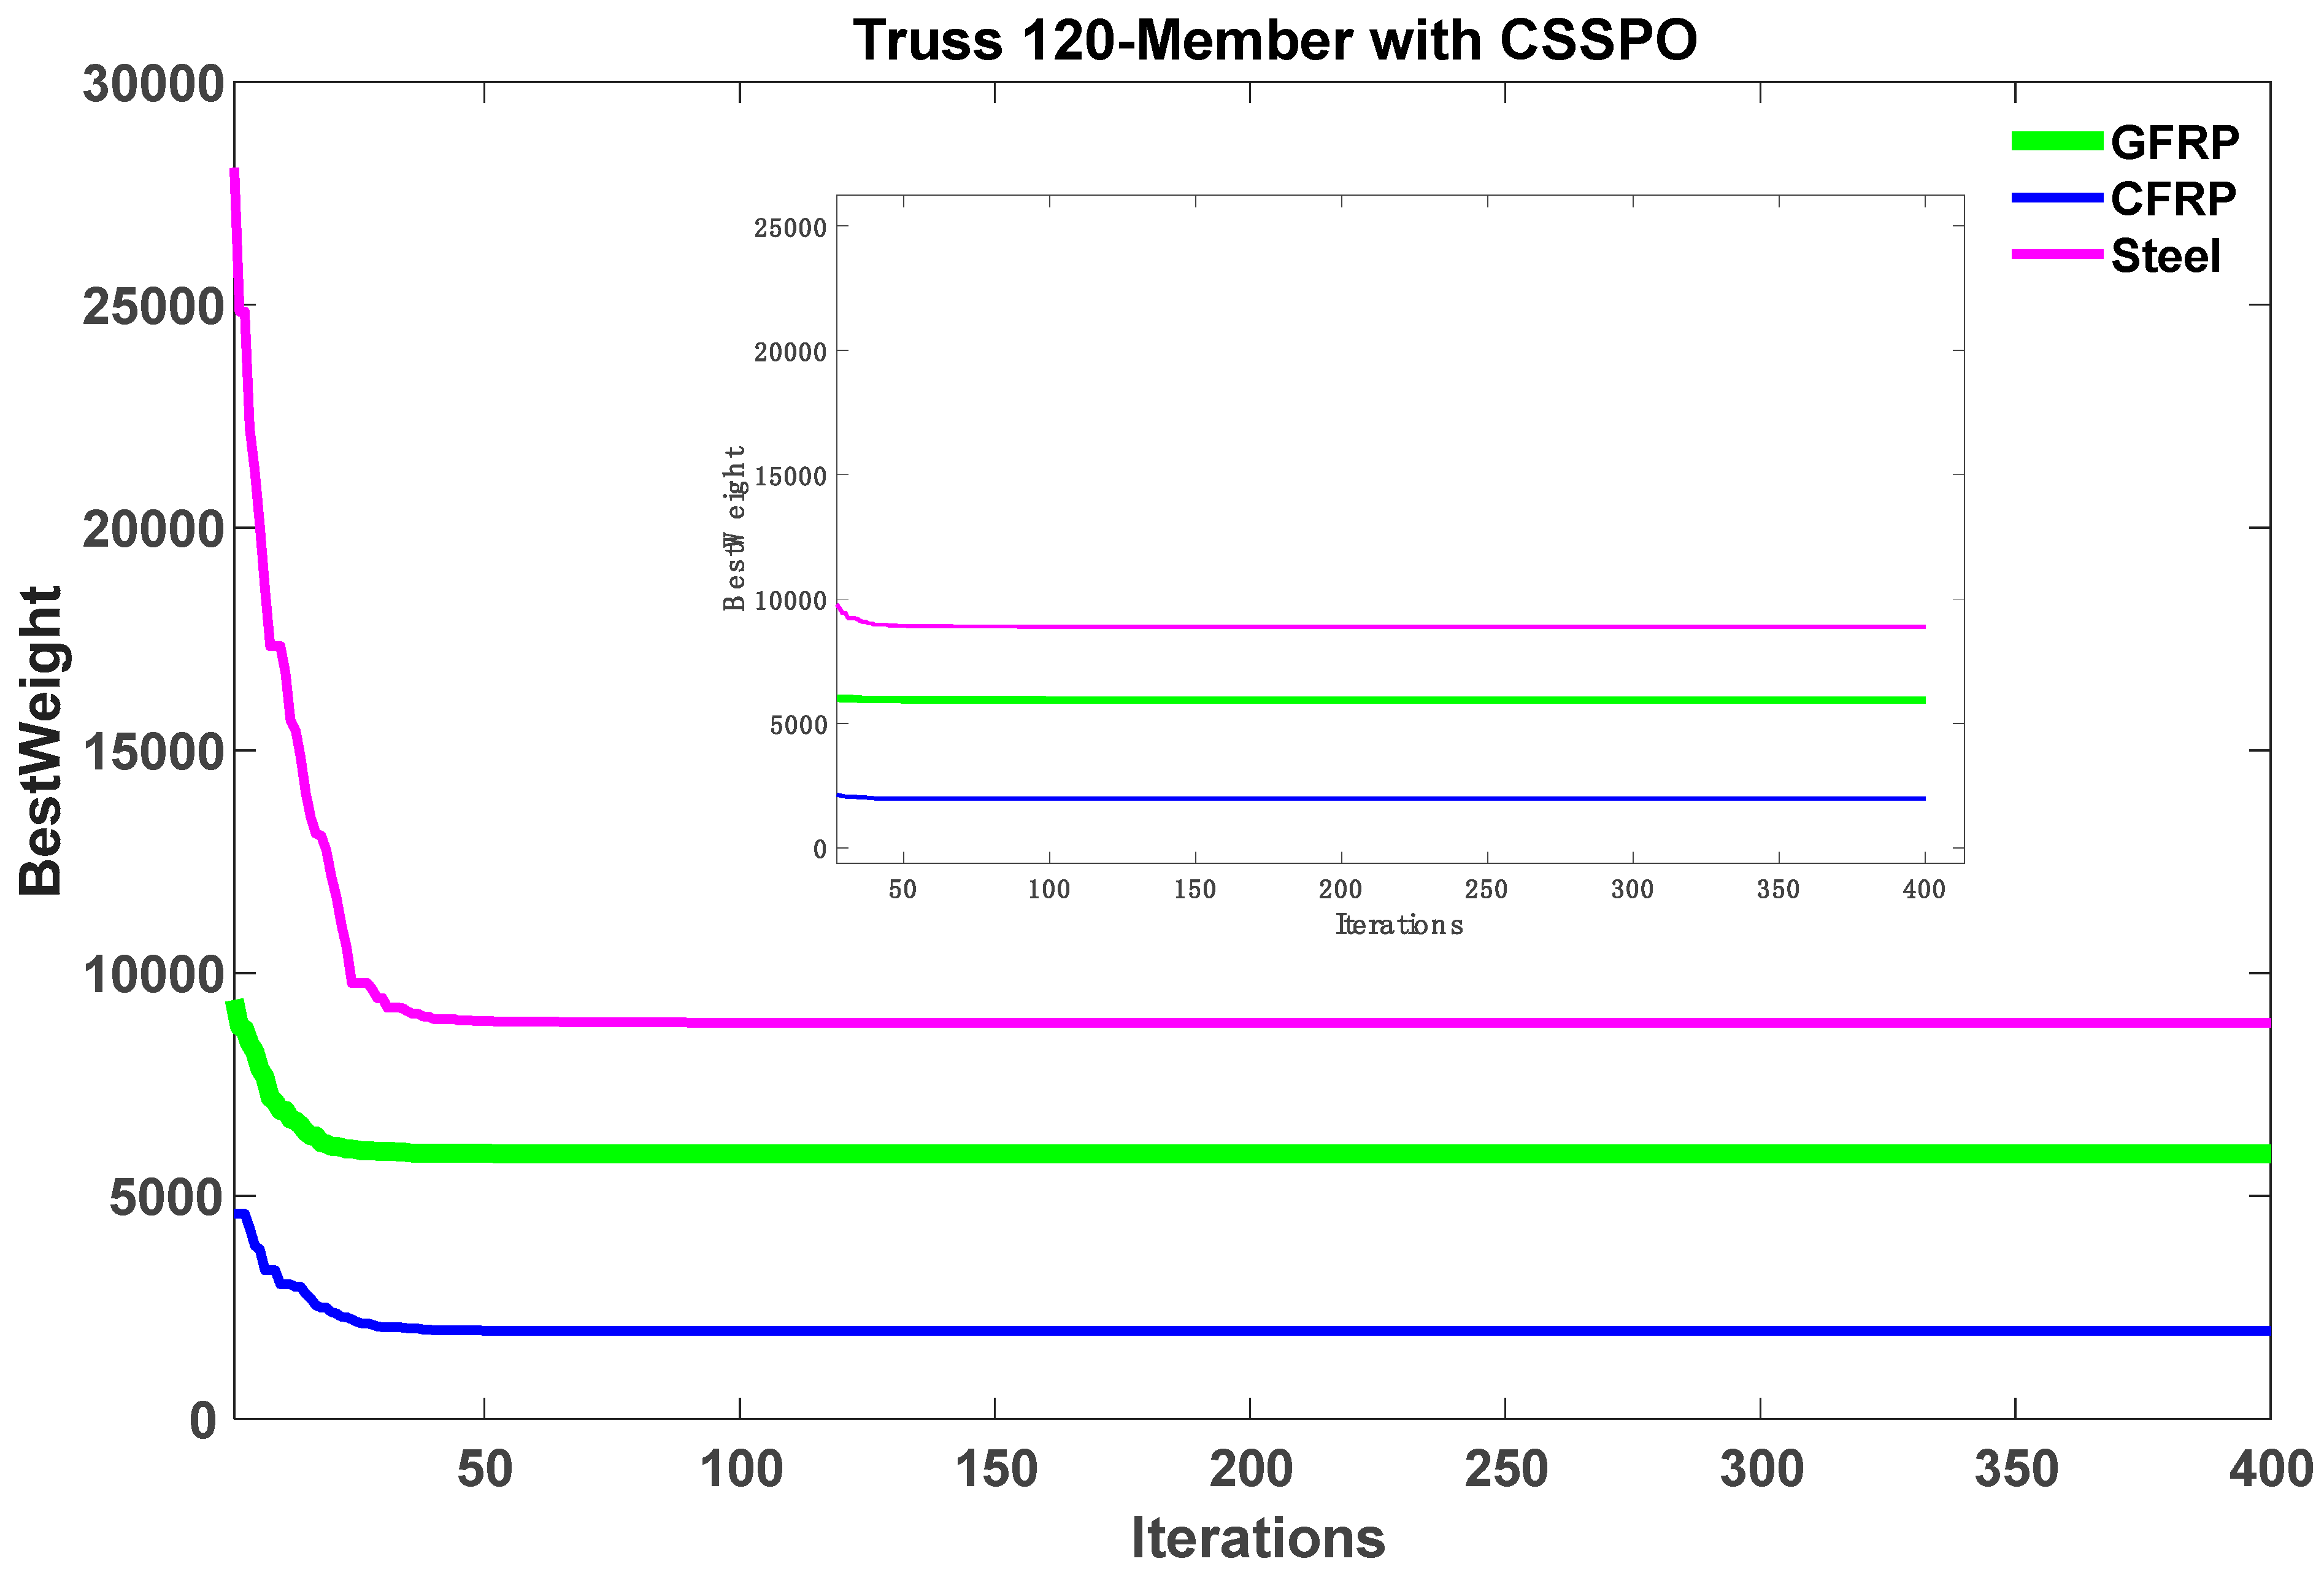
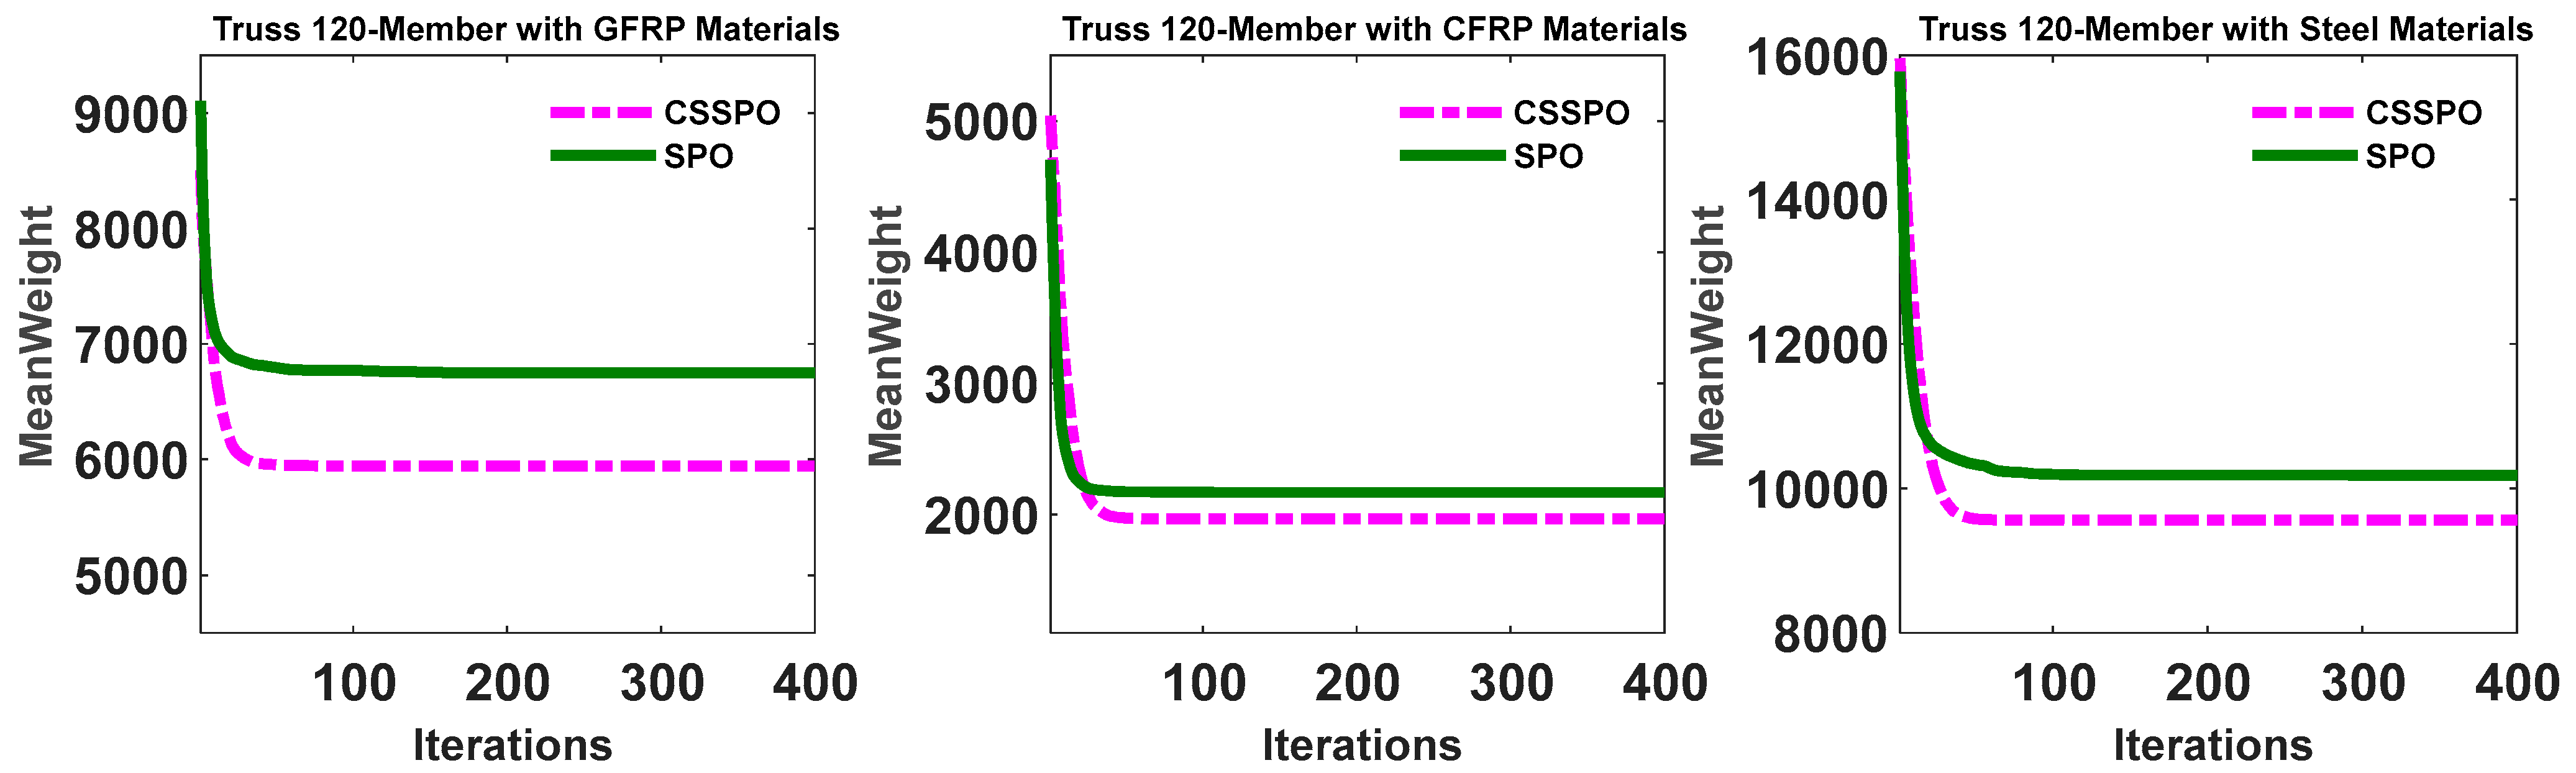
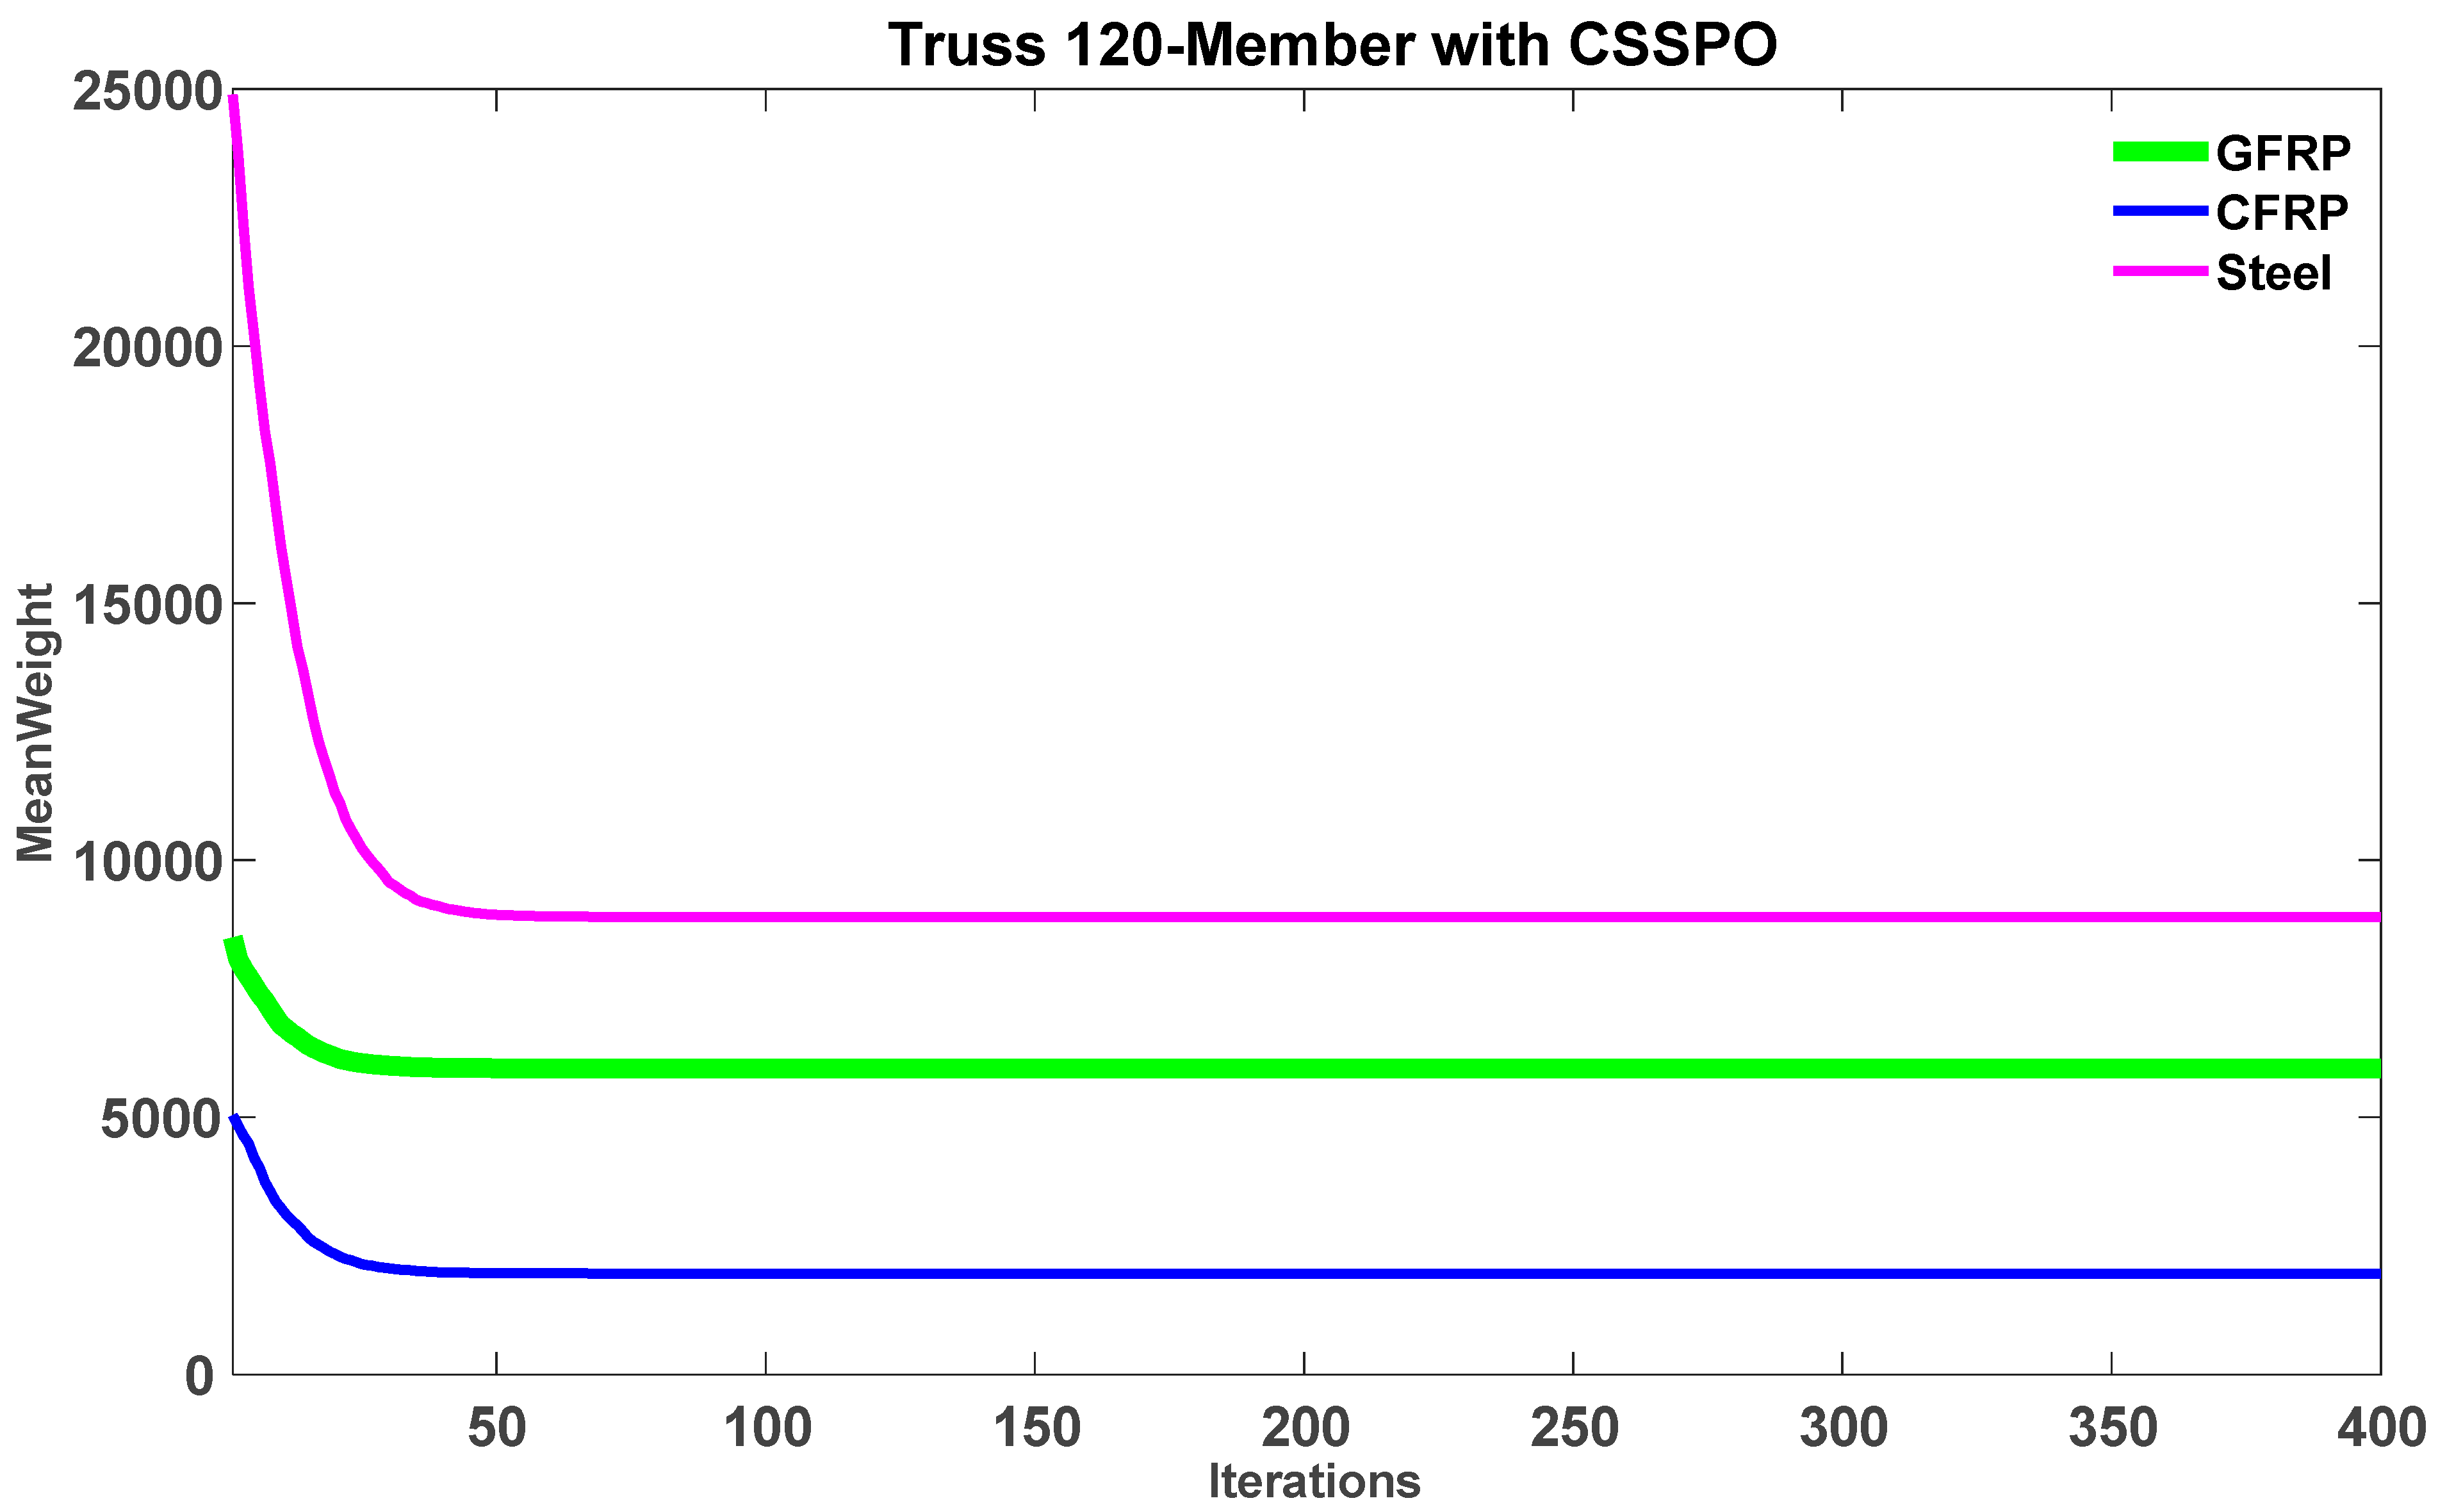
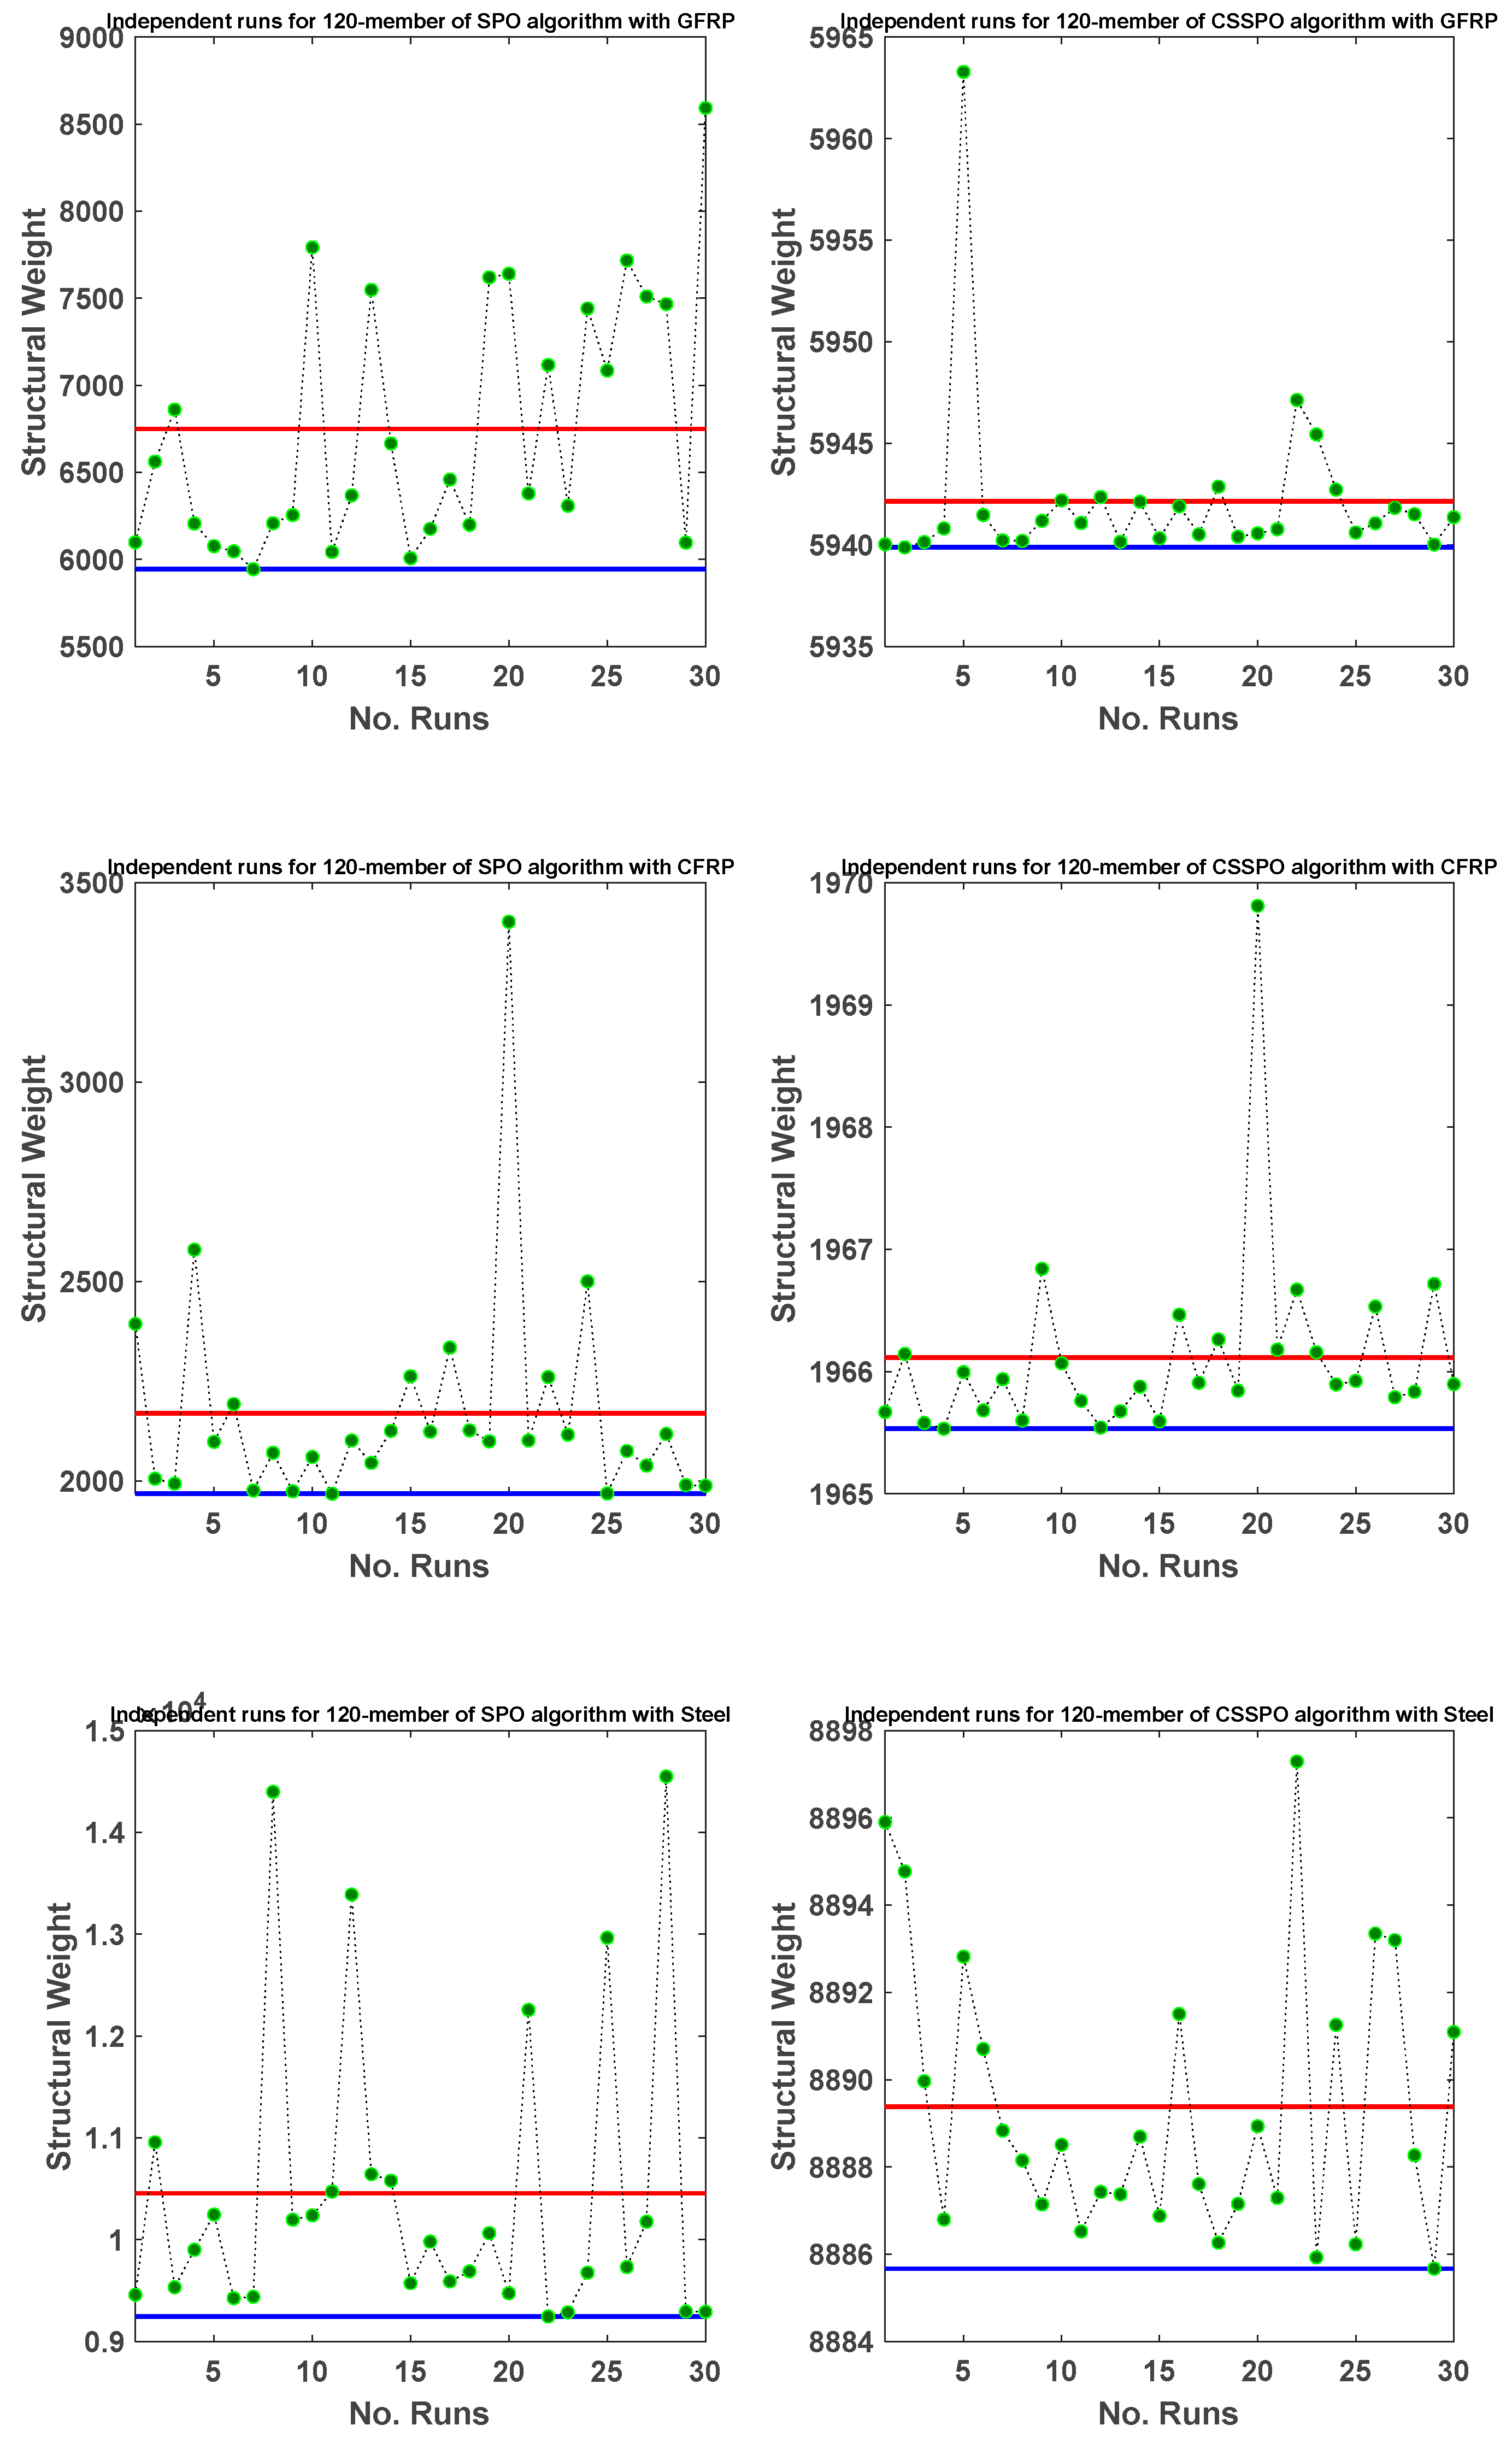
5.3. A 120-Member Dome Truss

The third benchmark problem is illustrated in Figure 20, which involves optimizing the size of a 120-member three-dimensional dome truss. This problem was initially studied by Kaveh and Zolghadr [39], and Table 2 summarizes the design considerations. Non-structural masses were added at node 1 (3000 kg ), nodes 2–13 (500 kg each), and the remaining free nodes (100 kg each). The elements were categorized into seven groups based on the assumption of symmetry around both the x-axis and y-axis. The cross-sectional areas varied between 1 and 129.3   cm 2 .
The size variables, optimal weight, mean weight, weight standard deviation (STD), and the number of function evaluations are presented in Table 7. As indicated in this table, the CSSPO was able to achieve the best weight of 1965.5323 kg by conducting a lower number of analyses with CFRP, and the corresponding SD was 0.7860. The GFRP material secured second place, with an optimal response of 5939.8775 kg , and the related SD was 4.2971 using the CSSPO algorithm. These findings suggest that the CSSPO has a lower computational cost while maintaining high accuracy for composite materials. In addition, Table 8 displays the outcomes of the natural frequencies. All the algorithms for different materials successfully adhered to the constraints without any violations, thereby satisfying the specified requirements.
Figure 21 displays the best weight convergence curves of the SPO and CSSPO using GFRP, CFRP, and steel for a 120-member truss. The evidence presented in the figure unequivocally demonstrates the superior performance of CSSPO in comparison to SPO. Figure 22 compares the best convergence curves for CFRP, GFRP, and steel. The figure shows that CFRP achieved a feasible solution and ranked first among all the materials studied in terms of weight. Additionally, using CSSPO with CFRP resulted in the lowest average weight among all the materials reviewed (refer to Figure 23). Based on the findings depicted in this figure, it is evident that CSSPO surpassed all other materials in terms of performance. According to Figure 24, among all its competitors, CFRP obtained the best average weight of 1966.1123 kg and was ranked first.
The CSSPO approach was found to be more effective than the standard version of the SPO, achieving the lowest weight for all the materials. This indicates that the new approach is an optimal design enhancement that utilizes the existing algorithm. Moreover, according to Table 8, this approach continues to meet the frequency constraints. The diagram depicted in Figure 25 illustrates 30 distinct runs of the ultimate weights for both the SPO and CSSPO. This diagram illustrates the lowest result achieved, represented by the blue line, while the red line represents the mean of all 30 runs. In reference to this figure, there is a notable proximity between the best and mean lines for most of the results. This indicates that the utilization of CFRP in combination with the CSSPO yields significantly superior outcomes compared to other materials.

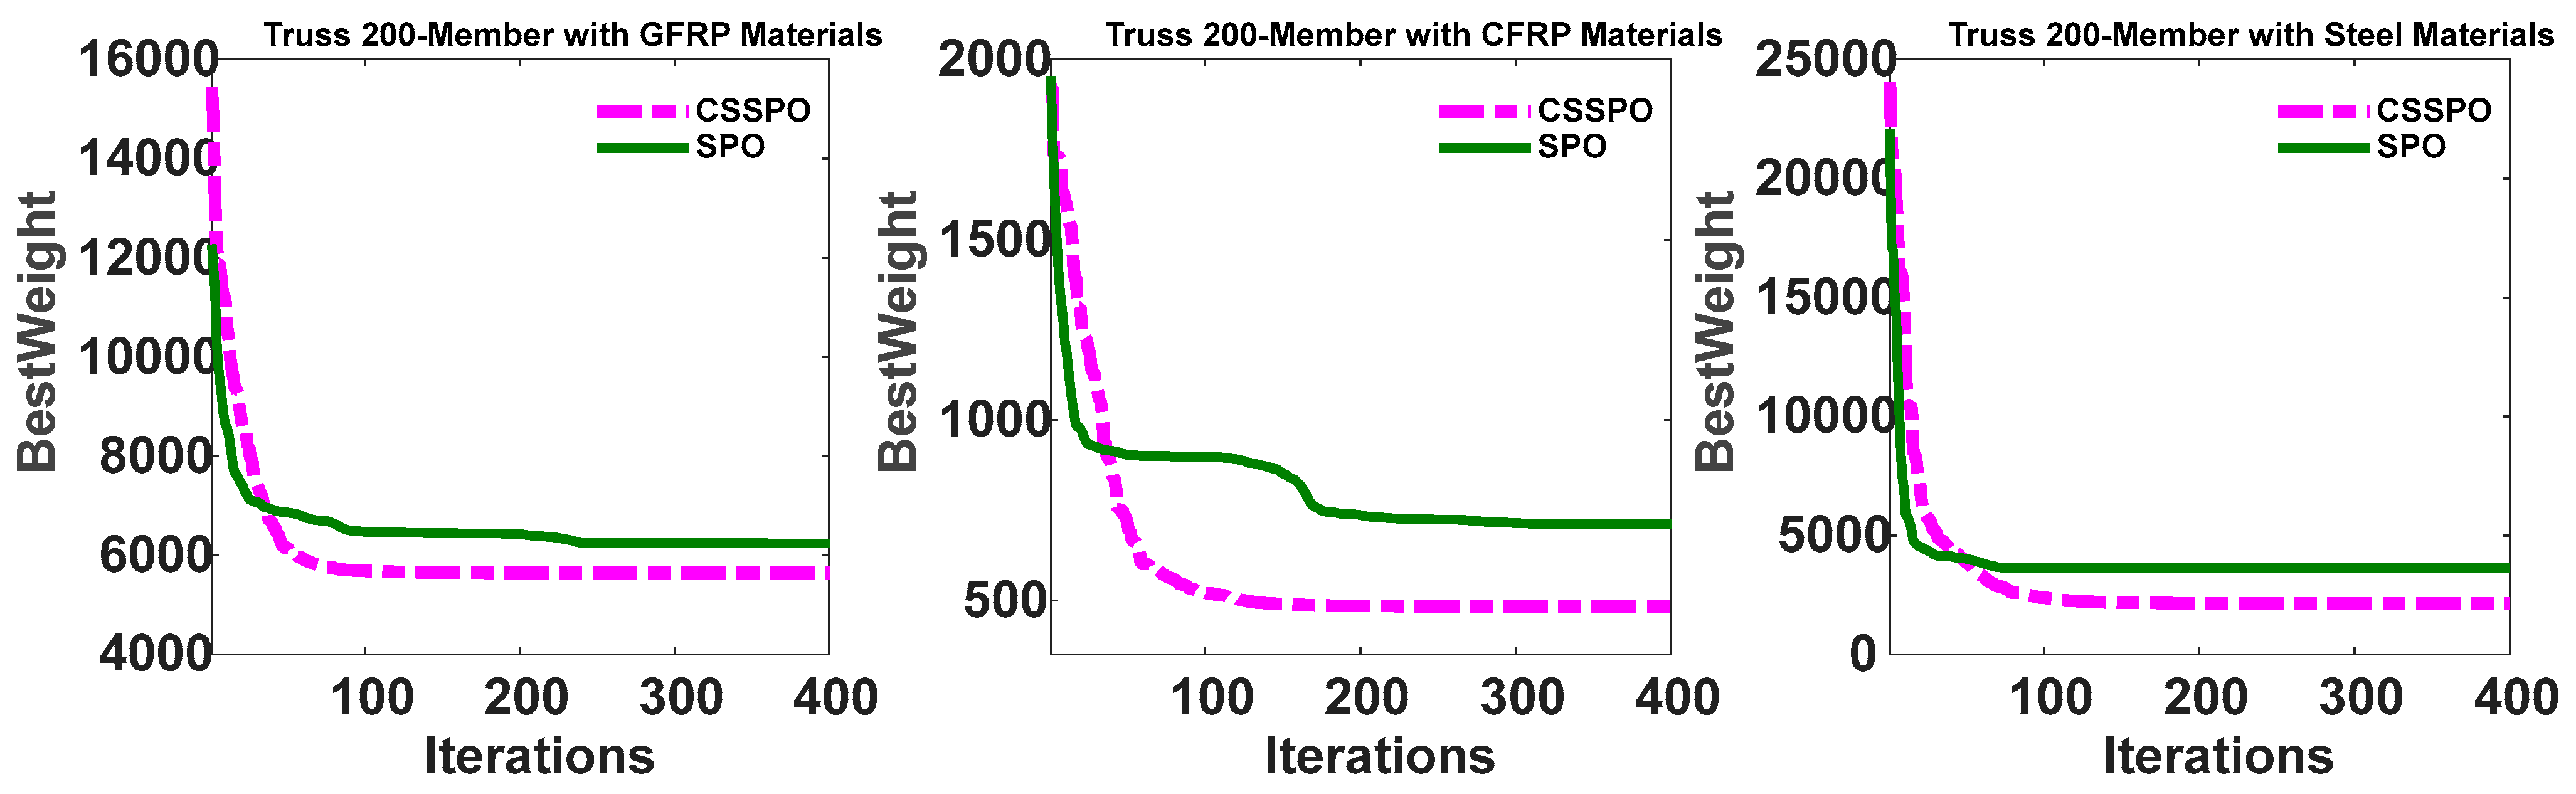
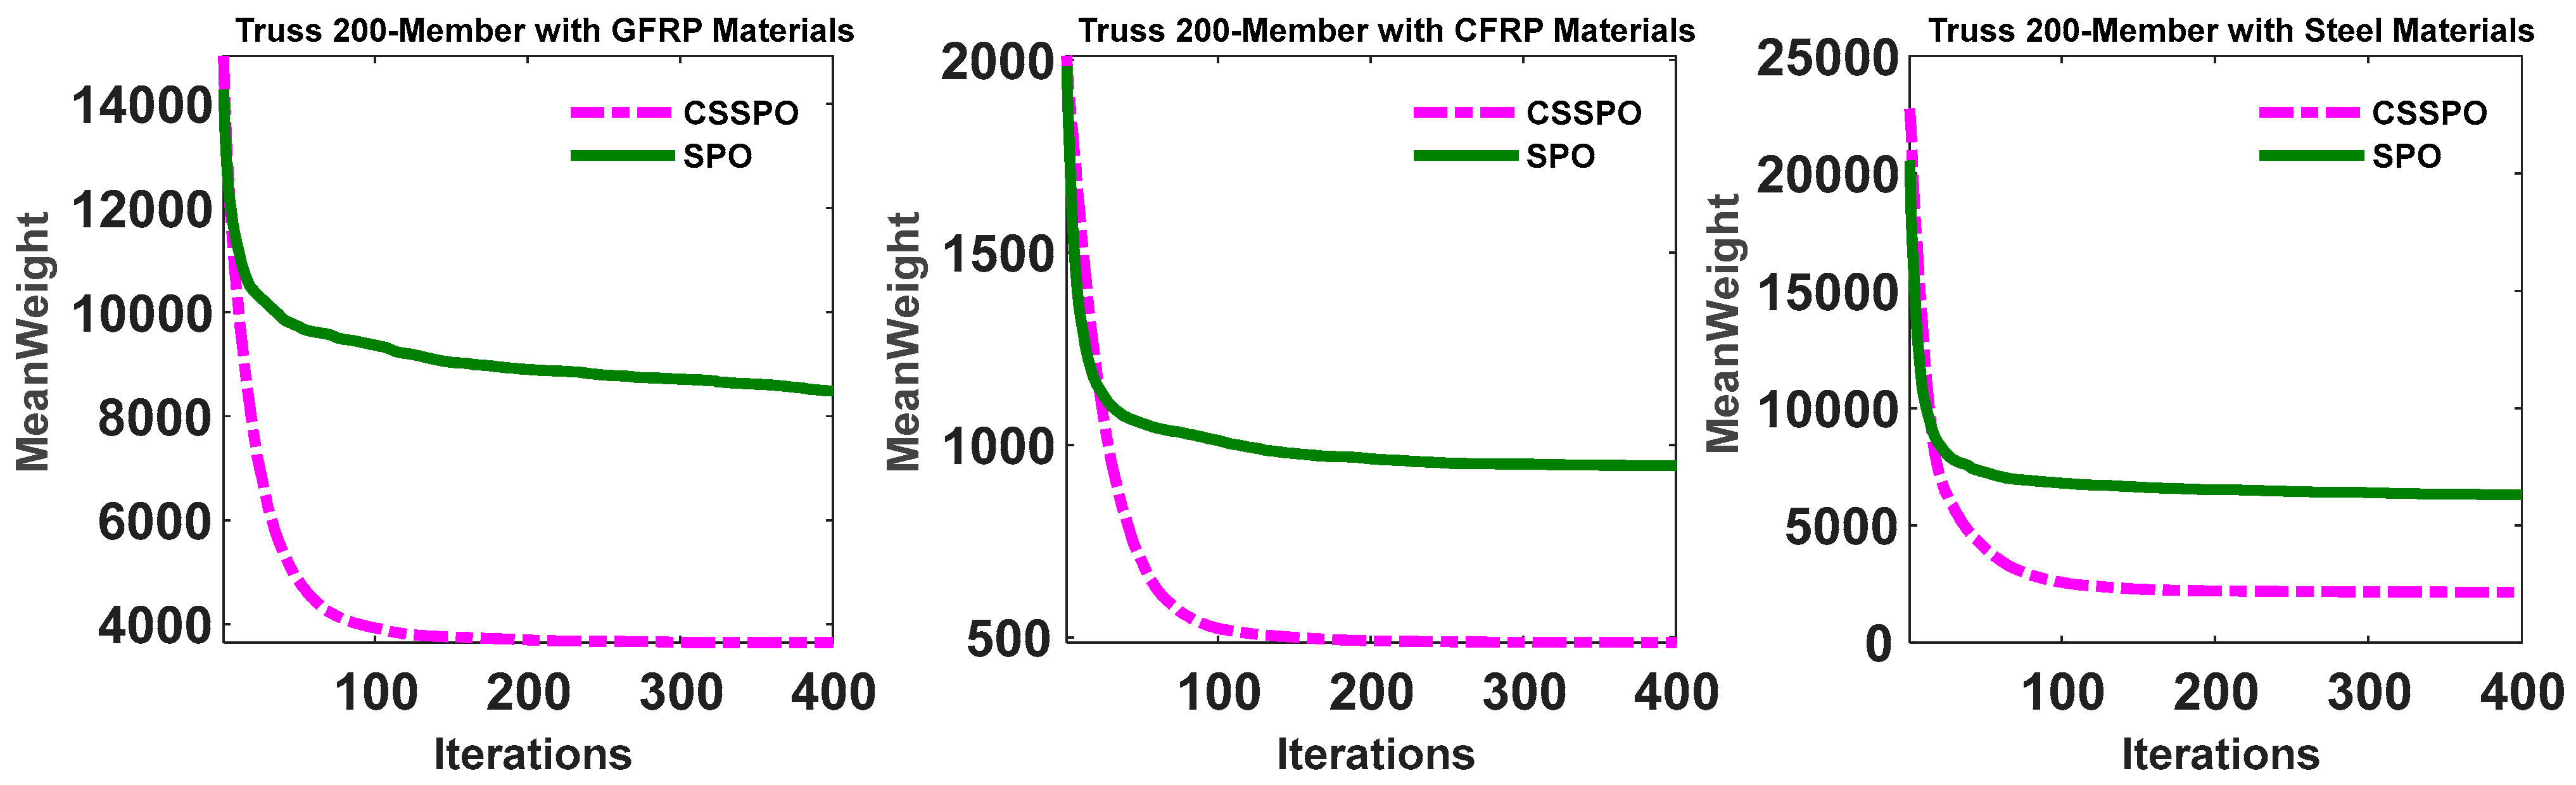
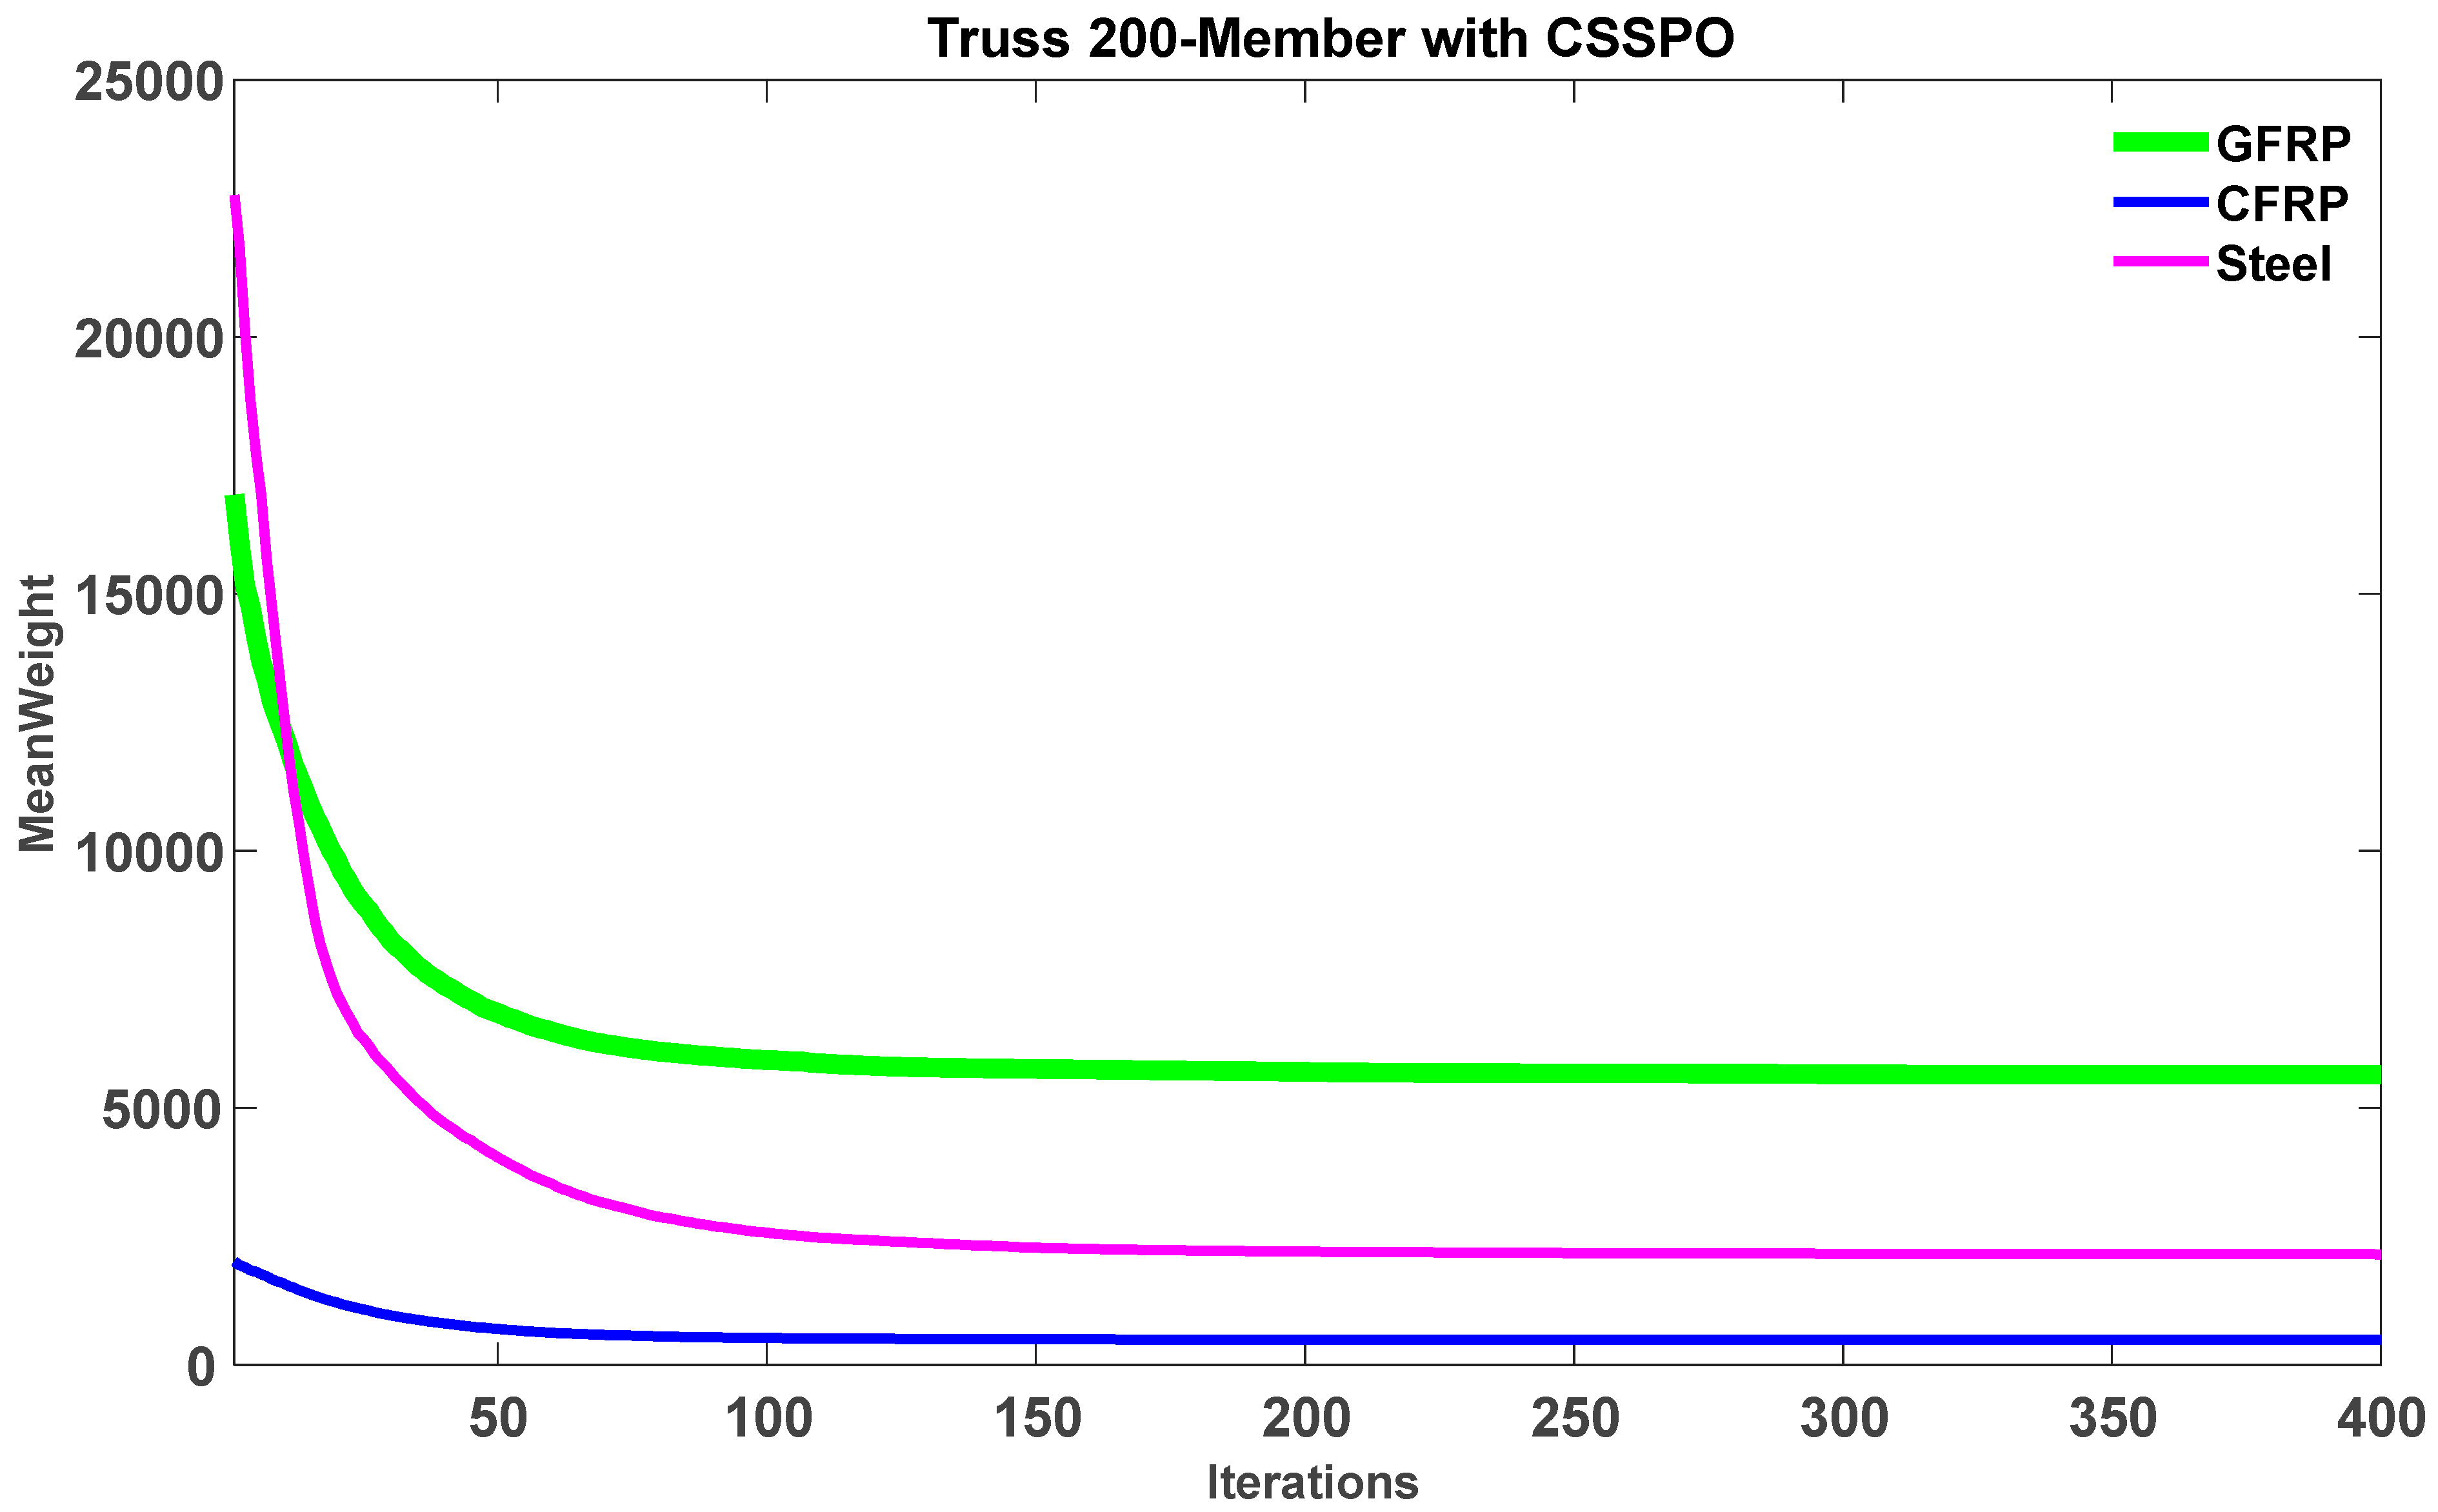
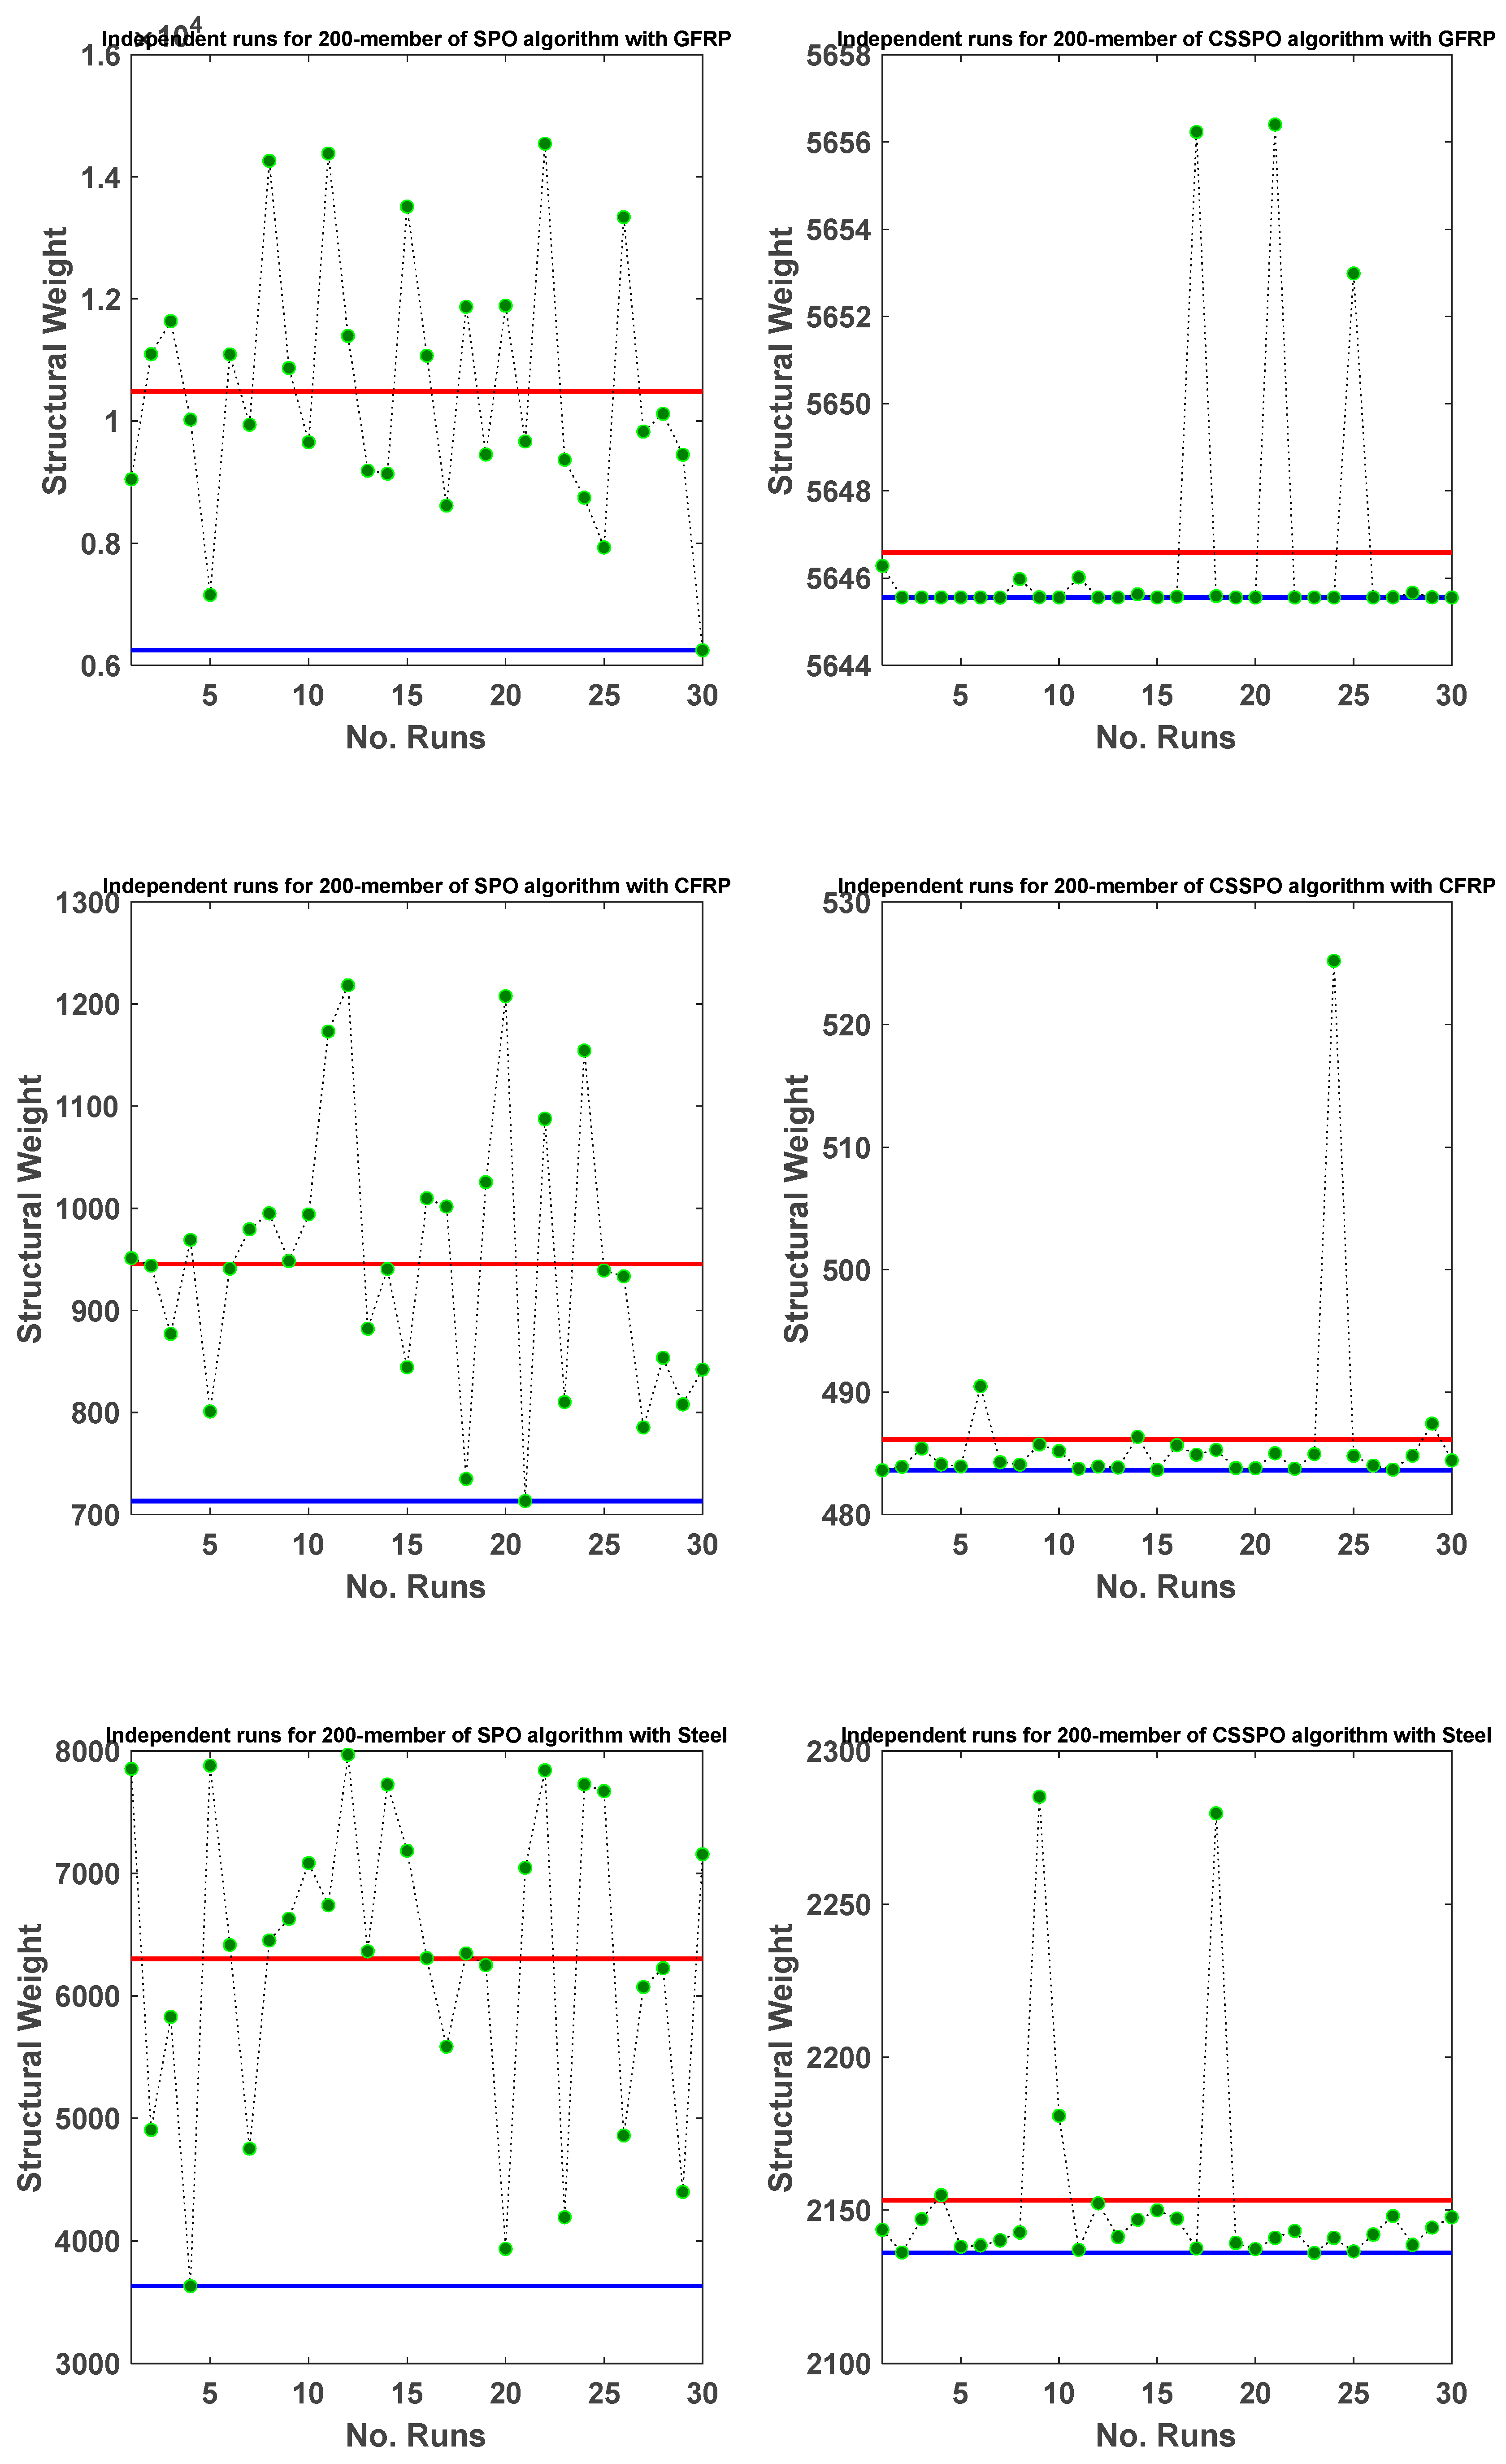
5.4. A 200-Member Planar Truss

This section addresses the fourth test problem, which involves minimizing the weight of a planar structure consisting of 200-member planar truss, as shown in Figure 26. The problem encompasses 29 sizing variables that pertain to the cross-sectional areas of the element groups, as outlined in Table 9. The frequency constraints are set to ω 1 5   Hz ,   ω 2 10   Hz ,   ω 3 15   Hz . Non-structural masses of 100 kg are attached to the truss’s upper nodes (1–5). Table 10 presents the optimizing design of the mentioned structure with three different materials, showing that CFRP with fewer function number evaluations yielded the lightest weight of 483.5991 kg with the CSSPO. The best results of CFRP with the CSSPO algorithm were lighter than the other materials. This demonstrates the effectiveness of the hybrid method with composite material over the other algorithms and materials studied in this test problem.
Table 11 demonstrates the natural frequencies of the best SPO and CSSPO methods designed with CFRP, GFRP, and steel materials. Each algorithm conscientiously complies with the constraints, ensuring a complete absence of violations and effectively meeting the prescribed criteria. According to the findings, the CSSPO with CFRP algorithm was able to generate the best possible answer, with an optimal weight of 483.5991 kg and SD = 7.5441. This specific instance created a significant challenge for metaheuristic techniques, primarily due to the significant number of variables. Several metaheuristics were found to be ineffective in resolving this issue. However, the CSSPO algorithm demonstrated satisfactory outcomes in contrast to the alternative approaches.
Figure 27 shows the best convergence curves for both methods with CFRP, GFRP, and steel materials. In reference to this figure, the SPO and CSSPO algorithms reached the optimal point, but the CSSPO had a faster convergence rate than the SPO. Figure 28 shows the best convergence curves for the hybrid version of SPO for CFRP, GFRP, and steel materials. The evidence presented in this figure highlights the substantial superiority of the CSSPO and CFRP combination solution over other materials.
Figure 29 illustrates that the average weight of the CSSPO using the CFRP algorithm was lower than that of other materials, providing evidence of the superior performance of the CSSPO algorithm. Moreover, CFRP was ranked first among all competitors, with the best average weight of 486.1037 kg , as depicted in Figure 30. In this figure, steel claimed the second position in the rankings, while GFRP achieved last place. Figure 31 presents the final weight for this investigation, which was derived from 30 separate runs of the SPO and CSSPO. In this figure, the blue line represents the minimum achievable result, while the red line represents the average of all 30 runs. In general, these findings show that the CSSPO algorithm with CFRP performed better than the other algorithms that were examined, both in terms of its overall performance and its accuracy.

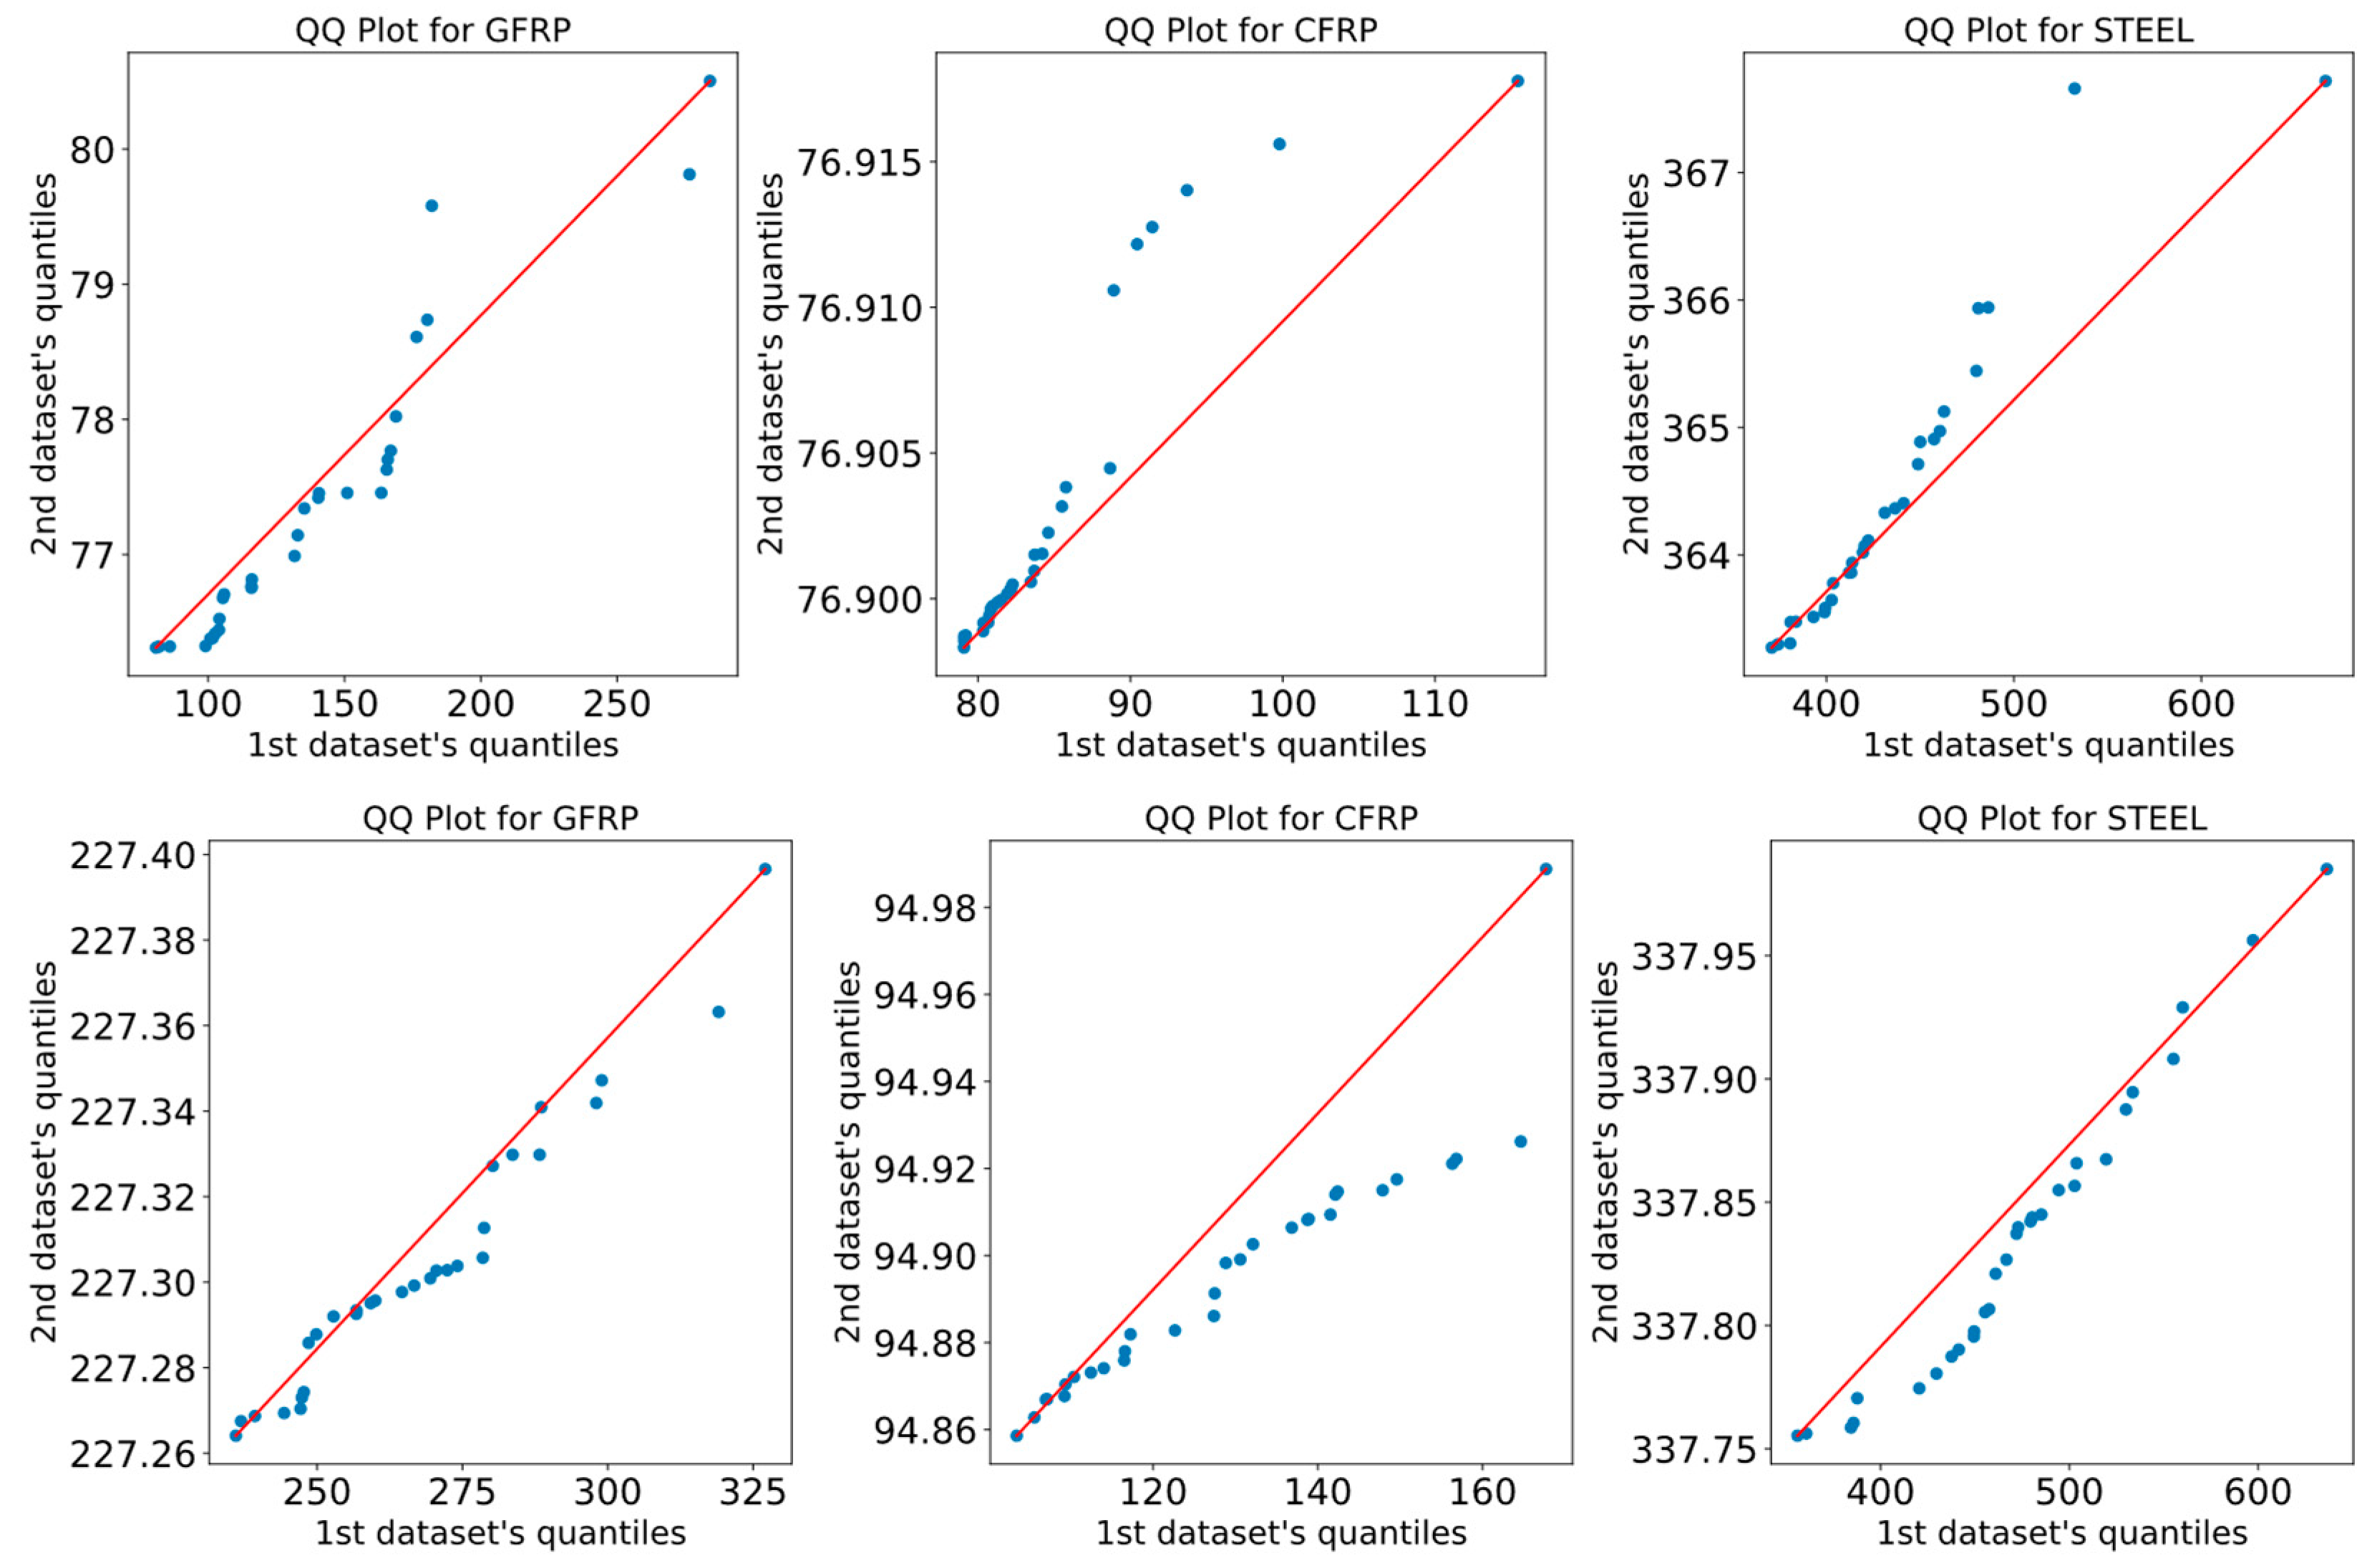
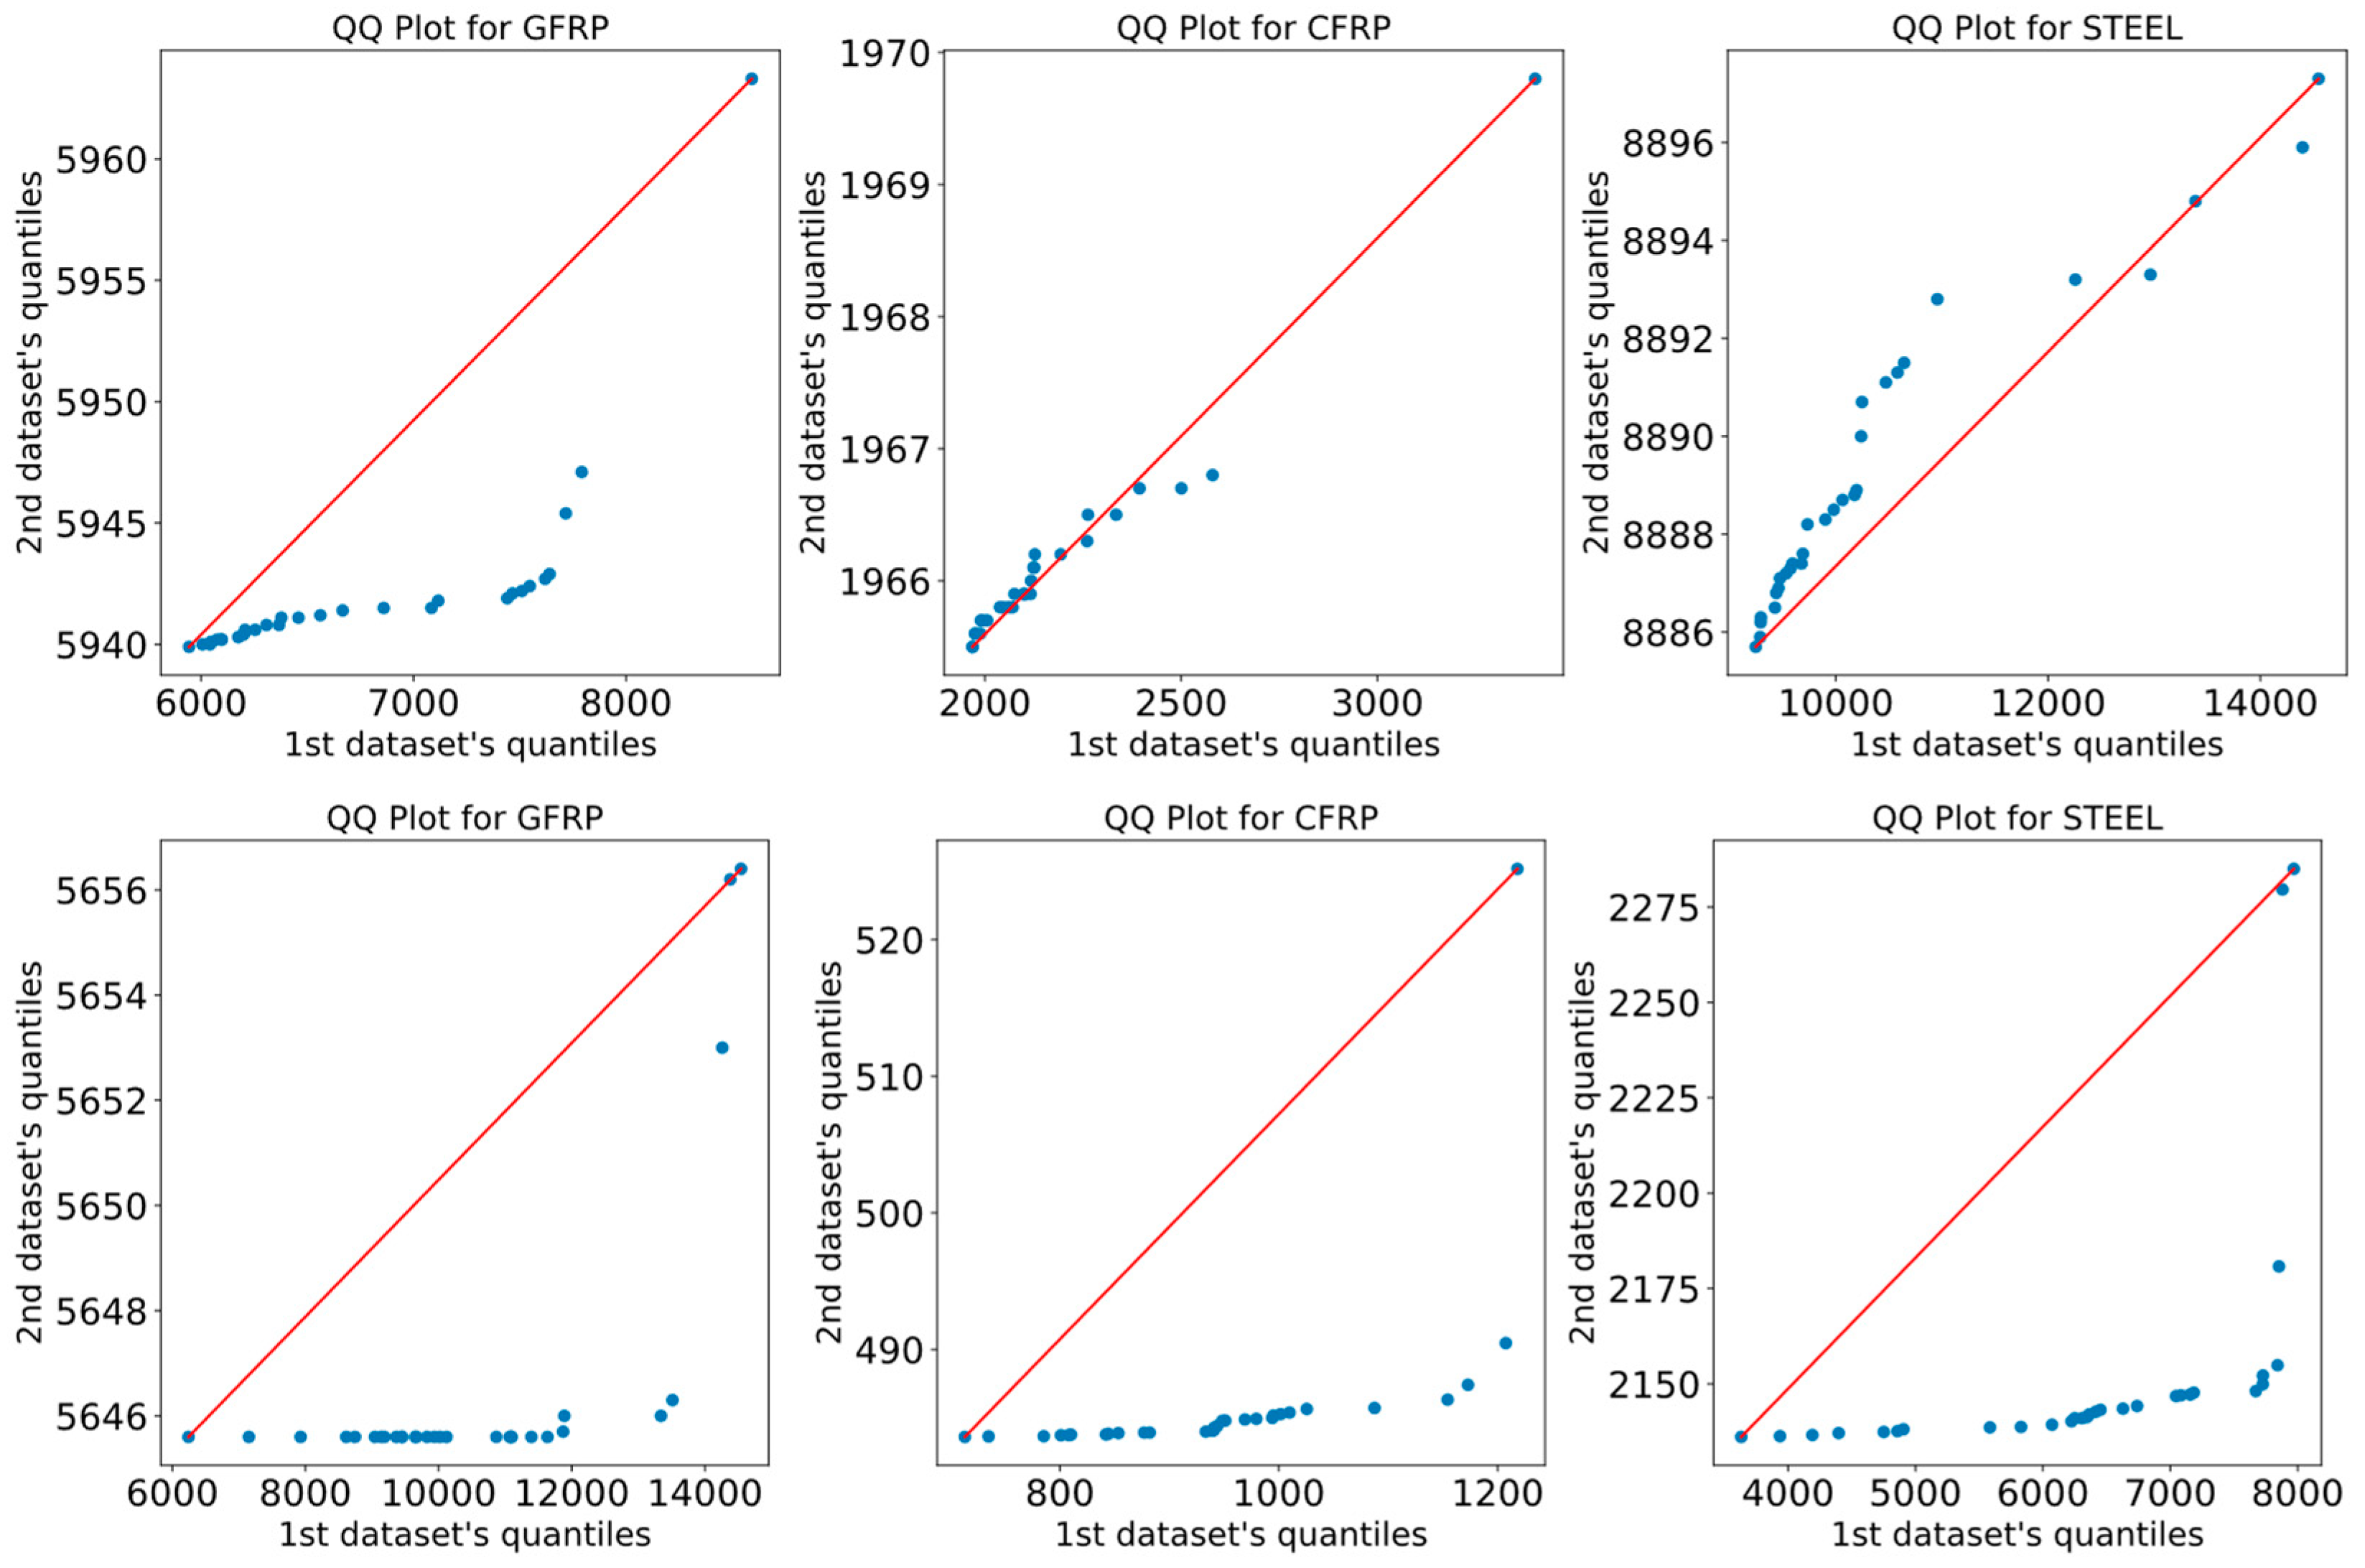
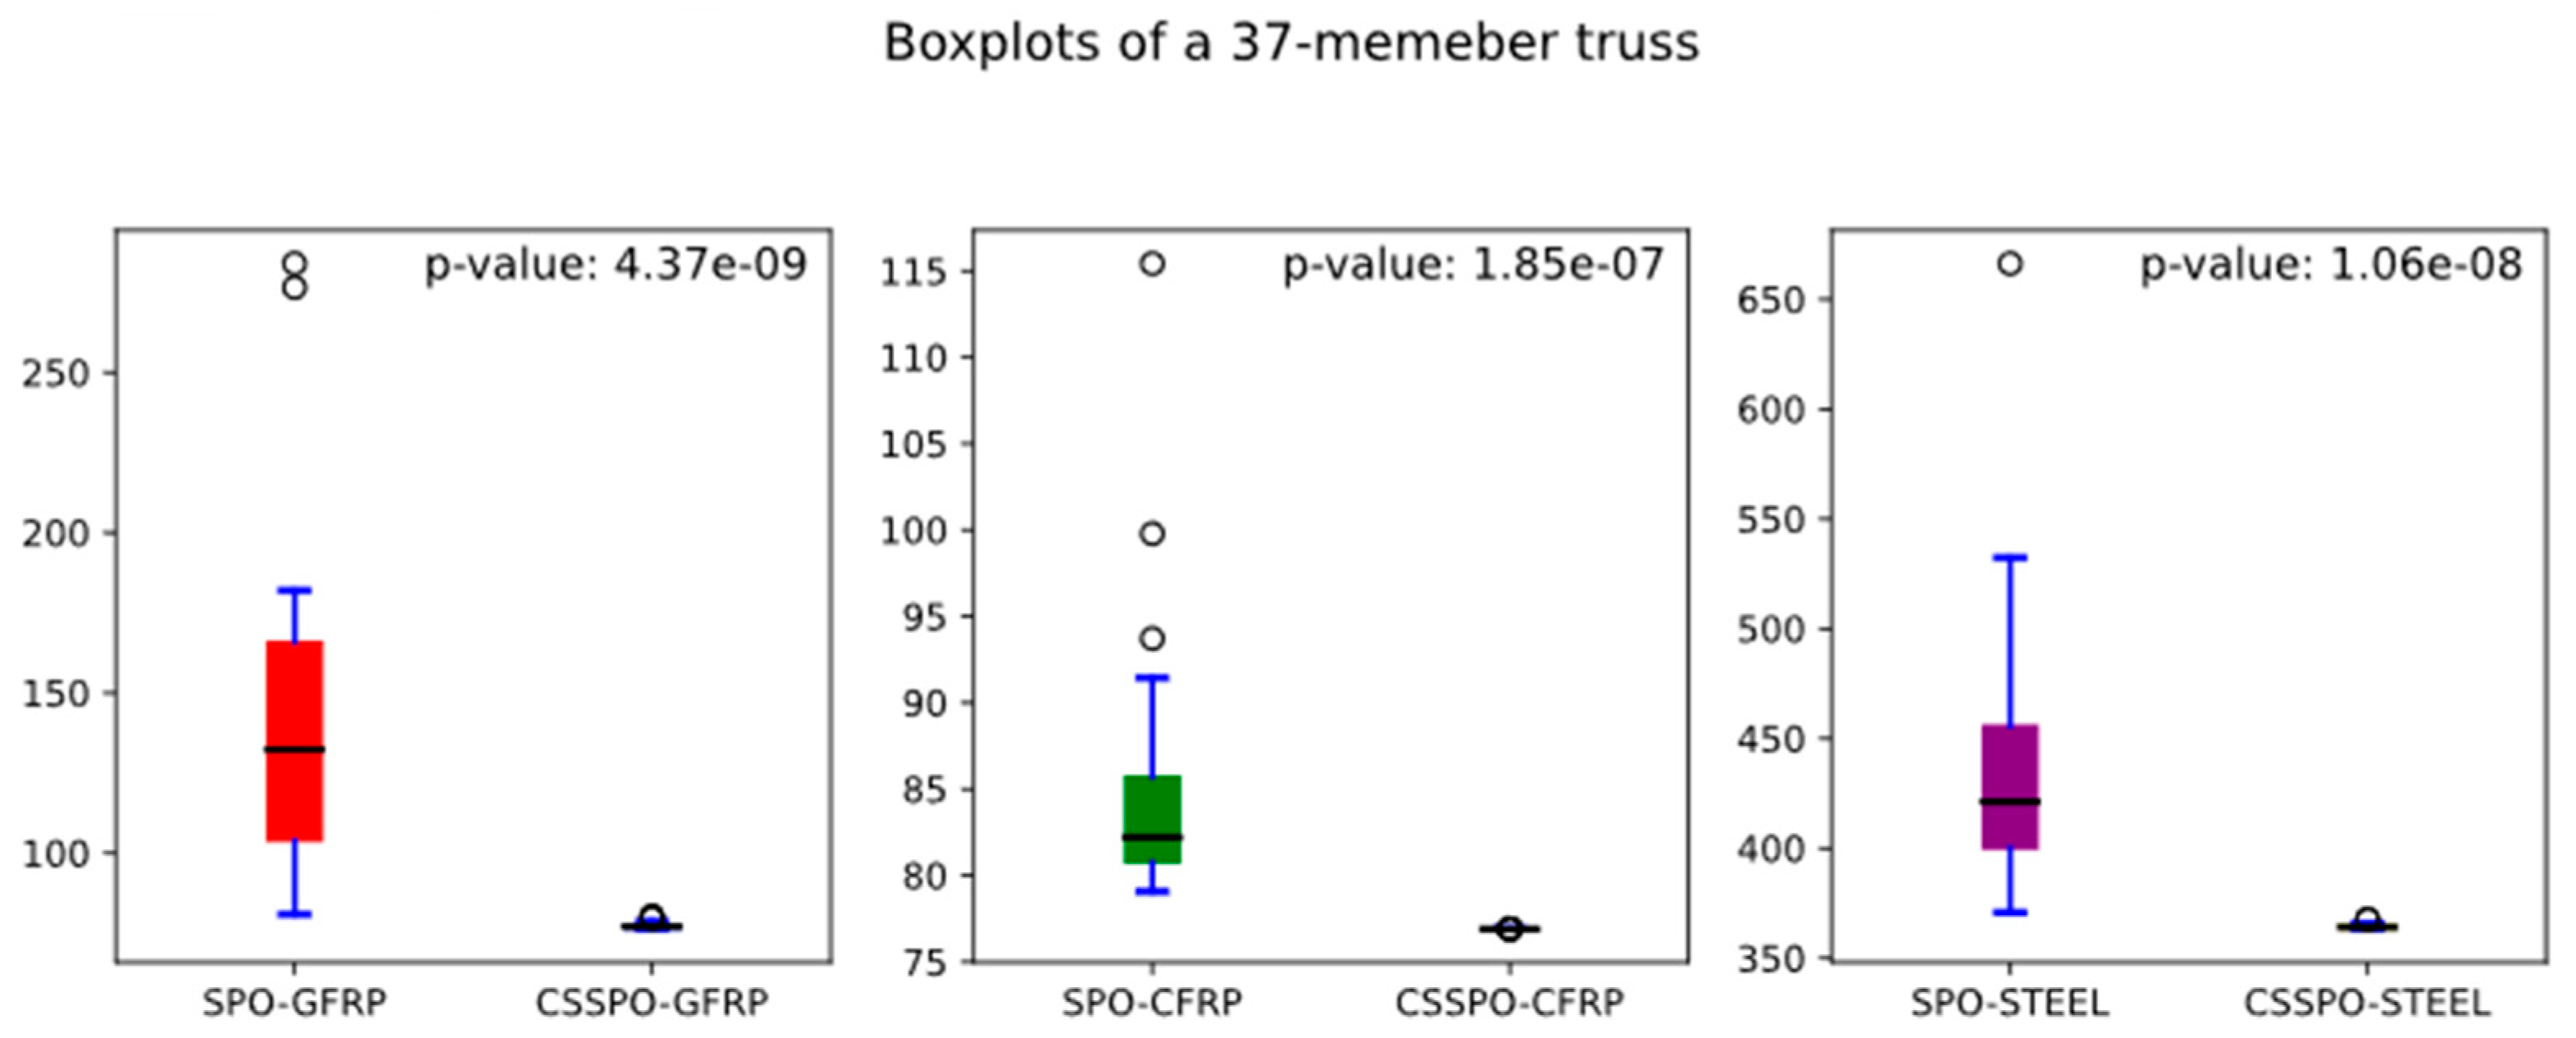
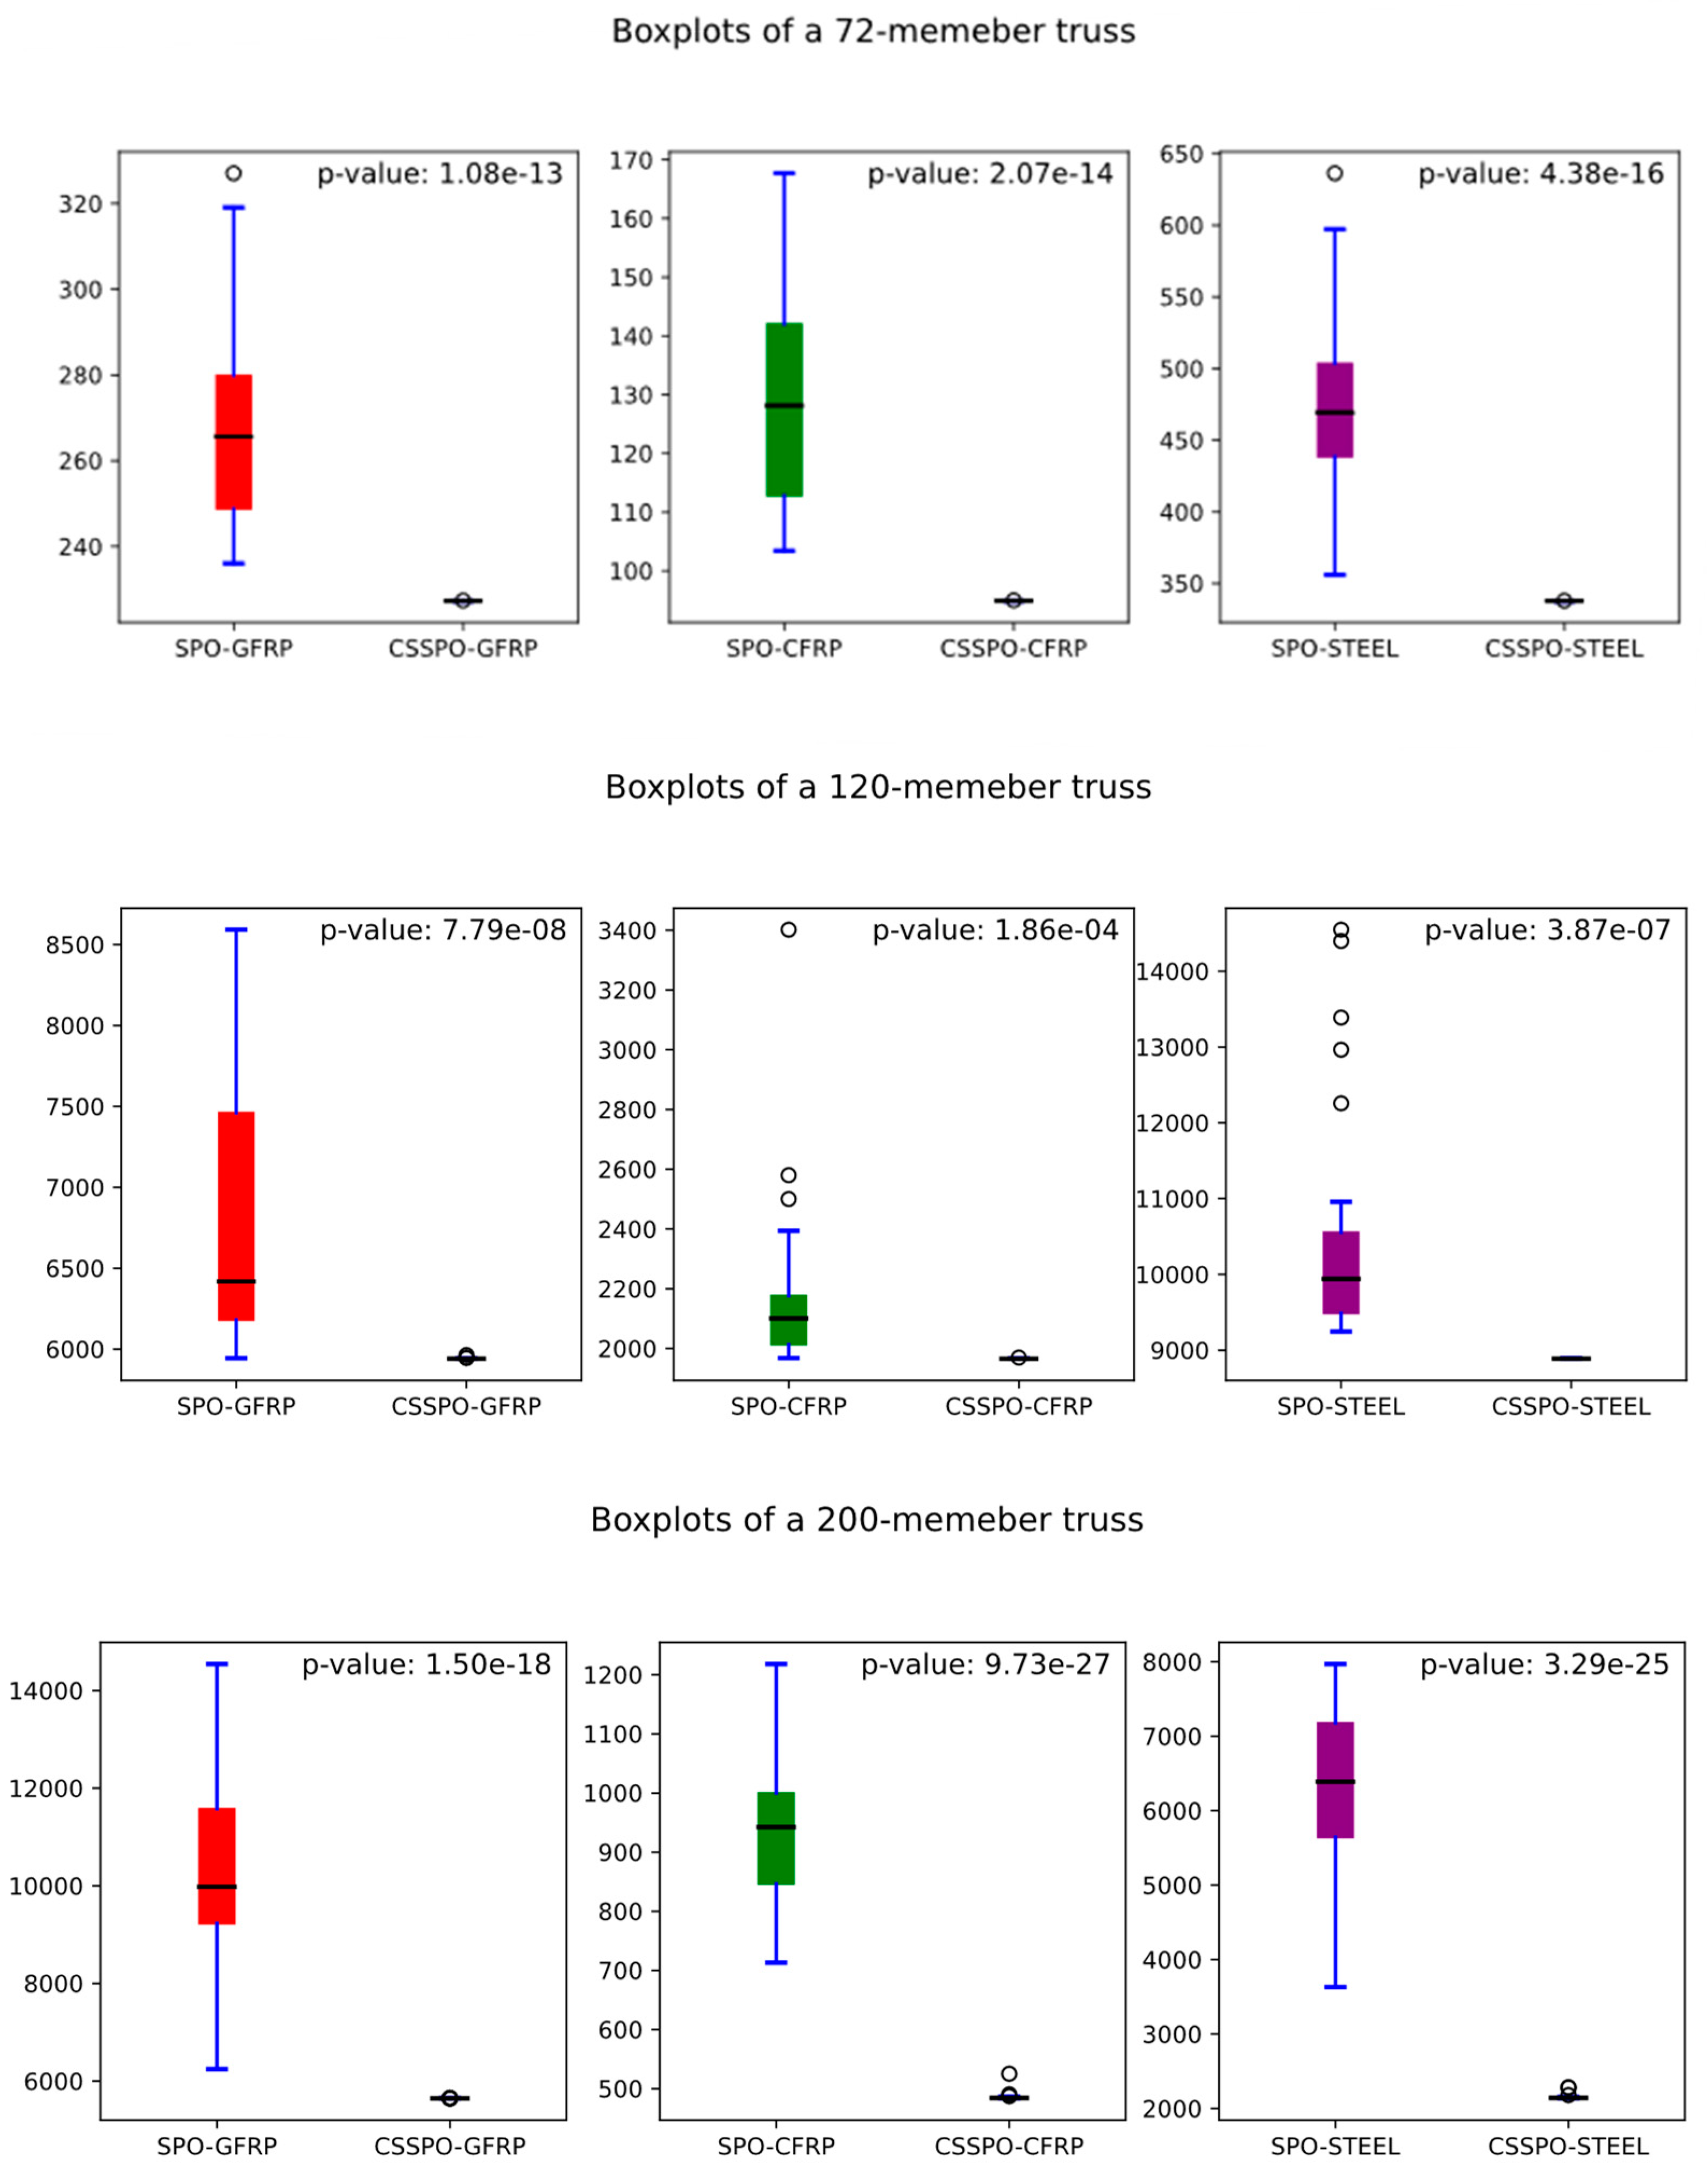
6. Statistical Analysis

To determine if there is a statistically significant difference between the population means of two samples, a t-test can be used. The t-test is a useful tool assessing the similarity of two samples by evaluating their statistical significance. In this study, a paired t-test was employed to perform a statistical comparison. If the calculated p-value exceeds 0.05, it indicates a lack of statistically significant differences between the outcomes of the two algorithms being compared. Conversely, a p-value below 0.05 suggests the presence of statistically significant variations in the performance of the two algorithms.
The resulting p-values are displayed in Table 12. Based on this table, all p-values obtained from the examples were less than 0.05, indicating statistically significant differences in the performance of the two algorithms. Furthermore, Figure 32 presents a QQ plot, commonly referred to as a quantile–quantile plot, which is a visual tool employed to compare two probability distributions by plotting their quantiles against each other. The blue circles are two sets of quantiles against one another in the QQ plot. The QQ plot displays the quantiles of the SPO dataset (results from 30 runs) on the x-axis and the quantiles of the CSSPO dataset on the y-axis. If the datasets are derived from a standard distribution, the data points on the graph should be aligned along a 45-degree line. Any deviations observed from this line suggest that the datasets have been obtained from distinct distributions.
The boxplot illustrates the distribution of data and identifies any outliers. Generating multiple boxplots on a single graph is valuable for comparing distinct datasets. The boxplot for each truss optimization is shown in Figure 33. In reference to this figure, the boxplot for the CSSPO shows the best performance compared to the SPO for all examples. In this figure, there are fewer outliers for the CSSPO. Overall, the statistical results indicate that the CSSPO performs better than the SPO.

7. Conclusions

A hybrid algorithm that combines the Cuckoo Search (CS) and Stochastic Paint Optimizer (SPO) was applied for the first time to the size optimization of truss structures that use composite materials under frequency constraints. The research conducted an in-depth comparison of truss structures constructed from various materials, including CFRP, GFRP, and steel. The composite material was utilized for the first time to optimize the truss design. The examined design examples demonstrate the effectiveness of the CSSPO algorithm with composite materials in optimizing final solutions, with statistical results showing its competitiveness with new metaheuristics. Additionally, the efficiency, accuracy, and performance of the CSSPO exceed the SPO. However, in larger-scale problems, the rapid convergence of the CSSPO algorithm to an optimal solution may pose challenges.
Additionally, statistical analyses demonstrated that the results of the CSSPO had the lowest standard deviation, indicating a high level of result reliability. The statistical results obtained from 30 independent runs for each material prove the robustness of the CSSPO compared to the SPO. The CSSPO is particularly noteworthy because it does not require parameter tuning. The performance and accuracy of the hybrid version of the SPO exceeded those of the standard version. The performance of the CSSPO was tested on four different truss structures. It was found that truss structures composed of composite materials led to a reduction in weight. This research highlights that using CFRP and GFRP composites in the fabrication of truss structures results in a significant weight decrease compared to the use of steel.
As a future direction, it is recommended to evaluate the performance of this computational approach in addressing optimization problems in other areas of design and engineering through further investigations. Another potential direction for future research would be to compare the performance of recently developed state-of-the-art methods with composite materials to the CSSPO for truss structures. The CSSPO is a versatile method that can be applied to complex engineering problems, including laminated composites, functionally graded structures, and reliability-based design optimization problems. These problems often involve high computational costs, making the CSSPO an attractive option. In addition, a potential area for future research is the application of discrete size optimization using composite materials for truss and frame structures.

Author Contributions

Methodology, N.K.; Software, N.K.; Investigation, E.H. and F.D.C.; Data curation, N.K.; Writing–original draft, N.K. and E.H.; Writing–review & editing, A.N. and F.D.C.; Supervision, A.N.; Project administration, A.N. All authors have read and agreed to the published version of the manuscript.

Funding

The authors gratefully acknowledge the financial support from the National Science Foundation I/U-CRC Center for Integration of Composites into Infrastructure (CICI) under grant #1916342.

Data Availability Statement

No new data were created or analyzed in this study. Data sharing is not applicable to this article.

Acknowledgments

The authors gratefully acknowledge the financial support from the National Science Foundation I/U-CRC Center for Integration of Composites into Infrastructure (CICI) under grant #1916342.

Conflicts of Interest

The authors declare no conflict of interest.

References

  1. EEl-Kenawy, E.S.M.; Mirjalili, S.; Khodadadi, N.; Abdelhamid, A.A.; Eid, M.M.; El-Said, M.; Ibrahim, A. Feature selection in wind speed forecasting systems based on meta-heuristic optimization. PLoS ONE 2023, 18, e0278491. [Google Scholar] [CrossRef]
  2. Lu, Y.; Liang, M.; Ye, Z.; Cao, L. Improved particle swarm optimization algorithm and its application in text feature se-lection. Appl. Soft Comput. 2015, 35, 629–636. [Google Scholar] [CrossRef]
  3. Atteia, G.; El-Kenawy, E.-S.M.; Samee, N.A.; Jamjoom, M.M.; Ibrahim, A.; Abdelhamid, A.A.; Azar, A.T.; Khodadadi, N.; Ghanem, R.A.; Shams, M.Y. Adaptive Dynamic Dipper Throated Optimization for Feature Selection in Medical Data. Comput. Mater. Contin. 2023, 75, 1883–1900. [Google Scholar] [CrossRef]
  4. Dhiman, G. MOSHEPO: A hybrid multi-objective approach to solve economic load dispatch and micro grid problems. Appl. Intell. 2019, 50, 119–137. [Google Scholar] [CrossRef]
  5. Abdelhamid, A.A.; El-Kenawy, E.-S.M.; Alrowais, F.; Ibrahim, A.; Khodadadi, N.; Lim, W.H.; Alruwais, N.; Khafaga, D.S. Deep Learning with Dipper Throated Optimization Algorithm for Energy Consumption Forecasting in Smart Households. Energies 2022, 15, 9125. [Google Scholar] [CrossRef]
  6. Khodadadi, N.; Abualigah, L.; El-Kenawy, E.-S.M.; Snasel, V.; Mirjalili, S. An Archive-Based Multi-Objective Arithmetic Optimization Algorithm for Solving Industrial Engineering Problems. IEEE Access 2022, 10, 106673–106698. [Google Scholar] [CrossRef]
  7. Holland, J.H. Genetic algorithms. Sci. Am. 1992, 267, 66–73. [Google Scholar] [CrossRef]
  8. Kennedy, J.; Eberhart, R. Particle swarm optimization. In Proceedings of the ICNN’95-International Conference on Neural Networks, Perth, WA, Australia, 27 November–1 December 1995; pp. 1942–1948. [Google Scholar]
  9. Abdelhamid, A.A.; Towfek, S.K.; Khodadadi, N.; Alhussan, A.A.; Khafaga, D.S.; Eid, M.M.; Ibrahim, A. Waterwheel Plant Algorithm: A Novel Metaheuristic Optimization Method. Processes 2023, 11, 1502. [Google Scholar] [CrossRef]
  10. Dehghani, M.; Montazeri, Z.; Trojovská, E.; Trojovský, P. Coati Optimization Algorithm: A new bio-inspired metaheuristic algorithm for solving optimization problems. Knowl.-Based Syst. 2022, 259, 110011. [Google Scholar] [CrossRef]
  11. Mirjalili, S.; Mirjalili, S.; Lewis, A. Grey wolf optimizer. Adv. Eng. Softw. 2014, 69, 46–61. [Google Scholar] [CrossRef] [Green Version]
  12. Zhang, Q.; Gao, H.; Zhan, Z.-H.; Li, J.; Zhang, H. Growth Optimizer: A powerful metaheuristic algorithm for solving continuous and discrete global optimization problems. Knowl. -Based Syst. 2023, 261, 110206. [Google Scholar] [CrossRef]
  13. Wang, L.; Cao, Q.; Zhang, Z.; Mirjalili, S.; Zhao, W. Artificial rabbits optimization: A new bio-inspired meta-heuristic algorithm for solving engineering optimization problems. Eng. Appl. Artif. Intell. 2022, 114, 105082. [Google Scholar] [CrossRef]
  14. Naruei, I.; Keynia, F. Wild horse optimizer: A new meta-heuristic algorithm for solving engineering optimization problems. Eng. Comput. 2021, 38, 3025–3056. [Google Scholar] [CrossRef]
  15. Qais, M.H.; Hasanien, H.M.; Turky, R.A.; Alghuwainem, S.; Tostado-Véliz, M.; Jurado, F. Circle Search Algorithm: A Geometry-Based Metaheuristic Optimization Algorithm. Mathematics 2022, 10, 1626. [Google Scholar] [CrossRef]
  16. Abdollahzadeh, B.; Gharehchopogh, F.S.; Khodadadi, N.; Mirjalili, S. Mountain Gazelle Optimizer: A new Nature-inspired Metaheuristic Algorithm for Global Optimization Problems. Adv. Eng. Softw. 2022, 174, 103282. [Google Scholar] [CrossRef]
  17. Khodadadi, N.; Talatahari, S.; Gandomi, A.H. ANNA: Advanced neural network algorithm for optimization of structures. Proc. Inst. Civ. Eng.-Struct. Build. 2023, 176, 1–23. [Google Scholar] [CrossRef]
  18. Tejani, G.G.; Savsani, V.J.; Patel, V.K.; Mirjalili, S. Truss optimization with natural frequency bounds using improved symbiotic organisms search. Knowl.-Based Syst. 2018, 143, 162–178. [Google Scholar] [CrossRef] [Green Version]
  19. Farshchin, M.; Camp, C.V.; Maniat, M. Optimal design of truss structures for size and shape with frequency constraints using a collaborative optimization strategy. Expert Syst. Appl. 2016, 66, 203–218. [Google Scholar] [CrossRef]
  20. Nanni, A.; De Luca, A.; Zadeh, H.J. Reinforced Concrete with FRP Bars: Mechanics and Design; CRC Press: Boca Raton, FL, USA, 2014. [Google Scholar]
  21. Khodadadi, N.; Mirjalili, S. Truss optimization with natural frequency constraints using generalized normal distribution optimization. Appl. Intell. 2022, 52, 10384–10397. [Google Scholar] [CrossRef]
  22. Tinkov, D.V.; Safonov, A.A. Design optimization of truss bridge structures of composite materials. J. Mach. Manuf. Reliab. 2017, 46, 46–52. [Google Scholar] [CrossRef]
  23. Kaveh, A.; Hamedani, K.B.; Kamalinejad, M. Improved slime mould algorithm with elitist strategy and its application to structural optimization with natural frequency constraints. Comput. Struct. 2022, 264, 106760. [Google Scholar] [CrossRef]
  24. Liu, S.; Zhu, H.; Chen, Z.; Cao, H. Frequency-constrained truss optimization using the fruit fly optimization algorithm with an adaptive vision search strategy. Eng. Optim. 2019, 52, 777–797. [Google Scholar] [CrossRef]
  25. Millan-Paramo, C.; Filho, J.E.A. Size and Shape Optimization of Truss Structures with Natural Frequency Constraints Using Modified Simulated Annealing Algorithm. Arab. J. Sci. Eng. 2019, 45, 3511–3525. [Google Scholar] [CrossRef]
  26. Ho-Huu, V.; Nguyen-Thoi, T.; Truong-Khac, T.; Le-Anh, L.; Vo-Duy, T. An improved differential evolution based on roulette wheel selection for shape and size optimization of truss structures with frequency constraints. Neural Comput. Appl. 2016, 29, 167–185. [Google Scholar] [CrossRef]
  27. Wei, L.; Tang, T.; Xie, X.; Shen, W. Truss optimization on shape and sizing with frequency constraints based on parallel genetic algorithm. Struct. Multidiscip. Optim. 2010, 43, 665–682. [Google Scholar] [CrossRef]
  28. Pyone, E.C.; Tangaramvong, S.; Van, T.; Bui, L.; Gao, W. Comprehensive learning phasor particle swarm opti-mization of structures under limited natural frequency conditions. Acta Mech. Sin. 2023, 39, 722386. [Google Scholar] [CrossRef]
  29. Wolpert, D.H.; Macready, W.G. No free lunch theorems for optimization. IEEE Trans. Evol. Comput. 1997, 1, 67–82. [Google Scholar] [CrossRef] [Green Version]
  30. Gandomi, A.H.; Yang, X.-S.; Alavi, A.H. Cuckoo search algorithm: A metaheuristic approach to solve structural opti-mization problems. Eng. Comput. 2013, 29, 17–35. [Google Scholar] [CrossRef]
  31. Kaveh, A.; Talatahari, S.; Khodadadi, N. Stochastic paint optimizer: Theory and application in civil engineering. Eng. Comput. 2020, 38, 1921–1952. [Google Scholar] [CrossRef]
  32. Liu, T.; Liu, X.; Feng, P. A comprehensive review on mechanical properties of pultruded FRP composites subjected to long-term environmental effects. Compos. Part B Eng. 2020, 191, 107958. [Google Scholar] [CrossRef]
  33. Bai, J. Advanced Fibre-Reinforced Polymer (FRP) Composites for Structural Applications; Woodhead Publishing: Sawston, UK, 2013. [Google Scholar] [CrossRef]
  34. GangaRao, H.V.S.; Prachasaree, W. FRP Composite Structures: Theory, Fundamentals, and Design; CRC Press: Boca Raton, FL, USA, 2021. [Google Scholar]
  35. Khodadadi, N.; Snasel, V.; Mirjalili, S. Dynamic Arithmetic Optimization Algorithm for Truss Optimization Under Natural Frequency Constraints. IEEE Access 2022, 10, 16188–16208. [Google Scholar] [CrossRef]
  36. Khodadadi, N.; Mirjalili, S.; Mirjalili, S. Optimal Design of Truss Structures with Continuous Variable Using Moth-Flame Optimization. In Handbook of Moth-Flame Optimization Algorithm; CRC Press: Boca Raton, FL, USA, 2022; pp. 265–280. [Google Scholar]
  37. Yang, X.-S.; Deb, S. Engineering optimisation by cuckoo search. Int. J. Math. Model. Numer. Optim. 2010, 1, 330–343. [Google Scholar] [CrossRef]
  38. Khodadadi, N.; Mirjalili, S.; Mirjalili, S.; Mirjalili, S. Chaotic Stochastic Paint Optimizer (CSPO). In Lecture Notes on Data Engineering and Communications Technologies, Proceedings of the 7th International Conference on Harmony Search, Soft Computing and Applications, 23–24 February 2022, Seoul, Republic of Korea; Springer: Berlin/Heidelberg, Germany, 2022; pp. 195–205. [Google Scholar]
  39. Kaveh, A.; Zolghadr, A. Truss optimization with natural frequency constraints using a hybridized CSS-BBBC algorithm with trap recognition capability. Comput. Struct. 2012, 102–103, 14–27. [Google Scholar] [CrossRef]
Figure 1. Glass fabrics.
Buildings 13 01551 g001
Figure 2. Carbon fabrics.
Buildings 13 01551 g002
Figure 3. Typical FRP and steel stress–strain curves.
Buildings 13 01551 g003
Figure 4. Flowchart of the truss optimization definition problem.
Buildings 13 01551 g004
Figure 5. Cuckoo search algorithm flowchart.
Buildings 13 01551 g005
Figure 6. Four different types of color mixing in SPO. (a) Analogous Combination, (b) Complementary Combination, (c) Triadic Combination and (d) Tetradic Combination.
Buildings 13 01551 g006
Figure 7. Stochastic paint optimizer flowchart algorithm.
Buildings 13 01551 g007
Figure 8. The 37-member planar bridge.
Buildings 13 01551 g008
Figure 9. The best weight convergence curves for SPO and CSSPO with GFRP, CFRP, and steel for a 37-member bridge.
Buildings 13 01551 g009
Figure 10. Comparison of best weight convergence curves for GFRP, CFRP, and steel using the CSSPO algorithm for a 37-member bridge.
Buildings 13 01551 g010
Figure 11. The average weight convergence curves for SPO and CSSPO with GFRP, CFRP, and steel for a 37-member bridge.
Buildings 13 01551 g011
Figure 12. Comparison of average weight convergence curves for GFRP, CFRP, and steel using the CSSPO algorithm for a 37-member bridge.
Buildings 13 01551 g012
Figure 13. Weights of 30 distinct runs for SPO and CSSPO for a 37-member truss with different materials.
Buildings 13 01551 g013
Figure 14. The 72-member space truss structure.
Buildings 13 01551 g014
Figure 15. Weights of 30 distinct runs for SPO and CSSPO for a 72-member truss with different materials.
Buildings 13 01551 g015
Figure 16. The best weight convergence curve for SPO and CSSPO with GFRP, CFRP, and steel for a 72-member truss.
Buildings 13 01551 g016
Figure 17. Comparison of best weight convergence curves for GFRP, CFRP, and steel with the CSSPO algorithm for a 72-member truss.
Buildings 13 01551 g017
Figure 18. Average weight convergence curve for SPO and CSSPO with GFRP, CFRP, and steel for a 72-member truss.
Buildings 13 01551 g018
Figure 19. Comparison of the average weight convergence curves for GFRP, CFRP, and steel using the CSSPO algorithm for a 72-member truss.
Buildings 13 01551 g019
Figure 20. The 120-member dome truss structure.
Buildings 13 01551 g020
Figure 21. Best weight convergence curves for SPO and CSSPO with GFRP, CFRP, and steel for a 120-member truss.
Buildings 13 01551 g021
Figure 22. Comparison of the best weight convergence curves for GFRP, CFRP, and steel with the CSSPO algorithm for 120-member truss.
Buildings 13 01551 g022
Figure 23. Average weight convergence curves for SPO and CSSPO with GFRP, CFRP, and steel for a 120-member truss.
Buildings 13 01551 g023
Figure 24. Comparison of average weight convergence curves for GFRP, CFRP, and steel using the CSSPO algorithm for a 120-member truss.
Buildings 13 01551 g024
Figure 25. Weights of 30 distinct runs for the SPO and CSSPO for a 120-member truss with different materials.
Buildings 13 01551 g025
Figure 26. The 200-member planar truss structure.
Buildings 13 01551 g026
Figure 27. Best weight convergence curves for the SPO and CSSPO with GFRP, CFRP, and steel for a 200-member truss.
Buildings 13 01551 g027
Figure 28. Comparison of best weight convergence curves for GFRP, CFRP, and steel using the CSSPO algorithm for a 200-member truss.
Buildings 13 01551 g028
Figure 29. Average weight convergence curves for the SPO and CSSPO with GFRP, CFRP, and steel for a 200-member truss.
Buildings 13 01551 g029
Figure 30. Comparison of the average weight convergence curves for GFRP, CFRP, and steel using the CSSPO algorithm for 200-member truss.
Buildings 13 01551 g030
Figure 31. Weights of 30 distinct runs for the SPO and CSSPO for a 200-member truss with different materials.
Buildings 13 01551 g031
Figure 32. QQ plots for all examples of GFRP, CFRP, and steel materials.
Buildings 13 01551 g032aBuildings 13 01551 g032b
Figure 33. Boxplots of all examples for GFRP, CFRP, and steel materials.
Buildings 13 01551 g033aBuildings 13 01551 g033b
Table 1. Material properties.
MaterialDensityModulus of Elasticity
lb/ft3Kg/m3GPaKsi
GFRP971550558000
CFRP109175016023,000
Steel490785020730,000
Table 2. Design constraints for various optimization problems.
Test ProblemCross-Sectional
A (cm2)
Natural Frequency Constraints
ω (Hz)
37-member planar bridge 1 A ω 1 20 ,     ω 2 40 ,   ω 3 60
72-member space truss 0.645 A ω 1 = 4 ,   ω 3 6
120-member dome truss 1 A 129.3 ω 1 9 ,   ω 2 11
200-member planar truss 0.1 A ω 1 5 ,   ω 2 10 ,   ω 3 15
Table 3. Optimized results of GFRP, CFRP, and steel using SPO and CSSPO for a 37-member bridge.
MaterialsGFRPCFRPSteel
Member GroupSPOCSSPOSPOCSSPOSPOCSSPO
(Y3-Y19) m1.51841.00111.00011.00001.00481.0000
(Y5-A17) m1.89471.36571.68091.32921.36521.3728
(Y7-A15) m2.09501.51891.68501.58131.57461.5405
(Y9-Y13) m2.26461.65561.85381.74021.72131.6485
(Y11) m2.34621.72091.93871.80521.82171.7231
(A1-A27) cm25.00004.24281.00001.00023.62232.9181
(A2-A26) cm21.92341.49501.00001.00001.63361.0191
(A3-A24) cm21.00021.25811.00001.00001.00131.0009
(A4-A25) cm22.04663.98721.85131.04513.23542.6357
(A5-A23) cm21.94831.85491.00021.00013.26491.2225
(A6-A21) cm22.39512.08861.00001.00001.08071.2106
(A7-A22) cm22.34313.72481.01811.17911.73982.6363
(A8-A20) cm22.19902.11202.07361.00001.03241.4348
(A9-A18) cm22.53422.22361.50621.00001.29401.5293
(A10-A19) cm22.09943.95531.02721.21192.05272.7911
(A11-A17) cm24.34231.84061.00151.00001.50981.2057
(A12-A15) cm22.80111.94791.83801.00001.48221.2726
(A13-A16) cm23.13633.87601.00001.24003.42922.4663
(A14-A16) cm21.00451.00351.00001.00001.00141.0004
Best weight  ( k g ) 80.891776.311979.069076.8983370.8402363.2729
Average weight  ( k g ) 140.622977.358885.060576.9032434.8858364.4259
Standard deviation49.66511.11257.65280.005857.86641.1706
No. Analyses13,15010,5005400440061504600
Table 4. Natural frequencies (Hz) for the best design of a 37-member bridge.
MaterialsGFRPCFRPSTEEL
Frequency No.SPOCSSPOSPOCSSPOSPOCSSPO
f 1 20.00020.000020.002420.000120.000020.0000
f 2 42.954440.000047.336342.296640.004940.0000
f 3 60.000060.000067.896566.097260.000060.0000
Table 5. Optimized results of GFRP, CFRP, and steel using SPO and CSSPO for a 72-member truss.
MaterialsGFRPCFRPSTEEL
Member Group SPOCSSPOSPOCSSPOSPOCSSPO
1 (A1-A4) cm213.39724.77021.49321.49321.49321.1560
2 (A5-A12) cm29.44819.99813.44863.44863.44862.6751
3 (A13-A16) cm20.64500.64500.64500.64500.64500.6450
4 (A17-A18) cm20.67240.71810.64500.64500.64500.6450
5 (A19-A22) cm212.009610.52533.41113.41113.41112.6876
6 (A23-A30) cm211.374010.05623.50423.50423.50422.6555
7 (A31-A34) cm20.64500.64500.64500.64500.64500.6450
8 (A35-A36) cm20.64500.64500.64500.64500.64500.6453
9 (A37-A40) cm213.628916.97635.72745.72745.72744.2783
10 (A41-A48) cm28.620810.08653.50863.50863.50862.6824
11 (A49-A52) cm20.64500.64500.64500.64500.64500.6450
12 (A53-A54) cm20.64500.64500.64500.64500.64500.6452
13 (A55-A58) cm220.000020.00007.31127.31127.31125.6892
14 (A59-A66) cm211.23549.96043.43973.43973.43972.7112
15 (A67-A70) cm20.64500.64500.64500.64500.64500.6450
16 (A71-A72) cm20.64500.64500.64500.64500.64500.6450
Best weight (kg)236.0334227.2641103.436194.8585356.0184337.7553
Average weight (kg)268.0583227.3044129.383394.8953472.1857337.8333
Standard deviation23.09320.031118.68530.027165.87680.0600
No. Analyses19,10069006800490041504050
Table 6. Natural frequencies (Hz) for the best design of a 72-member truss.
MaterialsGFRPCFRPSTEEL
Frequency No. SPOCSSPOSPOCSSPOSPOCSSPO
f 1 4.00004.00004.00004.00004.00004.0000
f 2 4.00014.00014.00004.00004.00014.0001
f 3 6.00006.00006.00026.00006.00006.0000
f 4 6.00236.00498.54038.23948.92579.0087
f 5 8.76548.610710.67189.73879.28409.8549
Table 7. Optimized results of GFRP, CFRP, and steel using SPO and CSSPO for 120-member truss.
MaterialsGFRPCFRPSTEEL
No. GroupSPOCSSPOSPOCSSPOSPOCSSPO
179.211380.066924.378224.555420.908919.8347
2129.2908129.300047.821646.472239.122842.1216
339.936338.051810.760111.380311.443211.4296
475.791075.159120.977621.011721.097821.6645
534.465133.31499.19359.398111.065110.0670
640.137441.891413.311512.311710.645412.9819
747.060947.841011.818211.976319.701415.2824
Best weight  ( k g ) 5943.84425939.87751968.09711965.53239245.88428885.6721
Average weight  ( k g ) 6749.42835942.13932169.8621966.112310,457.8648889.385
Standard deviation719.32794.2971279.47340.78601500.933.13777
No. Analyses440041504850455041004400
Table 8. Natural frequencies (Hz) for the best design of a 120-member truss.
MaterialsCFRPGFRPSTEEL
No. FrequencySPOCSSPOSPOCSSPOSPOCSSPO
f 1 9.00009.00009.00009.00009.00009.0000
f 2 11.000011.000011.000011.000011.000011.0000
f 3 11.005211.000011.000011.000011.060311.0000
f 4 11.007511.007511.003311.003211.089011.0096
f 5 11.052411.052211.053011.053511.158111.0494
Table 9. Member numbers for each group.
GroupMember NumberGroupMember Number
11,2,3,41682,83,85,88,89,91,92,103,104,106,107,109,110,112,113
25,8,11,14,1717115,116,117,118
319,20,21,22,23,2418119,122,125,128,131
418,25,56,63,94,101,132,139,170,17719133,134,135,136,137,138
526,29,32,35,3820140,143,146,149,152
66,7,9,10,12,13,15,16,27,28,30,31,33,34,36,3721120,121,123,124,126,127,129,130,141,142,144,145,147,148,150,151
739,40,41,4222153,154,155,156
843,46,49,52,5523157,160,163,166,169
957,58,59,60,61,6224171,172,173,174,175,176
1064,67,70,73,7625178,181,184,187,190
1144,45,47,48,50,51,53,54,65,66,68,69,71,72,74,7526158,159,161,162,164,165,167,168,179,180,182,183,185,186,188,189
1277,78,79,8027191,192,193,194
1381,84,87,90,9328195,197,198,200
1495,96,97,98,99,10029196,199
15102,105,108,111,114
Table 10. Optimized results of GFRP, CFRP, and steel using the SPO and CSSPO for a 200-member truss.
MaterialsGFRPCFRPSTEEL
Member Group SPOCSSPOSPOCSSPOSPOCSSPO
12.42292.57284.91250.70931.23420.5002
22.39582.13580.10000.86040.10000.4979
30.10000.10006.52390.10160.13690.1019
40.29730.19120.10000.10000.10550.1003
52.21521.92970.19230.88450.23250.4506
63.94704.02692.35231.48402.10070.8848
70.10000.38031.92550.10247.31510.1000
85.72386.20600.98302.16701.00791.4102
92.29370.10000.10000.100812.90350.1000
107.00107.11270.78302.36570.30161.5747
116.28745.08632.12171.61941.97541.1112
120.60260.78474.62940.11980.10000.1381
1312.097313.76741.47603.97903.17092.9040
140.18110.18750.10000.101910.65320.1008
1512.861815.91216.74994.04003.70113.1706
167.75017.66391.89091.88532.89601.5698
170.96571.99405.96670.21140.10000.2814
1830.000026.75053.59445.68366.97835.0985
1930.00000.39660.21840.11490.10130.1073
2030.000030.00004.42545.644310.85465.2830
2112.226112.29571.76392.08173.46052.0484
2230.000013.60740.70940.64810.11300.4935
2330.000030.000013.74447.941512.53237.7323
2430.000021.35071.90930.11932.11600.2046
2529.999930.00007.86947.630913.76188.1349
2629.997030.00001.05212.44933.05772.6627
2730.000030.000015.51039.165510.899810.2624
2829.998530.000025.356618.529927.130521.3333
2930.000030.000029.654710.301626.217910.2026
Best weight  ( k g ) 6245.00625645.5521713.0536483.59913632.21532136.1284
Average weight  ( k g ) 10,483.245646.58945.4095486.10376300.83912153.1362
Standard deviation2068.4842.971819131.24237.51411273.74736.1414
No. Analyses13,150630015,050670072507150
Table 11. Natural frequencies (Hz) for the best design of a 200-member truss.
MaterialsGFRPCFRPSTEEL
No. FrequencySPOCSSPOSPOCSSPOSPOCSSPO
f 1 5.00385.00575.00005.00005.00005.0000
f 2 14.388214.935514.853316.086514.775013.0865
f 3 15.000016.020319.182316.243619.046015.0000
f 4 19.103418.998019.529925.214019.514120.0789
f 5 22.745222.245425.964232.318925.805522.0192
f 6 25.310723.911226.471936.972026.287325.4215
Table 12. The p-values obtained using t-tests for all examples.
ExamplesAlgorithmsGFRPSTEELCFRP
37-Member trussSPO vs. CSSPO4.37 × 10−91.85 × 10−71.06 × 10−8
73-Member trussSPO vs. CSSPO1.08 × 10−132.07 × 10−144.38 × 10⁻¹⁶
120-Member trussSPO vs. CSSPO7.79 × 10−81.86 × 10−43.87 × 10−7
200-Member trussSPO vs. CSSPO1.50 × 10−189.73 × 10−273.29 × 10⁻²⁵
Disclaimer/Publisher’s Note: The statements, opinions and data contained in all publications are solely those of the individual author(s) and contributor(s) and not of MDPI and/or the editor(s). MDPI and/or the editor(s) disclaim responsibility for any injury to people or property resulting from any ideas, methods, instructions or products referred to in the content.

