Abstract
Shear walls are important vertical and lateral bearing element in structures. While shear walls with openings are fragile due to stress concentration and the quasi-brittle behavior of concrete in tension. Therefore, additional strengthening rebars are required for the shear walls with openings. However, it aggravates the problem of dense reinforcement which increases the steel cage manufacturing and concrete compaction problem and still lacks countermeasures against concrete damage and cracking. To reduce the rebar demand and improve the damage tolerance of squat reinforced concrete (RC) shear walls with openings, an optimized steel-fiber-reinforced concrete (SFRC) was adopted to understand the seismic performance by cyclical loading test. The tested specimens included a plain RC shear wall without strengthening bar around the opening (for comparison), an SFRC shear wall, and an SFRC shear wall with a reduced distributed steel bar. This paper mainly studies the effect of using SFRC to improve the seismic performance of the open shear wall and to replace the reinforcement around the opening and the shear reinforcement. The hysteresis curves, skeleton curves, stiffness degradation, bearing capacity degradation and energy dissipation of the specimens were analyzed. The results show that the failure can be delayed and relieved, the deformation capacity and energy dissipation can considerably improve, and rebars can be partially replaced by using SFRC.
1. Introduction
Reinforced concrete (RC) shear walls are widely used in mid- and high-rise structures owing to their excellent horizontal and vertical resistance. Shear walls located in the core area of the structure generally suffer from the combined action of large axial and shear forces. The openings demand-induced stress concentration may cause brittle shear damages, augmenting the risk of failure of the walls and hindering their retrofit after an earthquake [1], or directly leaded to the failure of the entire structure [2,3].
Passed studies have experimentally found the influence of the opening on the seismic performance of shear walls [4,5,6,7,8]. The presence of openings reduced the displacement capacity and changes the damage pattern of the walls [9,10,11,12,13], and the squat shear walls with opening are mainly damaged as crack extension at opening corner and shear damage of the wall. Specifications such as ACI 318-08 [14], GB50010-2010 [15] and NZS 3101 [16] specify the strengthening requirement for the steel bars around the openings in the shear walls. According to China’s GB50010-2010 regulations, reinforcement bars should not be less than 50% of the cut steel, which often increases the difficulties of steel cage manufacturing and concrete compacting. Huang’s research suggested that connecting transverse reinforcement should be set to enhance effective transmission around openings beyond structural reinforcement specified by code requirements [17]. The requirements of transverse reinforcement with strong openings are also put forward in codes. However, dense reinforcement requirements greatly increase the difficulty of construction, and at present, there still lacks corresponding prevention and control measures for the damage and cracking of concrete.
The utilization of high-performance steel-fiber-reinforced concrete (SFRC) materials are characterized by their high fluidity, strength, durability, and remarkable strain hardening properties that allow the design strength of components to be maintained even under considerable deformation [18]. Compared to ordinary concrete, SFRC has significantly higher crack resistance due to the bridging effect of steel fibers which can prevent microcrack development and restrain damage propagation and accumulation under alternating loads. Current studies indicate that applying SFRC restrains initial shear cracking and damage. Liao et al.’s research [19,20] indicates that high-fluidity self-compacting steel-fiber-reinforced concrete can completely replace the horizontal reinforcement of beam-column joints. Therefore, researchers have utilized SFRC structural members for cracking prevention and strengthening purposes as well as in shear walls to improve their strength and ductility [21,22,23,24].
Zhao et al. [24] demonstrated significant improvements in crack resistance, ductility, and energy dissipation capacity when adding steel fibers to reinforced concrete shear walls. Lu et al. [22] and Zhang et al. [23] developed a new composite shear wall using steel-fiber-reinforced high-strength concrete (SFRHSC), and experimentally verified the seismic improving effect for the SFRC shear walls by cyclic loading test under different axial compression load. Carrillo et al.’s studies [25] showed that SFRC enhances seismic performance and substitutes lateral reinforcement in shear walls. Boita et al. [21] studied the possibility of replacing traditional reinforcing bars with SFRC in shear walls. Additionally, a shaking table study conducted by Carrillo et al. [25] on six low-rise shear walls reinforced with steel fibers demonstrated their effect on seismic performance and ability to replace transverse reinforcement.
Because of the quasi-brittle behavior of concrete in tension, shear walls with openings located in the core area of the lower stories of mid- and high-rise structures still face the great challenge of preventing stress concentration and shear failure. As demonstrated, the addition of steel fibers experimentally showed more effective in the shear wall specimens with openings than the solid specimens [9]. The seismic simulation study on the squat shear walls with opening provided evidence on the damage prevention effect [26]. As a result, the application of SFRC provided possibility to enhance the damage tolerance for the squat RC shear walls with openings.
To understand the seismic improving and the steel bar substitution effect, it is necessary to make clear the seismic behavior of the squat SFRC shear wall with window-opening. In this study, the optimized fly-ash SFRC was adopted to reach good compacting effect for the shear walls with openings. Three specimens, including a plain concrete shear wall for comparison, an SFRC shear wall, and an SFRC shear wall with a reduced ratio of distributed rebars, were tested under an axial compression ratio of 0.2 and increasing cyclic lateral loads. For these specimens, additional reinforcement bars were not placed around the opening as specified in the code to test the reinforcement effect of the SFRC, and crack development, seismic performance, and replacement of distributed reinforcement bars were studied.
2. Experimental Program
Shear walls with openings located in the core area, particularly those at lower stories, support large vertical loads. Figure 1 shows a frame-shear wall structure, as demonstrated, there are outer columns and core shear walls with openings. This is a kind of popular applied structural form for commercial and residential use. The shear wall with window opening at the lower part is selected as the research target. The loading beam is set to apply the vertical load and cyclical horizontal load. Under earthquake action, shear walls are easily damaged by the combined action of shear and compression, as Figure 1 shows, at the corner of the opening and the vertical bearing block. The top beam and bottom beam are also critical for shear and vertical load. The failure of these walls due to shear damage is generally brittle compared with flexural failure. Thus, maintaining the toughness of the shear walls with openings located in the core area is critical in mitigating the collapse of mid- and high-rise buildings during seismic events. As demonstrated by real seismic disasters and experiments, shearing cracks generally occur at the corners of the openings due to strain concentration.
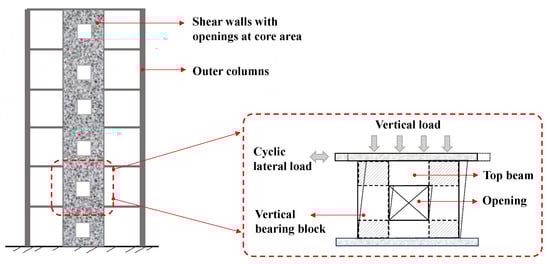
Figure 1.
Diagram of core wall with opening.
Consequently, shear wall design codes, such as ACI318-08 and GB50010-2010, require reinforcing bars around wall openings. To determine their strengthening effect, these reinforcing bars were omitted in this study. Three shear wall specimens, including one made of traditional plain concrete, another made of the proposed SFSC, and a third made of SFSC but with a 30% reduction in distributed rebars, were designed and tested under cyclic loading.
2.1. Materials
2.1.1. SFSC and Plain Concrete
The concrete was designed with a strength of 60 MPa (C60 type) to match the strength demand imposed on structural elements under large axial compression. To obtain improved workability and flowability, the composite and mixing ratio of the SFSC were designed referring to the material optimization study [19]. The raw material composition included P.II 2.5 silicate cement, the fly ash in Class II with a mean particle size of around 0.4–100 μm, and end-hooked steel fibers with a tensile strength of 1275 MPa, length of 35 mm, equivalent diameter of 0.75 mm, length-to-diameter ratio of 47, and volume rate of 1.5%. Although shear walls with a 2.0% fiber volume fraction show significant improvement in their energy dissipation capacity, as shown in the literature [10], fluidity and compactness are major problems when mixing SFRC. Several studies have found that fiber clumping occurs for fiber volume fractions beyond 2.0% [22,23]. Pictures of the steel fibers, main ingredient, and SFSC mixture are shown in Figure 2. Correspondingly, the plain concrete without steel fibers was also prepared to cast the plain concrete shear wall. The compositions of the self-compacting SFRC and the plain concrete are listed in Table 1.
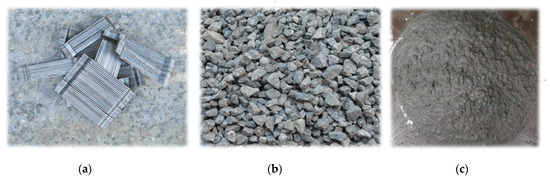
Figure 2.
Pictures of the components: (a) the steel fibers: (b) coarse aggregate, and (c) SFSC mix.

Table 1.
Compositions of the self-compacting SFRC (kg/m3).
The flow properties and workability were tested via a slump test using a 30 cm-high inverted cone. The falling slump was 22.0 cm, and the slump diameter was 44 cm, indicating good fluidity and workability. According to the Technical specification for concrete pumping construction (JGJ T10-2011) of China [27], the falling slum for a 200 m-high structure is 19~22 cm, and the slum spread is 45~59 cm for a 400 m-high structure. Therefore, the workability and flowability of the manufactured composite in this study is excellent, which meet the needs of ordinary pumping concrete for 200 m-high structures.
To obtain the mechanical properties of the SFSC, dog-bone, cube (150 × 150 × 150 mm3), and prism specimens (100 × 100 × 300 mm3) were prepared and tested. Three standard cube specimens with dimensions of 150 × 150 × 150 mm were reserved when the wall concrete was cast. The workability was tested via the slump degree and slump flow tests. The SFSC stress–strain curves obtained from the prism specimens are shown in Figure 3; the cube compressive strengths fcu obtained from the cube tests are listed in Table 2.
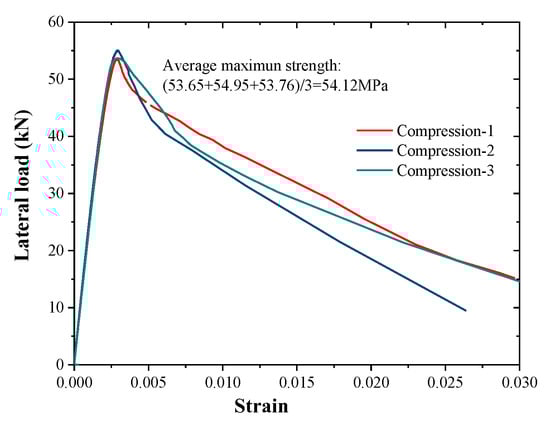
Figure 3.
Stress–strain curves of SFSC under compression.
Table 2.
Concrete mechanical characterization test results.
As can be seen in Table 2, the average cubic, prism, and tensile strengths of the SFSC were 61.35, 54.12, and 2.01 MPa, respectively.
2.1.2. Steel Material Properties
Three steel bar specimens were tested for each rebar diameter used. The average tensile strength, modulus of elasticity, yield strength, ultimate strength, and elongation obtained during the tests are listed in Table 3.
Table 3.
Mechanical properties of steels.
2.2. Shear Wall Specimen Design
The specimens were designed at a 1:2 scale and according to the Concrete Structures Design Code (GB50010-2010) [15] and Buildings Seismic Design Code (GB50011-2019) [28]. Table 4 shows the description of the three shear wall specimens. Three shear wall specimens were cast, one with plain concrete and two with SFSC; the distributed vertical and horizontal rebars in one of the SFSC walls were the same as those in the plain concrete specimen, whereas in the other they were reduced by 30%. The steel reinforcement and specimen configuration are shown in Figure 4. The three shear walls were tested under the same loading sequence to analyze the effects of using SFSC on the seismic performance and failure mode of the walls, as well as the possibility that or degree to which the quantity of distributed rebars could be reduced due to the use of SFSC. Each specimen included top and bottom beams, which were designed as rigid parts to transfer the load and fix the specimen to the ground. The bottom concrete was also fabricated with C60 concrete before the shear wall, leaving a raw surface to ensure good contact. The shear walls and top beams were cast simultaneously to guarantee excellent integration.
Table 4.
The description of the three shear wall specimens.
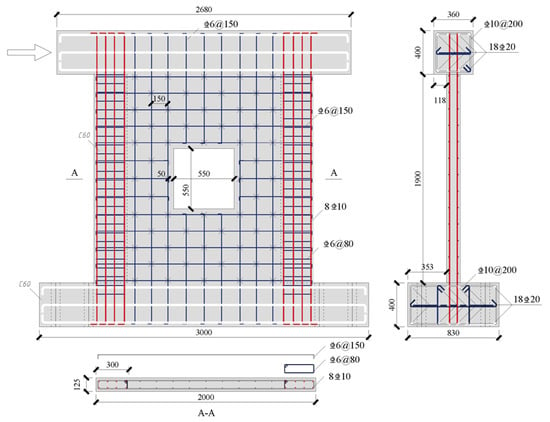
Figure 4.
Configuration of shear wall specimens.
2.3. Test Setup and Loading Sequence
The specimens were subjected to a constant vertical load and an increasing cyclic horizontal load. The bottom beam of the specimen was fixed, while a loading actuator was connected to the top beam. The loading device was a multi-function loading system (Bonneville JAW-3000) with vertical and horizontal loading capacities of 3000 and 2000 kN, respectively. The maximum travel of the horizontal actuator was 100 mm. One end of the horizontal actuator was fixed to the reaction wall, whereas the other acted on the top beam of the specimen through an L-shaped distribution beam; the vertical load was also applied to the loading beam by a vertical actuator.
A vertical compression load of 1200 kN was applied to each specimen and kept constant during the entire test. The horizontal loading sequence is illustrated in Figure 5. Before the formal start of each test, 40% of the vertical pressure was repeatedly applied two or three times to eliminate the uneven gap between the loading frame and the specimen. Similarly, the horizontal cyclic load was partially applied twice to confirm the proper functioning of the measurement system. This preload did not exceed 40% of the estimated crack load. The horizontal load was applied in displacement-controlled cycles, with an initial displacement of 2 mm. Before the specimen yielded, the displacement was incremented in 1 mm steps, applying each target displacement for one cycle. After the specimen yielded, the displacement increment step was 2 mm, and each cycle was repeated three times to determine the accumulated damage. After the lateral load dropped to 85% of its maximum value, each loading level was applied for one cycle until the test terminated. The loading or unloading speed was the same during the entire test to maintain a continuous and uniform loading sequence.
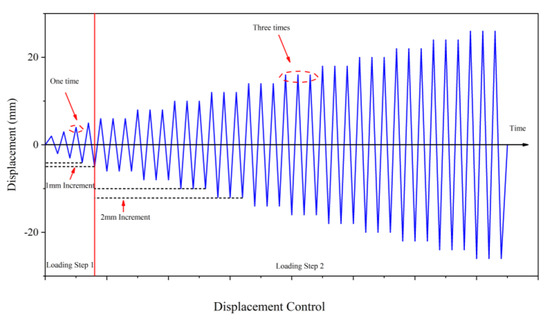
Figure 5.
Loading sequence.
A schematic of the experimental setup is shown in Figure 6. As Figure 6 shows, the testing data were collected using sensors and a data-acquisition system. The force and displacement of the horizontal actuator were measured using its own inner collection system. Other measurements included the horizontal displacement at different heights, the relative vertical deformation, and the diagonal relative deformation of the wall. These displacements or deformations were measured using linear variable differential transformers (LVDTs) and collected by the data-acquisition system. Moreover, to monitor the strain variation during the entire loading procedure, digital image correlation (DIC) technology was employed in this experiment. To focus on the cracking and crushing procedure at the corner of the opening and the wall branch, the speckles were set on a lower corner of each specimen, as shown in Figure 6. Additionally, the test view is also shown in Figure 7. The DIC speckles were set on the back side of the specimen, as demonstrated in Figure 7.
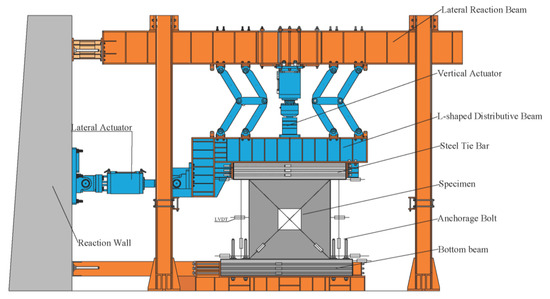
Figure 6.
Test setup.
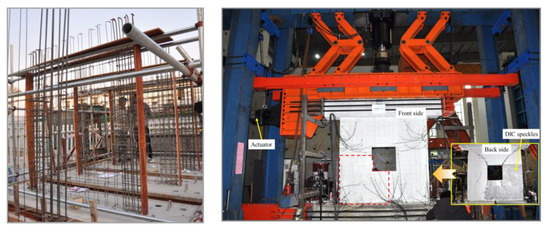
Figure 7.
Manufacturing and testing view.
3. Test Results
3.1. Damage and Crack Propagation
The three shear walls were designed for the shear deformation type, which was also demonstrated in the experiment. From the start of loading until cracking, all specimens were in an elastic working condition, and their load-displacement curves were linear. As the loading advanced, oblique cracks appeared at the corners of the window openings and horizontal cracks developed on both edges of the walls before and after yielding, with the steel-fiber-reinforced specimens clearly exhibiting the development of multiple cracks. After the load reached its peak, the crack propagation behaved as expansion instead of new crack generation. Simultaneously, the lateral strength gradually decreased corresponding with the concrete crushing. By the end of the loading sequence, the concrete diagonal cracks had intersected, the transverse reinforcement had been deboned, and the longitudinal reinforcement had yielded. The damaged front view and damage view at the upper corner of the specimens at as lateral displacement of 18 mm (corresponding to a lateral drift angle of 1/105) are shown in Figure 8.
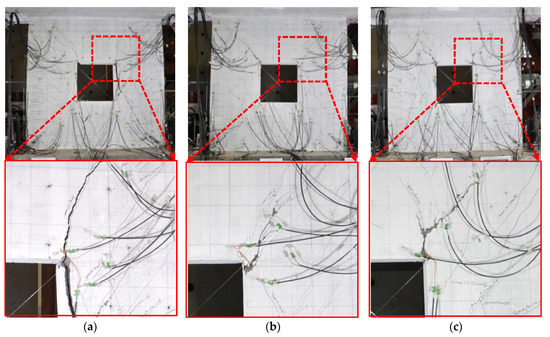
Figure 8.
Damage view of the SFSC shear walls with window at lateral displacement of 18 mm: (a) SWO-W; (b) SWOF-W; (c) SWOF-W (@200).
3.1.1. Improvement of SFSC
During the testing procedure, it can be observed that the crack propagation including the width and spacing of cracks of the SFSC specimen (SWOF-W) were significantly lower than the plain concrete specimen under the same load level, which is also demonstrated in Figure 9. Using DIC technology, it can be found that, at the stage in which the lateral drift was 4 mm (drift angle is 1/475), many cracks appeared on the plain concrete specimen, while only tiny cracks appeared on the specimen made of SFSC, as Figure 9a,d show. In this experiment, the vertical crack first appeared on the lower beam below the window opening, which was caused by the high vertical load. When the lateral drift was 8 mm (drift angle is 1/238), the crack under the window opening expanded, the horizontal cracks extended, the oblique cracks generated and increased and concentrated at the vertical bearing block of the wall for SWO-W. Comparatively, cracks under the window opening also appeared on specimen SWOF-W, which were much tiny than those found in the plain concrete specimen; a horizontal crack also appeared on SWOF-W, but no oblique cracks were observed. When the lateral drift reached 16 mm (drift angle is 1/119), the crack under the opening further expanded, the maximum width was over 1.6 mm, the maximum width of horizontal crack was around 0.6 mm, the oblique crack growth increased, and the cracks were concentrated at the corner of the opening; additionally, a main oblique crack formed across the former oblique crack with a maximum width of around 0.8 mm; similarly, there were horizontal cracks at the lower part near the edge of the wall, which was induced by bending; there was also a crack under the opening and oblique crack at the vertical bearing block, but they were much smaller compared with those in the plain concrete shear wall. When the lateral drift was 18 mm, for the plain concrete specimen, the concrete on the right side of the window opening was completely damaged with the corner concrete crushed, the longitudinal reinforcement at the bottom of the vertical bearing corner was exposed, and the bearing capacity significantly decreased, as Figure 8b shows. In contrast, the SFSC shear walls reached the ultimate stage when the lateral drift was about 20 mm, their integrity was intact, the crack expansion was relatively slow, and the concrete was not spalled. Since there was no strengthening rebar around the opening, the damage pattern of the plain concrete specimen showed a significant oblique crack at the corner, as well as the concrete stripping from the rebar cage at the side of the opening. In comparison, the damage for the SFSC specimen was much lower. If more strengthening measures are taken around the corner, the reinforcing result may be better than the tested case.
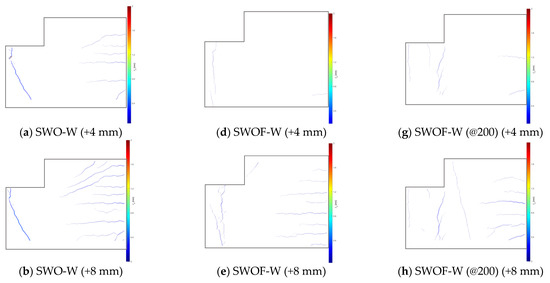
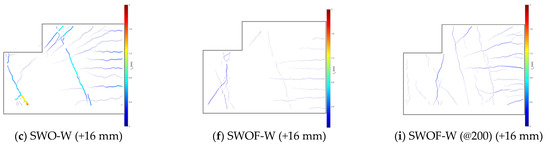
Figure 9.
Crack propagation on different states.
As the test results demonstrated, the tension crack on the lower beam below the window opening can be reduced for the SFSC shear wall; the horizontal tension cracks at the vertical bearing block appeared at about 4 mm for the plain concrete specimen, while that appeared at about 8 mm for the SFSC specimen; additionally, the oblique crack at the vertical bearing block was significantly smaller with the cooperation of steel fiber.
Figure 10 demonstrates the ultimate damage state of the SFSC specimen (SFOW-W). Figure 10a shows the shear and compression damage at the upper corner of the shear wall. Figure 10b shows the tension-shear damage at the upper corner of the window. Figure 10c shows the shear damage on the upper corner block of the wall. As observed, the steel fiber embedded in the shear wall crisscrosses the cracks, which prevents the propagation of the cracks and keeps the shear wall intact during the deformation procedure. Therefore, the main role of the SFSC can be divided into the (a) compression constraint effect, (b) tension retardant effect, and (c) shear dowel effect. The reinforcing mechanics are shown in Figure 11.
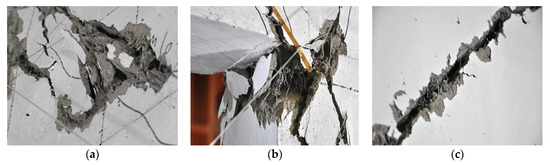
Figure 10.
The reinforcing effect of the hook-end steel fiber within the SFSC shear wall (SFOW): (a) the shear and compression damage at upper corner; (b) tension-shear damage at the upper corner of the window; (c) the shear damage on the wall.
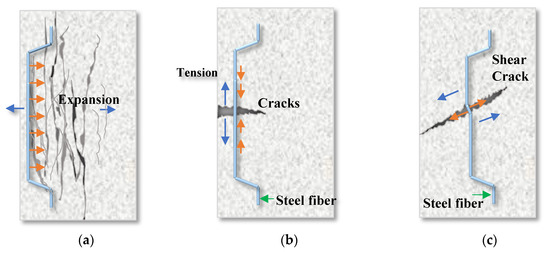
Figure 11.
The three-reinforcing effect of steel fibers in the concrete matric members: (a) compression constraint effect; (b) tension retardant effect; and (c) shear dowel effect.
3.1.2. Substitution of Distribution Reinforcement by SFSC
The crack distributions are also detected via DIC technology at the lower corner near the loading end, as Figure 6 and Figure 7 show. The recognized cracking propagation by DIC is demonstrated at a lateral displacement of 4 mm, 8 mm, and 16 mm, corresponding to a lateral drift angle of 1/475, 1/238, and 1/119.
Compared with the plain concrete wall specimen, the distribution-reinforcement-reduced SFSC shear wall did not significantly weaken. From Figure 9a,g, it can be found that cracks at the lower beam below the opening initially appeared, which were tiny compared to those found in the plain concrete wall, and the edge horizontal cracks were fewer and smaller than those of the plain concrete one. When the lateral drift increased to 8 mm, there were more horizontal cracks and the oblique crack appeared at the vertical bearing block of the SFSC wall (SWOF-W (@200)), but the horizontal cracks were much less and tiny compared with the plain concrete specimen and no oblique cracks appeared at the end of the horizontal cracks compared with those of the plain concrete wall. At the stage of lateral drift reaching 16 mm, the cracks of SFSC with reduced reinforcement further increased and widened; there were two main oblique cracks on the vertical bearing block, but the maximum crack was within about 0.6 mm, while that of the plain concrete specimen was 1.6 mm below the opening; the maximum oblique crack was also around 1.0 mm. As observed and compared, even with reduced distribution reinforcement, the SFSC shear wall still performed with an improved crack prevention effect for oblique and horizontal crack propagation. A large distribution space induced more oblique cracks on the vertical bearing block, while SFSC prevented the crack from further concentrated propagation, which generally resulted in brittle failure prevention.
3.2. Hysteretic Behavior
3.2.1. Hysteresis Curves
To understand the seismic behavior of the shear wall specimens, the hysteretic load-displacement curves, which are shown in Figure 12, were analyzed. The lateral load at the top of the specimen was measured using the inner system of the horizontal actuator. The lateral displacement Δ was obtained as the relative displacement between the base of the specimen, and the load centroid was measured by the LVDTs.
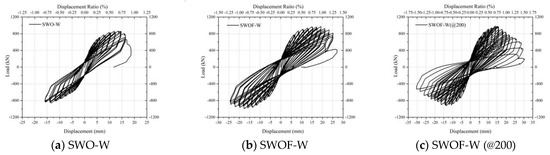
Figure 12.
Hysteresis curves of the specimens.
As Figure 12 shows, the loading curves of each specimen in the positive and negative directions are straight before yielding. After yielding, the stiffness of the walls gradually degraded, and the hysteresis loop gradually formed a bow. After it reached its maximum lateral bearing value, the lateral bearing force of the plain concrete specimen degraded and rapidly lost its bearing capacity, while those of the SFSC specimens gradually decreased to the ultimate stage.
The area enclosed by a hysteresis loop represents the dissipated seismic energy of the specimen. The variation in the area enclosed by each hysteresis loop with the displacement for the three specimens during the loading process is shown in Figure 13. It can be seen that the energy dissipation capacity of the two specimens with steel fibers was better than that of the ordinary reinforced concrete specimen at all stages of the loading process. As shown, when the displacement reaches 8 mm (lateral drift angle of 1/238), the energy dissipation capacity of the SWOF-W specimen is 7.12% higher than that of the SWO-W, the difference between the energy dissipation capacities of the SWOF-W and SWOF-W (@200) specimens being less than 1%. When the displacement reaches 12 mm (lateral drift angle of 1/158), the energy dissipation of the SWOF-W specimen increases by 12.00% compared with that of the SWO-W specimen, and the energy dissipation of SWOF-W (@200) is almost the same as that of SWOF-W at this stage. When the displacement reaches 22 mm (displacement ratio of 1/86), the energy dissipation of the SWOF-W is 14.24% higher than that of SWOF-W (@200), whereas the SWO-W wall has already failed. During the whole loading process, the energy dissipation capacities of both specimens with steel fibers were better than that of the ordinary concrete specimen, indicating that the addition of steel fibers effectively improved the seismic energy dissipation capacity of the shear walls with openings. The energy dissipation capacities of the SFSC and plain concrete shear walls were similar during the early loading stage, but they significantly increased in the late loading stage. The SFSC shear walls showed improved energy dissipation capacity and the shear wall with reduced reinforcement still possessed much better energy dissipation capacity compared with the plain concrete shear wall. The reinforcing effect of SFSC was still better than that provided by the 30% reinforcement in the ordinary concrete shear wall. The results reflect that the reinforcing effect of SFSC can be used to reduce the distribution reinforcement to resist the shear force.
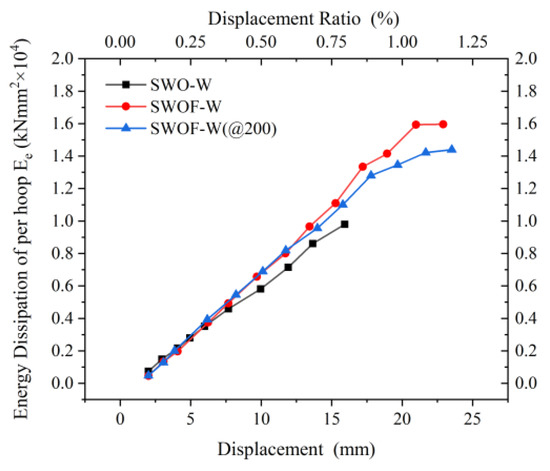
Figure 13.
Energy dissipation capacity of each hoop.
3.2.2. Skeleton Curves
The specimen skeleton curves are shown in Figure 14. The characteristic points are marked in the figure and summarized in Table 5. According to these results, the shear wall specimens show elastic characteristics in the initial loading stage, with the stiffness of the SWOF-W and SWOF-W (@200) walls before yielding being slightly greater than that of the SWO-W wall.
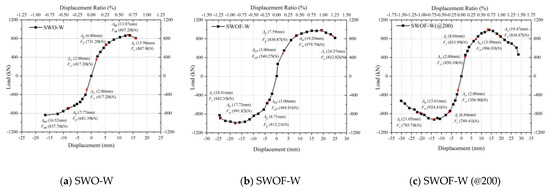
Figure 14.
Skeleton curves of specimens.
Table 5.
Lateral load and top displacement at different service states.
Compared with the peak bearing capacity of SWO-W, those of SWOF-W and SWOF-W (@200) were 12.9% and 13.8% higher, respectively. After the specimens reached the peak bearing capacity, the ordinary concrete shear wall SWO-W exhibited a sharp decrease in the bearing capacity, while the SFSC shear walls SWOF-W and SWOF-W (@200) experienced a ductile failure mode after a flat load drop. Even after reducing the reinforcement, the post-peak horizontal bearing capacity of the SWOF-W (@200) shear wall decreased slightly and provided better ductility.
Compared with a shear wall with an aspect ratio of approximately 2.0, the deformation capacity of the shear walls tested in this study was low [10,11], which was because the failure was mainly caused by shear damage. This shear damage was significant at the corner of the opening for both the plain concrete wall and SFSC wall, and the vertical bearing block for the plain concrete wall, as Figure 9 shows.
3.2.3. Load-Bearing Capacity Degradation
The load-bearing capacity degradation is the decrease that structural members exhibit under repeated loading cycles with the same displacement amplitude. The bearing capacity degradation of a wall is of great significance to its force and seismic performance, and the rate of bearing capacity degradation or decay determines its ability to resist the load. The Chinese JGJ/T 101-2015 building seismic test procedure standard [23] specifies the bearing capacity degradation coefficient λi obtained from each cycle, and the same loading amplitude can be used to examine the bearing capacity reduction performance of the specimen, as follows:
where denotes the ith cyclic peak load during jth level of loading, and denotes the i – 1th cyclic peak load during jth level of loading.
This study calculated the bearing capacity degradation coefficient of the specimens for all displacement levels using the third cycle relative to the first cycle, as shown in Figure 15.
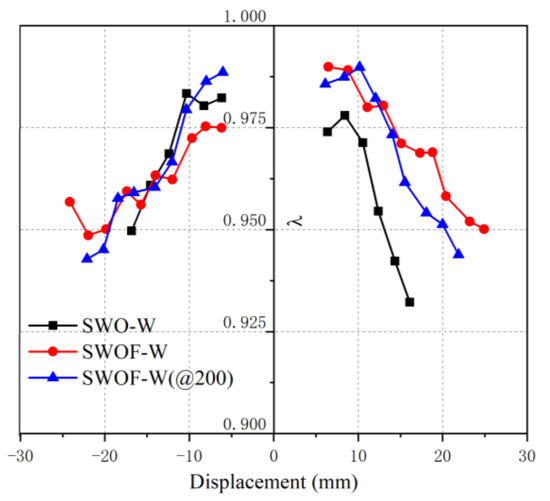
Figure 15.
Load-bearing capacity degradation curves.
Figure 15 shows that the bearing capacity degradation coefficient of SFSC shear walls is generally higher than that of plain concrete shear walls. Specifically, at the late stage of loading, the plain concrete specimen experiences rapid strength degradation due to irreversible damage to its concrete and steel bars, resulting in a loss of the shear-bearing capacity. In contrast, SFSC elements exhibit a relatively smooth and slow decrease in bearing capacity, consistent with their behavior observed in the skeleton curve. Therefore, SFSC also prevents rapid degradation of the bearing capacity during cyclic loading.
3.2.4. Residual Deformation
The residual deformation of the shear wall is an important index for assessing the magnitude of the self-replacement capability of shear wall members during loading. The residual deformation is defined as the deformation of the structural member when it is unloaded to zero. To demonstrate the residual deformation of the walls influenced by the SFSC, the residual lateral drift and drift angle of the three shear wall members under each loading condition level were calculated, and the results are shown in Figure 16, as well as the residual deformation limits at each performance level specified in the code.
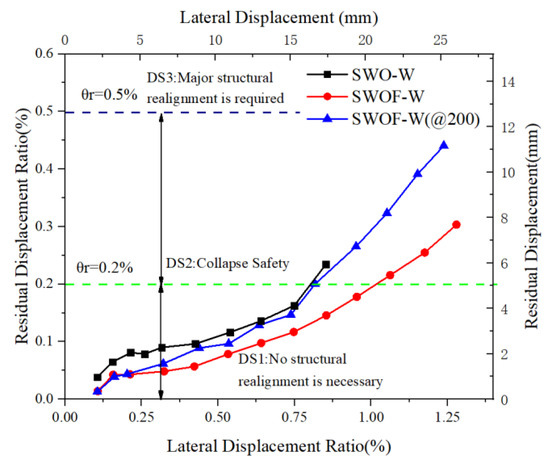
Figure 16.
Residual deformation curves.
As demonstrated, the residual deformation angle of the SFRC wall (SWOF-W) is significantly less than that of the plain concrete wall (SWO-W). The residual deformation of the reduced reinforcement SFRC wall (SWOF-W (@200)) is between those of the above two specimens. With an increase in the displacement angle, the residual deformation angle of the SFRC walls increased but lower than that of the plain concrete wall (SWO-W). When the lateral displacement increased at about 16 mm, the plain concrete wall was ultimate damaged, while the specimens SWOF-W and SWOF-W (@200) still maintained lateral bearing capacity. In these three specimens, the SFRC wall (SWOF-W) performed best with lowest residual displacement, and SWOF-W (@200) with reduced reinforcement had restricted residual displacement particularly before yielding stage.
FEMA P58-1 identifies four damage states (DS1) associated with residual drift. These damage states range from the onset of damage to nonstructural components to near-collapse of the structure. Damage State 1 (DS1) represents that no structural realignment is necessary for structural stability; Damage State 2 (DS2) represents that realignment of the structural frame and related structural repairs required to maintain permissible drift limits for nonstructural and mechanical components and to limit the degradation of the structural stability (i.e., collapse safety); Damage State 3 (DS3) represents that major structural realignment is required to restore the margin of safety for lateral stability. As specified, the limit residual drift ratio of DS1 is 0.2%, and the limit residual drift of DS2 is 0.5%.
As is shown in Figure 16, when reaching DS2, the residual lateral drift angles of SWO-W, SWOF-W, and SWOF-W (@200) are 0.8166%, 1.017%, and 0.8029%, respectively. SWOF-W (@200) reaches DS3 (the limit residual drift ratio is 0.5%) when the lateral drift angle is 1.3084% (1/76), while the maximum residual displacement of SWOF-W and SWO-W is about 0.3% and 0.25%.
In terms of the controlling effect of residual deformation, it can be obtained that the residual limit specified in code for low-aspect-ratio shear walls with openings under a high axial load is over-estimated; the residual displacement of failure state is around 0.25% to 0.3% in this case; SFSC significantly prevents the residual displacement from rapid growing compared to the plain concrete wall; even when reducing the amount of distribution reinforcement by 30%, the specimen made of SFSC still performed better than the plain concrete wall.
3.3. Bending and Shear Displacement
The lateral deformation of the shear walls is generally caused by shear deformation, bending deformation, and horizontal slip, which can be expressed by Equation (2).
where Ut is the total lateral horizontal deformation, Us is the horizontal deformation of the shear wall due to shear, Uf is the horizontal deformation of the shear wall due to bending, and Usl is the horizontal deformation of the shear wall due to slipping.
The displacement was measured by deformation meters as Figure 6 shows. The lateral slip of the shear wall specimens observed in this test was very small; thus, it is ignored in the analysis. The bending deformation was measured using LVDT arranged on both sides of the wall. The shear deformation of shear walls is obtained using the “X” shaped displacement meter; this method is proposed by Hiraishi on the surface of the wall to obtain the average shear deformation by measuring the diagonal length change [29]. The deformation value calculated from the displacement meter measurement in the test must be corrected [27] to obtain the following deformation calculation formula:
where l and h are the width and height of the wall, respectively; Dmeas1 and Dmeas2 are the diagonal lengths of the shear wall after deformation measured by the test; V1 and V2 are the heights of both sides of the wall after deformation measured by the test; Uf is the horizontal deformation produced by bending of the specimen; , Xcorrected is the average shear deformation; θ is the rotation angle of the top beam; α is the center of rotation of the shear wall bending deformation to the ratio of the distance from the top of the measurement to the full height of the measurement; according to the literature [30], α is recommended as 0.67. The diagram of each symbol is shown in Figure 17.
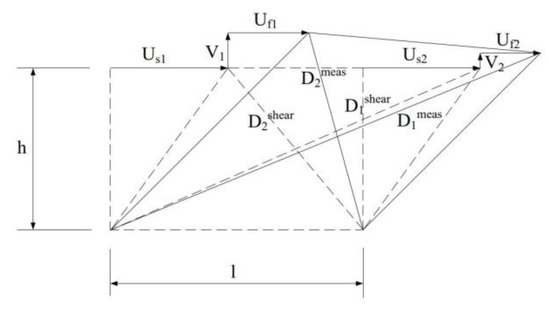
Figure 17.
Bending and shear deformation calculation model.
The shear and bending deformation of the individually extracted shear walls at all levels of loading conditions and the variation in the shear-bending deformation ratio of the shear walls with lateral displacement are shown in Figure 18. Comparing the magnitude of bending deformation and shear deformation of each specimen, it can be seen that the damage form of all three shear walls is shear damage, and the ratio of shear deformation to bending deformation of steel fiber fine stone concrete shear wall SWOF-W is slightly smaller than that of plain concrete SWO-W, which shows the effect of steel fiber admixture on the shear resistance of shear walls, while the shear deformation of SWOF-W (@200) accounts for a larger percentage, and changing reinforcement rate affects the damage mode of shear walls.
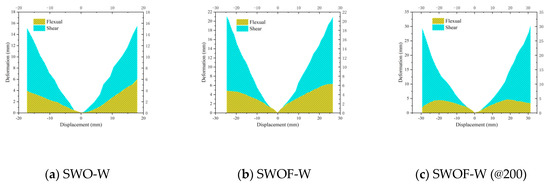
Figure 18.
Comparison of the deformation components in different specimens.
When the lateral displacement reaches 8 mm, the shear deformation rates of SWO-W, SWOF-W, and SWOF-W (@200) are 1.44 mm, 0.37 mm, and 0.95 mm, respectively. When the lateral displacement reaches 12 mm, the shear deformation rates of SWO-W, SWOF-W, and SWOF-W (@200) are 2.78 mm, 1.36 mm, and 2.37 mm, respectively; SWO-W failed when the lateral displacement reached 16 mm, while the shear deformation rates of SWOF-W and SWOF-W (@200) were 2.99 mm and 5.31 mm, respectively. These shear displacements at different loading stages indicate that the shear deformation can be greatly restricted for the SFSC wall, and even with the distribution reinforcement reduced by 30%, a slightly higher shear-resistance performance for SFSC wall was observed.
Shear Deformation Ductility
Since the failure of the specimens in this study is the domain by shear failure, to find the shear deformation development, Figure 19 shows the lateral load-shear deformation skeleton curve of the specimen. Correspondingly, the shear displacement ductility was calculated, and the results are listed in Table 6.
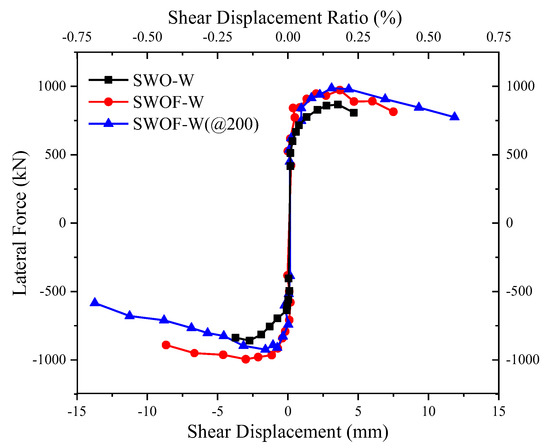
Figure 19.
Lateral load–shear deformation curves.
Table 6.
Lateral load, shear displacement, and shear displacement ductility at different service states.
The data presented in Figure 19 and Table 6 show that the SFSC wall (SWOF-W) has better shear displacement ductility than the SWO-W specimen. The SWOF-W (@200) sample also showed a significant increase in shear ductility of 96.9% and 14.91%, respectively, compared to the ordinary plain concrete specimen SWO-W. These results prove that adding steel fibers greatly improves member shear ductility, preventing brittle shear failure and promoting a more ductile pattern. Additionally, replacing some of the steel reinforcement with steel fibers is feasible for enhancing shear ductility.
3.4. Seismic Damage Analysis
In this study, the damage index was determined using the Park–Ang [31] seismic damage model. To account for the shear domain failure mode of the shear walls, Perus [32] and Gan Jinfeng’s studies [33] were consulted during the calculation. The resulting curve of the damage index in relation to lateral displacement is presented in Figure 20.
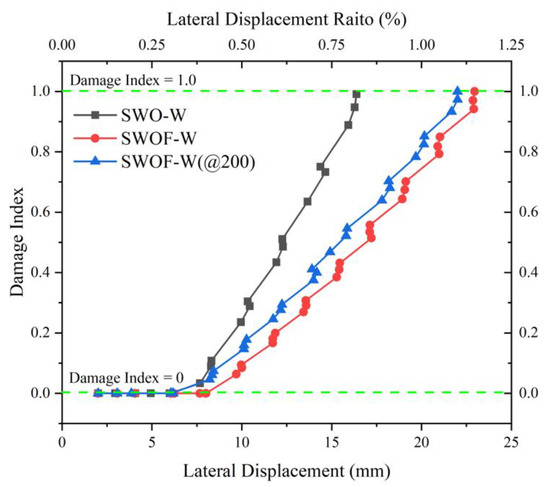
Figure 20.
Top displacement-damage index curves.
At the beginning of loading, the damage index was almost 0 because the members were in the elastic phase. With the increase in loading displacement, the damage index of the specimen started to increase, and the maximum lateral displacement of the specimen approached in three cycles of the same level of loading, while the damage index continued to increase.
Owing to the crack prevention and shear capacity reinforcement, the damage index was significantly less than that of the plain concrete walls. As can be seen from Figure 20, under the same loading displacement, the damage index of the SWO-W specimen was the largest, followed by the SWOF-W (@200) specimen, and the damage index of the SWOF-W specimen was the smallest. When the specimens were loaded to 8 mm for the third time, the damage indexes of SWO-W and SWOF-W (@200) were 0.1078 and 0.0741, respectively, while the damage index of SWOF-W remained 0 for the yield displacement having not been reached; when the specimens were loaded to 12 mm for the third cycle, the damage indexes of SWO-W, SWOF-W, and SWOF-W (@200) were 0.5109, 0.1996, and 0.2943; when the specimens were loaded to 16 mm for the third time, the damage indexes of SWO-W, SWOF-W, and SWOF-W (@200) were 0.9907, 0.4314, and 0.5463, respectively. The damage index of the SFSC wall with reduced reinforcement also showed an improved damage prevention effect compared with the plain concrete wall.
3.5. The Equivalent Viscous Damping Coefficient
The equivalent viscous damping coefficient curves of the two members were drawn separately in terms of the energy dissipation capacity of the specimens, as shown in Figure 21. It was observed that the energy dissipation capacity of the SWOF-W specimen after loading up to the yield displacement was significantly higher than that of the plain concrete specimen (as indicated by the red line in the figure), with the improvement of the viscous damping coefficient under the same displacement condition. The energy dissipation capacity of specimen SWOF-W (@200) after loading up to the yield displacement was also significantly higher than that of the plain concrete specimen (as indicated by the red line in the figure), with the improvement in the viscous damping coefficient under the same displacement condition. When the lateral displacement reached 8 mm, the equivalent viscous damping coefficients of SWO-W, SWOF-W, and SWOF-W (@200) were 0.0995, 0.1242, and 0.1306, respectively; when the lateral displacement reached 12 mm, the equivalent viscous damping coefficients of SWO-W, SWOF-W, and SWOF-W (@200) were 0.0822, 0.1249, and 0.11956, respectively; when the lateral displacement reached 16 mm, the equivalent viscous damping coefficients of SWO-W, SWOF-W, and SWOF-W (@200) were 0.0861, 0.1182, and 0.1199, respectively.
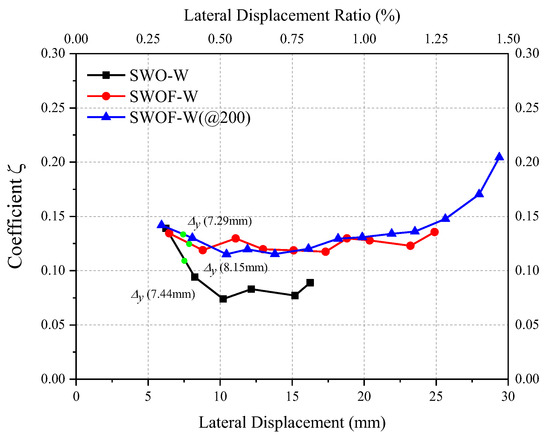
Figure 21.
Equivalent viscous damping coefficient.
4. Summary
4.1. Improving Effect of SFRC on Seismic Performance
Comparison are carried out between the plain concrete specimen (SWO-W) and SFRC specimen (SWOF-W), the two specimens were same in the configuration and distributed reinforcement spaced of 150 mm.
In terms of specimen strength, considering the skeleton curve characteristic points and displacement ductility coefficient listed in Table 3, it was found that the yield, peak, and ultimate loads of the SWOF-W specimen increased by 16.39%, 15.64%, and 3.68%, respectively, compared with those of the SWO-W specimen, which indicates that the use of SFRC contributed to enhancing the strength of the specimens.
Similarly, regarding the shear capacity of the specimens, based on the characteristic points of the shear deformation skeleton curve and shear ductility coefficient of the specimens summarized in Table 4, it can be seen that the yield, peak, and ultimate shear loads and the shear ductility coefficient of the SFRC specimen (SWOF-W) increased by 21.69%, 12.98%, 3.08%, and 96.91%, respectively, which indicates that the SFRC improved the shear capacity of the members particularly for the shear ductility.
In terms the equivalent viscos damping coefficient, when the lateral displacement is 8 mm, 12 mm and 16 mm (corresponding to the lateral drift angle is 1/237, 1/158 and 1/119), it is improved by 24.82%, 51.95% and 37.28% respectively for SFRC wall to plain concrete wall.
From the tested results, the seismic capacity including lateral bearing capacity, shear displacement prevention capacity, shear ductility and the equivalent viscos damping coefficient are greatly improved. The existing of steel fibers help to dissipate more energy during the loading procedure, which is related to the three reinforcing effects of constrain, deboning and dowel effect. For this high axial shear damage domain shear walls with openings, the use of SFRC plays positive damage prevention role, which is important in the damage state evaluation of these mid-high-rise concrete structures. It is prospective in the future application for next generation of high resilient structures.
4.2. The Substitution Effect of Steel Fiber Concrete for Steel Bar
Comparing specimens SWO-W and SWOF-W (@200), these two specimens were made of plain concrete and SFRC in terms of material, and SWO-W was constructed with distributed reinforcement spaced at 150 mm, whereas SWOF-W (@200) was design with reinforcement spaced at 200 mm. The test results of the two specimens were compared to determine the effect of replacing part of the distributed reinforcement with steel fibers.
In terms of specimen strength, from the skeleton curve characteristic points and displacement ductility coefficient listed in Table 3, it was found that the yield, peak, and ultimate loads of specimen SWOF-W (@200) increased by 14.92%, 12.11%, and 0.54%, respectively, compared with those of the plain concrete wall, which indicates that the use of steel fibers instead of distributed reinforcement is feasible while ensuring member strength.
Similarly, regarding the shear capacity of the specimens, based on the characteristic points of the shear deformation skeleton curve and shear ductility coefficient of the specimens presented in Table 4, it can be seen that the yield, peak, and ultimate shear loads and the shear ductility coefficient of the SWOF-W (@ 200) specimen were 25.17%, 13.80%, 3.83%, and 14.92% higher, respectively, than those of the plain concrete specimen, which indicates that the use of steel fibers instead of distributed steel reinforcement improved the shear capacity of the members.
In terms the equivalent viscos damping coefficient, when the lateral displacement is 8 mm, 12 mm and 16 mm (corresponding to the lateral drift angle is 1/237, 1/158 and 1/119), it is improved by 31.25%, 45.45% and 39.26% respectively for SFRC wall with 30% reduced reinforcement to plain concrete wall.
Since dense reinforcement always bring inconvenient for construction and have little improvement on cracking prevention for concrete, the substitution of distribution reinforcement is important for constructing. Moreover, the use of SFRC still shows improved lateral bearing capacity, shear deformation ductility and energy dissipation capacity, which demonstrates the presence of SFRC is equal or even better than the reinforcing function of 30% of the distribution reinforcement. Thus, it is significant on constructing process as well as on disaster prevention effect by applying the SFRC.
5. Conclusions
The seismic performance of the SFRC shear walls with openings was manufactured and tested under cyclic loading with an axial compression ratio of 0.2. Two aspects were focused on the improving effect of SFRC and the substitution possibility of the strengthening rebars and the shear resistance rebars. The following conclusions can be drawn from this study:
- 1.
- The failure evolution comparison indicates that the presence of SFRC can delay the appearance of horizontal cracks; the oblique crack can be significantly lightened for the bridging effect of the steel fibers;
- 2.
- Compared with the ordinary plain concrete shear wall specimen, the SFRC shear wall exhibits significantly improved seismic performance and the damage of the opening corner was significantly relived;
- 3.
- The SFRC wall with 30% reduced distribution rebar still shows improved seismic capacity comparing to the plain concrete wall which indicate the participate of the SFRC can substitute part of the shear rebar.
With improved tensile and shear toughness, the use of SFRC shows great positive damage prevention role for this high axial shear damage domain shear walls with openings, and it is also experimentally improved that it achieved good seismic performance by substitution part of the strengthening rebar around the opening corner and distribution rebar. For the future application, it is still necessary to improve the dispersion property of the steel fibers to achieve better seismic performance than that demonstrated in this study and the exact performance prediction formula can be proposed.
Author Contributions
Methodology, H.Z.; Validation, Z.C.; Investigation, Y.D.; Writing—original draft, Z.T.; Writing—review & editing, Y.D.; Funding acquisition, H.Z. and Y.D. All authors have read and agreed to the published version of the manuscript.
Funding
The National Key R&D Program of China (2019YFE0112600), the National Natural Science Foundation of China (Grant Nos. 52078459), and the Natural Science Foundation of Zhejiang Province (Grant Nos. LZ22E080005).
Informed Consent Statement
Not applicable.
Data Availability Statement
Not applicable.
Acknowledgments
The research work of this paper is especially thanks to the great support given by Liao Wencheng’s research group in Taiwan and Wang Jiyang in Zhejiang University.
Conflicts of Interest
The authors declare no conflict of interest.
References
- Li, B.; Qian, K.; Wu, H. Flange effects on seismic performance of reinforced concrete squat walls with irregular or regular openings. Eng. Struct. 2016, 110, 127–144. [Google Scholar] [CrossRef]
- Guo, Z.X.; Lu, X.L. Experimental study on the hysteretic model of RC columns with high axial compressive ratio. China Civ. Eng. J. 2004, 37, 32–38. [Google Scholar]
- Zhang, Y.; Wang, Z. Seismic behavior of reinforced concrete shear walls subjected to high axial loading. ACI Struct. J. 2000, 97, 739–750. [Google Scholar]
- Massone, L.M.; Muñoz, G.; Rojas, F. Experimental and numerical cyclic response of RC walls with openings. Eng. Struct. 2019, 178, 318–330. [Google Scholar] [CrossRef]
- Taylor, C.; Cote, P.; Wallace, J.W. Design of slender reinforced concrete walls with openings. ACI Struct. J. 1998, 95, 420–433. [Google Scholar]
- Wang, J.Y.; Sakashita, M.; Kono, S.; Tanaka, H. Shear behavior of reinforced concrete structural walls with eccentric openings under cyclic loading: Experimental study. Struct. Des. Tall Spec. Build. 2012, 21, 669–681. [Google Scholar] [CrossRef]
- Song, X.B.; Cai, Q.; Xiao, X.W.; Cao, Z.W.; Li, C.; Zhang, S.Q. Study on mechanical behavior of monolithic assembled concrete shear wall with non-connected vertical distribution reinforcement and window opening. Build. Struct. 2023, 53, 30–35. [Google Scholar]
- Hosseini, S.A.; Kheyroddin, A.; Mastali, M. An experimental investigation into the impacts of eccentric openings on the in-plane behavior of squat RC shear walls. Eng. Struct. 2019, 197, 109410. [Google Scholar] [CrossRef]
- Bhanu, K.C.; Ganesan, N.; Indira, P.V. Behavior of High-Performance Concrete Shear Walls with Openings under Reversed Cyclic Loading. ACI Struct. J. 2022, 119, 227–241. [Google Scholar]
- Mosoarca, M. Failure analysis of RC shear walls with staggered openings under seismic loads. Eng. Fail. Anal. 2014, 41, 48–64. [Google Scholar] [CrossRef]
- Yu, H.J.; Kang, S.M.; Park, H.G.; Chung, L. Cyclic Loading Test of Structural Walls with Small Openings. Int. J. Concr. Struct. Mater. 2019, 13, 40. [Google Scholar] [CrossRef]
- Ali, A.; Reinforced Wight, J. Concrete Structural Walls with Staggered Opening Configurations under Reverse Cyclic Loading; Report No. UMCE 90–05; Department of Civil Engineering, University of Michigan: Ann Arbor, MI, USA, 1990. [Google Scholar]
- Ou, Y.C.; Hoang, L.; Roh, H. Cyclic behavior of squat reinforced concrete walls with openings typical of exterior walls of row houses in Taiwan. Eng. Struct. 2019, 195, 231–242. [Google Scholar] [CrossRef]
- ACI (American Concrete Institute). ACI 318-08: Building Code Requirements for Reinforced Concrete; ACI: Farmington Hills, MI, USA, 2008. [Google Scholar]
- GB 50010-2010; Industry Standard of the People’s Republic of China. Code for Design of Concrete Structures. China Architecture & Building Press: Beijing, China, 2010.
- NZS 3101; SNZ (Standards New Zealand). Code of Practice for the Design of Concrete Structures, Parts 1 and 2. Standards New Zealand: Wellington, New Zealand, 1995.
- Lin, Z.; Zhang, H.; Monti, G.; Castoro, C. Effects of Openings and Axial Load Ratio on the Lateral Capacity of Steel-Fiber-Reinforced Concrete Shear Walls. Buildings 2022, 12, 2032. [Google Scholar] [CrossRef]
- Hwang, S.J.; Lee, H.J. Analytical model for predicting shear strengths of interior reinforced concrete beam column joints for seismic resistance. ACI Struct. J. 2000, 97, 35–44. [Google Scholar]
- Liao, W.C. Crack opening evaluation of highly flowable strain hardening fiber-reinforced concrete (HF-SHFRC) under tensile and shear forces. Am. Soc. Civ. Eng. 2014, 253, 9–16. [Google Scholar]
- Liao, W.C.; Su, W.R. Implementation of highly-flowable strain hardening fiber reinforced concrete in new RC beam-column joints. MATEC Web Conf. 2018, 147, 01003. [Google Scholar] [CrossRef]
- Boita, I.E.; Dan, D.; Stoian, V. Seismic behavior of composite steel fiber reinforced concrete shear walls. IOP Conf. Ser. -Mater. Sci. Eng. 2017, 245, 022006. [Google Scholar] [CrossRef]
- Lu, X.L.; Zhang, Y.; Zhang, H.M.; Zhang, H.; Xiao, R. Experimental study on seismic performance of steel fiber reinforced high strength concrete composite shear walls with different steel fiber volume fractions. Eng. Struct. 2018, 171, 247–259. [Google Scholar] [CrossRef]
- Zhang, H.M.; Zhang, Y.; Lu, X.L. Influence of Axial Load Ratio on the Seismic Behavior of Steel Fiber Reinforced Concrete Composite Shear Walls. J. Struct. Eng. 2019, 146, 04019171. [Google Scholar] [CrossRef]
- Zhao, J.; Qiu, J.H.; Gao, D.Y. Experimental Study of Steel Fiber Partially Reinforced Concrete Shear Wall. J. Appl. Basic Eng. Sci. 2010, 18, 10. [Google Scholar]
- Carrillo, J.; Alcocer, S.M.; Pincheira, J.A. Behavior of low-rise, steel fiber-reinforced concrete thin walls under shake table excitations. Eng. Struct. 2017, 138, 146–158. [Google Scholar] [CrossRef]
- Tseng, C.-C.; Chen, L.-P.; Hwang, S.-J. Experimental Study of Non-ductile Frame Infilled with RC Shear Wall with Openings. Struct. Eng. 2018, 33, 68–83. [Google Scholar]
- JGJ/T 101-2015; Industry Standard of the People’s Republic of China. Specification of Testing Method for Earthquake Resistant Building. China Architecture & Building Press: Beijing, China, 2015.
- GB 50011-2019; Industry Standard of the People’s Republic of China. Code for Seismic Design of Buildings. China Architecture & Building Press: Beijing, China, 2019.
- Hiraishi, H. Evaluation of shear and flexural deformation of flexural type shear walls. Bull. N. Z. Soc. Earthq. Eng. 1984, 17, 135–144. [Google Scholar] [CrossRef]
- Massone, L.M.; Wallace, J.W. Load-Deformation Responses of Slender Reinforced Concrete Walls. ACI Struct. J. 2004, 101, 103–113. [Google Scholar]
- Park, Y.J.; Ang AH, S. Mechanistic seismic damage model for reinforced concrete. J. Struct. Eng. 1985, 111, 722–739. [Google Scholar] [CrossRef]
- Peruš, I.; Fajfar, P.; Grabec, I. Prediction of the seismic capacity of RC structural walls by non-parametric multidimensional regression. Earthq. Eng. Struct. Dyn. 1994, 23, 1139–1155. [Google Scholar] [CrossRef]
- Gan, J.F.; Chen, X.L.; Zhang, Y.B.; Fu, J.P. Shear failure test and seismic damage analysis of shear walls. Civ. Constr. Environ. Eng. 2018, 40, 142–150. [Google Scholar]


Disclaimer/Publisher’s Note: The statements, opinions and data contained in all publications are solely those of the individual author(s) and contributor(s) and not of MDPI and/or the editor(s). MDPI and/or the editor(s) disclaim responsibility for any injury to people or property resulting from any ideas, methods, instructions or products referred to in the content. |
© 2023 by the authors. Licensee MDPI, Basel, Switzerland. This article is an open access article distributed under the terms and conditions of the Creative Commons Attribution (CC BY) license (https://creativecommons.org/licenses/by/4.0/).