Article

Further Explanation on the Excitation Mechanism of Stay Cable Vibration in Dry Conditions

Faculty of Road and Bridge Engineering, The University of Danang—University of Science and Technology, Danang 550000, Vietnam
*
Author to whom correspondence should be addressed.
Buildings 2023, 13(6), 1543; https://doi.org/10.3390/buildings13061543
Submission received: 5 June 2023 / Revised: 14 June 2023 / Accepted: 15 June 2023 / Published: 17 June 2023

Abstract

:
The present article outlines a research investigation carried out in a wind tunnel setting aimed at augmenting comprehension of the excitation mechanism of stay cable vibration in arid conditions. A multitude of wind tunnel experiments were thoroughly scrutinized. The study commenced by conducting measurements of the stay cable vibration in conditions of steady flow. The flow angle was set at 45 degrees, and the inclination was set at 25 degrees. The wind velocities varied during the experiment. Additionally, an investigation into the flow field surrounding the stay cable’s was conducted in both vertical and horizontal directions. By utilizing two hot wire anemometers in the cable wake, an extensive database of flow field measurements was obtained. The experimental results revealed that the vibration characteristics of the stay cable under the arid conditions considered in this study aligned with findings reported in existing literature. Notably, a deeper comprehension of the excitation mechanism of a stay cable in a dry state was attained. This mechanism is closely associated with the inhibition of Karman vortices and the development of low-frequency vortices. At low wind speeds, Karman vortices predominated, resulting in small-amplitude vibrations. However, as the wind speed increased, the influence of Karman vortices diminished progressively, while the low-frequency vortices grew stronger. These low-frequency vortices exhibited high energy and a significant correlation with shedding along the stay cable, thereby inducing cable vibration in a dry environment.

1. Introduction

Wind-induced stay cable vibration can be divided into several categories. A number of variables can influence the excitation of stay cables, including the critical wind speed range, cable angles, rain volume, vibration magnitude, and dynamic cable properties. Dry-state galloping of stay cable (DSG) is a recent phenomenon that causes hazardous cable vibration in desiccated environments [1,2,3,4,5]. DSG is a wind-induced vibration phenomenon characterized by significant amplitude. This phenomenon is typically observed during dry weather conditions and is often associated with high wind speeds. Despite the observation of significant amplitude in cable vibrations in various field studies [4,5,6,7,8], no on-site measurements were conducted to comprehensively comprehend the underlying cause. Recent research employing both field observations and wind tunnel tests has demonstrated the phenomenon in issue. It is difficult to fully comprehend all of its attributes. As reported in references [9,10,11,12,13,14], the wind tunnel investigation has also identified the presence of DSG (dynamic stall generation) in the stay cable. Hence, it is imperative to acknowledge its occurrence on stay-cable bridges. In DSG, it is possible to differentiate between two distinct types of cable vibration. The initial type of vibration is denoted as possessing a restricted amplitude and is denominated “limited amplitude vibration”. The second type of galloping is known as divergent galloping, which pertains to the erratic oscillation of a cable. The occurrence of divergent galloping is conjoined with the presence of adverse aerodynamic damping. When the magnitude of damping is significant enough to exceed the positive structural damping, it leads to a negative effective damping of the cable. As a result, the amplitude of the oscillation will experience a significant increase, resulting in a motion that demonstrates divergence. Consequently, the quantification of the aerodynamic damping of a stay cable could serve as a valuable approach for comprehending the mechanics of DSG. The evaluation of the aerodynamic dampening of a vibration cable subjected to wind forces is frequently conducted through the utilization of the conventional DenHartog criteria [15]. Macdonald et al. [16] extended the conventional DenHartog theory to enable its application to a cylindrical structure undergoing vibration in any direction perpendicular to its axis and possessing any cross-sectional shape. In addition, Piccardo et al. [17] proposed a dynamic model of inclined full-scale stay-cables under the effect of yawed steady wind, which is able to induce DSG. Nevertheless, Qingkuan Liu et al. [18] conducted a study to investigate the impact of modifications in the cross-sectional configuration of stay cables. Specifically, they compared the performance of micro-elliptical sections with that of circular cylinders. The results of their study revealed that the regions of galloping that were anticipated based on the quasi-steady hypothesis did not demonstrate a satisfactory correlation with the actual vibrations that were observed. Consequently, the utilization of the quasi-steady assumption as a prediction method is unsuitable for precise prognostication of the detected vibrations.
Parallel to this, Nakamura et al. [19] proposed that the phenomenon of galloping can be explained by the interference of the separation flows around a bluff body, leading to a balance of pressure on both the upper and lower surfaces of the cable due to the interaction of these distinct flows. Matsumoto et al. [4] conducted wind tunnel experiments with the aim of elucidating the role of axial flow in galloping instability. This was achieved by introducing both natural and artificial axial flow in the wake of the cable. The empirical findings unequivocally demonstrate that the presence of axial flow in the wake possesses the capability to initiate galloping. Matsumoto et al. [20] have previously reported the identification of axial flow in physical bridge configurations through the use of light strings as representations of prototype stay cables. Nonetheless, the fundamental concepts that regulate axial flow are not yet fully comprehended. The study conducted by Nikitas et al. [13] revealed that the flow pattern’s transitional behavior in the critical Reynolds number range, along with its interaction with wind turbulence and inclination angle, has a notable impact on the incidence of dry galloping. The occurrence of an unusual dynamic response necessitates a blend of quasi-steady features and unsteadiness, like the wake-induced vibration phenomenon. Significant findings include abrupt alterations in movement, inconsistent temporal gaps between loading and movement, and a wind-generated force element displaying traits similar to rigidity. McTavish et al. [21] conducted a wind tunnel experiment to examine the aerodynamic characteristics of stay cables with varying surface geometries in a dry environment. Nevertheless, the precise mechanism underlying the action of DSG remains incompletely comprehended.
Previous studies have provided a restricted comprehension of the characteristics of DSG, employing various methodologies to investigate this phenomenon. Nevertheless, the understanding of the mechanism of excitation that triggers the oscillation of circular cylinders caused by wind in dry environments remains limited. Furthermore, the flow regime surrounding the cable in the context of DSG events is largely unclear. The objective of this study is to enhance our comprehension of the excitation mechanism in DSG, with a specific emphasis on circular cables.

2. Experimental Setting Up

2.1. Wind Tunnel and Cable Model

The wind tunnel employed in this investigation is an open-circuit wind tunnel that incorporates a working section with measurements of 1.3 m in width and 1.3 m in height. The apparatus possesses the capacity to perform experiments while maintaining consistent flow conditions, characterized by elevated flow velocities of up to 20 m/s. The present study involved the vertical plane support of a circular cylinder with a single degree of freedom. The assessment of turbulence intensity was conducted within the wind tunnel to ensure the homogeneity of the flow field.
The manipulation of the suspended cable frame through two distinct angles, namely the inclined angle (α) and the horizontal angle (β), can enable the simulation of cable orientation, as shown in Figure 1. The predetermined angle of 25° was conjoined with a horizontal angle of 45°. A standard practice in the design of cable-stayed bridges involves selecting an inclined angle of 25° to accommodate the inclination of the stay cables that are situated at the apex of the tower. The wind relative angle denoted as β* represents the angle formed between the direction of the wind and the axis of the cable.

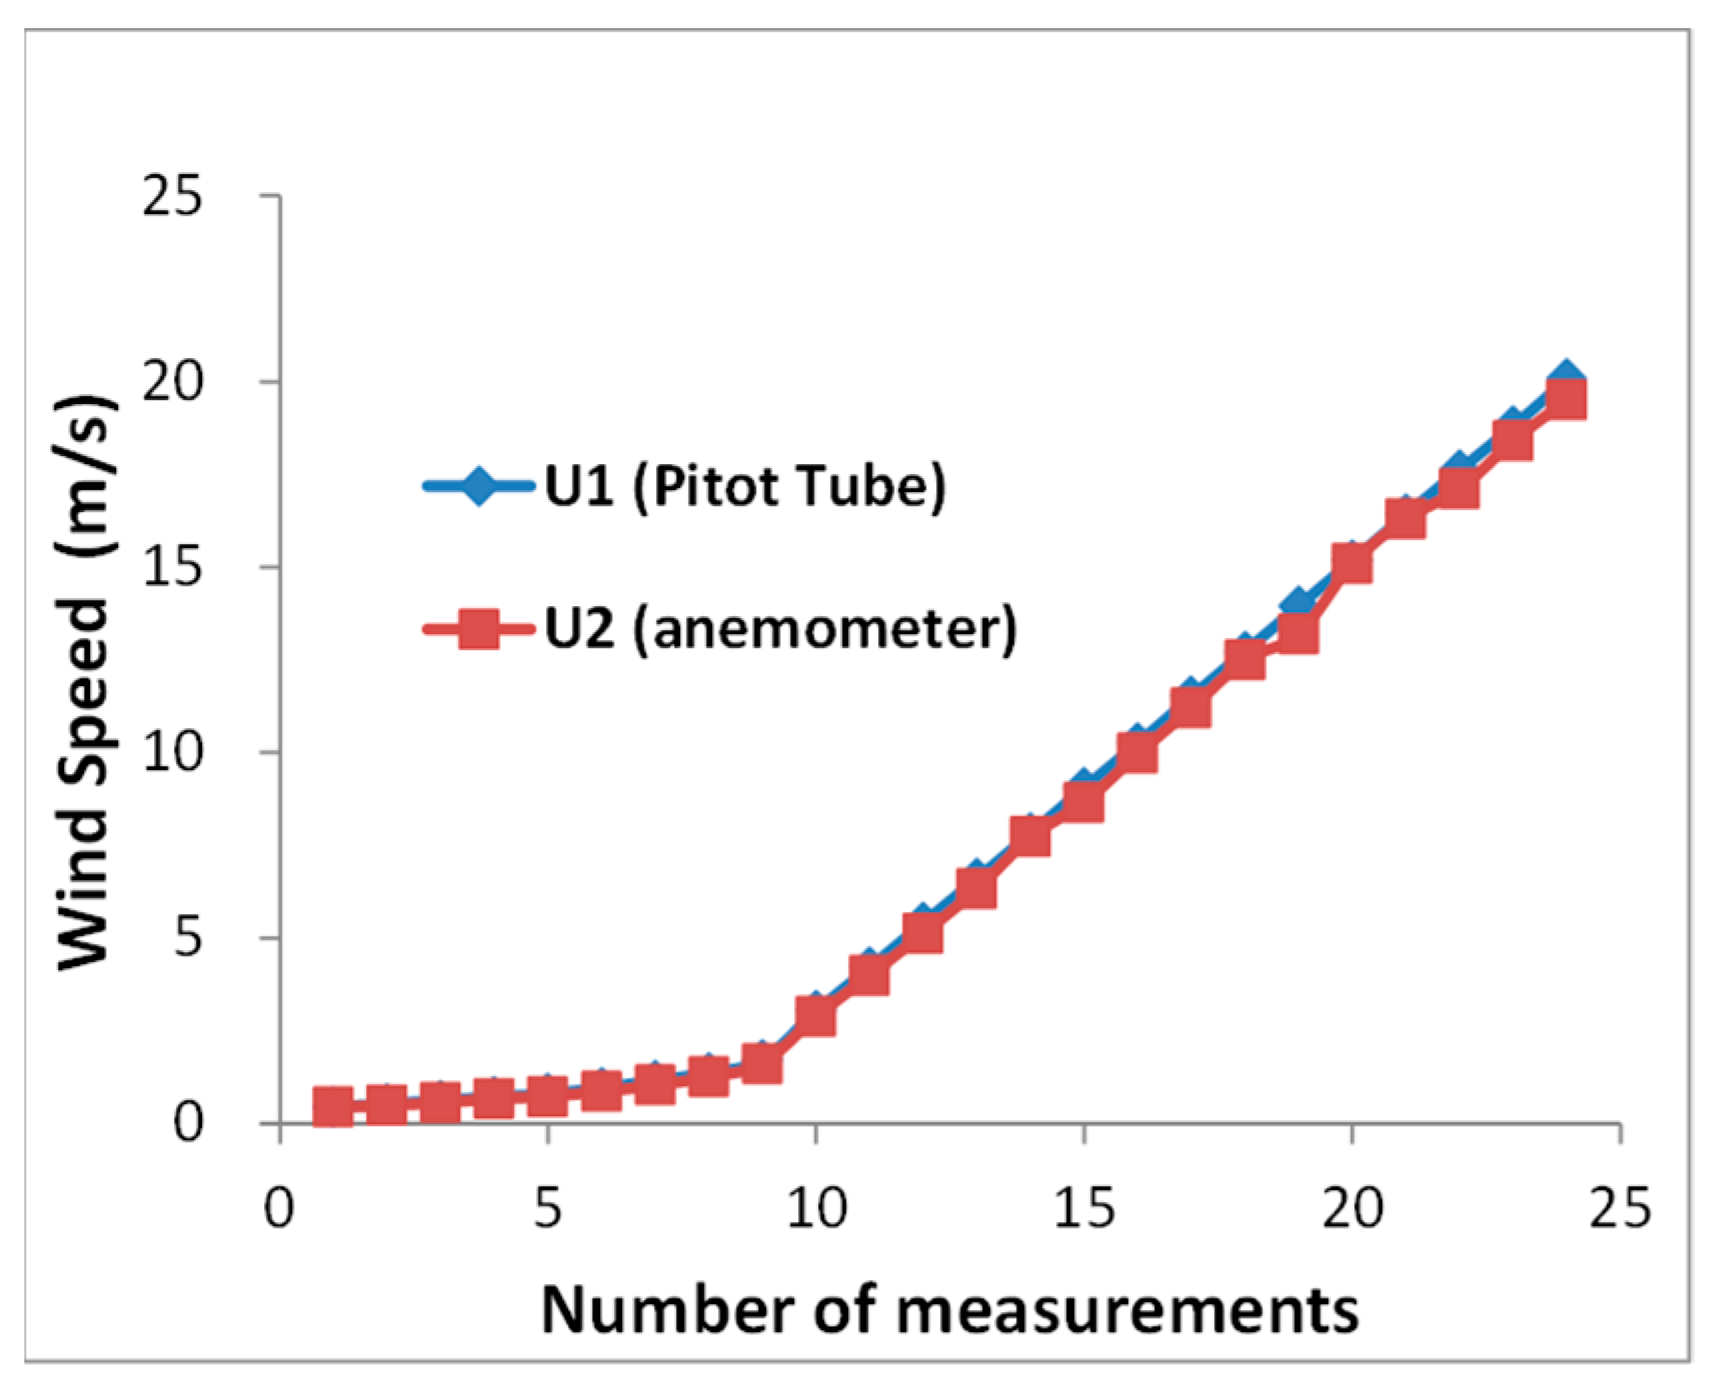
2.2. Wind Flow Profile

The analysis of turbulence intensity was conducted within the wind tunnel to ascertain the homogeneity of the flow field. The flow conditions were assessed by means of a hot wire anemometer located at the position of the cylinder prototype. Based on the findings of the measurements, a range of turbulence levels around 0.5–0.6% were detected across various wind velocities, as presented in Table 1. The wind speed measurements were acquired at each location through the utilization of a hot wire apparatus, as illustrated in Figure 2. The aforementioned procedure facilitated the validation of the wind velocity variance between the location of the cable model at the wind tunnel entrance and the interior of the wind tunnel, where the Pitot tube was situated. Table 2 presents a comparison of wind speeds at different locations, indicating that wind speeds at two distinct sites are generally similar. The wind speed ratio (U1/U2) at the cable position has been estimated to be approximately 1.03, based on the analysis of wind speeds spanning from 3 to 20 m/s.

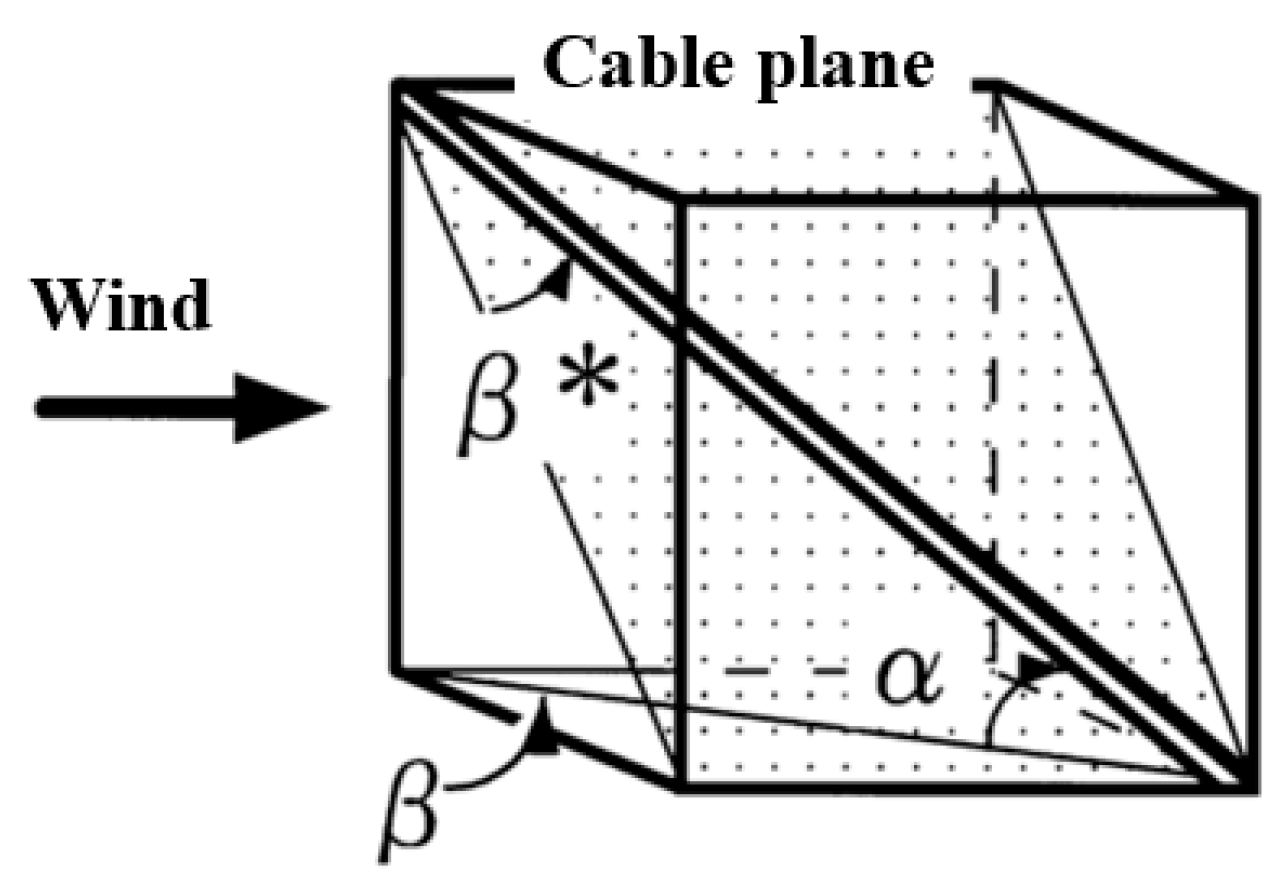
2.3. Experimental Parameters

Table 3 provides a detailed overview of the experimental parameters, including the cable diameters measuring 158 mm and the effective model length of 1.5 m. In both instances, the aspect ratio measures 9.5. The logarithmic decrement denotes that the damping exhibits variability within the range of around 0.5% to 1.6%. The empirical data indicates that the customary magnitude of factual stay cables implies that the inherent frequency falls within the range of roughly 0.8 to 1 Hz. The maximum wind speed attainable is 20 m/s, which is equivalent to a Reynolds number of approximately 2.1 × 10⁵.
The phenomenon of DSG reproduction in a wind tunnel for stay cables is depicted in Figure 3. The stay cable exhibited oscillations of restricted magnitude at lower wind velocities. At a wind speed around 8–10 m/s, a limited vibration amplitude was also found. Nevertheless, once the wind velocity attained a critical value of 10 m/s, the cable exhibited a phenomenon commonly referred to as divergent galloping, wherein the amplitude escalates despite the constant wind speed. At a wind velocity of approximately 12 m/s, a maximum vibration amplitude of roughly 22 cm was observed. It is noteworthy that the present cable model underwent testing with a significantly low damping ratio. Subsequently, the DSG continues to operate at elevated wind velocities. The discovery mentioned above is consistent with prior research conducted by scholars [1,2,4].

3. Excitation Mechanism of Wind-Induced Circular Cylinder Vibration

The flow pattern around the cable wake will be investigated to shed light on the galloping mechanism of a circular cylinder. The wavelet analysis on the vertical wind fluctuation component (w-component) and along the wind fluctuation component (u-component) will be performed to reveal the flow field pattern surrounding the cable wake.

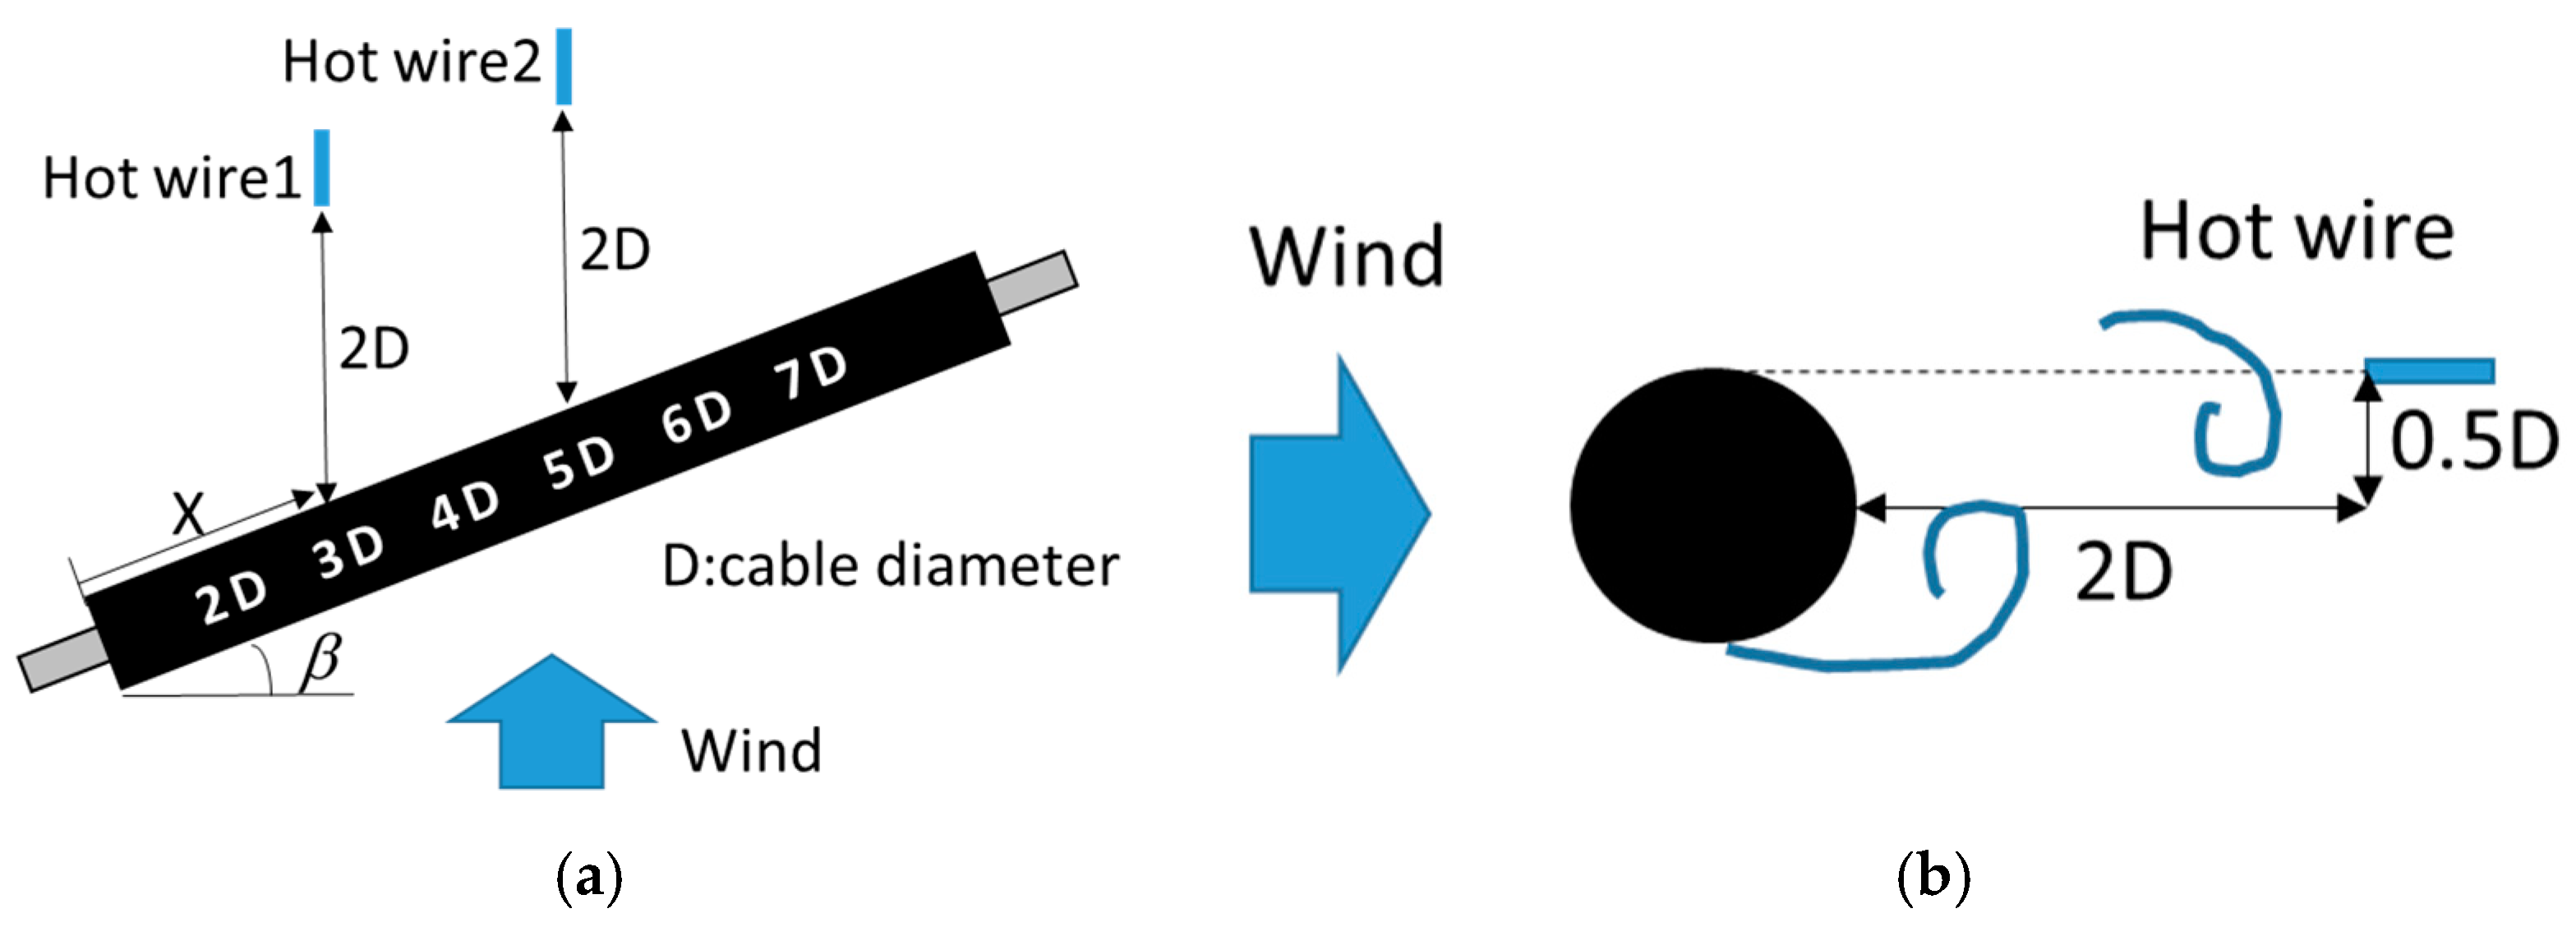
3.1. Wake Flow Measurements

On the model, the fluctuating wind velocity after the inclined cable was measured. The vertical component of wind (w) and the horizontal component of wind in the direction of motion (u) will be taken into account. Stay cables featuring a horizontal angle of 45 degrees and an inclination of 25 degrees were implemented within the wind tunnel. As illustrated in Figure 4, the hot wire anemometer sensor was situated at a distance of 2D from the cable discharge (Figure 4a) and at a distance of 0.5D from the cable axis (Figure 4b). The hot wire anemometer sensor was relocated from the upper side to the lower side of the cable at distances ranging from 2D to 7D. This setup enables the examination of the spatiotemporal fluctuations of wind velocity across different wind speeds.

3.2. Excitation Mechanism of DSG

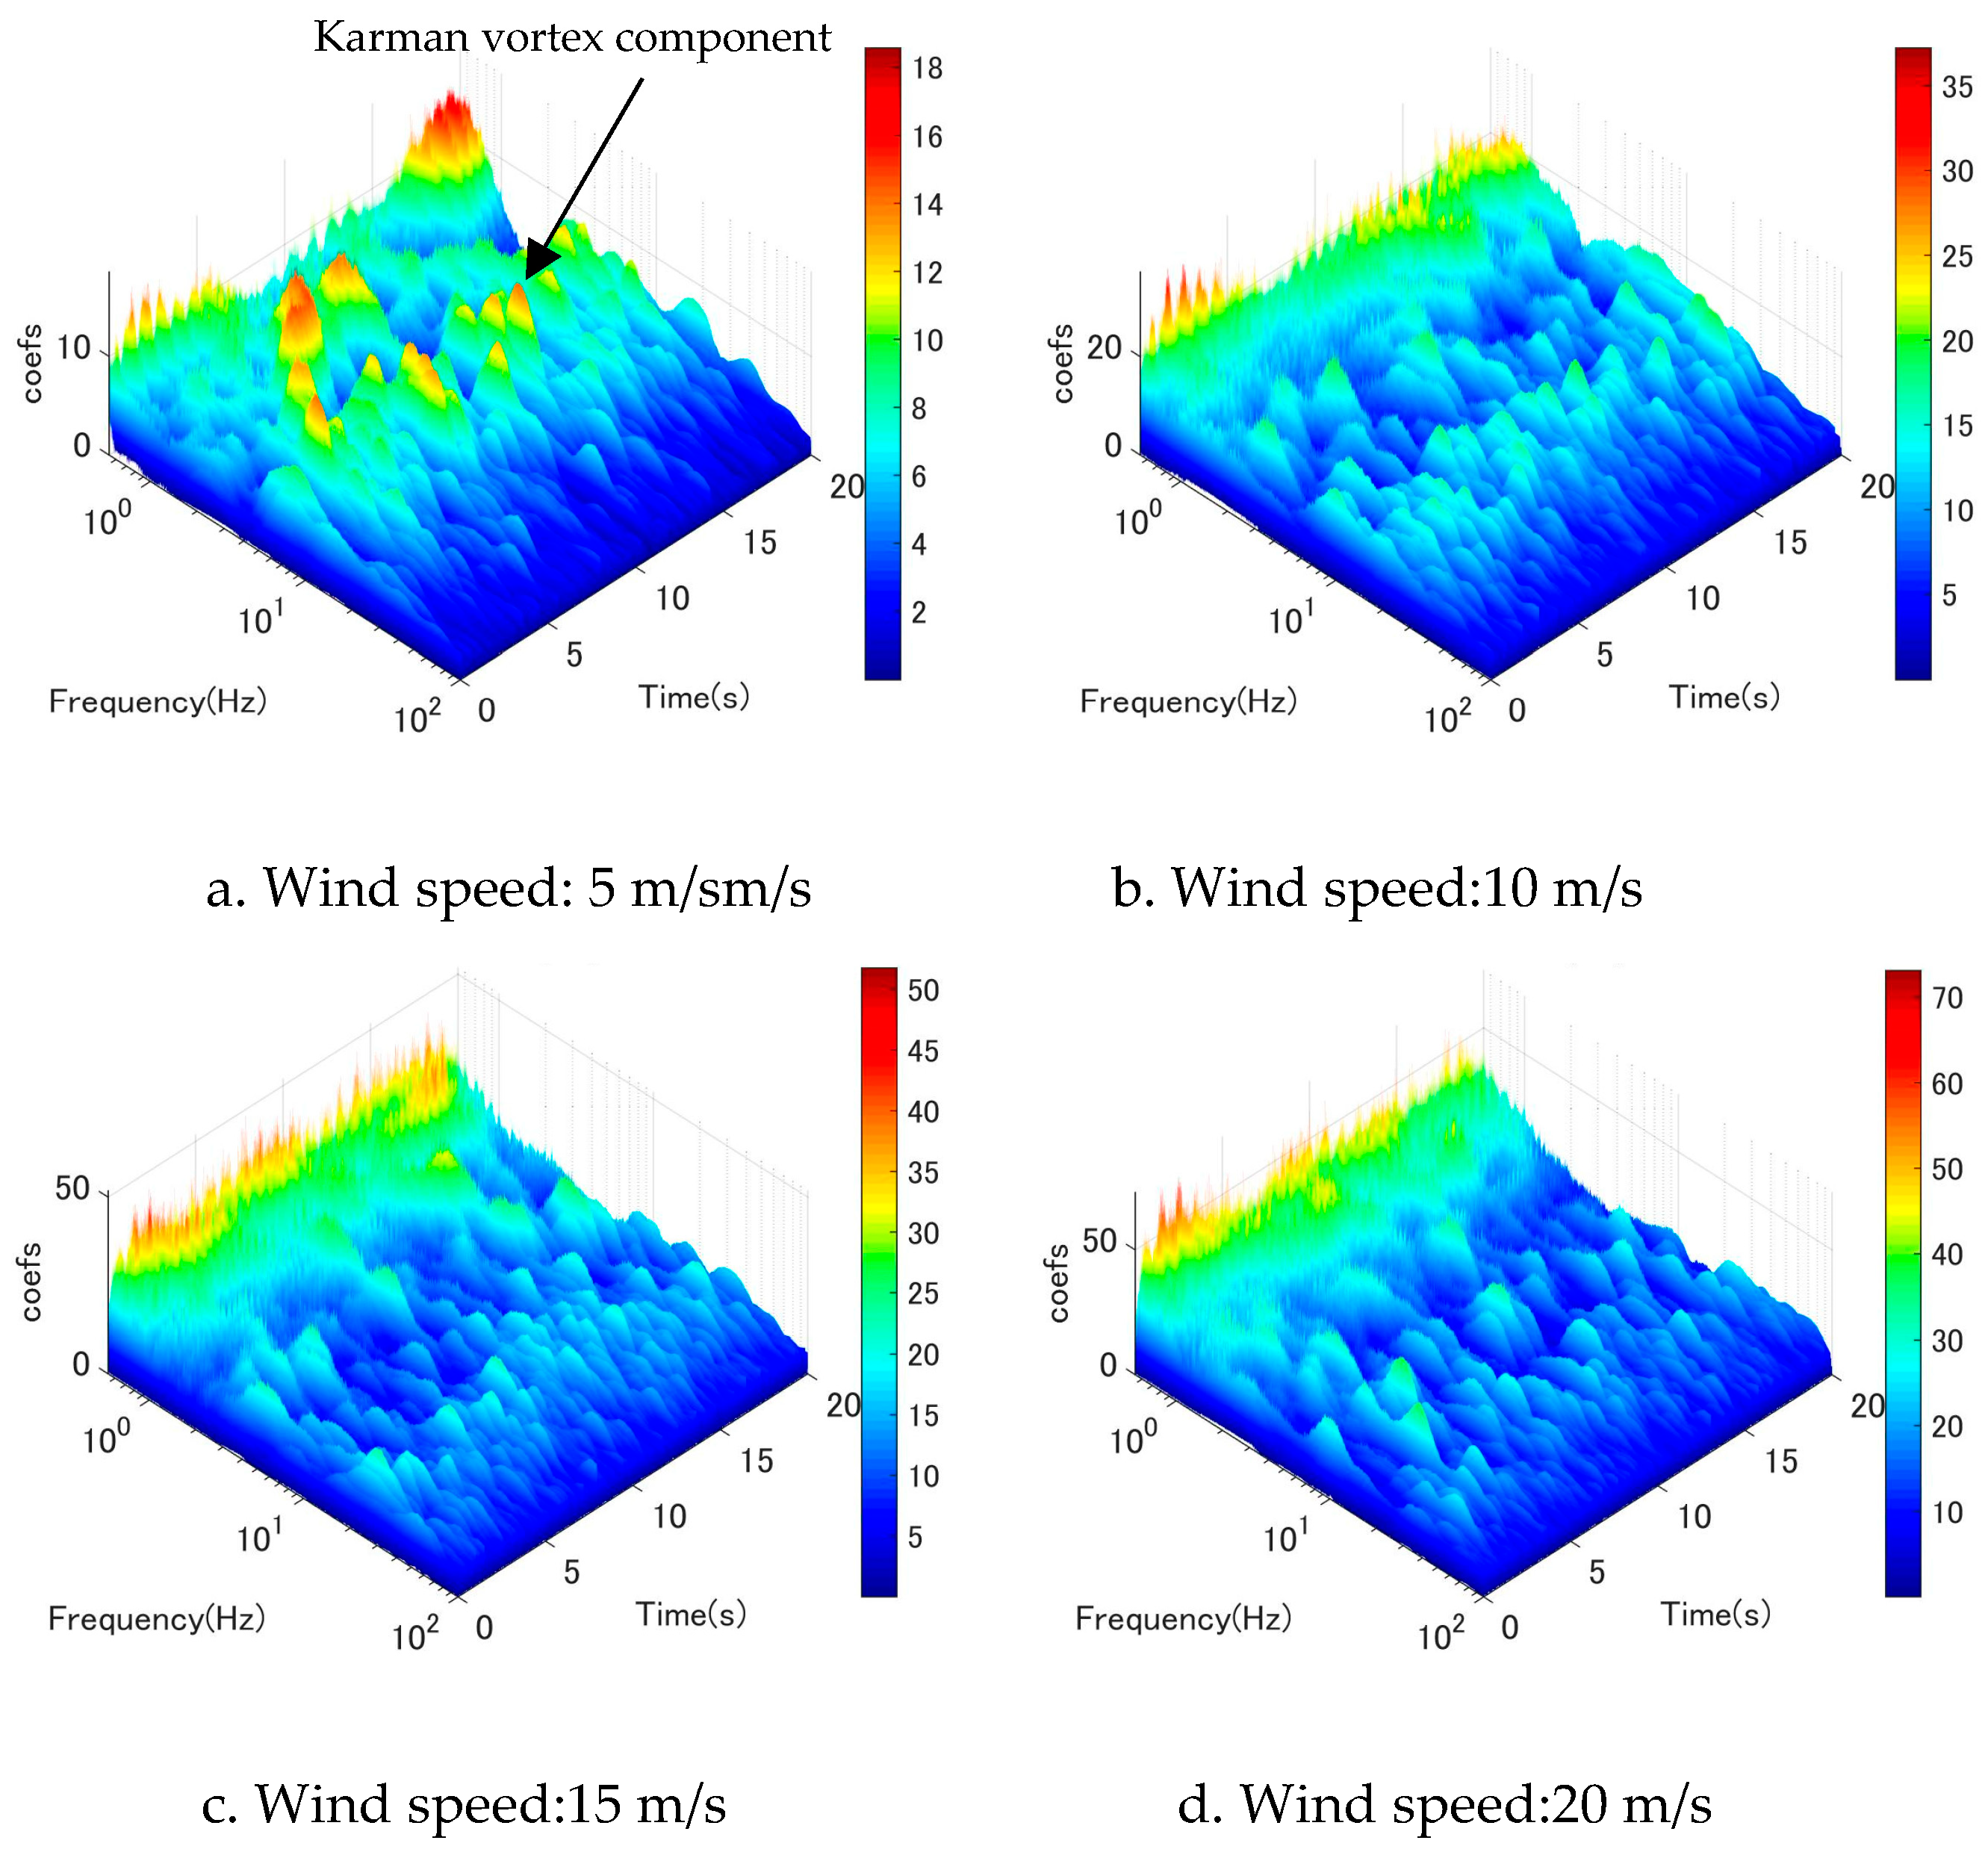
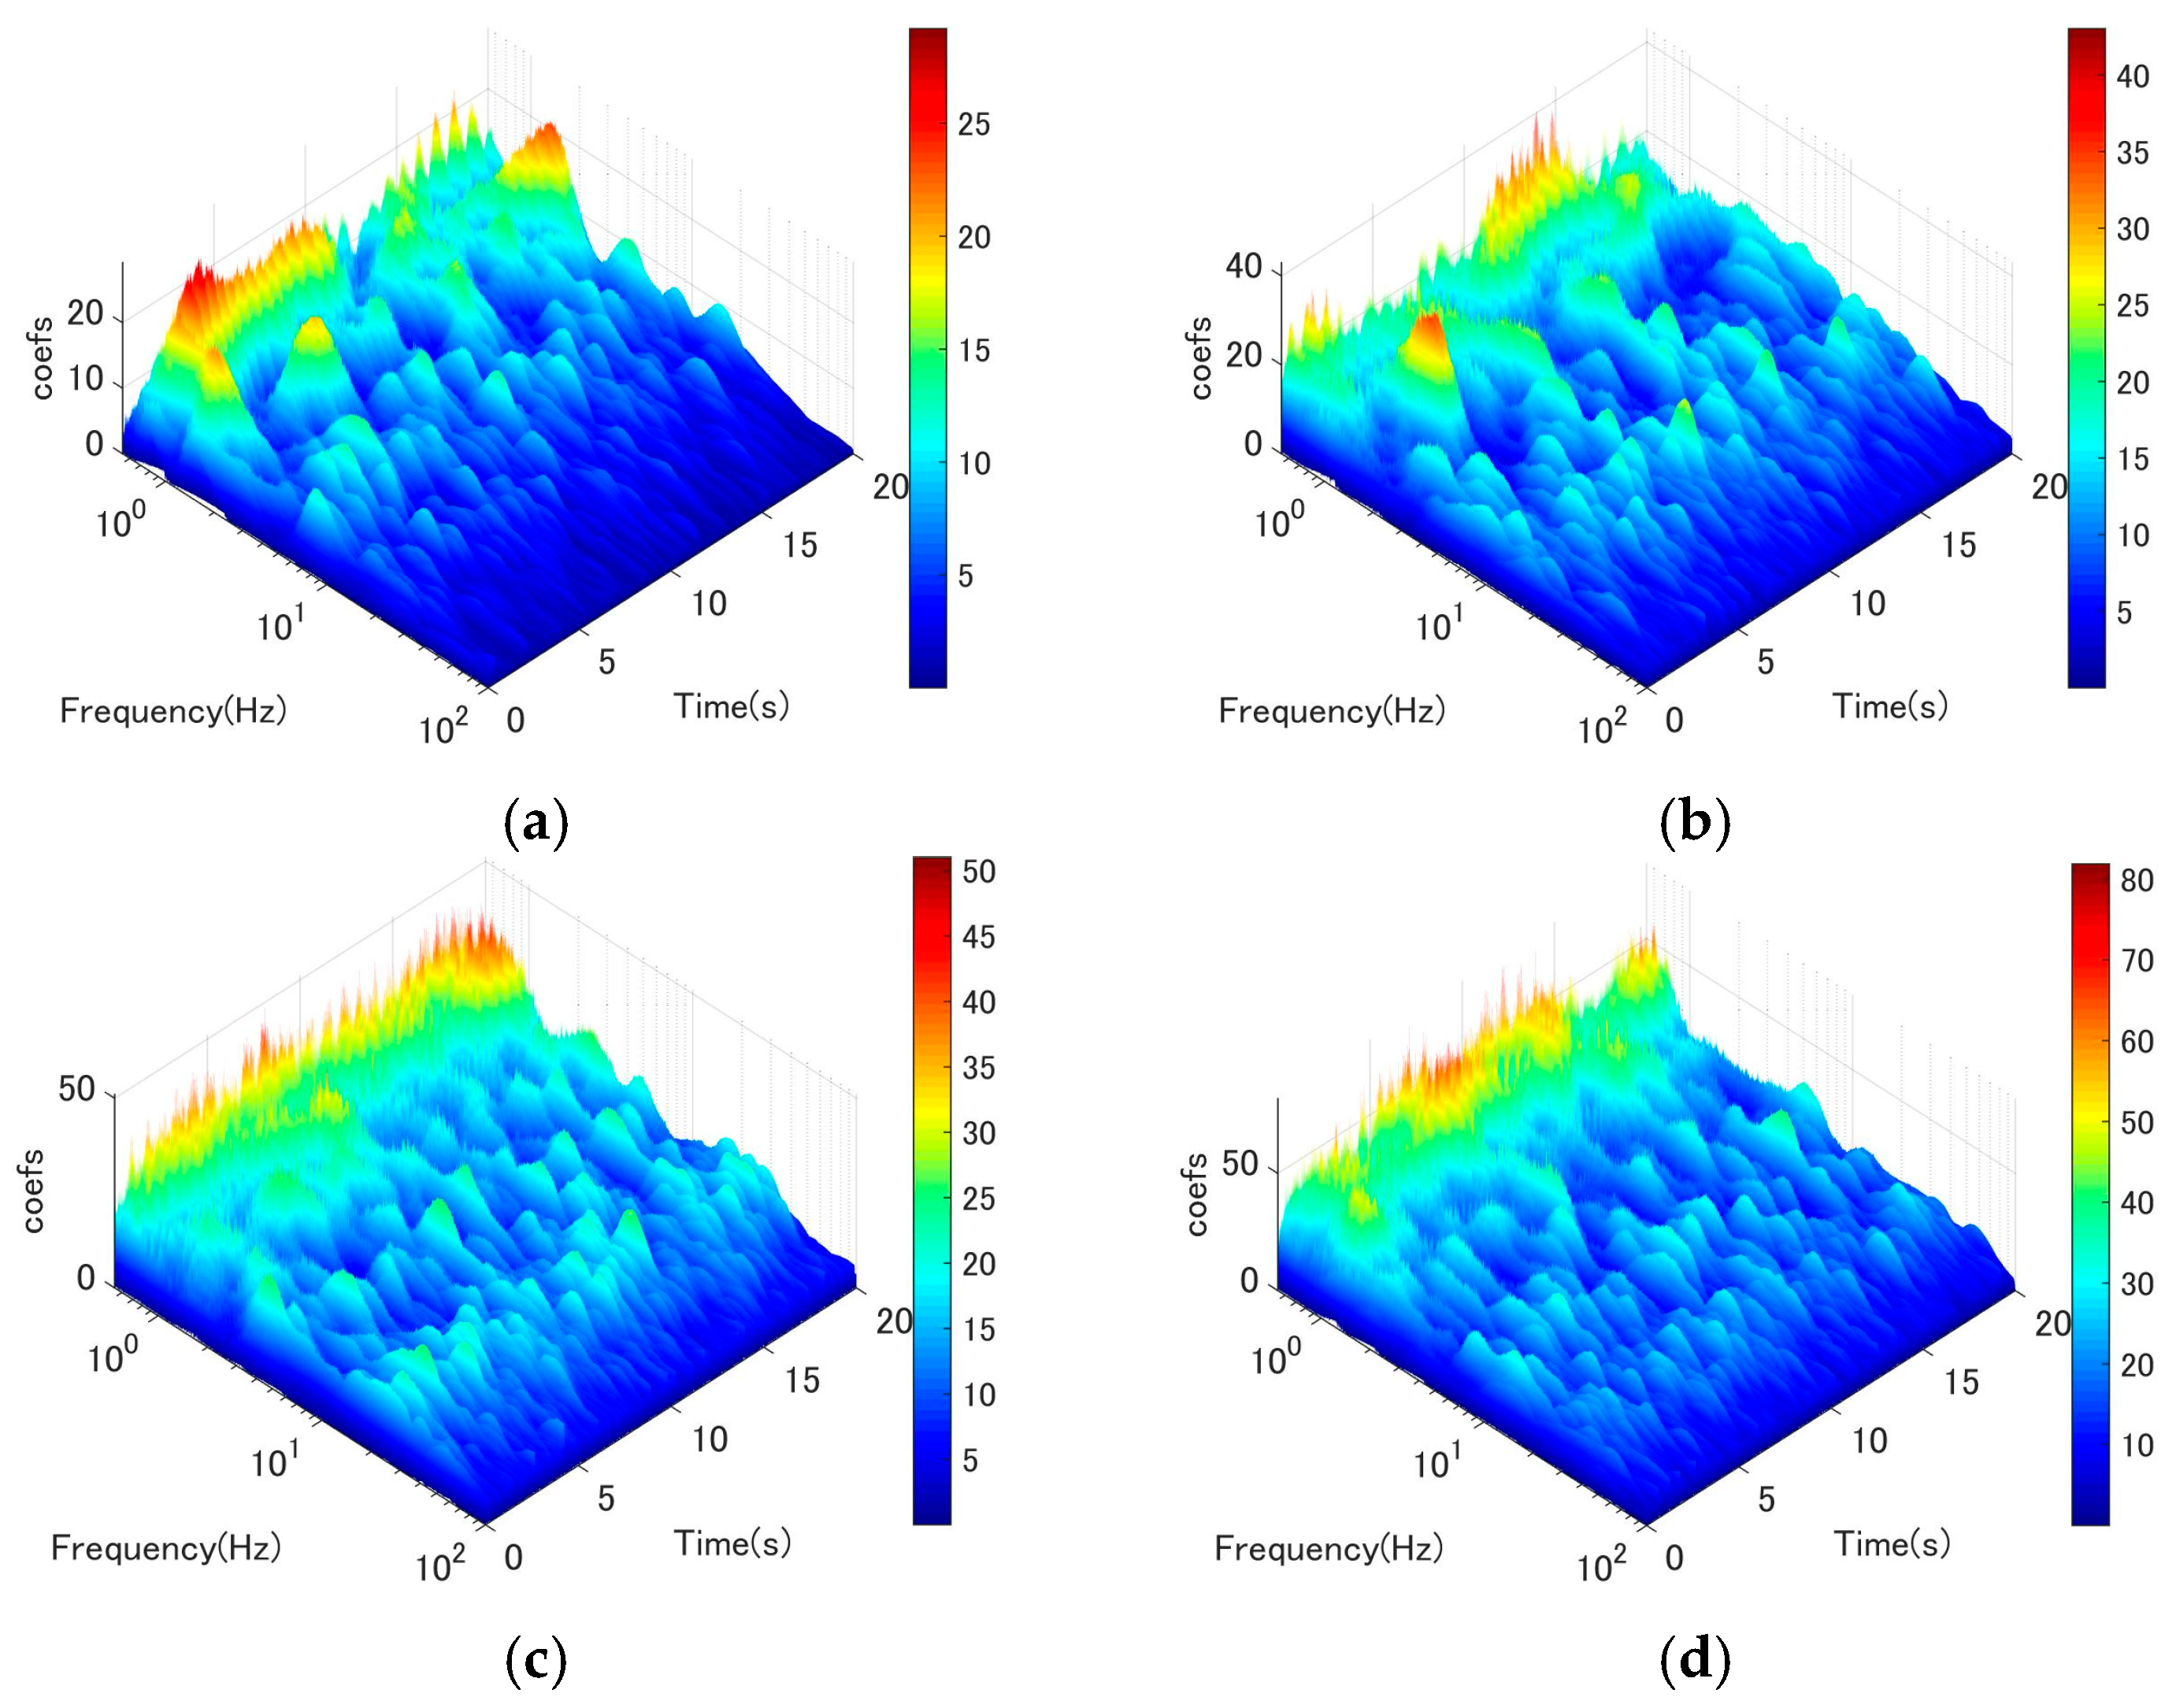
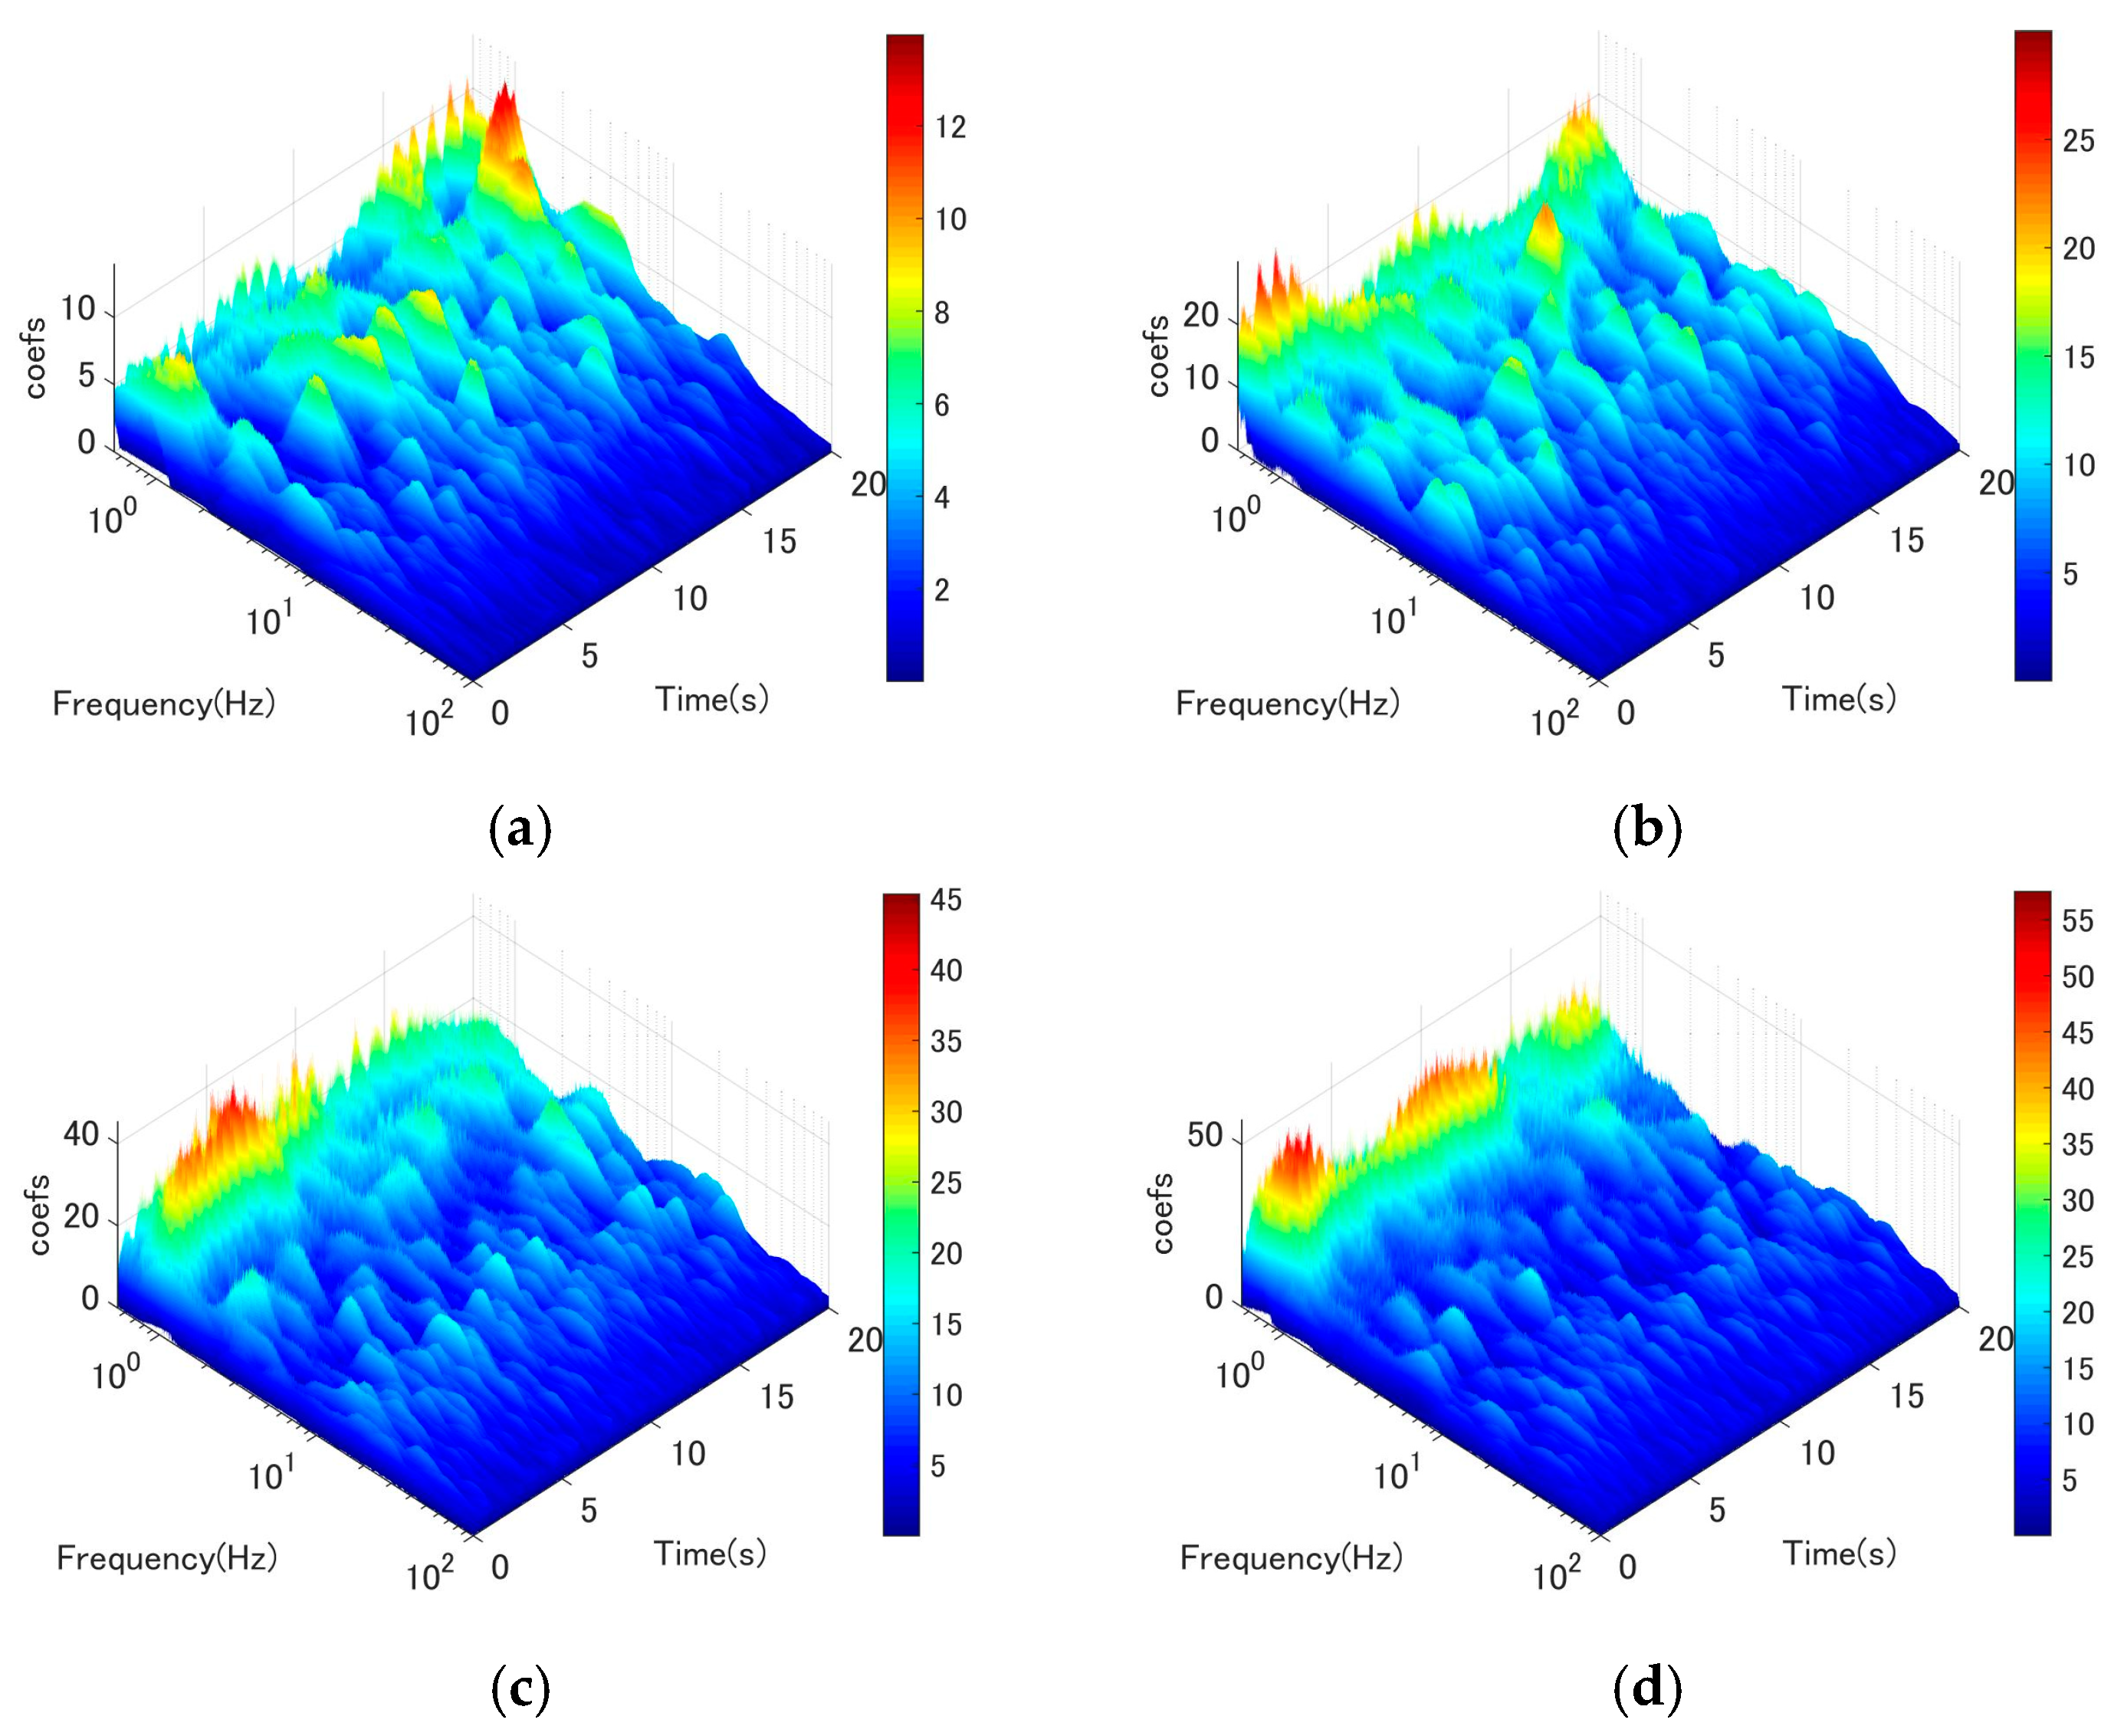
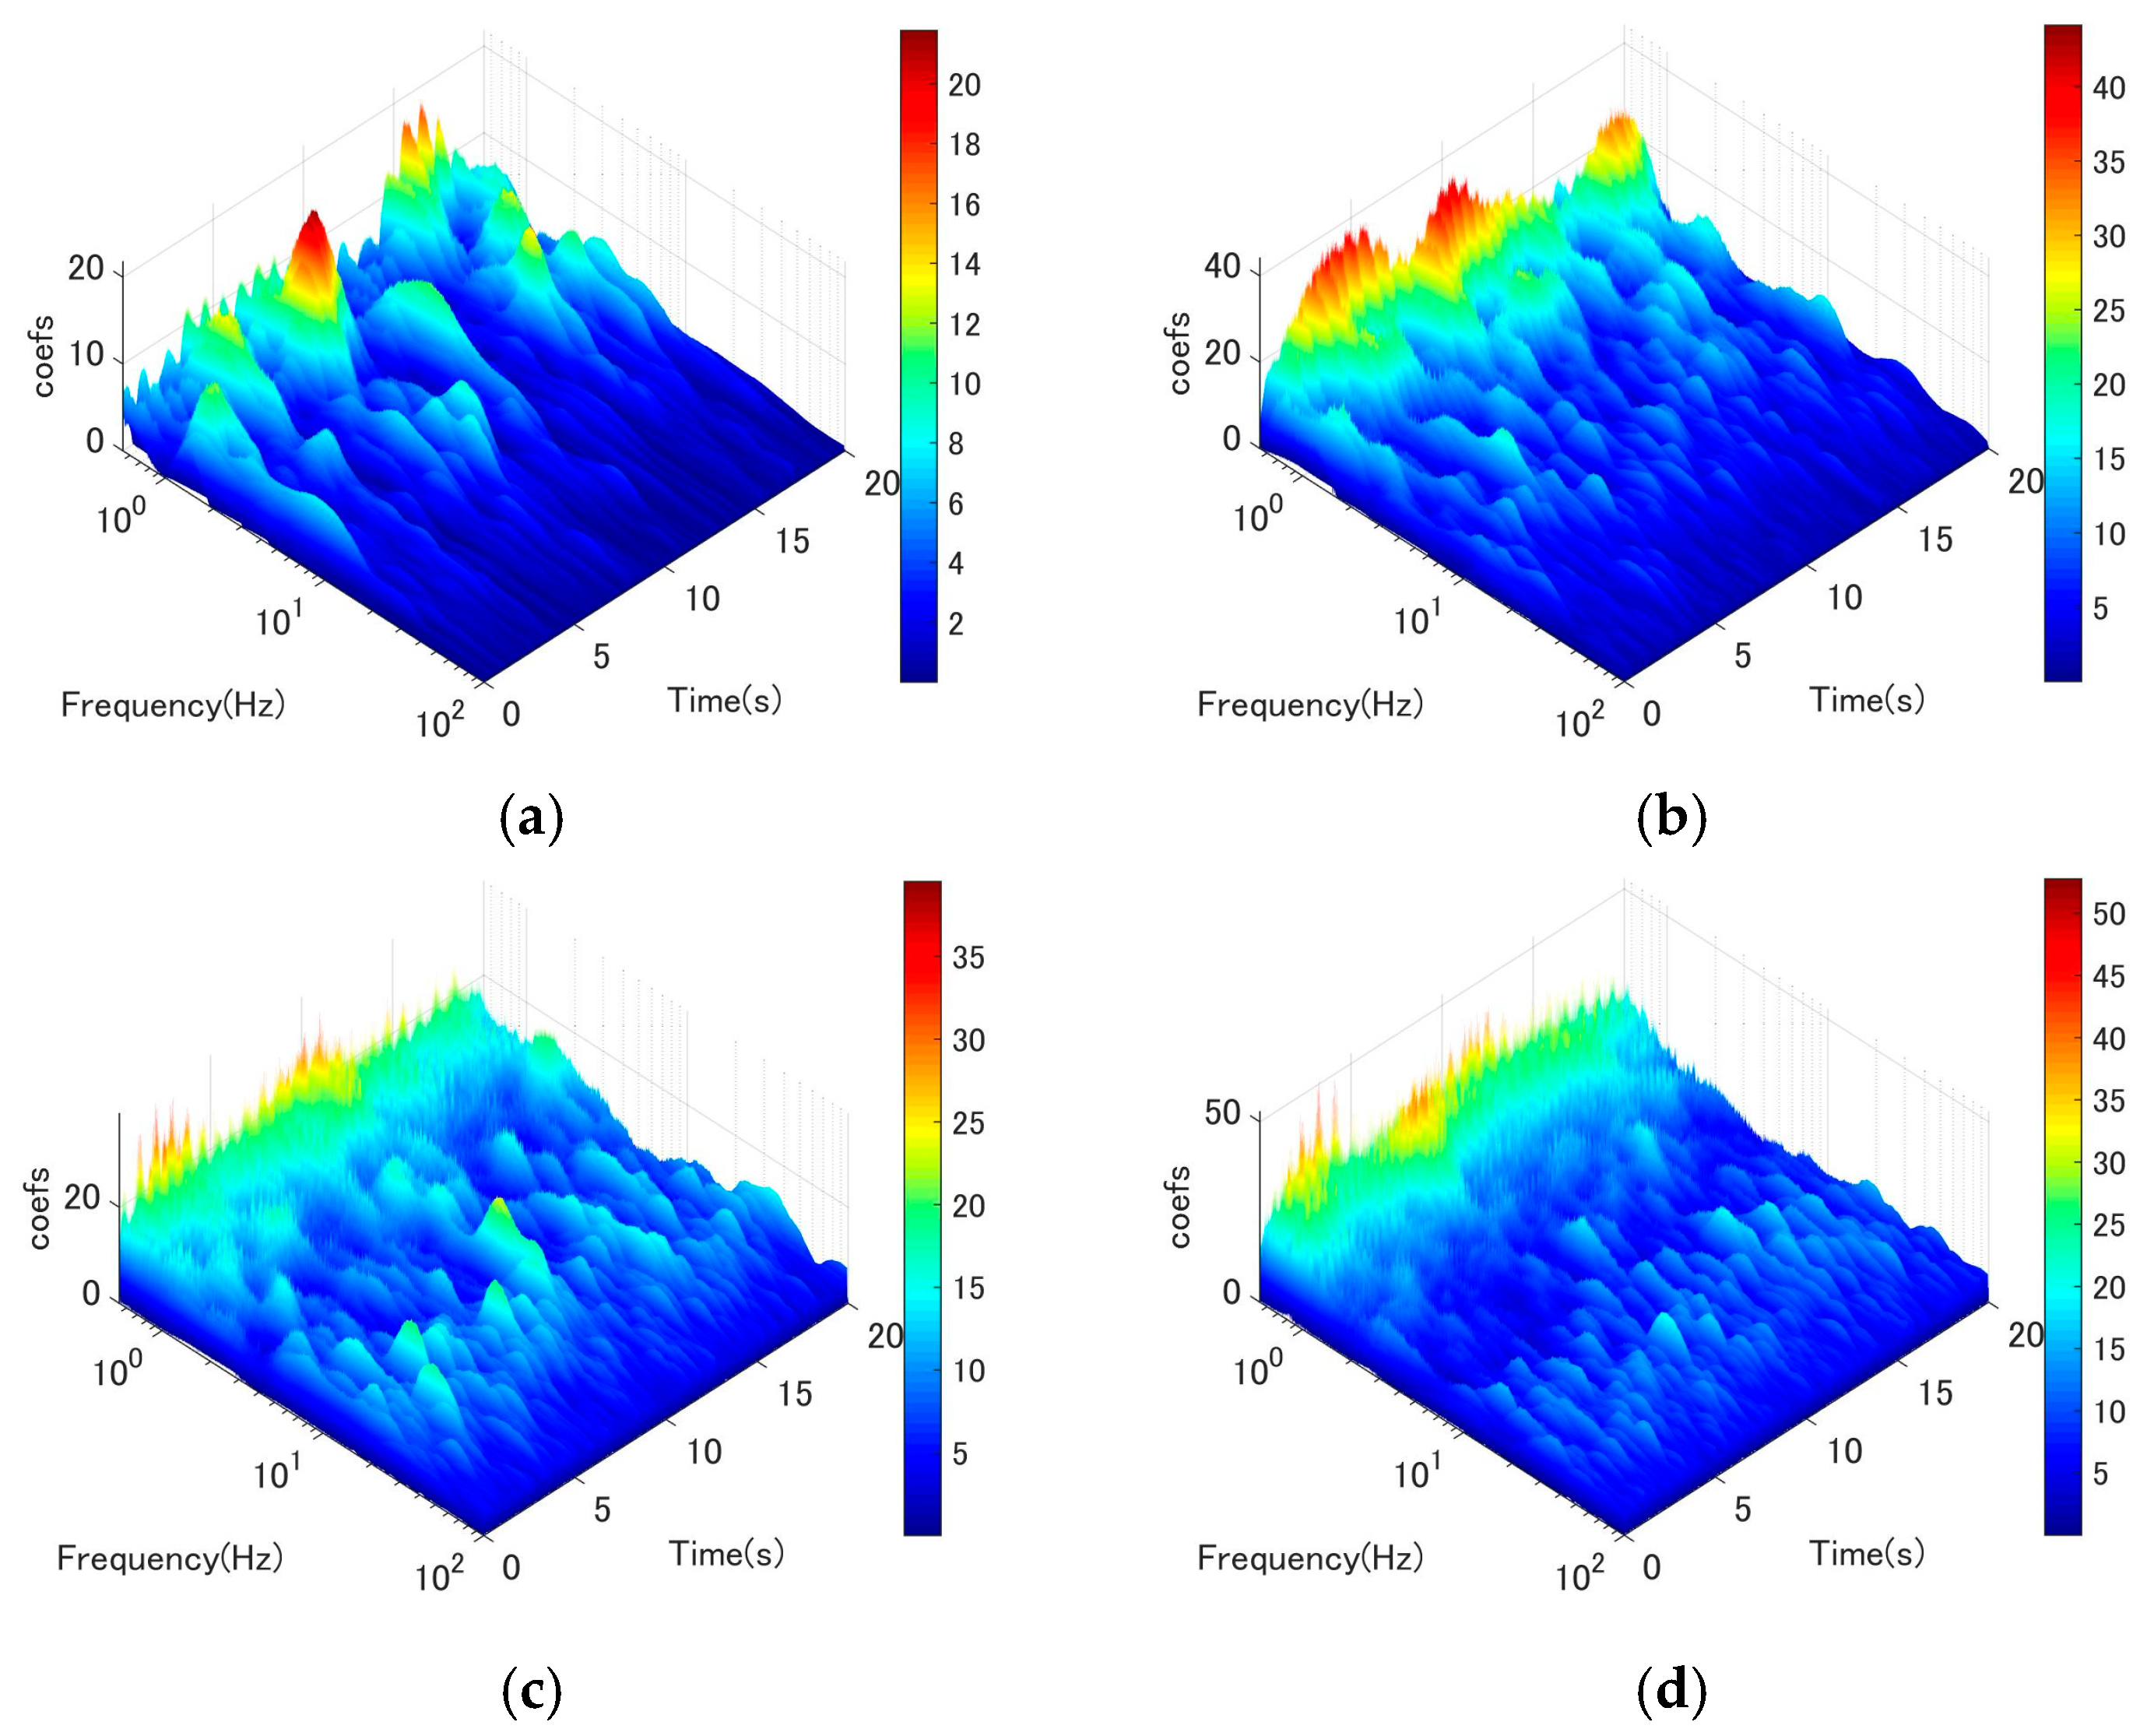
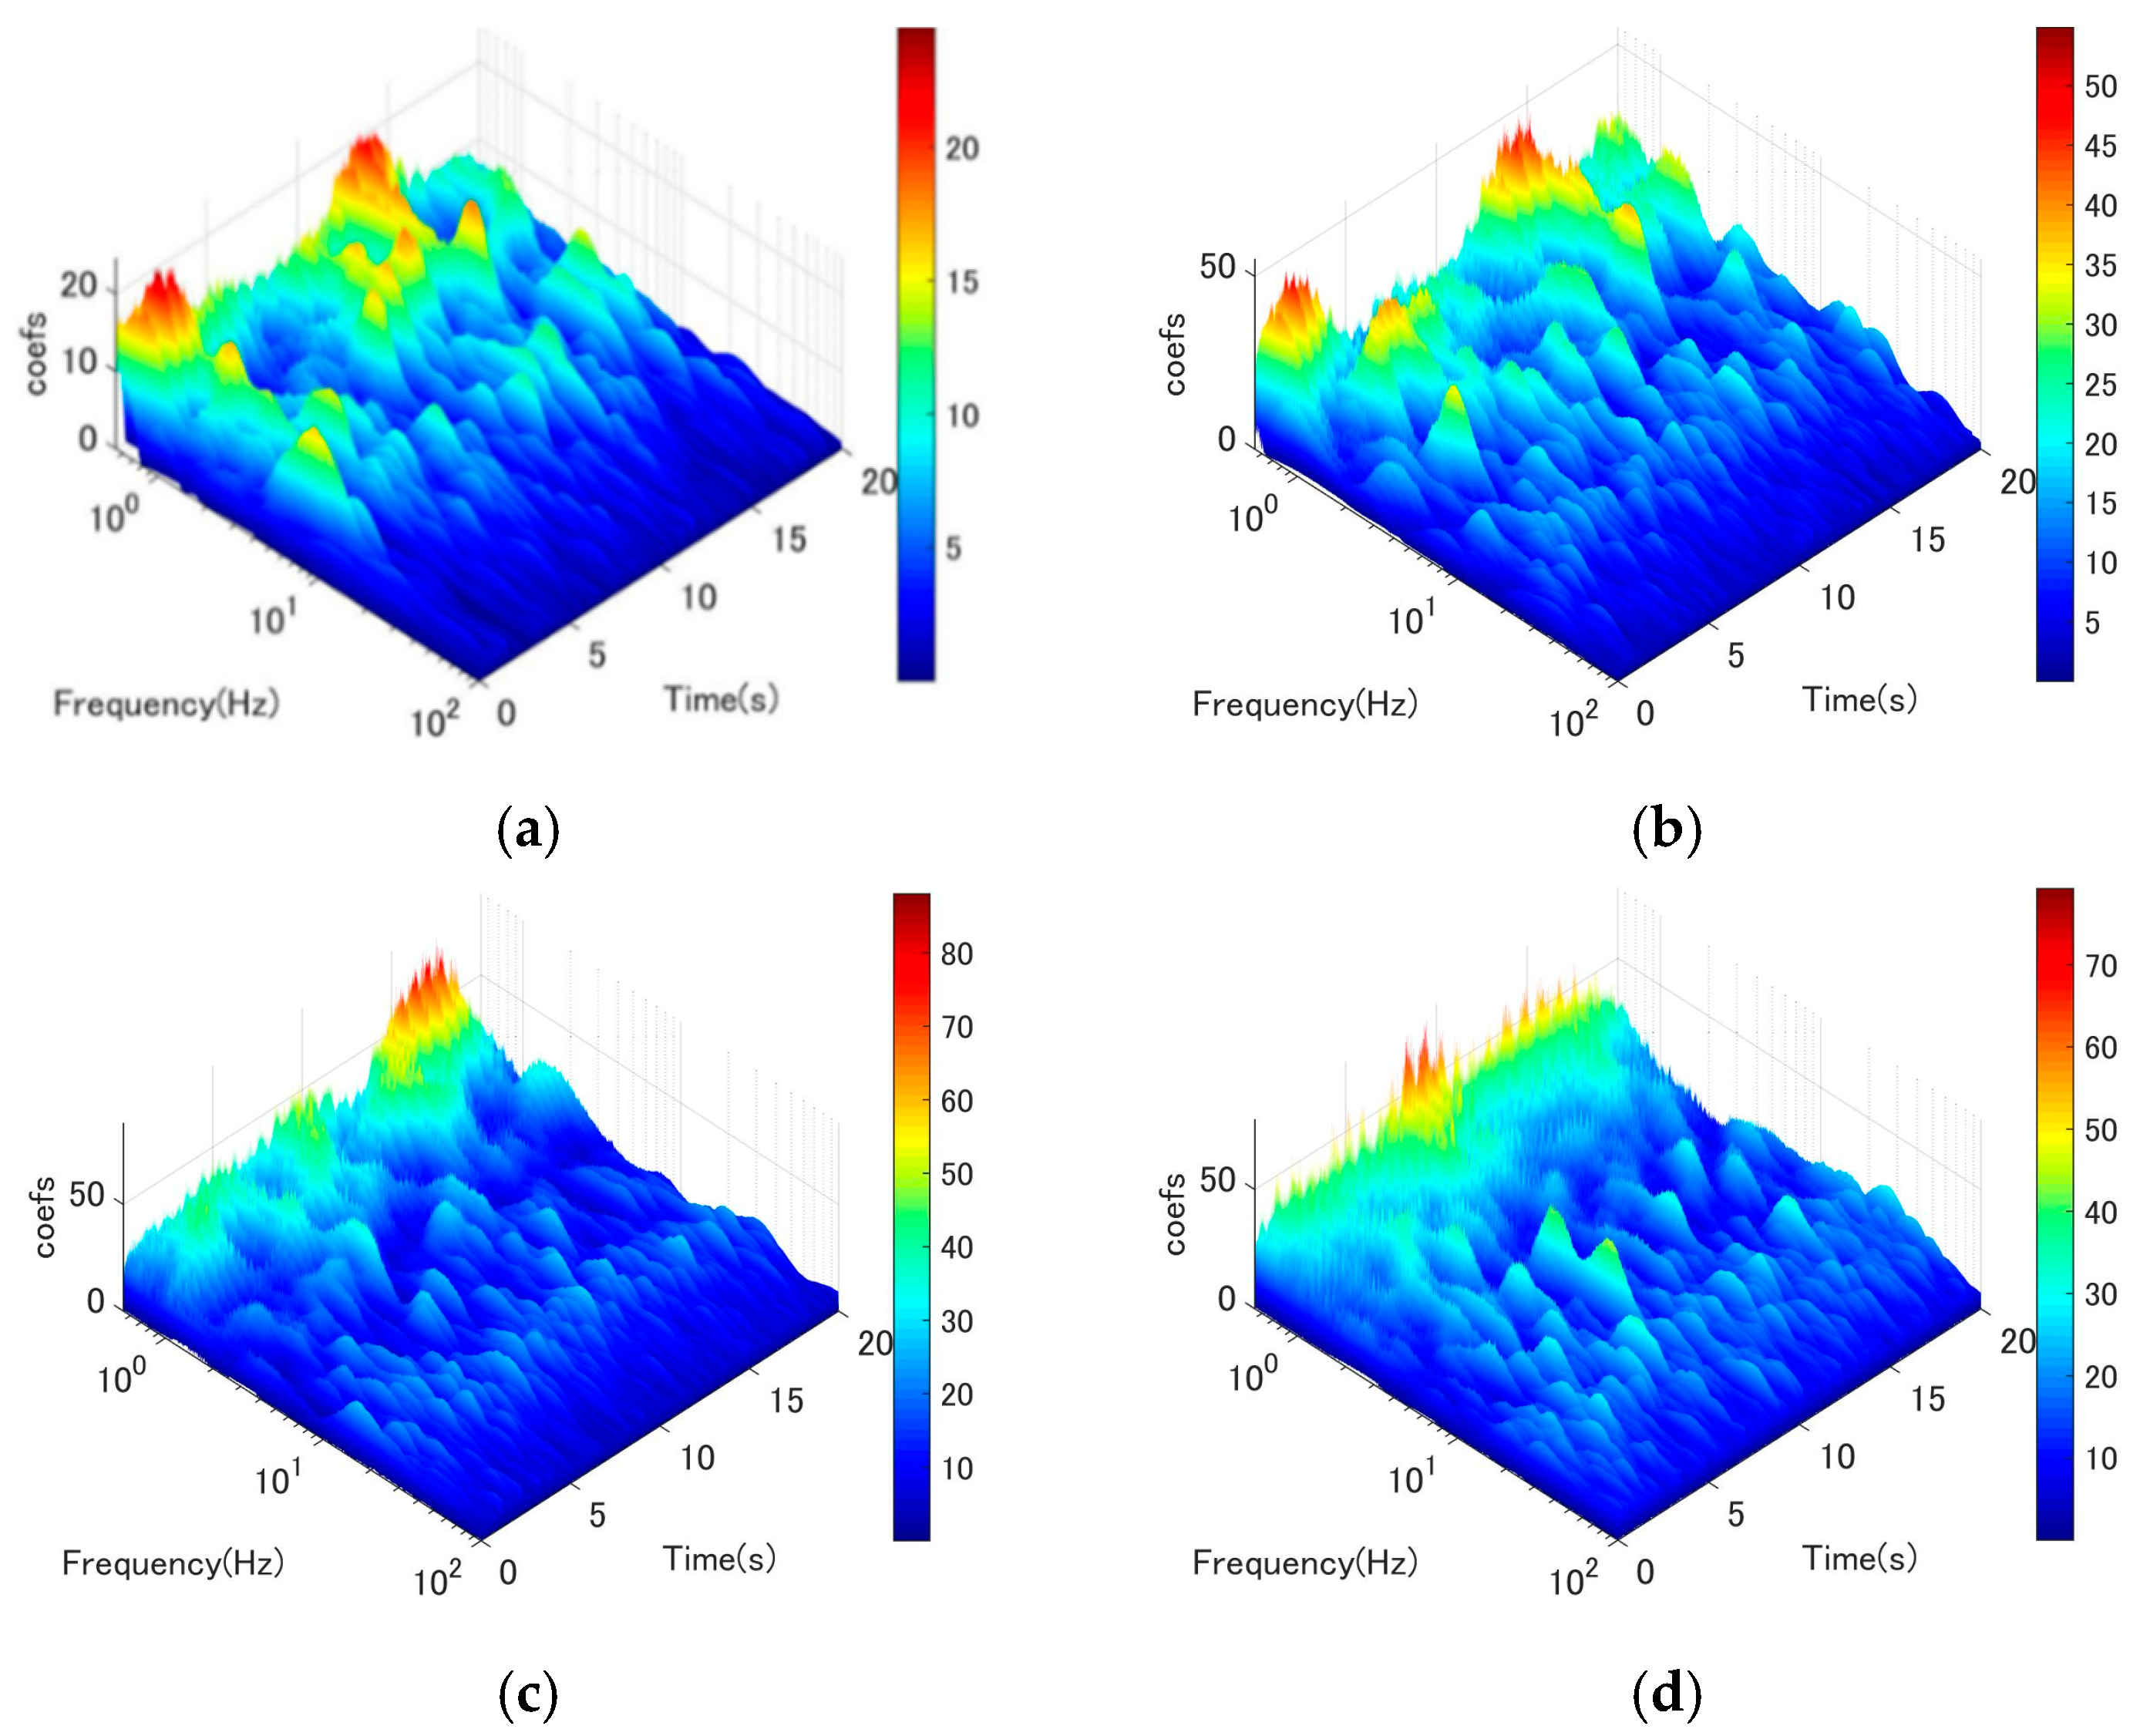
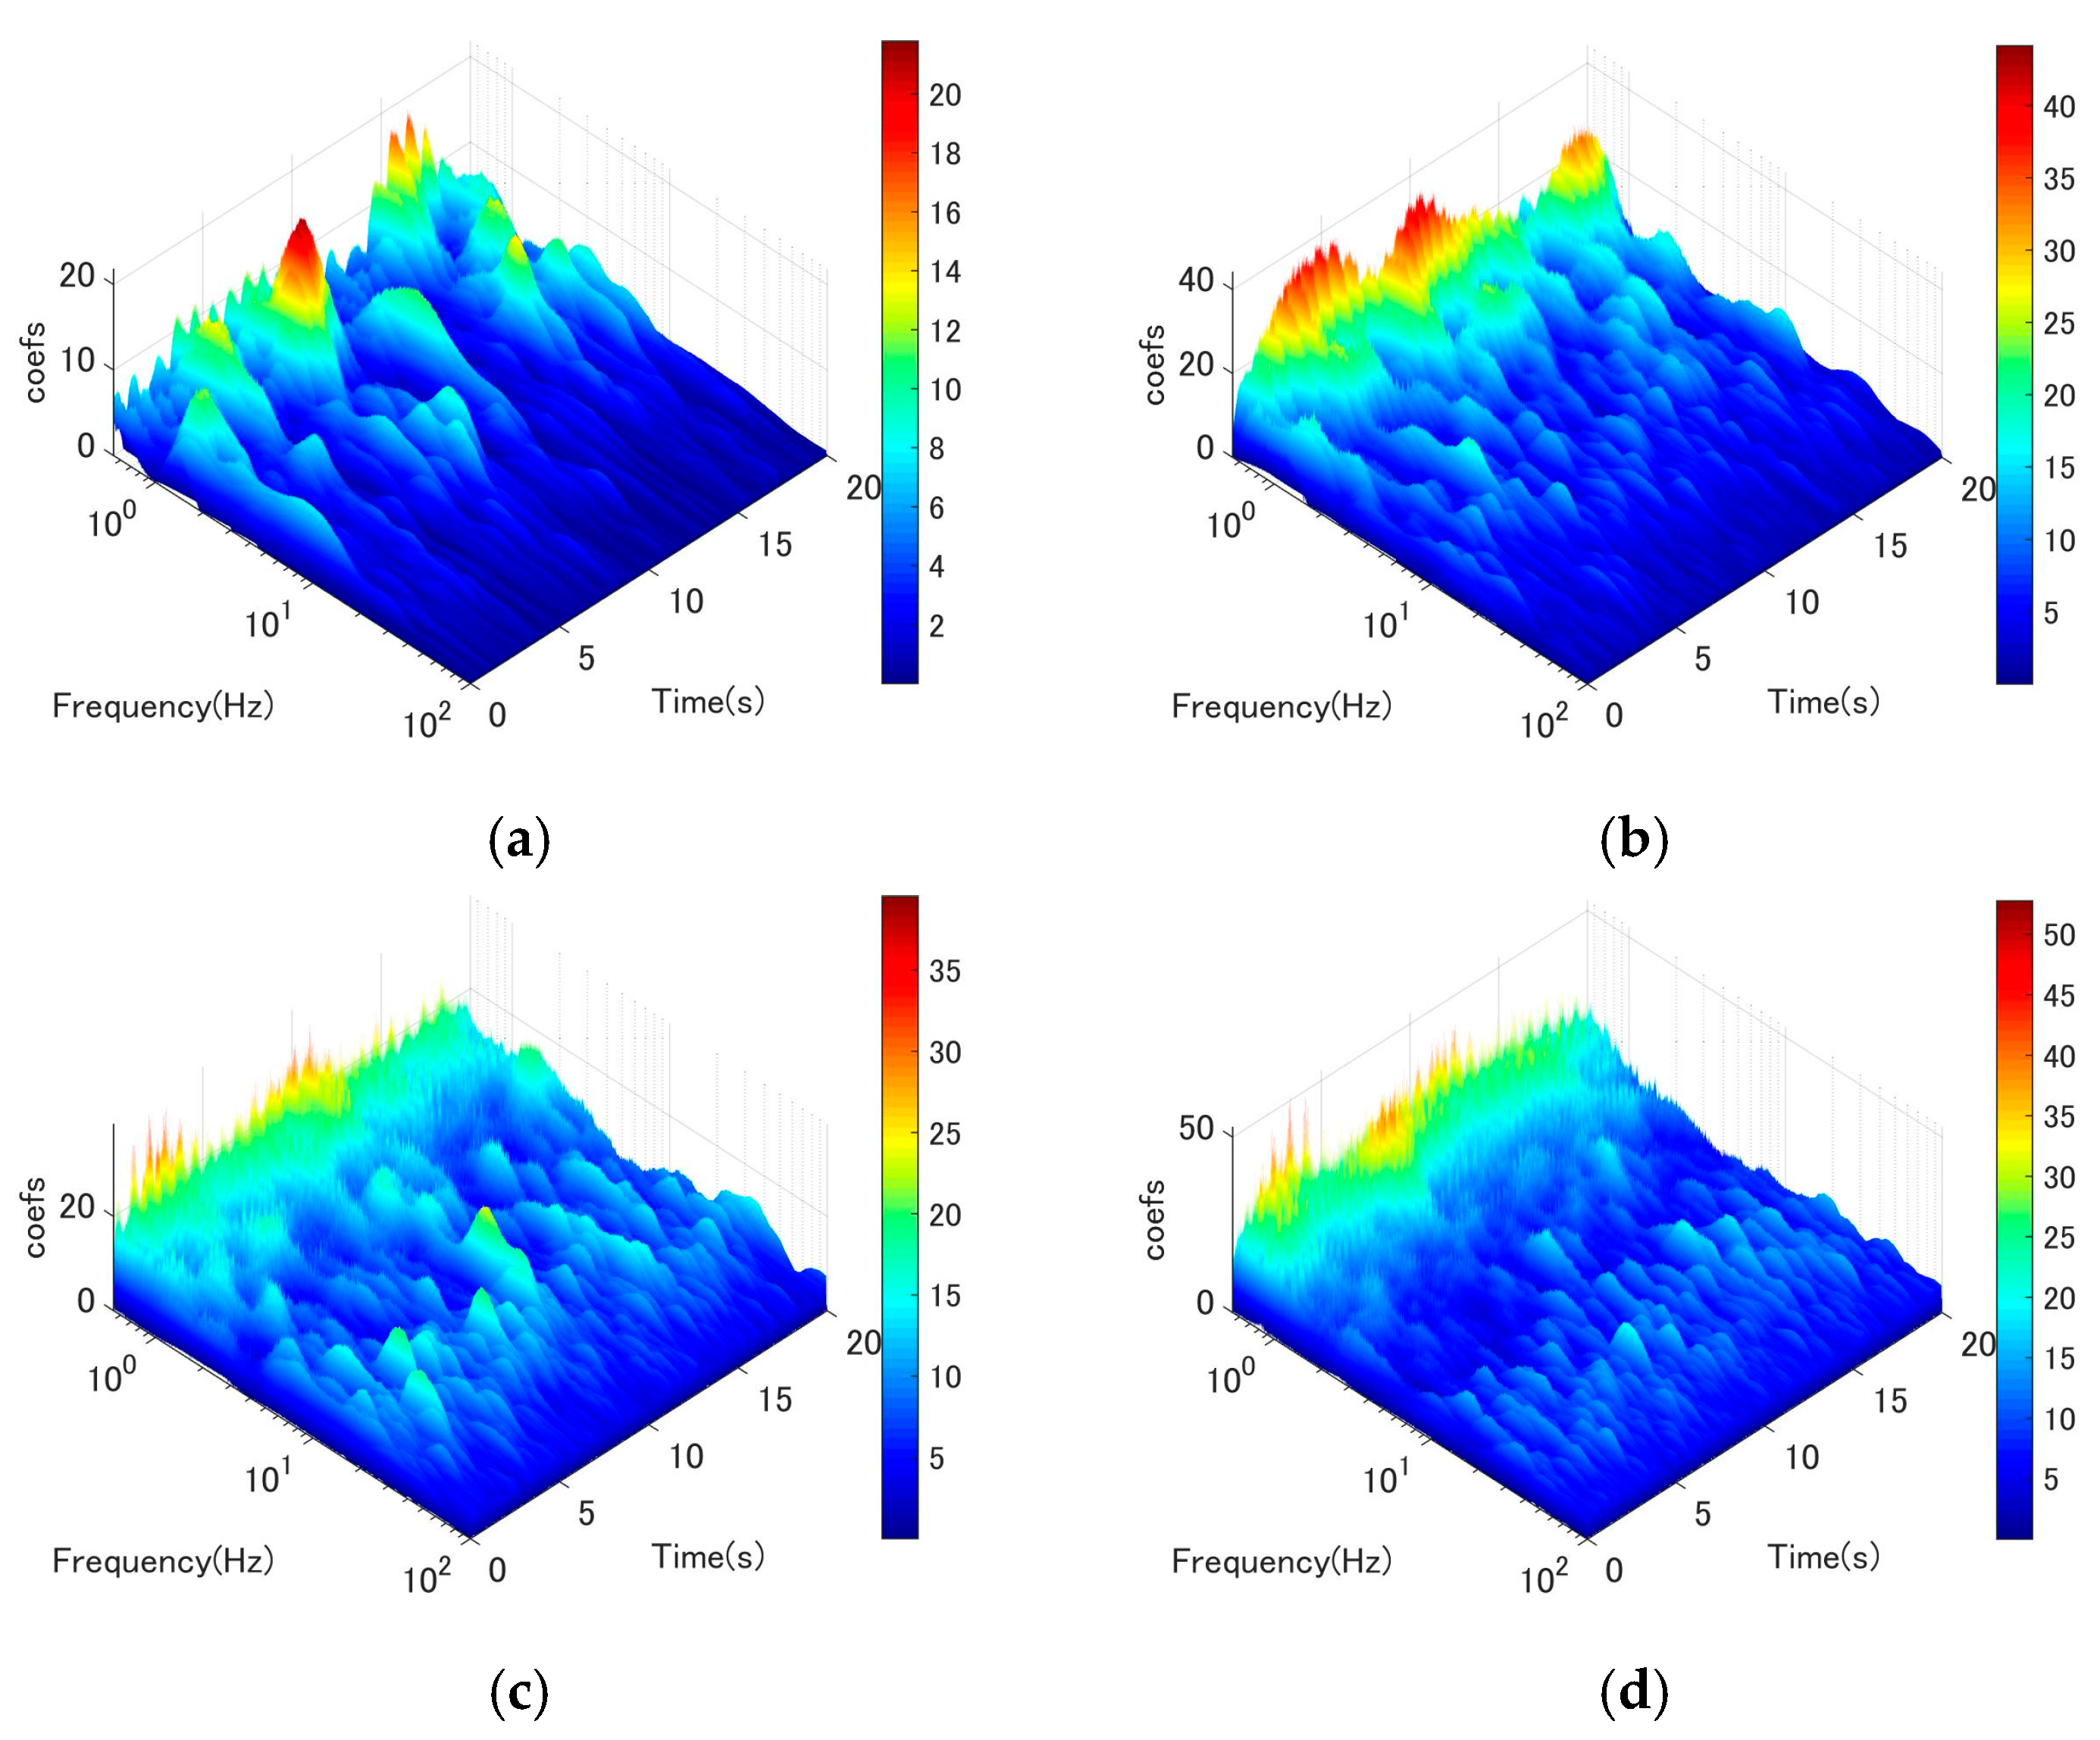
3.2.1. Wavelet Analysis on the Vertical-Wind Fluctuation Component (W-Component)

The study employed the Morlet wavelet function as the primary basis for conducting wavelet analysis to investigate the temporal variations of wind velocity and the corresponding excitation mechanism. The wavelet analysis of fluctuating vertical-wind velocity near the discharge along the cable orientation is illustrated in Figure 5, Figure 6, Figure 7, Figure 8, Figure 9 and Figure 10. The wind tunnel maintains a constant mean wind speed of 5, 10, 15, and 20 m/s. The wavelet analysis of fluctuating wind velocity in the vertical direction near the cable discharge for cases 45 degree–25 degree is illustrated in Figure 5, where the wind speed ranges from 5 m/s to 20 m/s. The graphical representation depicted in Figure 5a exhibits frequency peaks characterized by notably diminished periods.
In the present investigation (Figure 5a), the Karman vortex has a shedding frequency of around 5–7 Hz which corresponds to a Strouhal number (fD/U) is around 0.15–0.2. This finding is consistent with conventional Karman vortex-induced vibration [22]. However, according to observation, the Karman vortex only showed a very small amplitude of vibration for the stay cable. At a wind speed of U = 10 m/s (as depicted in Figure 5b), it appears that the Karman vortex underwent a reduction while low-frequency vortices began to shed.
Figure 5c, d show that this type of pattern is also more apparent. When wind speed increased to 15 to 20 m/s, Karman vortex scattering disappeared, and low-frequency vortices became dominant at the same time. In addition, the dominant vortex corresponds to a reduced wind speed (U/fD) around 110, which was likely driven by the wind-induced circular cylinder vibration phenomenon identified in earlier investigations [1,4]. This result is consistent with the large amplitude range illustrated in Figure 3. In addition, this trend was also observed in the discharge location from 3D to 7D (Figure 6, Figure 7, Figure 8, Figure 9 and Figure 10). In brief, wake flow perturbation with extremely low-frequency vortices plays a crucial role in the mechanism that excites circular cylinder galloping. It is apparent that a significant quantity of low frequencies is present at high wind speeds. Furthermore, these low-frequency components exhibit high energy at high wind speeds. The phenomenon of circular cylinder vibration induced by wind can be succinctly described as follows: under low wind speeds, the dominant mechanism is the vibration induced by Karman vortex shedding. The Karman vortex is then eliminated as wind speed increases, and low-frequency vortices with high energy manifest. These low-frequency vortices continue to dissipate at higher wind speeds; the circular cylinder will be stimulated.

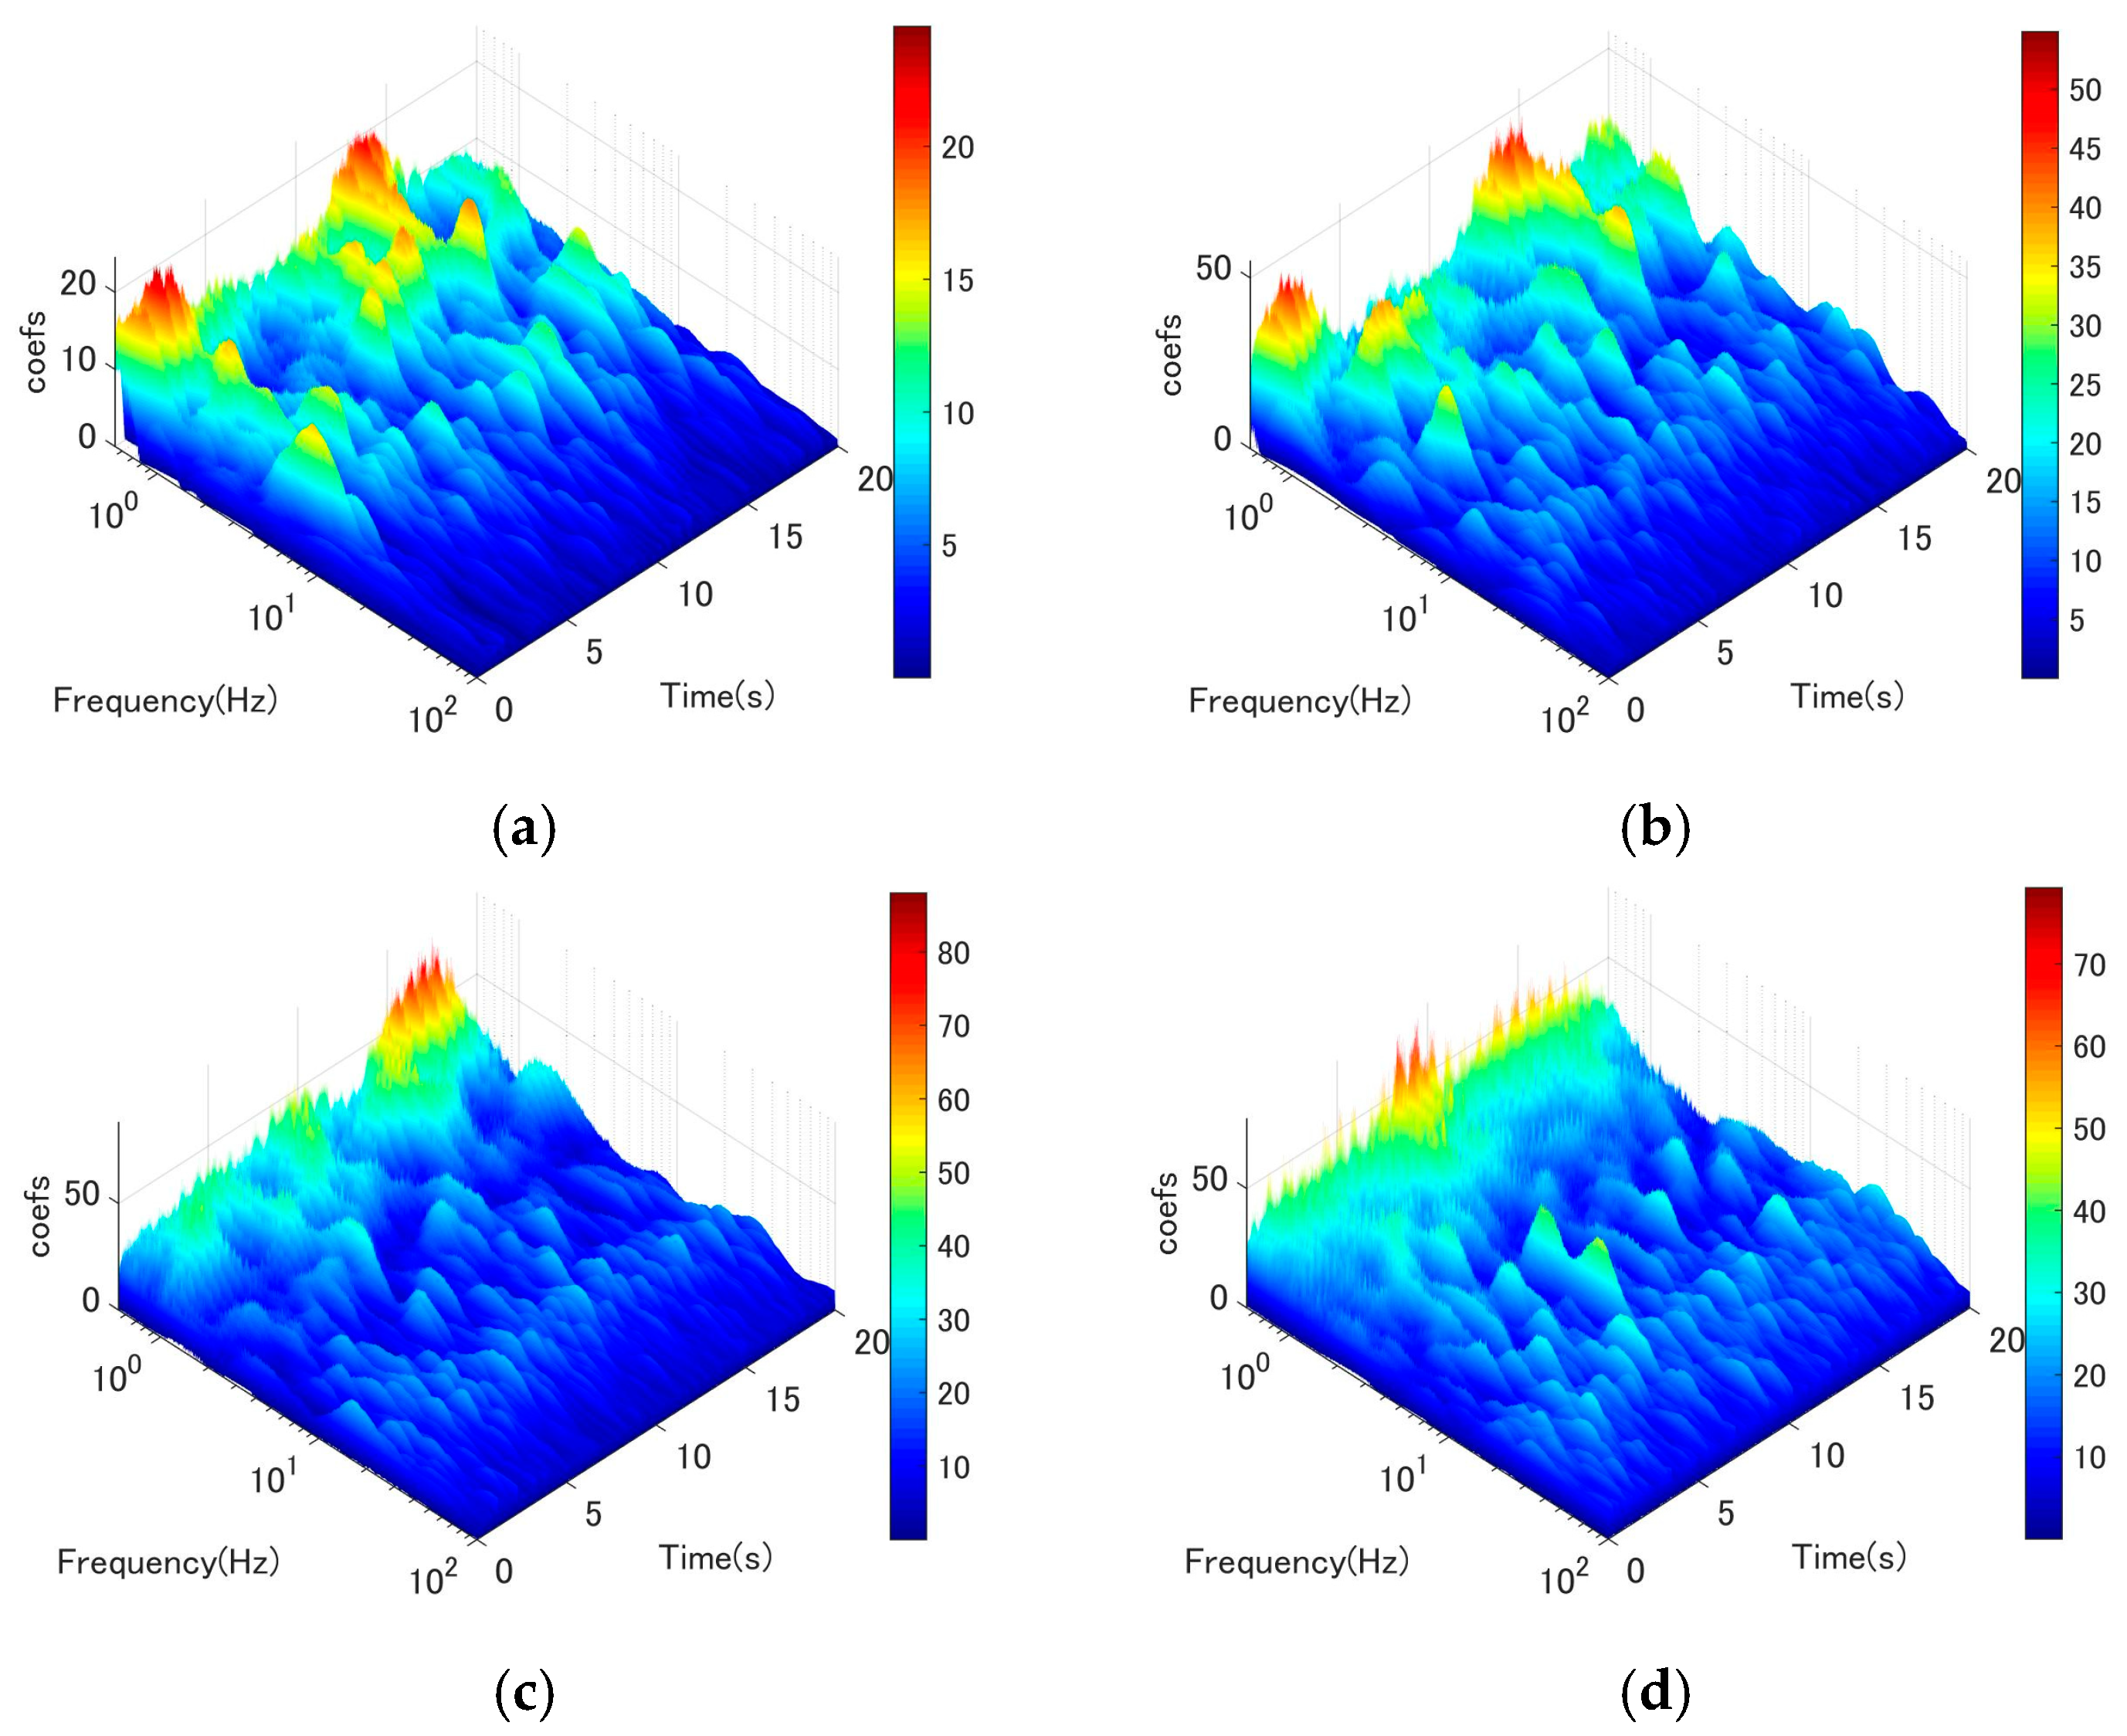
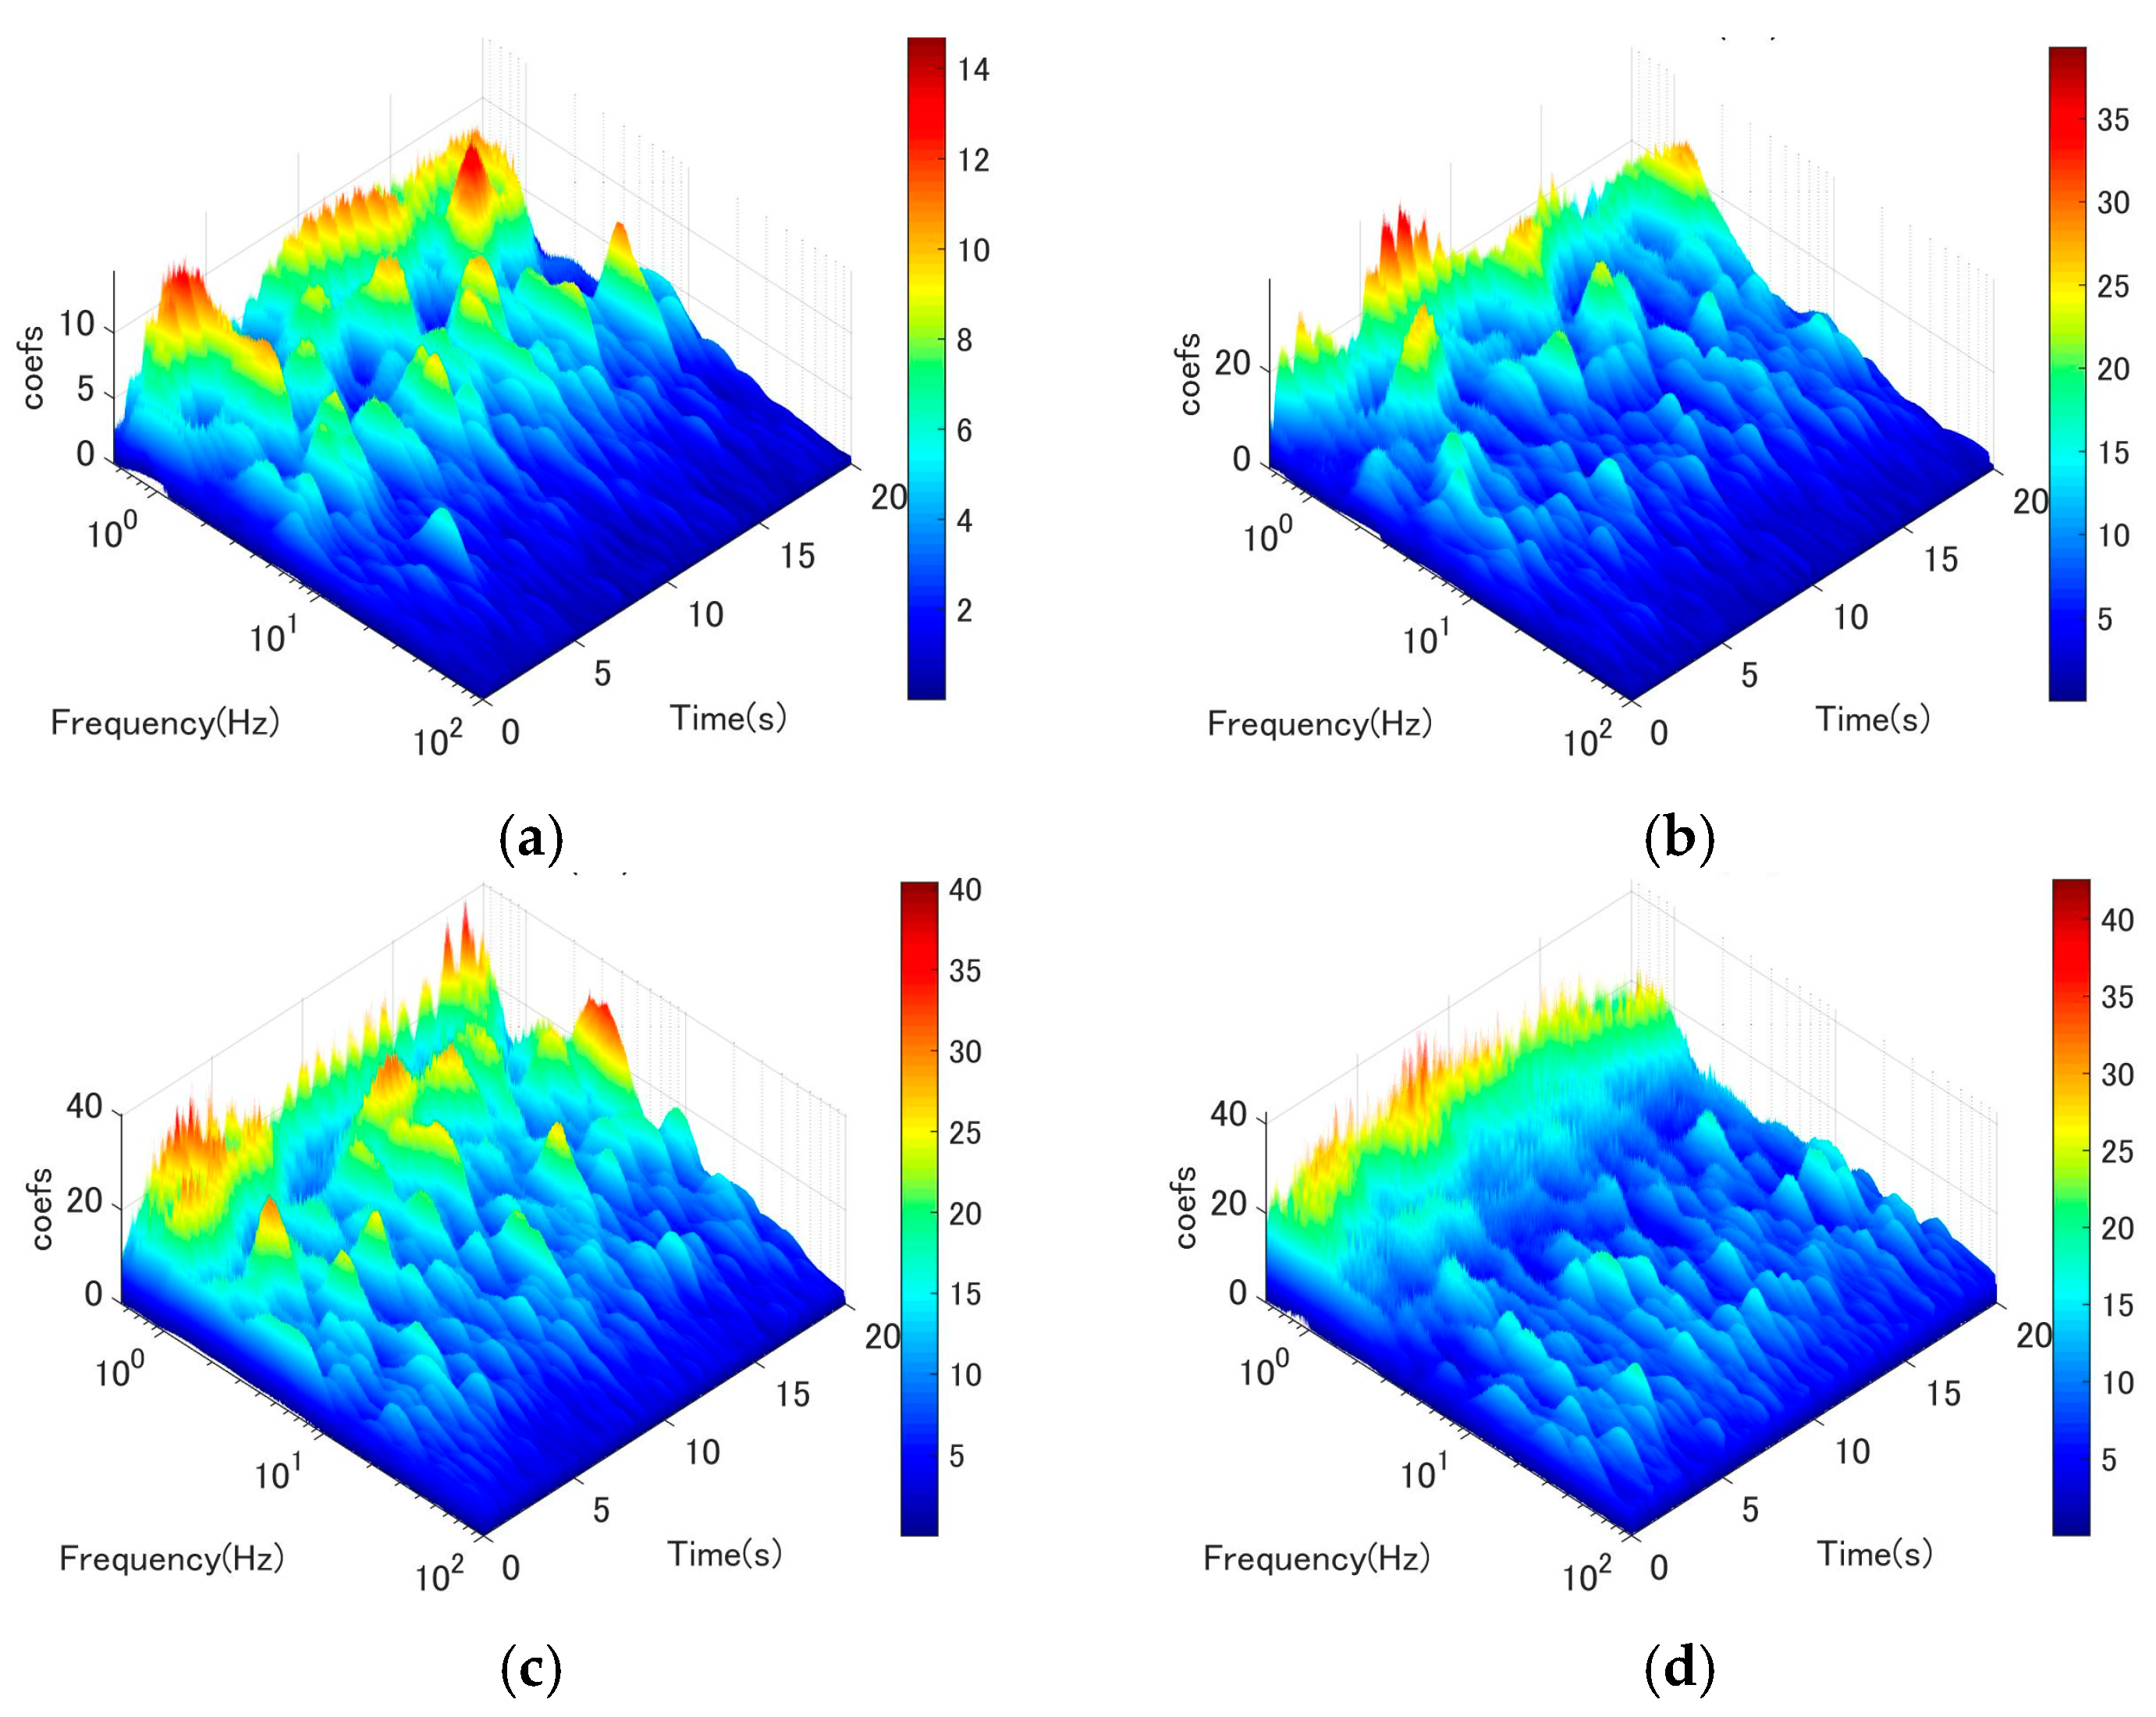
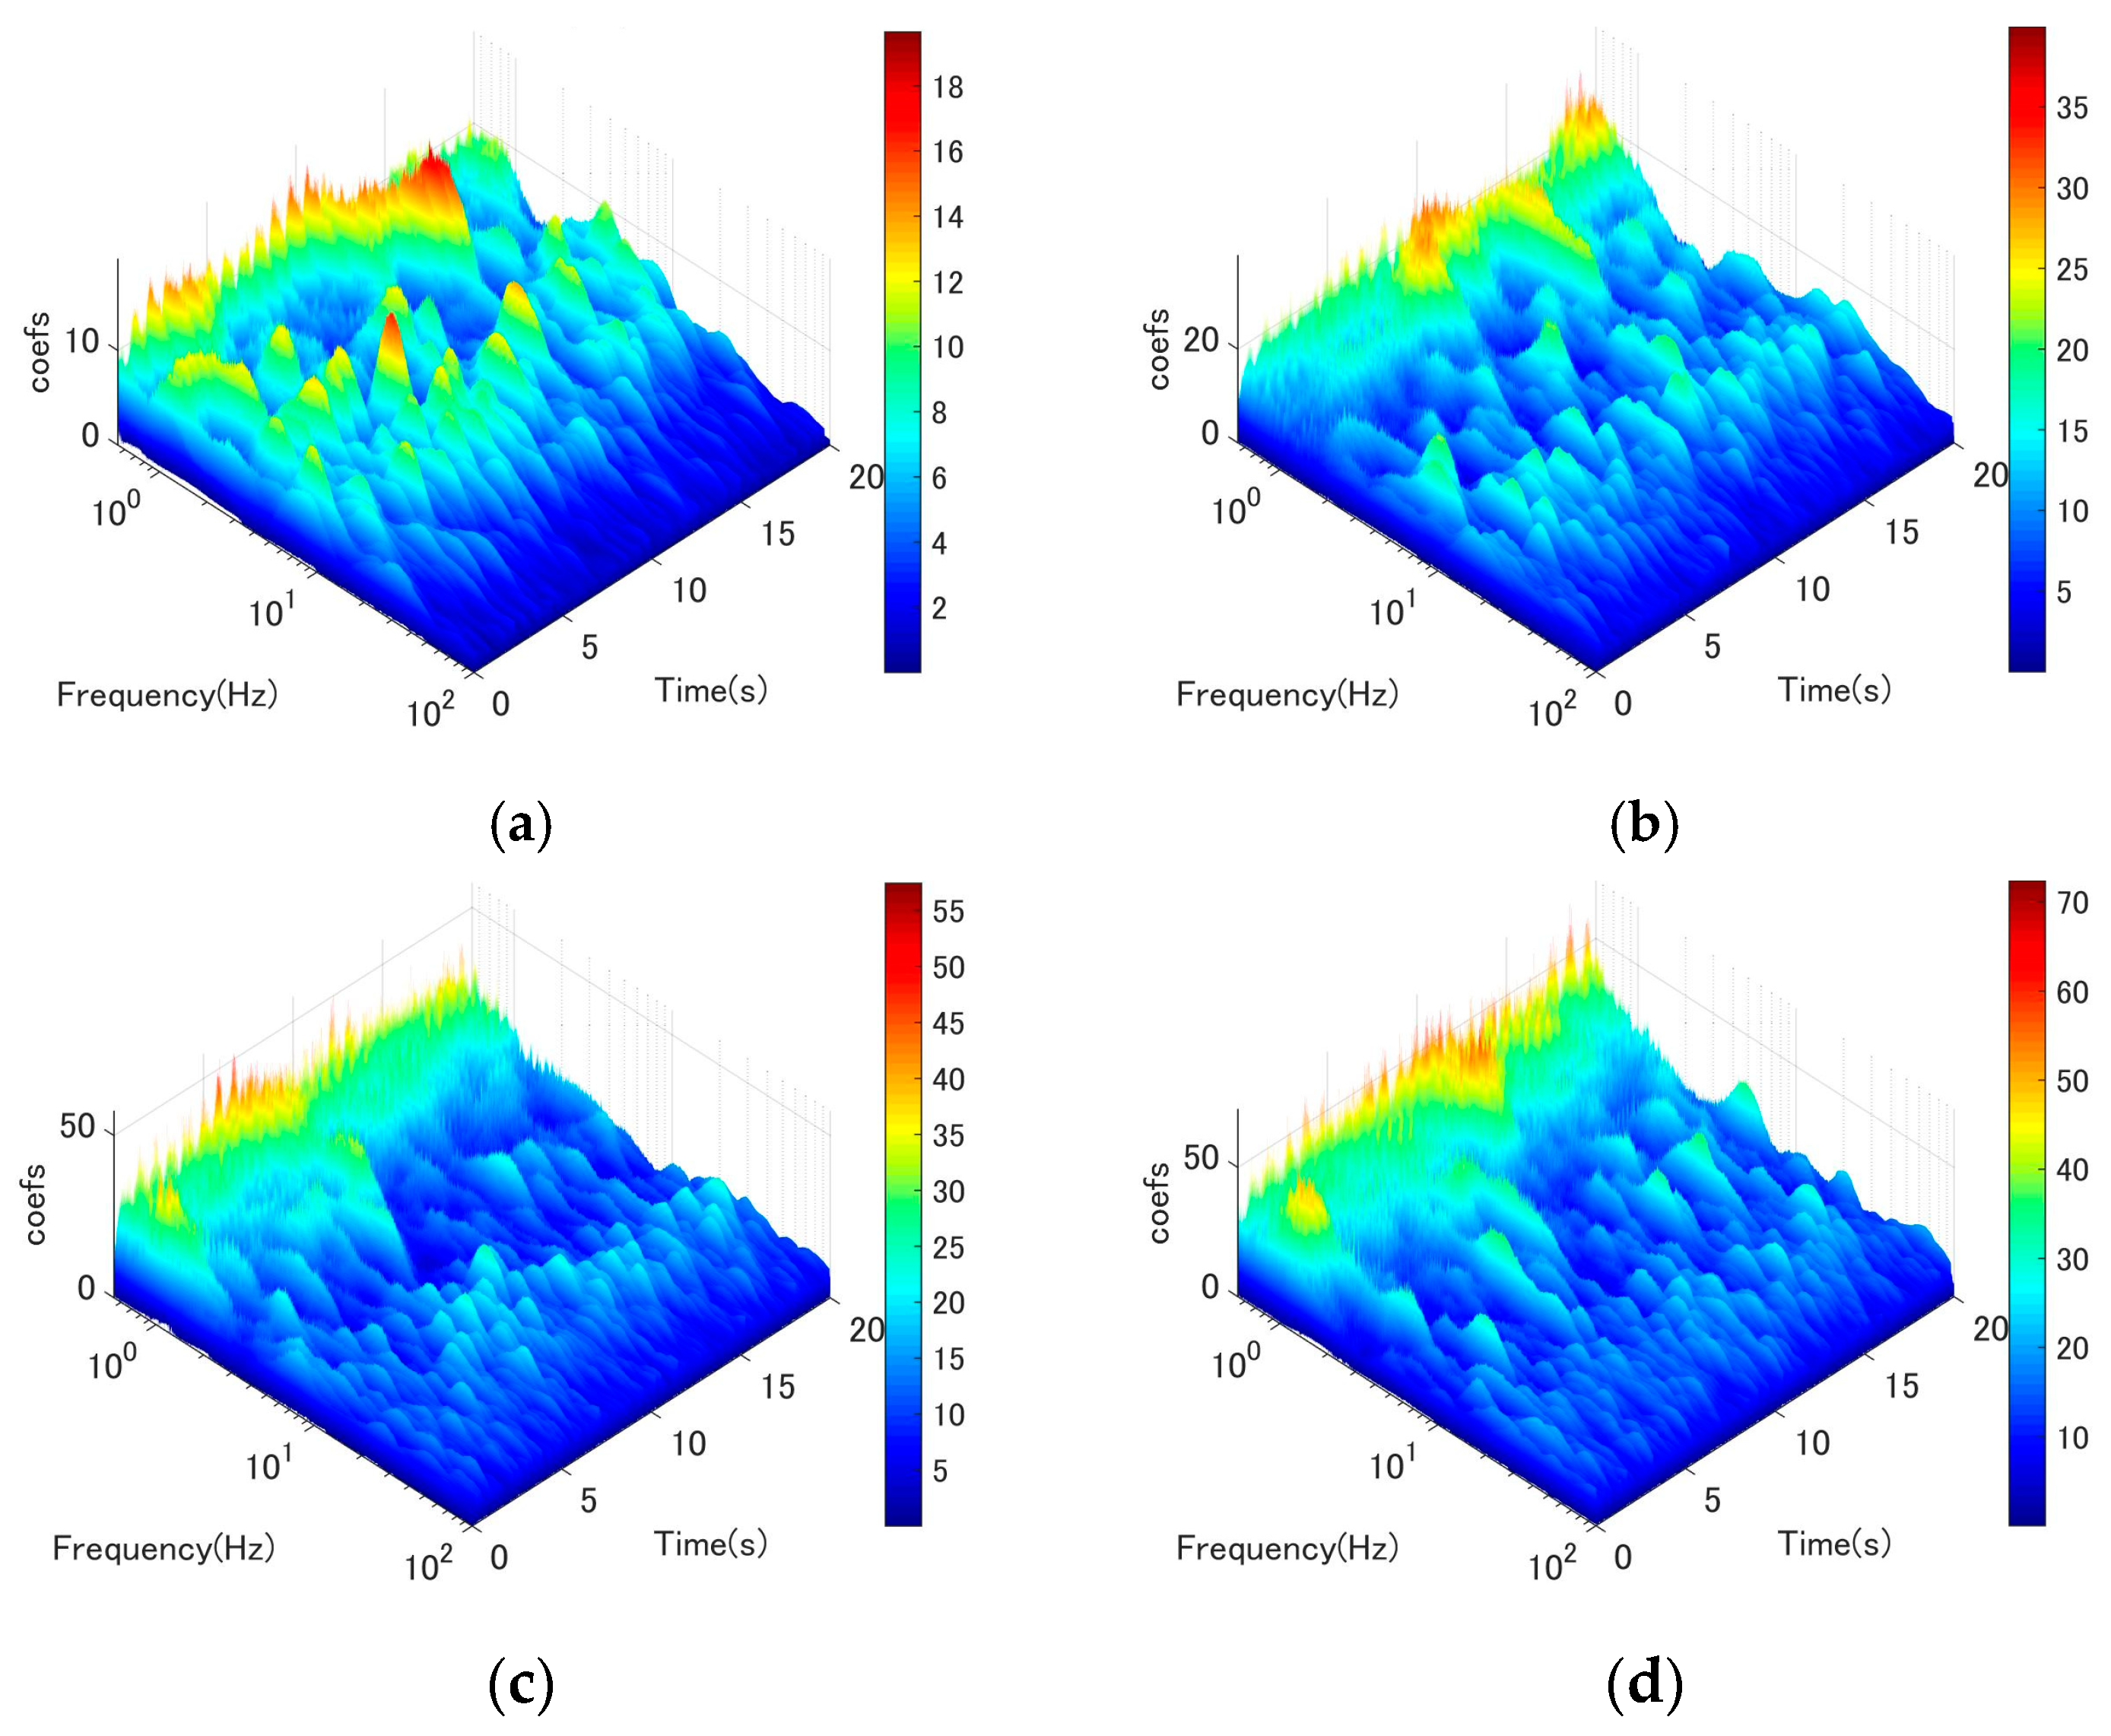
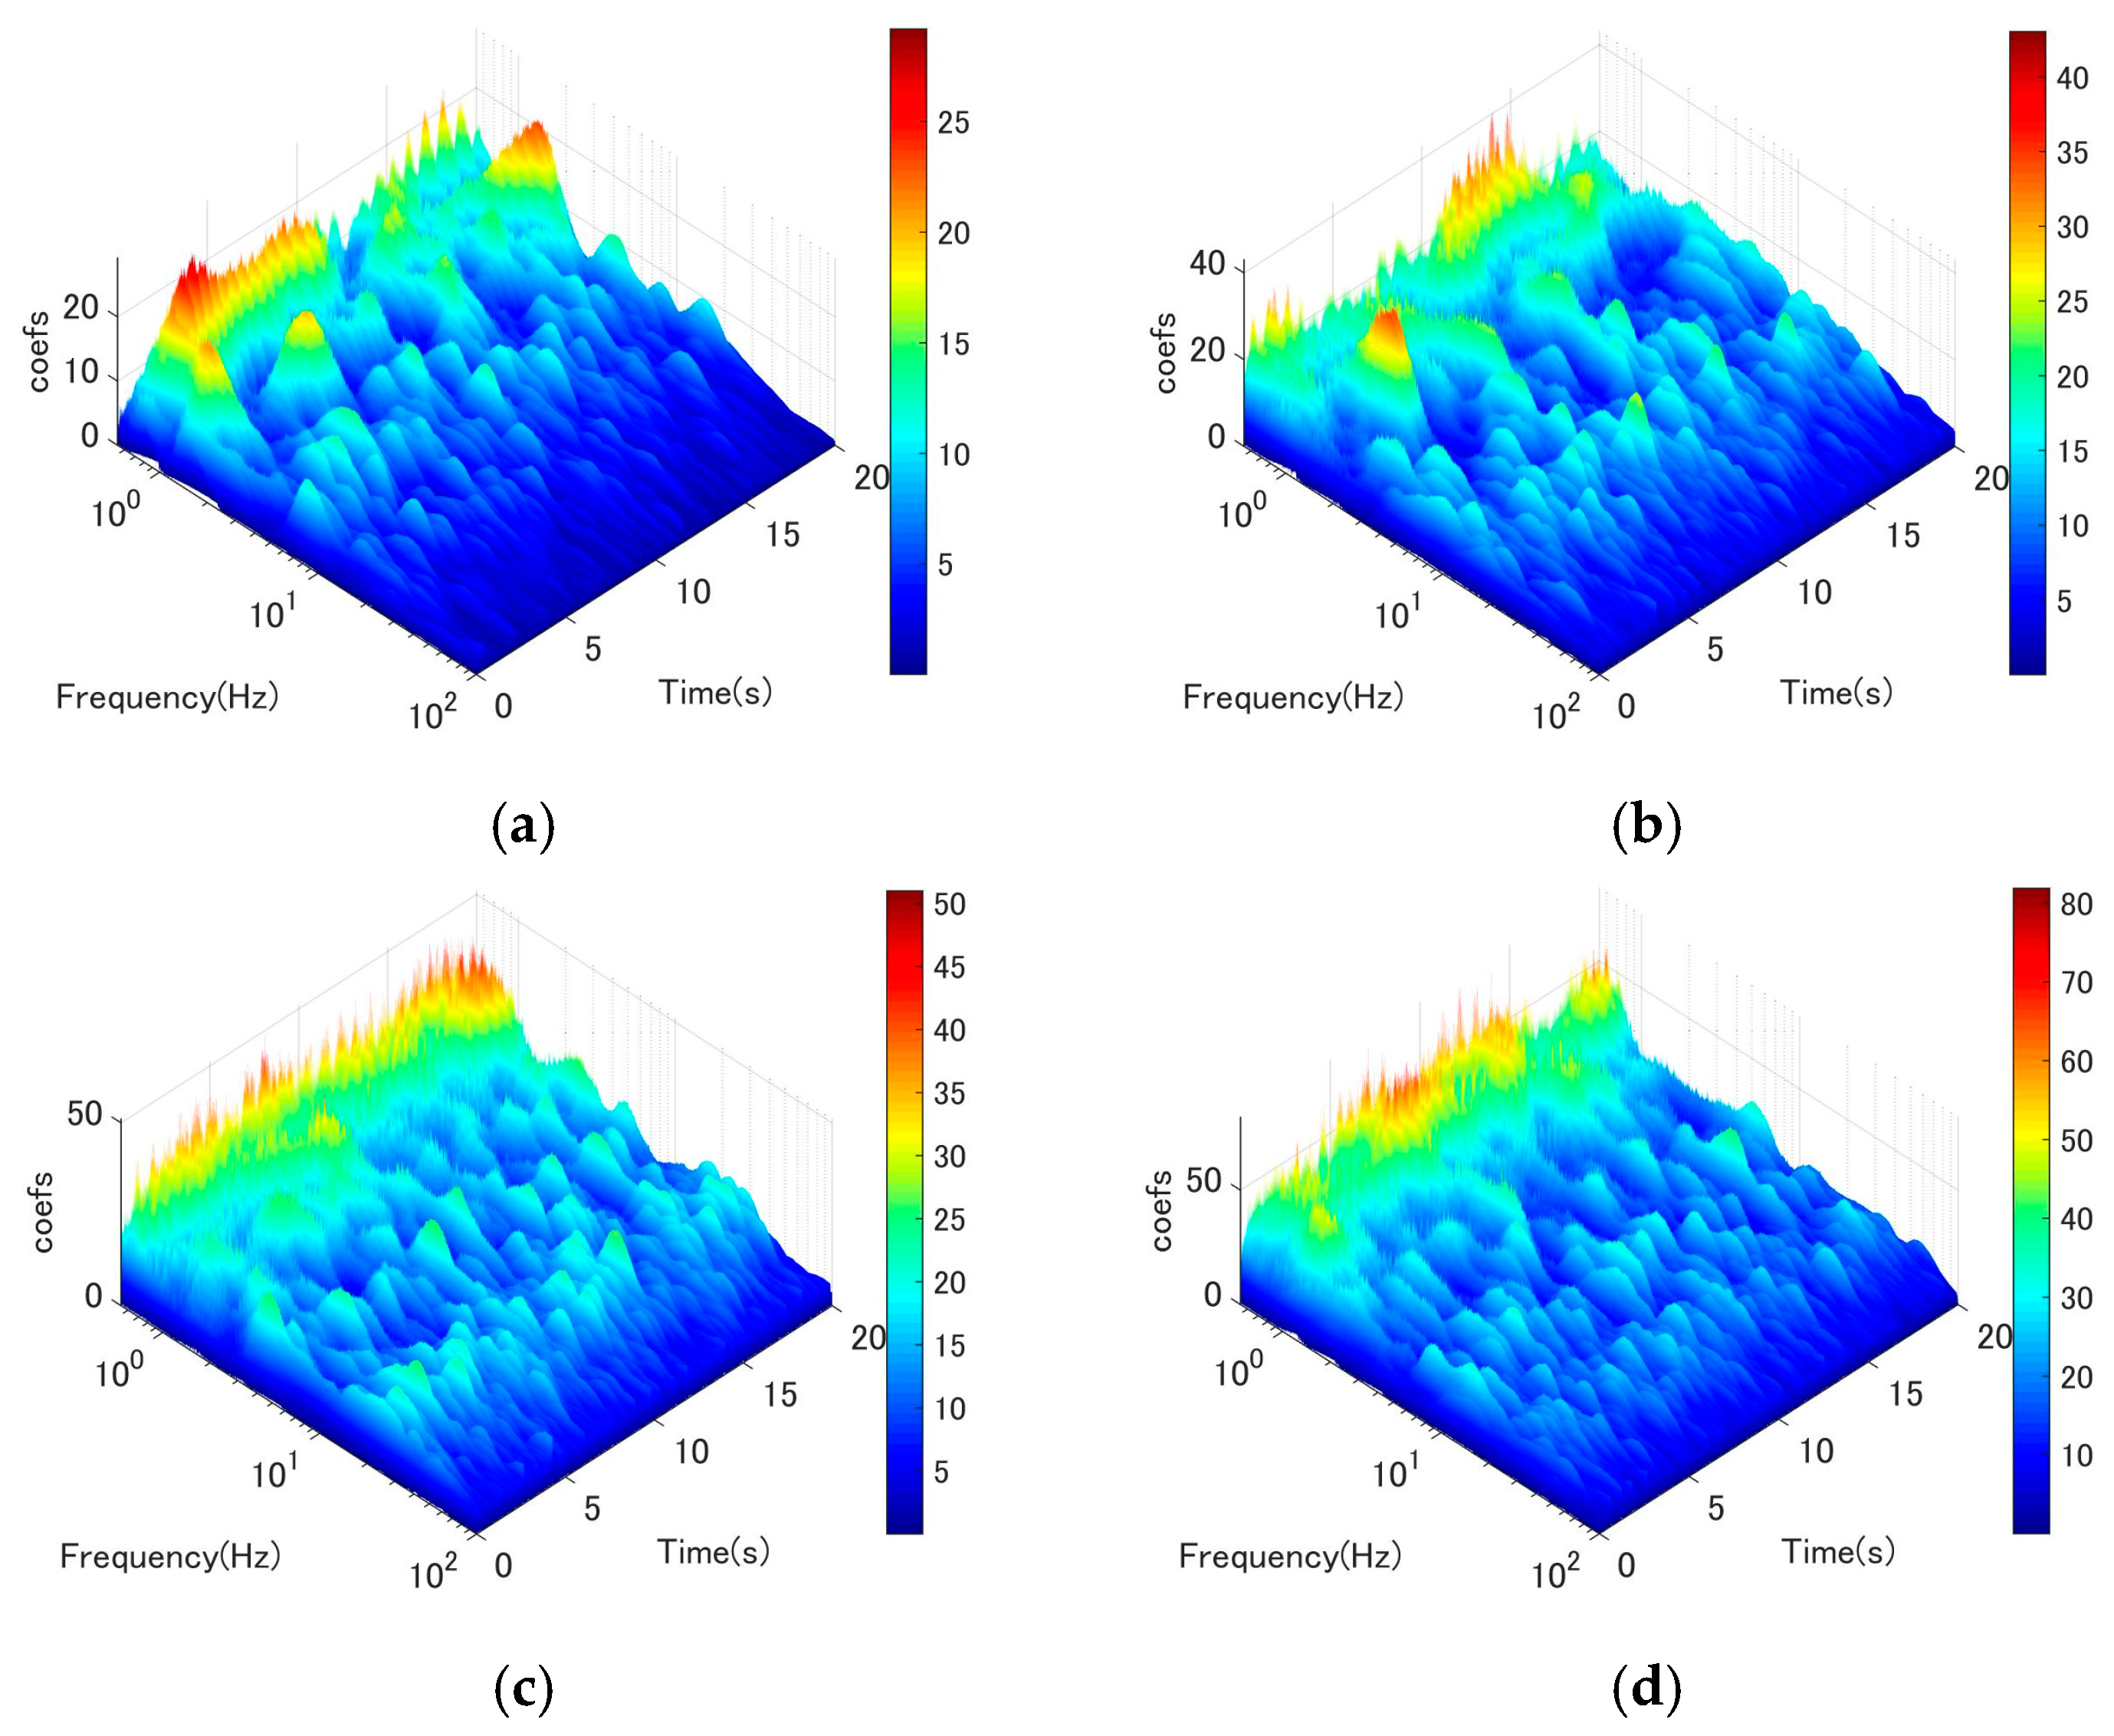
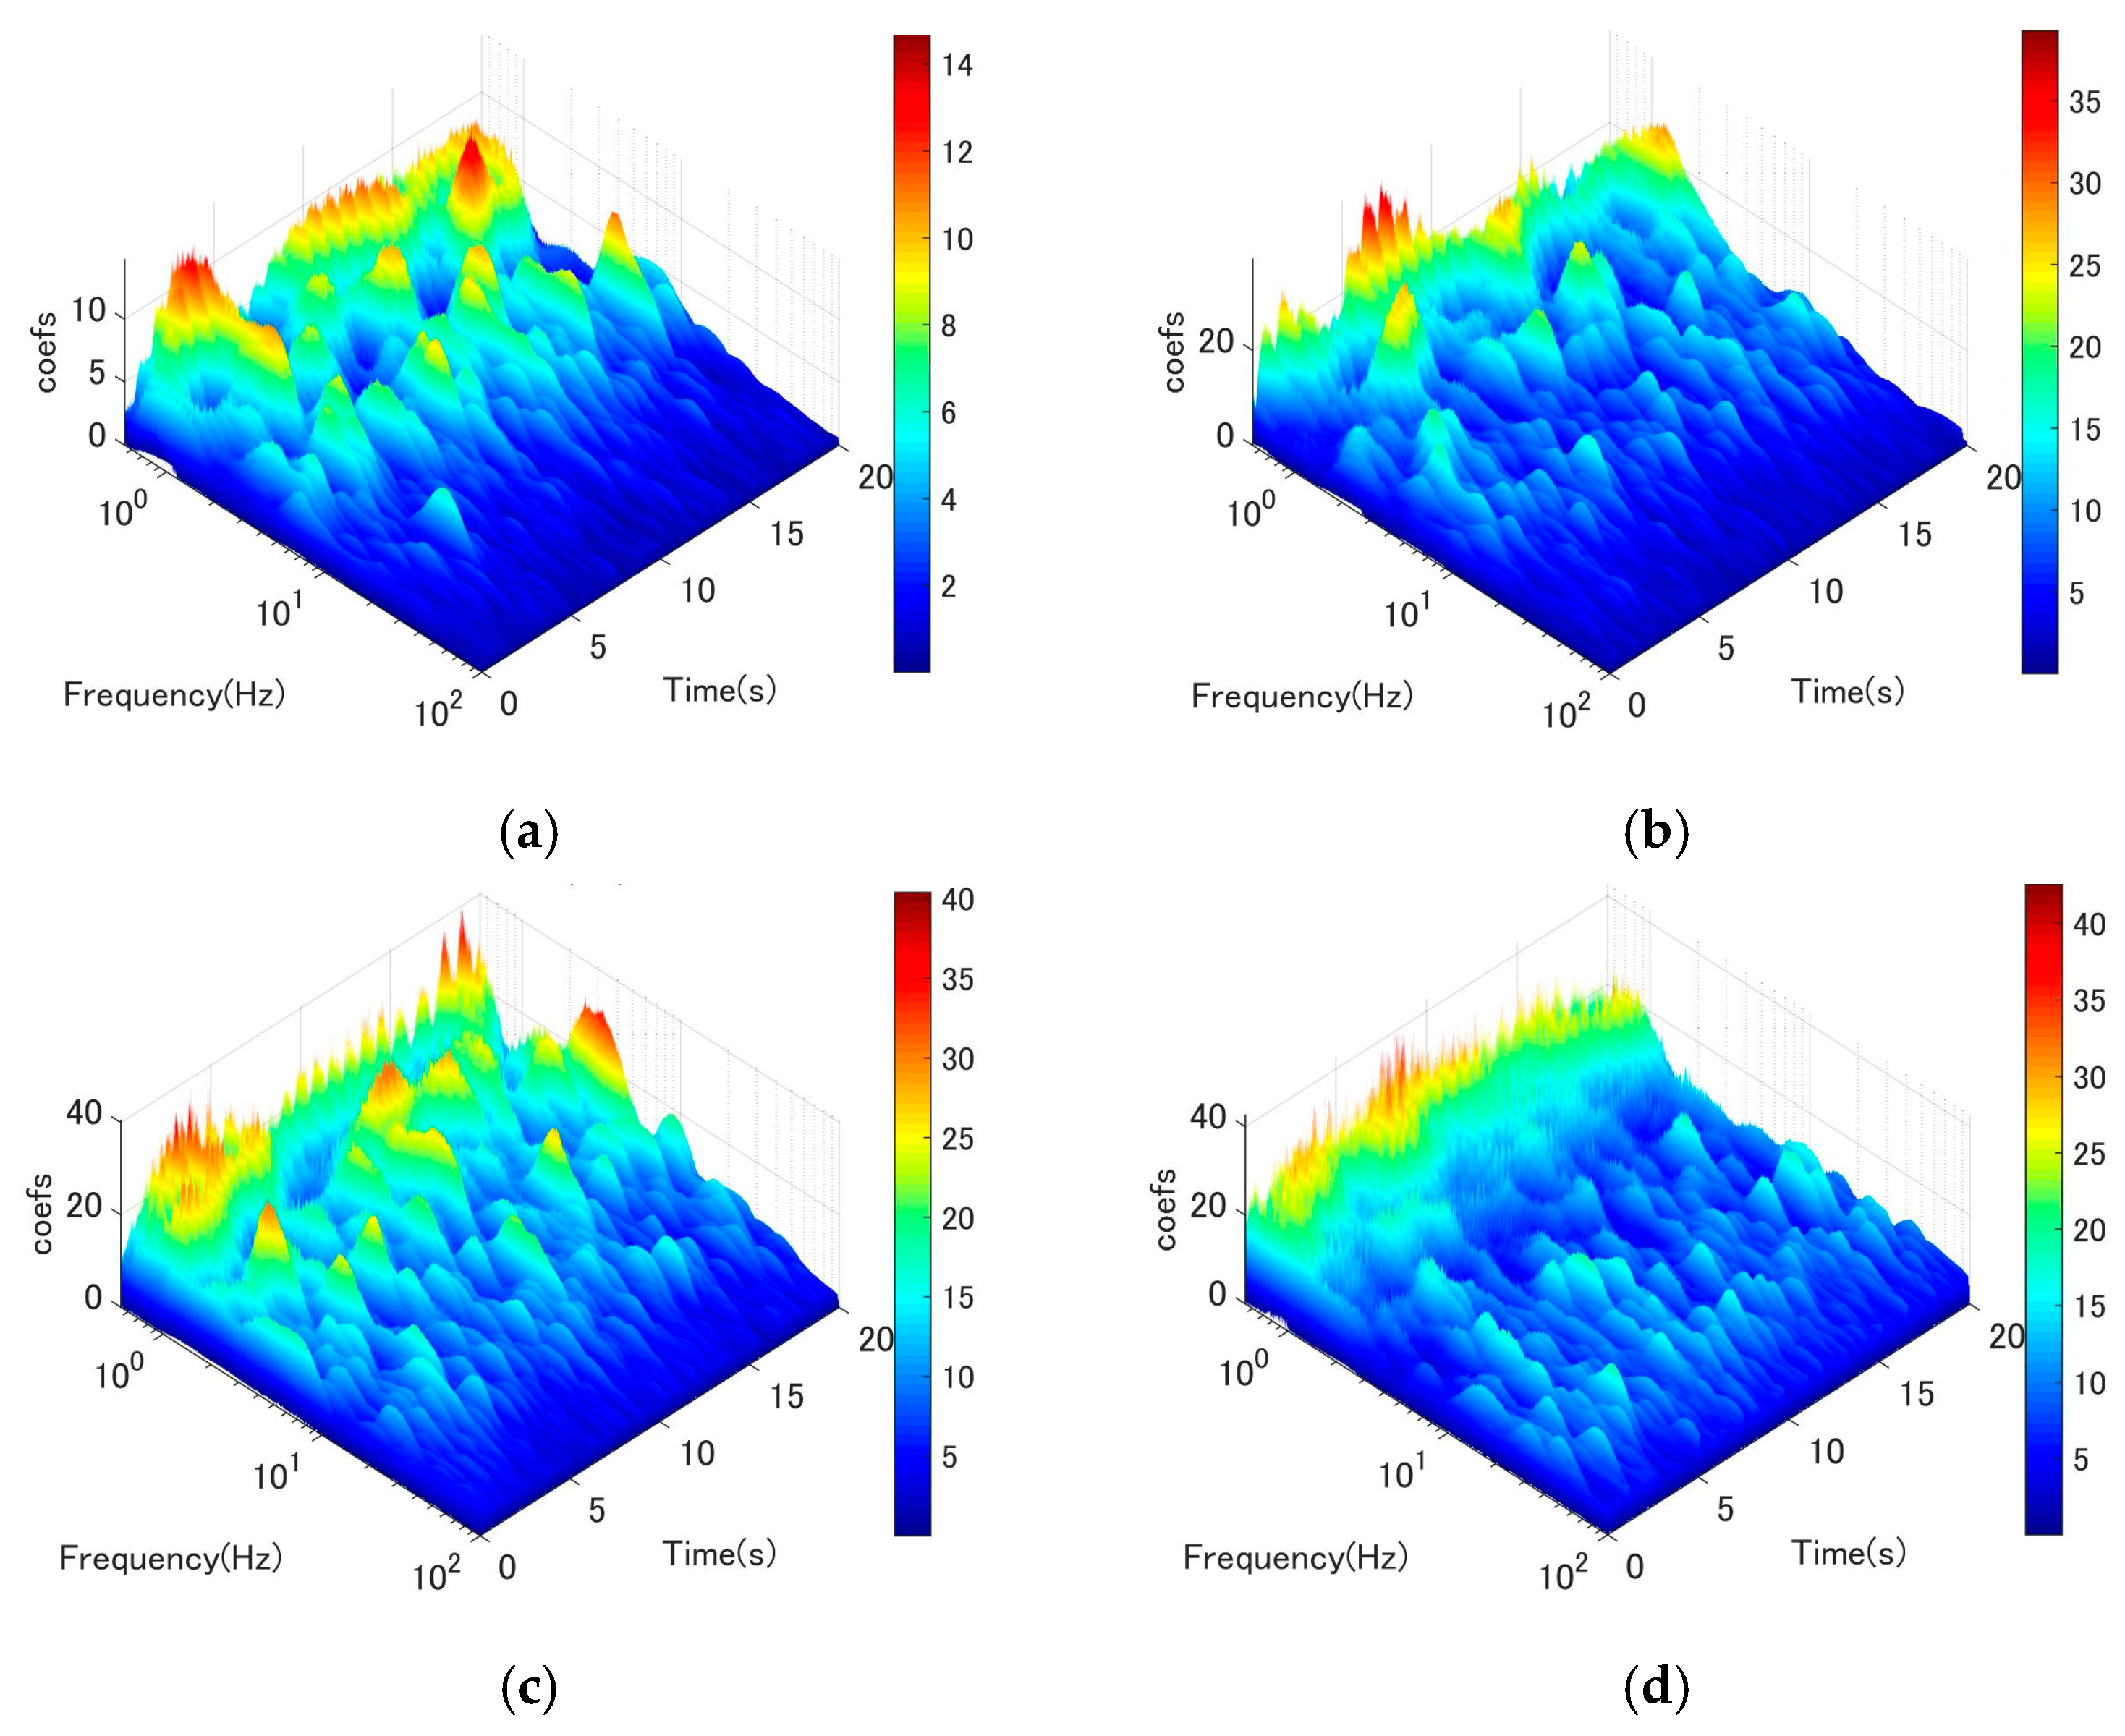
3.2.2. Wavelet Analysis on Along-Wind Fluctuation Component (U-Component)

To gain a more comprehensive understanding of the flow field surrounding the circular stay cable, an examination of along-wind fluctuation (u-component) was undertaken. Figure 11, Figure 12, Figure 13, Figure 14, Figure 15 and Figure 16 illustrate the wavelet analysis performed on the u-component at locations ranging from 2D to 7D. Remarkably, a similar mechanism was observed in the along-wind direction, indicating that the excitation of low-frequency vortices manifests in both the vertical and horizontal directions. Specifically, it was observed that Karman vortex shedding occurred at low wind speeds in conjunction with low-frequency vortices (as depicted in Figure 11a,b), which dissipated as wind speeds increased. Conversely, low-frequency vortices commenced shedding at a certain wind speed threshold (as shown in Figure 11b–d).

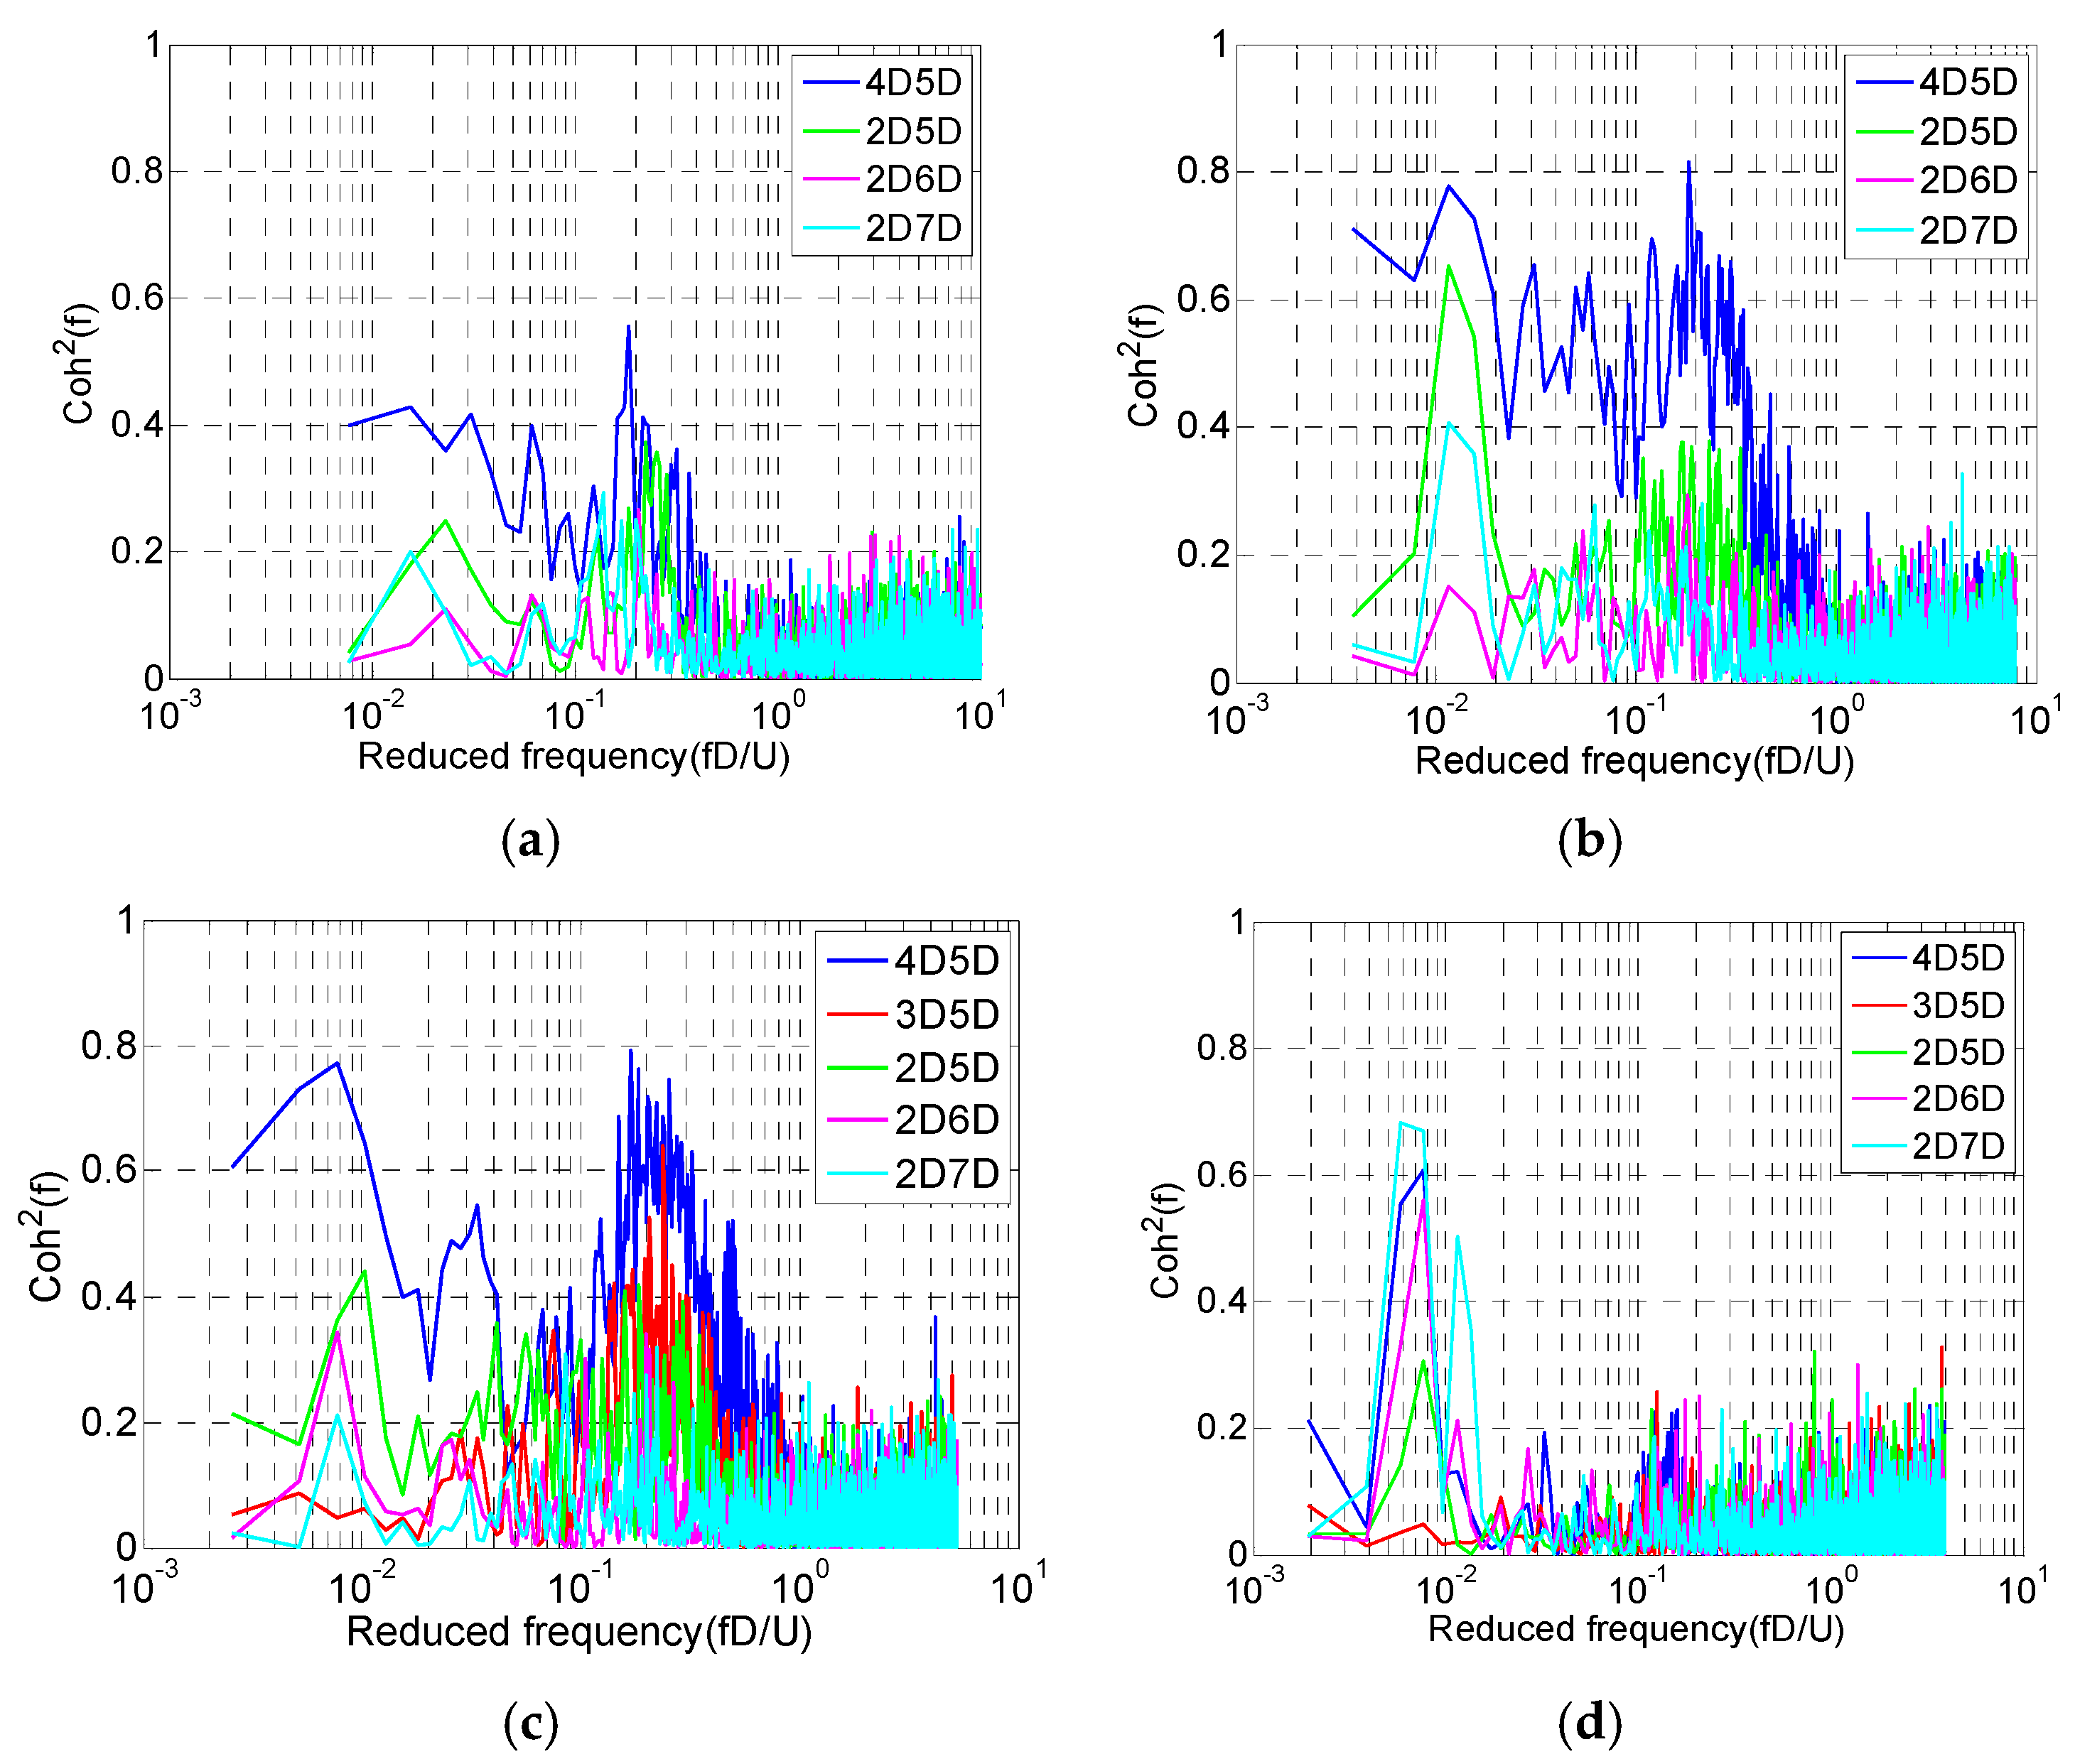
3.3. Shedding Correlation of Wind Flow in Cable Wake

Two hot wire anemometers were employed to quantify the wake flow along the cable in order to enhance the comprehension of the shedding correlation between wind flow in the vicinity of the cable wake. The cross-spectral density’s non-dimensional form of coherence, Coh2, is shown by:
C o h u 1 u 2 2 ( f ) = | C u 1 u 2 ( f ) | 2 C u 1 u 1 ( f ) × C u 2 u 2 ( f ) 1
The decay properties of the autocorrelation and cross-correlation coefficients are consistent with those of the corresponding functions. Moreover, the cross-spectral density and cross-covariance functions in the frequency domain exhibit equivalence. The identical description of the correlation, frequency content, and relative phases of the same frequencies between the two signals is apparent. The concept of coherence can be employed to determine a specific point at which the two signals exhibit a significant level of correlation [23].
Figure 17 depicts the correlation among wake flow fluctuations at distinct positions for different wind speeds. Obviously, the correlation at wind speeds between 5 and 10 m/s is very high at reduced frequencies (fD/U) of approximately 0.2, which coincides with the Karman vortex shedding frequency. At 10 and 15 m/s, the correlation of low-frequency flow gradually increased. At 20 m/s, the correlation of the Karman vortex is already suppressed, while the low frequency becomes very high. The highest correlation at 20 m/s is around 0.65 for locations 2D–7D. The results align with the wavelet analysis discussed in the previous section. The frequency range of fD/U, which was limited to 0.005–0.01, demonstrated a strong correlation with coherence levels exceeding 0.5 across different locations at a wind velocity of 20 m/s. Furthermore, the correlation coefficient observed at the frequency of vortex-induced vibration is approximately 0.2 at a wind speed of 20 m/s. To sum up, the variability in wind velocity characterized by low band frequency, high energy, and high correlation has the potential to generate significant excitation force, thereby triggering the galloping phenomenon in a circular cylinder. This observation is in accordance with the behavior of DSG’s stay cable.

4. Conclusions

The objective of this research undertaking is to augment our understanding of the stimulation mechanism that underlies the wind-induced galloping of circular cylinders in arid conditions. In order to attain this goal, a multitude of tests have been carried out and thoroughly analyzed to acquire a deeper understanding of the galloping phenomenon induced by wind. The present investigation puts forth the following principal findings:
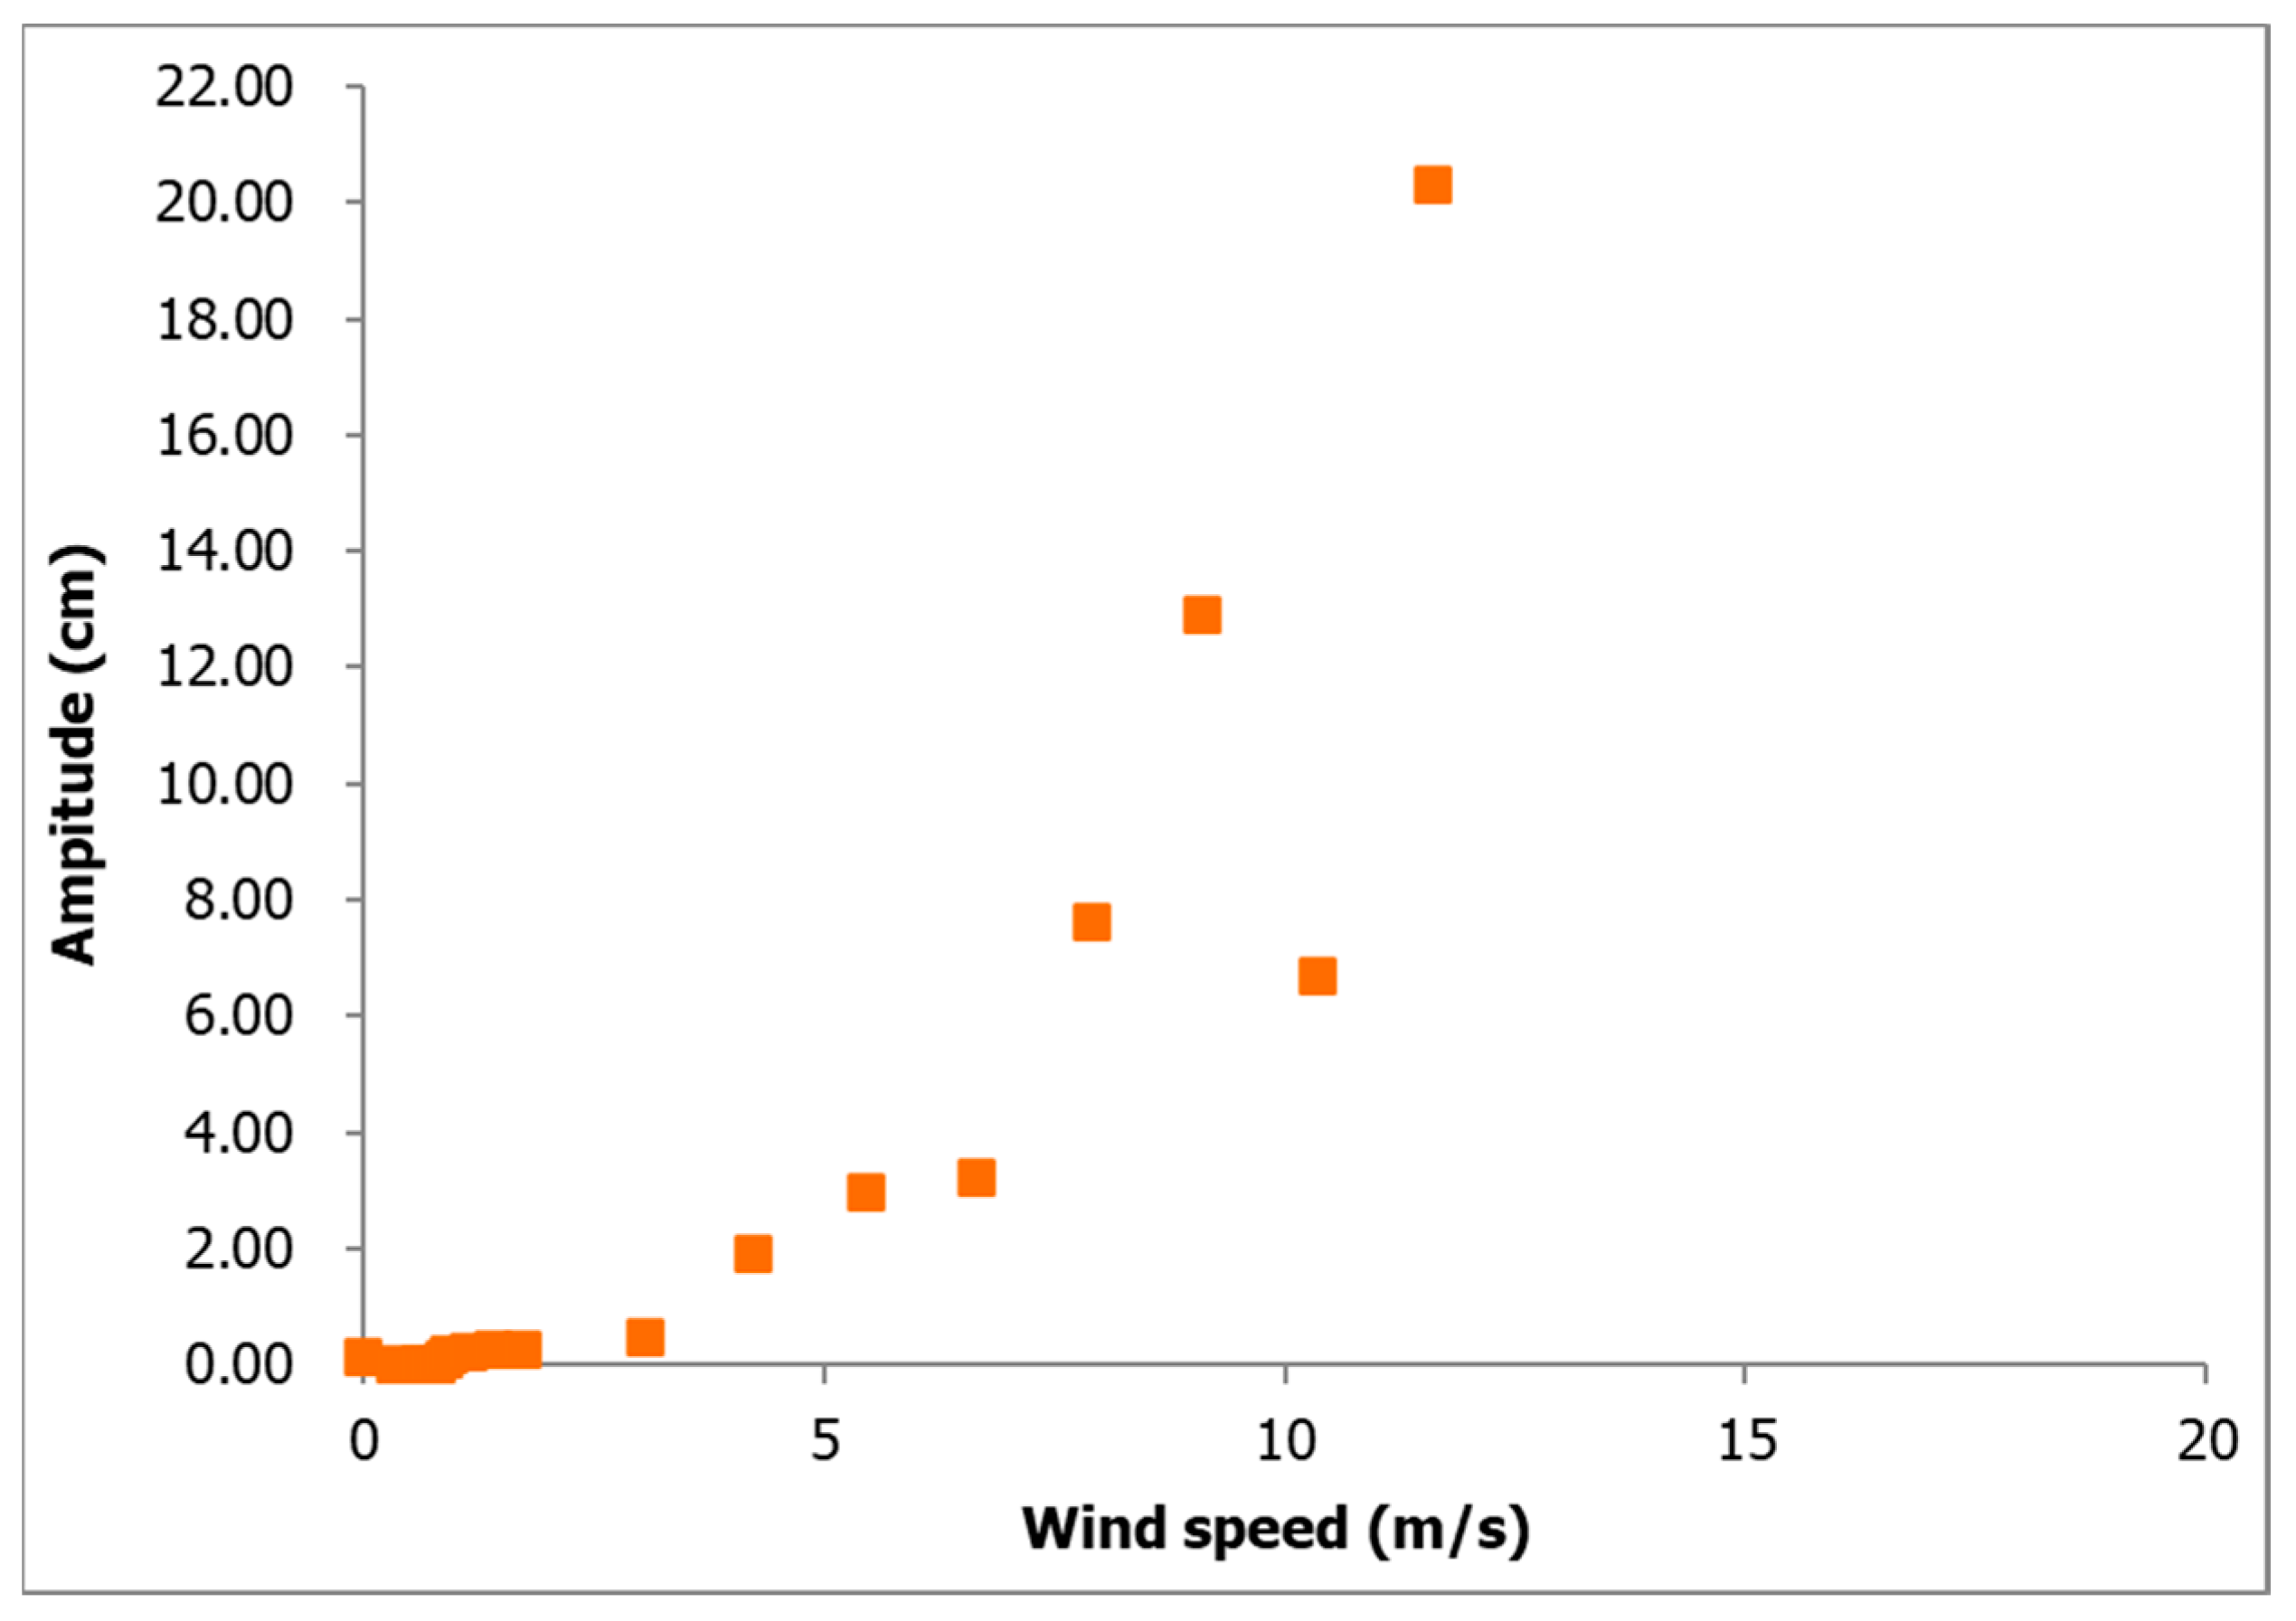
  • The investigation effectively replicates the limited response and divergent galloping phenomena, which are distinctive reactions of wind-induced oscillation in arid circumstances in cable stays;
  • Extensive measurements of the wake flow surrounding the stay cable were performed, encompassing both the vertical and horizontal wind fluctuation elements. Furthermore, the utilization of wavelet analysis and coherence analysis has been implemented to clarify the flow field characteristics in the proximity of the wake generated by the stay cable;
  • Under dry conditions, the formation of low-frequency dominant vortices and the suppression of Karman vortex shedding in the cylinder wake are closely associated with the process of wind-induced circular cylinder galloping;
  • At high wind speeds, there is a significant increase in the shedding correlation of low-frequency vortices. Conversely, as wind speed increased, the shedding correlation of the Karman vortex was progressively attenuated;
  • The low-frequency vortices exhibit high energy levels and demonstrate a strong temporal shedding correlation. Consequently, they have a significant excitation effect on the cylinder, contributing to its strong vibration response.

Author Contributions

Conceptualization, D.T.N. and D.H.V.; methodology, D.H.V.; software, D.T.N.; validation, D.H.V.; formal analysis, D.H.V.; investigation, D.T.N. and D.H.V.; resources, D.H.V.; data curation, D.T.N.; writing—original draft preparation, D.T.N. and D.H.V.; writing—review and editing, D.H.V.; visualization, D.T.N.; supervision, D.H.V.; project administration, D.H.V.; funding acquisition, D.T.N. and D.H.V. All authors have read and agreed to the published version of the manuscript.

Funding

This work was supported by the University of Danang, University of Science and Technology, code number of project: T2022-02-24.

Data Availability Statement

The data presented in this study are available on request from the corresponding author. The data is not publicly available due to privacy considerations. Please contact the corresponding author before use.

Acknowledgments

This work was supported by the University of Danang, University of Science and Technology. The authors are also grateful to Yokohama National University (Japan) for the wind tunnel test.

Conflicts of Interest

The authors declare no conflict of interest.

References

  1. Vo, H.D.; Katsuchi, H.; Yamada, H.; Nishio, M. A wind tunnel study on control methods for cable dry-galloping. Front. Struct. Civ. Eng. 2016, 10, 72–80. [Google Scholar] [CrossRef]
  2. Vo-Duy, H.; Nguyen, C.H. Mitigating Large Vibrations of Stayed Cables in Wind and Rain Hazards. Shock. Vib. 2020, 2020, 5845712. [Google Scholar] [CrossRef]
  3. Jakobsen, J.B.; Andersen, T.L.; Macdonald, J.H.G.; Nikitas, N.; Larose, G.L.; Savage, M.G.; McAuliffe, B.R. Wind-induced response and excitation characteristic of an inclined cable model in the critical Reynolds number range. J. Wind. Eng. Ind. Aerodyn. 2012, 110, 100–112. [Google Scholar] [CrossRef]
  4. Matsumoto, M.; Yagi, T.; Hatsuda, H.; Shima, T.; Tanaka, M.; Naito, H. Dry galloping characteristics and its mechanism of inclined/yawed cables. J. Wind. Eng. Ind. Aerodyn. 2010, 98, 317–327. [Google Scholar] [CrossRef] [Green Version]
  5. Ni, Y.; Wang, X.; Chen, Z.; Ko, J. Field observations of rain-wind-induced cable vibration in cable-stayed Dongting Lake Bridge. J. Wind. Eng. Ind. Aerodyn. 2007, 95, 303–328. [Google Scholar] [CrossRef]
  6. Zuo, D.; Jones, N.P. Interpretation of field observations of wind- and rain-wind-induced stay cable vibrations. J. Wind. Eng. Ind. Aerodyn. 2010, 98, 73–87. [Google Scholar] [CrossRef]
  7. Kumarasena, S.; Jones, N.P.; Irwin, P.; Taylor, P. Wind Induced Vibration of Stay Cables; Report No. FHWA-HRT-05-083; Federal Highway Administration: McLean, VA, USA, 2007.
  8. Kusuhara, S. Vibrations and countermeasures for cable structure of Honshu-Shikoku bridges. In Proceedings of the International Symposium on Flutter and Its Application 2016, Tokyo, Japan, 15–17 May 2016; Japan Aerospace Exploration Agency: Tokyo, Japan, 2017. [Google Scholar]
  9. Saito, T.; Matsumoto, M.; Kitazawa, M. Rain-wind Excitation of Cables on Cable-stayed Higashi-Kobe Bridge and Cable Vibration Control. In Proceedings of the Cable-Stayed and Suspension Bridges, Deauville, France, 12–15 October 1994. [Google Scholar]
  10. Honda, A.; Yamanaka, T.; Fujiwara, T.; Saito, T. Wind tunnel test on rain-induced vibration of the stay cable. In Proceedings of the International Symposium on Cable Dynamics, Liège, Belgium, 19–20 October 1995. [Google Scholar]
  11. Miyata, T.; Yamada, H.; Hojo, T. Aerodynamic response of PE stay cables with pattern-indented surface. In Proceedings of the International Conference on Cable-Stayed and Suspension Bridges (AFPC), Deauville, France, 2 October 1994. [Google Scholar]
  12. Cheng, S.; Larose, G.L.; Savage, M.G.; Tanaka, H.; Irwin, P.A. Experimental study on the wind-induced vibration of a dry inclined cable—Part I: Phenomena. J. Wind. Eng. Ind. Aerodyn. 2008, 96, 2231–2253. [Google Scholar] [CrossRef]
  13. Nikitas, N.; Macdonald, J.H.G. Aerodynamic forcing characteristics of dry cable galloping at critical Reynolds numbers. Eur. J. Mech.-B/Fluids 2015, 49, 243–249. [Google Scholar] [CrossRef] [Green Version]
  14. Kleissl, K.; Georgakis, C. Comparison of the aerodynamics of bridge cables with helical fillets and a pattern-indented surface. J. Wind. Eng. Ind. Aerodyn. 2012, 104–106, 166–175. [Google Scholar] [CrossRef]
  15. Den Hartog, J.P. Mechanical Vibrations, 4th ed.; McGraw-Hill: New York, NY, USA, 1956. [Google Scholar]
  16. Macdonald, J.; Larose, G. A unified approach to aerodynamic damping and drag/lift instabilities, and its application to dry inclined cable galloping. J. Fluids Struct. 2006, 22, 229–252. [Google Scholar] [CrossRef]
  17. Piccardo, G.; Zulli, D.; Luongo, A. Dry galloping in inclined cables: Linear stability analysis. Procedia Eng. 2017, 199, 3164–3169. [Google Scholar] [CrossRef]
  18. Liu, Q.; Sun, Y.; Jia, Y.; Ma, W.; Xiao, B. Study on the characteristics and mechanisms of the wind-induced vibration of micro-elliptical section stay cables. J. Wind. Eng. Ind. Aerodyn. 2020, 206, 104355. [Google Scholar] [CrossRef]
  19. Nakamura, Y.; Hirata, K.; Urabe, T. Galloping of rectangular cylinders in the presence of a splitter plate. J. Fluids Struct. 1991, 5, 521–549. [Google Scholar] [CrossRef]
  20. Matsumoto, M.; Shiraishi, N.; Kitazawa, M.; Knisely, C.; Shirato, H.; Kim, Y.; Tsujii, M. Aerodynamic Behavior of Inclined Circular Cylinders-Cable Aerodynamics. Wind. Eng. Ind. Aerodyn. 1990, 33, 63–72. [Google Scholar] [CrossRef]
  21. McTavish, S.; D’auteuil, A.; Raeesi, A. Effect of cable surface characteristics and flow turbulence on the aerodynamic behaviour of stay cables in dry conditions. J. Wind. Eng. Ind. Aerodyn. 2020, 207, 104414. [Google Scholar] [CrossRef]
  22. Chandrasekaran, S. Chapter 3–Vortex-induced vibration. In Design of Marine Risers with Functionally Graded Materials; Woodhead Publishing Series in Civil and Structural Engineering; Woodhead Publishing: Cambridge, UK, 2021; pp. 59–90. ISBN 9780128235379. [Google Scholar] [CrossRef]
  23. Barltrop, N.D.P.; Adams, A.J. Dynamics of Fixed Marine Structures, 3rd ed.; Butterworth Heinemann: Oxford, UK, 1991. [Google Scholar]
Figure 1. Cable model in wind tunnel.
Buildings 13 01543 g001
Figure 2. Wind speed calibration.
Buildings 13 01543 g002
Figure 3. Reproduction of DSG for stay cable in wind tunnel.
Buildings 13 01543 g003
Figure 4. Measurement of the flow field near the cylinder wake. (a) Hot wire anemometer from cable wake; (b) hot wire anemometer on separation layer.
Buildings 13 01543 g004
Figure 5. Wavelet analysis of the wind velocity fluctuation at location 2D, w-component.
Buildings 13 01543 g005
Figure 6. Wavelet analysis of the wind velocity fluctuation at location 3D, w-component. (a) Wind speed: 5 m/s; (b) wind speed: 10 m/s; (c) wind speed: 15 m/s; (d) wind speed: 20 m/s.
Buildings 13 01543 g006
Figure 7. Wavelet analysis of the fluctuating wind velocity at location 4D, w-component. (a) Wind speed: 5 m/s; (b) wind speed: 10 m/s; (c) wind speed: 15 m/s; (d) wind speed: 20 m/s.
Buildings 13 01543 g007
Figure 8. Wavelet analysis of the fluctuating wind velocity at location 5D, w-component. (a) Wind speed: 5 m/s; (b) wind speed: 10 m/s; (c) wind speed: 15 m/s; (d) wind speed: 20 m/s.
Buildings 13 01543 g008
Figure 9. Wavelet analysis of the fluctuating wind velocity at location 6D, w-component. (a) Wind speed: 5 m/s; (b) wind speed: 10 m/s; (c) wind speed: 15 m/s; (d) wind speed: 20 m/s.
Buildings 13 01543 g009
Figure 10. Wavelet analysis of the fluctuating wind velocity at location 7D, w-component. (a) Wind speed: 5 m/s; (b) wind speed: 10 m/s; (c) wind speed: 15 m/s; (d) wind speed: 20 m/s.
Buildings 13 01543 g010
Figure 11. Wavelet analysis of the fluctuating wind velocity at location 2D, u-component. (a) Wind speed: 5 m/s; (b) wind speed: 10 m/s; (c) wind speed: 15 m/s; (d) wind speed: 20 m/s.
Buildings 13 01543 g011
Figure 12. Wavelet analysis of the fluctuating wind velocity at location 3D, u-component. (a) Wind speed: 5 m/s; (b) wind speed: 10 m/s; (c) wind speed: 15 m/s; (d) wind speed: 20 m/s.
Buildings 13 01543 g012
Figure 13. Wavelet analysis of the fluctuating wind velocity at location 4D, u-component. (a) Wind speed: 5 m/s; (b) wind speed: 10 m/s; (c) wind speed: 15 m/s; (d) wind speed: 20 m/s.
Buildings 13 01543 g013
Figure 14. Wavelet analysis of the fluctuating wind velocity at location 5D, u-component. (a) Wind speed: 5 m/s; (b) wind speed: 10 m/s; (c) wind speed: 15 m/s; (d) wind speed: 20 m/s.
Buildings 13 01543 g014
Figure 15. Wavelet analysis of the fluctuating wind velocity at location 6D, u-component. (a) Wind speed: 5 m/s; (b) wind speed: 10 m/s; (c) wind speed: 15 m/s; (d) wind speed: 20 m/s.
Buildings 13 01543 g015
Figure 16. Wavelet analysis of the fluctuating wind velocity at location 7D, u-component. (a) Wind speed: 5 m/s; (b) wind speed: 10 m/s; (c) wind speed: 15 m/s; (d) wind speed: 20 m/s.
Buildings 13 01543 g016
Figure 17. Coherence analysis at different wind speed. (a) Wind speed: 5 m/s; (b) wind speed: 10 m/s; (c) wind speed: 15 m/s; (d) wind speed: 20 m/s.
Buildings 13 01543 g017
Table 1. Turbulence intensity.
No.Mean U
(m/s)
IuIw
16.710.59%0.60%
29.200.59%0.62%
311.680.56%0.59%
414.150.60%0.61%
519.060.48%0.62%
Table 2. Wind speed ratio.
No.U1 (m/s)
At Pitot Tube
U2 (m/s)
At Model Position
U1/U2
10.450.441.024
20.540.491.095
30.620.561.114
40.720.671.081
50.800.731.099
60.960.871.109
71.161.031.123
81.381.261.093
91.721.621.059
103.042.891.051
114.213.991.055
125.415.131.055
136.606.321.045
147.827.731.012
159.068.661.046
1610.259.971.028
1711.5111.201.028
1812.7312.501.018
1913.9513.201.057
2015.1815.101.005
2116.4216.301.007
2217.6217.101.030
2318.7918.401.021
2420.0719.501.029
Table 3. Experimental parameters.
ParametersValue
Stay cable diameter: D158 mm
Model length1500 mm
Mass per unit14.00–16.00 kg/m
Frequency0.80–1.00 Hz
Logarithm decrement (δ)0.5–1.6%
Reynolds number~2.1 × 10⁵
Disclaimer/Publisher’s Note: The statements, opinions and data contained in all publications are solely those of the individual author(s) and contributor(s) and not of MDPI and/or the editor(s). MDPI and/or the editor(s) disclaim responsibility for any injury to people or property resulting from any ideas, methods, instructions or products referred to in the content.

