Article

Cyclic Behavior of Different Connections in Precast Concrete Shear Walls: Experimental and Analytical Investigations

by
Ekkachai Yooprasertchai
1,*,
Pongsak Wiwatrojanagul
2,
Panumas Saingam
3 and
Kaffayatullah Khan
4
1
Construction Innovations and Future Infrastructure Research Center (CIFIR), Department of Civil Engineering, Faculty of Engineering, King Mongkut’s University of Technology Thonburi, Bangkok 10140, Thailand
2
Theta Forge Co., Ltd., Ladprao, Bangkok 10230, Thailand
3
Department of Civil Engineering, School of Engineering, King Mongkut’s Institute of Technology Ladkrabang, Bangkok 10520, Thailand
4
Department of Civil and Environmental Engineering, College of Engineering, King Faisal University, Al-Hofuf 31982, Saudi Arabia
*
Author to whom correspondence should be addressed.
Buildings 2023, 13(6), 1433; https://doi.org/10.3390/buildings13061433
Submission received: 4 May 2023 / Revised: 26 May 2023 / Accepted: 29 May 2023 / Published: 31 May 2023
(This article belongs to the Special Issue Seismic Vulnerability Analysis and Mitigation of Building Systems)

Abstract

:
This study investigated the grouted sleeve splices and corrugated duct splices between shear walls and footing. In this regard, three shear walls were experimentally tested. One wall was cast monolithically with the foundation (RCWS), whereas two walls were precast. One wall was connected to the foundation using splice sleeves (PGWS), and another with corrugated duct splices (PCWS). All the walls were tested under reverse cyclic loading and a constant axial load. It was observed that the performance of specimen PGWS was controlled by rocking, and a premature connection loss was observed at one of the grouted sleeve splices. The hysteretic performance of specimen PCWS was close to that of specimen RCWS, whereas extensive pinching was observed in the hysteretic response of specimen PGWS. The peak load, ductility, secant stiffness, and energy dissipation of specimens RCWS and PCWS were in good agreement, whereas the energy dissipated by specimen PGWS was considerably lower than the corresponding values of specimens RCWS and PCWS. Nonlinear fiber-based modeling in OpenSees was performed using SFI-MVLEM elements. The predicted hysteretic response of the OpenSees model was in close agreement with the experimental response.

1. Introduction

Several disadvantages are associated with conventional cast-in-place (CIP) or monolithic construction, such as being laborious and time-consuming. In addition, it is difficult to maintain construction quality in monolithic construction [1]. The use of precast (PC) concrete can overcome these issues, especially in the construction of high-rise buildings. The use of PC concrete has been around since the late 19th century [2]. In a similar context, the use of PC shear walls has gained interest in recent years [3,4,5,6,7,8].
The performance of a PC structure mainly depends on the performance of the connections between the individual components. An adequate connection between two adjacent components is vital to ensure the proper load transfer mechanism and avoid premature failure attributed to poor connection details. Further, ACI 318-19 [9] recommends ensuring a similar performance of a PC shear wall as that of a CIP shear wall. At present, the most common method to connect a PC shear wall to the adjacent members is either using grouted sleeve splices (GSS) or corrugated duct splices (CDS) [1].
Invented in the 1960s, GSS have been the most commonly deployed method for the panel-to-panel or panel-to-foundation connection due to their short and convenient construction [10,11,12]. Belleri and Riva [13] investigated the use of GSS in column-to-footing connections. Comparisons were made with traditional CIP column-to-footing connections. It was observed that the GSS connection resulted in a similar performance as that of the CIP connection in terms of ductility and dissipated energy. Further, the grout used in the GSS connection provided confinement to the longitudinal bars, and their buckling was prevented. Peng et al. [14] adopted a mortar sleeve connection for the longitudinal bars in PC shear walls. The performance of the mortar sleeve connection was investigated under cyclic loading. The sleeve connection was found to effectively transfer longitudinal bar stresses. Further, the failure mode of the shear wall with mortar GSS was similar to the failure mode of the CIP shear wall. However, the energy-dissipating capacity of the PC shear wall was less than the capacity of the CIP shear wall. Soudki et al. [15] tested six full-scale PC shear walls with GSS, including a control CIP shear wall under reverse cyclic loading and constant axial load. Steel sleeves were installed at the two edges, whereas the ductility and energy dissipation of the shear walls with GSS connections were found to be comparable to the ductility and energy dissipation of the CIP shear wall. Xiao et al. [16] highlighted the issues of GSS connections, including the backflow of the grout during grouting, resulting in a defected grout connection. In this regard, grout defects of different sizes were intentionally introduced in the GSS connection to assess the resulting performance of PC shear walls. The defected GSS connections were found to adversely affect the performance of PC shear walls, mainly when the longitudinal bars were in tension. Further, a longitudinal bar in a GSS connection without defects was observed to achieve its full capacity.
Despite demonstrating good performance under cyclic loading tests, the use of GSS connections may not be cost-effective [17]. Further, grouting defects significantly affect the performance of PC shear walls [16,18]. Corrugated duct splices (CDS) have recently gained significance due to their lower costs. Further, the length of corrugated duct splices can be made longer than GSS splices. As a result, the defect tolerance of the grout is considerably enhanced [17]. Popa et al. [19] investigated the performance of scaled PC columns with steel CDS connections at their bases. The hysteretic response and energy dissipation of PC columns with CDS connections were found to be similar to those of CIP columns. Fan et al. [20] investigated the performance of GSS and CDS connections at PC column-footing junctions in comparison to the performance of CIP specimens. For ease of construction, large-diameter bars were used. In the case of the GSS connection, the formation of a plastic hinge above the GSS connection resulted in the buckling of longitudinal bars and the rupture of transverse bars, adversely affecting the overall performance of the specimen. In the case of CDS connections, the slip of large-diameter bars and surrounding concrete resulted in pronounced pinching in the hysteretic response. A possible solution to reduce pinching in the case of CDS connections with large-diameter bars was identified using longer CDS lengths. Nonetheless, PC columns with CDS connections exhibited higher ductility and lateral load capacity than those of the columns with GSS connections. Zhi et al. [21] tested three PC shear walls with CDS connections and CIP shear wall. Metallic corrugated pipes were used for the CDS connection at the front and back of the PC shear walls, close to the vertical sides. The three PC shear walls were differentiated depending on the type of longitudinal bars inside the CDS connection, such as ordinary bars, high-strength bars, or post-tensioned bars. It was observed that the inclusion of high-strength or post-tensioned bars inside the CDS improved the performance of shear walls in terms of ductility and energy dissipation. Xue et al. [17] tested six full-scale shear walls under reverse cyclic loading. The walls were tested under an axial load ratio of either 0.12 or 0.3. The PC shear walls used either the GSS or CDS connections. The hysteretic curves of PC shear walls were found to be wider than the hysteretic curves of CIP walls, ascribed to the improved confinement provided by GSS or CDS connections. The PC shear walls were found to have similar ductility to those of the CIP shear walls under low axial loads. However, the ductility of PC shear walls was higher than the ductility of CIP walls under high axial loads. The state-of-the-art concerning the use of CDS connections in PC shear walls is very limited at the moment. Previous studies have demonstrated that the use of CDS connections could be an effective solution for the PC members’ connections [17,19,20,21]. Further, it was demonstrated by Xue et al. [17] that CDS connections can be an alternative to the conventional GSS connections in PC shear walls with a height of 2750 mm.
The present study tends to increase the limited experimental database on the use of CDS connections in shear walls. The main objectives of the present study include performing an experimental comparison of shear walls with GSS and CDS connections subjected to hysteretic loadings. In particular, the efficacy of GSS or CDS connections is assessed on short shear walls, i.e., up to 1200 mm. At present, no study has been conducted that predicts the hysteretic behavior of PC shear walls with CDS connections. The present study also tends to fill this gap by performing nonlinear analysis on PC shear walls with GSS or CDS connections. In particular, the present study focuses on the application of GSS or CDS horizontal wall-to-footing joints.

2. Experimental Program

2.1. Test Matrix

This study intended to perform an experimental comparison of shear walls with GSS or CDS horizontal connections. Therefore, three shear wall specimens were tested in this study, comprising one cast-in-place (CIP) specimen (RCWS), one precast (PC) specimen with grouted sleeve splices (PGWS), and one PC specimen with corrugated duct splices (PCWS). The length and width of all specimens were 800 mm and 120 mm, respectively. The height of all specimens was 1190 mm. These details are summarized in Table 1.

2.2. Specimen Details

The structural details of three test specimens are presented in Figure 1. All specimens comprised two boundary elements with denser reinforcement and a web element in between the boundary elements. All the walls were connected to beams at the top and to footings at the bottom to replicate the actual construction details. The longitudinal reinforcement consisted of deformed bars of 10 mm diameter. The center-to-center spacing of longitudinal bars within the boundary elements was 110 mm, whereas it was increased to 177 mm within the web. The longitudinal reinforcement was tied along the boundaries using deformed bars of 10 mm diameter. The spacing of 10 mm diameter ties was 150 mm toward the lower half of the shear walls, whereas the spacing was increased to 300 mm near the top. The ties within the boundary elements comprised round bars of 9 mm diameter. The spacing of ties within boundary elements was 75 mm at the bottom and 150 mm near the top of the shear walls. The structural details of the top beam are also shown in Figure 1.
As mentioned before, grouting sleeve splice and corrugated duct splice methods were adopted in this study to compare the corresponding structural responses of PC shear walls. The details of corrugated duct splices are shown in Figure 1b. Three corrugated ducts were installed along the centerline of the section, with one within the web, and the other two within the boundary elements. The height of the corrugated duct was kept at 450 mm, whereas the height of the protruding bars (i.e., deformed bars of 20 mm diameter) from the footing was 400 mm. The center-to-center spacing of corrugated ducts was 315 mm. For the PGWS specimen (see Figure 1c), the sleeves were installed at similar locations. The height of the protruding bars in the PGWS specimen was 165 mm, whereas the height of the bar above the sleeve was 500 mm. For both splice methods, a gap of 20 mm was left between the shear wall and footing, which was later filled using a high-strength grout. The concrete cover was considered 20 mm for all walls.

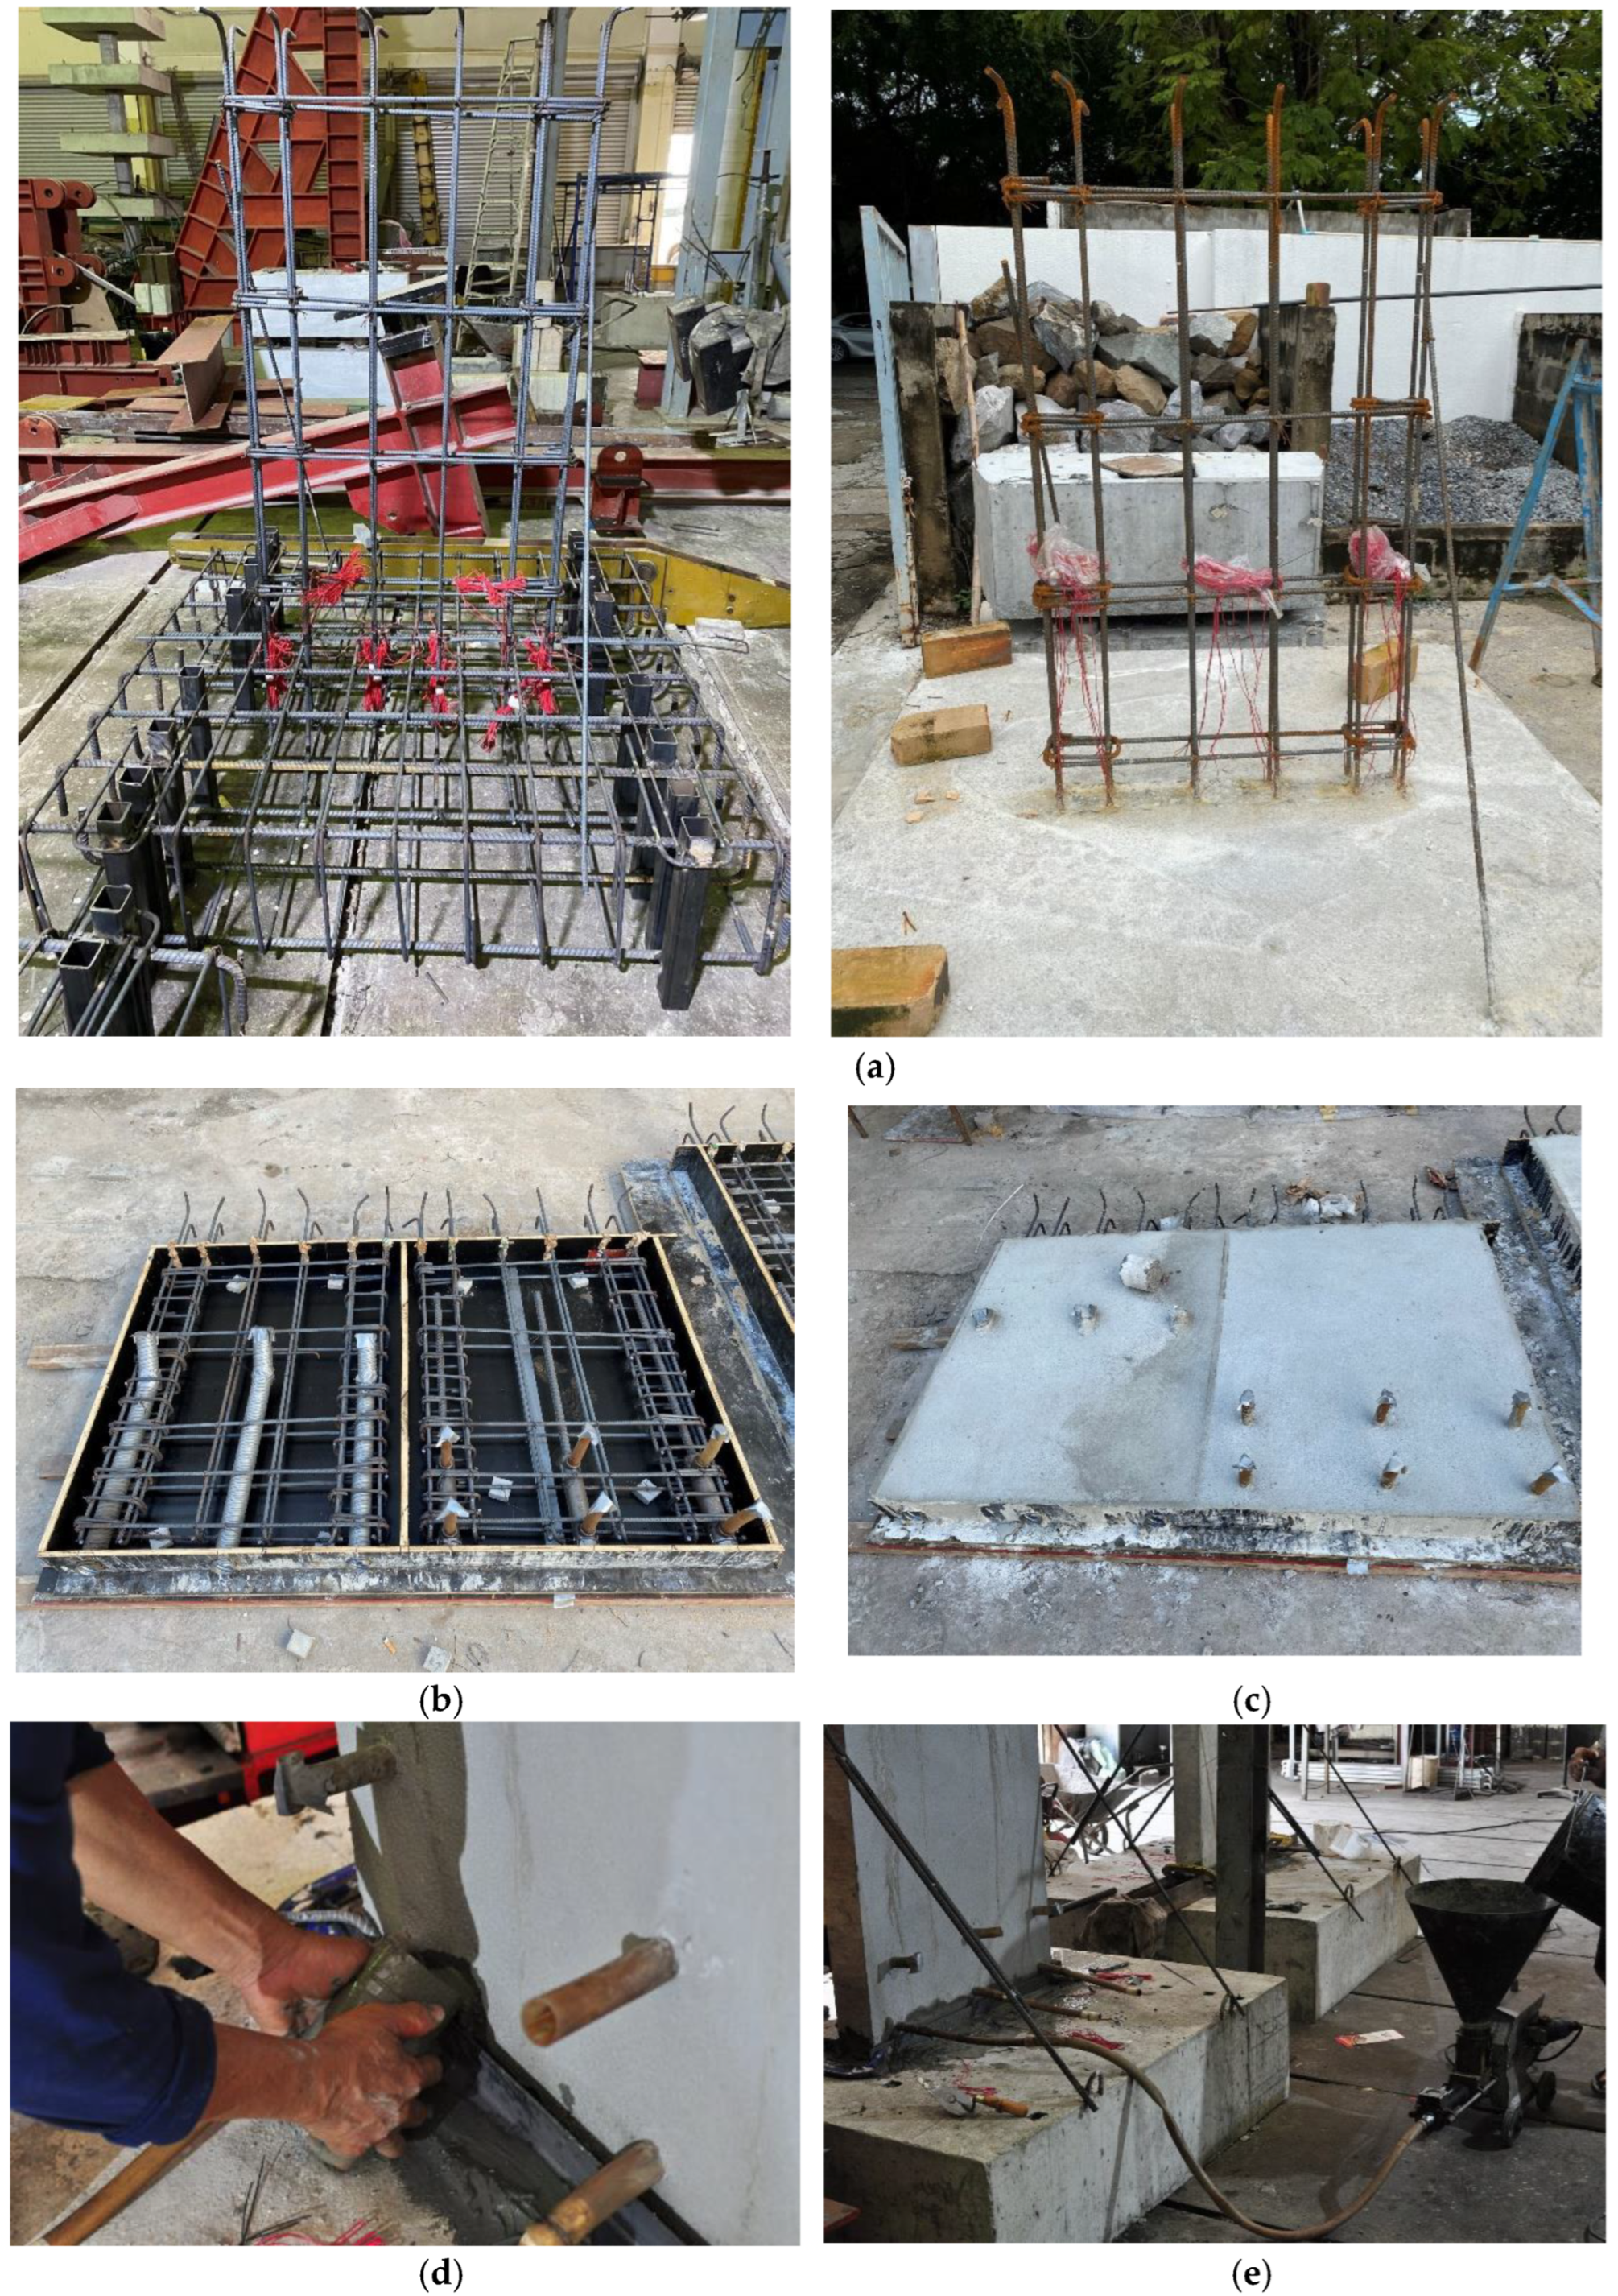
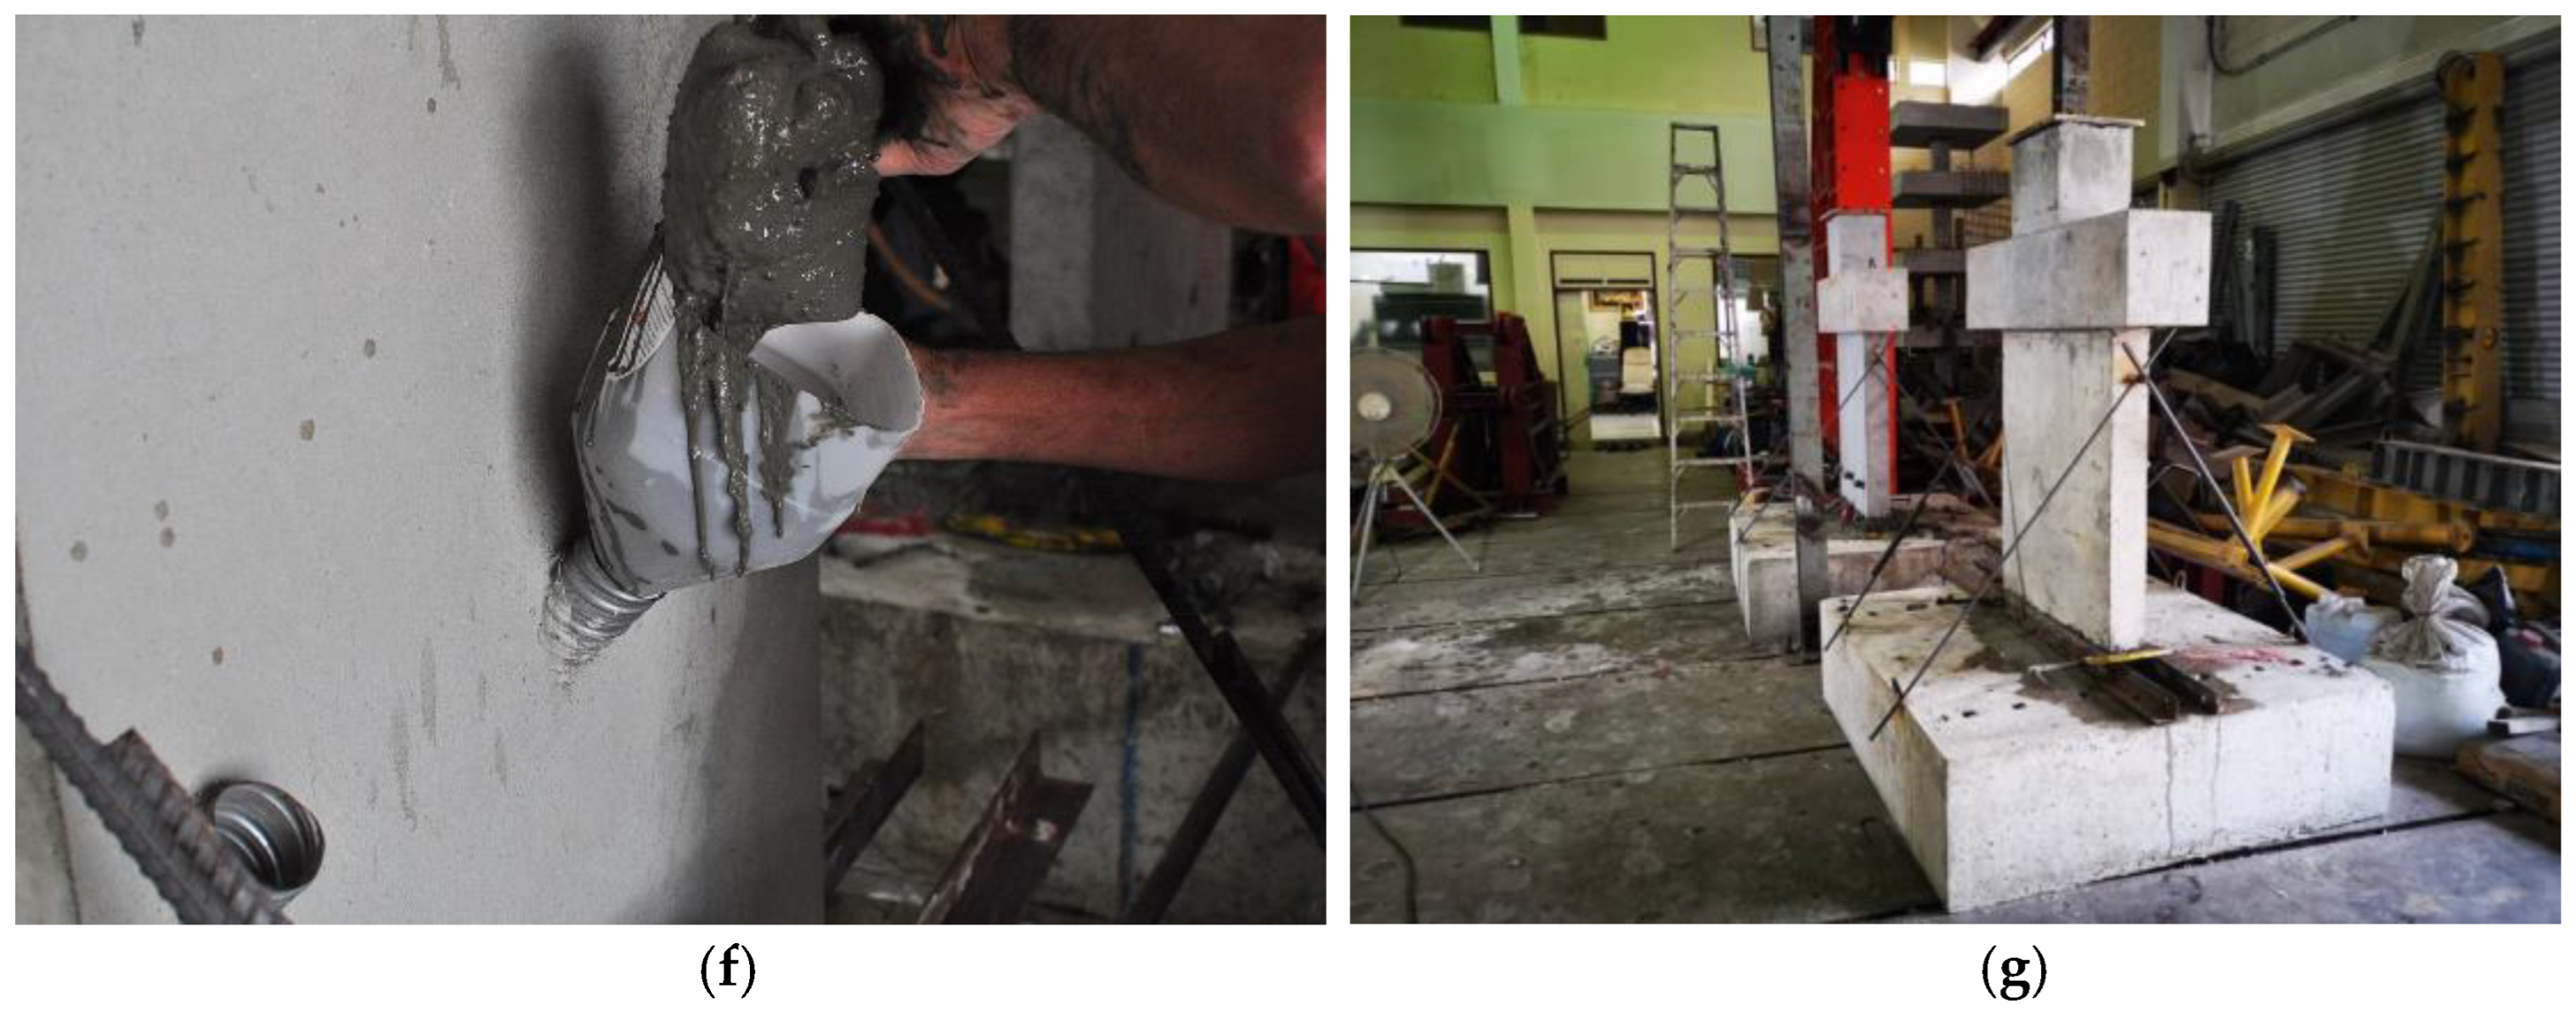
2.3. Construction Procedure

Currently, the most prevalent approach for connecting a PC shear wall to neighboring members involves the utilization of grouted sleeve splices (GSS) or corrugated duct splices (CDS) [1]. GSS, which were invented in the 1960s, have traditionally been widely used for connecting panels in PC shear walls or linking panels to the foundation. This method gained popularity due to its ease of construction and the relatively short time required for implementation [10,11,12]. However, their cost-effectiveness may be questionable [17]. Grouting defects can significantly impact the performance of PC shear walls [16,18]. Recently, corrugated duct splices (CDS) have gained significance due to their lower costs and ability to accommodate longer splice lengths, enhancing the tolerance for grout defects [17]. Since experimental studies that involve a direct comparison of these methods are scarce, this study chose to adopt these two methods to connect the shear walls with footings. The shear wall and footing of specimen RCWS were cast monolithically, as shown in Figure 2a, whereas the footings and shear walls were fabricated separately for specimens PCWS and PGWS. Corrugated ducts of diameter 50 mm and sleeves were embedded in the walls at prescribed locations (see Figure 2b). The PC wall panels with protruded duct and sleeve openings for grouting are shown in Figure 2c. The PC wall panels were then erected and placed above the footing, with corrugated ducts and sleeves concentrically located above the bars protruding from the footing. Finally, the gap between the walls and footing was filled using a high-strength grout, followed by the grouting inside the corrugated ducts and sleeves.

2.4. Material Properties
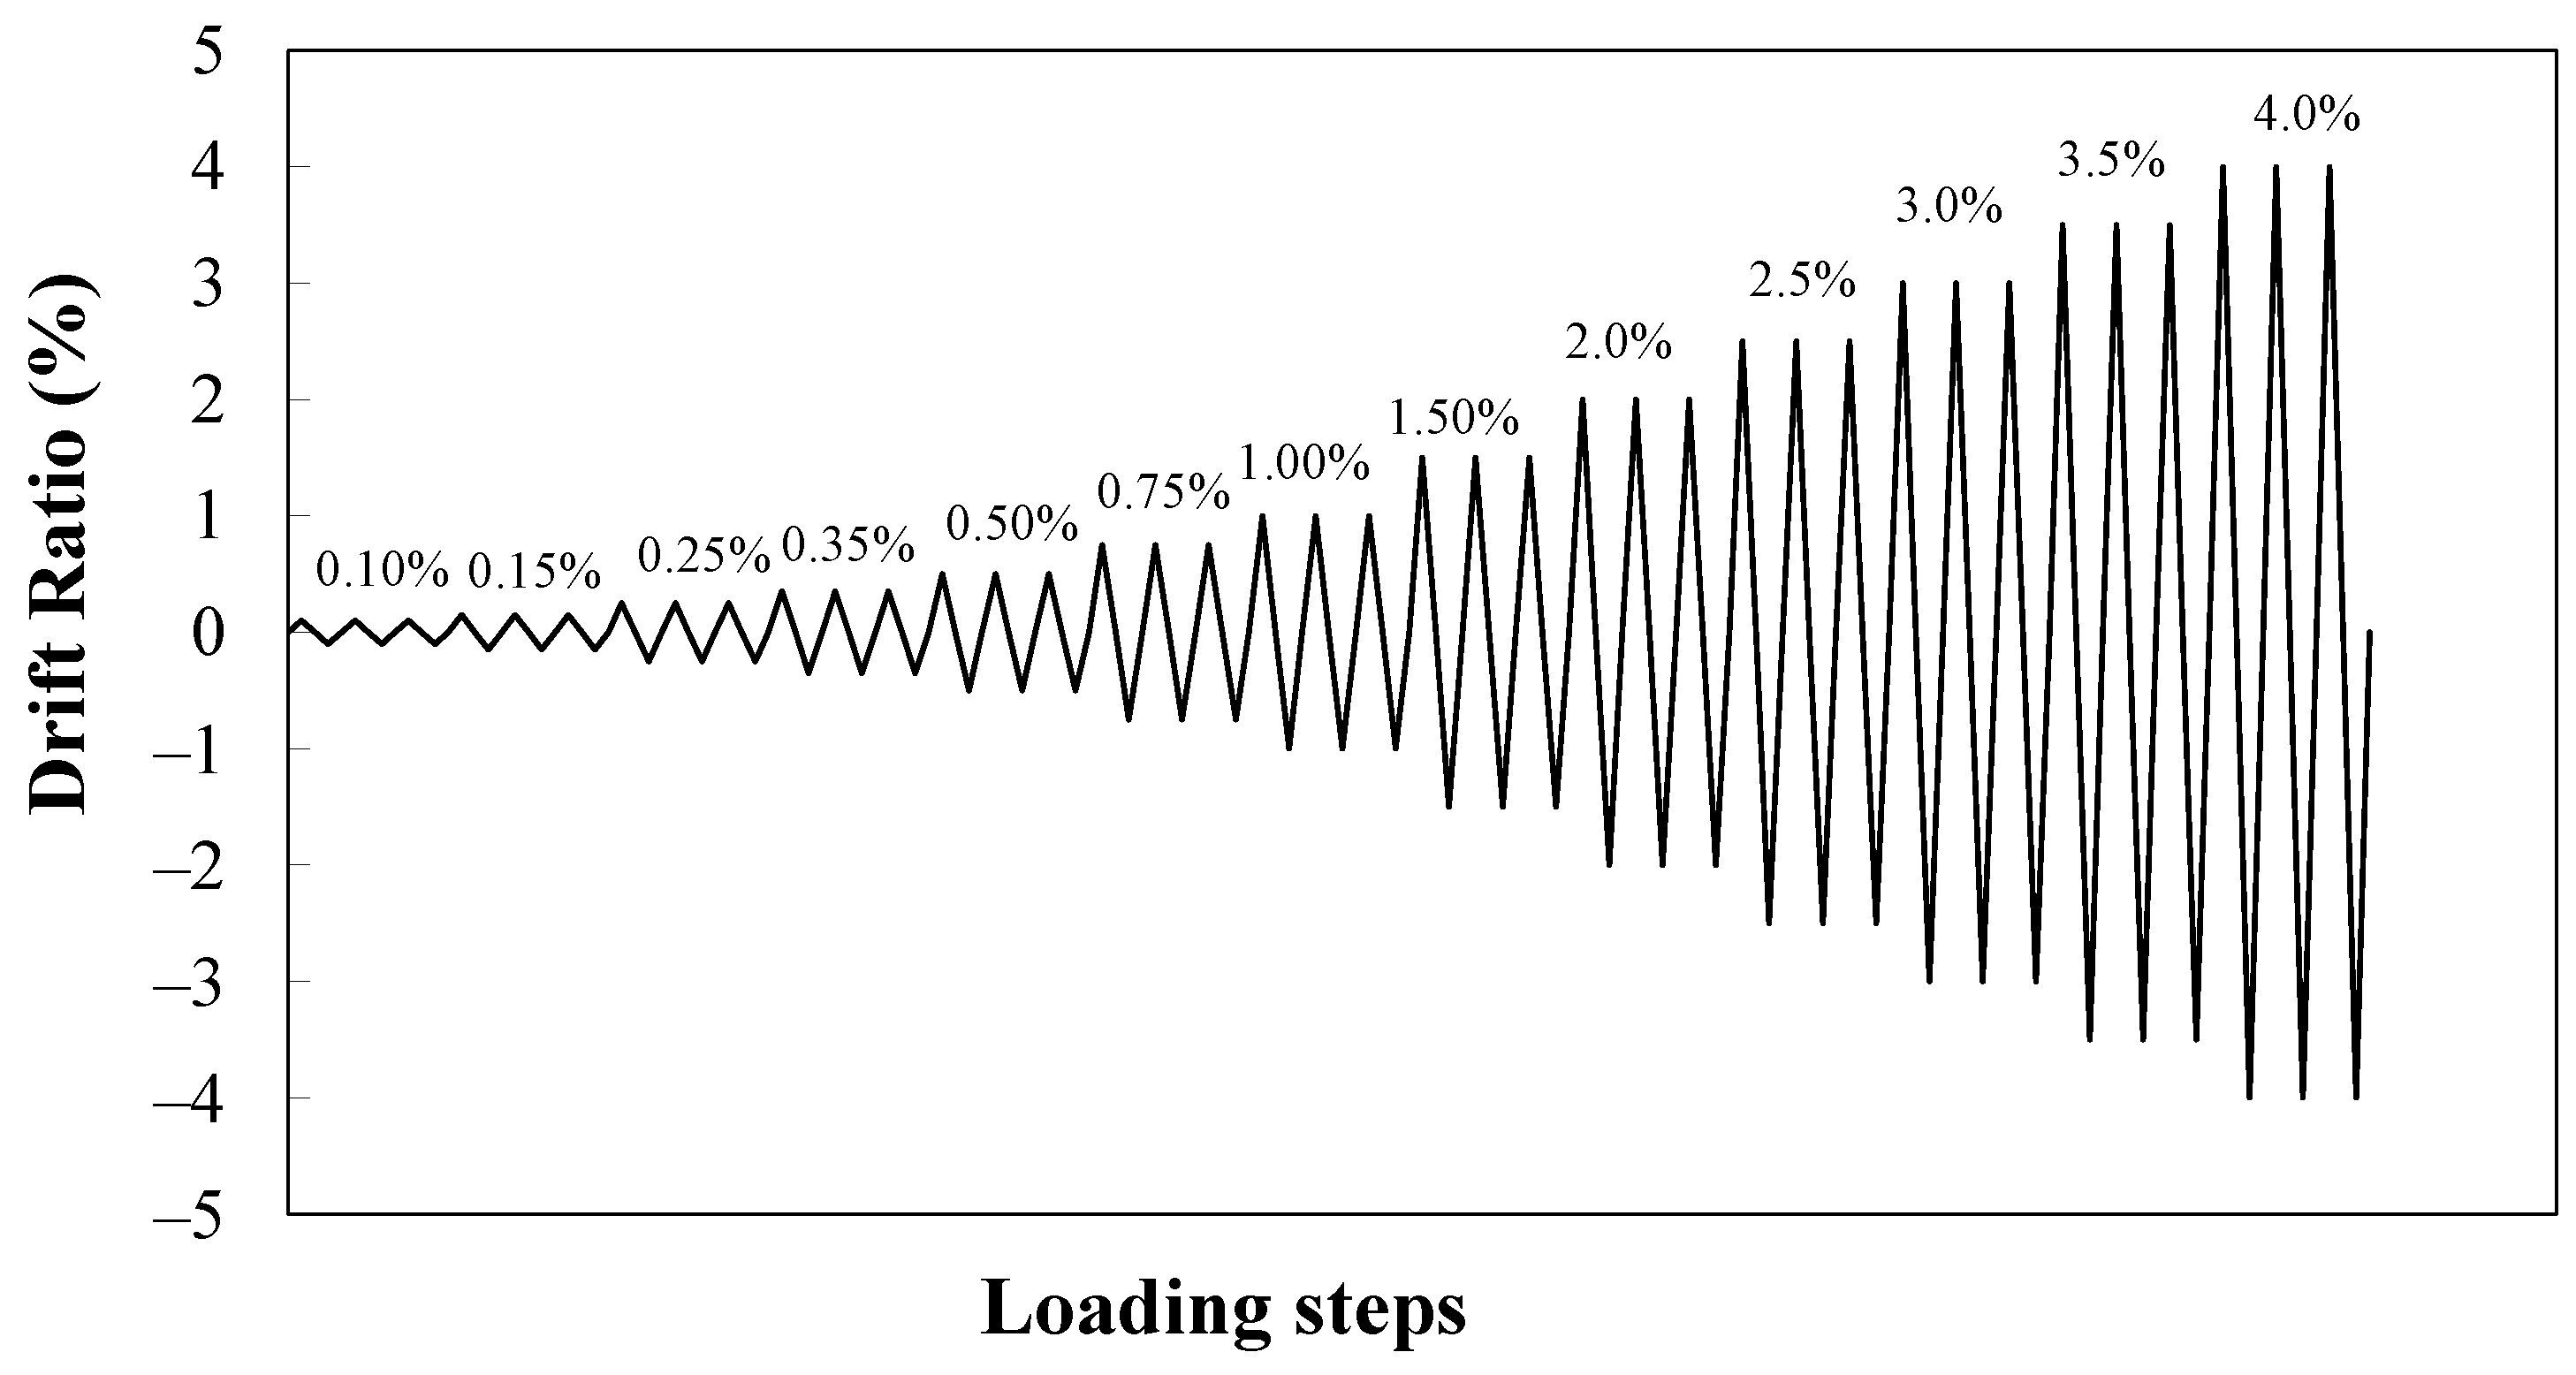
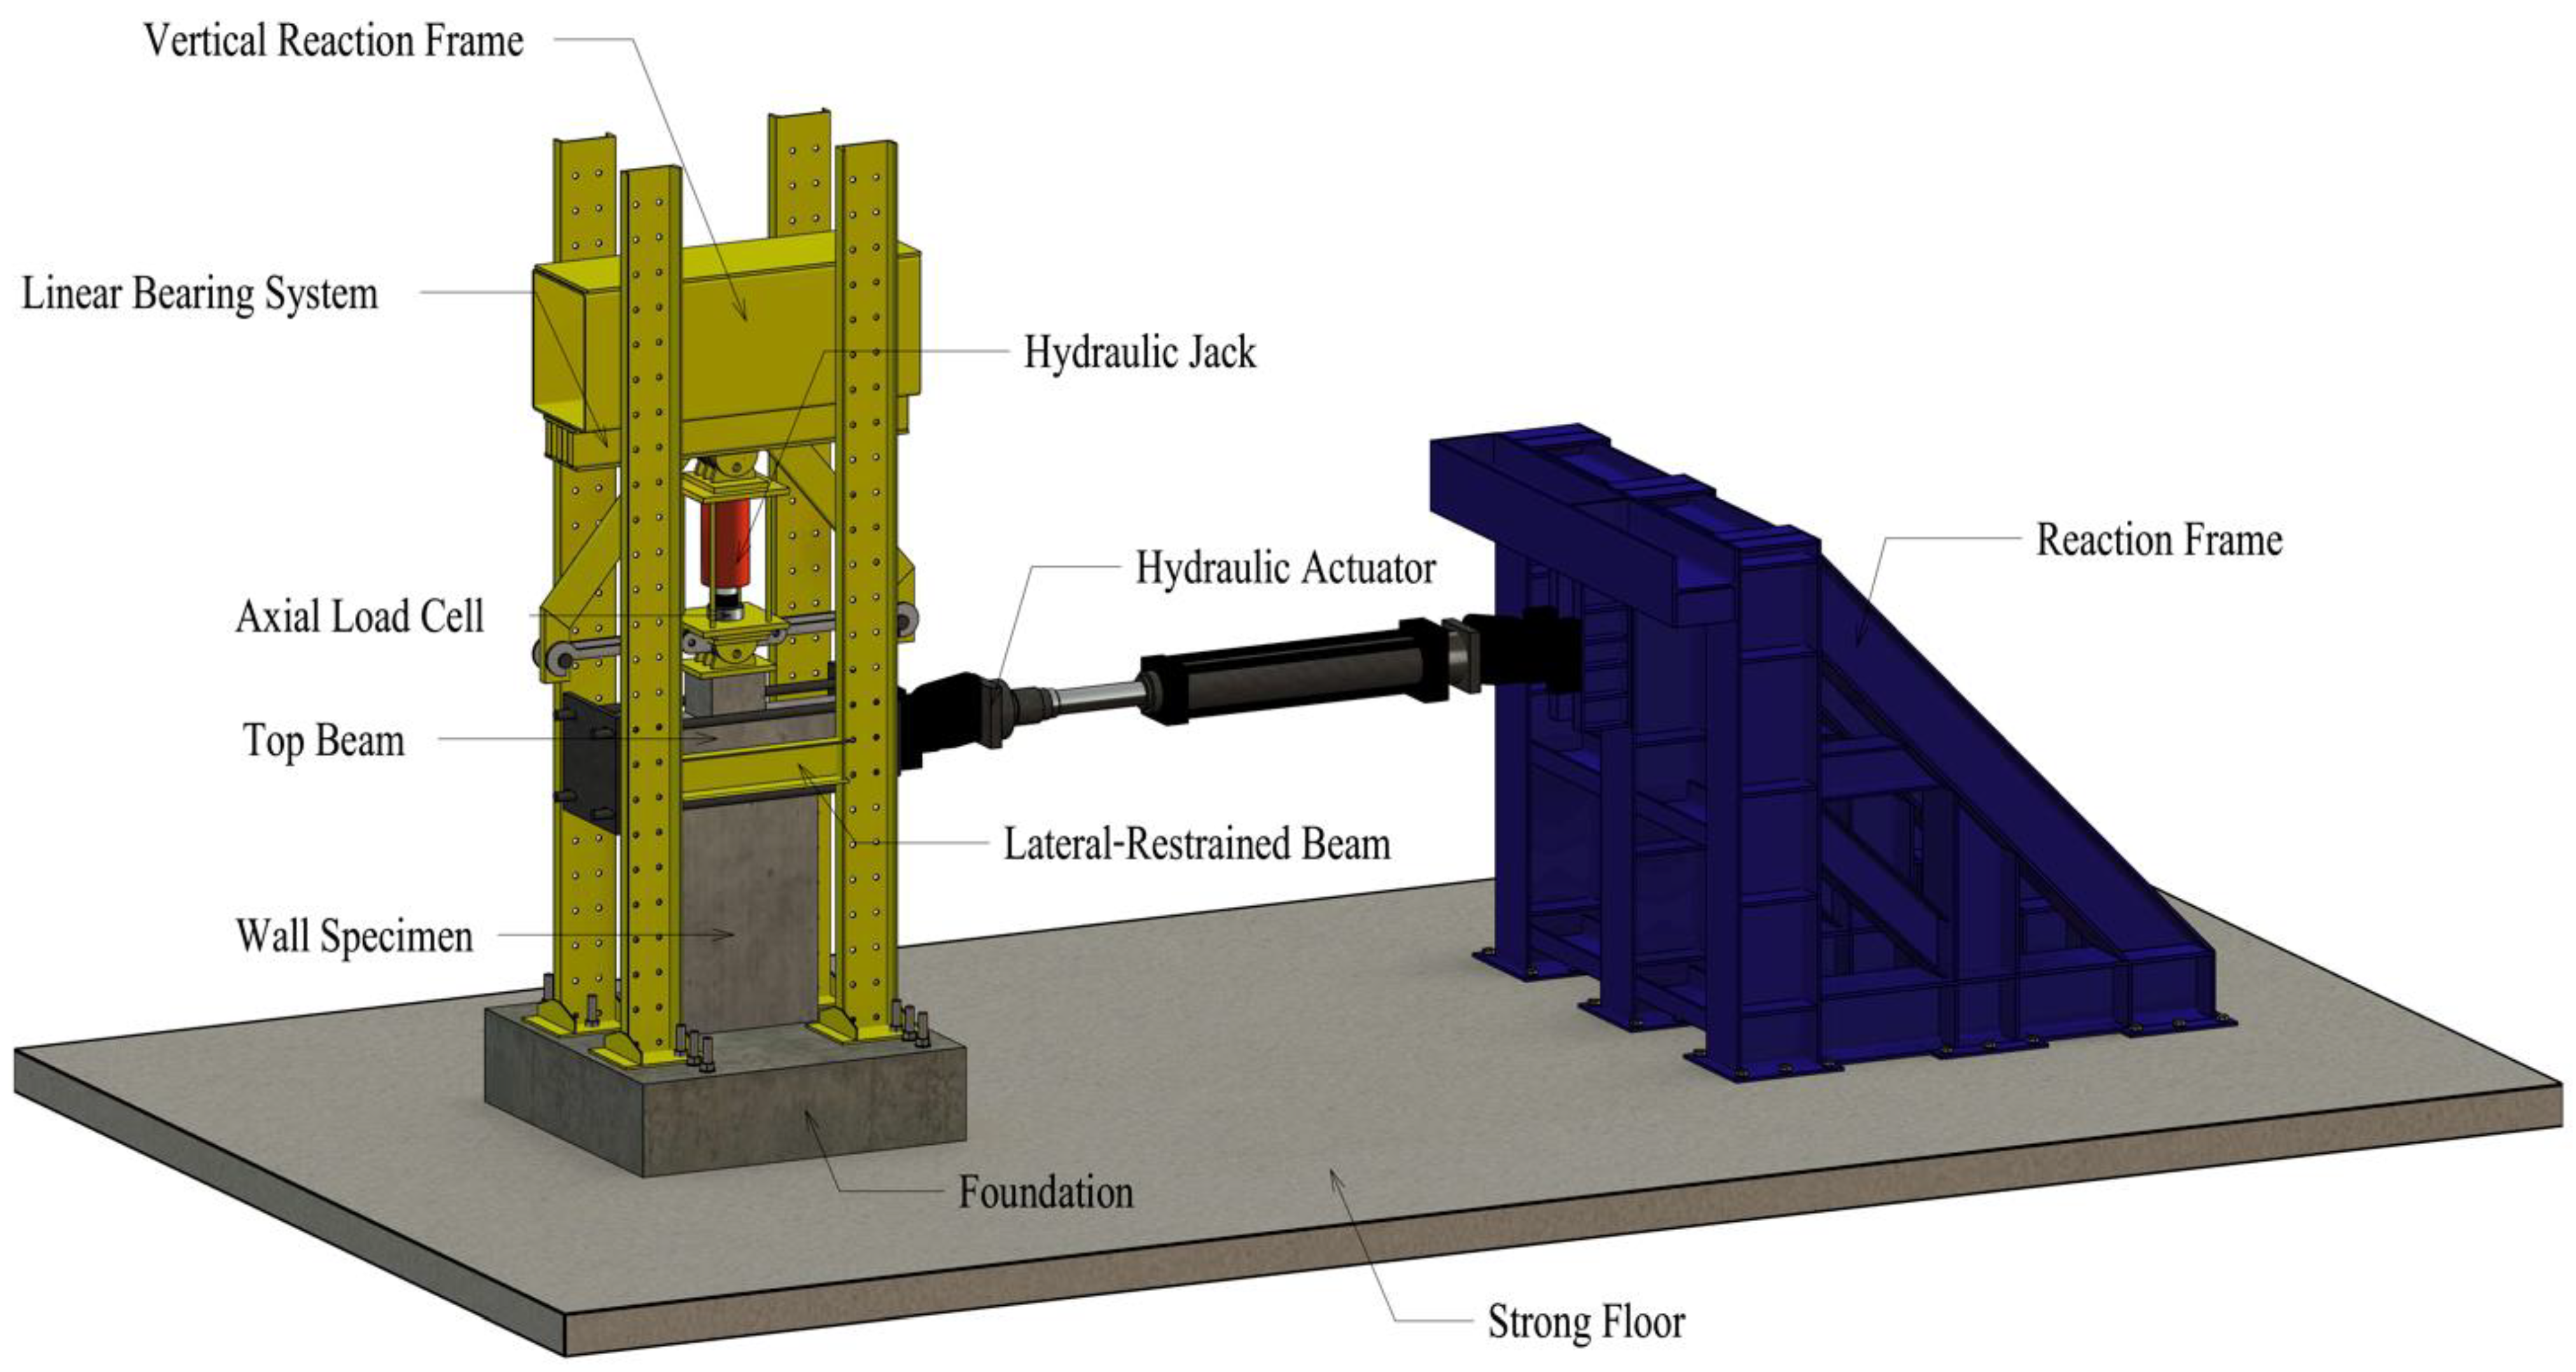
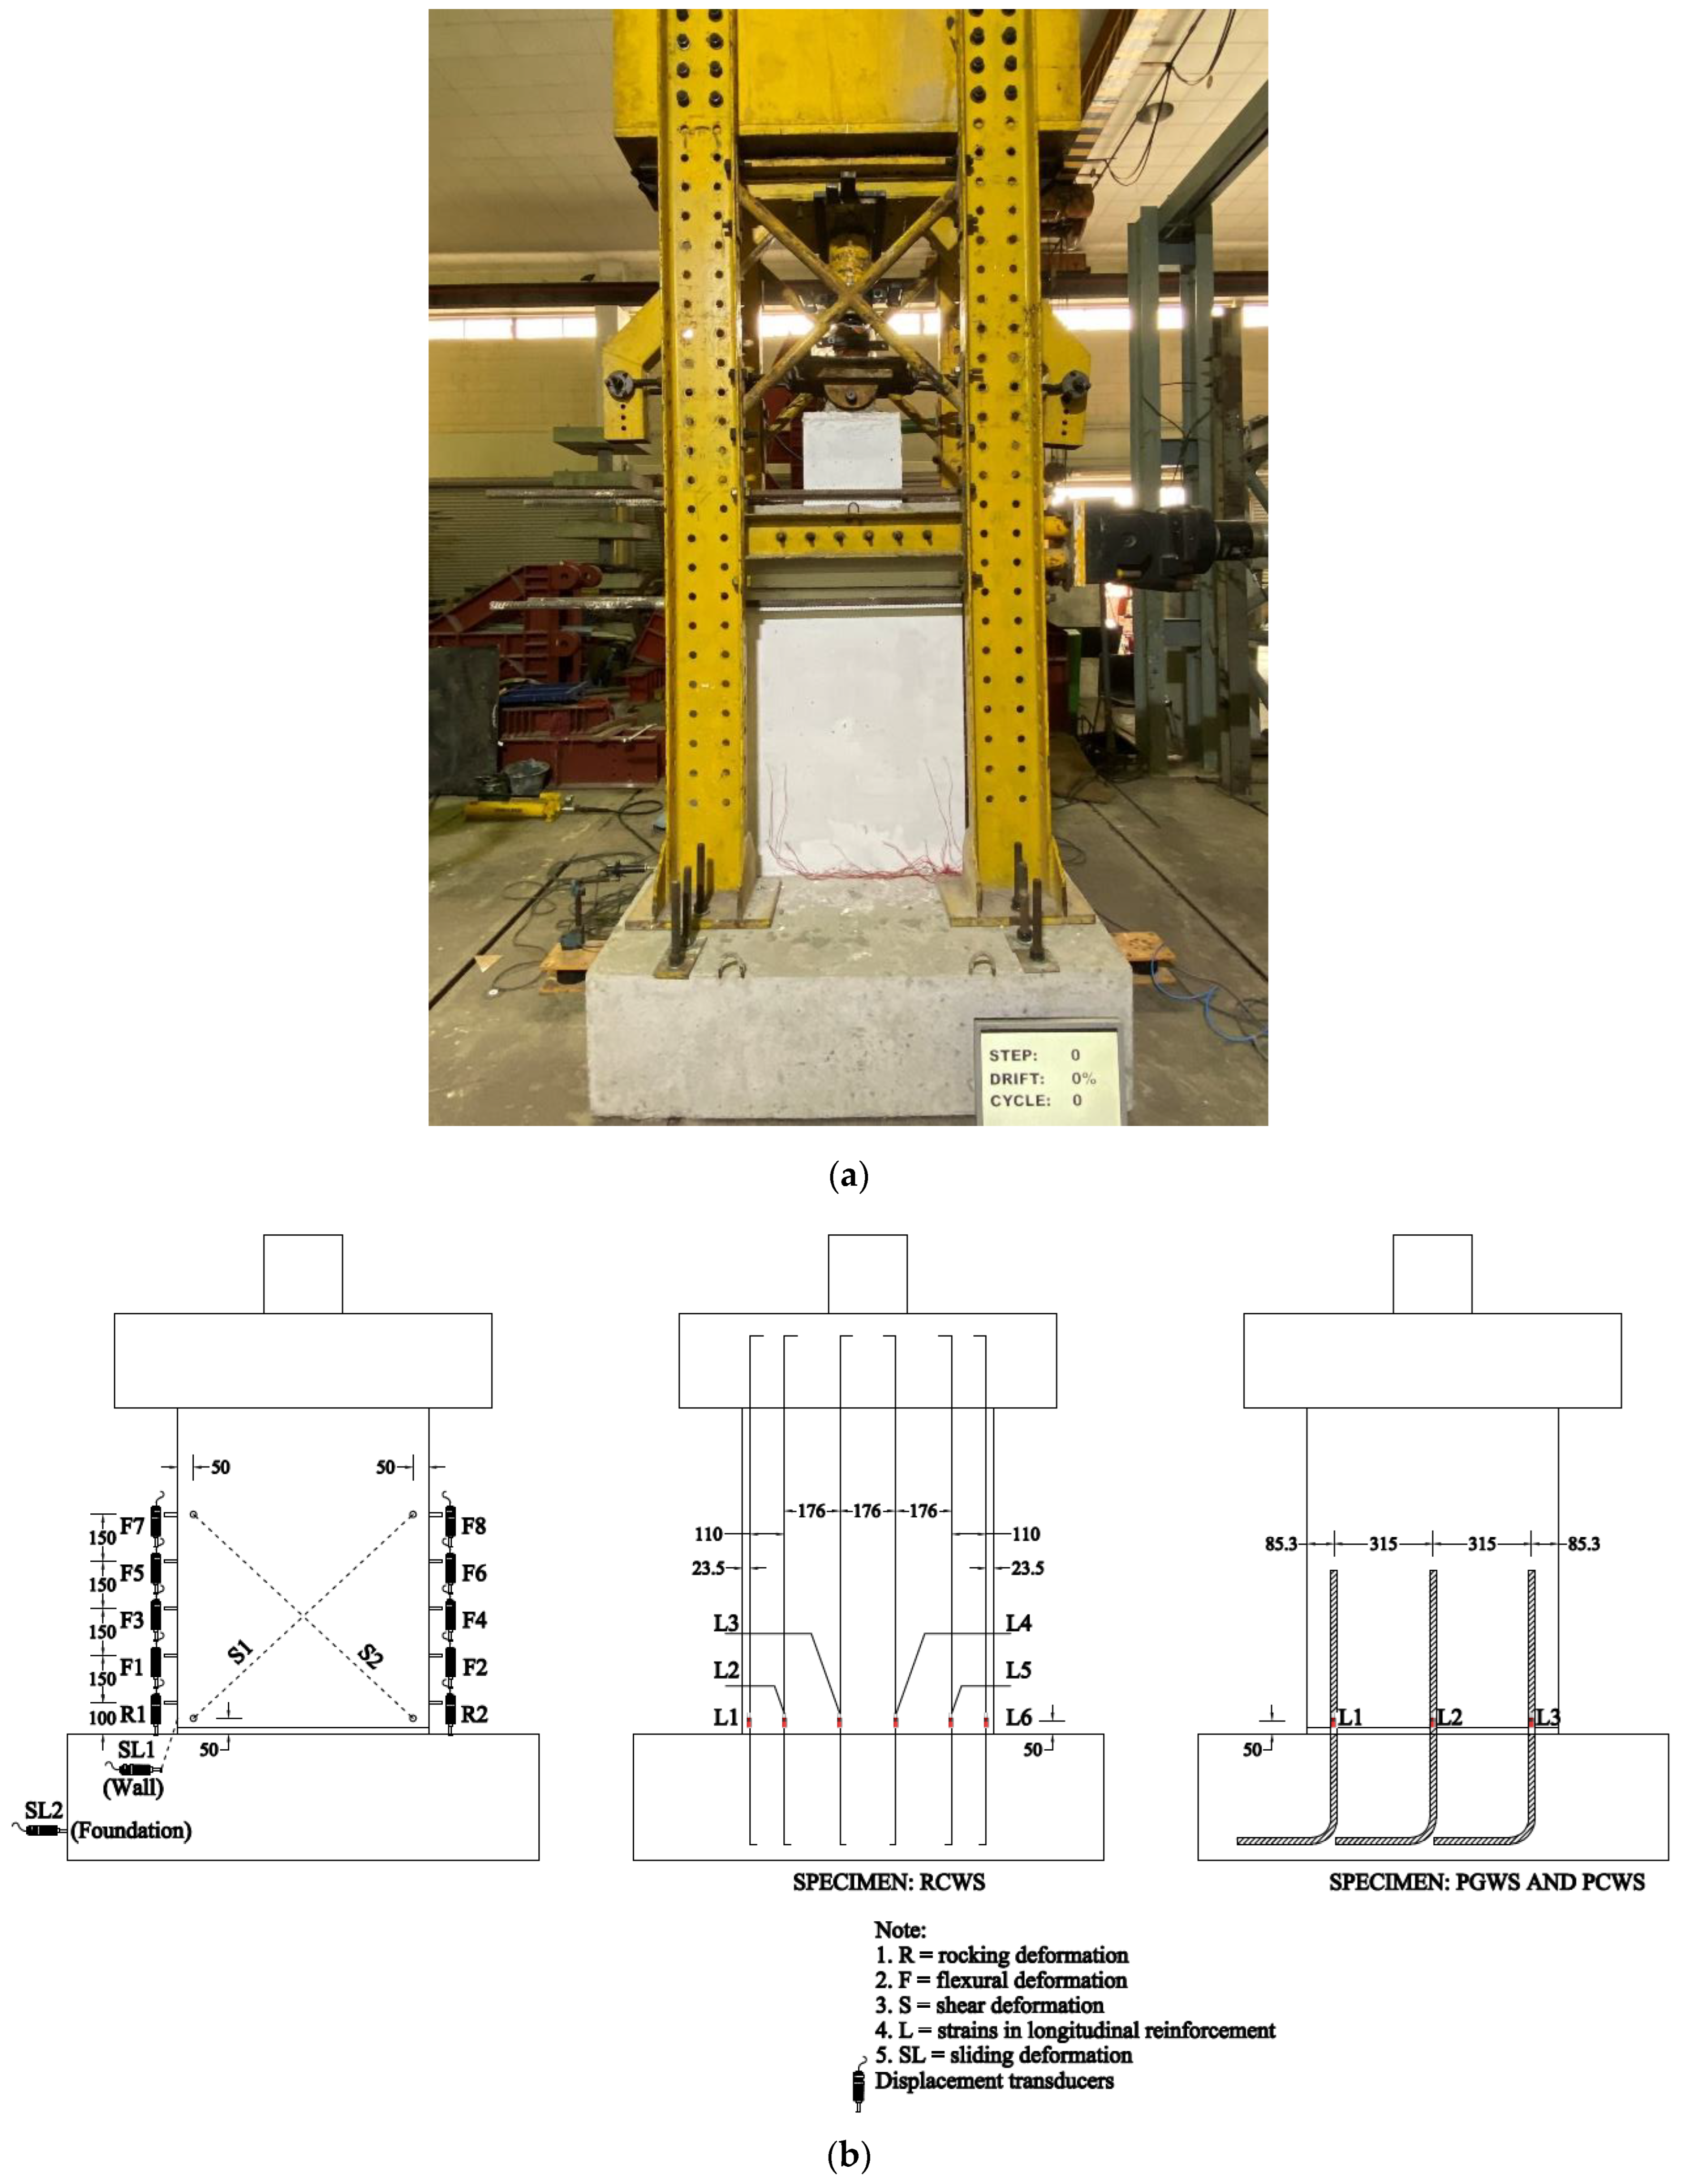
The footings of all beams were cast using a single batch of concrete with a cylindrical strength of 34.13 MPa. The concrete used for the fabrication of specimens RCWS, PCWS, and PGWS was obtained from a single batch with a cylindrical strength of 32.68 MPa on test day. The properties of the grout and concrete are listed in Table 2, whereas the properties of steel bars are listed in Table 3. High-performance non-shrink cement (product name SikaGrout-214-11 TH) was used to prepare high-strength grout. For concrete, three cylinders of standard size, i.e., 150 × 300 mm (Diameter × Height), were used, whereas for grout, three cubes of size 50 × 50 × 50 mm were used for strength properties.

2.5. Test Setup

All specimens were subjected to displacement-controlled reverse cyclic loading. The amplitudes of the cyclic loading history are plotted in Figure 3. Three cycles at each drift ratio were applied. In addition to the cyclic loading, all specimens were subjected to a constant axial load of 150 kN. This axial load was equivalent to an axial load ratio of 0.05.
A typical test setup is shown in Figure 4a. The axial load and cyclic loading history were applied using hydraulic actuators, whereas the intensity of the applied load at each time instant was monitored with the help of load cells. Several linear variable differential transducer LVDTs were installed to record the deformation of shear walls, as shown in Figure 4b. A logger was used to record the applied load history. Strain gages were attached to the longitudinal bars at the wall and foundation junction in all specimens to monitor the longitudinal strains, as shown in Figure 4b.

3. Experimental Results

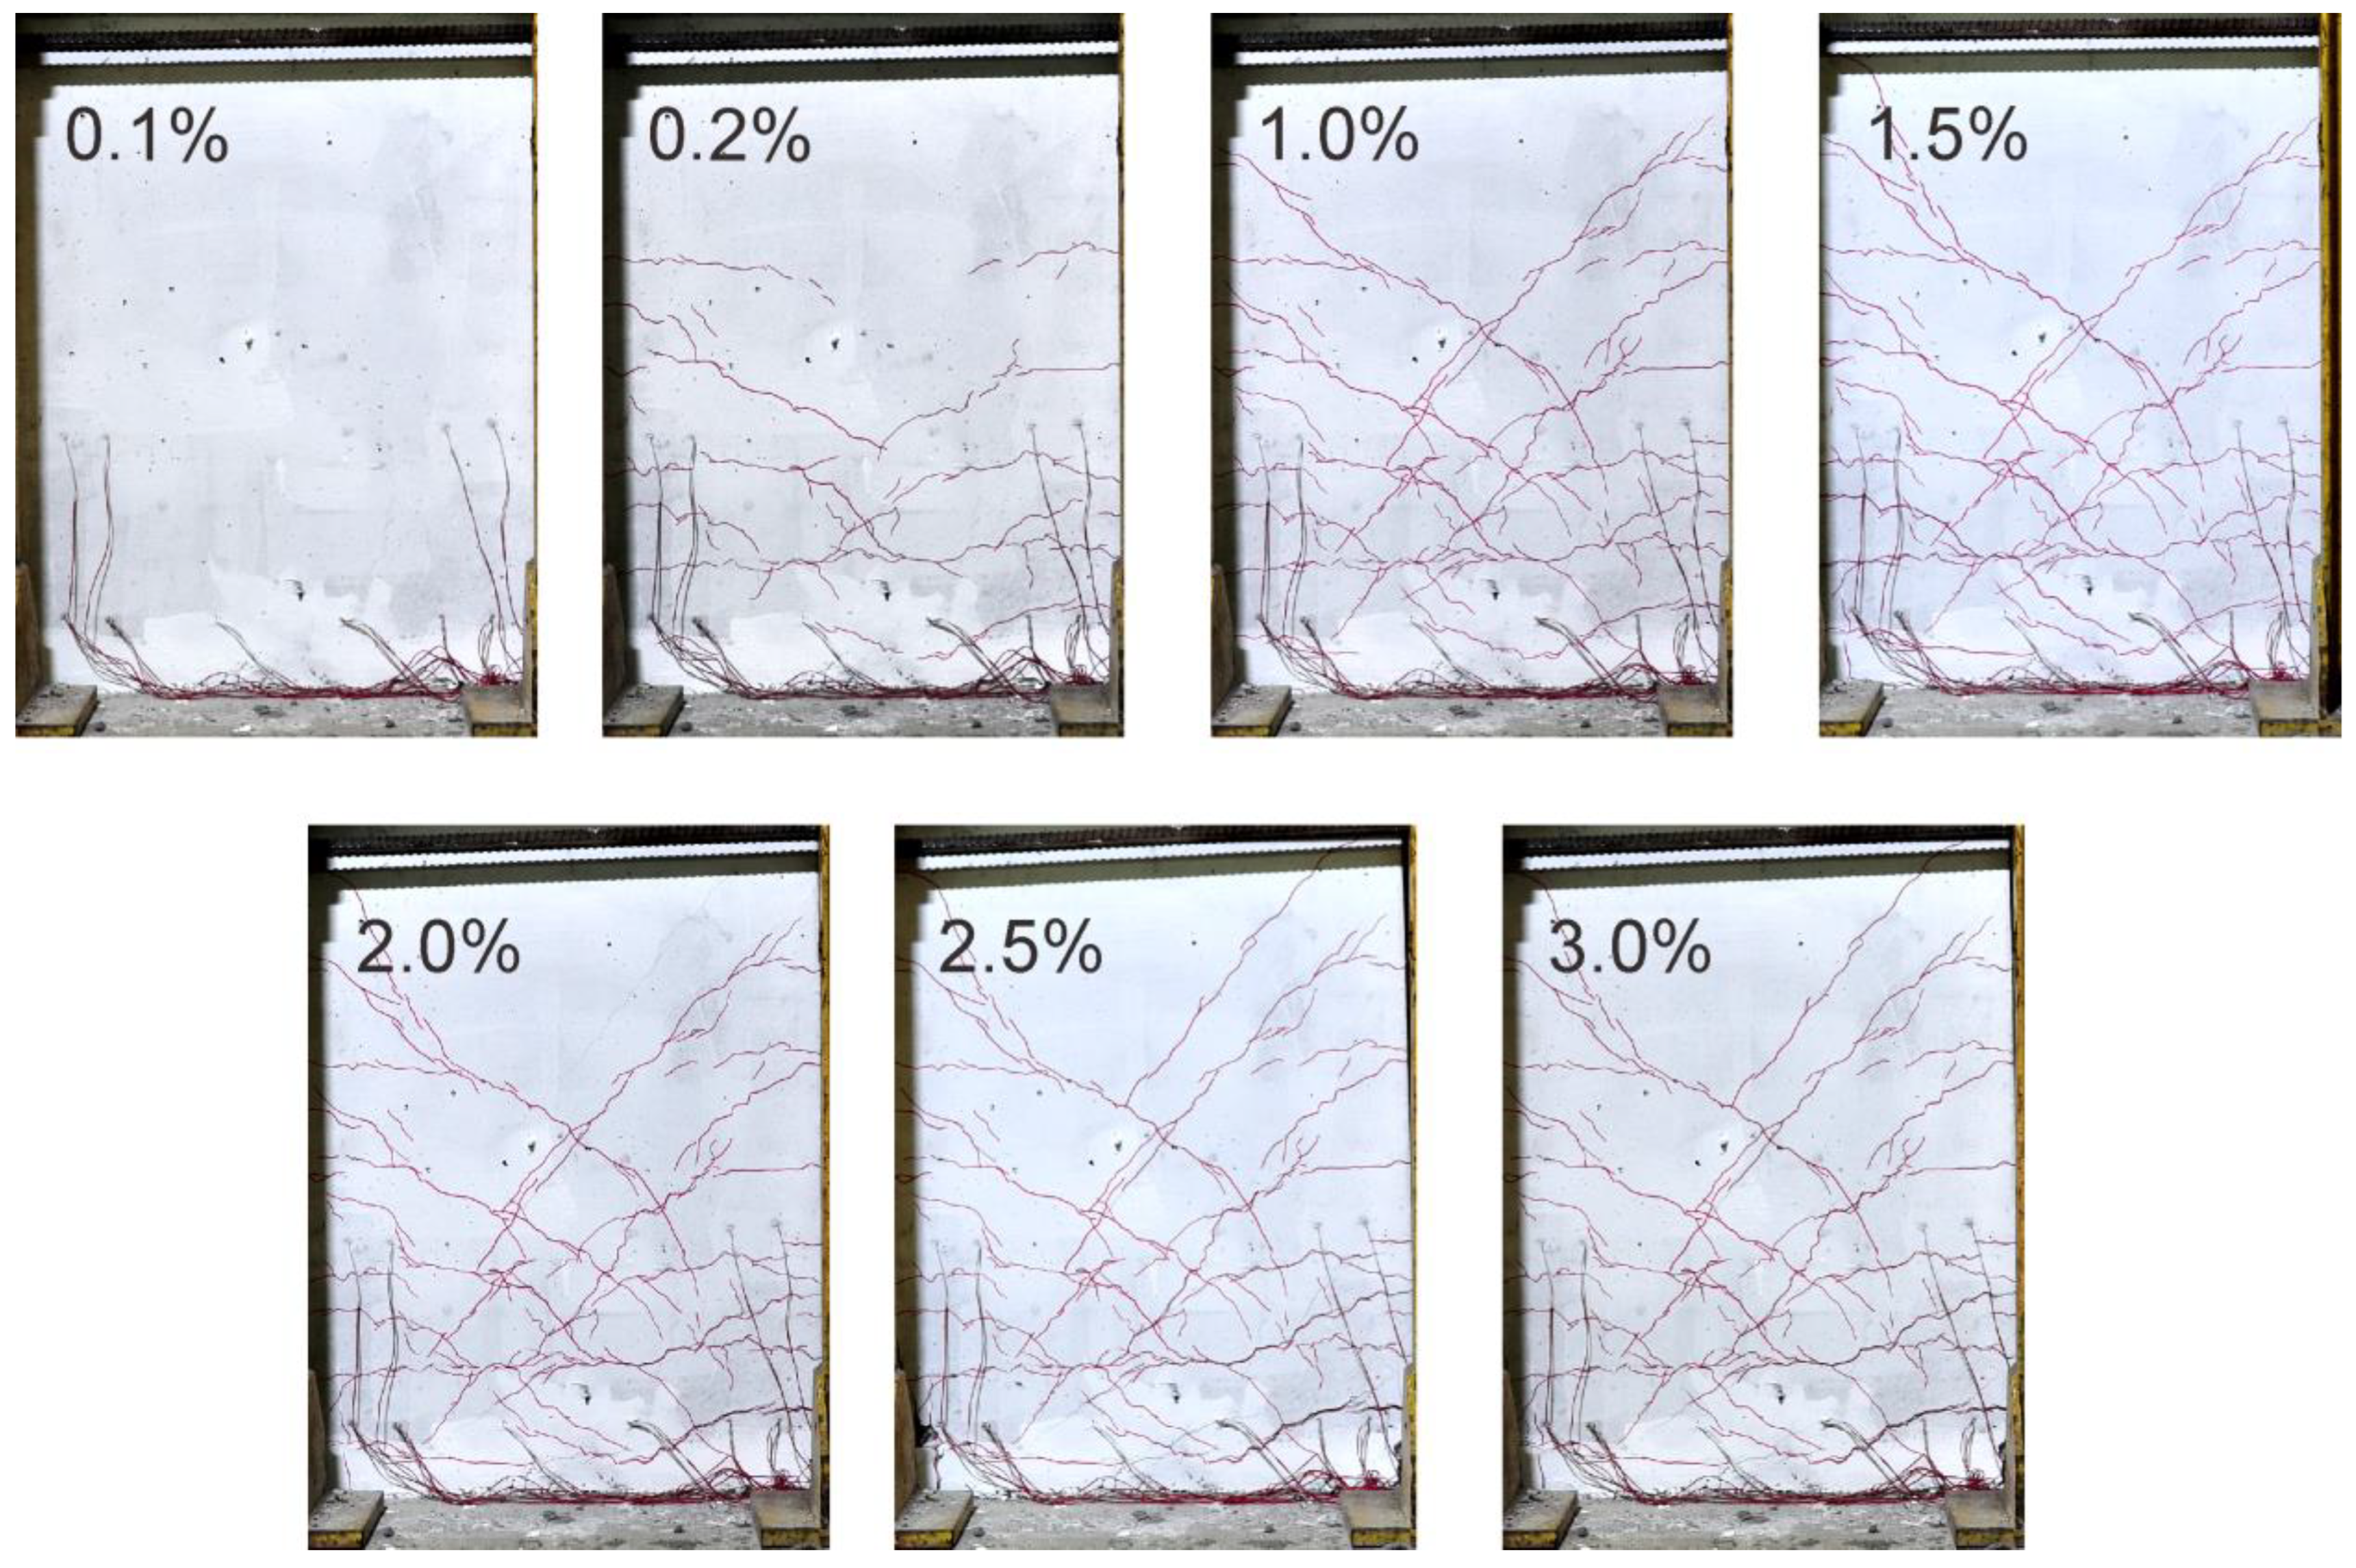
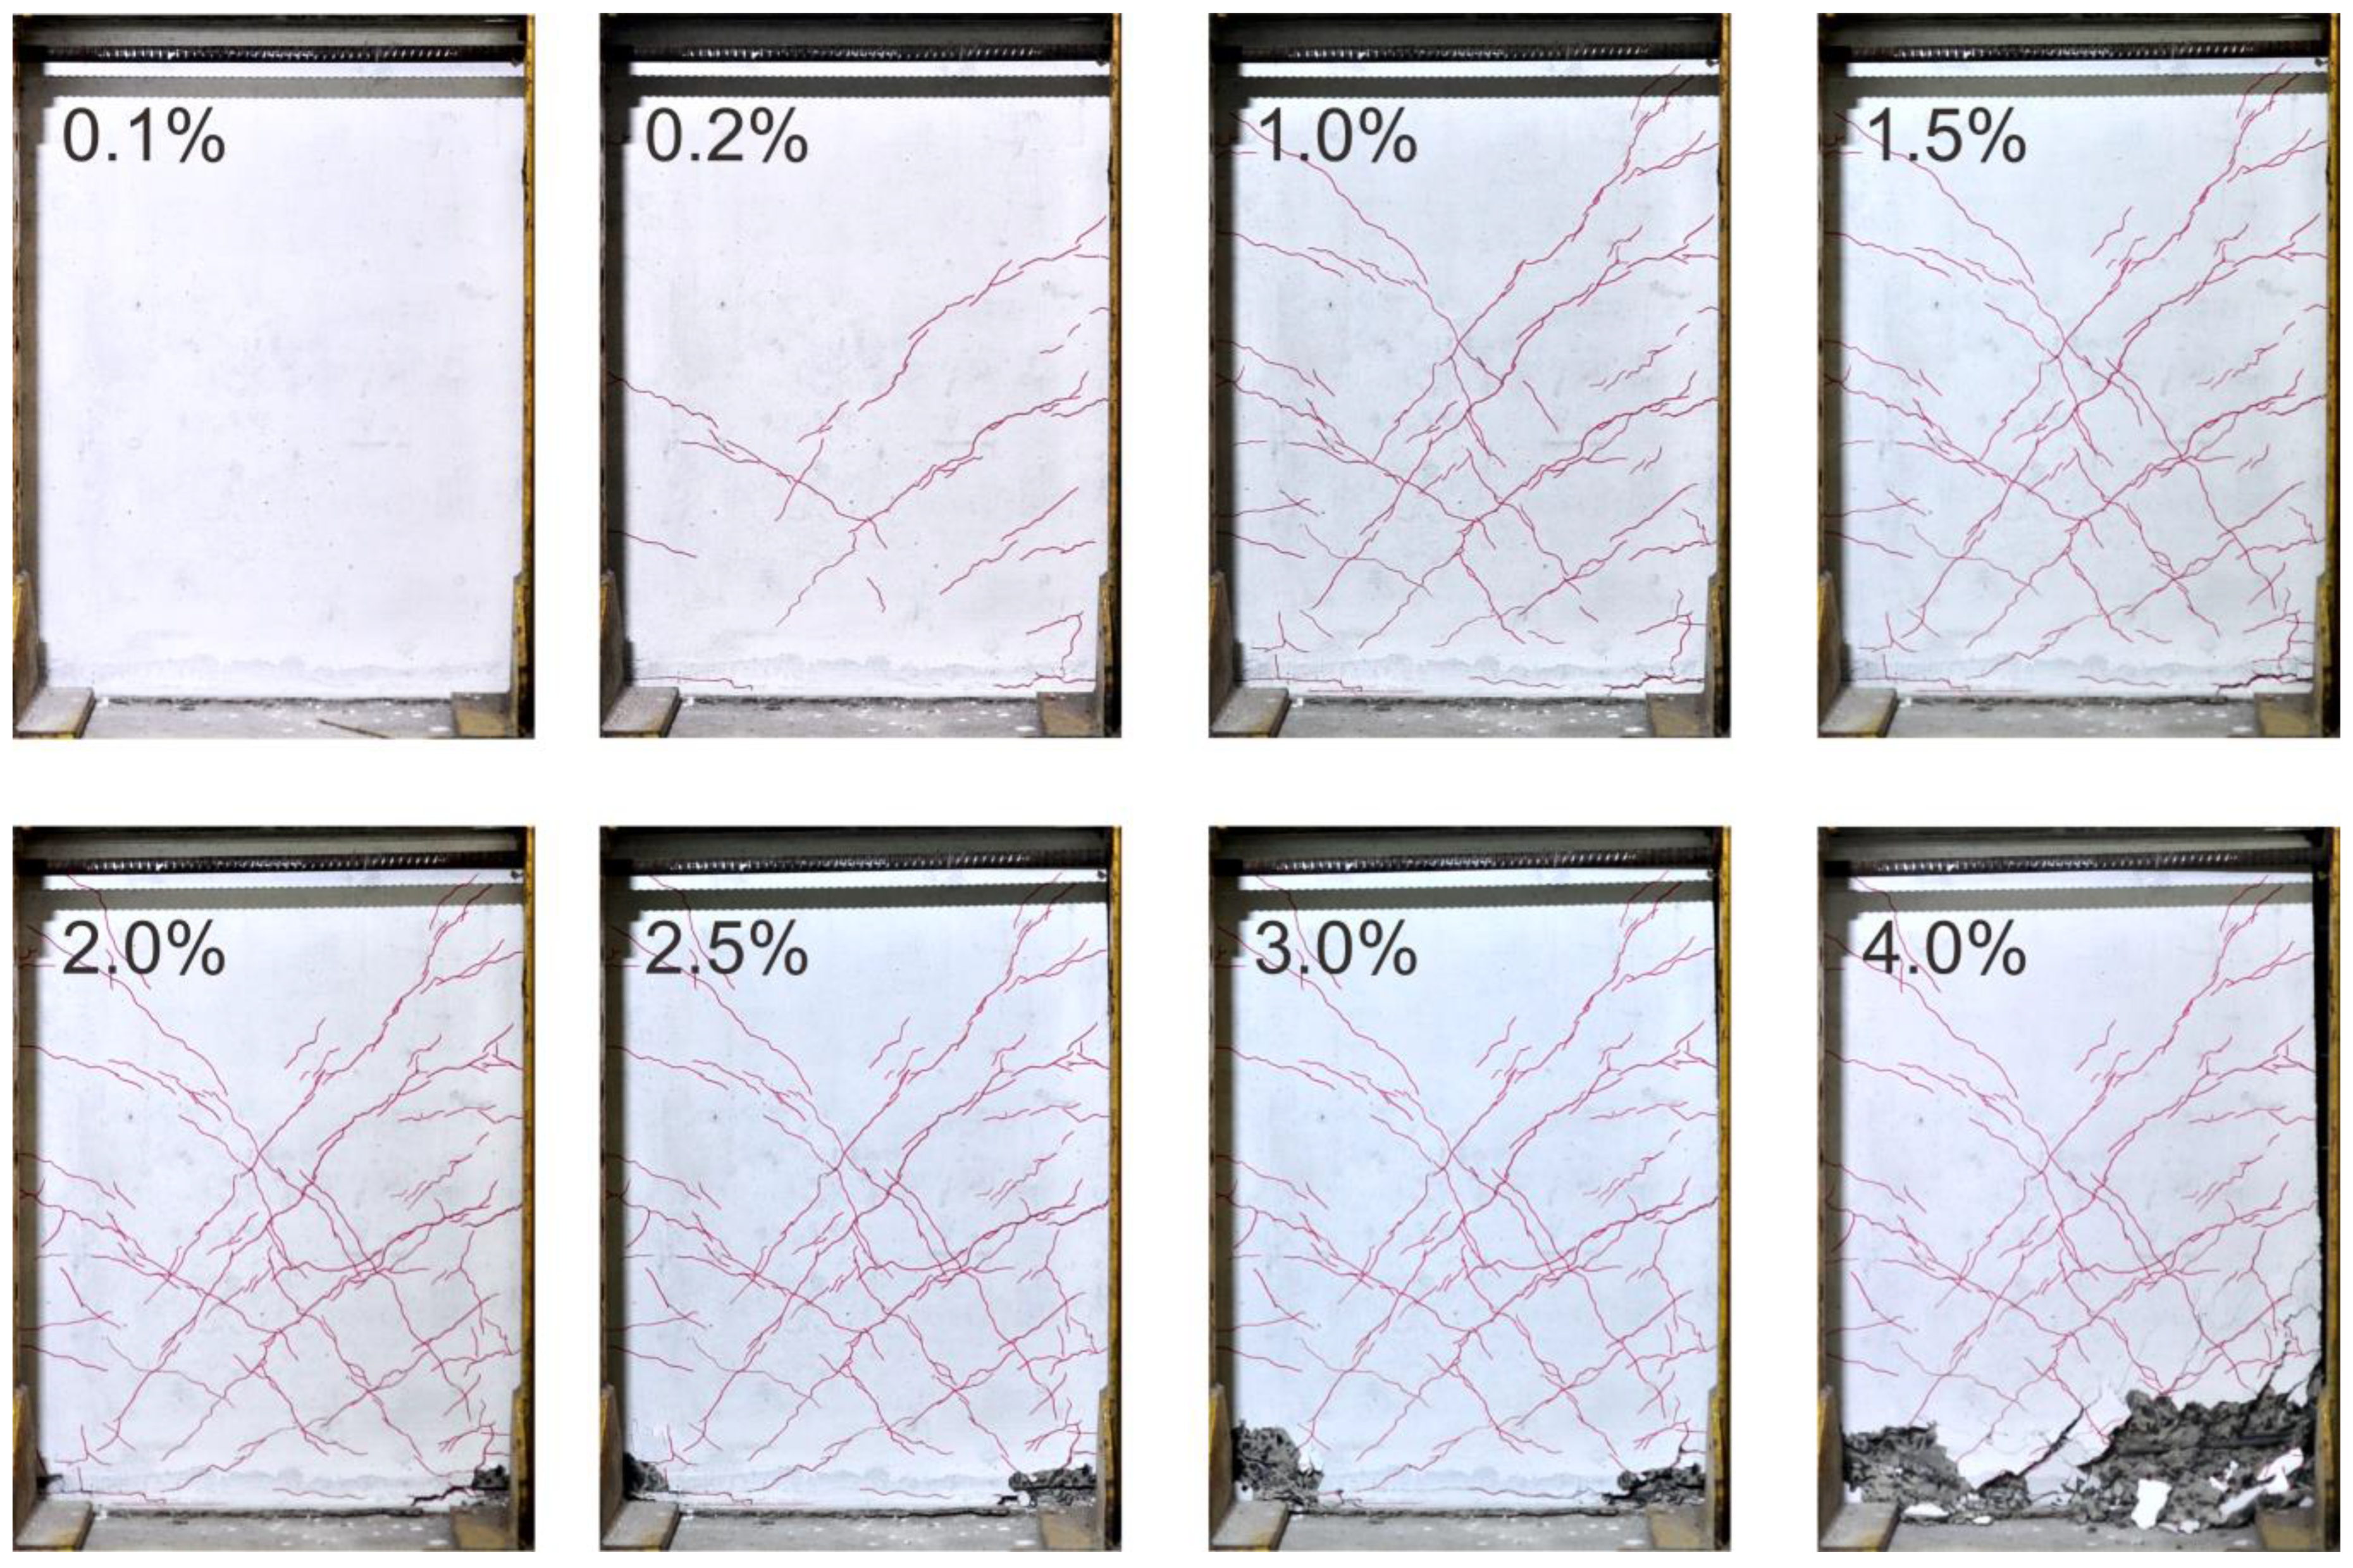
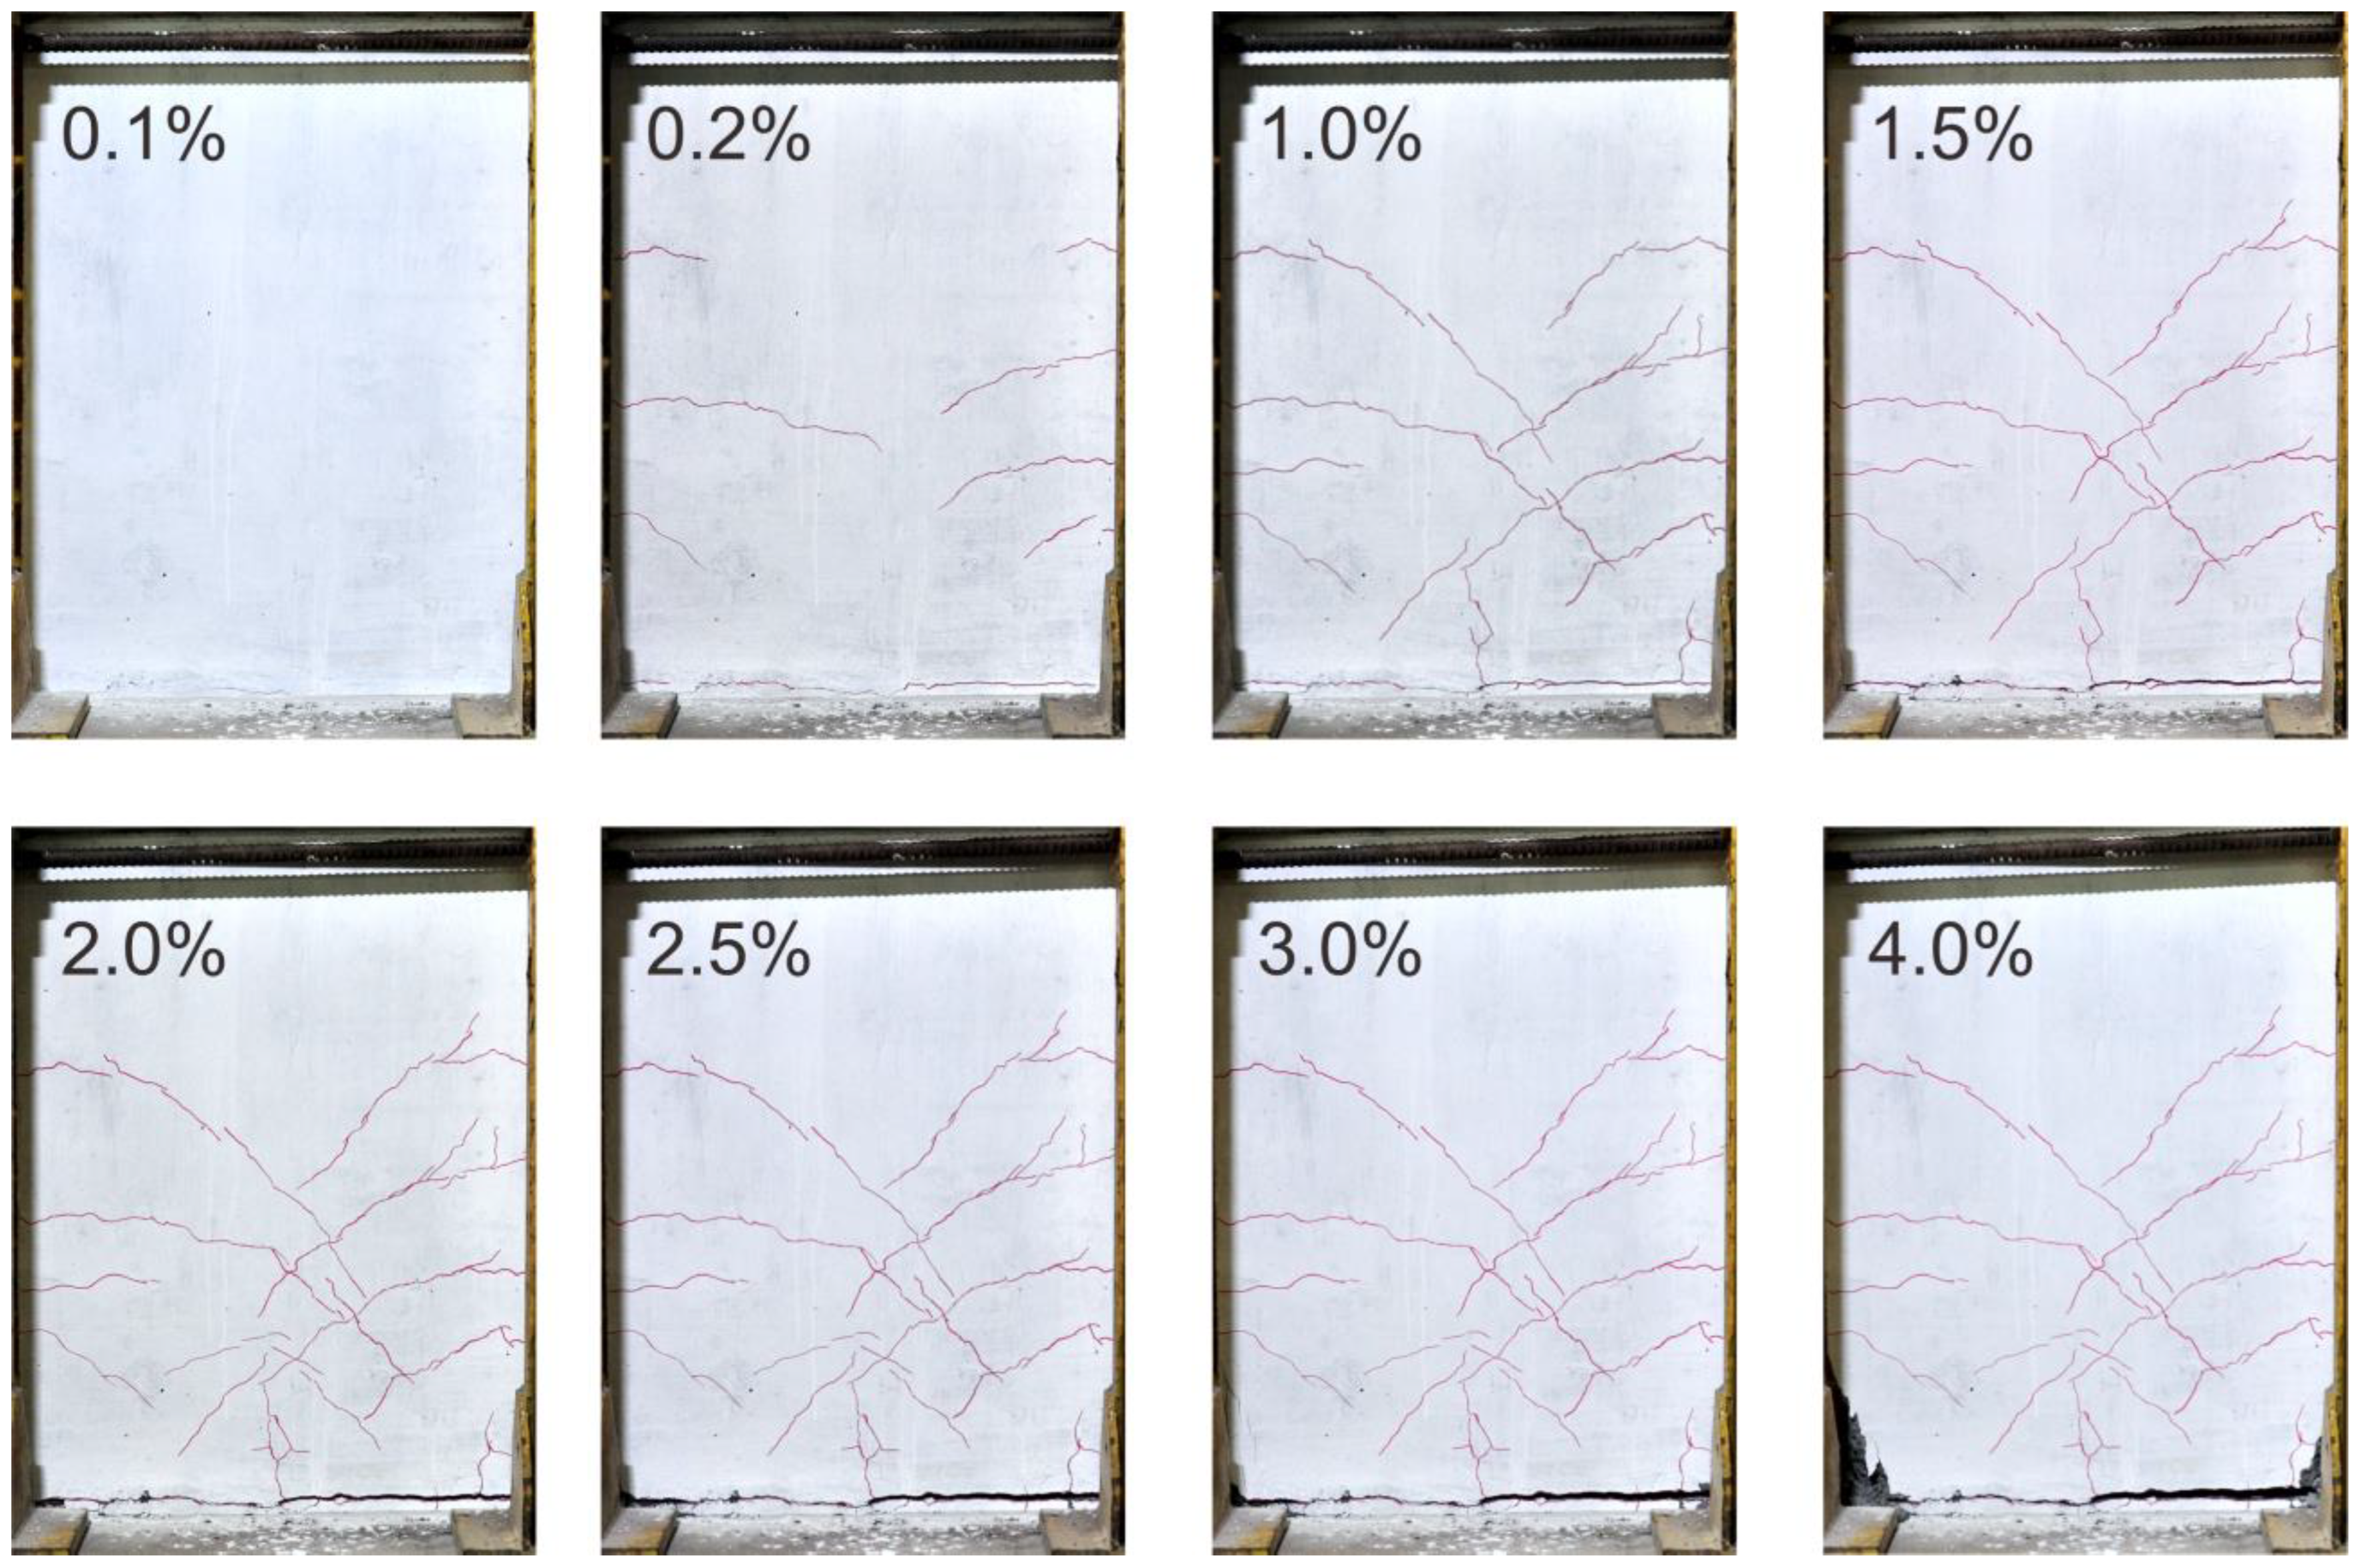
3.1. Crack Patterns and Failure Modes

The evolution of cracks in the specimen RCWS is shown in Figure 5. At a low drift ratio of 0.1%, cracks at the base were observed. The orientation of cracks dictated the presence of shear-dominated behavior at small drift ratios. At a drift ratio of 0.2%, significant horizontal cracking at both sides of the specimen RCWS was observed, suggesting flexural domination in addition to the existing shear forces. By increasing the drift ratios, both the shear and flexural cracks widened and propagated toward the middle. Several flexural cracks were found to merge with existing shear cracks, indicating a flexural-shear behavior. At a drift ratio of 3%, significant diagonal cracking was observed along the full height of specimen RCWS. In addition, considerable flexural cracks were observed at the base. At high drift ratios, the specimen RCWS exhibited wide cracks at the wall-footing junction, and the rocking behavior was noticed.
The evolution of cracks in the specimen PCWS is shown in Figure 6. Unlike specimen RCWS, significant shear and flexural cracks were not observed in the specimen PCWS until a drift ratio of 0.2%. Beyond the drift ratio of 0.2%, shear and flexural cracks started to appear. At a drift ratio of 1%, the quantity of shear and flexural cracks was significant, and existing cracks propagated toward the centerline of the specimen. Cracks at the wall-footing junction appeared at low drift ratios, and their sizes increased as the loading progressed. At a drift ratio of 2.5%, concrete crushing was observed near the corners of the junction. The concrete crushing was predominant at a drift ratio of 4%.
Crack patterns at various drift ratios in the specimen PGWS are shown in Figure 7. Flexural behavior was found to be dominant till a drift ratio of 0.2% in the form of horizontal cracks. The smallest number of shear cracks at a drift ratio of 1% was observed in the specimen PGWS. However, the cracks at the wall-footing junction were considerable at a drift ratio of 1%. Interestingly, the increase in drift ratio did not induce a significant increase in the number of flexural cracks. At a drift ratio of 1%, the existing flexural cracks propagated in a diagonal direction, indicating a flexural-shear behavior. The specimen PGWS demonstrated large cracks, and the PC wall in the specimen PGWS seemed to be dislocated from the footing. Thus, the behavior of the specimen PGWS was found to be dominated by the rocking mechanism due to the presence of large cracks at the wall-footing junction.
The ultimate failure modes of three specimens are shown in Figure 8. The failure of the specimens RCWS and PCWS accompanied extensive concrete crushing at the wall base. In addition, buckling of the longitudinal reinforcement was observed in the exposed regions, whereas splitting of concrete in the horizontal and diagonal direction indicated a flexure-shear-dominated behavior. In contrast, the failure of the specimen PGWS did not accompany substantial horizontal and diagonal splitting. However, large cracks at the wall-footing junction indicated the failure of grouted sleeve splices, resulting in a dominant rocking behavior.

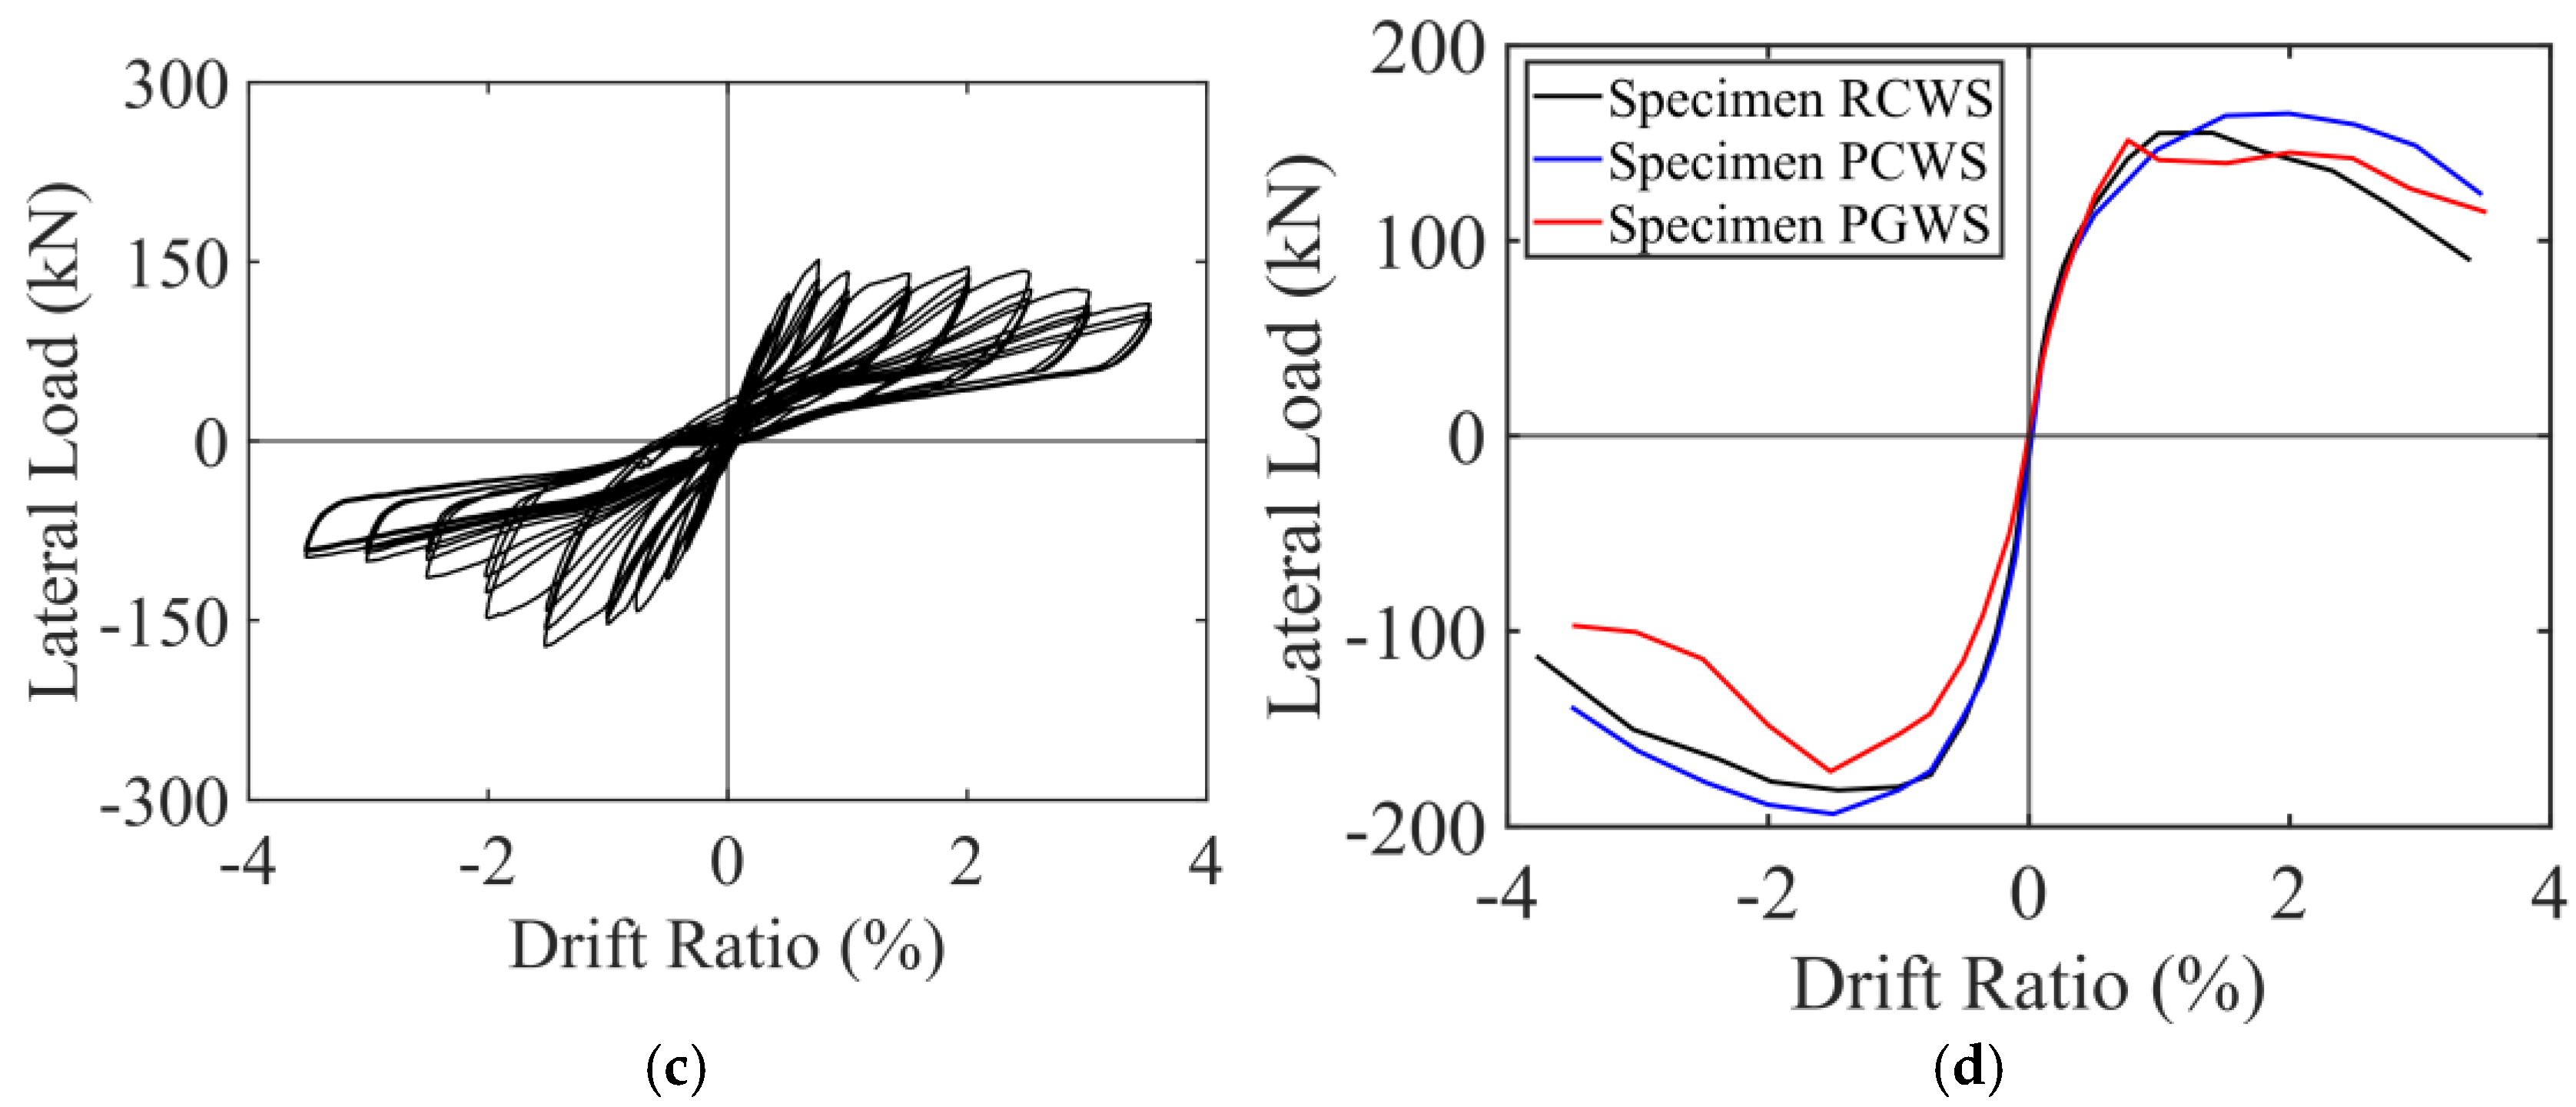
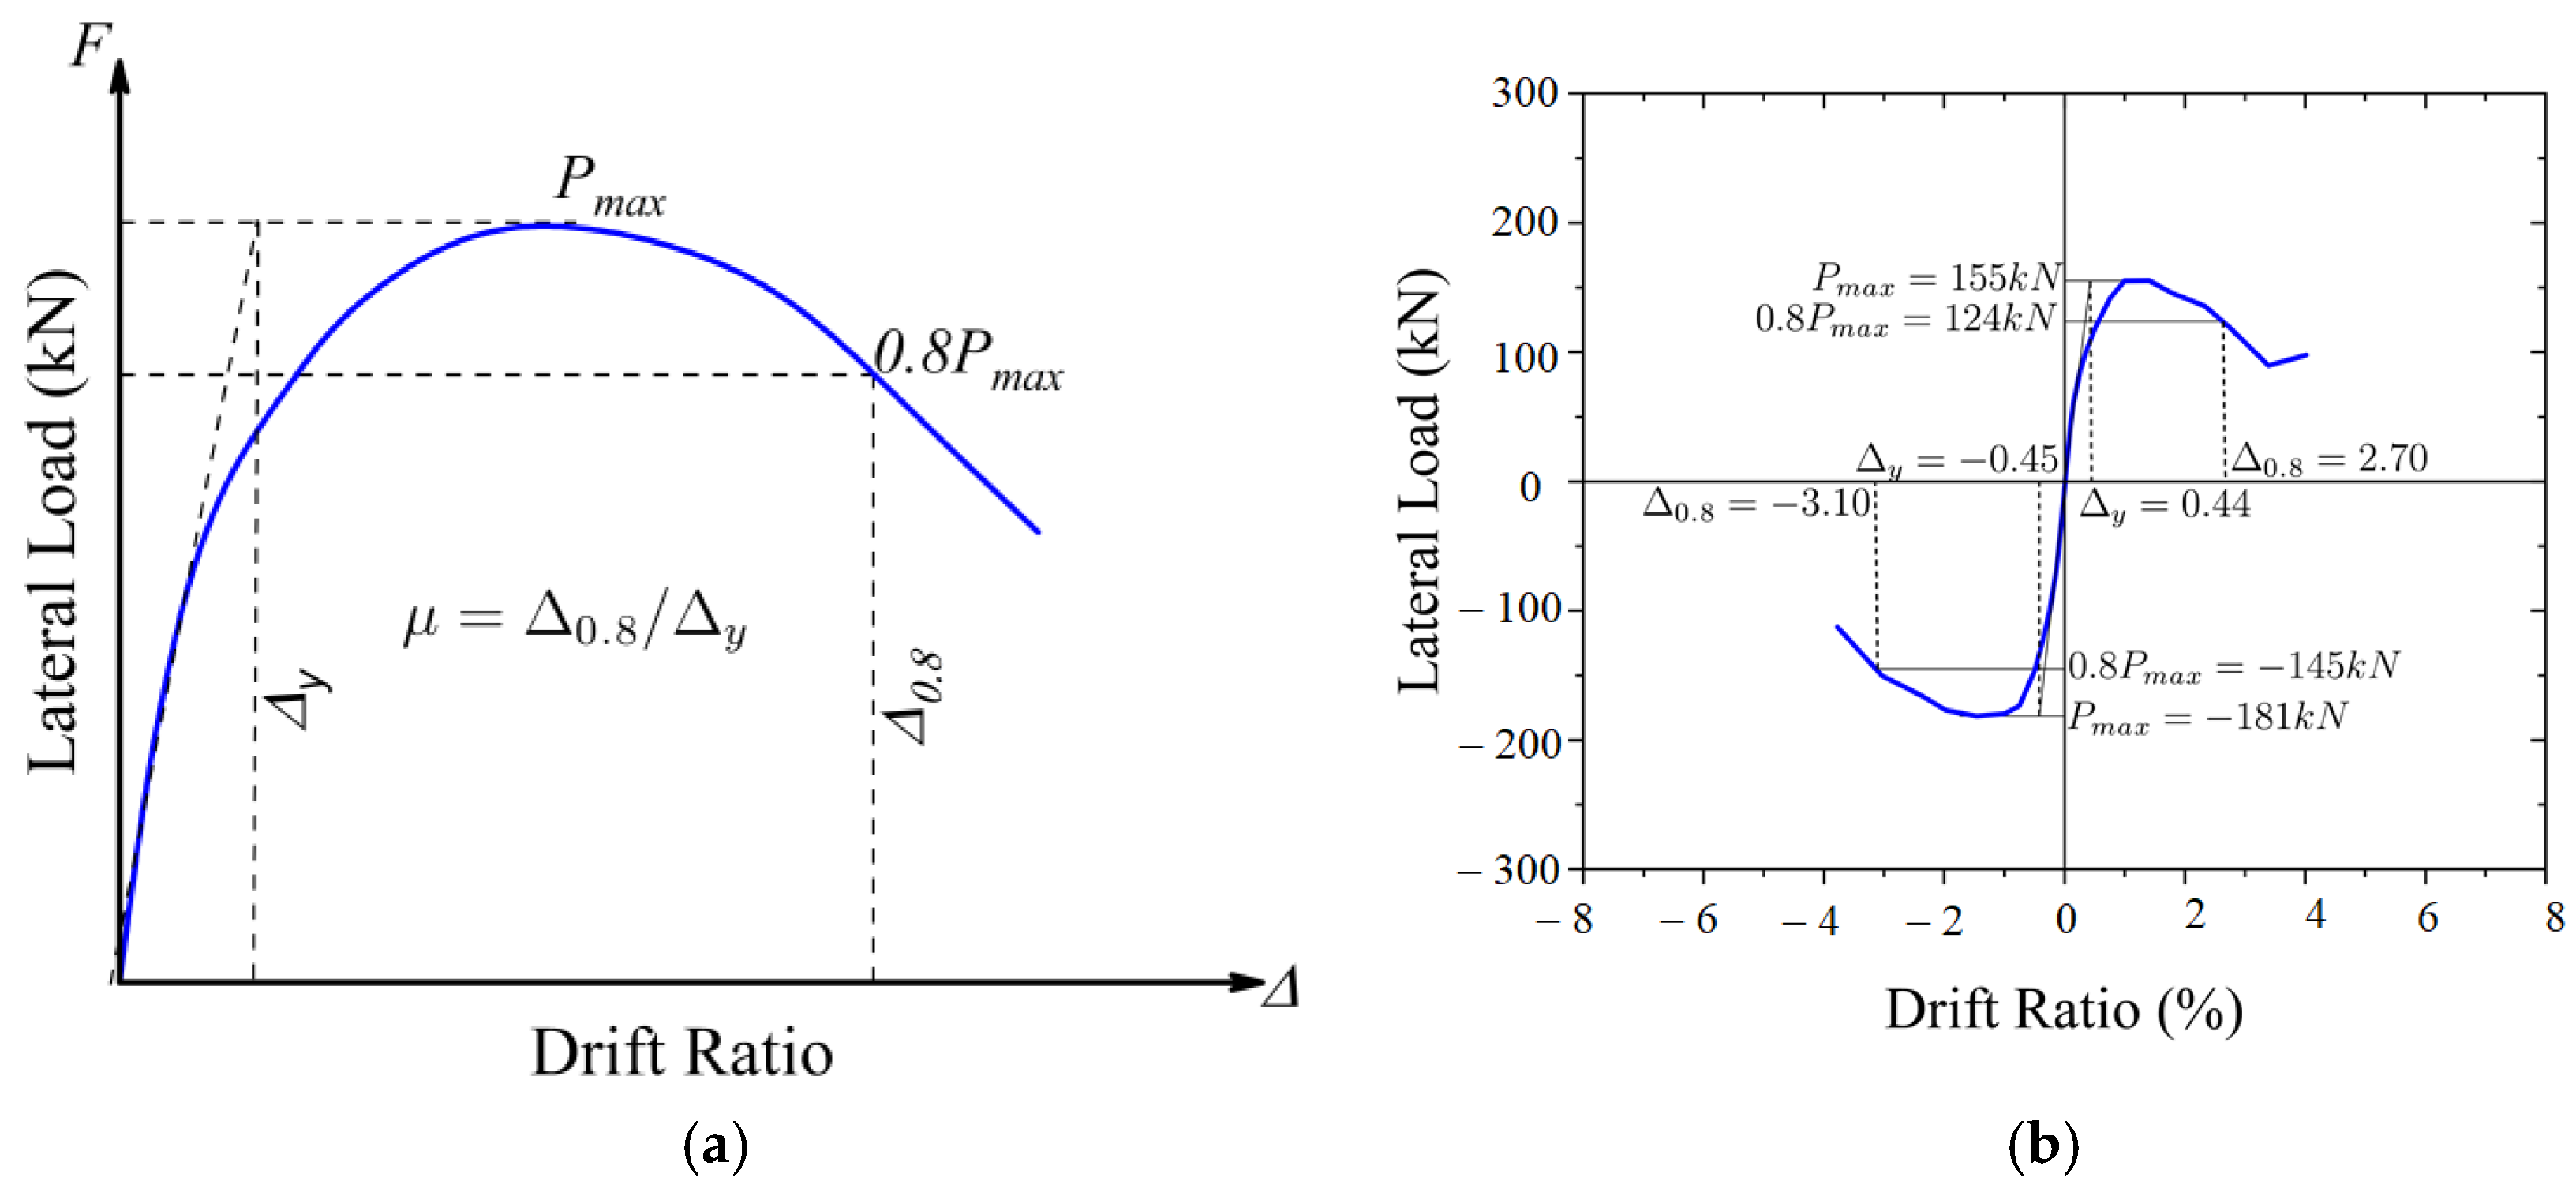
3.2. Hysteretic Response and Ductility of Shear Walls

The measured hysteretic load-deflection response of all specimens is shown in Figure 9. By visual inspection, it is evident that the hysteretic behavior of the specimens RCWS and PCWS was comparable. On the contrary, the hysteretic response of the specimen PGWS demonstrated extensive pinching. This was expected after witnessing extensive cracking at the wall-footing junction and the predominantly rocking behavior of the specimen PGWS. This is an indication that the use of grouted sleeve splices did not result in an efficient connection between the PC shear wall and footing. On the other hand, the connection by corrugated duct splices resulted in pinching as low as the pinching in the CIP shear wall (i.e., the specimen RCWS), suggesting the effectiveness of corrugated duct splices. The lateral load-deflection envelopes are presented in Figure 9d. In terms of peak lateral strength and initial stiffness, no significant difference was observed among the three specimens. In addition, the rate of post-peak strength degradation could not be differentiated among the three specimens. In terms of pinching, the specimen PGWS demonstrated the highest pinching. While the load-deflection hysteretic responses of the specimens PCWS and RCWS exhibited similar pinching characteristics.
The key parameters of the hysteretic response of all specimens are listed in Table 4. The definition of displacement ductility index μ is shown in Figure 10 and mathematically represented in Equation (1) [12].
μ = Δ 0.8 Δ y
where Δ 0.8 is the displacement corresponding to a 20% drop in peak lateral strength and Δ y   is the yield displacement defined in Figure 10a [22]. The estimated ductility for all specimens from the backbone curve is also shown in Figure 10. It is evident that the ductility levels of the specimens RCWS and PCWS were above 6.0, whereas the ductility of the specimen PGWS was above 6.0 in the push direction only. The specimen RCWS did not perform well in the pull direction, which can be attributed to the substandard connection between the wall and footing. Further, the peak load sustained by the specimen PCWS was greater than the peak load sustained by the specimen RCWS, whereas the specimen PGWS sustained a lower peak load than the peak load sustained by the specimen RCWS.

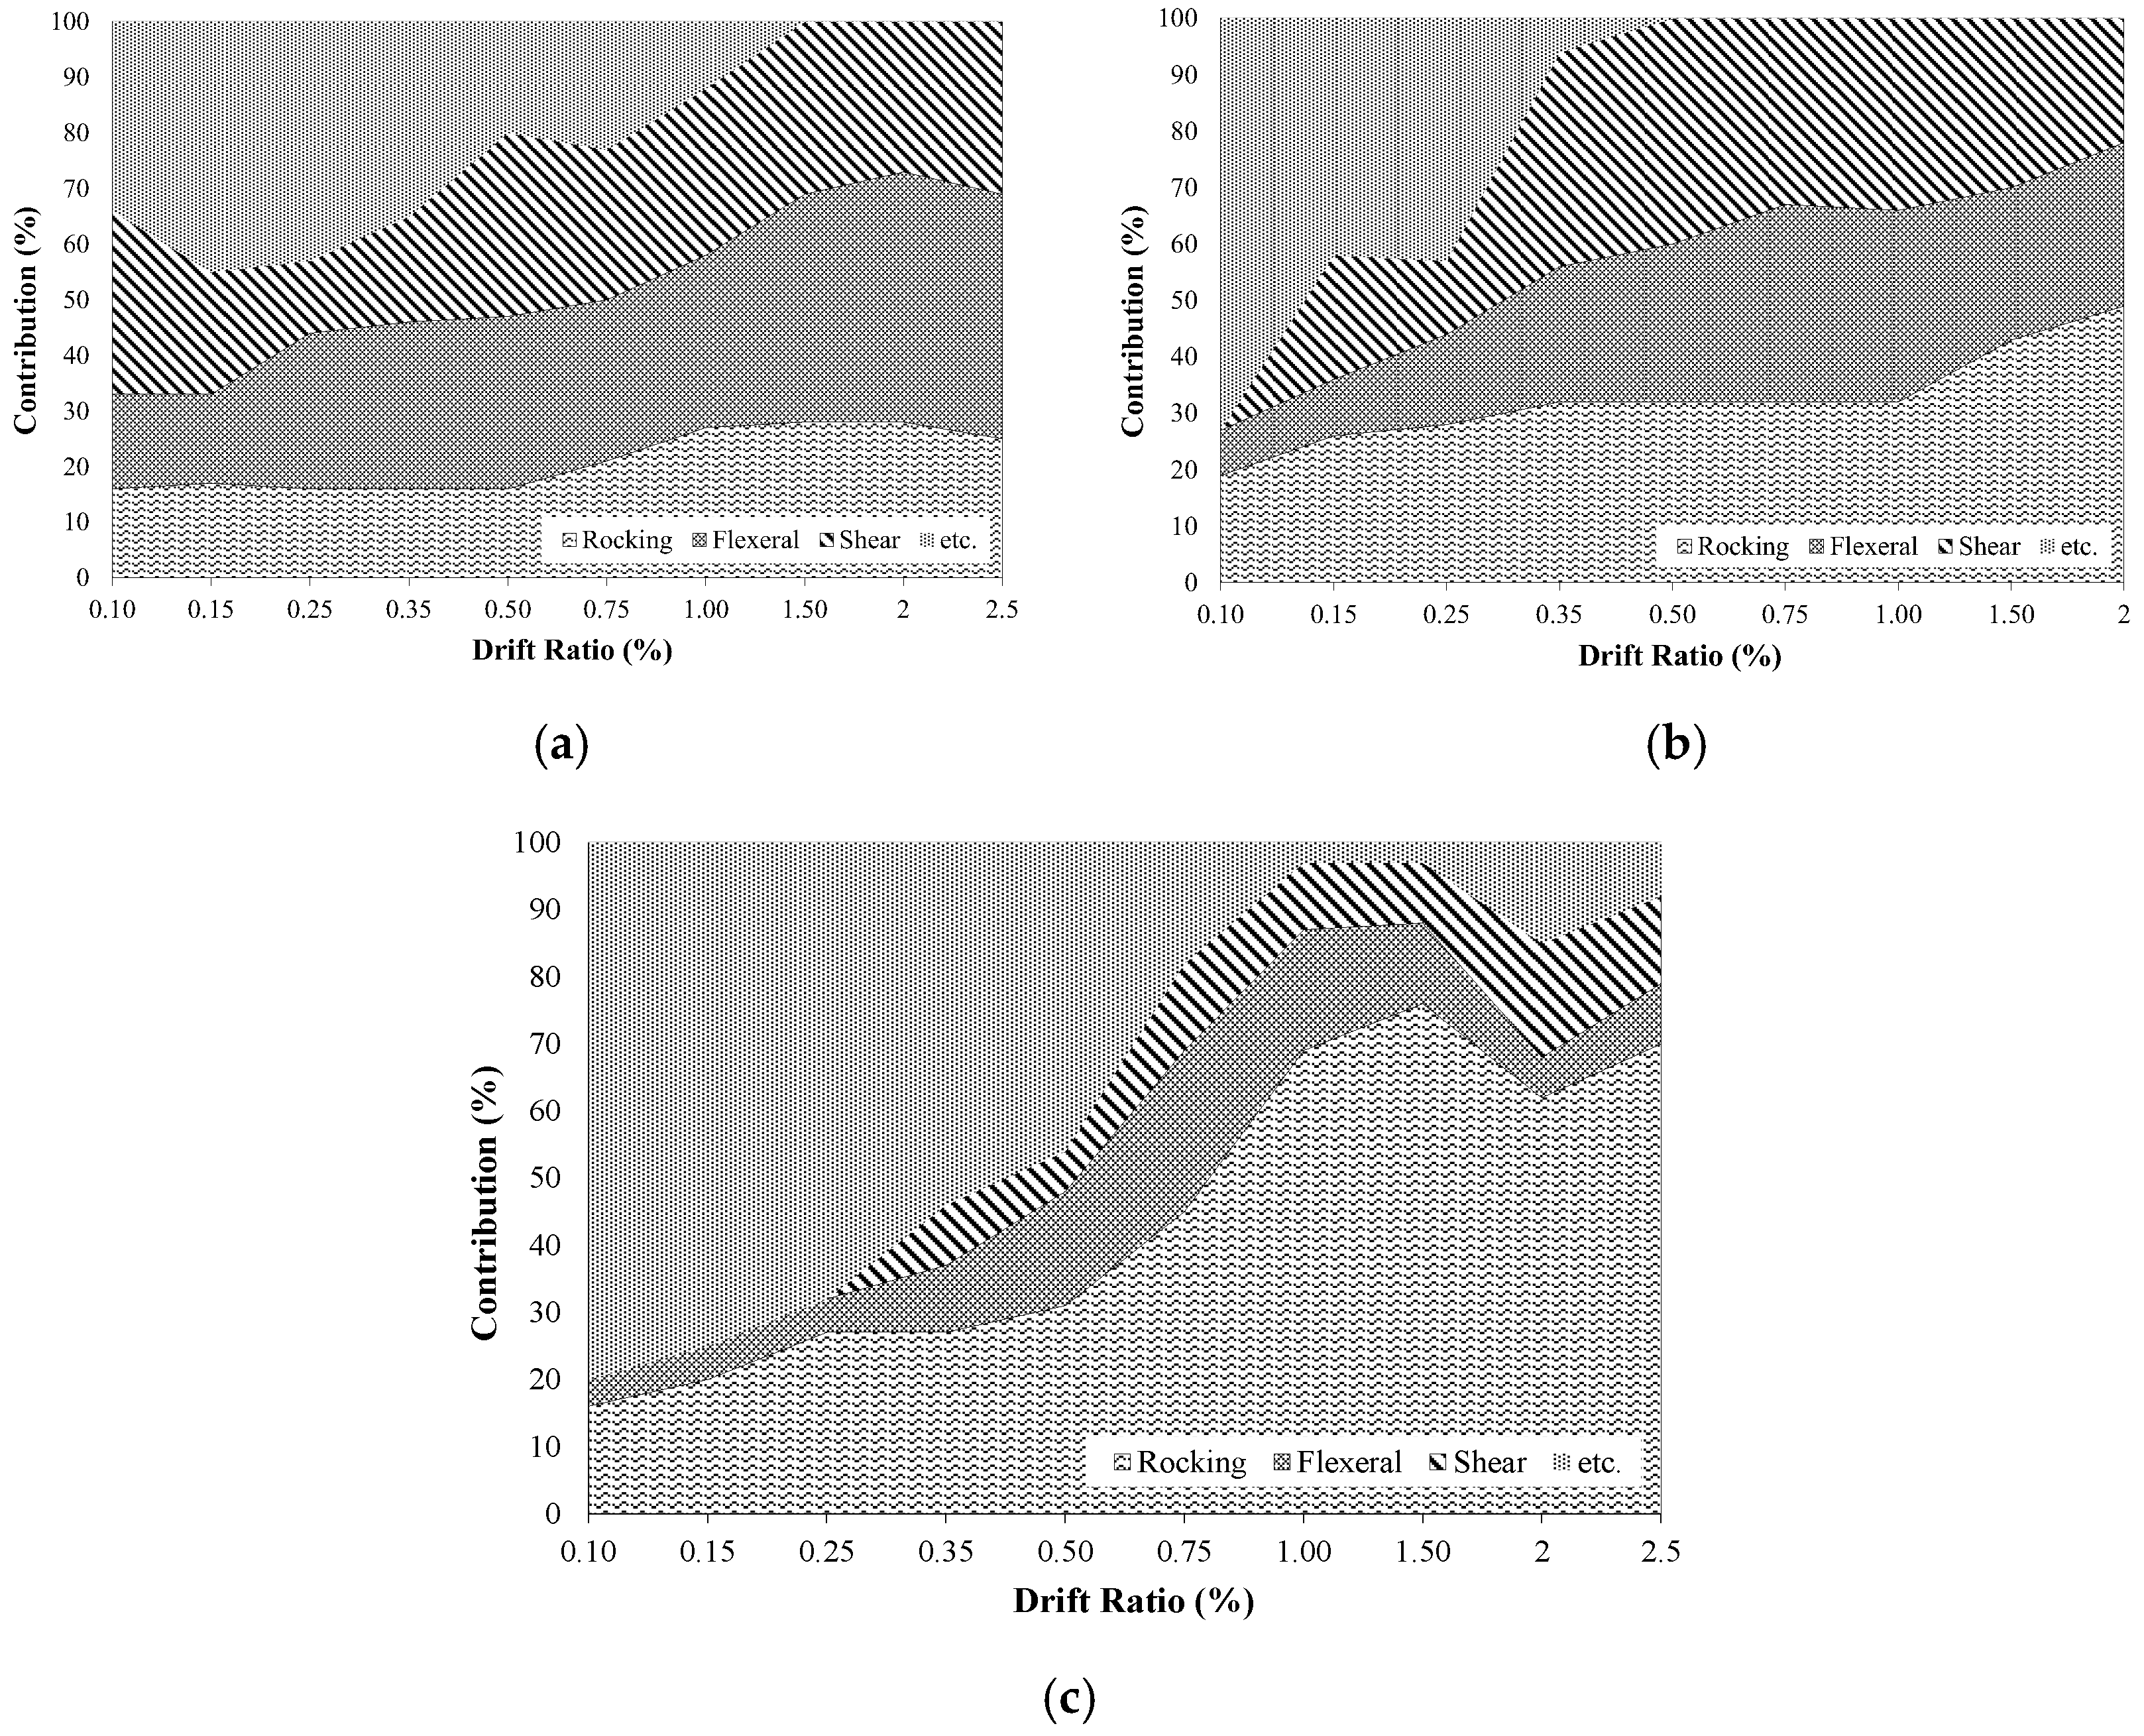
3.3. Lateral Deformation Components

Extensive instrumentation was deployed to capture the contribution of the individual lateral deflection components. The captured contribution of shear, flexure, and rocking mechanisms to the total lateral deflection at various drift ratios is plotted in Figure 11. It can be seen in Figure 11a that the contribution of shear, flexure, and rocking to the total deflection was presented throughout the loading history. In addition, the contribution of the three components increased as the loading progressed. For the specimen PCWS, the contribution of shear and flexure was low at small drift ratios. This can be validated by the cracking patterns in the specimen PCWS in Figure 6. The contribution of shear to the total deflection evolved rapidly as the drift ratios increased, which is again, corroborated by the extensive shear cracking observed at drift ratios greater than 1.5% in the specimen PCWS. Finally, the contribution of shear and flexure was insignificant compared to the contribution by rocking to the total deflection of the specimen PGWS. This is again confirmed by the cracking patterns observed in the specimen PGWS (see Figure 7). The contribution of rocking to the total deflection of the specimen PGWS was approximately 70%. This is substantiated by the noticeable cracks at the wall-footing junction in the specimen PGWS. The resemblance in cracking patterns and the estimated contribution of different components to total deflection suggest that the applied instrumentation accurately captured the individual components.

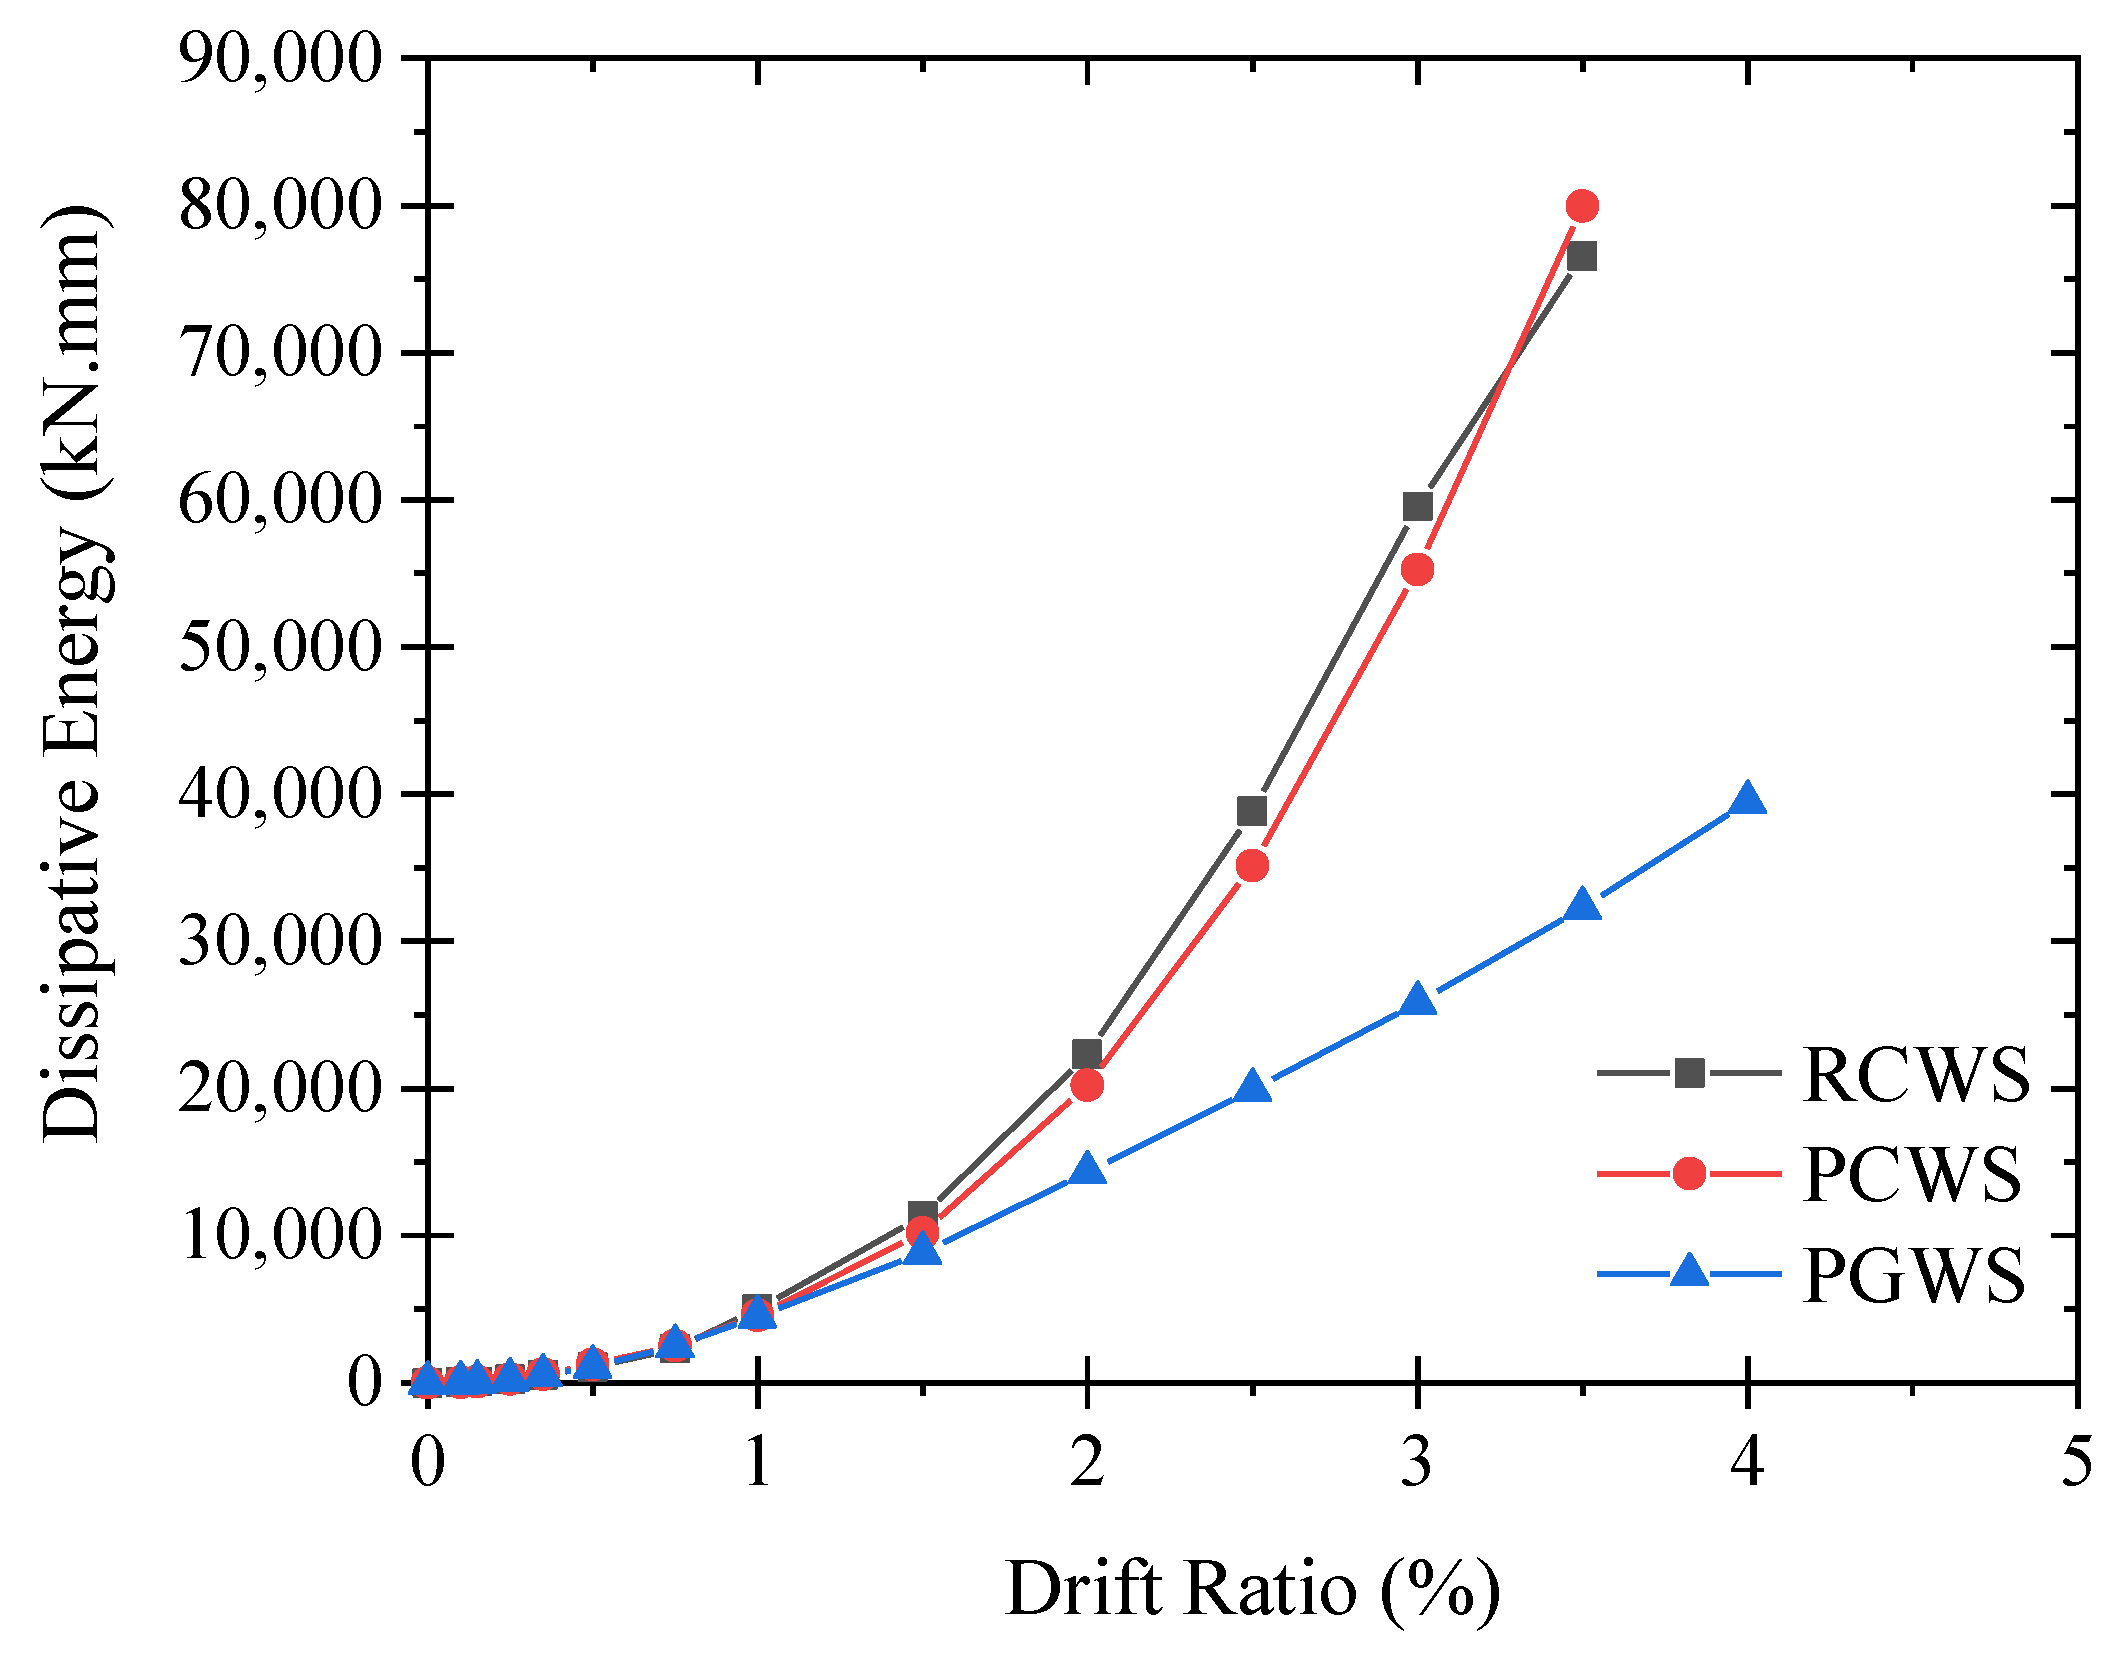
3.4. Energy Dissipation

The dissipated energy was calculated as the area under hysteretic loops. The calculated dissipated energy along various drift ratios is plotted in Figure 12, whereas the total dissipated energy by each specimen is presented in Table 4. At small drift ratios, i.e., below 1%, the dissipated energy of all specimens evolved slowly. Further, the cumulative energy of all specimens below the 1% drift ratio was comparable. Above 1% drift ratio, the specimen PGWS did not follow the trend of dissipated energy of the CIP shear wall, i.e., the specimen RCWS. This can be ascribed to the extensive pinched hysteretic response of the specimen PGWS due to the rocking mechanism. On the contrary, the total energy dissipated by the specimen PCWS was 87.6 kN-m in comparison to the value of 76.6 kN-m for the specimen RCWS.

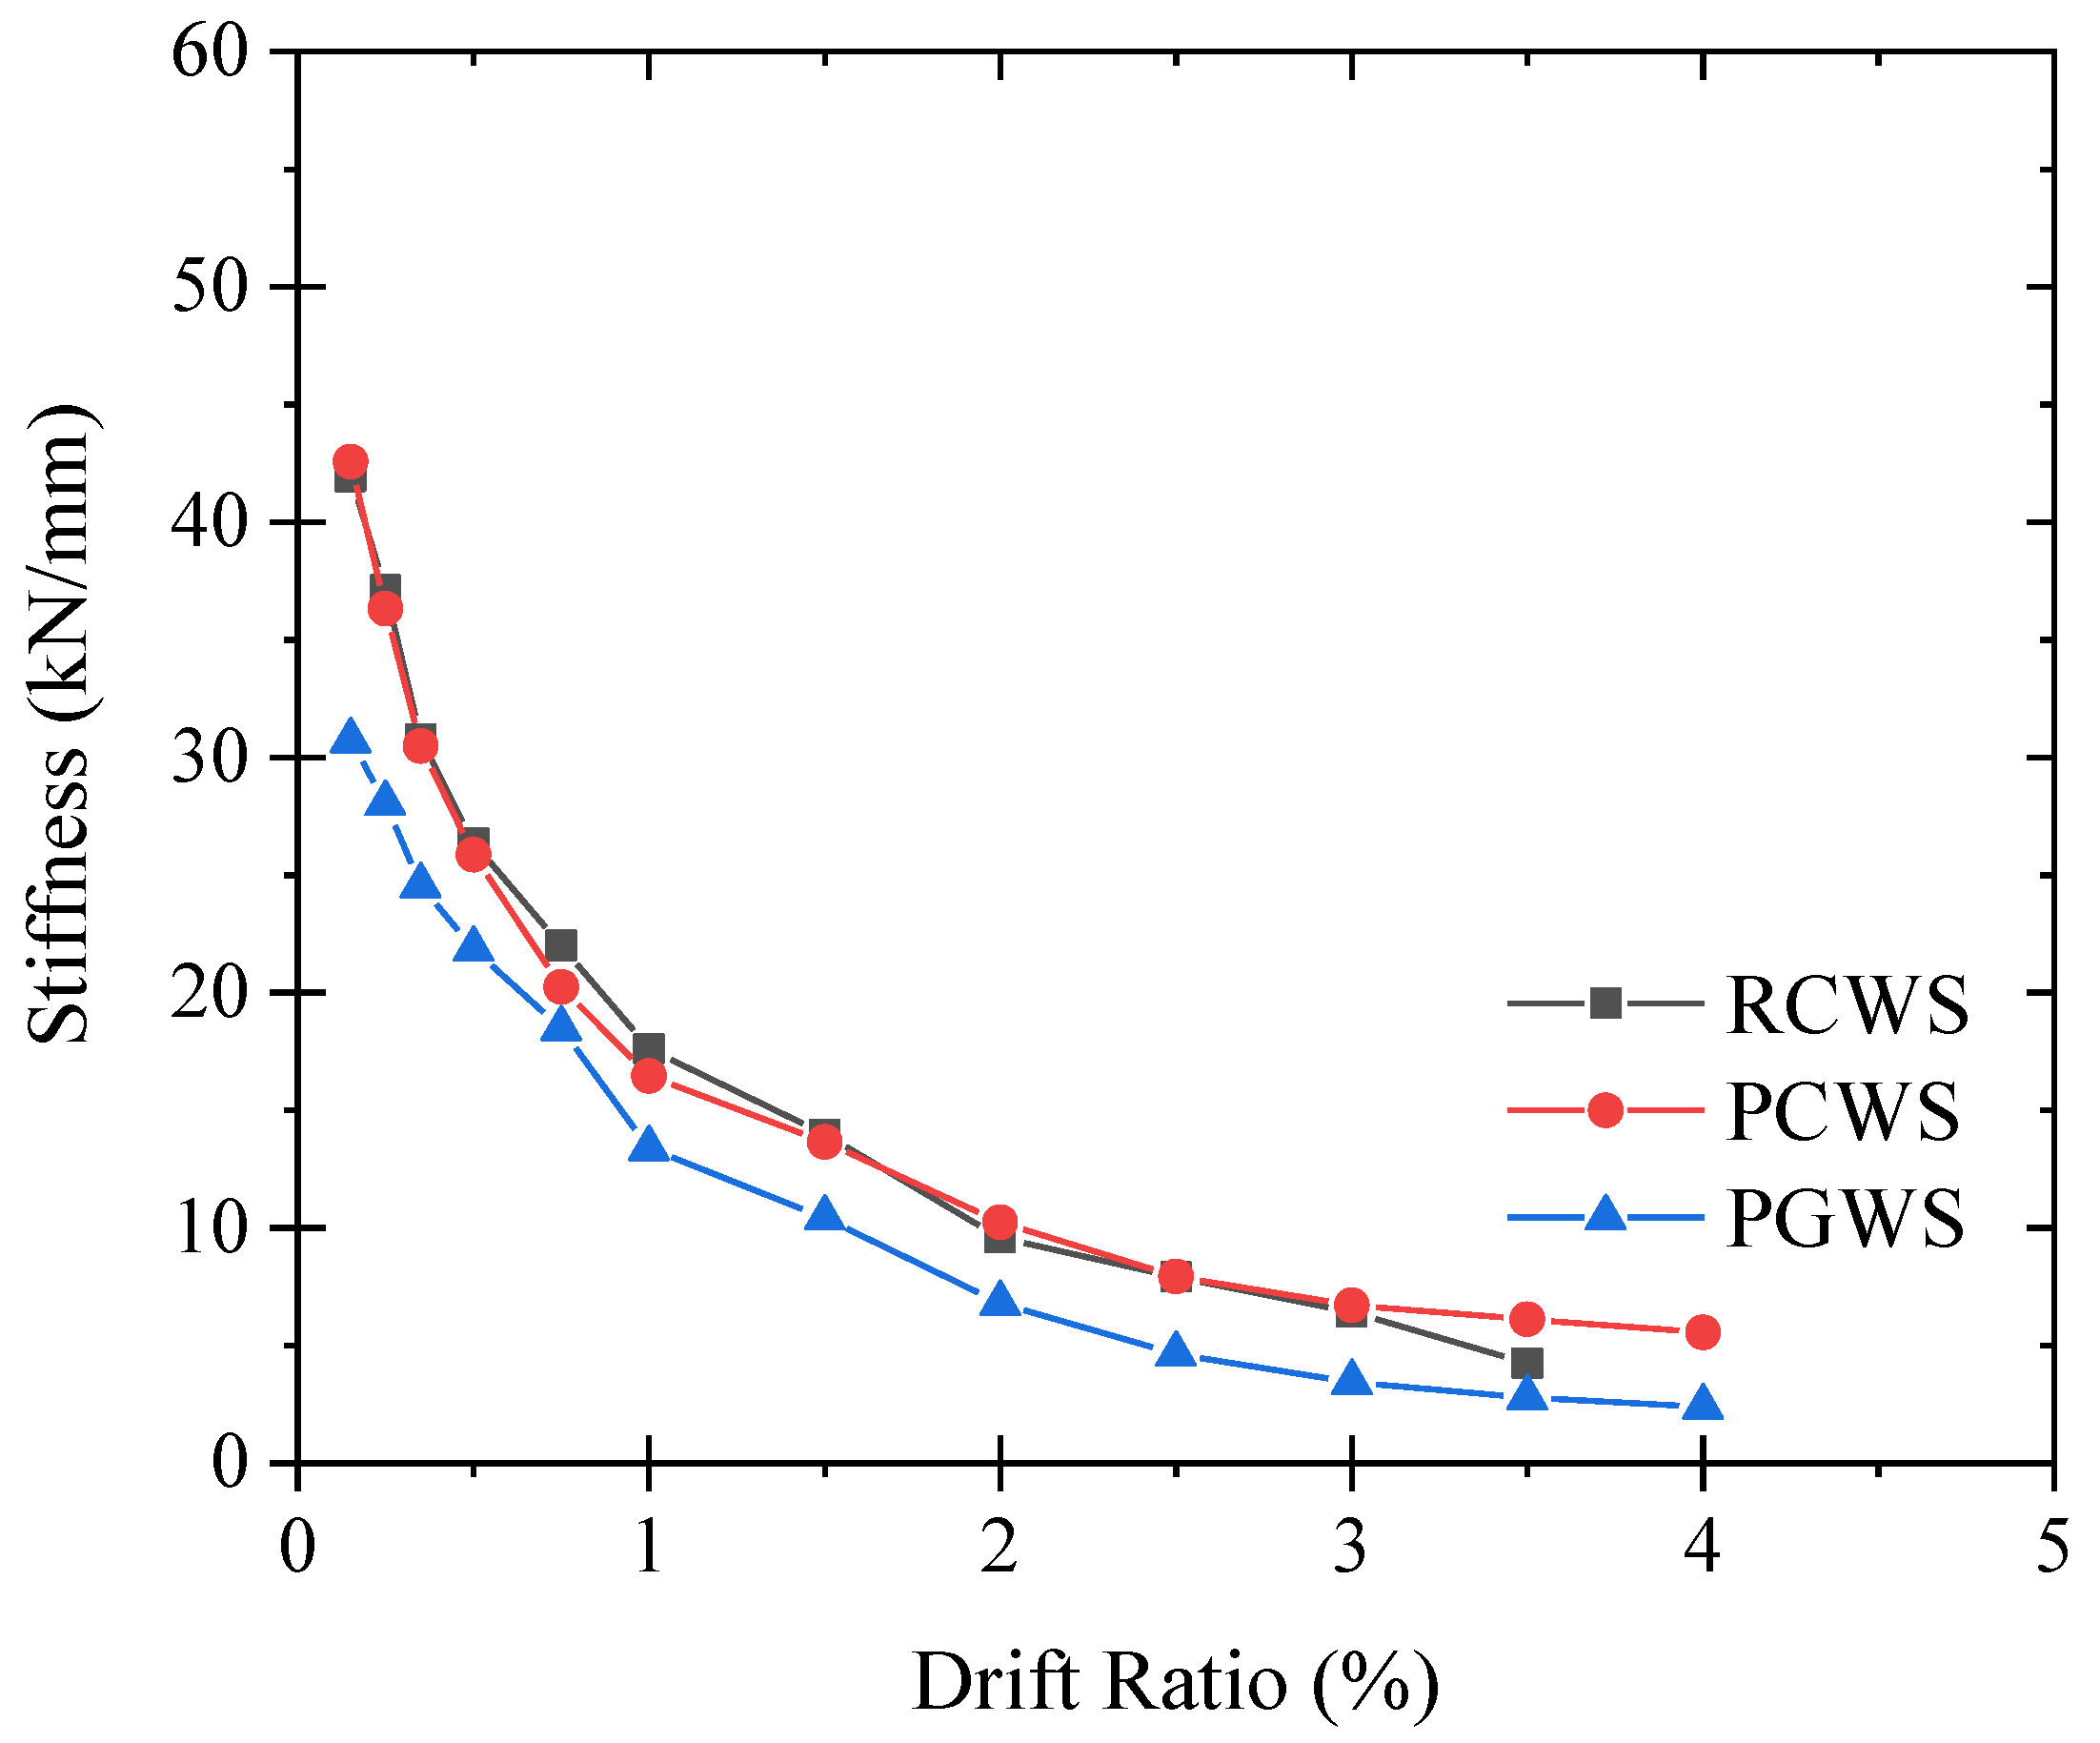
3.5. Secant Stiffness Degradation

The secant stiffness degradation is another criterion to estimate the rate of strength degradation under hysteretic loading. It is defined as the secant stiffness of the line joining the origin and peak load at each drift ratio. The estimated secant stiffness for all specimens in the push direction is plotted in Figure 13. It is evident that the corrugated duct splice resulted in strength degradation of the PC wall that was comparable to the secant stiffness degradation of the CIP monolithic shear wall. The substandard nature of grouted sleeve splices is evident in Figure 13 as the secant stiffness of the specimen PGWS at each drift ratio was lower than those of specimens RCWS and PCWS. The rapid stiffness degradation at low drift ratios in all specimens can be attributed to the tensile cracking of concrete and the evolution of shear cracks.

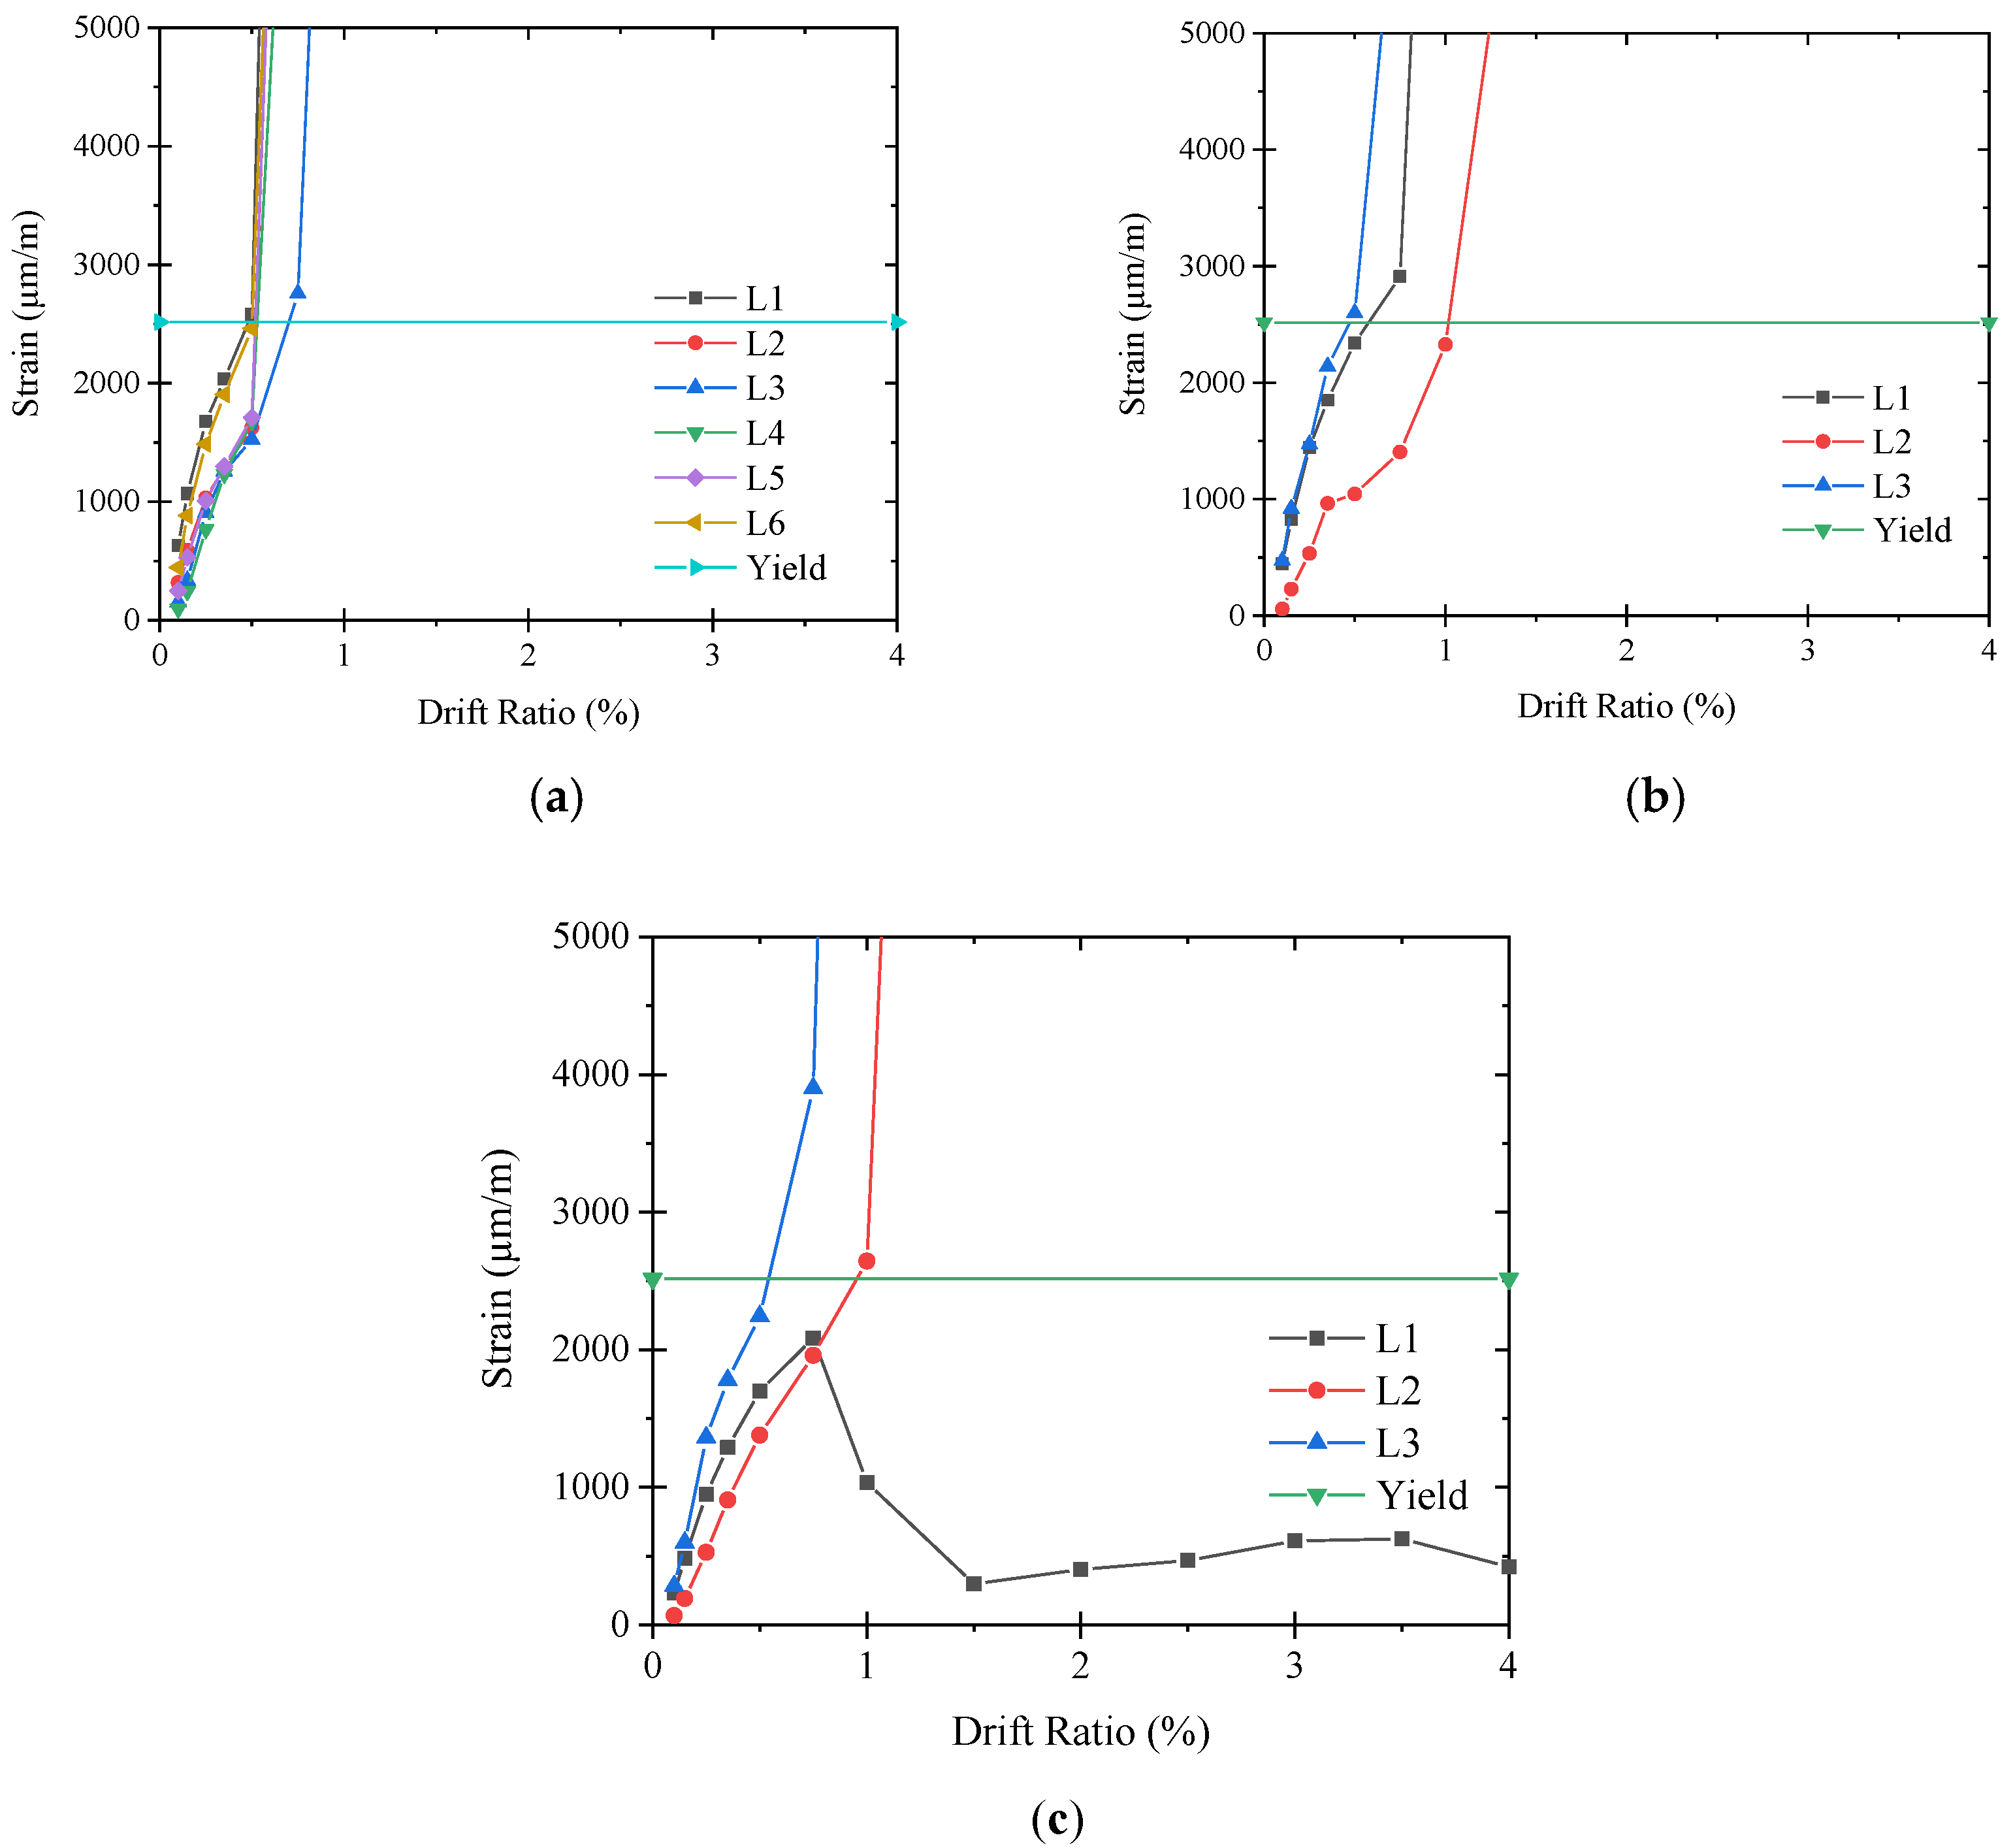
3.6. Strains of Longitudinal Reinforcement

Various strain gages were installed on the longitudinal bars at the wall-footing junction. The measured strains in the specimen RCWS are shown in Figure 14a. Six strain gages were installed on six longitudinal bars in the specimen RCWS. It can be seen that the longitudinal bars in the boundary elements attained higher strains than the strains of longitudinal bars in the web element. Nonetheless, all the longitudinal bars attained yield stress at a drift ratio of 0.75%. The specimen PCWS had three strain gages attached to the protruded bars in corrugated ducts, as shown in Figure 14b. The bars within boundary elements attained yielding at a drift ratio of around 0.5%, whereas a delayed yielding in the middle bar was observed. Finally, strain measurements in the specimen PGWS are shown in Figure 14c. The bar at location L1 could not attain yielding. This can be attributed to the premature failure of grouted sleeve splices at location L1. This can be explained by the wide crack observed at the wall-footing junction in the specimen PGWS.
In light of the ongoing discussion, it is inferred that the specimen PGWS suffered connection damage at location L1. This is confirmed in Figure 14, where the strain gage mounted to the longitudinal bar at location L1 could not measure the yield strain due to the loss of connection at the same location. This may be attributed to the assumed grout defect at location L1. This is because existing studies have highlighted the issues concerning the difficulties in maintaining the grout quality within the grouted sleeve splices [16,18].

4. Numerical Simulations

In this part, the open-source computational platform of OpenSees [23] was used to model the shear wall. It was demonstrated that the specimen PGWS suffered from connection damage. As a result, the response of the specimen PGWS was substantially dominated by rocking, resulting in extensive pinched behavior. Since the connection damage was attributed to an unforeseen grout defect, the wall PGWS was not modeled. The objective behind the testing of corrugated duct splices was to assess their efficiency in maintaining the wall-footing connection under reversed cyclic loading. In short, it was desired to have a similar hysteretic response from the specimen PCWS as that of the specimen RCWS. It was shown in Section 3 that the peak load, ductility, energy-dissipation capability, and secant stiffness of the specimen PCWS were all the same as those of the specimen RCWS. Therefore, it is inferred that corrugated duct splices can effectively be utilized in the connection of precast wall panels. To this end, a single shear wall was modeled in OpenSees representative of the specimens RCWS and PCWS. The modeling details are described below.
The class of the Multiple Vertical Line Element Model (MVLEM) in OpenSees was utilized to model the hysteretic behavior of the shear wall. In particular, the macroscopic modeling approach that utilizes the two-dimensional fiber-based formulation of the Shear-Flexure Interaction-Multiple Vertical Line Model (SFI-MVLEM) was adopted [24,25], as shown in Figure 15. The SFI-MVLEM approach models the member by stacking elements in series. Each element in the series is representative of steel and concrete properties along the member width. Each element is connected to rigid beams at the top and bottom, where three global degree-of-freedoms are defined at the center of each rigid beam. The relative rotation between the top and bottom beams is assumed to occur at the center of rotation, which is further assumed to act at a distance of 0.4 times the element height from its base [26]. Each element is divided into a number of RC panels along its length. The longitudinal internal forces within each element are represented through a membrane action, where the constitutional law of RC panels is evaluated by utilizing the Fixed Strut Angle Model (FSAM) [27].
In practice, the boundary elements of a shear wall incorporate better confinement than the web. This phenomenon can easily be modeled using the SFI-MVLEM modeling approach, as the width and thickness of an individual RC panel can be controlled. Further, different constitutive stress-strain laws of concrete and steel can be assigned to different RC panels.

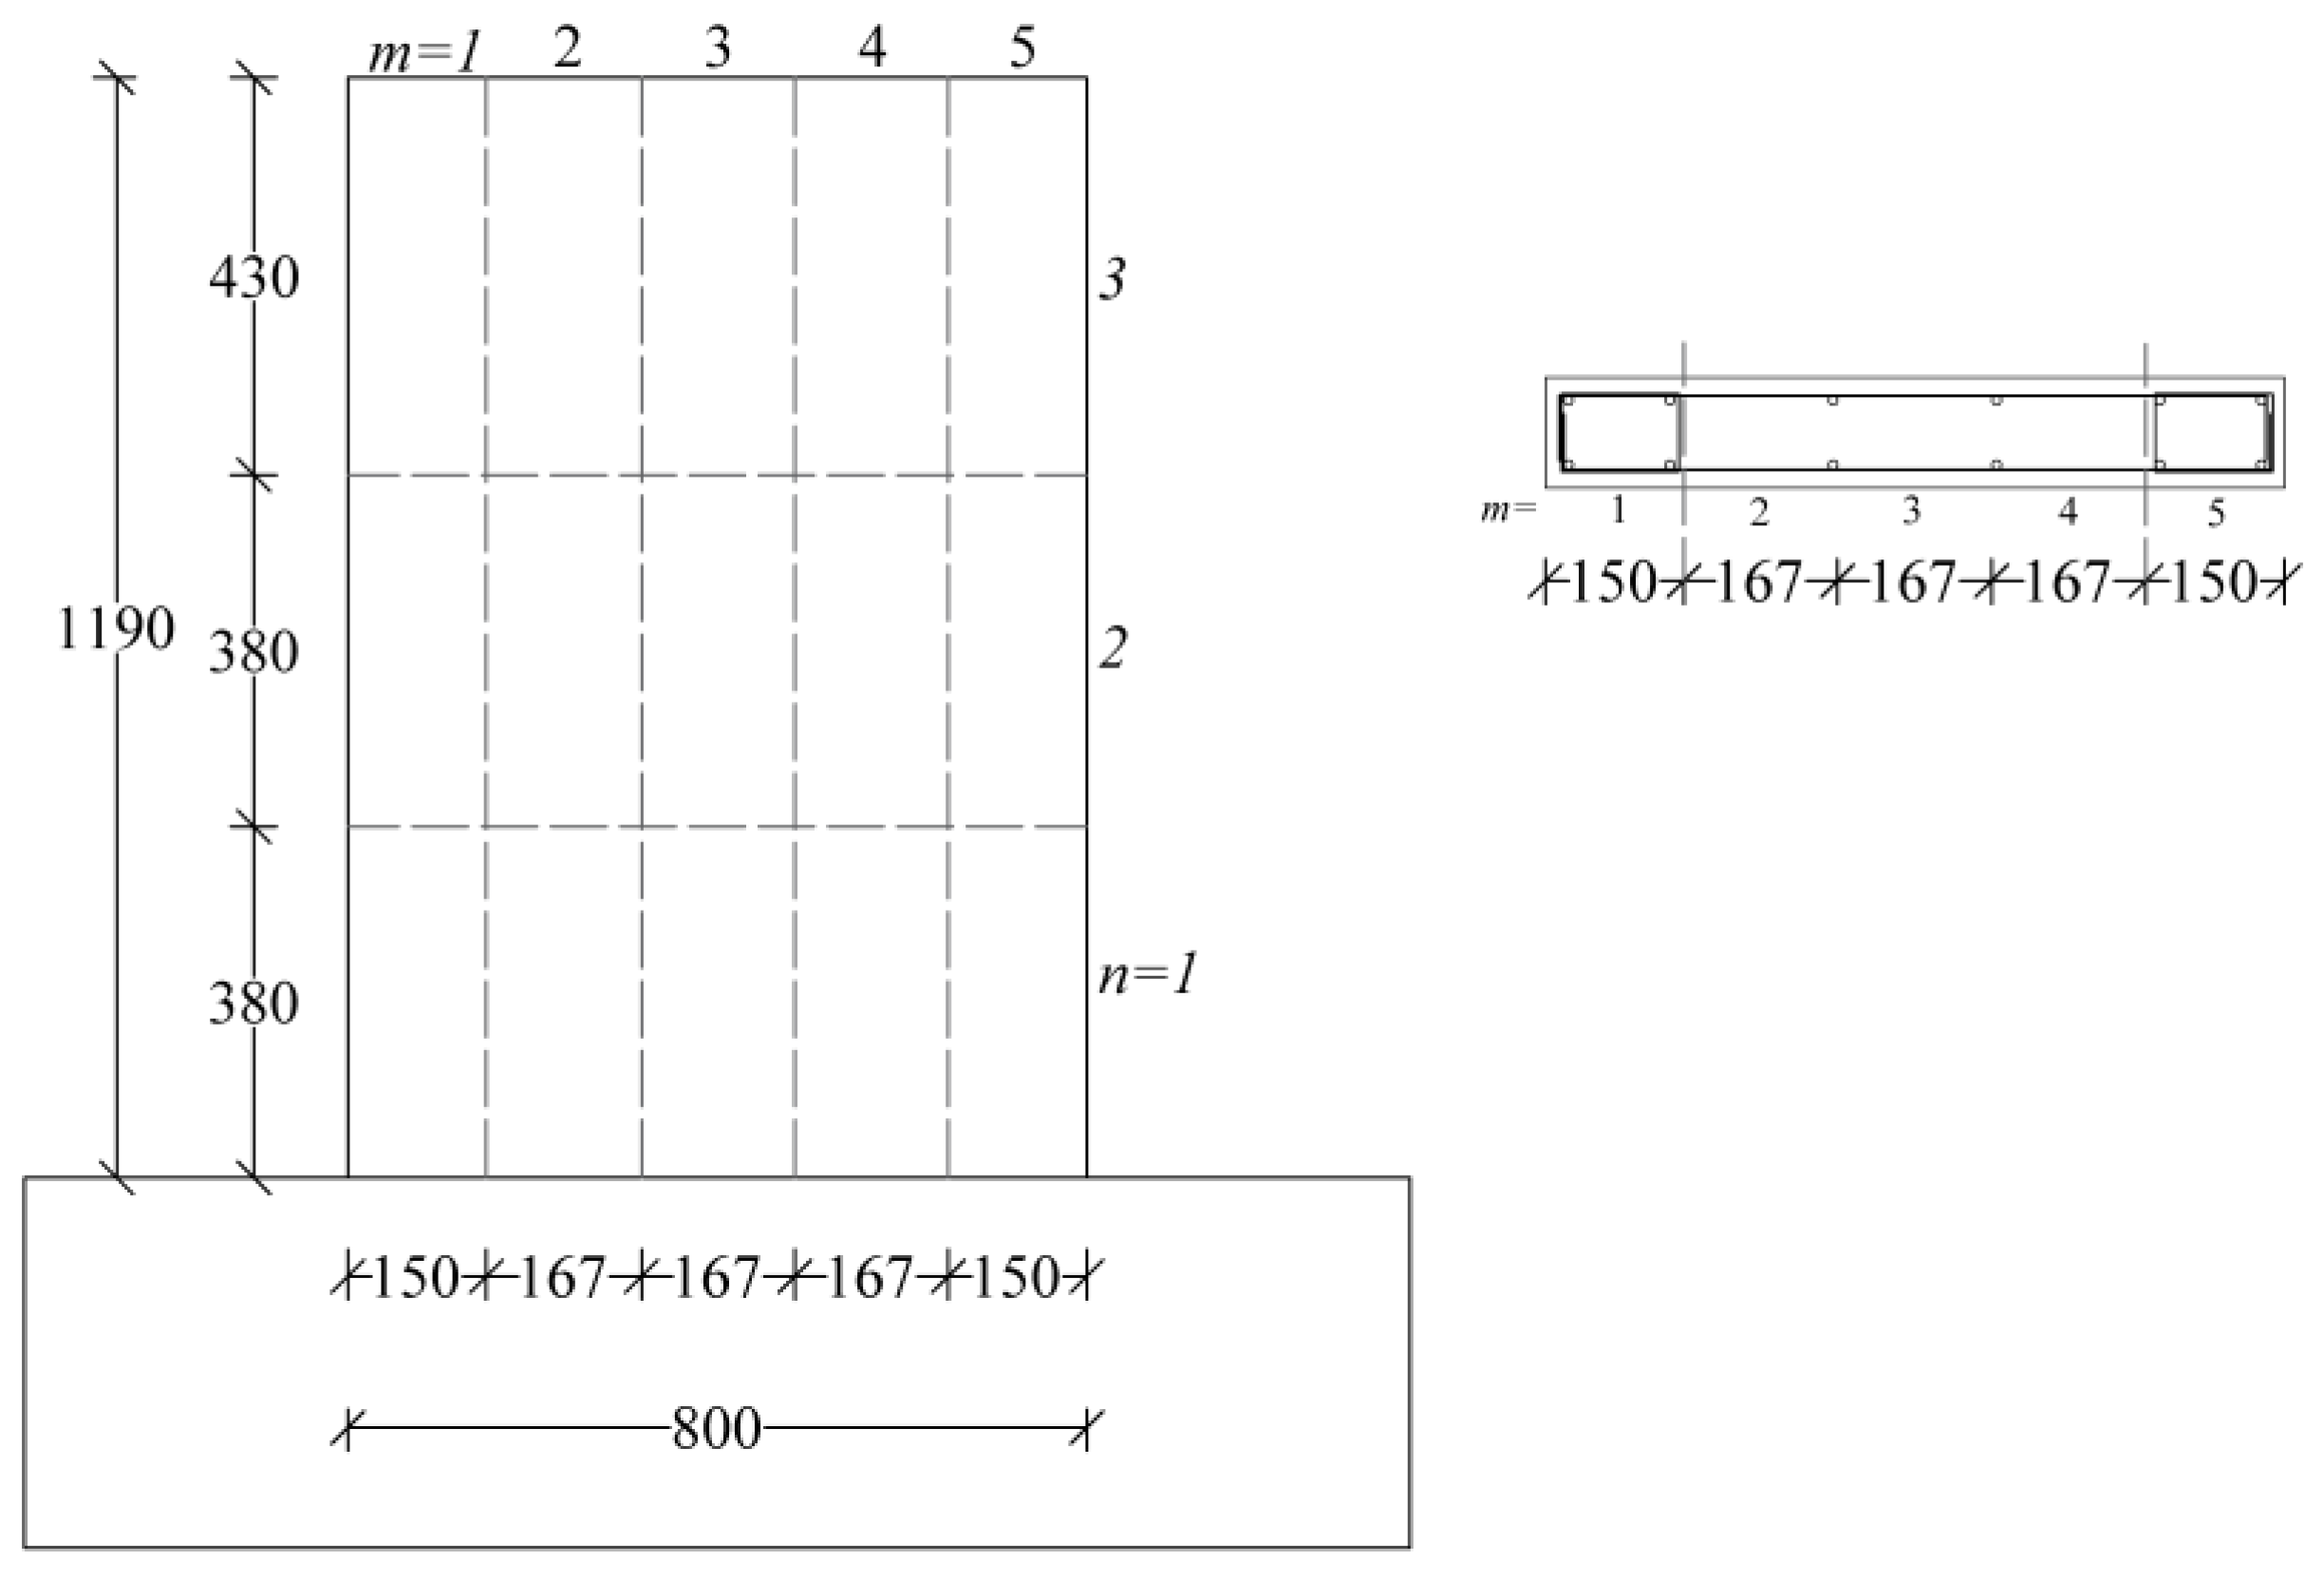
4.1. Element and Panel Discretization

In the present study, a shear wall representative of the specimens RCWS and PCWS was modeled using three SFI-MVLEM elements, as shown in Figure 16. A single RC panel was used to model the boundary element at each end, whereas three RC panels were used to model the web of each element. The length of boundary RC panels was taken as 150 mm, whereas the length of three web panels was 167 mm. The height of element one and element two was 380 mm, and the height of element three was 430 mm.

4.2. Material Constitutive Relations

Concrete properties within the boundary regions were evaluated using the model of Mander et al. [28]. The uniaxial material ConcreteCM was used to model the uniaxial concrete behavior, which is the hysteretic concrete model developed by Chang and Mander [29]. The ConcreteCM material has the ability to model the pinching of the load-deflection behavior in the form of an optional gap parameter. The gap parameters take a value of 0.0 or 1.0, with 0.0 denoting a less gradual gap closure (more pinching) and 1.0 denoting rapid gap closure. In the present study, the default value of 0.0 was adopted for the gap parameter. The SFI-MVLEM must be used in conjunction with FSAM material belonging to class nDMaterial in OpenSees, which represents the plane stress-stress constitutive relationship of the RC panels. The definition of FSAM needs two input parameters: ν and α to account for the concrete friction coefficient and stiffness coefficient of reinforcement dowel action, respectively. In the present study, values of 0.08 and 0.005 were adopted for ν and α , respectively.
The uniaxial steel stress-strain relation was incorporated using SteelMPF material, which was originally formulated by Menegotto and Pinto [30], and later extended by Filippou et al. [31] to incorporate isotropic hardening. The Bauschinger effect was included in the form of a curvature parameter R 0 , which was taken as 15.0. Further, the curvature degradation was incorporated by input parameters a 1 and a 2 , which were taken as 0.96 and 0.11, respectively. The default values of isotropic hardening parameters were adopted in the present study.

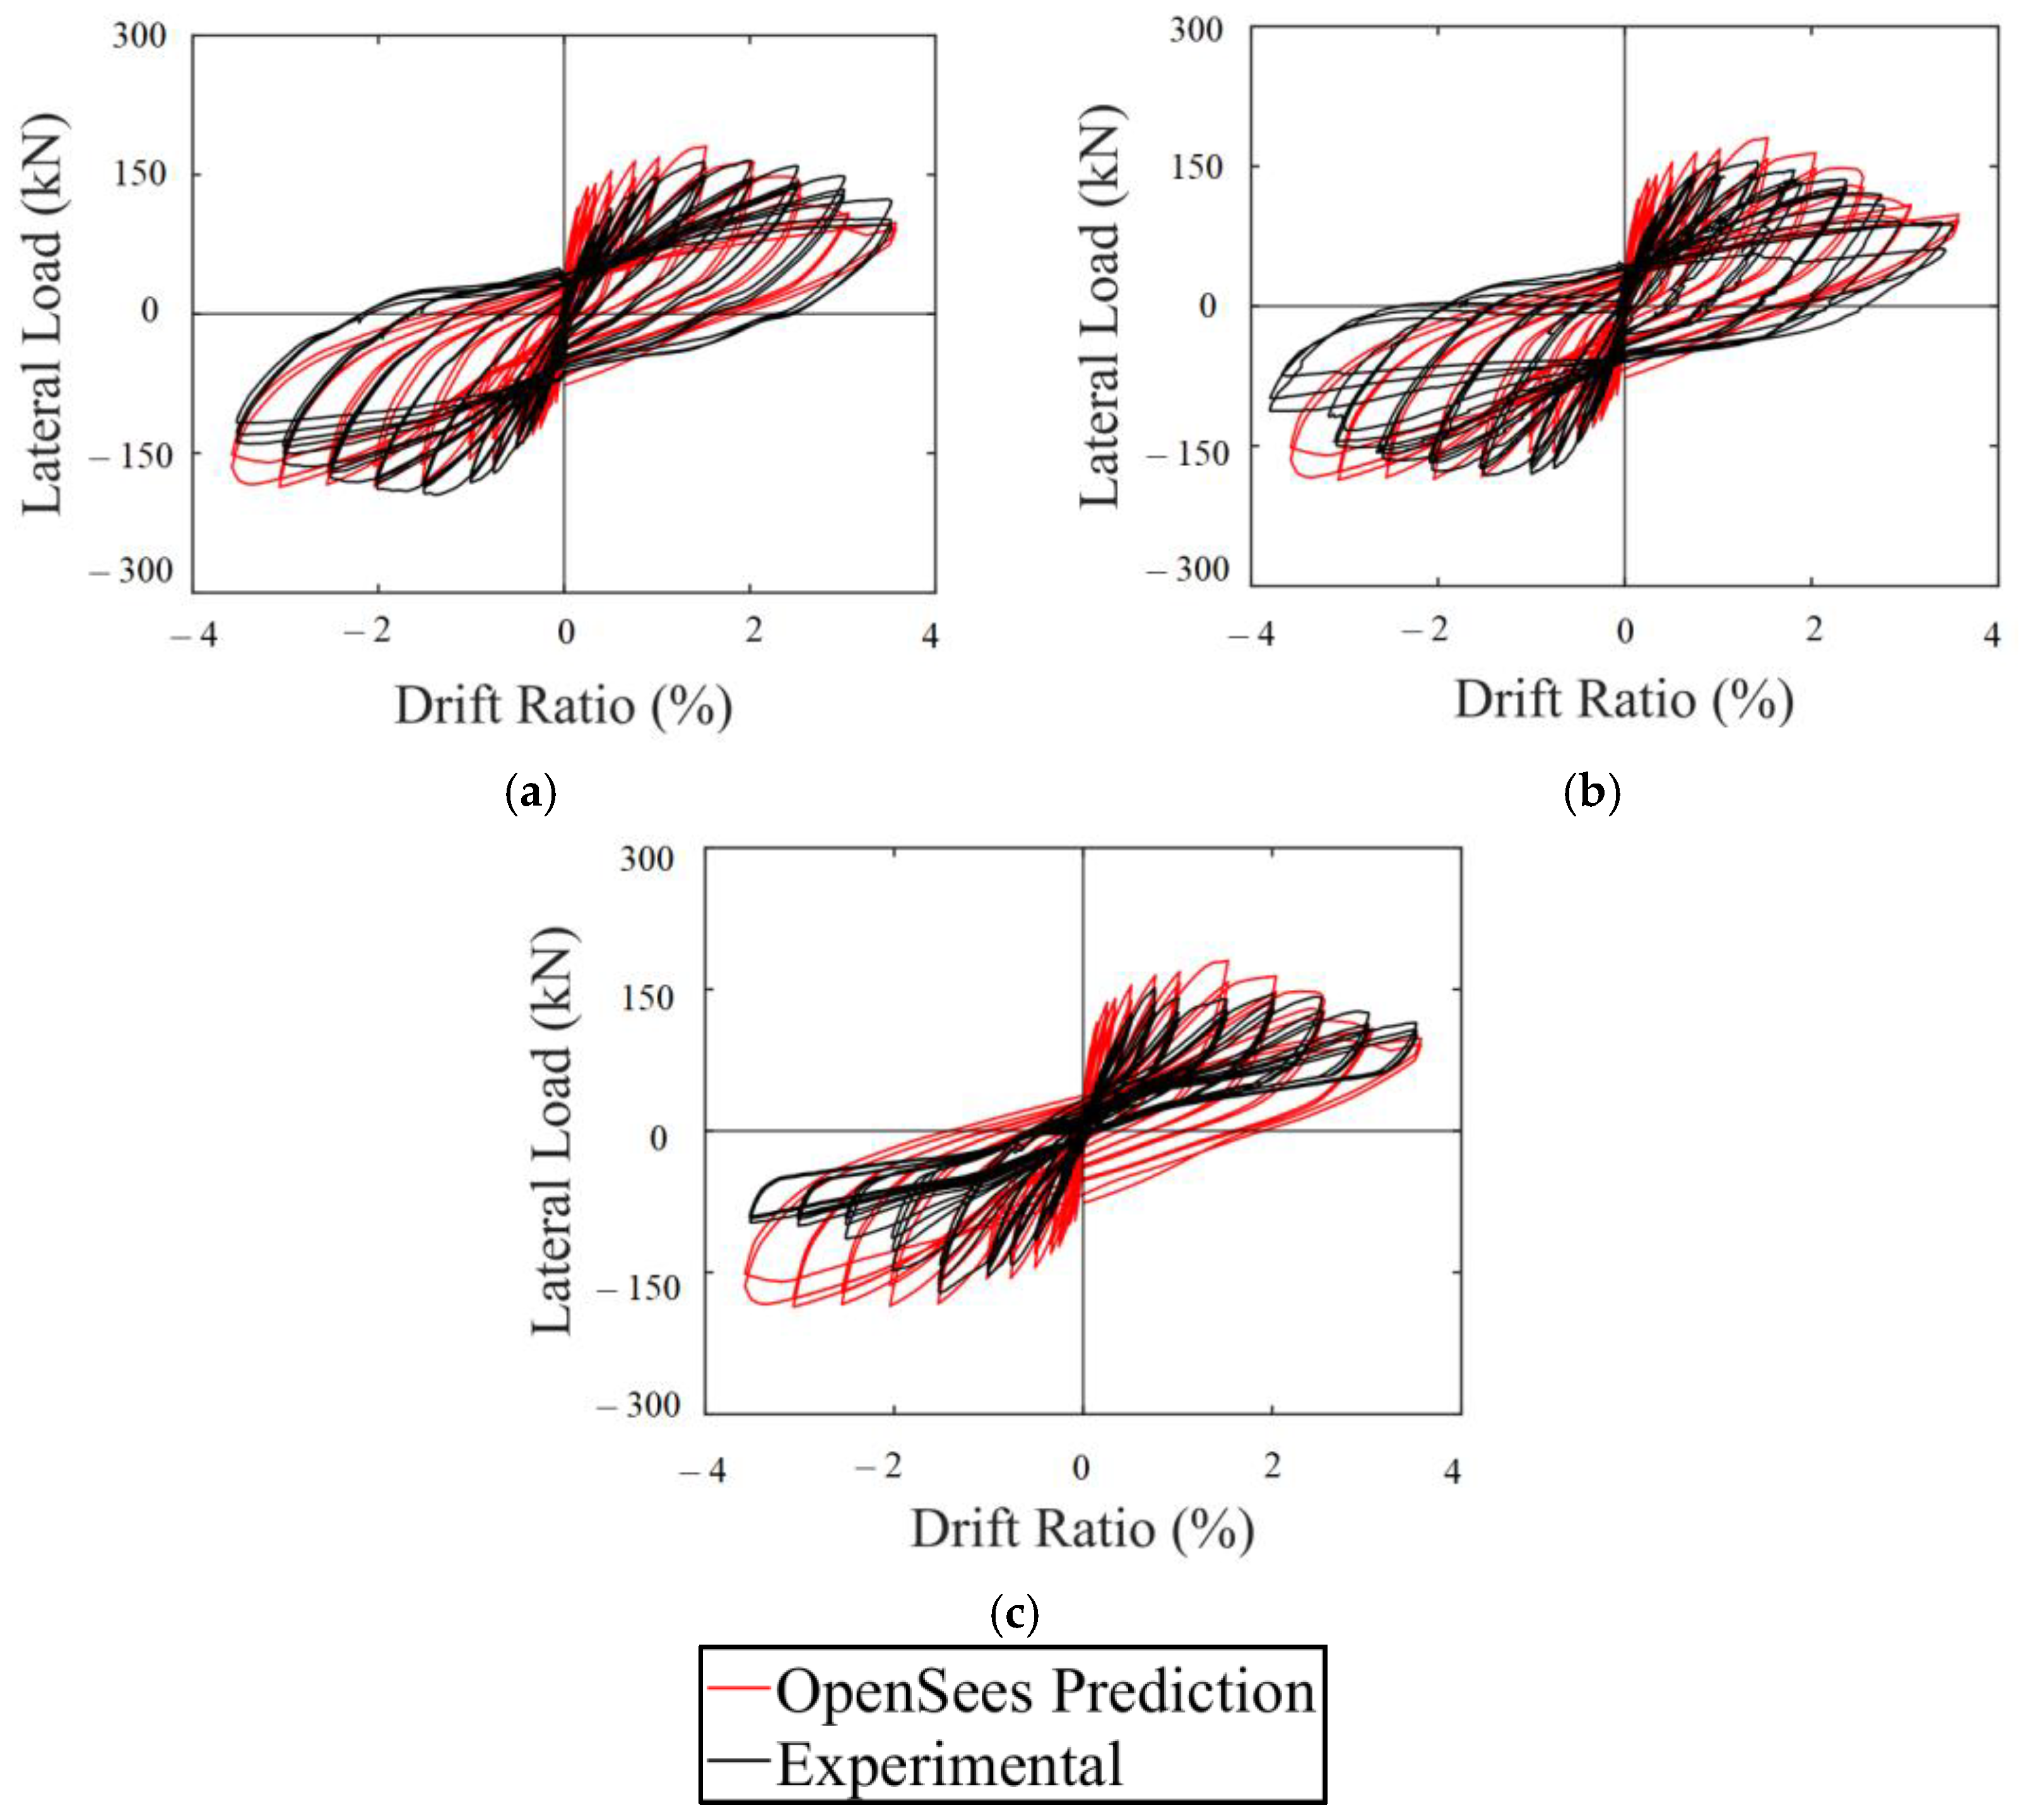
4.3. Comparison of Predicted vs. Experimental Hysteretic Response

A comparison of the predicted hysteretic response and experimental hysteretic response for the specimen PCWS is shown in Figure 17a. The initial stiffness of the predicted response was slightly overestimated, whereas the predicted trend of the post-peak strength degradation was observed to be in good agreement with the experimental trend. The predicted peak load of the wall in both directions was also observed to be in good agreement with the experimental results. The total dissipated energy under the predicted hysteretic loops was 77.8 kN-m, whereas the corresponding experimental value was 79.98 kN-m, resulting in an error of −2.7%. A comparison between the predicted (same as that for the specimen PCWS) and experimental hysteretic responses of the specimen RCWS is shown in Figure 17b. It can be seen that the OpenSees model was able to trace the hysteretic response of specimens RCWS and PCWS with good accuracy, whereas the extensive pinching in the hysteretic response of the specimen PGWS was underestimated, as shown in Figure 17c. It can be inferred that the adopted model for shear wall in OpenSees is unable to capture pinching of high magnitude, and other material models need to be investigated.

5. Discussions

The failure mechanisms of the specimens RCWS and PCWS involved extensive concrete crushing at the base of the walls. Additionally, buckling of the longitudinal reinforcement occurred in the exposed regions, while splitting of concrete in horizontal and diagonal directions indicated a flexure-shear-dominated behavior. In contrast, the specimen PGWS exhibited a distinct failure mode. It did not exhibit significant horizontal and diagonal splitting, but large cracks at the wall-footing junction indicated the failure of grouted sleeve splices, resulting in a prominent rocking behavior. Xiao et al. [16] brought attention to the challenges associated with GSS connections, specifically the issue of grout backflow during the grouting process, which can lead to defective grout connections. To investigate the impact of these defects on the performance of PC shear walls, grout defects of varying sizes were deliberately introduced into GSS connections. The study revealed that these defective GSS connections had a detrimental effect on the performance of PC shear walls, particularly when the longitudinal bars were under tension. On the other hand, it was observed that a GSS connection without defects allowed the longitudinal bar to achieve its full capacity. Thus, it can be inferred that the issues related to the grout backflow can significantly affect the performance of GSS connections, with noticeable detrimental effects. This issue manifested itself in the hysteretic response of the specimens. The hysteretic behavior of the specimens RCWS and PCWS exhibited similar characteristics. However, the hysteretic response of the specimen PGWS displayed significant pinching. This behavior was anticipated due to the extensive cracking observed at the wall-footing junction and the predominant rocking behavior of the specimen PGWS. These findings suggest that the use of grouted sleeve splices did not result in an effective connection between the PC shear wall and footing. The inefficient connection contributed to the observed pinching behavior and indicated limitations in the performance of the grouted sleeve splices in this context.

6. Conclusions

This study investigated the splice sleeve and corrugated duct splices between RC shear walls and footings. In this regard, three shear walls were experimentally tested. One wall was cast monolithically with the foundation (RCWS), whereas two walls were precast. One wall was connected to the foundation using splice sleeves (PGWS) and another with corrugated duct splices (PCWS). All walls were tested under reverse cyclic loading and under a constant axial load. The following important conclusions can be deduced:
  • The crack patterns and ultimate failure modes of the specimens RCWS and PCWS were close to each other, whereas the failure of the specimen PGWS was characterized by a wide crack at the wall-footing junction. Further, the number of flexure and shear cracks in specimen PGWS was lower than the corresponding number in specimens RCWS and PGWS, suggesting that the mode of failure in the specimen PGWS was mainly controlled by rocking.
  • The hysteretic load-deflection behavior of the specimens RCWS and PCWS was identical in terms of initial stiffness, ductility, peak load, pinching, and energy dissipation. On the contrary, the hysteretic response of the specimen PGWS exhibited extensive pinching in both directions, which can be attributed to the rocking behavior. It was observed that the contribution of rocking to the total lateral deformation of the specimen PGWS was predominantly high as compared to the corresponding contributions in the specimens RCWS and PCWS. As a result, the total dissipated energy by the specimen PGWS was significantly low compared to the corresponding values of other specimens. Different deformation components were extracted, and it was found that the contribution of rocking to the total lateral deformation of specimen PGWS was up to 70%.
  • For drift ratios below 1%, all specimens exhibited a gradual evolution of dissipated energy. The cumulative energy dissipation among the specimens was similar within this range. However, above a 1% drift ratio, the specimen PGWS deviated from the dissipated energy trend observed in the specimen RCWS (representing a cast-in-place shear wall). This can be attributed to the extensive pinched hysteretic response caused by the rocking mechanism in the specimen PGWS. In contrast, the specimen PCWS demonstrated a higher total dissipated energy of 87.6 kN-m compared to the specimen RCWS, which recorded a value of 76.6 kN-m.
  • The secant slope vs. drift ratio response of all the specimens was identical. Strain gages attached to the longitudinal bars suggested that all longitudinal bars in the specimens RCWS and PCWS yielded, whereas one longitudinal bar in the splice sleeve of the specimen PGWS could not achieve yielding. This suggests that the splice sleeve connection at the corresponding had failed prior to attaining yielding. This can be attributed to the grout defect that has been encountered in previous studies. Thus, corrugated duct splices not only provide an excellent alternative to grouted sleeve splices’ connections but also eliminate the risks associated with grout defects.
  • Nonlinear fiber-based modeling in OpenSees was performed using SFI-MVLEM elements. The nonlinear modeling was limited to specimens RCWS and PCWS, and a single model was created that was representative of both specimens. The predicted hysteretic response of the OpenSees model was in close agreement with the experimental response.

Author Contributions

Conceptualization, E.Y.; methodology, E.Y., P.W. and P.S.; software, E.Y.; validation, E.Y. and P.W.; formal analysis, E.Y. and K.K.; investigation, E.Y.; data curation, P.W.; writing—original draft preparation, E.Y.; writing—review and editing, P.S. and K.K.; visualization, P.W. All authors have read and agreed to the published version of the manuscript.

Funding

This work was financially supported by the Office of the Permanent Secretary, Ministry of Higher Education, Science, Research and Innovation, under Grant No. RGNS 63-093.

Data Availability Statement

Not applicable.

Acknowledgments

We thank the Asian Institute of Technology (AIT) for partially supporting the test facilities. We also extend our thanks to the KMUTT graduate student, Akekarin Chaisanit, for his assistance in the laboratory.

Conflicts of Interest

The authors declare no conflict of interest. The funders had no role in the design of the study; in the collection, analyses, or interpretation of data; in the writing of the manuscript; or in the decision to publish the results.

References

  1. Singhal, S.; Chourasia, A.; Chellappa, S.; Parashar, J. Precast reinforced concrete shear walls: State of the art review. Struct. Concr. 2019, 20, 886–898. [Google Scholar] [CrossRef]
  2. Elliott, K. Precast Concrete Structures; CRC Press: Boca Raton, FL, USA, 2019; Available online: https://books.google.com/books?hl=en&lr=&id=cjH3DwAAQBAJ&oi=fnd&pg=PP1&ots=49pcPigwZk&sig=Bh94D_d4NmItAz9AoyTnderTyc4 (accessed on 26 August 2022).
  3. Perez, F.J.; Pessiki, S.; Sause, R. Experimental Lateral Load Response of Unbonded Post-Tensioned Precast Concrete Walls. ACI Struct J. 2013, 110, 1045–1056. [Google Scholar] [CrossRef]
  4. Pimanmas, A.; Yooprasertchai, E.; Wiwatrojanagul, P. Cyclic loading test of precast concrete load-bearing walls designed for gravitational loading. Mag. Concr. Res. 2021, 73, 595–607. [Google Scholar] [CrossRef]
  5. Yooprasertchai, E.; Warnitchai, P. Seismic performance of precast hybrid moment-resisting frame/rocking wall systems. Mag. Concr. Res. 2018, 70, 1118–1134. [Google Scholar] [CrossRef]
  6. Yooprasertchai, E.; Hadiwijaya, I.J.; Warnitchai, P. Seismic performance of precast concrete rocking walls with buckling restrained braces. Mag. Concr. Res. 2016, 68, 462–476. [Google Scholar] [CrossRef]
  7. Guo, T.; Zhang, G.; Chen, C. Experimental Study on Self-Centering Concrete Wall with Distributed Friction Devices. J. Earthq. Eng. 2014, 18, 214–230. [Google Scholar] [CrossRef]
  8. Gu, Q.; Dong, G.; Wang, X.; Jiang, H.; Peng, S. Research on pseudo-static cyclic tests of precast concrete shear walls with vertical rebar lapping in grout-filled constrained hole. Eng Struct. 2019, 189, 396–410. [Google Scholar] [CrossRef]
  9. ACI. ACI 318-19: Building Code Requirements for Structural Concrete and Commentary; ACI: Farmington Hills, MI, USA, 2019; Available online: https://www.concrete.org/store/productdetail.aspx?ItemID=318U19&Language=English (accessed on 27 December 2021).
  10. Haber, Z.B.; Saiidi, M.S.; Sanders, D.H. Seismic Performance of Precast Columns with Mechanically Spliced Column-Footing Connections. ACI Struct. J. 2014, 111, 639–650. [Google Scholar] [CrossRef]
  11. Ameli, M.J.; Parks, J.E.; Brown, D.N.; Pantelides, C.P. Seismic evaluation of grouted splice sleeve connections for reinforced precast concrete column-to-cap beam joints in accelerated bridge construction. PCI J. 2015, 60, 80–103. [Google Scholar] [CrossRef]
  12. Ameli, M.J.; Brown, D.N.; Parks, J.E.; Pantelides, C.P. Seismic Column-to-Footing Connections Using Grouted Splice Sleeves. ACI Struct. J. 2016, 113, 1021–1030. [Google Scholar] [CrossRef]
  13. Belleri, A.; Riva, P. Seismic performance and retrofit of precast concrete grouted sleeve connections. PCI J. 2012, 57, 97–109. [Google Scholar] [CrossRef]
  14. Peng, Y.Y.; Qian, J.R.; Wang, Y.H. Cyclic performance of precast concrete shear walls with a mortar–sleeve connection for longitudinal steel bars. Mater. Struct. 2016, 49, 2455–2469. [Google Scholar] [CrossRef]
  15. Soudki, K.A.; Rizkalla, S.H.; LeBlanc, B. Horizontal connections for precast concrete shear walls subjected to cyclic deformations part 1: Mild steel connections. PCI J. 1995, 40, 78–96. [Google Scholar] [CrossRef]
  16. Xiao, S.; Wang, Z.; Li, X.; Harries, K.A.; Xu, Q.; Gao, R. Study of effects of sleeve grouting defects on the seismic performance of precast concrete shear walls. Eng. Struct. 2021, 236, 111833. [Google Scholar] [CrossRef]
  17. Xue, W.; Huang, Q.; Niu, P. Reversed cyclic tests on precast concrete shear walls with grouted corrugated metallic duct connections. Eng. Struct. 2022, 256, 113948. [Google Scholar] [CrossRef]
  18. Zhang, W.; Wang, J.; Zhang, J.; Cao, Y.; Qin, P.; Yi, W. Experimental study on post-fire performance of half grouted sleeve connection with construction defect. Constr. Build. Mater. 2020, 244, 118165. [Google Scholar] [CrossRef]
  19. Popa, V.; Papurcu, A.; Cotofana, D.; Pascu, R. Experimental testing on emulative connections for precast columns using grouted corrugated steel sleeves. Bull. Earthq. Eng. 2015, 13, 2429–2447. [Google Scholar] [CrossRef]
  20. Fan, J.J.; Feng, D.C.; Wu, G.; Hou, S.; Lu, Y. Experimental study of prefabricated RC column-foundation assemblies with two different connection methods and using large-diameter reinforcing bars. Eng. Struct. 2020, 205, 110075. [Google Scholar] [CrossRef]
  21. Zhi, Q.; Kang, L.; Jia, L.; Xiong, J.; Guo, Z. Seismic performance of precast shear walls prestressed via post-tensioned high strength bars placed inside grouted corrugated pipes. Eng. Struct. 2021, 237, 112153. [Google Scholar] [CrossRef]
  22. Hamidian, M.R.; Shafigh, P. Post-peak Behaviour of Composite Column Using a Ductile Lightweight Aggregate Concrete. Int. J. Concr. Struct. Mater. 2021, 15, 16. [Google Scholar] [CrossRef]
  23. McKenna, F. OpenSees: A Framework for Earthquake Engineering Simulation. Comput. Sci. Eng. 2011, 13, 58–66. [Google Scholar] [CrossRef]
  24. Kolozvari, K.; Orakcal, K.; Wallace, J.W. Modeling of Cyclic Shear-Flexure Interaction in Reinforced Concrete Structural Walls. I: Theory. J. Struct. Eng. 2014, 141, 04014135. [Google Scholar] [CrossRef]
  25. Kolozvari, K.; Tran, T.A.; Orakcal, K.; Wallace, J.W. Modeling of Cyclic Shear-Flexure Interaction in Reinforced Concrete Structural Walls. II: Experimental Validation. J. Struct. Eng. 2014, 141, 04014136. [Google Scholar] [CrossRef]
  26. Kolozvari, K.; Orackal, K.; Wallace, J. Shear-Flexure Interaction Modeling for Reinforced Concrete Structural Walls and Columns under Reversed Cyclic Loading; Pacific Earthquake Engineering Research Center, University of California: Berkeley, CA, USA, 2015. [Google Scholar]
  27. Orakcal, K.; Ulugtekin, D. Constitutive Modeling of Reinforced Concrete Panel Behavior under Cyclic Loading. In Proceedings of the 15th World Conference on Earthquake Engineering, Lisbon, Portugal, 24–28 September 2012. [Google Scholar]
  28. Mander, J.B.; Priestley, M.J.N.; Park, R. Observed Stress Strain Behavior of Confined Concrete. J. Struct. Eng. 1988, 114, 1827–1849. [Google Scholar] [CrossRef]
  29. Chang, G.A.; Mander, J.B. Seismic Energy Based Fatigue Damage Analysis of Bridge Columns: Part 1—Evaluation of Seismic Capacity; NCEER Technical Rep. No. NCEER-94; US National Center for Earthquake Engineering Research: Alachua, FL, USA, 1994. [Google Scholar]
  30. Menegotto, M.; Pinto, P.E. Method of analysis for cyclically loaded RC plane frames including changes in geometry and non-elastic behavior of elements under combined normal force and bending. In Proceedings of the IABSE Symposium on Resistance and Ultimate Deformability of Structures Acted on by Well Defined Repeated Loads, Lisbon, Portugal; 1973; pp. 15–22. Available online: https://www.e-periodica.ch/cntmng?pid=bse-re-001:1973:13::9 (accessed on 4 September 2022).
  31. Fllippou, F.E.; Popov, E.P.; Bertero, V.V. Effects of Bond Deterioration on Hysteretic Behavior of Reinforced Concrete Joints. 1983. Available online: https://nehrpsearch.nist.gov/static/files/NSF/PB84192020.pdf (accessed on 4 September 2022).
Figure 1. Structural details of test specimens: (a) specimen RCWS; (b) specimen PCWS; and (c) specimen PGWS (units: mm).
Buildings 13 01433 g001aBuildings 13 01433 g001b
Figure 2. The construction process of shear walls. (a) Construction of RCWS specimen. (b) Sleeves and ducts installed. (c) Concrete casting in PC shear walls. (d) Grouting at wall base. (e) Grouting in sleeve splices. (f) Grouting in duct splices. (g) Erected PC walls.
Buildings 13 01433 g002aBuildings 13 01433 g002b
Figure 3. Applied reverse cyclic loading history.
Buildings 13 01433 g003
Figure 4. (a) Typical test setup and (b) location of LVDTs and strain gages (units: mm).
Buildings 13 01433 g004aBuildings 13 01433 g004b
Figure 5. Evolution of cracks in specimen RCWS.
Buildings 13 01433 g005
Figure 6. Evolution of cracks in specimen PCWS.
Buildings 13 01433 g006
Figure 7. Evolution of cracks in specimen PGWS.
Buildings 13 01433 g007
Figure 8. Failure modes of all specimens. (a) RCWS specimen; (b) PCWS specimen; (c) PGWS specimen.
Buildings 13 01433 g008aBuildings 13 01433 g008b
Figure 9. Hysteretic response of specimen (a) RCWS; (b) PCWS; (c) PGWS; and (d) lateral load-deflection envelopes.
Buildings 13 01433 g009aBuildings 13 01433 g009b
Figure 10. (a) Definition of displacement ductility μ; (b) specimen RCWS, (c) PCWS, and (d) PGWS.
Buildings 13 01433 g010aBuildings 13 01433 g010b
Figure 11. Contribution of various mechanisms to total lateral deformation in specimen (a) RCWS; (b) PCWS; and (c) PGWS.
Buildings 13 01433 g011
Figure 12. Dissipated energy vs. drift ratio relation.
Buildings 13 01433 g012
Figure 13. Secant stiffness vs. drift ratio of all specimens.
Buildings 13 01433 g013
Figure 14. Measured strains on longitudinal reinforcement at various drift ratios for specimens (a) RCWS; (b) PCWS; and (c) PGWS.
Buildings 13 01433 g014
Figure 15. Representation of SFI-MVLEM model and element (credit: opensees.berkeley.edu accessed on 4 May 2023).
Buildings 13 01433 g015
Figure 16. Discretization of the shear wall along the height and length for assigning SFI-MVLEM elements and RC panels, respectively.
Buildings 13 01433 g016
Figure 17. Comparison of predicted vs. experimental hysteretic response for specimens (a) PCWS; (b) RCWS; and (c) PGWS.
Buildings 13 01433 g017
Table 1. Experimental framework.
Type of WallDesignationHeight (mm)Length (mm)Width (mm)
Cast-in-situ wallRCWS1190800120
PC wall with corrugated duct splicesPGWS1190800120
PC wall with grouted sleeve splices PCWS1190800120
Table 2. Properties of concrete and grout.
RCWSPCWSPGWS
Concrete Cylinder Strength (MPa)Footing WallFootingWallFootingWall
34.1332.6834.1332.6834.1332.68
Axial load (kN)150 150 150
Grout (50 × 50 × 50 mm) (MPa)-97.5897.58
Table 3. Properties of steel bars.
Bar TypeYield Strength (MPa)Tensile Strength (MPa)
RB9311.49466.72
DB10412.19620.36
DB12509.45617.58
DB20502.74646.38
Table 4. Summary of peak loads, ductility, and dissipated energy.
IDDirection P m a x   ( kN ) 0.8 P m a x   ( kN ) Δ 0.8 Δ y μ Dissipated Energy (kN-m)
PCWSPush1651323.30.536.2387.6
Pull1931553.10.427.38
RCWSPush1551242.70.446.1476.6
Pull1811453.10.456.89
PGWSPush1511213.10.447.0439.5
Pull1711372.150.583.71
Disclaimer/Publisher’s Note: The statements, opinions and data contained in all publications are solely those of the individual author(s) and contributor(s) and not of MDPI and/or the editor(s). MDPI and/or the editor(s) disclaim responsibility for any injury to people or property resulting from any ideas, methods, instructions or products referred to in the content.

