Article

Development, Calibration, and Validation of a Simulation Model for Indoor Temperature Prediction and HVAC System Fault Detection

1
Faculty of Engineering, University of Rijeka, Vukovarska 58, HR-51000 Rijeka, Croatia
2
Center for Artificial Intelligence and Cybersecurity, University of Rijeka, R. Matejcic 2, HR-51000 Rijeka, Croatia
*
Author to whom correspondence should be addressed.
Buildings 2023, 13(6), 1388; https://doi.org/10.3390/buildings13061388
Submission received: 30 March 2023 / Revised: 23 May 2023 / Accepted: 24 May 2023 / Published: 26 May 2023
(This article belongs to the Special Issue Study on Building Energy Efficiency Related to Simulation Models)

Abstract

:
An effective approach to increasing energy efficiency in buildings without compromising thermal comfort is to optimize heating, ventilation, and air conditioning (HVAC) systems through the use of advanced building-management system features, such as fault detection and diagnosis. Such functions are usually developed based on simulation models that must be calibrated and validated to achieve an appropriate level of accuracy and reliability. The objective of this study was to develop and calibrate a room-level simulation model of a hotel building and its HVAC system using TRNSYS 18 software and real data collected from the smart room system installed in the building. The calibration process was performed with 100 rooms using 5-min samples of room temperatures in selected 1-month periods during the summer and winter seasons by minimizing the root mean squared error (RMSE) in the average of the observed rooms using a genetic algorithm. The calibrated model was able to predict room temperatures with an RMSE of 0.79 ± 0.14 °C and a coefficient of variation in the root mean squared error (cvRMSE) of 3.58 ± 0.7%, which is well below the limits prescribed by international guidelines. The model was then applied to detect faults in the operation of fan coil units in the rooms based on the residual analysis and defined if–then rules. The results obtained show that the model can track the trends of temperature changes in real conditions and successfully detect major anomalies in a system.

1. Introduction

Climate change, caused by increasing greenhouse gas (GHG) emissions due to human activities, is of major concern worldwide. The buildings sector contributes significantly to this problem, both directly through GHG emissions and indirectly through energy consumption. Buildings account for around 34% of global final energy consumption and 33% of energy- and process-related GHG emissions, with heating, ventilation, and air-conditioning (HVAC) systems playing a significant role [1]. Increasing energy efficiency in buildings without compromising occupant comfort is critical to reducing their environmental impact.
To reduce both energy consumption and GHG emissions in this sector, the development of energy-efficient, environmentally friendly and sustainable buildings, such as net-zero-energy/emission buildings, and the refurbishment of existing buildings are required [2]. The mainly renewable-energy-based technical systems in these buildings must be equipped with efficient, properly installed and commissioned components controlled by advanced building automation and control systems. Significant improvements in reducing energy consumption and GHG emissions in existing buildings can already be achieved in a simple, cost-effective and sustainable manner by implementing smart technologies and control algorithms in HVAC systems that optimize their performance and avoid unnecessary energy waste [3].
The control of HVAC systems in most buildings currently relies on rule-based methods [4]. However, a promising approach for improvement is model predictive control, which aims to save energy by predicting future events and controlling system operation based on these predictions [5,6]. In addition, detection and diagnosis of faults in HVAC systems can also contribute to energy savings, as faulty operation can lead to increased energy demand and affect occupant thermal comfort [7]. The two strategies for improving control and troubleshooting are based on developing a model of the building and its systems that can simulate specific features such as indoor temperatures.
Models for predicting building energy consumption and indoor temperatures can be developed using different techniques—white-box, black-box, and grey-box—with each technique having its own advantages and disadvantages [8,9,10]. In white-box models, the thermal behavior of the building and its HVAC system is described by physical laws. The advantages are interpretable results, high accuracy in cases where all required information is known, universality of modeling tools, and the fact that white-box models can be created without historical data on building operation. However, model creation requires detailed specification of physical parameters, expertise, and some effort, which can lead to less accurate results than other modeling techniques when model simplifications and constraints must be applied. In contrast, black-box models—also called data-driven models—use only data collected in the field for modeling. The models are generally more accurate than white-box models when detailed information about building physics is lacking, and they can be adjusted and extended with newly collected data. On the other hand, the results obtained cannot be physically explained, the accuracy of the models under previously unknown working conditions is unreliable, and high-quality and informative data sets are needed. Finally, grey-box models—also called hybrid models—combine and balance the advantages of both modeling techniques. Grey-box models, resistance-capacitance (RC) networks, or physical models integrated with data-driven algorithms are easier to build than white-box models because simplified equations describing physical effects are used, and they can provide interpretable results; however, development tools need to be improved and methods standardized.
White-box models, which remain the most widely used, are useful tools for architectural design, energy performance evaluation and prediction, and system component and management optimization [11]. Software programs typically used for white-box model development include TRNSYS, EnergyPlus, and IDA Indoor Climate and Energy (IDA-ICE). One problem that can arise during model development is the divergence between simulated and measured results due to uncertainties in the design variables [9]. To reduce or eliminate this so-called performance gap and increase reliability, calibration is required, which is defined as the process of adjusting the input parameters in the model with the goal of improving agreement with real data [12,13]. The building envelope properties, infiltration rates, internal heat gain density, and some specific HVAC system variables are often used as adjustable parameters in this process, which can be very computationally intensive, especially when each parameter needs to be fine-tuned. To reduce the complexity, the process can focus on the most influential parameters, which are determined by sensitivity analysis [14]. Calibration can generally be performed manually or automatically. In manual methods, improvements are often achieved through trial and error in adjusting some key parameters of the model, but these methods also require expert knowledge and evidence-based processes (building audits). Automatic methods are usually formulated as optimization problems that can be solved using optimization techniques such as genetic algorithms. The calibration process can have one or multiple objectives, with hourly indoor temperatures and monthly electricity consumption being the most common. The calibration performance of energy-consumption simulation models is typically evaluated using the normalized mean bias error (nMBE) and coefficient of variation of the root mean squared error (cvRMSE), recommended by the American Society of Heating, Refrigerating and Air Conditioning Engineers (ASHRAE) and the International Performance Maintenance and Verification Protocol (IPMVP). These same indices are also widely used to assess the calibration performance of indoor temperature prediction models. However, the mean absolute error (MAE) and root mean squared error (RMSE) are more accurate and reliable metrics for this purpose and should be used instead [15]. The calibration process remains a difficult and time-consuming task due to the lack of clear guidelines and best practices [13].

1.1. Related Work

In recent years, there have been several studies that have investigated the use of different models and calibration methods for temperature prediction in buildings. In their study, Arendt et al. [16] compared white-box, grey-box, and black-box models and found that the black-box models provided the most accurate temperature predictions in most cases, with an average mean absolute error of the best such model of 0.4 °C, compared to 1.0 °C for the grey-box and 0.7 °C for the white-box model. The white-box model was advantageous for working conditions not included in the original data set. O’Donovan et al. [17] created a white-box model of a nearly zero-energy building (nZEB) to predict indoor temperatures at the room level, focusing on three specific rooms and accounting for occupancy schedules and window-opening strategies. After manually calibrating the model created in TRNSYS, the accuracy of the temperature prediction, as measured by the RMSE metric, ranged from 0.27 °C to 1.5 °C, with an average cvRMSE of up to 20%. Guyot et al. [18] performed a manual calibration of a white-box model of an office building with 132 thermal zones and achieved a temperature prediction accuracy of about ±2 °C compared to the measured values. The calibration was performed over one year of simulation with a time step of five minutes. Pachano and Bandera [15] created a white-box model of a school complex with 27 thermal zones for hourly predictions of heating and cooling, electricity consumption, and indoor air temperatures. They achieved an RMSE of 0.29 °C by dividing the calibration process of the model into several steps and automated it using a genetic algorithm. Baba et al. [19] developed an automated method to calibrate the building simulation model using the hourly indoor temperatures in multiple rooms simultaneously. By incorporating a variance-based sensitivity analysis of the most influential building parameters, a multi-objective genetic algorithm for calibration, and some newly developed evaluation criteria, they achieved a temperature prediction accuracy of 0.3 °C, measured by the RMSE of a school building modeled in EnergyPlus. Figueiredo et al. [20] proposed a multi-stage hybrid evolutionary algorithm for the calibration of building simulation models, which they applied to a college building. Their building model consisted of 24 thermal zones. The proposed optimization procedure was validated by comparing hourly simulated and measured data for one year in two test rooms. They obtained RMSE values for the rooms of 1.17 °C and 1.33 °C, respectively, and cvRMSE values of 4.5% and 5.4%, respectively. Royapoor and Roskilly [21] investigated the accuracy of an EnergyPlus model for a five-story office building. They emphasized the importance of using local weather data in the calibration process to minimize errors. The calibrated model predicted annual hourly indoor air temperatures with an error of ±1.5 °C and a cvRMSE value of less than 2%. Rosato et al. [22] developed a detailed simulation model of a laboratory test room and its HVAC system in TRNSYS and achieved an RMSE of 0.39 °C when comparing with measured data. They used the model to set up fault detection for the HVAC system by analyzing the variations in sensory measurements. In [23], Roberti et al. pointed out the importance of calibrating building models with more than a single parameter, especially for old houses and incomplete information about their construction. They proposed a calibration method based on a particle swarm optimization algorithm. The model created in EnergyPlus was validated with hourly indoor air and surface temperatures, with an RMSE between 0.4 °C and 0.8 °C. Kosak and Stadler [24] pointed out the importance of including storage mass in thermal energy modeling when predicting temperatures in thermal zones. Inappropriate settings and methods for modeling thermal mass can lead to a deviation in model prediction results of up to 26% [13]. Martínez-Ibernón et al. [25] compared two modeling approaches for predicting indoor air temperatures and relative humidity in buildings, the first considering the common modeling assumption of a completely dry building envelope and the second considering the presence of moisture in the building elements. By simulating an unheated building as a single thermal zone in TRNSYS, they obtained more accurate results in the second case (an RMSE of 1.35 °C compared to 1.65 °C in the first case), indicating the influence of humidity on heat balance and air temperature prediction. Martínez-Mariño et al. [26] created a combined multi-zone airflow model for buildings using TRNSYS and TRNFLOW to predict indoor temperatures and relative humidity considering occupancy and moisture gains, window and door opening, and mechanical ventilation. Using a multi-objective calibration with a genetic algorithm, they obtained average RMSE values for indoor temperatures of 0.51 °C and 0.48 °C (cvRMSE 2.27% and 2.15%) and for relative humidity of 3.58% and 2.21% (cvRMSE 13.8% and 6.5%), respectively, for two case study houses. They emphasized the need to model moisture buffering in walls to accurately predict indoor relative humidity. Murphy et al. [27] developed a grey-box model for nZEB using an automatic calibration algorithm and compared it to a white-box model. Although the white-box model produced slightly more accurate results, with a 1.5% difference in the RMSE metric, the grey-box model significantly reduced development time and effort. Berthou et al. [28] created a grey-box model using multiple RC networks. Determining the number of resistances and capacitances is the most important step in building the model. They found that the R6C2 model gave the best results for temperature prediction, in terms of both accuracy and complexity. Belić et al. [29] presented an inverse modeling approach for indoor temperature prediction in multi-zone buildings using a RC model network based on building data. They compared the results of their model with measured temperatures and arrived at an RMSE value of 0.33 °C for the optimized model and 0.64 °C when applying the same model to another data set with similar working conditions. Cui et al. [30] created a hybrid model by combining a RC network and an artificial neural network (ANN). The RC model was used to predict the mean indoor air temperature of a two-story single-family house, while the ANN model was used to predict the temperature difference between two thermal zones (two floors) in the house. They compared the simulation results with measurements and obtained an average RMSE of the hybrid model of 0.64 °C.
When simulating building energy performance, outdoor conditions, building fabric, and occupant behavior must be considered [7,31]. Solar radiation and outdoor temperatures have a great impact on indoor thermal dynamics, as noted in the study by Aguilera et al. [32]. The main uncertainty factor in the simulations is the occupants’ behavior, as they have control over windows, lights, shading, and set temperatures [33,34]. Usually, occupants’ actions are modeled as fixed schedules with constant values [35]. In addition, interactions with adjacent spaces must also be considered, as heat flows along the path of least resistance from areas of higher temperature to those of lower temperature [36].
A detailed simulation model can be used to detect anomalies in an HVAC system. Discrepancies between simulated thermal responses and real field measurements may indicate errors in system operation. Anomalies can be detected by analyzing deviations from fault-free trends of residuals calculated from the differences between predicted and measured values at specific time periods [37]. In recent studies, dynamic simulation models for fan coil units have been used to simulate thermal behavior and find errors in the system [38,39]. Such white-box models can generate a labeled data set for normal and faulty operation and allow implementation of data-driven techniques in automatic detection algorithms [40].

1.2. Contribution and Structure

This study presents the development, calibration, and validation of a white-box model for predicting indoor temperatures in a hotel building. Temperatures were simulated under real conditions using data collected from the smart room system installed in the building several years ago. The simulations took into account occupant activity, window opening, HVAC system control logic in the rooms, and external weather conditions. The goal of the model development was not only to simulate the room temperatures but also to detect anomalies in the HVAC system operation, especially related to the fan coil units in the rooms.
The literature search revealed that there are not many studies that specifically address temperature prediction in hotel rooms. HVAC systems in hotels can be very complex, room occupancy fluctuates, and guest behavior is stochastic and depends on their expectations and comfort preferences, which affects HVAC system operation and window opening. All of this introduces many uncertainties into a simulation model that is intended to be applied to every room in the building, which calls into question its accuracy and reliability. It is also not common to have such an extensive database of room-specific data, as is the case in this work, thanks to the records of the smart-room system.
The contribution of this study can be summarized in the following points:
  • TRNSYS 18 software was used to develop a room-level simulation model of a hotel building in Zagreb, Croatia, and its HVAC (fan coil) system. Each room was set up as a separate thermal zone with appropriate boundary conditions and designed using the Google SketchUp 3D 2021 tool. To simplify and speed up the simulations, the model was created for a single room and applied to all rooms with similar physical characteristics by changing the room-specific parameters. In this way, the accuracy and reliability of the model in predicting indoor temperatures was increased relatively quickly through its calibration and validation with a genetic algorithm. The sensitivity analysis identified the most influential building and HVAC operating parameters, which were later used in the calibration process. Python scripts were developed to automatically create and run new simulations and process the results. Summer and winter seasons were considered, and the performances of the original (baseline) model and the calibrated model were compared.
  • The simulations were fed with five-minute samples of real data collected over several years from the smart-room system installed in the hotel and integrated with the central building automation and control system. The data included temperature control logic, room occupancy, window opening, HVAC system status, and operating mode in each hotel room. Incorporating all of this data made developing the model challenging, but its accuracy is within the acceptable limits of the VDI, ASHRAE, and IPMVP guidelines. It has been shown to be applicable to any room in the building with similar characteristics but specific input parameters.
  • The developed model has been used to detect anomalies associated with the operation of fan coil units in the rooms. It has successfully revealed the main anomalies in the system. However, further tests and diagnostics need to be performed to confirm the anomalies and their real causes. As a next step, the model should help develop more advanced automatic fault detection and diagnosis routines based on machine learning techniques that can be implemented in the building’s smart-room system in the future.
This article is organized as follows. Section 2 first presents the materials used to build the simulation model. This includes a description of the case study hotel building, the collection of field data, and the operation and control of the HVAC system. Then, all the steps used to create the thermal model of the building and the simulation environment are explained, as well as the model calibration and validation processes. The results are presented and discussed in Section 3. Finally, conclusions are drawn in Section 4.

2. Materials and Methods

The objective of this study was to create a reliable white-box or simulation model of the guest rooms of the case study hotel. The model includes the rooms, each of which is considered a separate thermal zone, the HVAC system equipment in the rooms, the HVAC system control logic, and details about real-world conditions. The main purpose of the model is to predict the room air temperatures and detect possible anomalies associated with the HVAC system.
The following sections first describe the hotel building used for model development, the components of the HVAC system in the rooms and its control system, the available multi-year field data recorded independently by the installed smart-room system for each room in the building, and the weather data. The methods used to develop and calibrate the model are then presented.

2.1. Building Description

The case study building in the research was a hotel in Zagreb, Croatia (45°48´ N, 16°0´ E; site elevation 112 m). The building has 16 floors, 9 of which are occupied by guest rooms. All floors with rooms have the same floor plan and room layout, except for the last two. Each floor consists of 24 rooms, 20 of which have a floor area of 26 m2 and 4 of which have a floor area of 32 m2. The height of a room is 2.6 m. All rooms of the same size have an identical floor plan, with a bedroom and a bathroom for two people. Figure 1 shows the floor plan of a representative floor, including the overall dimensions of the building. Below and above the floors with the guest rooms are some public areas and offices, which were not considered in detail. The hotel is surrounded by other buildings on the east, north, and west sides, with the south side facing the wide avenue. The buildings on the west side are much lower, and those on the east and north sides are about half the height, partially shading the hotel and protecting it from direct wind gusts.
Table 1 lists the building elements of the smaller rooms and shows the properties of each element layer, all derived from the main architectural design of the building. In Table 1, δ represents the thickness of the layer, λ the thermal conductivity, c the specific heat capacity, ρ the density, and A the surface area of an element. The windows consist of an aluminum frame and two layers of IZO glass, with an inert gas between them. Their overall heat transfer coefficient (U-value) and solar heat gain coefficient are 1.10 W/(m2K) and 0.33, respectively, and each window has an area of 8.65 m2. Apart from the manually operated curtains, there are no shading devices on the windows.
Each room is equipped with a four-pipe fan coil unit (FCU) that can both heat and cool depending on actual temperature conditions and guest needs. The bathroom does not have an additional heating element. The FCU is connected to a central mechanical ventilation system of the hotel. All features of the HVAC system come from the designer’s as-built documentation and the FCU manufacturer´s technical specifications.
A smart-room system installed in each room controls and monitors all systems in the room, such as FCU operation and lighting, and provides security through alarms. All sensory measurements and control outputs are stored by the central controller of the smart-room system for easy access and analysis. Overall management of all systems installed in the hotel is handled by the central building automation and control system.

2.2. HVAC System and Control Logic

The FCU in every room consists of an air filter, a fan, a hot-water heating coil, a chilled-water cooling coil, and two control valves. Each unit has 3 fan speeds and a rated capacity of 1600 W for both heating and cooling at nominal values (Table 2). It recirculates room air but is also continuously supplied with fresh air from the central mechanical ventilation system at a flow rate of 60 m3/h at design temperature and humidity. The same amount of air is extracted from the bathroom. The water supply temperature in heating mode depends on the outdoor air temperature (weather compensation function under control by the central building automation and control system) and is 70 °C under nominal working conditions at −15 °C outdoors, while the water supply temperature in cooling mode is 9 °C. In the off-season, guests can switch between heating and cooling modes, while in other seasons, only one mode is available. Despite the installation of a four-pipe system, the unit can only heat during the winter season and cool during the summer season. If a guest switches to cooling mode during the winter season or to heating mode during the summer season, the unit will only ventilate the space.
Control of the FCU in this setting is based on the use of two thermostats, one for cooling mode and one for heating mode. These thermostats operate at three different levels and control the fan speeds accordingly. The activation of these speeds depends on the difference between the set temperature and the measured room temperature. The set temperature is determined by the central smart-room system control but can be changed by guests at any time. There are two modes for regulating the speed of the FCU: automatic and manual. In automatic mode, the fan speed is automatically changed according to the control logic. In manual mode, guests have the option to adjust the fan speed themselves. Guests also have the ability to turn the unit on and off at will.
The control logic of the system also takes into account special cases such as opening windows. When the window is opened, the control system automatically turns off the FCU to save energy.

2.3. Data Gathering

The smart-room system installed in the hotel collected data from 166 guest rooms at a sampling rate of 5 min between 2013 and 2021. While this sampling rate did not capture all possible events, the data still provide insight into the performance of the system. Table 3 lists and describes the data collected.
Prior to developing the simulation model, the data were analyzed and processed. The data set contained missing and erroneous values that were identified and replaced with linearly interpolated values. The HVAC system also had some issues with its control logic due to system maintenance. The periods where problems occurred were excluded from the model calibration and validation processes. Preprocessing was necessary to ensure high-quality data for accurate model calibration.
In addition to the data collected at the hotel, outdoor conditions recorded by the Croatian Meteorological and Hydrological Service at a nearby weather station were also used [41]. The multi-year weather data, stored in a database as hourly averages of 10 min samples, were partially preprocessed to implement them in the model. The data used to represent the external environment are listed in Table 4.

2.4. Simulation Model Development and Calibration

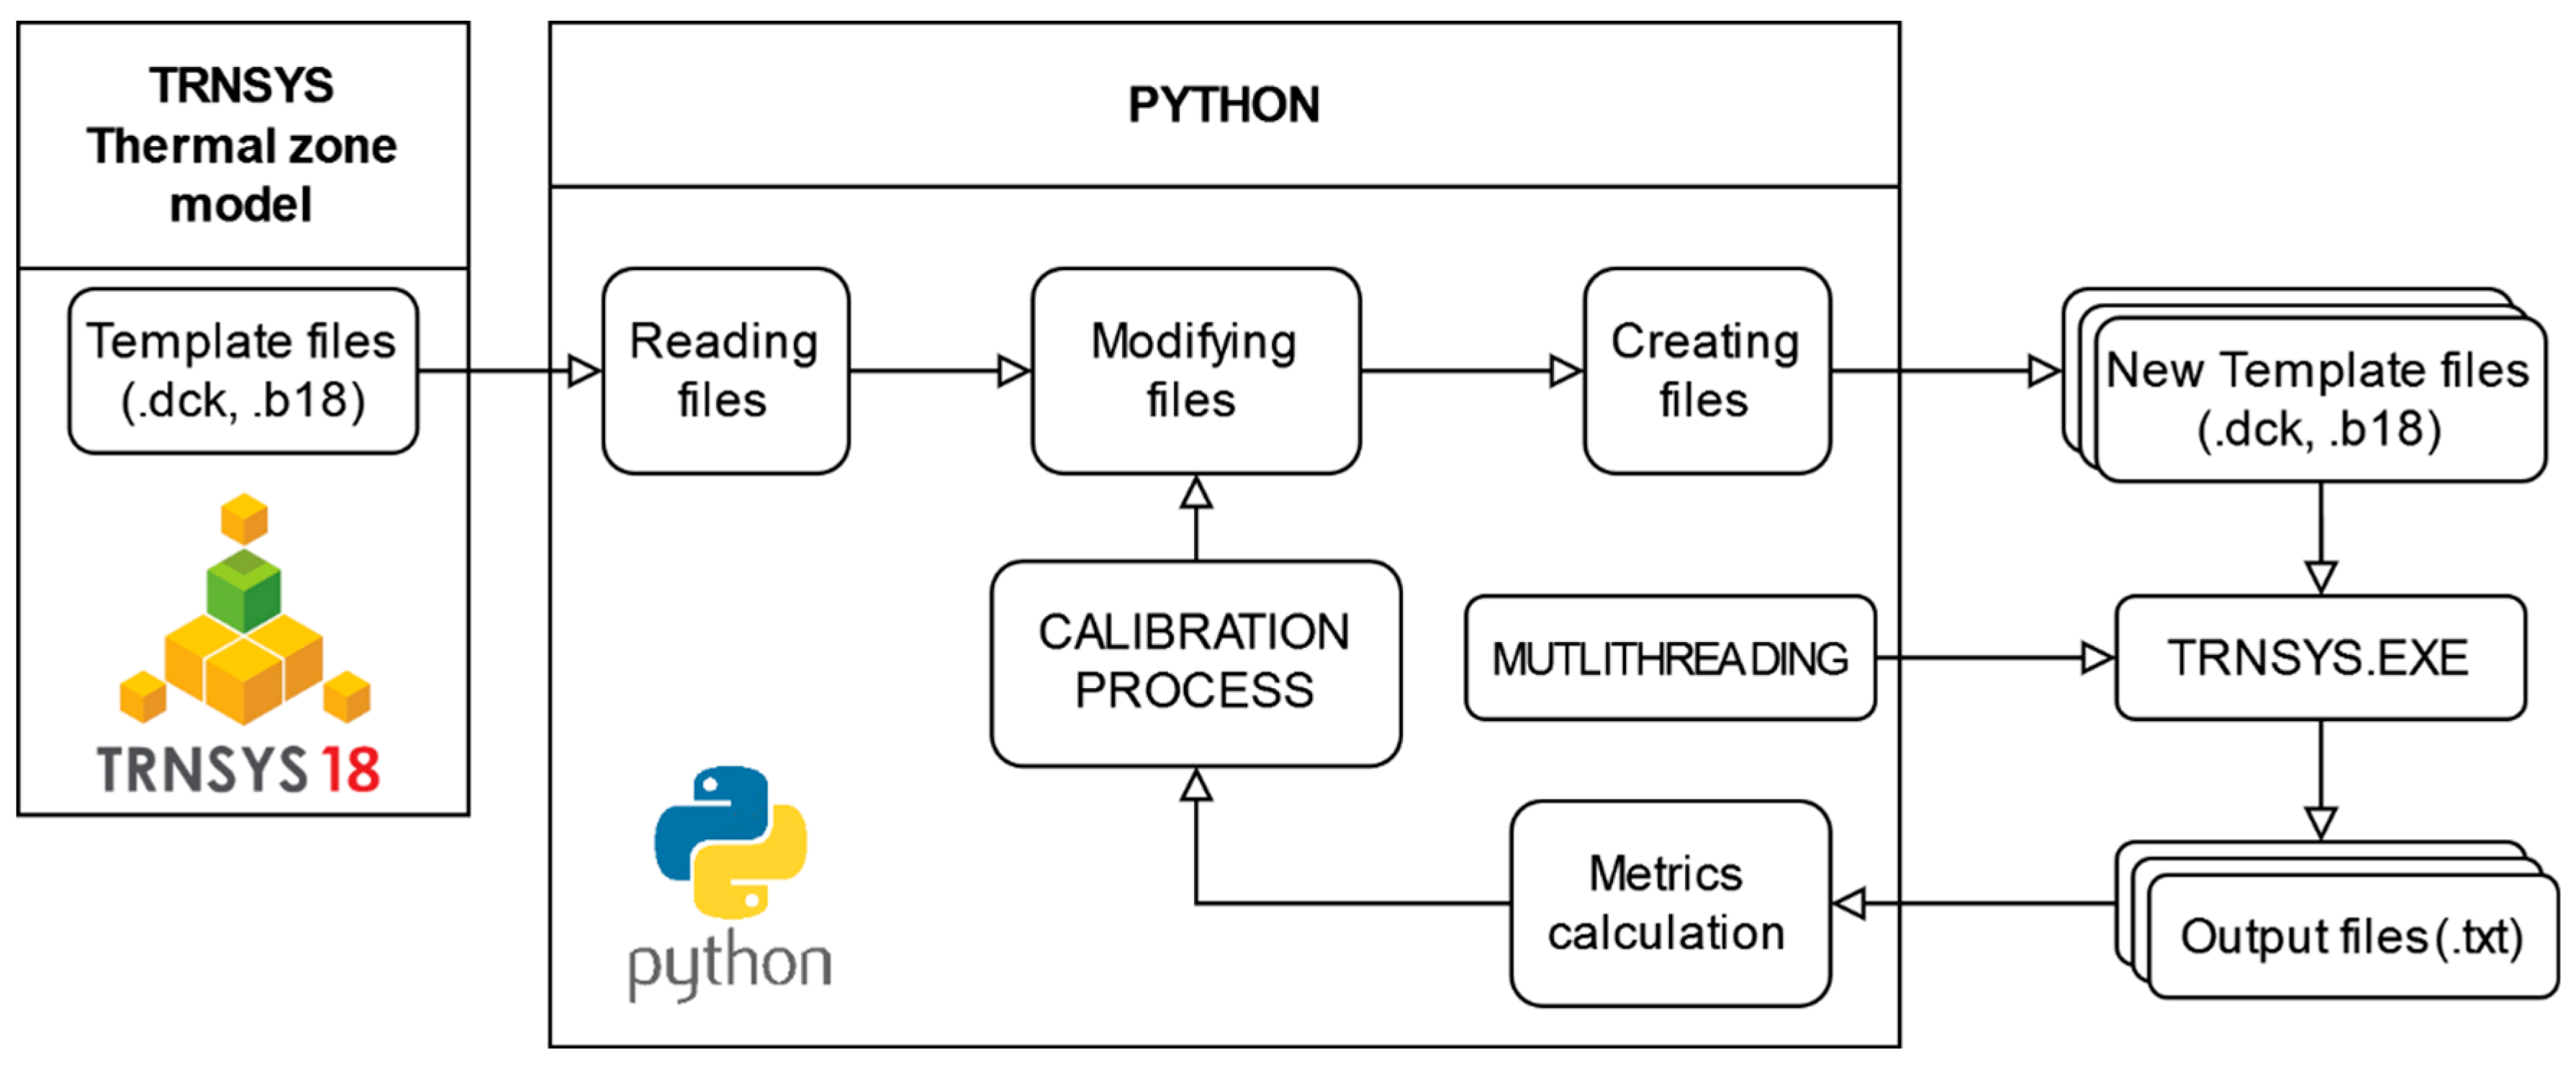
Based on the previous description of the hotel, its FCU system, and the available data, the building model was developed in a simulation environment. Figure 2 shows a flowchart illustrating the process of creating and calibrating the simulation model, which includes the creation of multiple simulations and model optimization. Several software solutions are used, including TRNSYS 18 [42] to develop the model and simulate the thermal behavior of the building and its FCU system, Google SketchUp 3D 2021 to define the geometry of the thermal zones, and Python to run the simulations and perform the calibration process.

2.4.1. Thermal Zone Modeling

The development of a building simulation model usually begins with the division of the interior spaces into thermal zones. In this study, each room of the hotel was considered as a separate thermal zone. In addition, the bedroom and bathroom in each room were combined into a single space. This was possible because the bathrooms do not have their own heating elements and the temperatures in the bathrooms are similar to those in the bedrooms. In order to simplify and speed up the design process, while also taking into account the design of the smart-room system and the ultimate goal of the current project to upgrade this system with new features at the room level, it was decided to create a multi-zone thermal model consisting of a single room and the adjacent spaces (other rooms and public areas). Therefore, the model simulates one room at a time, taking into account the corresponding room parameters and inputs. The adjacent thermal zones are defined only to calculate the heat exchange between them and the simulated room, not to predict the temperatures in these spaces. In the simulations, the temperatures of the adjacent zones correspond to the temperatures recorded by the smart-room system (if the adjacent spaces are other rooms) and to the design temperatures (if the adjacent spaces are public areas whose actual temperatures are not included in the smart-room system records).
The shape and dimensions of the thermal zones are developed based on architectural descriptions of the building in Google SketchUp 3D 2021 using the trnsys3d plugin. The simulated room and adjacent spaces are configured in the model in terms of the room’s position in the building and orientation. All non-geometric information required for model development is created in TRNBuild, including building envelope composition and material properties, internal heat gains, and infiltration and ventilation rates. The composition of the building elements is also taken from architectural descriptions. The material properties of the element layers used are listed in Table 1. All other parameters are listed in Table 5. Internal heat gains are generated only by people when they are in the room. Infiltration is defined as a constant inflow of outside air at the specified rate. When windows are open, natural ventilation occurs and is simulated by increasing the air change rate to an empirically determined value during the simulations. The room ventilation is set to draw air from the FCU (according to the manufacturer’s specifications and depending on the fan speed) and fresh air from the central mechanical ventilation system.

2.4.2. Simulation Model

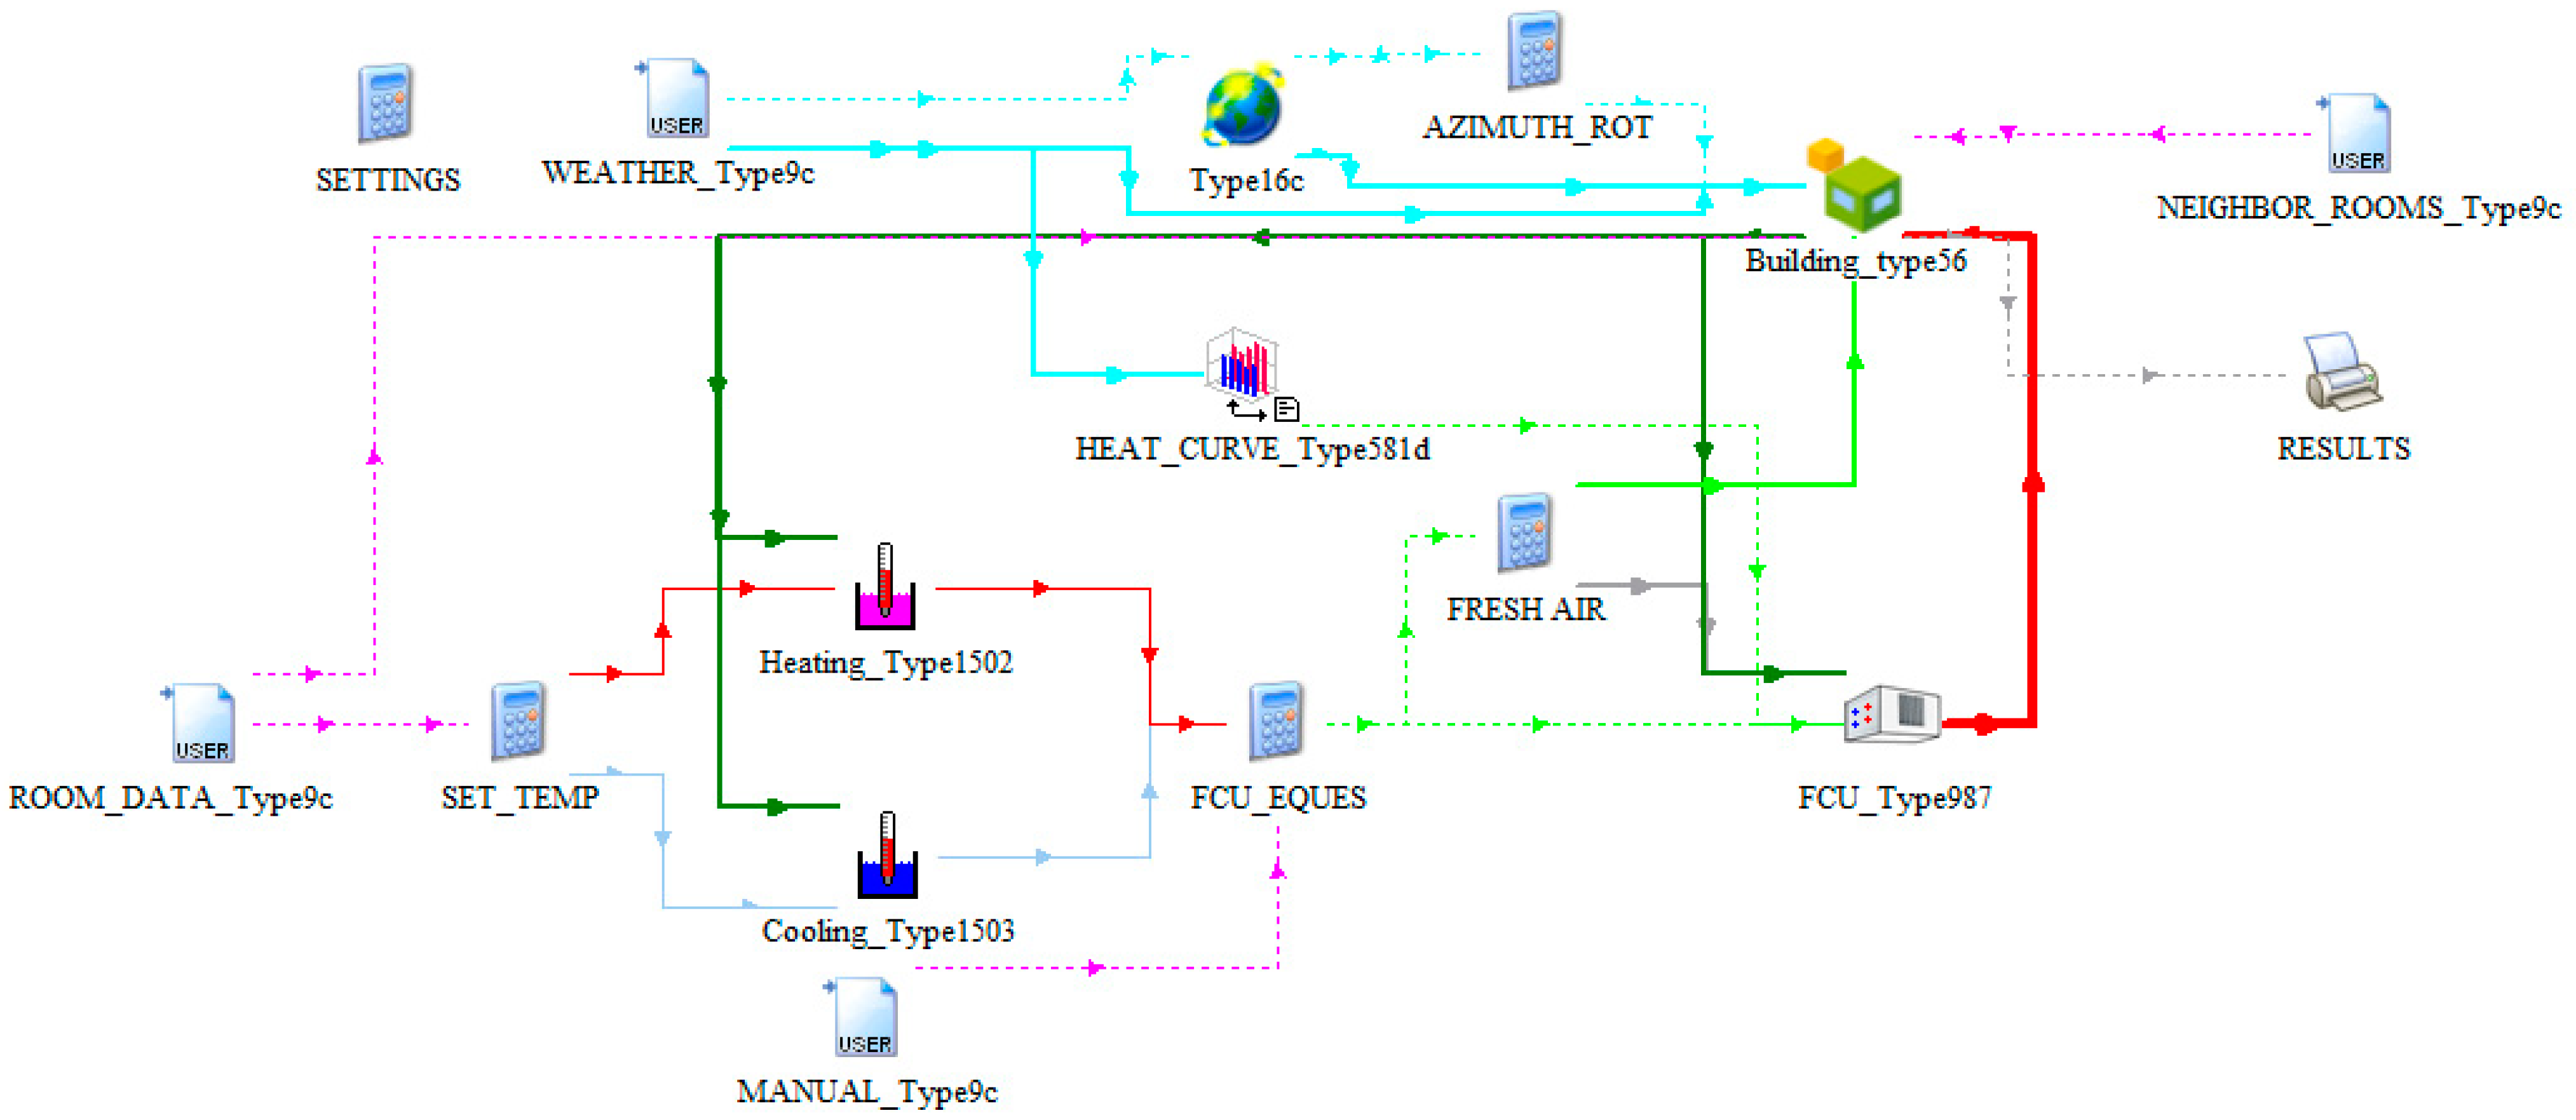
Figure 3 shows the simulation model for temperature prediction developed in TRNSYS 18 Simulation Studio. It consists of the multi-zone thermal model of the building described in the previous subsection, the FCU model, the control logic, the input files, and weather data processing.
The component Type 56 BUILDING models the thermal behavior of the thermal zones—the simulated room and the adjacent spaces—taking into account their position in the building and their orientation. The component calculates the air temperatures in the rooms.
Four blocks of Type 9c components import into the model specific room and weather data for each simulation time step from the records of the smart-room system or the weather database:
  • ROOM DATA contains room-specific information on setpoint temperature, occupancy, window status, HVAC status, and HVAC mode;
  • MANUAL affects the HVAC system by setting the FCU fan speed desired by guests;
  • NEIGHBOR ROOMS inputs the recorded temperatures of adjacent rooms and the design temperatures of public areas into the model to create boundary conditions for heat exchange with these spaces;
  • WEATHER is used to create ambient conditions for the model.
Outdoor temperature and relative humidity data from the weather database are used directly in the simulation model without additional processing. Before the solar radiation data is included in the model, the solar irradiance on the zonal outdoor surfaces is calculated using the solar radiation processor Type 16c. The equation component AZIMUTH ROT defines the angle of the zonal surfaces and changes the azimuth angle of the sun depending on the position (orientation) of the currently simulated room in the building. The component Type 581d HEAT CURVE provides a weather compensation function to calculate the hot water supply temperature for the FCU.
The Type 987 component simulates the operation of the FCU based on a generated performance map with operating data provided by the manufacturer. Outputs from the component include discharge temperature, relative humidity, and airflow supplied to the room.
The room control system consists of two thermostats—one for heating mode (Type 1502) and one for cooling mode (Type 1503). The control actions are based on the outputs of two equation components. The equation component SET TEMP calculates temperature setpoints for various fan speeds and turns off the FCU based on window and HVAC status. The FCU EQUES component controls the operation of the FCU, taking into account the manual mode of the system.
The equation component FRESH AIR models the supply of fresh air to the space by the central mechanical ventilation system through the FCU. Depending on whether the FCU is active or not, the fresh air is supplied either through the FCU or directly.
Once the simulation is complete, the component RESULTS saves the simulation results, which are then processed.

2.4.3. Model Evaluation

The performance evaluation of the developed model includes the evaluation of the temperature prediction for each simulated room. According to [13], the mean bias error (MBE) and root mean squared error (RMSE) are common metrics for this purpose. The MBE reflects the extent to which the simulation model overestimates or underestimates the actual response, while the RMSE provides a more accurate representation of simulation performance by measuring the root of the squared error between the simulated and actual values. They are calculated using the following equations:
M B E = 1 n p i = 1 n ( y m , i y s , i ) ,
R M S E = 1 n p i = 1 n y m , i y s , i 2 ,
where y m represents the measured values, y s represents the simulated values, n represents the number of samples, and p represents the number of parameters to be calibrated. In this study, the value of parameter p is set to zero [18]. The criterion for valid simulations is that the RMSE must be less than or equal to 1.5 °C [15,44].
The accuracy of energy consumption calculations is typically evaluated using normalized versions of Equations (1) and (2): normalized mean bias error (nMBE) and coefficient of variation in root mean squared error (cvRMSE). Both the MBE and RMSE are normalized using the mean of the measured values. The nMBE indicates the overall bias of the model but is subject to cancelation errors because it takes into account the sign of the average error vector and should not be used alone. The cvRMSE reflects the relative magnitude of the errors with respect to the scale of the target variable and takes into account only the distance between the values, overcoming the cancelation error. In the literature, the abbreviations MBE or MBE (%) are sometimes used when referring to nMBE, which may lead to confusion [17,45]. Therefore, a precise distinction between nMBE and MBE is made in this work. nMBE and cvRMSE are calculated using the following equations:
n M B E = M B E 1 n i = 1 n y m , i · 100 % ,
c v R M S E = R M S E 1 n i = 1 n y m , i · 100 % .
Equations (3) and (4) can also be used to evaluate temperature prediction simulations and make the results comparable with other studies [15]. For the simulations to be considered valid, cvRMSE and nMBE should meet the conditions specified in the ASHRAE [46] or IPMVP [47] guidelines. The maximum allowable values depend on the time step of the calibration (monthly or hourly). The following are the conditions for the cvRMSE and nMBE metrics in the case of hourly calibration:
  • ASHRAE: cvRMSE  30% and nMBE  ± 10%;
  • IPMVP: cvRMSE  20% and nMBE  ± 5%.

2.4.4. Calibration Process

The process of calibration is an important step to improve the accuracy and reliability of the simulation model. It is part of the optimization process aimed at finding the optimal model design parameters that minimize the difference between the predicted and actual values. Genetic algorithms are often used to solve this optimization problem in order to minimize the error in temperature simulation [48].
During the development of the simulation model, case-specific files were created that contained all the information of the model. Any changes to the design parameters could be made by modifying these files. To automate the simulation and calibration process, Python was used to read and modify the files, run simulations, process the results, calculate metrics, and perform the calibration process itself (Figure 2). When modifying the files, two types of parameters need to be processed: room-specific and calibration parameters.
In order to run simulations for all observed rooms, the room orientation and Type 9c component input files (i.e., set temperatures, occupancy schedules, etc.) must be modified accordingly for each room. Once the new files were created, the simulations were run in parallel by calling on the TRNSYS 18 executable program with 100 rooms and a simulation time step of 5 min. All rooms had the same size and geometry, but they had different data inputs. The obtained results were evaluated, and the metrics were calculated.
This procedure was repeated for each change in the parameters of the calibration process made by a genetic algorithm. The parameters of the calibration process or the genes of the genetic algorithm were the parameters of the building envelope and FCU operation. The most influential of them had been previously identified by sensitivity analysis. With the calibration parameters, the input files are changed and the process requires another set of simulations for all the rooms. The hyperparameters of the genetic algorithm were adapted to this particular problem. The crossover operator was configured as a single-point crossover and the mutation operator as a single-gene mutation. Individuals were selected from a pool of solutions using tournament selection. The population was uniformly initialized.
A key component of the calibration process is a fitness function. The average value of the RMSE metric calculated for each simulated room was incorporated in the fitness function to provide an overall evaluation of each solution. The fitness function was defined using the following equation:
F i t n e s s   f u n c t i o n = 1 n r o o m i = 1 n r o o m R M S E r o o m , i ,
where R M S E r o o m , i refers to the prediction accuracy for one room and n r o o m is the total number of simulated rooms. The calibration process was completed when a set of design parameters of the model was determined that resulted in the minimum value of the fitness function.
The model calibration was divided into one-month summer and winter seasons. After the calibration process was completed, the model was evaluated again for another period to validate the obtained solution. The baseline model was also included in the validation period to investigate the biases. Table 6 shows the calibration and validation periods for the winter and summer seasons.

2.5. Fault Detection in an HVAC System

HVAC systems in buildings can encounter problems during operation that may reduce thermal comfort and increase energy consumption. Using the case study building and the HVAC system in its rooms as an example, these problems can include a stuck FCU control valve, reduced airflow rate due to a dirty filter or fan problem, faulty FCU control due to room temperature sensor bias, window sensor failure, etc. All of these issues can lead to inadequate performance of the HVAC system and failure to achieve the desired thermal environment. To create an automated control function to detect anomalies or faults, a simulation model such as the one described in the previous subsections can be applied to identify major differences between measured temperatures and simulated temperatures that persist over an extended period of time (e.g., 3 or more Kelvin averaged over several hours or days, depending on the fault), taking into account fan speed, HVAC mode, HVAC state, window opening, and room occupancy. To this end, a set of if–then rules and thresholds must be established. Additional verification of the fault detection results can be conducted by comparing the evaluated performances in the room in question with the performances in a similar room.

3. Results and Discussion

In this section, the results of the calibration and validation of the simulation model for both the winter and summer seasons are presented and discussed. The results for the baseline model and the calibrated model show the distribution of temperature simulation accuracy across all 100 simulated rooms. In addition, line plots of temperatures for representative rooms are included for both models. Finally, an example of an HVAC system malfunction in a guest room that was detected by the created model is presented.
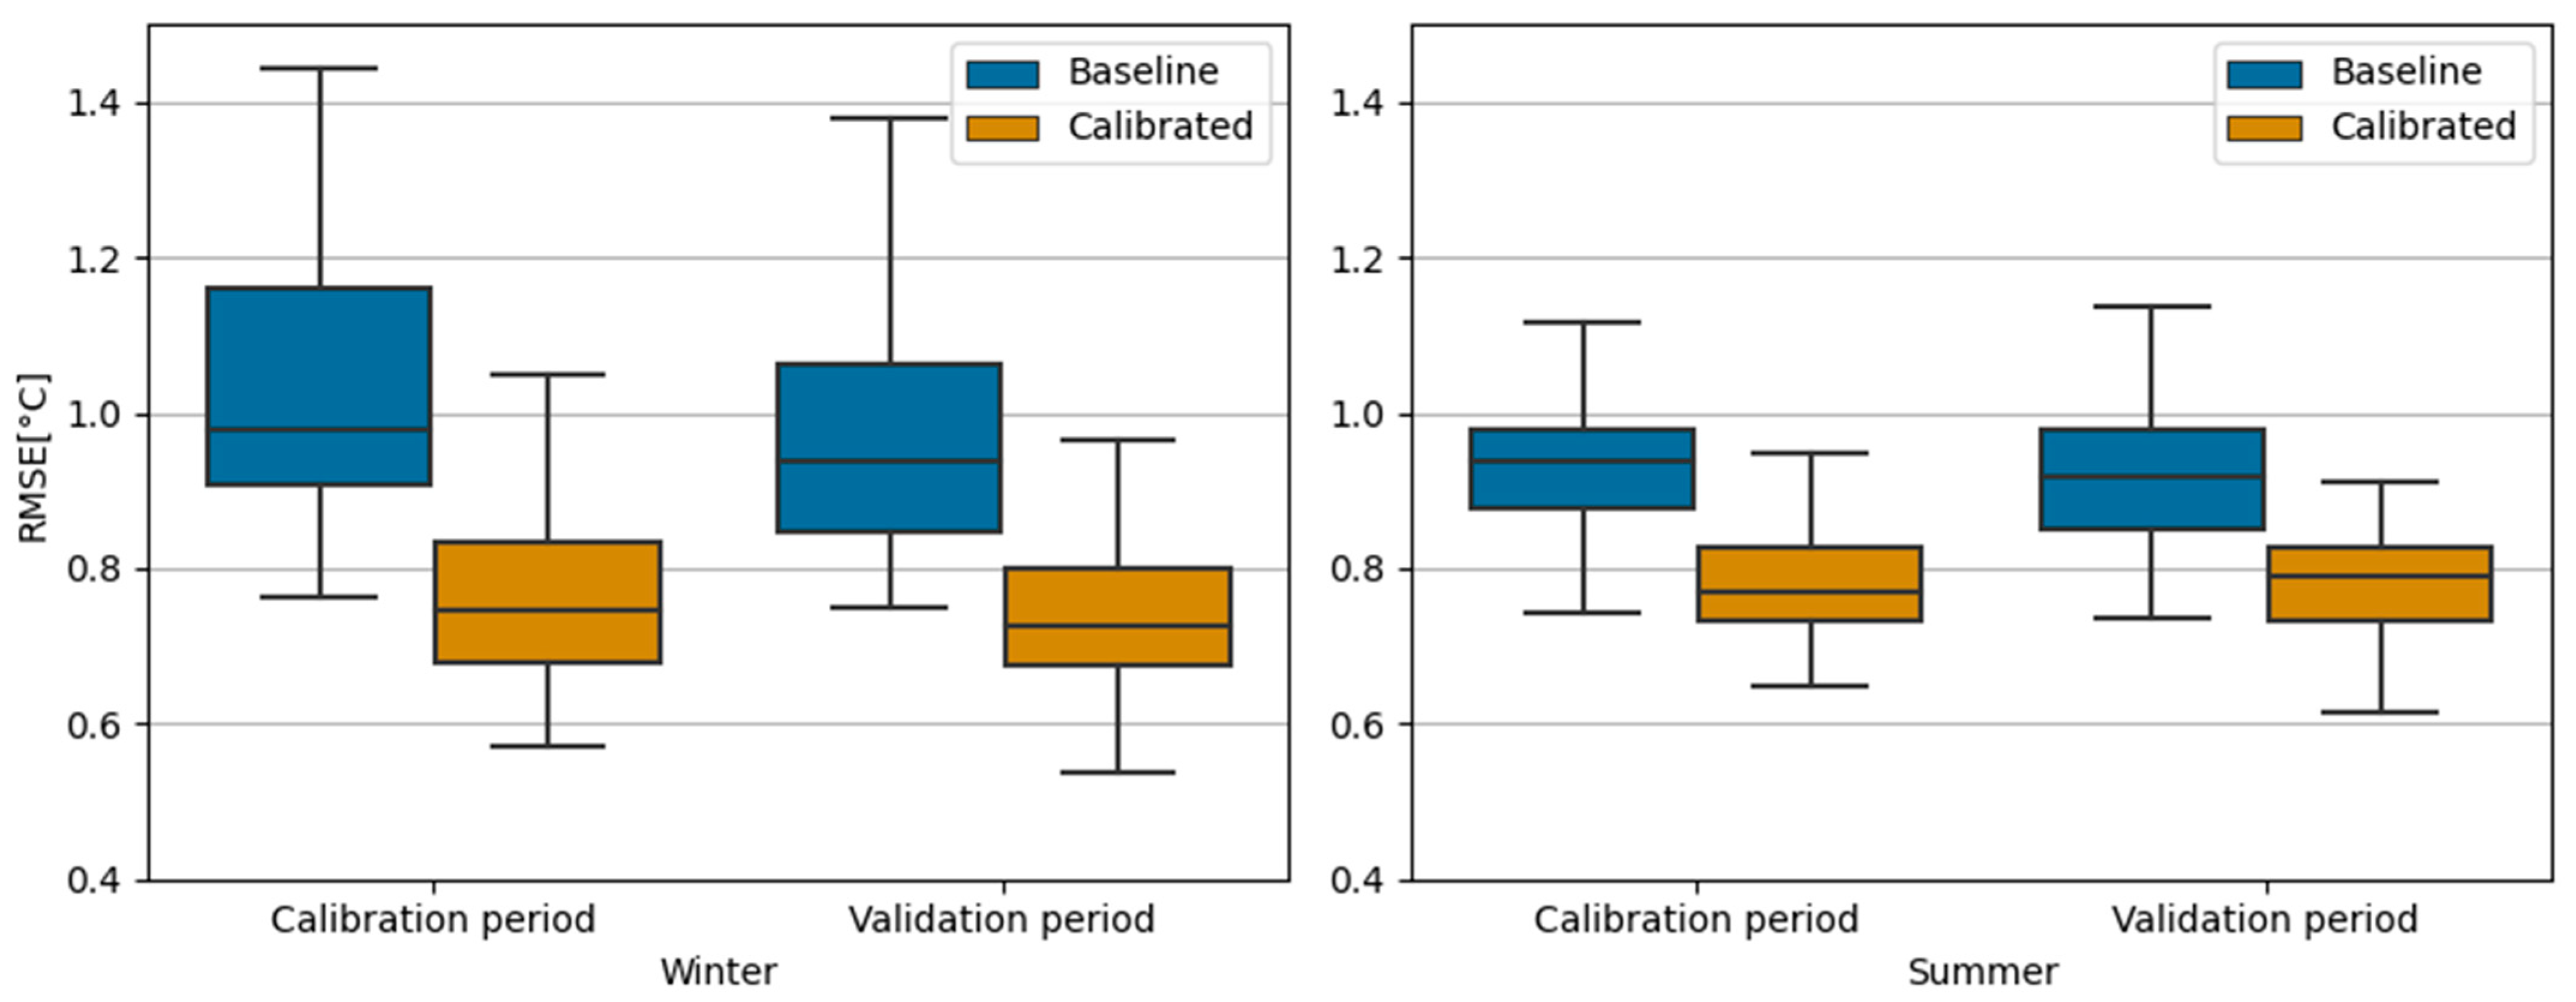
Figure 4 depicts the distribution of RMSE values for all simulated rooms. The results are shown for each season for both the baseline model and the calibrated model. In the winter-season period chosen for the calibration process (Table 5), the baseline model produced errors between 0.91 °C and 1.16 °C with a median value of 1 °C, while the errors of the calibrated model in the same period ranged between 0.67 °C and 0.83 °C with a median value of 0.74 °C. This corresponds to an improvement of 0.25 °C on average. The errors varied in values between rooms due to the different input settings and conditions for each room. For the validation process, the baseline model gave slightly better results than for the calibration process, averaging 0.1 °C for all rooms. The errors of the calibrated model did not change during the validation process, and the results remained the same as during the calibration process, with an improvement of 0.23 °C over the baseline model. During the summer-season calibration, the baseline model had errors between 0.87 °C and 0.98 °C with a median of 0.93 °C, while the errors of the calibrated model were between 0.73 °C and 0.82 °C with a median of 0.76 °C. The results of the calibrated model are improved by 0.17 °C on average. The results of the validation process also confirmed that the calibrated model is not overfitted and can be used in other seasons.
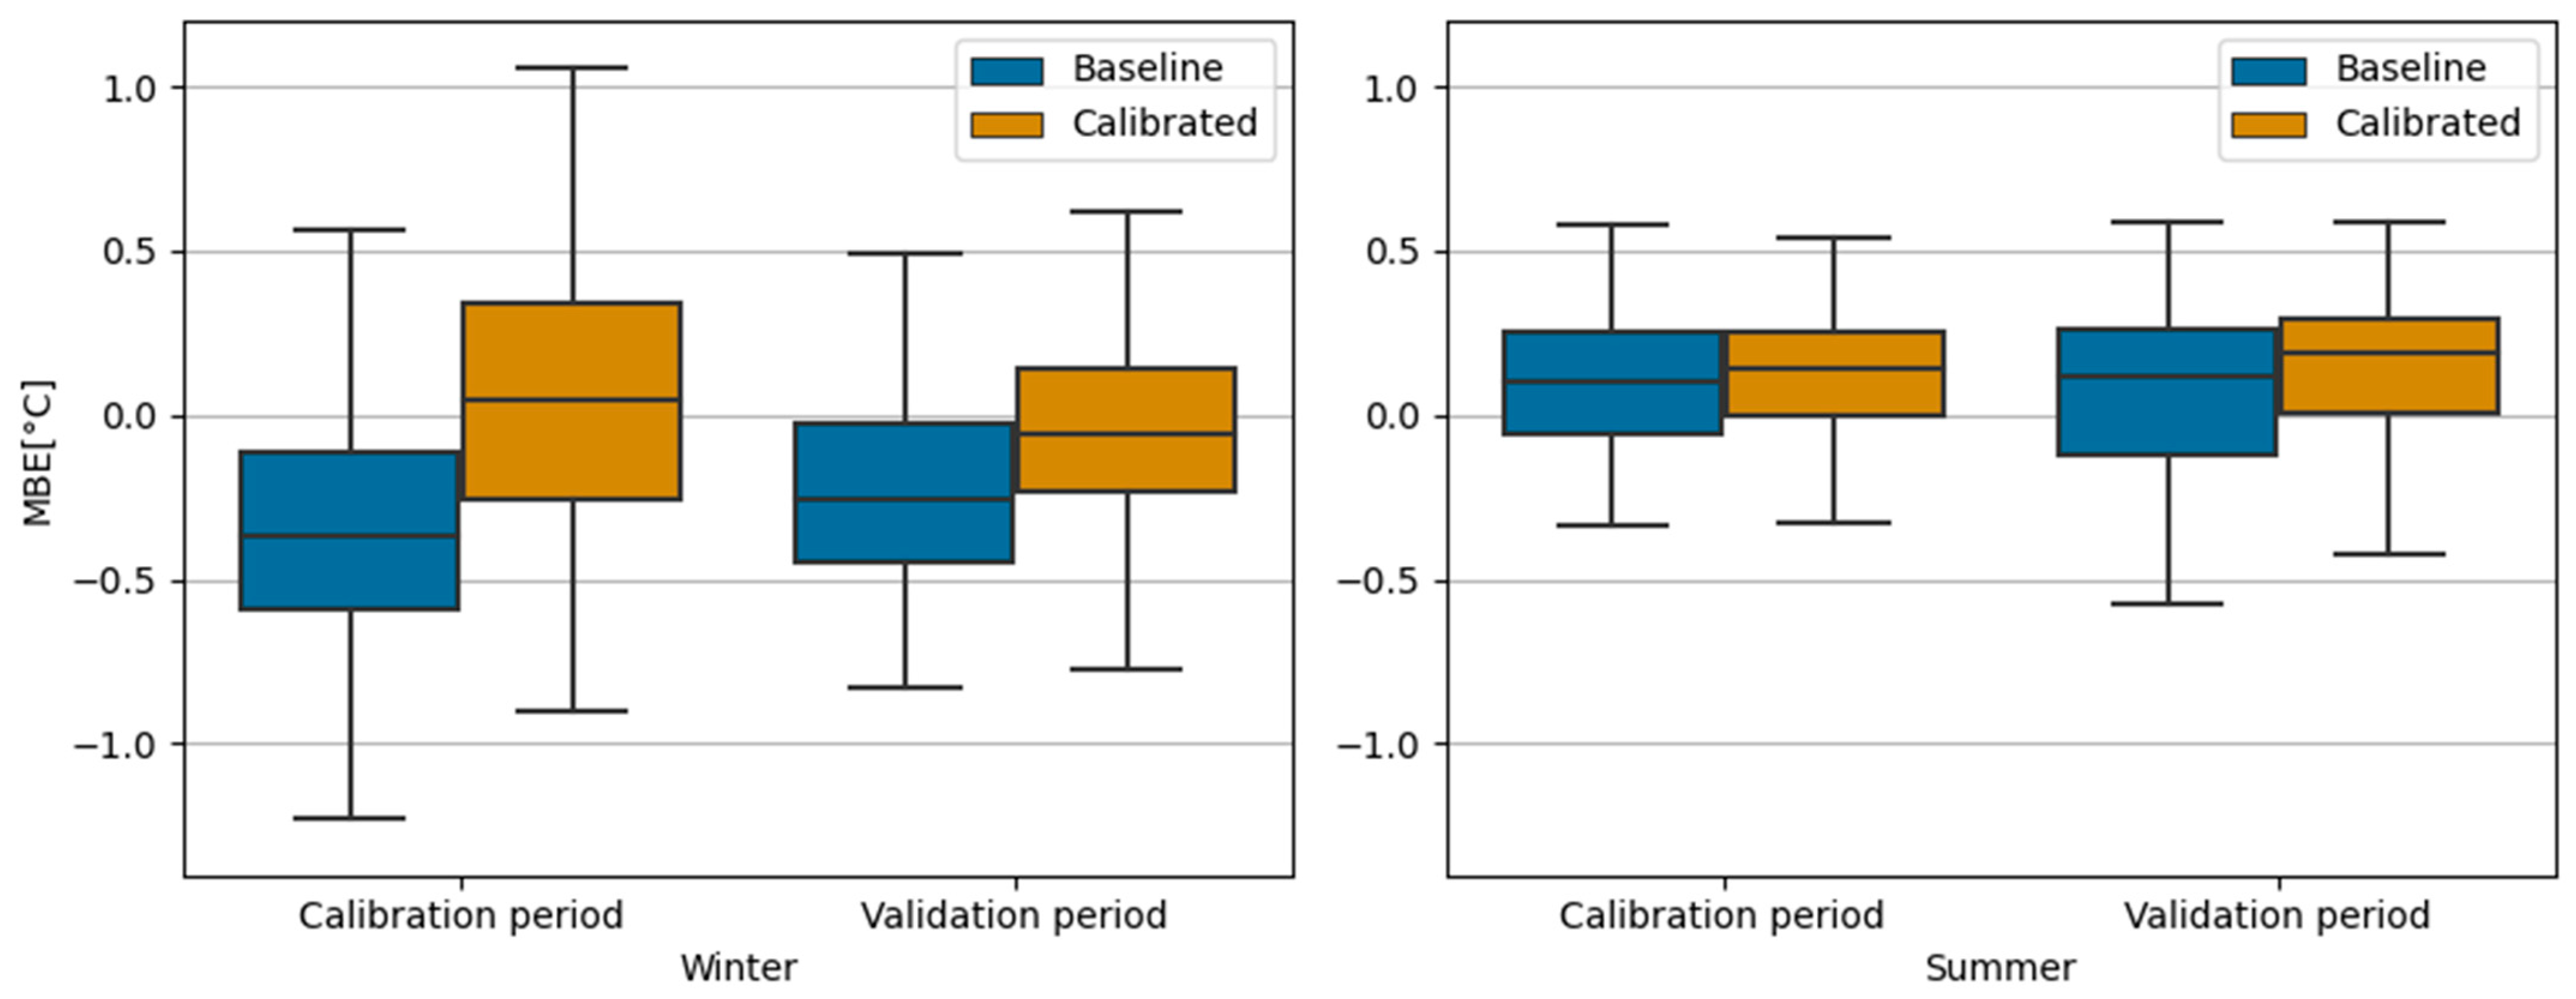
Figure 5 illustrates the distribution of MBE values in the winter and summer seasons selected for the calibration and validation processes for both the baseline model and the calibrated model. For the winter-season calibration process, the baseline model produced results between −0.59 °C and −0.11 °C, with a median value of −0.36 °C, while the errors of the calibrated model ranged between −0.25 °C and 0.34 °C, with a median value of 0.04 °C. These results indicate that the calibrated model improved the MBE metrics and neither underestimated nor overestimated the measured temperatures in most rooms. On the other hand, the baseline model consistently underestimated the measured temperatures. The results for both models for the validation process differed from those for the calibration process only in distribution, but the median value remained in the same range. The MBE results for the validation process were more compactly distributed and had a smaller spread of up to 0.1 °C compared to the results for the calibration process.
For the summer-season calibration process, the MBE results for the baseline model and the calibrated model ranged from −0.05 °C to 0.25 °C, with a median value of about 0.1 °C. This shows that the baseline model was already providing good solutions and the calibrated model was not improved in this respect. Both models overestimated the measured temperatures by 0.1 °C on average. The two models differed in the divergence of results for the summer-season validation period, but the median values remained in the same range. During the summer season, both models overestimated temperatures, with no improvement from the calibrated model.
Table 7 shows the mean values of all metrics used to evaluate the performance of the baseline model and the calibrated model for the winter and summer seasons. Based on the results for the calibration process, the cvRMSE of the calibrated model was 22% better than that of the baseline model. During the validation process, the cvRMSE metric was improved by 19%. The same percentage improvements were obtained for the RMSE metric. For the nMBE metric, the values of the calibrated model for the calibration and validation processes outperformed the baseline model by 42% and 59%, respectively. Although the performance of the calibrated model deteriorated during the summer season for the nMBE metric, the overall performance improved. The calibration process achieved better results for temperature prediction.
The calibrated model had to be evaluated in periods other than those used for the calibration process to confirm its validity and stability, because during calibration, it is possible to overfit the parameters of the model to the measured data from that period. Therefore, the validation process is crucial to confirming the calibration results. The baseline model also needed to be tested during the validation period to detect any deviations in the corresponding data set, such as those caused by interruptions in system operations or temporary hotel closures that could result in different temperature behavior than during the calibration period. The calibration and validation results were similar for both the baseline model and the calibrated model. However, differences were found between rooms due to various factors such as orientation, guest comfort preferences, and window openings. In addition, hotel room occupancy during the summer and winter months can affect the accuracy of the model, with higher occupancy resulting in higher system utilization.
The performance of both the baseline model and the calibrated model met the requirements of the German standard VDI 6020, which specifies a maximum temperature prediction error of 1.5 °C. The models also met ASHRAE and IPMVP guidelines regarding hourly calibration. However, it is important to note that these guidelines are primarily for validation of energy consumption models and not for indoor temperature prediction models. The ASHRAE guideline limits the values of the cvRMSE and nMBE metrics to 30% and 10%, respectively, while the IPMVP sets these values to 20% and 5%, respectively. The calibrated model achieved an average temperature prediction error of 0.79 ± 0.14 °C measured with the RMSE metric and 3.58 ± 0.7% measured with the cvRMSE metric, which is well below the allowable limits. Both the RMSE and cvRMSE metrics were improved by an average of 20% compared to the baseline model results.
The average errors obtained are generally of the same order of magnitude as in the literature reviewed, but a direct comparison of the results is only possible when modeling the same building. Timing and fixing the values of some input parameters, modeling a smaller number of thermal zones, and simpler systems make it easier to obtain better prediction results. In this study, each of the 100 simulated rooms is a special case with its own occupancy, window-opening schedule, and FCU operating conditions. Therefore, the most important indicators of the model’s performance are compliance with existing guidelines and case-specific tolerances of errors.
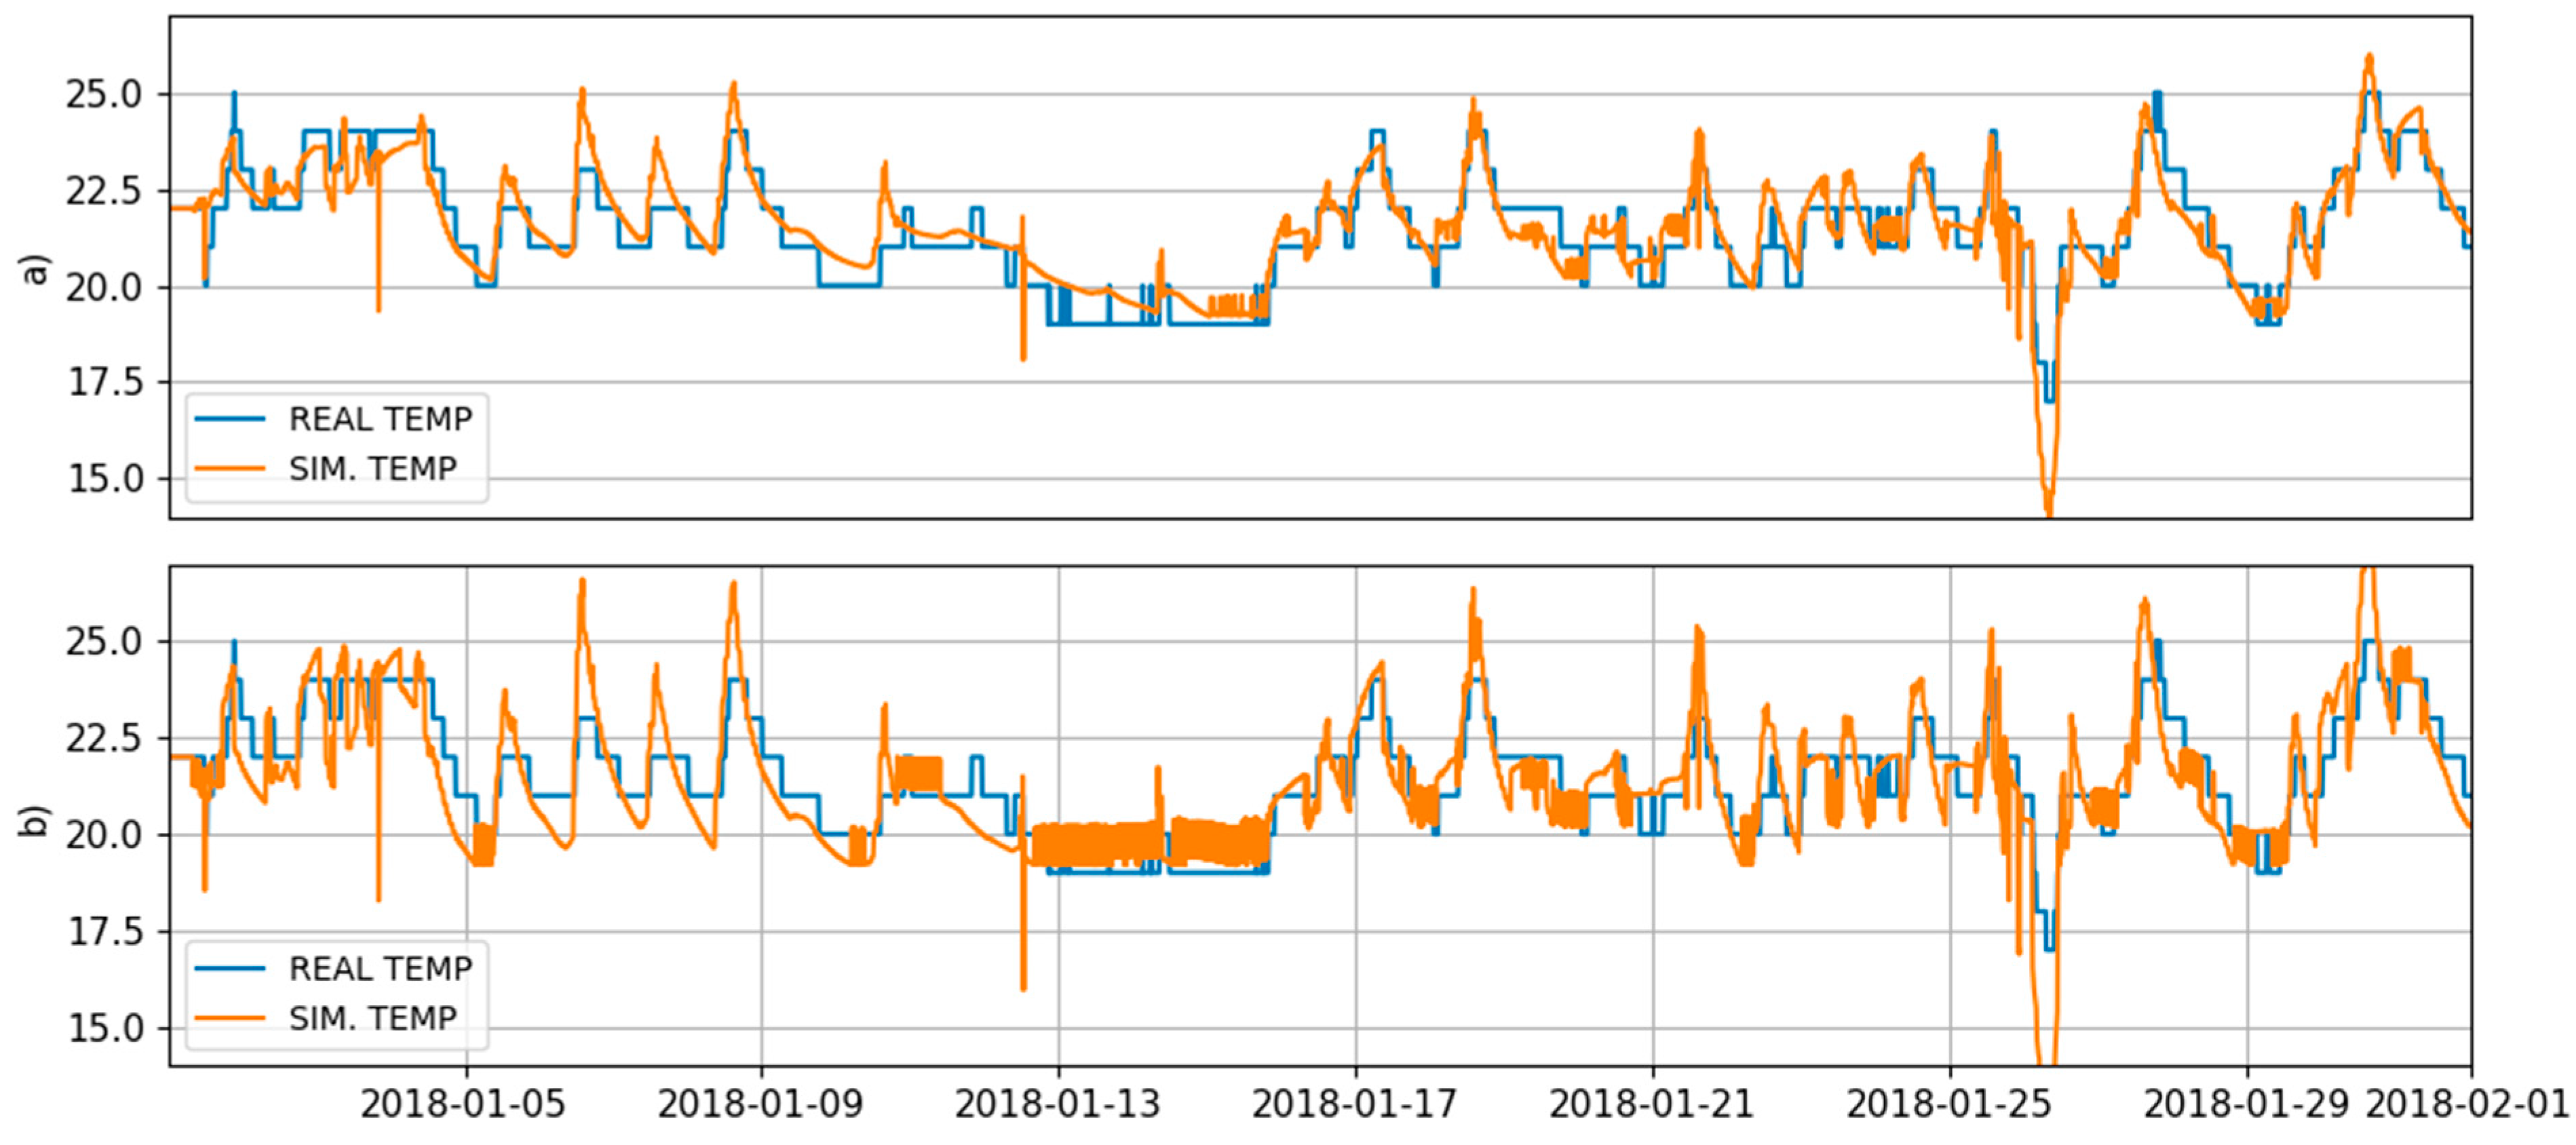
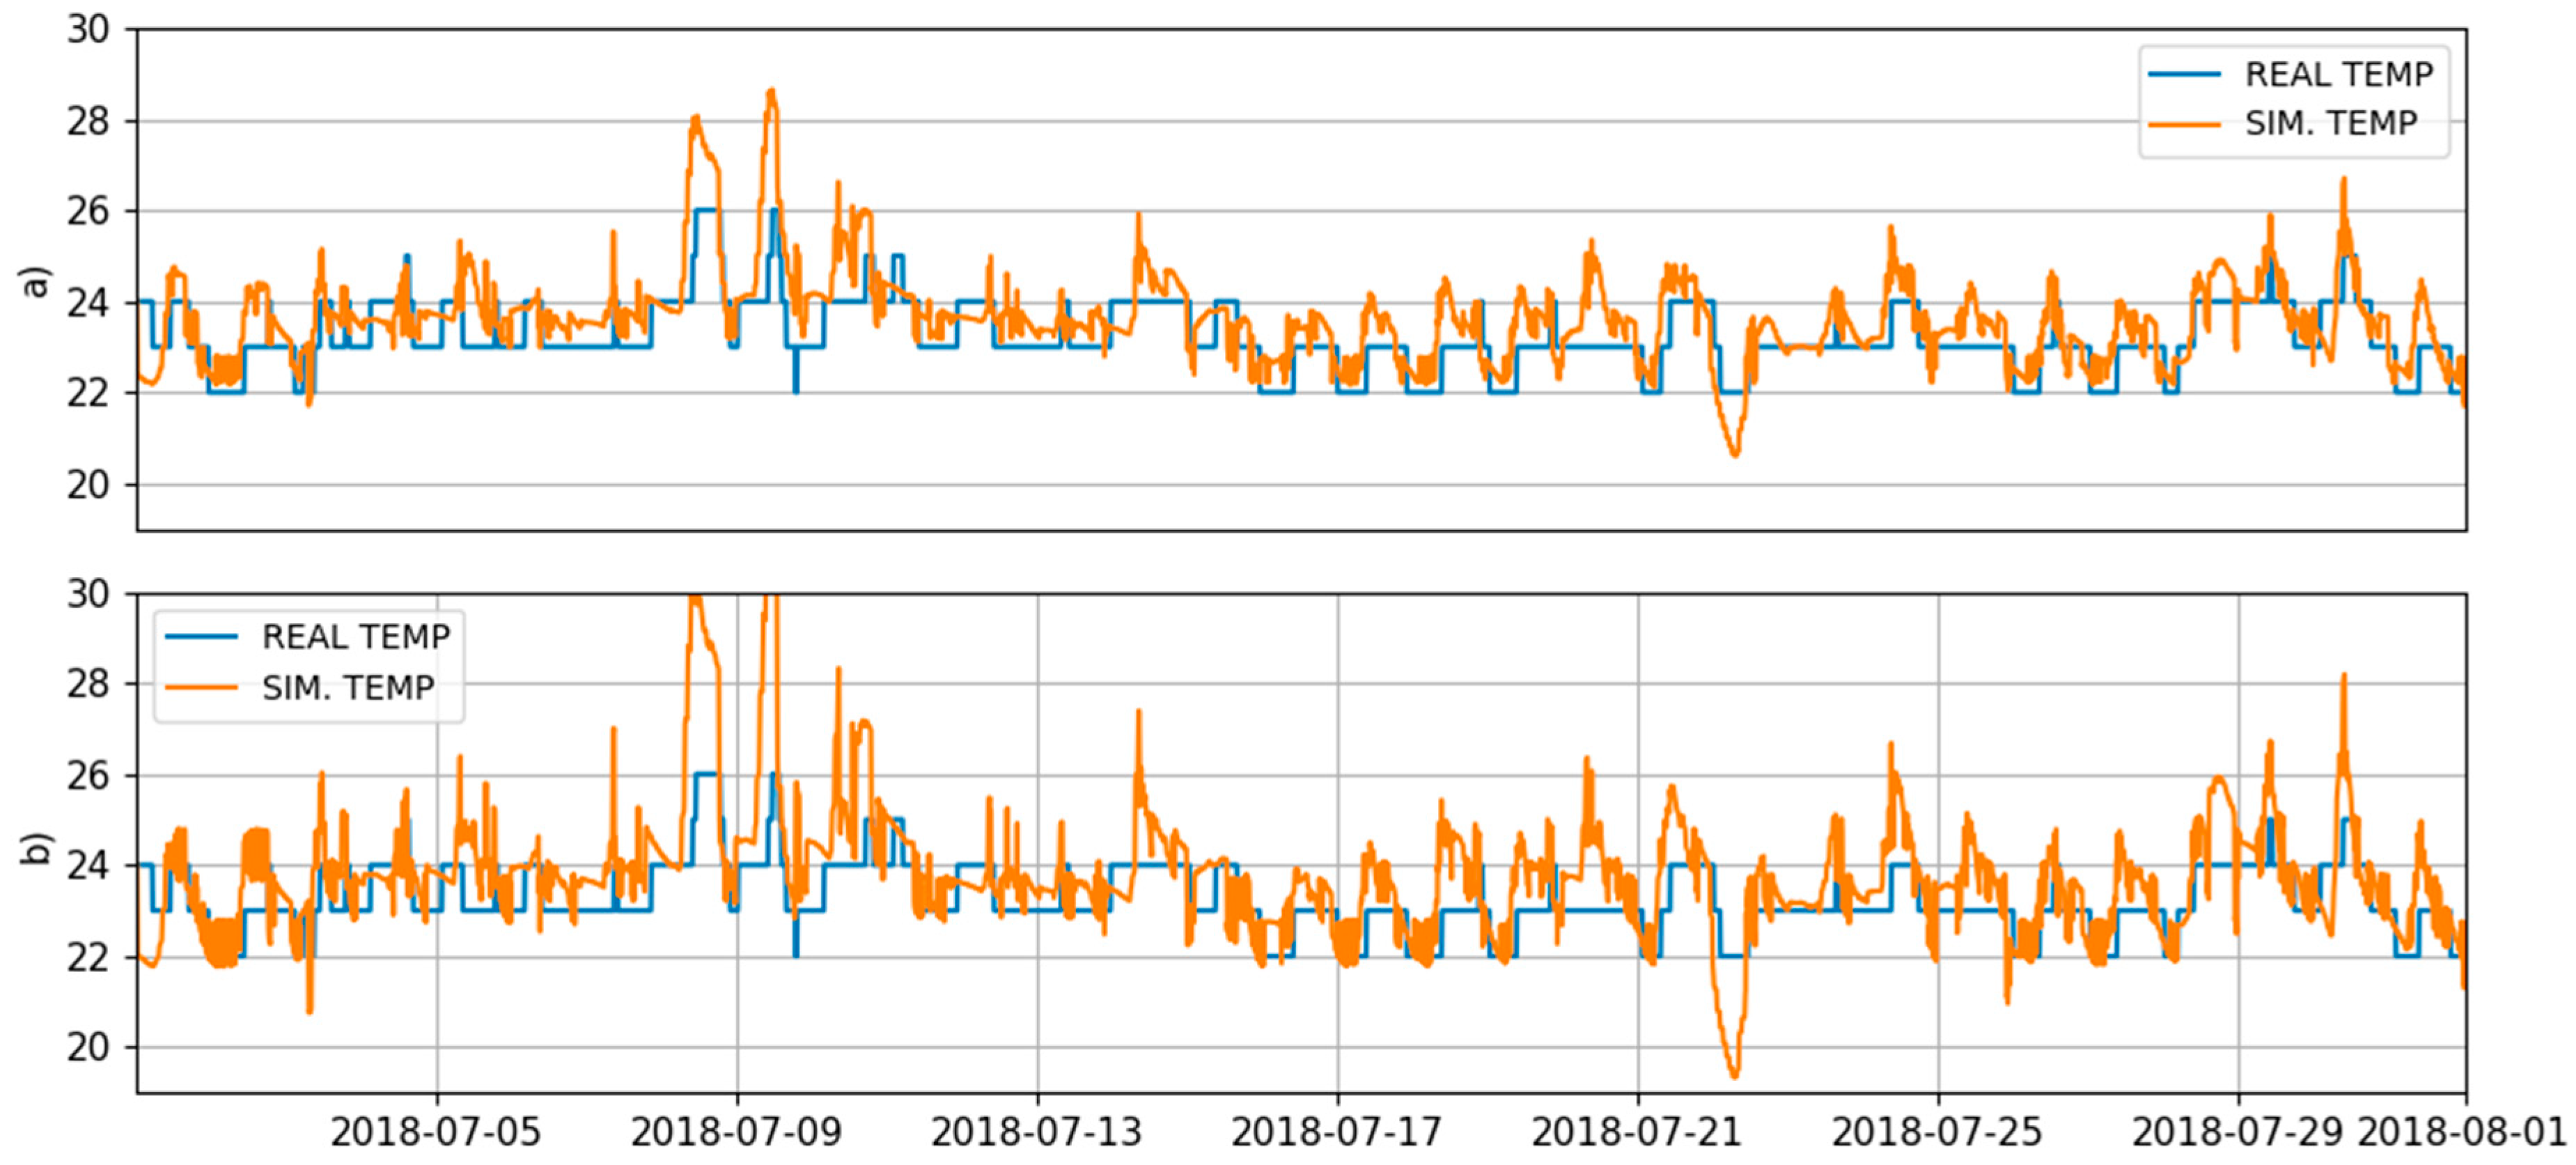
Although the presented values of the metrics indicate that the calibration was successful, the developed model could not accurately predict the temperature changes in the rooms at each simulation time step and in each situation. Figure 6 and Figure 7 compare the measured and simulated temperatures of a selected room for the calibrated model and the baseline model, respectively. Figure 6 presents the winter-season performance in January 2018, while Figure 7 shows the summer-season performance in July 2018.
Throughout the year, the temperature in the rooms was typically between 20 °C and 23 °C, as determined by the hotel management. Any deviation from this range can be attributed to certain external and internal influences. The greater increase in temperature on sunny, warm days and the decrease in temperature when windows are open on colder days and nights can be clearly seen in the figures. When windows are closed, temperatures generally return to default values. The calibrated model performed better than the baseline model in tracking these temperature variations, with simulated temperatures closer to measured temperatures. The difference between the models is more pronounced during periods when the FCU is not operating and passive temperature regulation is taking place.
The calibration process has helped reduce temperature deviation and improve the overall accuracy of the model. Despite its improved performance, the calibrated model still incorrectly predicts the dynamics of room temperatures at certain times. There are several possible reasons for this problem. These include the simplifications used in creating the model, uncertainties associated with the building fabric and its characteristics, and the fact that the measured temperatures were recorded in integer values by the central control of the smart-room system, resulting in a lack of information needed to precisely determine the control logic of the FCU system. The rounding of the values of the measured temperatures affected the uncertainty analysis, as the actual measured values remained unknown. In addition, the model calculates the room temperatures while assuming that the air in the room is well mixed. This may not be the case in the real world, and the measured temperatures may only reflect local conditions, depending on the position of the sensor in the room.
The obtained results indicate the need for more accurate modeling of the thermal response of the rooms during periods of strong solar radiation, as well as during periods of natural ventilation, taking into account the wind speed and direction. The opening of the windows was simulated by increasing the number of air changes per hour. The moment the system registers that the windows are open, the number of air changes in the model increases to a fixed, predefined value. The number of air changes per hour of 3 h−1 resulted in the smallest average error considering all simulated rooms. This value was applied to all rooms, regardless of their orientation. In reality, not all facades are exposed to the wind at the same time. In addition, the wind does not always blow at a constant speed. Some spaces will therefore have a stronger wind influence than others, and this influence varies over time. Under these circumstances, the model overestimates the temperature changes in rooms on the downwind side of the building and may underestimate them in the rooms directly on the wind path. Further investigation should be undertaken and further model improvements should be made to address these issues.
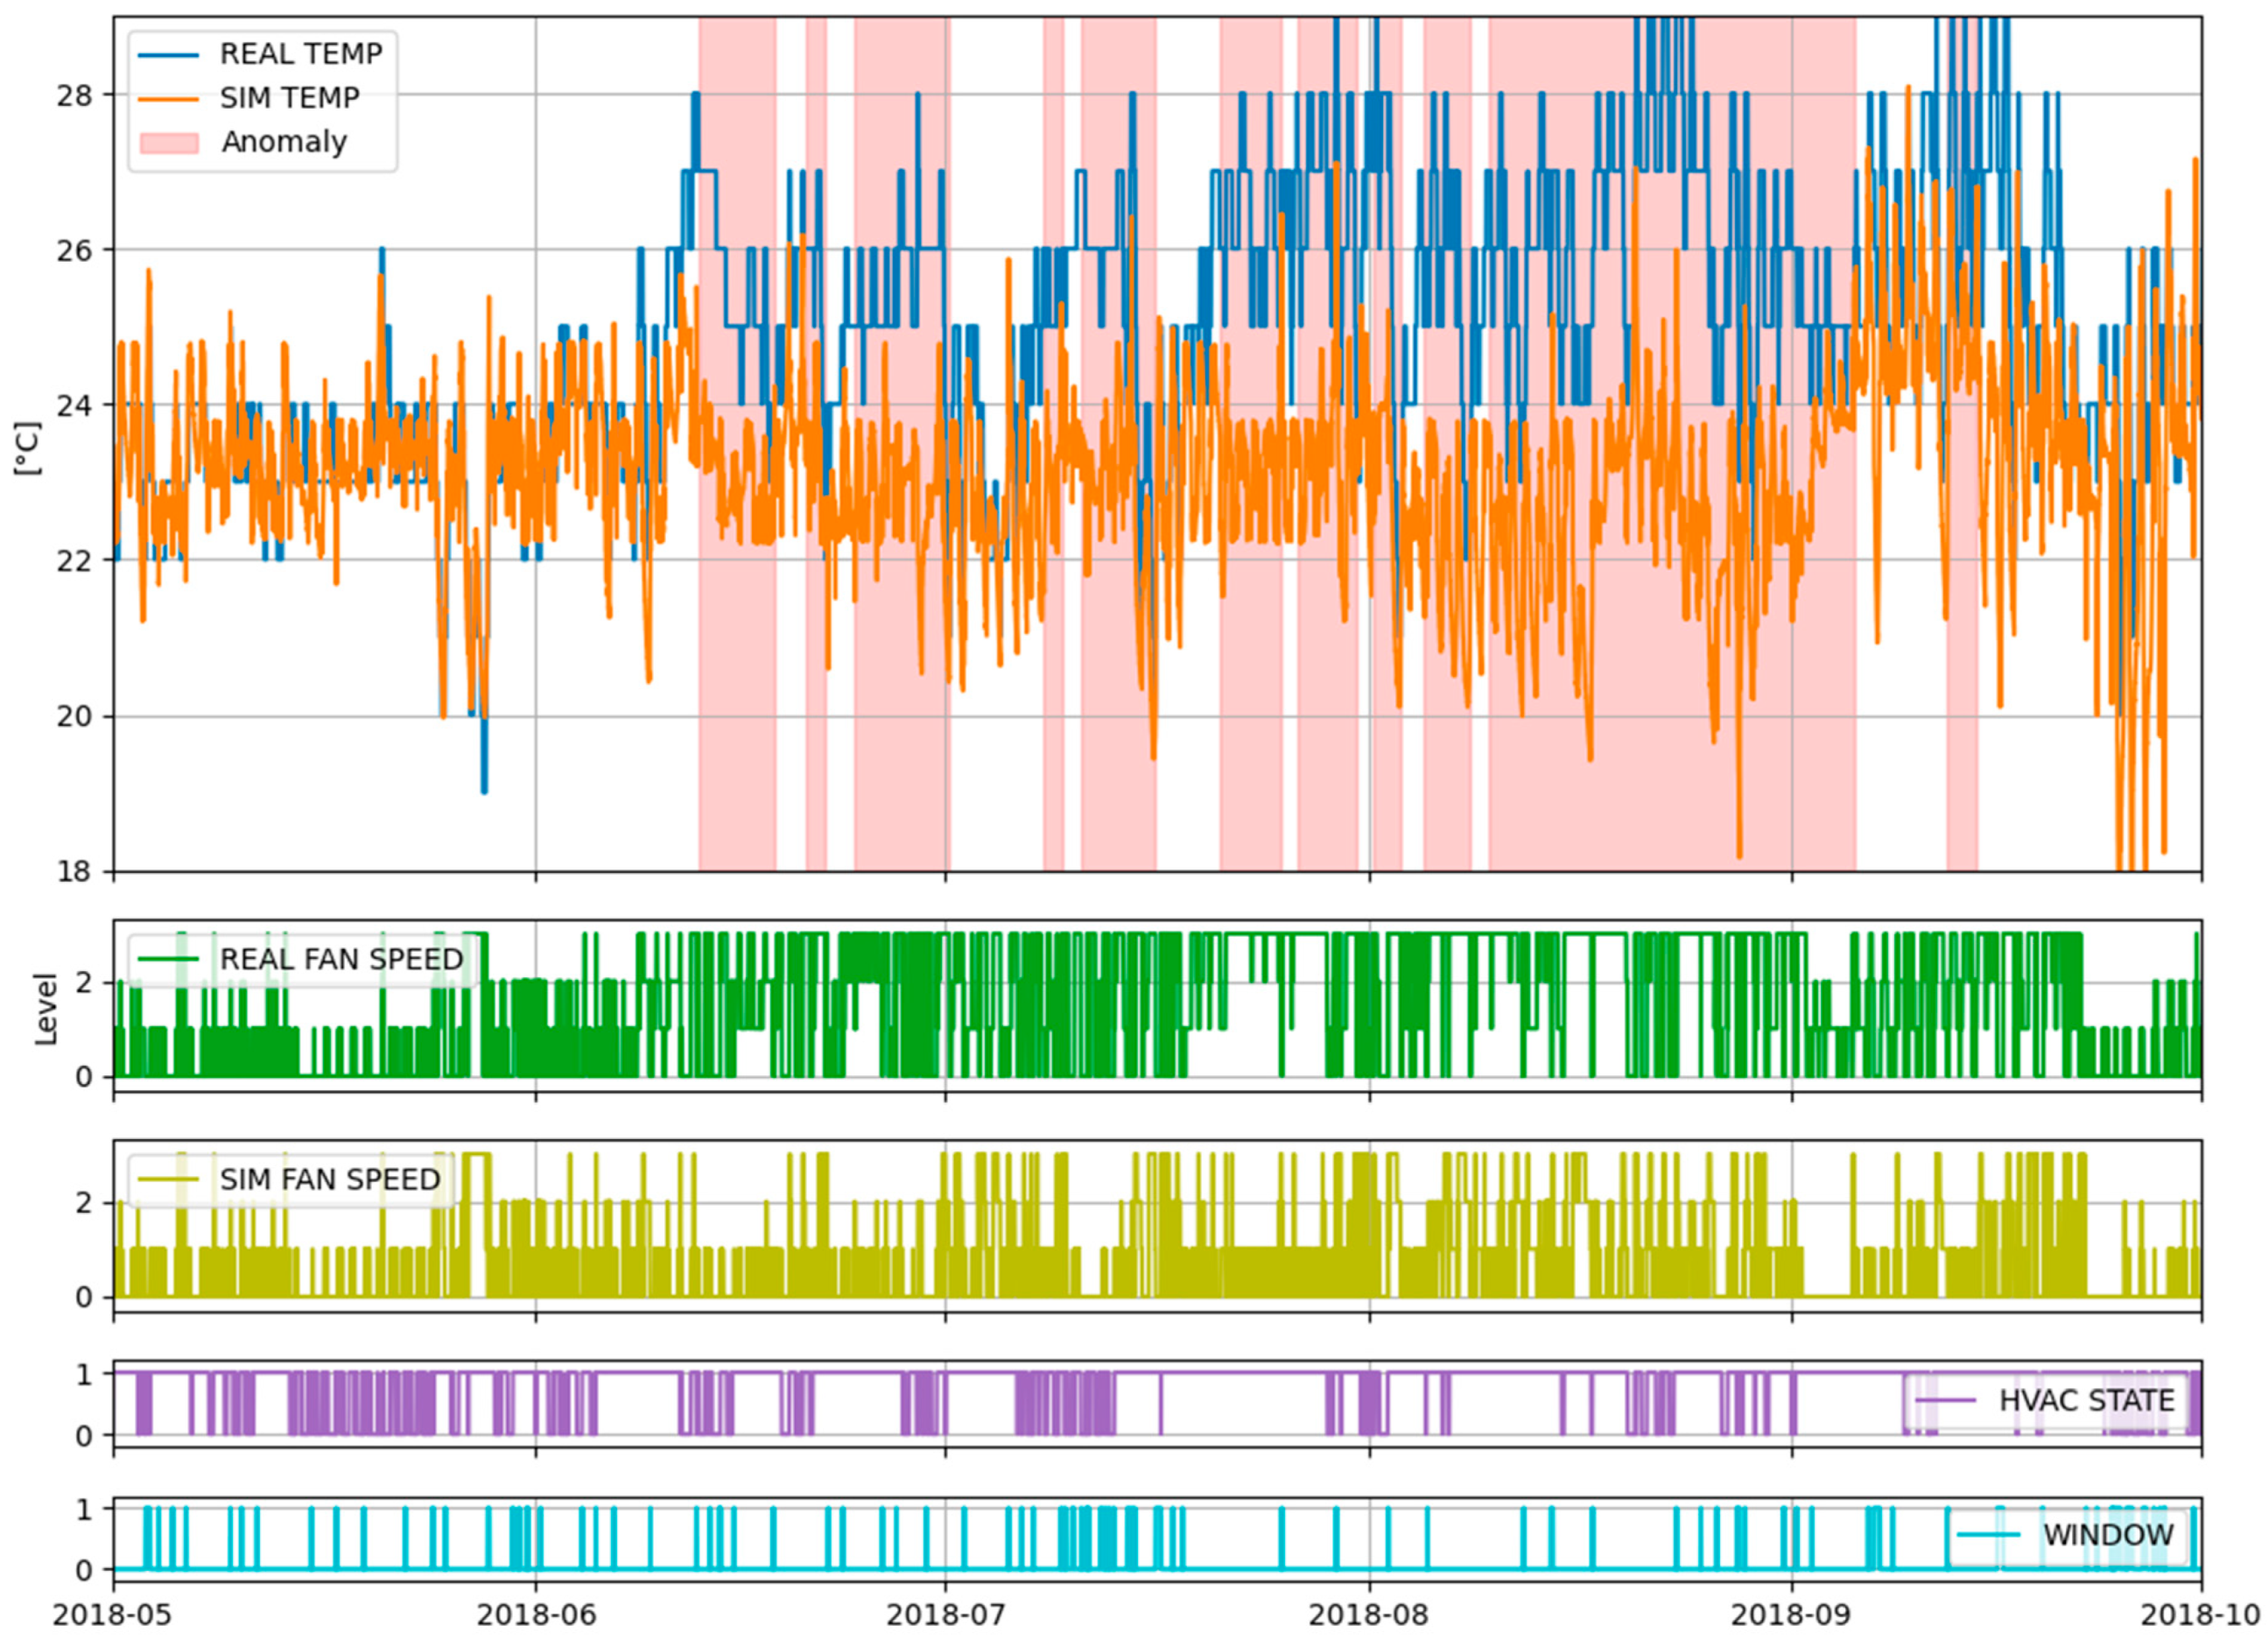
The developed simulation model was used in the next step to identify anomalies or faults in the HVAC system of individual rooms, particularly in the context of FCUs. Figure 8 shows an example where the model successfully identified an anomaly in a particular room during the summer season by finding large discrepancies between simulated and measured air temperatures. The air temperature in the room was higher than it should be, resulting in uncomfortable conditions, even though the FCU was operating intensively (the actual fan speed was often at level 3, as indicated in the graph of REAL FAN SPEED). During the same periods, simulated temperatures were consistently lower, as were simulated fan speeds (the speed was at level 1 most of the time, as shown in the graph of SIM FAN SPEED). The windows in the room were mostly closed (the graph of WINDOW). Additional testing was performed to confirm the anomaly. This included an evaluation of the operation of the FCU and a comparison of the temperature of the room with the temperatures of other rooms with similar characteristics. The results show that the average temperature in the room with the anomaly was above 26 °C, while average temperatures in the comparison rooms were between 22 °C and 25 °C. An analysis of the FCU´s operation showed that the unit ran longer and more intensely in the room with the anomaly than in the other rooms, without providing comfortable conditions, suggesting a malfunction of the system. It was also found that the specified conditions were met in the compared rooms. The same principle was applied to detect faults in other rooms. Although the model can detect anomalies with the implemented detection algorithm, further tests and diagnostics should be performed to confirm faults and find their real causes.
It should be noted that faults are not always detectable because temperatures may remain at the desired level due to favorable internal and external conditions, as is the case on cooler summer days. Another case where a fault may not be detected is when the HVAC system is not operating or is operating at a partial load. Faults are more likely to be detected under extreme conditions when the HVAC system must operate at nominal capacity. To improve the fault detection capabilities of the system, it is important to consider all signal conditions that can greatly affect the performance of the system.

4. Conclusions

Significant improvements in the energy efficiency of HVAC systems can be achieved through the use of smart technologies and control algorithms that optimize their performance and avoid unnecessary energy waste. One of the methods of improving control functions is the application of automatic fault detection and diagnosis routines. Their development is based on reliable simulation models of the system.
This study focused on the development and calibration of a white-box model of the guest rooms and associated HVAC systems (fan coils) in the case study hotel in Zagreb, Croatia, to predict the indoor temperatures under real conditions. The simulations took into account occupant behavior, window openings, and temperature control logic. All of this room-specific data came from an extensive database created over the course of several years by measurements from a smart-room system installed in the building. Real outdoor weather conditions recorded over the same period provided the environmental conditions for the model, which was calibrated with a genetic algorithm based on a five-minute time step to improve temperature predictions. The simulations yielded an average accuracy of 0.79 ± 0.14 °C as measured by RMSE, with a 20% improvement for RMSE and cvRMSE compared to the baseline model. For metrics accounting for positive and negative values, there was a 59% improvement for nMBE and 67% improvement for MBE. Occupant behavior was the largest source of error in the simulations, as they have control over windows, set temperatures, and HVAC system operation in the case of manual mode selection. The actions of the occupants, particularly the opening of windows, pose a challenge to the model’s predictions of the dynamics of temperature changes, which could be improved by more detailed modeling of the thermal responses of the rooms. Another potential source of error in the prediction is the fact that the temperatures measured in the field were recorded in integer values, so some of the information needed to determine the control logic was lost. Nevertheless, the developed model met the requirements of the current guidelines and can be used for further analysis of the HVAC system and optimization of energy consumption in the case study building.
The model is also capable of detecting major anomalies in the analyzed HVAC system. Anomaly detection is based on finding major discrepancies between simulated and measured temperatures. To confirm the anomalies found, additional tests were performed analyzing the temperatures and operation of the HVAC system in different rooms.
Future work consists of developing more advanced methods for automatic fault detection and diagnosis by integrating machine learning techniques and implementing model predictive control features, which is a promising approach for energy savings in buildings.

Author Contributions

Conceptualization, I.Š. and I.W.; methodology, D.P., I.Š., S.L. and I.W.; software, D.P.; validation, D.P., I.Š., S.L. and I.W.; formal analysis, D.P., I.Š., S.L. and I.W.; investigation, D.P., I.Š., S.L. and I.W.; resources, D.P., I.Š., S.L. and I.W.; data curation, D.P., I.Š., S.L. and I.W.; writing—original draft preparation, D.P.; writing—review and editing, D.P., I.Š., S.L. and I.W.; visualization, D.P. and I.W.; supervision, I.Š. and I.W.; project administration, I.Š., S.L. and I.W.; funding acquisition, I.Š. All authors have read and agreed to the published version of the manuscript.

Funding

This work was supported in part by the European Regional Development Fund (ERDF) under grant agreement number KK.01.2.1.02.0303, project Adria Smart Room. TRNSYS software was purchased as part of the HEXENER project, funded by the Croatian Science Foundation (IP-2016-06-4095).

Data Availability Statement

Not applicable.

Conflicts of Interest

The authors declare no conflict of interest. The funders had no role in the design of the study; in the collection, analyses, or interpretation of data; in the writing of the manuscript; or in the decision to publish the results.

Abbreviations

The following abbreviations have been used in this manuscript:
ASHRAEAmerican Society of Heating, Refrigerating and Air Conditioning Engineers
FCUFan Coil Unit
GHGGreenhouse Gas
HVACHeating, Ventilation, and Air Conditioning
IDA ICEIDA Indoor Climate and Energy
IPMVPInternational Performance Maintenance and Verification Protocol
nZEBNearly Zero Energy Building
TRNSYSTransient System Simulation Tool
cvRMSECoefficient of Variation of the Root Mean Squared Error
MAEMean Absolute Error
MBEMean Bias Error
nMBENormalized Mean Bias Error
RMSERoot Mean Squared Error

References

  1. International Energy Agency (IEA). Buildings; IEA: Paris, France, 2022. Available online: https://www.iea.org/reports/buildings (accessed on 13 April 2023).
  2. International Energy Agency (IEA). Promoting Energy Efficiency Investments: Case Studies in the Residential Sector; OECD/IEA and AFD: Paris, France, 2008.
  3. Mariano-Hernández, D.; Hernández-Callejo, L.; Zorita-Lamadrid, A.L.; Duque-Perez, O.; García, F.S. A Review of Strategies for Building Energy Management System: Model Predictive Control, Demand Side Management, Optimization, and Fault Detect & Diagnosis. J. Build. Eng. 2021, 33, 101692. [Google Scholar] [CrossRef]
  4. Drgoňa, J.; Arroyo, J.; Figueroa, I.C.; Blum, D.H.; Arendt, K.; Kim, D.; Ollé, E.P.; Oravec, J.; Wetter, M.; Vrabie, D.; et al. All You Need to Know about Model Predictive Control for Buildings. Annu. Rev. Control 2020, 50, 190–232. [Google Scholar] [CrossRef]
  5. Zakula, T.; Armstrong, P.R.; Norford, L.K.; Norford, L.K. Modeling Environment for Model Predictive Control of Buildings. Energy Build. 2014, 85, 549–559. [Google Scholar] [CrossRef]
  6. Yao, Y.; Shekhar, D.K. State of the Art Review on Model Predictive Control (MPC) in Heating Ventilation and Air-Conditioning (HVAC) Field. Build Environ. 2021, 200, 107952. [Google Scholar] [CrossRef]
  7. Matetić, I.; Štajduhar, I.; Wolf, I.; Ljubic, S. A Review of Data-Driven Approaches and Techniques for Fault Detection and Diagnosis in HVAC Systems. Sensors 2023, 1, 1. [Google Scholar] [CrossRef] [PubMed]
  8. Cacabelos, A.; Eguía, P.; Febrero, L.; Granada, E. Development of a new multi-stage building energy model calibration methodology and validation in a public library. Energy Build. 2017, 146, 182–199. [Google Scholar] [CrossRef]
  9. Yu, J.; Chang, W.-S.; Dong, Y. Building Energy Prediction Models and Related Uncertainties: A Review. Buildings 2022, 12, 1284. [Google Scholar] [CrossRef]
  10. Guyot, D.; Giraud, F.; Simon, F.; Corgier, D.; Marvillet, C.; Tremeac, B. Overview of the Use of Artificial Neural Networks for Energy-related Applications in the Building Sector. Int. J. Energy Res. 2019, 43, 6680–6720. [Google Scholar] [CrossRef]
  11. Delač, B.; Pavković, B.; Lenić, K.; Mađerić, D. Integrated Optimization of the Building Envelope and the HVAC System in NZEB Refurbishment. Appl. Therm. Eng. 2022, 211, 118442. [Google Scholar] [CrossRef]
  12. Fabrizio, E.; Monetti, V. Methodologies and Advancements in the Calibration of Building Energy Models. Energies 2015, 8, 2548–2574. [Google Scholar] [CrossRef]
  13. Chong, A.; Gu, Y.; Jia, H. Calibrating Building Energy Simulation Models: A Review of the Basics to Guide Future Work. Energy Build. 2021, 253, 111533. [Google Scholar] [CrossRef]
  14. Chen, R.; Tsay, Y.-S. An Integrated Sensitivity Analysis Method for Energy and Comfort Performance of an Office Building along the Chinese Coastline. Buildings 2021, 11, 371. [Google Scholar] [CrossRef]
  15. Pachano, J.E.; Bandera, C.F. Multi-Step Building Energy Model Calibration Process Based on Measured Data. Energy Build. 2021, 252, 111380. [Google Scholar] [CrossRef]
  16. Arendt, K.; Jradi, M.; Shaker, H.R.; Veje, C. Comparative Analysis of White-, Gray- and Black-Box Models for Thermal Simulation of Indoor Environment: Teaching Building Case Study. In Proceedings of the 2018 Building Performance Modeling Conference and SimBuild co-organized by ASHRAE and IBPSA-USA, Chicago, IL, USA, 26–28 September 2018. [Google Scholar]
  17. O´Donovan, A.; O´Sullivan, P.D.; Murphy, M.D. Predicting Air Temperatures in a Naturally Ventilated Nearly Zero Energy Building: Calibration, Validation, Analysis and Approaches. Appl. Energy 2019, 250, 991–1010. [Google Scholar] [CrossRef]
  18. Guyot, D.; Giraud, F.; Simon, F.; Corgier, D.; Marvillet, C.; Tremeac, B. Building Energy Model Calibration: A Detailed Case Study Using Sub-Hourly Measured Data. Energy Build. 2020, 223, 110189. [Google Scholar] [CrossRef]
  19. Baba, F.M.; Ge, H.; Zmeureanu, R.; Wang, L. Calibration of Building Model Based on Indoor Temperature for Overheating Assessment Using Genetic Algorithm: Methodology, Evaluation Criteria, and Case Study. Build. Environ. 2022, 207, 108518. [Google Scholar] [CrossRef]
  20. Figueiredo, A.; Kämpf, J.; Vicente, R.; Oliveira, R.; Silva, T. Comparison between Monitored and Simulated Data Using Evolutionary Algorithms: Reducing the Performance Gap in Dynamic Building Simulation. J. Build. Eng. 2018, 17, 96–106. [Google Scholar] [CrossRef]
  21. Royapoor, M.; Roskilly, T. Building Model Calibration Using Energy and Environmental Data. Energy Build. 2015, 94, 109–120. [Google Scholar] [CrossRef]
  22. Rosato, A.; Guarino, F.; Guarino, F.; Filomena, V.; Sibilio, S.; Maffei, L. Experimental Calibration and Validation of a Simulation Model for Fault Detection of HVAC Systems and Application to a Case Study. Energies 2020, 13, 3948. [Google Scholar] [CrossRef]
  23. Roberti, F.; Oberegger, U.F.; Gasparella, A. Calibrating Historic Building Energy Models to Hourly Indoor Air and Surface Temperatures: Methodology and Case Study. Energy Build. 2015, 108, 236–243. [Google Scholar] [CrossRef]
  24. Kossak, B.; Stadler, M. Adaptive Thermal Zone Modeling Including the Storage Mass of the Building Zone. Energy Build. 2015, 109, 407–417. [Google Scholar] [CrossRef]
  25. Martínez-Ibernón, A.; Aparicio-Fernández, C.; Royo-Pastor, R.; José-Luis Vivancos, J.L. Temperature and humidity transient simulation and validation in a measured house without a HVAC system. Energy Build. 2016, 131, 54–62. [Google Scholar] [CrossRef]
  26. Martínez-Mariño, S.; Eguía-Oller, P.; Granada-Álvarez, E.; Erkoreka-González, A. Simulation and Validation of Indoor Temperatures and Relative Humidity in Multi-Zone Buildings under Occupancy Conditions Using Multi-Objective Calibration. Build. Environ. 2021, 200, 107973. [Google Scholar] [CrossRef]
  27. Murphy, M.D.; O’Sullivan, P.D.; da Graça, G.C.; O’Donovan, A. Development, Calibration and Validation of an Internal Air Temperature Model for a Naturally Ventilated Nearly Zero Energy Building: Comparison of Model Types and Calibration Methods. Energies 2021, 14, 871. [Google Scholar] [CrossRef]
  28. Berthou, T.; Stabat, P.; Salvazet, R.; Marchio, D. Development and Validation of a Gray Box Model to Predict Thermal Behavior of Occupied Office Buildings. Energy Build. 2014, 74, 91–100. [Google Scholar] [CrossRef]
  29. Belić, F.; Slišković, D.; Hocenski, Ž. Detailed Thermodynamic Modeling of Multi-Zone Buildings with Resistive-Capacitive Method. Energies 2021, 14, 7051. [Google Scholar] [CrossRef]
  30. Cui, B.; Fan, C.; Munk, J.D.; Mao, N.; Xiao, F.; Dong, J.; Kuruganti, T. A Hybrid Building Thermal Modeling Approach for Predicting Temperatures in Typical, Detached, Two-Story Houses. Appl. Energy 2019, 236, 101–116. [Google Scholar] [CrossRef]
  31. Chen, Y.; Guo, M.; Chen, Z.; Chen, Z.; Ji, Y. Physical energy and data-driven models in building energy prediction: A review. Energy Rep. 2022, 8, 2656–2671. [Google Scholar] [CrossRef]
  32. Aguilera, J.J.; Andersen, R.K.; Toftum, J. Prediction of Indoor Air Temperature Using Weather Data and Simple Building Descriptors. Int. J. Environ. Res. Public Health 2019, 16, 4349. [Google Scholar] [CrossRef]
  33. Delzendeh, E.; Wu, S.; Lee, A.; Zhou, Y. The Impact of Occupants’ Behaviours on Building Energy Analysis: A Research Review. Renew. Sustain. Energy Rev. 2017, 80, 1061–1071. [Google Scholar] [CrossRef]
  34. Calì, D.; Andersen, R.K.; Andersen, R.K.; Müller, D.; Olesen, B.W. Analysis of Occupants’ Behavior Related to the Use of Windows in German Households. Build. Environ. 2016, 103, 54–69. [Google Scholar] [CrossRef]
  35. Bonte, M.; Thellier, F.; Thellier, F.; Lartigue, B. Impact of Occupant’s Actions on Energy Building Performance and Thermal Sensation. Energy Build. 2014, 76, 219–227. [Google Scholar] [CrossRef]
  36. Belazi, W.; Ouldboukhitine, S.-E.; Chateauneuf, A.; Bouchaïr, A. Thermal Modeling of the Occupied Multi-Zone Buildings Taking into Account the Uncertainties of Occupant Behavior. Case Stud. Therm. Eng. 2022, 33, 101978. [Google Scholar] [CrossRef]
  37. Parzinger, M.; Hanfstaengl, L.; Sigg, F.; Spindler, U.; Wellisch, U.; Wirnsberger, M. Residual Analysis of Predictive Modelling Data for Automated Fault Detection in Building’s Heating, Ventilation and Air Conditioning Systems. Sustainability 2020, 12, 6758. [Google Scholar] [CrossRef]
  38. Pourarian, S.; Wen, J.; Veronica, D.A.; Pertzborn, A.; Zhou, X.; Liu, R. A Tool for Evaluating Fault Detection and Diagnostic Methods for Fan Coil Units. Energy Build. 2017, 136, 151–160. [Google Scholar] [CrossRef]
  39. Ranade, A.; Provan, G.; Mady, A.E.-D.; O’Sullivan, D.T.J. A Computationally Efficient Method for Fault Diagnosis of Fan-Coil Unit Terminals in Building Heating Ventilation and Air Conditioning Systems. J. Build. Eng. 2020, 27, 100955. [Google Scholar] [CrossRef]
  40. Rosato, A.; Guarino, F.; Sibilio, S.; Entchev, E.; Masullo, M.; Maffei, L. Healthy and Faulty Experimental Performance of a Typical HVAC System under Italian Climatic Conditions: Artificial Neural Network-Based Model and Fault Impact Assessment. Energies 2021, 14, 5362. [Google Scholar] [CrossRef]
  41. Croatian Meteorological and Hydrological Service. Available online: https://meteo.hr/index_en.php (accessed on 15 February 2022).
  42. Klein, S.A. TRNSYS 18: A Transient System Simulation Program; Solar Energy Laboratory, University of Wisconsin: Madison, WI, USA, 2017. [Google Scholar]
  43. American Society of Heating, Refrigerating and Air-conditioning Engineers (ASHRAE). 2009 ASHRAE Handbook-Fundamentals (SI Edition); ASHRAE Inc.: Atlanta, GA, USA, 2009. [Google Scholar]
  44. VDI-Fachbereich Technische Gebäudeausrüstung. Requirements to be Met by Calculation Methods for the Simulation of Thermal-Energy Efficiency of Buildings and Building Installations Standard DINGCD22; Verlag des Vereins Deutscher Ingenieure (VDI): Düsseldorf, Germany, 2001. [Google Scholar]
  45. Ruiz, G.R.; Bandera, C.F. Validation of Calibrated Energy Models: Common Errors. Energies 2017, 10, 1587. [Google Scholar] [CrossRef]
  46. American Society of Heating, Refrigerating and Air-conditioning Engineers (ASHRAE). ASHRAE Guideline 14-2014: Measurement of Energy, Demand, and Water Savings; ASHRAE: Atlanta, GA, USA, 2014. [Google Scholar]
  47. Efficiency Valuation Organization (EVO). International Performance Measurement and Verification Protocol Volume I: Concepts and Options for Determining Energy and Water Savings; EVO: Washington DC, USA, 2012. [Google Scholar]
  48. Ruiz, G.R.; Bandera, C.F.; Temes, T.G.A.; Gutierrez, A.S.O. Genetic Algorithm for Building Envelope Calibration. Appl. Energy 2016, 168, 691–705. [Google Scholar] [CrossRef]
Figure 1. Floor plan of a single floor of the hotel.
Buildings 13 01388 g001
Figure 2. Procedure for creating simulations and performing the calibration process.
Buildings 13 01388 g002
Figure 3. Simulation model created in TRNSYS 18 Simulation studio.
Buildings 13 01388 g003
Figure 4. RMSE metrics for baseline and calibrated models in the winter and summer seasons.
Buildings 13 01388 g004
Figure 5. MBE metrics for baseline and calibrated models in the winter and summer seasons.
Buildings 13 01388 g005
Figure 6. Comparison of measured (REAL) and simulated (SIM.) temperatures for the winter-season calibration period: (a) calibrated model, (b) baseline model.
Buildings 13 01388 g006
Figure 7. Comparison of measured (REAL) and simulated (SIM.) temperatures for the summer-season calibration period: (a) calibrated model, (b) baseline model.
Buildings 13 01388 g007
Figure 8. Measured (REAL) and simulated (SIM) temperatures with marked periods of anomalies in the HVAC system. Other signals affecting the operation of the system are also shown.
Buildings 13 01388 g008
Table 1. Composition of building elements and material properties in rooms.
ElementsMaterialδ [m]λ [W/(mK)]c [kJ/(kgK)]ρ [kg/m3]A [m2]
Ceiling
/Floor
Plasterboard0.0200.2500.9090026.04
Air gap0.3001.31011
Reinforced concrete0.3002.50012500
Air gap0.1250.57011
Wood0.0300.1801.60700
Adjacent WallsPlasterboards0.0750.2500.9090022.32
Thermal insulation layers0.1500.0351.03100
External WallPlasterboard0.0300.2500.909006.48
Air gap0.0350.19011
Thermal insulation layer0.1200.0351.03100
Air gap0.0150.09011
Glass0.00810.752500
Table 2. Operating characteristics of fan coil units.
ParameterValue
Air flow rate265/460/552 kg/h
Water flow rate68 kg/h (heating)/345 kg/h (cooling)
Supply water temperature70 °C at −15 °C (heating)/9 °C (cooling)
Table 3. Room-based sensory measurements from the building.
VariableTypeDescription
SET TEMP.Integer [°C]Temperature set by guest or hotel staff
ROOM TEMP.Integer [°C]Measured room air temperature
HVAC SPEEDInteger [0–3]FCU fan speed
HVAC STATEBooleanFCU status (on/off)
HVAC MODEBooleanFCU heating or cooling mode (on/off)
OCCUPANCYBooleanPresence of people in the room
WINDOWBooleanWindow status (open/closed)
Table 4. Environmental data.
VariableDescription
OUTSIDE TEMP.Outdoor air temperature, °C
IRRADIANCESolar irradiation on horizontal surface, W/m2
HUMIDITYRelative humidity of outdoor air, %
Table 5. Input parameters for thermal zone modeling.
ParameterValue
Internal heat gain100 W per person [43]
Internal moisture gain35 g/h per person [43]
Infiltration0.1 air changes per hour (3 ach when windows are open)
VentilationRecirculating air + fresh air supplied and extracted at a rate of 60 m3/h
Table 6. Periods of calibration and validation for winter and summer seasons.
ProcessSeasonPeriod
CalibrationWinter1 January 2018–31 January 2018
Summer1 July 2018–31 July 2018
ValidationWinter1 December 2018–31 December 2018
Summer1 August 2018–31 August 2018
Table 7. Averages of metrics for baseline and calibrated models. For clarity, all acronyms are provided in the Abbreviations list.
CalibrationValidation
Baseline m.Calibrated m.ImprovementBaseline m.Calibrated m.Improvement
cvRMSE4.60%3.59%+22%4.40%3.56%+19%
RMSE1.01 °C0.79 °C+22%0.98 °C0.79 °C+19%
nMBE−0.66%0.38%+42%−0.37%0.15%+59%
MBE−0.14 °C0.08 °C+43%−0.09 °C0.03 °C+67%
Disclaimer/Publisher’s Note: The statements, opinions and data contained in all publications are solely those of the individual author(s) and contributor(s) and not of MDPI and/or the editor(s). MDPI and/or the editor(s) disclaim responsibility for any injury to people or property resulting from any ideas, methods, instructions or products referred to in the content.