Abstract
The superimposed slab shear wall has been found to be more and more applicable in the building construction industry due to its building industrialization superiority. The hysteretic behavior of superimposed slab shear walls accounts for an important part of seismic performance analysis. This paper presents the results of a numerical study to investigate the hysteretic behavior of superimposed slab shear walls. Different calculation methods of the shear capacity of the combined interface and horizontal connection are introduced. The calculated results show that the shear capacity of the combined interface and horizontal connection is much larger than the ultimate shear capacity of a superimposed slab shear wall. Therefore, the bond slip effect of a combined interface and horizontal connection can be ignored in finite element analysis on the premise of it not affecting calculation precision. Three different theoretical analysis models, namely the vertical multi-line element model, bend–shear coupled fiber model and layered shell element model, were established in OpenSEES based on a macro-model and a micro-model. The results show that the calculated results of the vertical multi-line element model and the bend–shear coupled fiber model agree reasonably with the experiment results, whereas the calculated results of the layered shell model gave a relatively larger initial stiffness.
1. Introduction
A superimposed slab shear wall is a kind of sandwich structure made of two layers of prefabricated concrete panels on both sides and one layer of cast-in-site concrete in the core, as shown in Figure 1. It has been broadly applied in the building industry recently due to its advantages of industrialized fabrication and relatively preferable integrity [1].
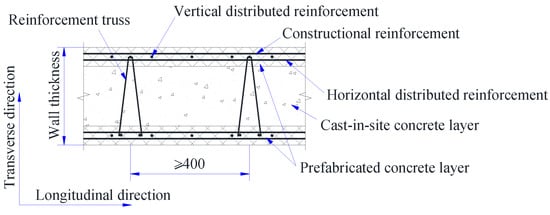
Figure 1.
Structural detail of superimposed slab shear wall.
The theory and behavior of superimposed slab shear walls have been extensively studied worldwide [2,3]. Huang et al. [4] evaluated the structural performance of the lightweight double skin composite system filled with ultra-lightweight cement composite. The test of double-layer composite beams, shells and walls with shear connectors was executed, and the results indicate that the double-layer composite system has comparable performance with a system filled with ordinary concrete in terms of ultimate resistance and load deflection characteristics. Benayoune et al. [5] conducted an experimental and theoretical study on the structural performance of precast concrete sandwich panels (PCSP) under bending. The results show that the failure mode and crack mode of PCSP as a slab component are very similar to those of solid slabs. Hamid et al. [6] investigated the seismic performance of insulated sandwich wall panels (ISWP) under lateral cyclic loading. Experimental work was carried out to determine the lateral strength capacity, hysteresis loops (load–displacement) stiffness, ductility and equivalent versus viscous damping of ISWP. Hodicky et al. [7] investigated the composite action of 46 segments representing precast concrete sandwich panels (PCSPs) using a fiber-reinforced polymer grid/rigid foam as a shear mechanism. The results indicate that the increase of the spacing between the vertical lines of CFRP grids will increase the overall shear flow strength because of the increase of the bonding contact area between the rigid foam and the concrete surface. This research has guiding significance for the engineering application of superimposed slab shear walls.
Some researchers in China [8,9] have mainly focused on its seismic behavior. A series of tests regarding superimposed slab shear walls under low axial compression ratios was done to check whether this type of member has sufficient seismic performance [10,11,12]. The results show remarkable similarity concerning deformation patterns and failure modes in the loading process between the superimposed slab shear walls and ordinary cast-in-site shear walls, except for lower ultimate strength, insufficient deformability and inferior ductility in this new sandwich structure [13,14]. With the gradual deepening of research, some scholars began to pay attention to the mechanical action mechanism of precast layer and cast-in situ layer in the composite plate shear wall. Wang et al. [15] carried out quasi-static tests on four reinforced concrete composite shear walls with openings and two reinforced concrete shear walls with openings under cyclic loads. The results show that the precast and cast-in situ concrete members with this type of component can work together well under loads. Similar tests [16] were performed on three horizontally spliced reinforced concrete composite shear walls and one non-horizontally spliced reinforced concrete composite shear wall. Ye et al. [17] studied the seismic performance of five precast normal concrete (NC) composite shear walls infilling self-compacting concrete (SCC) and two precast NC composite shear walls infilling NC. The results indicate that the precast composite shear walls infilling SCC have good seismic behavior. The seismic behavior of superimposed slab shear walls under different axial compression ratios were further studied by Yang et al. [18]. A series of theoretical formulas were derived that demonstrate accordance with the test results. On the basis of the test results and the higher strength of prefabricated concrete, some of superimposed slab shear wall specimens even had higher performance than those of cast-in-site shear walls under high axial compression ratios. This research proves that the outer layer of the composite plate shear wall, namely the prefabricated layer, can participate in the load resistance process. However, the existing research results are all based on analyses of the macro data obtained from the tests. Some problems in the finite element simulation are still not well-solved, for example, whether the interface slip effect needs to be considered as well as the efficiency and accuracy comparison of different equivalent models and their selection principles [19].
In this study, the several problems needed to be solved in finite element analysis of hysteretic behavior of the superimposed shear wall were studied based on OpenSEES. Specifically, first, different calculation methods on shear capacity of combined interface and horizontal connection were introduced. Then, the bond slip effect of the shear wall interfaces and the reliability of the shear resistance provided by rebar joints are studied in this paper. Subsequently, three different theoretical analysis models, namely the vertical multi-line element model, bend–shear coupled fiber model and layered shell element model, were established in OpenSEES based on a macro-model and a micro-model. The finite element calculation results based on three types of models were compared with the test results to measure the accuracy and efficiency of different simulation methods. Some problems in the simulation were also solved, which can provide reference for similar research. Finally, the summary and the conclusions are given at the end of this paper.
2. Simulation of the Interface in Finite Element Model
Generally, the reinforcement trusses connecting the two layers guarantee the integration of the shear wall. The connection between the superimposed slab shear wall and its foundation is implemented by the rebar joint through the in-between horizontal construction joint. One notable problem is whether the bond slip effect of the shear wall interfaces should be considered, and the reliability of the shear resistance provided by the rebar joint is also a topic that requires further attention.
2.1. Shear Capacity of Combined Interface
There are five theories concerning the shear resistance of the combined interfaces: (1) Mattock’s shear-friction theory [20], which deems the interfacial shear force as being induced by shear friction; (2) ACI 318-19 [21]; (3) the Eurocode method [22], which deems cross-sectional shear force is composed of bond forces, interface friction and shear-resisting rebar; (4) A.K. Patnai’s research [23], which proposes that the ultimate shear stress of interfaces varies under different conditions; (5) the perspective of some Chinese researchers [24,25,26,27], which deems the interfacial shear force as being comprised of concrete forces and the shear-resisting rebar.
Table 1 summarizes the calculation results of ultimate shear strength of the combined interface utilizing the methods mentioned previously. In the premise of zero normal stress, supposing a roughness of 6 mm in the rough interface and 0 mm in the smooth interface, the shear capacity of the combined interface can be calculated by using the product of shear strength and interface area. From Lian [8], specimens W2 and W5 are cast-in-site superimposed slab shear walls, and specimens W3 and W6 are prefabricated superimposed slab shear walls. Among them, W2 and W3 are in an axial compression ratio of 0.1, and W5 and W6 have an axial compression ratio of 0. Their rebar details are illustrated in Figure 2.

Table 1.
Different calculation methods of shear strength.
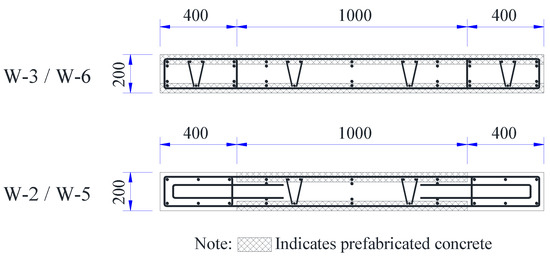
Figure 2.
Reinforcement detail of the specimens.
The calculation results present great variation among the ultimate shear stress of interfaces. It can be concluded that the method proposed by ACI 318-19 [21] is quite conservative. The shear capacities of W2/W5 and W3/W6 are 1680.00 kN and 5724.00 kN, respectively, using the method of ACI 318-19 [21]. Meanwhile, the ultimate capacities of W2, W3, W5 and W6 are 429.00 kN, 412.00 kN, 240.00 kN and 239.00 kN, respectively, from the tests. Obviously, the shear capacity of the combined interface is much larger than the ultimate capacity of the superimposed slab shear wall. Herein, the bond slip effect of combined interface can be neglected when it is analyzed using finite element method (FEM).
2.2. Shear Capacity of Horizontal Connection
The connecting details of the reinforcement directly determine the shear capacity of the horizontal connection. Magana R.A. [28] proposes a connection method using sleeve grouting. Soudki et al. [29] proposes a connection method using various forms of mild steel (welded angle steel, sleeve, steel tube, bolt, etc.). JGJ1-2014 [30] provides a connection method by using welded rebar and cast-in-site pins. The connection details of the interface also contribute to the shear capacity of the horizontal connection. Commonly used prefabricated shear walls have dentiform or rough ground interfaces. A grouting and caulking procedure at the corresponding bottom rough face is conducted after the in-site installation. Figure 3 illustrates the typical reinforcement detail of a superimposed slab shear wall and its rough concrete interface.
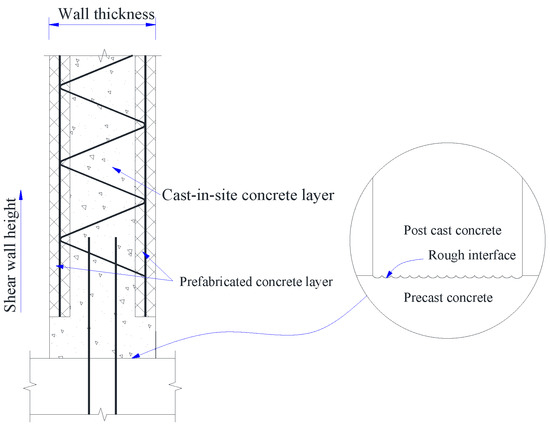
Figure 3.
Detail of the horizontal connection.
There are few studies concerning the horizontal connection capacity of superimposed slab shear walls [31,32]. The calculation methods of shear capacity using different codes are summarized in Table 2. Specimens of W2/W5 and W3/W6 were analyzed using these formulas, and the calculation results are compared in Figure 4.
Table 2.
Different calculation methods on shear strengths of horizontal connections.
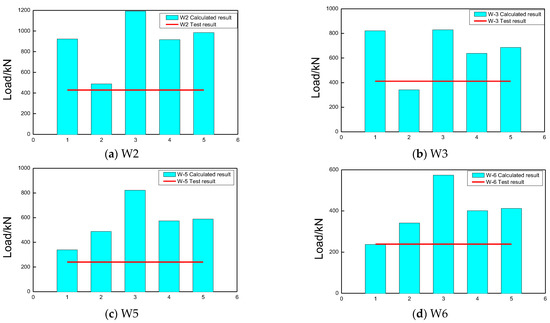
Figure 4.
Comparison of test results and calculated results on shear strengths of horizontal connections.
As Figure 4 shows, although considerable differences exist among the various methods, the calculated results are all larger than the test results except for W3. The reason is that the calculation method of ACI merely takes account of the shear resistance of reinforcement. It is relatively conservative due to the lack of consideration for axial force. Additionally, the no-slip detail at the bottom of the shear wall needs to be met to ensure a bottom-fixed FEM model does not have shear slip.
3. Hysterical Behavior of FEM Model
Research on the non-linear analysis of shear wall reinforcement is a challenging research hotspot [36,37]. There are two levels describing the analytical model: the macro-model and the micro-model [38]. Concretely, macro-model simplifies the shear wall into vertical multi-line elements, whereas the micro-model can be divided into a solid element model and a shell element model [39,40]. In this paper, for specimens W2 and W3 (on which low cyclic reverse loading tests with an axial compression ratio of 0.1 were conducted) and specimens W5 and W6 (on which low cyclic reverse loading tests with an axial compression ratio of zero were conducted), there are three kinds of superimposed slab shear wall FEM models established in the framework of OpenSEES: the vertical multi-line element model, bend–shear coupled fiber model and layered-shell element model. In addition, according to the research conclusions in the previous section, the constitutive relationship of concrete in the FEM model was assigned based on the concrete strength grade of the prefabricated layer and the cast-in-site layer, ignoring the bond slip effect of the combined interface and horizontal connection, as shown in Figure 5.
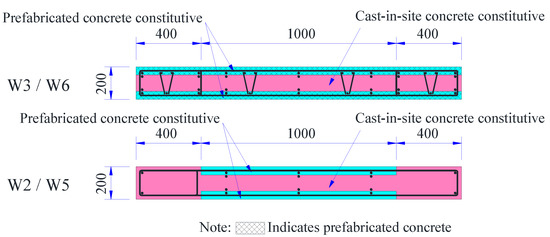
Figure 5.
Simulation of superimposed slab shear walls in FEM model.
3.1. Macro-Model: Vertical Multi-Line Element Model
3.1.1. Element Model
Kabeyasawa [41] proposes a macro-model with three vertical line elements. It can simulate the shift of the neutral axis of a shear wall after stepping into the non-linear stage. However, challenging problems still exist when it comes to determining the bending spring stiffness and the deformation compatibility between the bending spring and the side column. Vulano [42] proposes a vertical multi spring model. It simulates axial stiffness and bending stiffness with multiple vertical springs and shear stiffness with one horizontal spring. Not only can it consider the shift of the neutral axis, but also the comprehensive combination of restoring force models from multiple materials. In addition, the impact on strength and stiffness from axial load variation can also be simulated. Figure 6 gives the illustration of this model in which Kh is the stiffness of the horizontal spring, K1, K2 and Kn are the stiffnesses of the vertical springs, h is the height of the wall element and ch is the height of the horizontal shear spring.
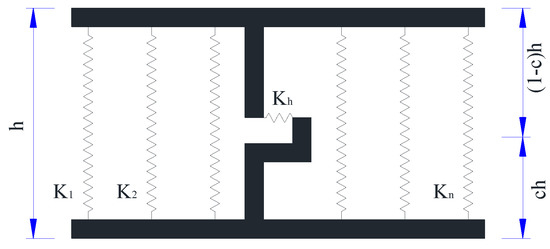
Figure 6.
Vertical multi-line element model.
3.1.2. Material Model
Vertical springs can be simulated by using the Truss element with specified fiber properties over the cross-section. The fibers consist of rebar fibers and concrete fibers; each has a diversified constitution provided by OpenSEES. In the cyclic reverse loading process, the cracking effect of the cross-section (which can be modeled using Concrete06 in OpenSEES) can increase energy dissipation and decrease the pinch effect, as shown in Figure 7. As for the rebar fiber, Steel02 in OpenSEES can better simulate the Bauschinger effect, as shown in Figure 8, where fy is the yield strength of the rebar, E is the initial elastic module, Ep is the plastic hardening module and R is the parameter influencing the shape of the curve.
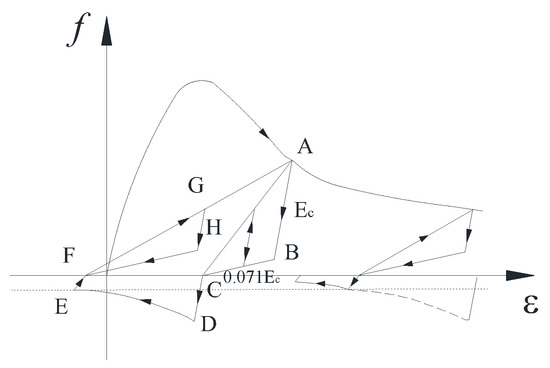
Figure 7.
Constitutive model of Concrete06.
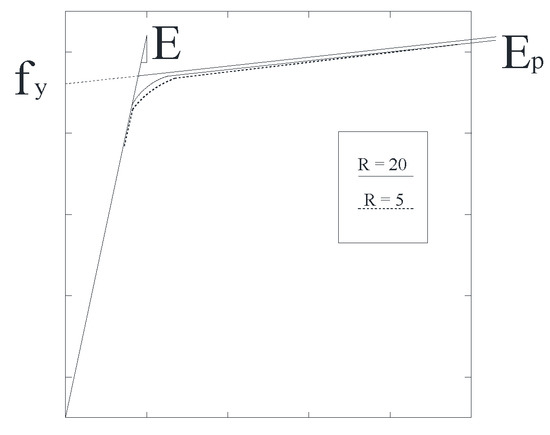
Figure 8.
Constitutive model of Steel02.
The properties of shear springs in the model are assigned by the Hysteretic material in OpenSEES, as shown in Figure 9. The parameters of this material can be determined by using two methods. One is the empirical formula proposed by Hirosawa [43] from many shear wall tests. The other is the amended inclined compression field theory. In this paper, Hirosawa’s empirical formula was chosen.
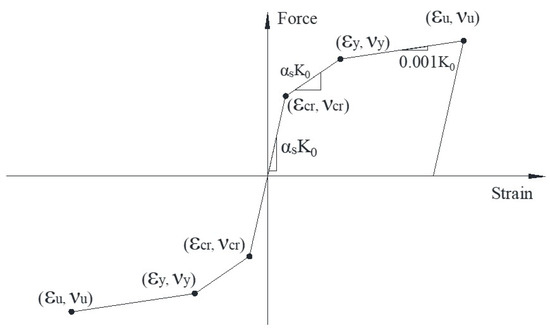
Figure 9.
Constitutive model of Hysteretic material.
3.1.3. Analysis Results
In the finite element model, ten elements were divided along the height of the wall. Two steps were incorporated into the analysis. The first step was to apply a vertical load through ten subdivided load increments. The second step was to apply reverse horizontal displacement controlled by 5 mm displacement increments. Figure 10 summarizes the simulated results and the test results from four shear wall specimens.
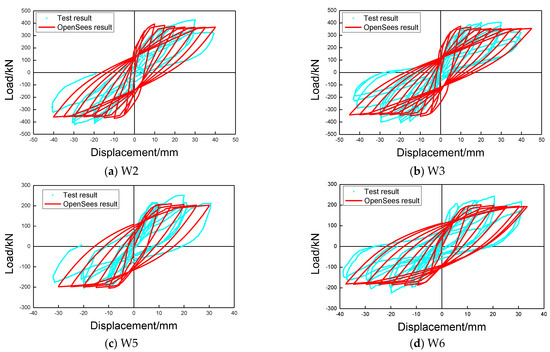
Figure 10.
Load–deformation curves based on the vertical multi-line element model.
From Figure 10, it can be concluded that the simulated vertical multi-line element under a low cyclic reverse load exhibited strength reduction and stiffness degradation. In this paper, the peak point of the load–displacement curve was selected as the calculation indicator for error. The test result and the simulated result for W2 were 429 kN and 399 kN, respectively, with an error of 6.9%. The test result and the simulated result for W3 were 412 kN and 379.82 kN, respectively, with an error of 7.8%. The simulated shear wall using the vertical multi-line element model under an axial compression ratio of 0.1 had an error of less than 8% compared with the test results. The test result and the simulated result for W5 (the superimposed slab shear wall with cast-in-site edge member) were 240 kN and 210 kN, respectively, with an error of 12.5%. The test result and the simulated result for W6 (the superimposed slab shear wall) were 239 kN and 202.1 kN, respectively, with an error of 15.4%. Table 3 lists a comparison of the peak points of the load–displacement curves based on the vertical multi-line element model for more intuitive analysis. The simulated shear wall with the vertical multi-line element model under an axial compression ratio of zero had an error less than 16% compared with the test results. For the macro-model with the vertical multi-line, the results discussed previously demonstrate a limited consistency of hysteretic behavior in the test results and simulated results because shear effect was not considered, both with axial load and without axial load. Therefore, in order to obtain more accurate simulation results from the hysteresis curve, other element models are needed.
Table 3.
Comparison of peak points of load–displacement curves based on the vertical multi-line element model.
3.2. Macro-Model: Bend–Shear Coupled Fiber Model
Shear force cannot be considered by the fiber element due to the lack of shear stiffness. To consider the shear effect, the section aggregator command in OpenSEES makes the shear constitutive able to be assembled in the fibrous section, as shown in Figure 11. This command was used to construct a section aggregator object, which aggregates groups of previously defined uniaxial material objects into a single-section force–deformation model. Each uniaxial material object represents a section’s force–deformation response for a particular section’s degrees of freedom. There was no interaction between responses in different degree-of-freedom directions. In this paper, Hirosawa’s empirical formula [43] was selected to define the shear constitutive, which is shown in Figure 9.
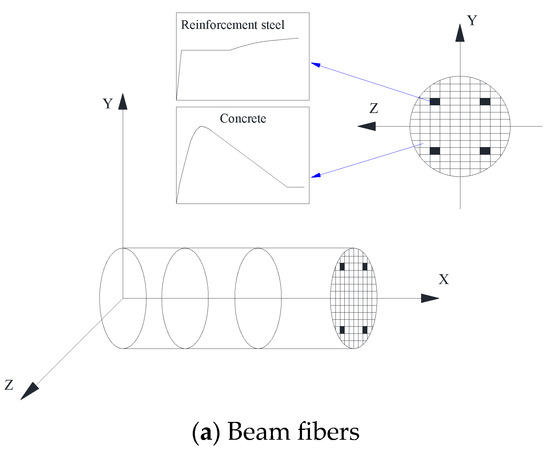
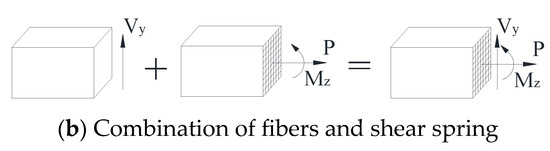
Figure 11.
Bend–shear coupled fiber model.
3.2.1. Element Model
The fiber model was frequently used in OpenSEES. There are two kinds of fiber model, namely the stiffness-based fiber model and the flexibility-based fiber model. The stiffness-based fiber model divides the element into several segments. With the help of integral point displacements obtained from the interpolation of cubic polynomials, it can provide precise results using a linear or approximately linear approach. However, non-linear behavior is hard to describe because of the limitation of the cubic interpolation function. Better results can only be obtained from a more precise meshing technique in the inelastic region. Likewise, the internal force at the integral points can also be obtained from the linear interpolation of the flexibility-based model with several divided segments. It gives a convergent result when the simulation of flexural beam elements is conducted, as well as during the simulation of non-linear concrete. Therefore, the flexibility-based model was selected for the analysis.
3.2.2. Material Model
Concrete01 was selected to simulate concrete, and its constitutive model is illustrated in Figure 12. In this figure, K indicates the concrete strength enhancement factor, Z indicates the slope of strain softening, fco indicates the cube compressive strength and εc indicates the concrete compressive strain at the peak loading. Its compressive backbone curve was from the amended Kent–Park model without the consideration of the action of the tensile concrete. The three stages of the backbone curve are described as the ascend stage, descent stage and platform stage. Meanwhile, Steel02 was selected to simulate rebar, as shown in Figure 7.
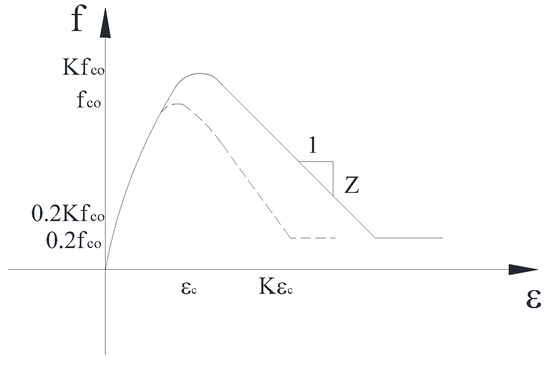
Figure 12.
Constitutive model of Concrete01.
3.2.3. Analysis Results
As mentioned previously, there were also two steps in the analysis. The first step was to apply a vertical load through ten subdivided load increments. The second step was to apply horizontal displacement. Figure 13 summarizes the comparison of the simulated results and the backbone curves of the test results of four shear wall specimens.
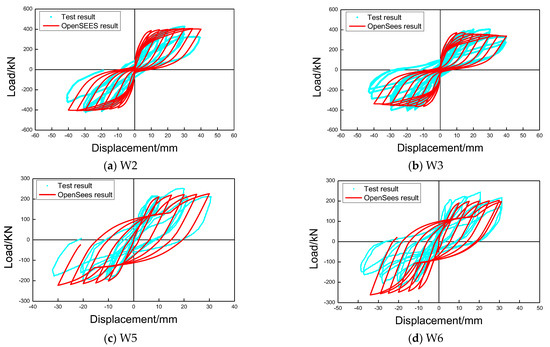
Figure 13.
Load–deformation curves based on the bend–shear coupled fiber model.
The test result and the simulated result for W2 were 429 kN and 406.96 kN, respectively, with an error of 5.1%. The test result and the simulated result for W3 were 412 kN and 371.81 kN, respectively, with an error of 9.7%. The simulated shear wall using bend–shear coupled fiber model under an axial compression ratio of 0.1 had an error of less than 10% compared with test results. The test result and the simulated result of W5 were 239 kN and 226.29 kN, respectively, with an error of 5.7%. The test result and the simulated result of W6 were 239 kN and 203.53 kN, respectively, with an error of 14.8%. Table 4 lists a comparison of the peak points of the load–displacement curves based on the bend–shear coupled fiber model for more intuitive analysis. The simulated shear wall utilizing the bend–shear coupled fiber model under an axial compression ratio of zero had an error less than 15% compared with test results. Compared with the macro-model with the vertical multi-line, the results generated using the bend–shear coupled fiber macro-model show higher consistency of hysteretic behavior for the test results and simulated results.
Table 4.
Comparison of peak points of load–displacement curves based on the bend–shear coupled fiber model.
3.3. Micro-Model
3.3.1. Layered Shell Element Model
Based on the mechanical properties of the composite material, the layered shell element can be used to describe the shear wall in-plane bend–shear coupling effect and out-of-plane bending effect. As illustrated in Figure 14, a layered shell element is divided into multiple layers with different thicknesses and material properties.
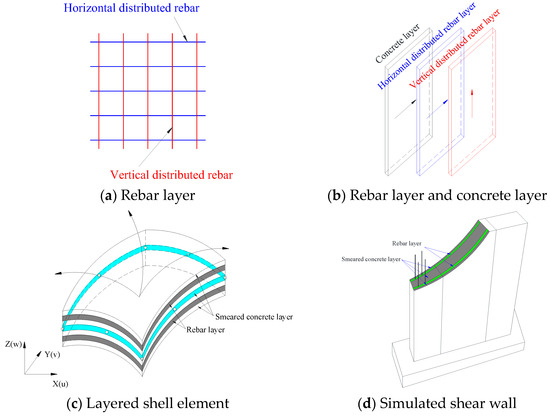
Figure 14.
Multi-layer shell element.
3.3.2. Material Model
The material model used in multi-layer shell element is a kind of two-dimensional material model based on smeared crack and damage mechanics, where the constitutive relationship is:
where E1, E2, ν12, ν21 and G12 are non-damaged elastic constants, D1 and D2 are damage variables and the two-dimensional rebar models are Steel01 and Steel02 based on uniaxial materials with space angles.
3.3.3. Size Effect
A more precise meshing approach ends up with faster declination in its load displacement curve if an identical cracking and softening stress–strain curve is utilized for all elements in the concrete. This phenomenon is called the fracture size effect, as shown in Figure 15, where N stands for the number of elements. To deal with this problem, a generalized method is to use the crack band model to adjust the softening stage of the concrete. Herein, the stress–strain curve is replaced with a crack width–stress curve, as shown in Figure 16, and the area contained by the curve is described as fracture energy.
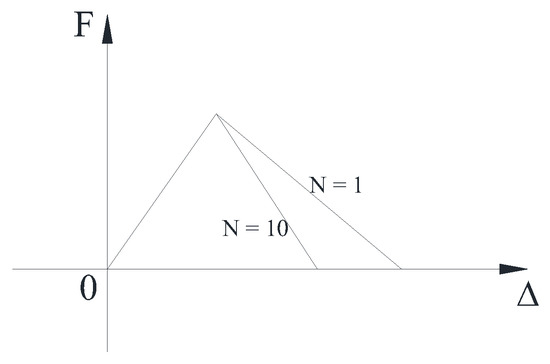
Figure 15.
Load–deformation curve of different mesh numbers.
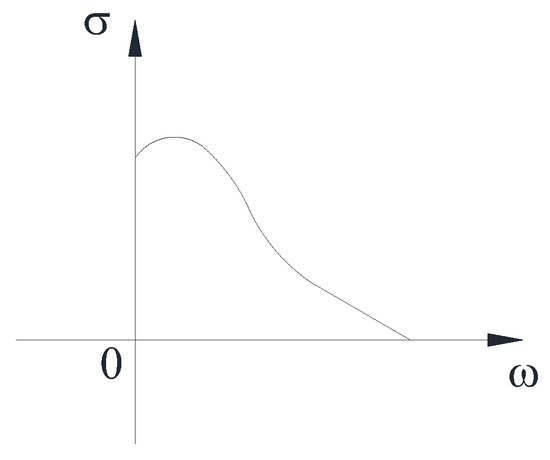
Figure 16.
Stress–crack width curve and fracture energy.
The shear transfer coefficient of the fracture surface is a complicated problem in the calculating process of the shell element. A trial value of 0.125 is recommended. In this paper, a lower value was taken in the range of the severely cracked concrete, whereas a higher value was taken in the core of the concrete.
3.3.4. Analysis Results
Figure 17, Figure 18, Figure 19 and Figure 20 summarize the FEM-simulated results and test results of the hysteretic curves from four shear wall specimens either prefabricated or cast-in-site, where different meshing sizes are also compared.
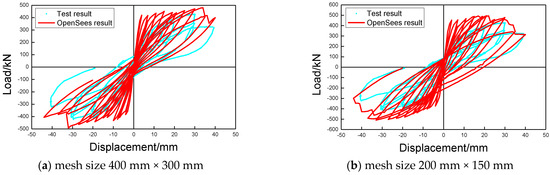
Figure 17.
Load–deformation curve of W2.
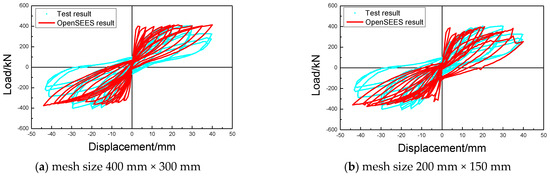
Figure 18.
Load–deformation curve of W3.
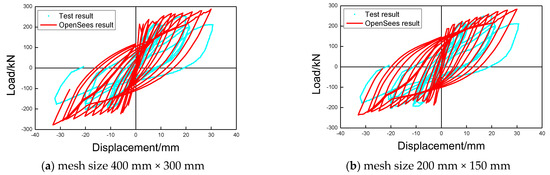
Figure 19.
Load–deformation curve of W5.
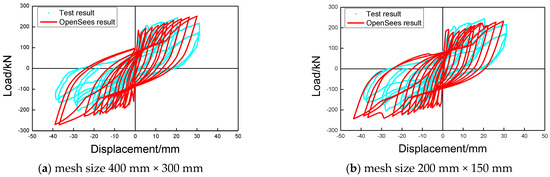
Figure 20.
Load–deformation curve of W6.
From the results, a layered shell element under a low cyclic reverse load properly simulated the strength reduction effect, stiffness degradation effect and pinch effect. Given the mesh size of 400 mm × 300 mm, the simulated result for W2 is 480.3 kN, which has an error of 11.9% compared with the test result of 429 kN. The simulated result for W3 is 413.5 kN, which has an error of 0.4% compared with the test result of 412 kN. The simulated result for W5 is 287.9 kN, which has an error of 20.0% compared with the test result of 240 kN. The simulated result for W6 is 251.5 kN, which has an error of 5.2% compared with the test result of 239 kN.
Given the mesh size of 200 mm × 150 mm, the simulated result for W2 is 494.8 kN with an error of 15.3%. The simulated result for W3 is 398.2 kN with an error of 3.3%. The simulated result for W5 is 283.3 kN with an error of 18.1%. The simulated result for W6 is 232.4 kN with an error of 2.7%. Compared with the results from the mesh size of 400 mm × 300 mm, the mesh size of 200 mm × 150 mm gave an equal effectiveness of predicting ultimate strength, and it performed better in evaluating hysteretic behavior. Table 5 lists a comparison of the peak points of the load–displacement curves based on the micro-model for more intuitive analysis. Under cyclic loading, simulated unloading stiffness and reloading stiffness were in close consensus with the test results.
Table 5.
Comparison of peak points of load–displacement curves based on the micro-model.
3.4. Comparison of Simulation Accuracy of Skeleton Curve
Figure 21 compares the hysteretic backbone curves from the simulated results and the test results for three kinds of models (a mesh size of 200 mm × 150 mm was chosen for the layered shell element model). It can be concluded that the vertical multi-line element model and bend–shear coupled fiber model fit the test results well, whereas the layered shell model gave a larger initial stiffness.
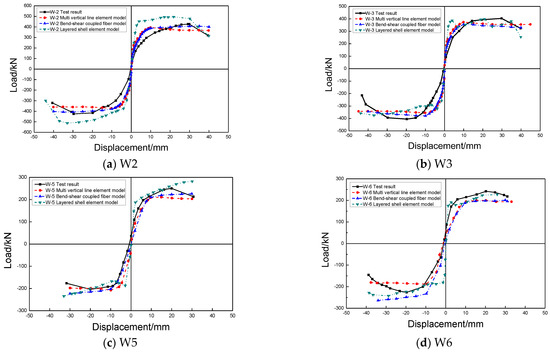
Figure 21.
Comparison of backbone curves for different models.
4. Conclusions
In this paper, the shear strengths of the bottom rebar joints and combined interfaces of superimposed slab shear walls were calculated using the shear resistance calculation formula for horizontal connections. The hysteretic behavior of two different kinds of superimposed slab shear walls with different wall configurations (where the edge member was either cast-in-site or prefabricated) were studied by using the finite element method. Here are the conclusions:
- (1)
- The shear strength of the combined interface is much larger than that of superimposed slab shear wall. Rebar trusses between the superimposed slab shear wall layers can provide reliable interface shear capacity. Based on this, when meeting the no-slip detail at the bottom of the shear wall through structural requirements, the consideration of interface slip effect in the FEM model can be avoided.
- (2)
- The shear strength of the horizontal connection at the bottom of the superimposed slab shear wall can be calculated using different codes. An adequate shear strength can be provided with joint rebar. Furthermore, the fixed-end boundary condition can be possibly realized in the FEM model.
- (3)
- A superimposed slab shear wall can be simulated by using three kinds of FEM models, namely the vertical multi-line element model, bend–shear coupled fiber model and layered shell element model. These three analytical models all give great results in simulating shear walls with different wall configurations. For hysteretic behavior simulation, unloading stiffness and reloading stiffness under cyclic loading using the layered shell element model is preferably consistent with test results. For backbone curve simulation, simulated results using the vertical multi-line element model and bend–shear coupled model provide excellent agreement with test results.
Author Contributions
Conceptualization, S.Y. and Y.Z.; methodology, J.B.; software, S.Y.; validation, Y.Z. and W.Z.; formal analysis, H.C.; investigation, S.Y.; resources, J.B. and J.J.; data curation, X.C.; writing—original draft preparation, S.Y.; writing—review and editing, Y.Z., W.Z. and J.J.; visualization, X.C.; supervision, H.C., W.Z. and J.J.; project administration, S.Y.; funding acquisition, Y.Z. All authors have read and agreed to the published version of the manuscript.
Funding
This research was funded by the Shanghai Rising-Star Program, grant number 21QB1406400.
Data Availability Statement
Data will be made available on request.
Acknowledgments
This research was sponsored by the Shanghai Rising-Star Program, grant number 21QB1406400. Any opinions, findings, conclusions or recommendations expressed in this article are those of the authors and do not necessarily reflect the views of the sponsors.
Conflicts of Interest
The authors declare no conflict of interest.
References
- Ma, W.; Xu, K.; Cheng, B.; Zhang, Y.; Chen, R.; Chen, D. Experimental study on the seismic behavior of a new single-faced superposed shear wall with the concealed column. Structures 2021, 33, 4446–4460. [Google Scholar] [CrossRef]
- Meng, L.; Zhu, L.; Sun, R.; Su, H.; Ye, Y.; Xu, L. Experimental investigation on seismic performance of the double-superimposed shear wall with different vertical connections. Struct. Concr. 2022, 23, 1439–1452. [Google Scholar] [CrossRef]
- Jiang, Q.; Shen, J.; Chong, X.; Chen, M.; Wang, H.; Feng, Y.; Huang, J. Experimental and numerical studies on the seismic performance of superimposed reinforced concrete shear walls with insulation. Eng. Struct. 2021, 240, 112372. [Google Scholar] [CrossRef]
- Huang, Z.; Liew, J.Y.R.; Xiong, M.; Wang, J. Structural behaviour of double skin composite system using ultra-lightweight cement composite. Constr. Build. Mater. 2015, 86, 51–63. [Google Scholar] [CrossRef]
- Benayoune, A.; Samad, A.A.; Trikha, D.N.; Ali, A.A.; Ellinna, S.H.M. Flexural behaviour of pre-cast concrete sandwich composite panel–experimental and theoretical investigations. Constr. Build. Mater. 2008, 22, 580–592. [Google Scholar] [CrossRef]
- Hamid, N.H.; Fudzee, M.M. Seismic performance of insulated sandwich wall panel (ISWP) under in-plane lateral cyclic loading. Int. J. Emerg. Technol. Adv. Eng. 2013, 3, 1–17. [Google Scholar]
- Hodicky, K.; Sopal, G.; Rizkalla, S.; Hulin, T.; Stang, H. Experimental and numerical investigation of the FRP shear mechanism for concrete sandwich panels. J. Compos. Constr. 2015, 19, 04014083. [Google Scholar] [CrossRef]
- Lian, X.; Ye, X.; Wang, D.; Jiang, Q.; Chang, L. Experimental Analysis of Seismic Behavior of Superimposed Slab Shear Walls. J. Hefei Univ. Technol. 2009, 32, 105–109. (In Chinese) [Google Scholar]
- Jia, L.; Li, Q.; Zhang, Y.; Zhao, W.; Du, M. Experimental study of the hysteretic behavior of prefabricated frame-shear wall structures with grouting sleeve connections. J. Build. Eng. 2022, 57, 104704. [Google Scholar] [CrossRef]
- Wang, M.; Guo, S. Seismic behavior of superimposed reinforced concrete shear walls with X-shaped steel plate bracings under different axial load ratios. Struct. Des. Tall Spec. Build. 2021, 30, e1889. [Google Scholar] [CrossRef]
- Gu, Q.; Zhao, D.; Tan, Y.; Gao, H.; Deng, Q.; Wang, X. Experimental study on L-shaped precast concrete superposed shear walls under quasi-static cyclic loading with different axial compressive load ratios. Eng. Struct. 2022, 254, 113857. [Google Scholar] [CrossRef]
- Gu, Q.; Zhao, D.; Li, J.; Peng, B.; Deng, Q.; Tian, S. Seismic performance of T-shaped precast concrete superposed shear walls with cast-in-place boundary columns and special boundary elements. J. Build. Eng. 2022, 45, 103503. [Google Scholar] [CrossRef]
- Wang, B.; Shi, Q.-X.; Cai, W.-Z.; Peng, Y.-G.; Han, L.I. Research on the calculation method for the deformation capacity of RC shear walls with a flange. Eng. Mech. 2020, 37, 167–175, 216. [Google Scholar]
- Zhang, Z.W.; Bai, G.L.; Qin, C.G.; Li, J.R.; Liu, H.Q. Shaking table test of fabricated concrete shear wall structure and study on damage mechanism of strong earthquake. Structures 2022, 43, 645–656. [Google Scholar] [CrossRef]
- Wang, Z.; Liu, W.; Ye, Y.; Sun, R.; Wei, W. Experimental study on seismic behavior of reinforced concrete composite shear wall with opening. J. Build. Struct. 2012, 33, 156–163. [Google Scholar]
- Wang, Z.; Liu, W.; Wei, W.; Ye, Y. Experimental study on seismic behavior of reinforced concrete composite shear wall with level splice. J. Build. Struct. 2012, 33, 147–155. [Google Scholar]
- Ye, Y.; Sun, R.; Xue, Z.; Wang, H. Experimental study on seismic behavior of SCC and precast NC composite shear wall. J. Build. Struct. 2014, 35, 138–144. [Google Scholar]
- Yang, L.; Yu, S.; Zhang, Q. Seismic behavior of superimposed slab shear walls under different axial load ratios. J. Vib. Shock. 2016, 35, 227–239. (In Chinese) [Google Scholar]
- Mast, R.F. Auxiliary reinforcement in concrete connections. J. Struct. Div. 1968, 94, 1485–1504. [Google Scholar] [CrossRef]
- Mattock, A.H. Shear friction and high-strength concrete. Struct. J. 2001, 98, 50–59. [Google Scholar]
- ACI Committee. ACI 318-19: Building Code Requirements and Commentary; American Concrete Institute: Indianapolis, IN, USA, 2019. [Google Scholar]
- Code, P. Eurocode 2: Design of Concrete Structures-Part 1–1: General Rules and Rules for Buildings; British Standard Institution: London, UK, 2004. [Google Scholar]
- Patnaik, A.K. Behavior of composite concrete beams with smooth interface. J. Struct. Eng. 2001, 127, 359–366. [Google Scholar] [CrossRef]
- Lin, Y.; Qian, Y.; Wang, Z. Research on calculation method of new-old concrete interface cohesion strength. Ind. Constr. 2006, 36, 844–846. [Google Scholar]
- Zhang, L.; Wang, E.; Yan, G. Experimental study on shearing property of interfacial bonding of new to old concrete by planting reinforced bar. J. Zhengzhou Univ. (Eng. Sci.) 2006, 27, 34–37. (In Chinese) [Google Scholar]
- Yang, Y. Research on Performance and Bonding Methods of the Interface in Strengthening Concrete Structures; Xi’an University of Science and Technology: Xi’an, China, 2006. (In Chinese) [Google Scholar]
- Nie, J.; Wang, Y.; Fan, J. Mechanical behavior of the interface of composite cross beam in old concrete bridges widened with steel-concrete composite beam. China Civ. Eng. J. 2012, 45, 99–109. [Google Scholar]
- Magana, R.A.; Schultz, A.E. Design and behavior of connections in precast concrete shear walls. In Proceedings of the Eleventh World Conference on Earthquake Engineering, Acapulco, Mexico, 23–28 June 1996. [Google Scholar]
- Soudki, K.A.; Rizkalla, S.H.; Daikiw, R.W. Horizontal connections for precast concrete shear walls subjected to cyclic deformations part 1: Mild steel connections. PCI J. 1995, 40, 78–96. [Google Scholar] [CrossRef]
- JGJ1-2014; Technical Specification for Precast Concrete Structures. Standards Press of China: Beijing, China, 2014.
- Chong, X.; Xie, L.; Ye, X.; Jiang, Q.; Wang, D. Experimental study on the seismic performance of superimposed RC shear walls with enhanced horizontal joints. J. Earthq. Eng. 2019, 23, 1–17. [Google Scholar] [CrossRef]
- Wang, W.; Wang, J.; Guo, L.; Hu, P. Development of hysteretic model for LEM-filled CFS shear walls under cyclic loading. Eng. Struct. 2023, 280, 115651. [Google Scholar] [CrossRef]
- GB 50010-2010; Code for Design of Concrete Structures. Standards Press of China: Beijing, China, 2010.
- CS Association. Design of Concrete Structures: Mississauga; Canadian Standards Association: Toronto, ON, Canada, 2020. [Google Scholar]
- NZS3101; Concrete Structures Standard. Standards New Zealand: Wellington, New Zealand, 2006.
- Mulas, M.G. Shaking Table Tests on RC Shear Walls: Significance of Numerical Modeling. Ph.D. Thesis, Politecnico di Milano, Milano, Italy, 2007. [Google Scholar]
- Giberson, M.F. The Response of Nonlinear Multi-Story Structures Subjected to Earthquake Excitation. Ph.D. Thesis, California Institute of Technology, Pasadena, CA, USA, 1967. [Google Scholar]
- Clough, R.W.; Benuska, K.L.; Wilson, E.L. Inelastic earthquake response of tall buildings. In Proceedings of the Third World Conference on Earthquake Engineering, Auckland, New Zealand; Wellington, New Zealand, 22 January–1 February 1965; Volume 11. [Google Scholar]
- Lai, S.S.; Will, G.T.; Otani, S. Model for inelastic biaxial bending of concrete members. J. Struct. Eng. 1984, 110, 2563–2584. [Google Scholar] [CrossRef]
- Park, H.; Eom, T. Truss model for nonlinear analysis of RC members subject to cyclic loading. J. Struct. Eng. 2007, 133, 1351–1363. [Google Scholar] [CrossRef]
- Kabeyasawa, T.; Shioara, H.; Otani, S. US-Japan cooperative research on R/C full-scale building test, Part 5: Discussion on dynamic response system. In Proceedings of the Eighth World Conference on Earthquake Engineering, San Francisco, CA, USA, 21–28 July 1984; p. 634. [Google Scholar]
- Vulcano, A.; Bertero, V.V.; Colotti, V. Analytical modeling of RC structural walls. In Proceedings of the 9th World Conference on Earthquake Engineering, Tokyo, Japan, 2–9 August 1988; Volume 6, pp. 41–46. [Google Scholar]
- Hirosawa, M. Past experimental results on reinforced concrete shear walls and analysis on them. Kenchiku Kenkyu Shiryo 1975, 6, 33–34. [Google Scholar]


Disclaimer/Publisher’s Note: The statements, opinions and data contained in all publications are solely those of the individual author(s) and contributor(s) and not of MDPI and/or the editor(s). MDPI and/or the editor(s) disclaim responsibility for any injury to people or property resulting from any ideas, methods, instructions or products referred to in the content. |
© 2023 by the authors. Licensee MDPI, Basel, Switzerland. This article is an open access article distributed under the terms and conditions of the Creative Commons Attribution (CC BY) license (https://creativecommons.org/licenses/by/4.0/).