Abstract
This research explores the energy behaviour of a traditional house on the Mediterranean coast of south-eastern Spain. The objective of the work is to determine the optimal passive strategies for rehabilitating a traditional house, improving its energy savings and comfort, considering the characteristics of the warm semi-arid Mediterranean climate. The main novelty of this article is that it demonstrates that the limits imposed by current regulations, based on globalised climate strategy approaches, undermine the energy efficiency capacity that passive solutions in vernacular architecture already employed. The methodology used consists of a systematised multi-objective study of various energy rehabilitation strategies. Four strategies were studied: raising the thermal insulation of enclosures, improving thermal insulation and solar control glazing with movable shading devices, increasing the size of windows and introducing the use of natural ventilation enhanced by ceiling fans. The results show that simultaneous improvement of these parameters reduces cooling and heating requirements by up to 87%, reducing the energy consumption of air conditioning systems. Indoor temperatures are also maintained within the comfort limits set by regulations for 91% of hours per year without the need for air conditioning systems. This results in a passive energy-efficient and comfortable house almost all year round. This work offers an alternative solution to the comfort standards of current Spanish regulations and demonstrates the need to adapt Fanger’s analytical method for comfort estimation. The research concludes that the comfort criteria of current energy regulations should be modified to better adapt the design criteria to the dry Mediterranean climate.
1. Introduction
It is established that buildings are responsible for 29% of the world’s energy use and contribute to 21% of CO2 emissions [1]. In the EU, the share of energy consumption of residential buildings reached 40% [2] at the beginning of the century and 25.7% in 2016 [3]. The Sustainable Development Goals stress the importance of reducing the environmental impact of urban environments [4] and improving the energy efficiency of buildings [5,6]. These objectives entail a progressive increase in European energy efficiency regulatory requirements, such as European Directive 2010/317EU [7] and subsequently Directive (EU) 2018/844 [8], and consequently the Spanish regulations have also been revised [9,10]. These regulations have greatly increased the thermal insulation requirements for new and renovated buildings [11,12], with a particular focus on reducing the thermal transmittance and airtightness of building envelopes. However, the creation of airtight and highly insulated thermal envelopes is not the best construction response in hot and semi-arid climates with high annual insolation such as the dry Mediterranean climate (BShs). The dry Mediterranean climate is characterised by a lower annual temperature oscillation than other European climates, with mild winters and not excessively hot summers, and a high level of sunshine throughout the year. In recent years, there has been an increase in tropical nights throughout the year [13,14]. In Europe, this type of climate is not very representative because it is found exclusively in south-eastern Spain and southern Greece [15]. This specificity implies designing a particular architecture that is different from the rest of the European climate zones, which is missing in the Spanish regulations. The current literature and building energy efficiency regulations do not specifically analyse the advantages of high annual insolation and natural ventilation of houses in a dry Mediterranean climate (BShs). The originality of this work is in studying, with priority to comfort and passive solutions, the optimal strategies for rehabilitating a traditional Mediterranean house with the most balanced intervention, improving its energy efficiency and avoiding air conditioning systems.
Adapting design criteria to climatic characteristics is one of the key actions to meet the regulatory requirements for nearly zero energy buildings (NZEB) [16] and to reduce greenhouse gas emissions from buildings [17]. Additionally, these design criteria should incorporate optimal construction solutions to achieve the lowest energy and material consumption over the entire life cycle of the building. To this end, the architectural design and construction systems should be adapted to the characteristics of the local climate. This means using design strategies that do not need energy to work in accordance with the Kyoto Pyramid [18] to reduce energy consumption and increase user comfort with less use of air conditioning systems.
In the case of the dry Mediterranean climate of south-eastern Spain, the optimal passive design solutions are those that in winter take advantage of the “free” heating from high solar radiation and in summer protect the interior from the sun and dissipate excess heat from inside the building via ventilation. Therefore, in addition to improving the insulation of the building envelope [19,20,21], adjustable solar shading systems [22] and natural ventilation should be used to avoid overheating due to the unwanted greenhouse effect in the warmer months [23]. However, current Spanish and European energy efficiency regulations focus on ensuring highly thermally insulated and airtight building envelopes. These regulations do not facilitate the application of some passive systems typical of the dry Mediterranean climate [24], where vernacular architecture is defined by a less-tight envelope that promotes natural ventilation.
They also do not consider the advantages of natural ventilation for the thermal comfort of users in this climate, as proposed in the bioclimatic diagrams of Givoni [25,26] or Oligay [27] and analysed in many studies [28,29,30,31,32,33,34,35,36]. Many researchers have studied the influence of natural ventilation on the indoor thermal environment in residential buildings as well [37,38,39,40].
This standard sets much more restrictive operating temperature limits and does not consider the positive effect of air velocity in achieving comfort even at higher temperatures than allowed [41]. Current Spanish energy efficiency regulations and national energy certification software [42,43] do not allow for modelling the effect of natural ventilation, despite its advantages of dissipating heat in summer and lowering the temperature and relative humidity of the air [44,45,46,47]. It should be noted that there are studies on this type of climate in other parts of the world, but their architectures are not regulated by European standards and have other variations in their design and construction systems [48,49], making comparisons misleading.
The novelty of this research is to demonstrate that, in a BShs climate, only the combined action of improving thermal insulation, increasing the size of windows, increasing the solar control of glazing and using natural ventilation supported by ceiling fans can achieve energy-efficient and comfortable houses without the use of air conditioning. This work proposes an alternative solution to the current energy efficiency regulations in Spain and Europe.
This research analyses a traditional house located in the south-east of Spain. The purpose is to demonstrate the possibility of achieving energy-efficient and comfortable homes all year round in a BShs climate without using conditioning systems. The aim was to optimise energy performance and improve user comfort with minimal intervention, which is compatible with, and respectful of, the original building. The methodology consists of the study and analysis of the hygrothermal behaviour of a traditional house and a systematised study of the most influential design parameters for optimising energy performance and improving indoor comfort. The research modelled and analysed the constructive design that optimises the energy performance of the building to meet the requirements of current regulations [50,51] and improve comfort by adapting to the characteristics of the local climate [52,53,54]. The research analyses passive design retrofit strategies such as increased thermal insulation [55] and natural cross ventilation [56] to improve the energy efficiency, indoor hygrothermal quality [57] and thermal comfort [58] of traditional buildings. The target is to identify simple passive design strategies that can strongly influence the energy performance of a building in this climate. Other research has demonstrated the benefits of improving the insulation of traditional dwellings in Mediterranean climates in terms of the comfort of their users [59]. However, this research is not specific to the dry Mediterranean BShs climate. It also does not analyse the beneficial effect of the greenhouse effect in winter caused by increasing the size of windows, nor the use of natural ventilation in summer. Other research examines the influence of thermal inertia of traditional envelopes with the incorporation of novel high-thermal-insulation envelope systems with dynamic envelope ventilation strategies [60]. These solutions were discarded because of their aesthetic impact on traditional houses. The present research aims to demonstrate that adequate natural ventilation of the interior of the house with more windows sufficiently improves thermal performance in summer. This research does not consider other scenarios based on active systems, e.g., the use of renewable energies through thermal or photovoltaic panels that can be integrated into the existing fabric [61]. Our purpose is to provide an alternative to traditional mechanical methods of air conditioning [62] through bioclimatic design strategies. Sustainability criteria were considered, reflected using traditional and autochthonous materials, minimum intervention and alteration of the original building, and lower economic cost [63].
A traditional Mediterranean house was selected as a case study and we used the opinions of its occupants through analytical surveys of the Predicted Mean Vote (PMV) and Predicted Percentage Dissatisfied (PPD) indices for estimating comfort using the Fanger method. Many investigations apply the PMV and PPD indices according to the Fanger model and demonstrate the need to correlate the temperature with the relative humidity of the indoor environment to ensure that the human comfort zone is reached [64,65]. This work analyses the applicability of the Fanger model in this BShs climate zone, compares the results with survey data, and proposes some corrections. This paper also proposes modification of the Givoni diagrams and the Spanish regulations on comfort to adapt them to the BShs climate.
This study contributes to a better understanding of the thermal performance of vernacular buildings. It is hoped that it will slow the current degradation and disuse of these dwellings and prevent unsuitable thermal renovations and retrofits, thus helping to safeguard the architectural and cultural heritage of this region of Spain. The usefulness of this research is to quantitatively evaluate the improvement in energy efficiency and thermal comfort produced by the proposed passive systems for the vernacular architecture of south-eastern Spain with a dry Mediterranean climate. This research demonstrates the inefficiency of over-insulating buildings in a BShs climate. It also contributes to questioning the limitations of Spanish energy efficiency regulations regarding passive systems such as natural ventilation. In this way, Pfafferot [66] drew beneficial conclusions from the use of night ventilation in subtropical, Mediterranean and desert climates. The demonstration of the validity of economical passive systems adapted to vernacular traditions can contribute to a more sustainable energy rehabilitation compatible with the built heritage of the area and protecting the culture of the “orchard of Alicante”.
2. Materials and Methods
The case study building is a traditional country house located near the city of Elche in the province of Alicante (Spain). It is located on the outskirts of the city in an area designated for agricultural plantations. Its geometry and construction method are common in the vernacular architecture of this area. The footprint is rectangular, 9.70 m long and 6.00 m wide, and the building is oriented south–north like most of the vernacular houses in the area. As is common in this typology, it has a main hall that runs longitudinally from east to the west, where the main activity of the house takes place, with a living–dining room and a kitchen. On the side, there are two bedrooms and a bathroom (Figure 1).

Figure 1.
Case study house: (a) location, (b) external image, (c) floor plan.
This house was selected because it is an example of the traditional Mediterranean autochthonous architecture of south-eastern Spain. This building typology is characterised by local materials, a layout that responds to the old needs of the agricultural sector, and its typical orientation. The construction and spatial characteristics also serve as an example of other similar traditional architectural typologies in this part of Spain. This building typology is currently experiencing a gradual process of abandonment due to its age and insufficient (thermal) comfort. This leads to fabric deterioration and the disappearance of the cultural and architectural heritage of the area [67].
The methodology used in this work consisted of two phases. The first was an investigation of the current hygrothermal conditions of the house, supported by an occupant survey of thermal comfort. This took place over a 12-month period. Second, a systematized and parametric study of different alternative passive design retrofit solutions was conducted. A comparative analysis of five proposed retrofit interventions and their effect on building energy performance and comfort considering the specific conditions of the local climate was performed.
Phase 1. Three types of measurements were made in situ. First, a thermographic survey was carried out to establish the performance of the building’s thermal envelope. Second, using a thermal transmittanceflowmeter, the thermal transmittance of the envelope of the enclosures that are part of the house was measured. Third, by using a hot-wire probe, the behaviour and stratification of temperatures inside the spaces was measured simultaneously with air velocity. An important part of this study was the evaluation of user perception of comfort in spaces and their thermal adaptation. This data was captured through a questionnaire survey that collected the occupants’ perceptions for twelve months. The questionnaire was completed by the eight members of the family who were residents or regular visitors to the property. A procedure was defined in all visits to ensure that the survey was completed according to pre-established conditions. These conditions were that the measurements were to be taken at the same time and the data recording instruments should be connected five minutes before taking the measurement. An important part of the protocol was that air conditioning could not be turned on for the whole day so as not to interfere with the interior conditions.
At the same time, using a weather station, a climate file was created that collected outdoor temperature and humidity for a period of 12 months, with two daily readings every 3 days.
The instrumentation used for data collection consisted of different teams. The thermographic evaluation was carried out by using a Testo 868 camera. The evaluation of thermal transmittance, humidity and temperature, and air speed was carried out by using a Testo 435-2 multifunctional instrument calibrated with standard settings.
Phase 2. This research has a systematized approach and is based on the four rehabilitation interventions that have the greatest influence on the energy efficiency of this kind of building in this climate. The proposed modifications were:
- -
- Improving the thermal insulation of opaque enclosures, evaluating the optimal thickness of the thermal insulation (Modification 1);
- -
- Improving window characteristics by reducing the thermal transmittance of the glazing (Ug) (Modification 2a), which reduces the thermal transmittance of the windows (Uw). The solar control factor of glass (g) (Modification 2b) and total solar transmittance of the glazing with an activated movable shading device (g_gl;sh;wi) (Modification 2c) were also improved;
- -
- Increasing the proportion of glazed area on the walls (Window Wall Ratio WWR) (Modification 3), analysing the impact of window size and proportion over the total of the façade;
- -
- Use of natural ventilation and the advantages of using ceiling fans to improve cross ventilation and redistribute the air and its temperature (Modification 4). The effect of natural ventilation on the operation of the building was analysed, and we performed computational fluid dynamics (CFD) analysis to determine the circulation speed of indoor air and its influence on the interior conditioning of the spaces.
And finally, a solution was proposed with all improvements implemented simultaneously.
This study analyses the influence of each of these interventions on interior temperatures, interior comfort and energy efficiency (Figure 2).

Figure 2.
Methodology diagram of the study.
Design Builder software (version v.7.0.1.006, DesignBuilder Software Limited, Stroud, UK) was used for modelling and simulation. This is a recognized software in the process of evaluating the energy performance of buildings that offers a wide variety of results and high customization. It uses the EnergyPlus calculation engine [68], which allows one to accurately define the geometry and construction of a building, in addition to defining use profiles that can include passive ventilation systems.
This software was also used in the development of the CFD analysis, in which the location of the building, the climatic conditions in which it is located, including the prevailing winds, and its construction characteristics were considered.
In a first adjustment, a heat transfer coefficient of 20 W/m2·K was considered, given the absence of insulation and a reference temperature equal to room temperature, since we did not intend to introduce the factor of conditioning systems in the analysis. The parameters used in air configuration in the analysis were:
- -
- Maximum air speed equal to the wind speed at the input factor;
- -
- Static gauge pressure equal to 0 at the air outlet.
The CFD simulation carried out was of the linear static type that omits the influence of external wind in the calculations. A convergence limit was defined in the calculation when the fluctuation or deviation was below the established level. At the same time, a large-enough analysis zone was established such that artificial variations in air acceleration did not occur with a variable fluid material environment and several iterations greater than 500 [69,70,71].
The calculation method used to evaluate the performance of the building was carried out in accordance with current Spanish regulations. Gains and losses through the building envelope by conduction were considered, to which the transmission of solar energy through the openings with their solar factor corrections and shading elements was added or subtracted. In addition, the loss of air through the gaps, the influence of ventilation and the internal loads generated by the occupants and the equipment were considered.
For all simulations, the climatic data were considered on the same days on which the measurement campaign was carried out, including temperature and relative humidity.
For the analysis of comfort, indoor temperatures measured in situ and those calculated virtually were compared with Givoni’s bioclimatic diagrams. The estimation of the thermal sensation of users was also calculated with the Predicted Mean Vote (PMV) and the Predicted Percentage Dissatisfied (PPD) using the analytical Fanger method.
For the thermal simulations, the climate database of the El Altet weather station (Alicante) was used. This geographical area corresponds to climate B4 according to Spanish legislation [72]. It can be fitted into climate BShs (dry Mediterranean climate within a warm semi-arid climate) in the Köppen climate classification [73] (see Figure 2). The climate in this area is defined by mild winters and warm summers, and temperatures allow for comfortable conditions during a large part of the year, as the average annual temperature is 18.3 °C. The most complicated part of the year to allow comfort occurs in the summer when the average temperature is 27 °C and only falls to 22 °C during the nights. However, this situation is compensated by the sea breeze, as the location is near the coast. This climate is also defined by high annual sunshine, high relative humidity and few episodes of rain that mostly happen in the autumn, with storms and torrential downpours (Figure 3).

Figure 3.
(a) BShs climate zone (red) according to the Köppen–Geiger Climate Classification for the Iberian Peninsula, the Balearic Islands and the Canary Islands of the Agencia Estatal de Meteorología del Ministerio para la Transición Ecológica del Gobierno de España; (b) location map of the house (large circle) and main locations of this housing typology (small dots) (own elaboration).
The computer model of the house considered its situation, dimensions, orientation, geometry, location of glazing and construction of the thermal envelope (Figure 4 and Table 1).

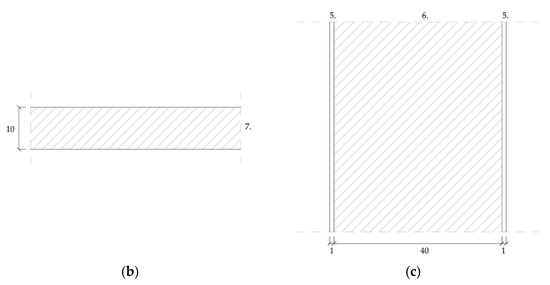
Figure 4.
Construction of the house: (a) roof section; (b) floor slab section; (c) façade wall construction. Materials: 1.: ceramic tile; 2.: air chamber; 3.: wattle; 4.: wooden beam; 5.: lime mortar; 6.: adobe and straw wall; 7.: soil. (dimensions in cm).

Table 1.
Original House Construction Characteristics.
To introduce the modified construction and geometric parameters, the parameter variations were introduced individually and progressively to allow for the evaluation of their effect on the energy performance and comfort of the house (Figure 5 and Table 2).
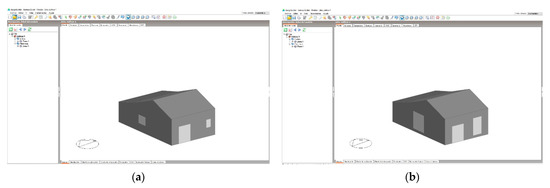
Figure 5.
Design Builder models: (a) original house; (b) modified house with 10% windows–wall ratio.

Table 2.
Original house and proposed house modifications construction and geometrical characteristics.
3. Results
3.1. Energy Efficiency
The calculations performed for the original house yielded winter heating needs above 39.07 KWh/m2·year and summer cooling needs reaching 10.35 KWh/m2·year (Figure 6). Therefore, the overall annual energy need (Heating + Cooling) reached 49.42 KWh/m2·year.
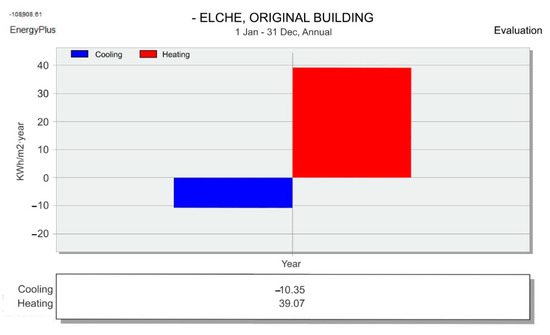
Figure 6.
Simulation results of the calculations of heating and cooling demands of the original building with the original construction features.
The results offered by this simulation indicate that an improvement in the thermal insulation of the opaque part of the envelope (Modification 1) by introducing 11 cm of hemp insulation reduces the heating energy need in winter by 29% but increases the cooling energy need in summer by 6%. It was also found that the impact generated by an increase in the thickness of the thermal insulation was reduced if the thickness of the insulation was increased, also generating an increase in the cooling demand (Figure 7a). In this case, the total annual energy demand (Heating + Cooling) is only reduced by 15% (Figure 6b). The use of artificial insulating materials would reduce the thickness of insulation needed to achieve the same overall annual energy requirement, such as expanded polystyrene (EPS) (7.7 cm), polyurethane foam (7.2 cm) or outdoor vacuum insulation panels (VIPs) (5.3 cm).
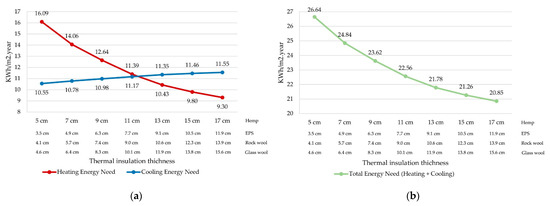
Figure 7.
Improvement in thermal insulation in the opaque parts of the building enclosures: (a) cooling and heating energy needs; (b) total energy need.
The yielded results show that improving the quality of the glazing by increasing its thermal insulation (Modification 2a) only offers an improvement of 2% and worsens summer cooling needs by 0.5% (Figure 7a), providing an overall improvement of 1.5% (Figure 8b).

Figure 8.
Improvement in thermal insulation in glazing (Ug): (a) cooling and heating energy needs; (b) total energy need.
If an improvement in the solar factor (g) is introduced in glazing (Modification 2b), the cooling energy needs in summer are reduced by 2.5% and the heating needs in winter are increased by 2.3% (Figure 9a). As a result, this intervention increases the overall energy need (Heating + Cooling) by 1.3% (Figure 9b).

Figure 9.
Improvement in solar control of glazing (g): (a) cooling and heating energy needs; (b) total energy need.
The incorporation of movable solar shading (Modification 2c), using it only during the summer months, reduces summer cooling needs by 10% and does not worsen winter heating needs (Figure 10a). However, the overall energy need (Heating + Cooling) is only reduced by 2%. (Figure 10b).

Figure 10.
Improvement in glazing total solar energy transmittance by introducing movable shading devices (ggl;sh;wi): (a) cooling and heating energy needs; (b) total energy need.
Increasing the window–wall ratio (WWR) without adding solar shading (Modification 3) reduces winter heating needs by almost 18% but greatly increases summer cooling needs by more than 40% (Figure 11a). Consequently, the overall energy need (Heating + Cooling) can increase by up to 20% (Figure 11b).

Figure 11.
Modification of window–wall ratio (WWR): (a) cooling and heating energy needs; (b) total energy need.
Increasing the natural ventilation of the original dwelling in the summer (Modification 4) does not affect the winter heating needs and reduces the summer cooling needs by 7% (Figure 12a). This means a reduction in the overall energy need for heating and cooling by 2% (Figure 12b).
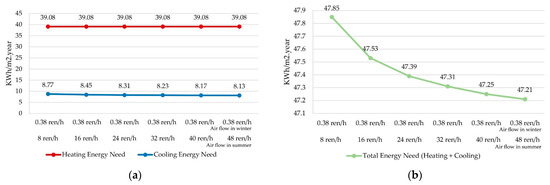
Figure 12.
Modification of natural ventilation (ren/h): (a) cooling and heating energy needs; (b) total energy need.
The results obtained show that simultaneous modification of the selected parameters allows a reduction in winter heating needs by up 2.02 KWh/m2·year and summer cooling needs by up to 4.42 KWh/m2·year (Figure 13). These results imply that it is possible to reduce the energy need for heating by up to 95% and the energy need for cooling by 57%, with a reduction in the global energy need of 87%, improving the annual energy performance of the house more than any of the calculated solutions that modified the parameters individually.
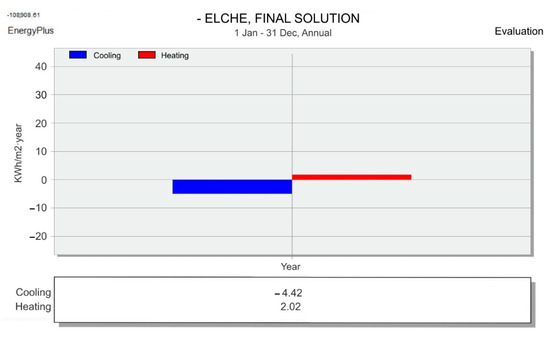
Figure 13.
Simulation results of the calculations of heating and cooling demands, implementing all the proposed improvements simultaneously.
3.1.1. Indoor Temperatures
The results obtained from the on-site measurements of the original building show that indoor temperatures in the house, without using air conditioning systems, are below 21 °C approximately 67% of the year (equivalent to 5856 h). Temperatures are below 19 °C for approximately 52% of the year (equivalent to 4598 h) and below 12.4 °C for approximately 3% of the year (equivalent to 238 h). On the other hand, temperatures are above 25 °C for 14% of the year (equivalent to 1219 h) and above 27 °C for approximately 7% of the year (equivalent to 625 h), with more than 5% of hours above 28 °C (equivalent to 430 h). Temperatures did not exceed 32 °C throughout the year. Consequently, for approximately 19% of annual hours (equivalent to 1664 h), indoor temperatures were maintained between 21 °C and 25 °C, and for approximately 41% of annual hours (equivalent to 3592 h), indoor temperatures were maintained between 19 °C and 27 °C. (Figure 14).
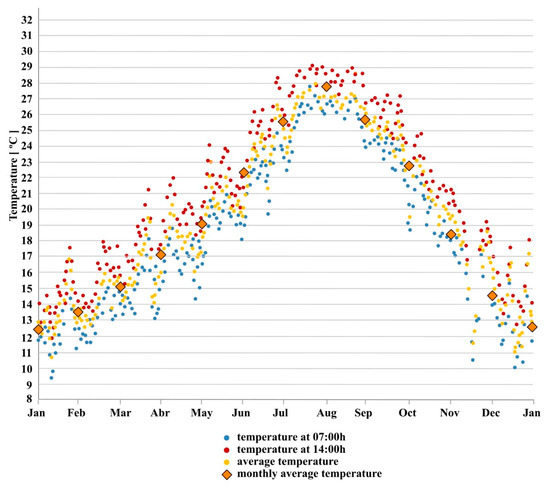
Figure 14.
On-site interior temperature measurements in the original building without using air conditioning systems.
Improving the thermal insulation of opaque enclosures reduces annual hours below 21 °C to 39% (3430 h) and annual hours below 19 °C to 23% (2075 h) and also eliminates hours below 12.4 °C. However, this intervention increases the annual hours above 25 °C to 40% (3547 h) and the annual hours above 27 °C to 29% (2569 h) (Figure 15a). Improved glazing insulation and solar shading on windows maintains annual hours below 21 °C at 67% (5784 h), maintains annual hours below 19 °C at 52% (4574 h), and slightly reduces hours below 12.4 °C to 2% (205 h). This intervention slightly reduces the annual hours above 25 °C to 12% (1042 h) and maintains the annual hours above 27 °C at 7% (619 h) (Figure 15b). The increase in WWR keeps annual hours below 21 °C at 68% (6000 h), keeps annual hours below 19 °C at 55% (4854 h), and keeps hours below 12.4 °C at 3.7% (327 h). This intervention increases the annual hours above 25 °C to 19% (1700 h) and maintains the annual hours above 27 °C at 7% (642 h) (Figure 15c). Finally, the use of natural ventilation in summer reduces the annual hours above 27 °C to 5% (438 h). This intervention decreases the hours above 28 °C to only 1% (70 h) (Figure 15d).
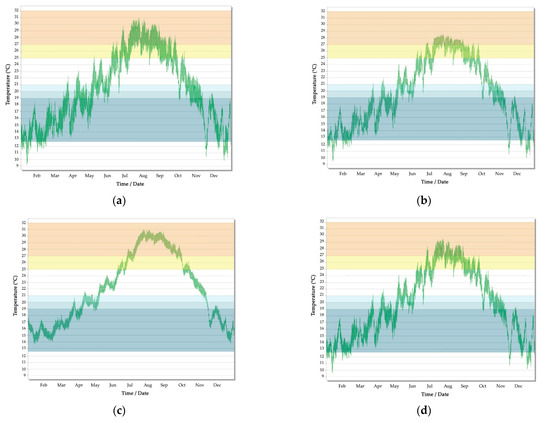
Figure 15.
Indoor temperatures considering the proposed energy renovation improvements individually: (a) modification of thermal insulation thickness of opaque enclosures (Modification 1); (b) modification of the thermal characteristics of the glazing (Modification 2); (c) modification of size of the glazing by modifying the size ratio between glass and opaque enclosures (WWR) (Modification 3); (d) use of natural ventilation in summer (Modification 4).
With regard to natural ventilation, the simulation results of the indoor air circulation calculations by means of CFD show that cross ventilation achieves comfortable temperatures with adequate air velocities, mostly below 0.10 m/s, in accordance with Spanish regulations. (Figure 16a,b).
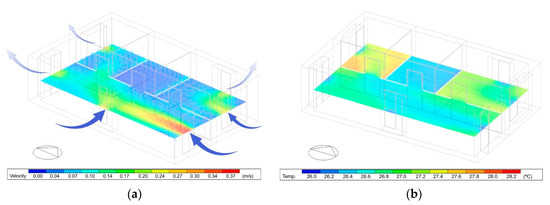
Figure 16.
Simulation results of the indoor air circulation calculations by means of CFD using natural cross ventilation: (a) air velocity results; (b) air temperature results.
At this point in the research, a new scenario was proposed with the incorporation of ceiling fans in each room. This measure has been studied in several studies as a means of improving energy efficiency, air quality [74] and sensation of thermal comfort [75,76], even up to 29° [77]. The simulation shows that the complementary use of ceiling fans allows a more controlled redistribution of air. They achieve more homogeneous temperatures and velocities throughout the dwelling and below 0.10 m/s (Figure 17a,b). It is interesting to recall that Roles et al. [78] concluded that ceiling fans can lead to energy savings of 15–18%.

Figure 17.
Simulation results of the indoor air circulation calculations by means of CFD using natural ventilation supported by ceiling fans: (a) air velocity results; (b) air temperature results.
The set of improvements incorporated in the final solution reduces annual hours below 21 °C to 19% (1681 h) and annual hours below 19 °C to just 3% (285 h), and eliminates hours below 12.4 °C. On the other hand, annual hours above 25 °C are increased to 20% (1840 h), but annual hours above 27 °C are reduced to 6% (552 h) and hours above 28 °C are drastically reduced to less than 1% (50 h) (Figure 18).
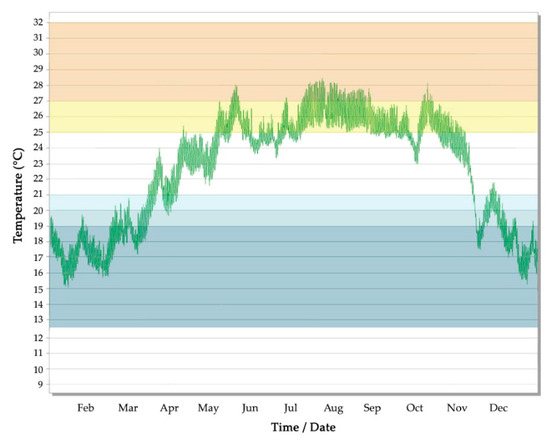
Figure 18.
Indoor temperatures considering all proposed energy retrofit improvements in the final solution: modification of thermal insulation thickness of opaque enclosures, modification of the thermal characteristics of the glazing, modification of size of the glazing by modifying the size ratio between glass and opaque enclosures and using natural cross ventilation.
3.1.2. Thermal Comfort
The temperatures obtained from the on-site measurements of the original building in winter are far from the comfort zone, but they are within the comfort zone with internal gains, with an indoor temperature of 9.5 °C on an extreme winter day (Figure 19) and 13.5 °C on the standard day (Figure 20). Improving the insulation of the opaque enclosures shows that temperatures are very close to the comfort zone, increasing from 9.5 °C to 13.8 °C on an extreme winter day and from 13.5 °C to 16.8 °C on the standard day. The rest of the proposed solutions hardly change the temperatures if applied individually. However, the application of all measures together does substantially improve temperatures, bringing them very close to the comfort zone on an extreme winter day and within the comfort zone on the standard day.
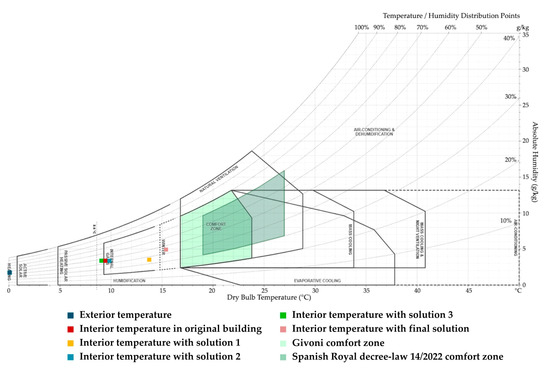
Figure 19.
Givoni chart with exterior and interior temperature measurements for winter extreme day.

Figure 20.
Givoni chart with exterior and interior temperature measurements for winter typical day.
In spring and autumn, indoor temperatures are outside the comfort zone on the coldest days but within the comfort zone with internal gain utilisation (Figure 21). However, temperatures are within the comfort zone on the hottest days (Figure 22). The indoor temperature is 13.8 °C on the coldest day and 25.0 °C on the hottest day. By improving the insulation of opaque enclosures, indoor temperatures remain within the comfort zone throughout spring and autumn. Again, the combined application of all the proposed measures offers the best results.

Figure 21.
Givoni chart with exterior and interior temperature measurements for spring/autumn cold day.
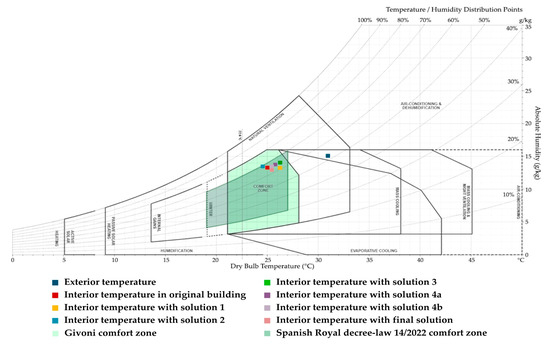
Figure 22.
Givoni chart with exterior and interior temperature measurements for spring/autumn hot day.
In summer, indoor temperatures are outside the comfort zone, although within the comfort zone with the use of natural ventilation, with an indoor temperature of 27.2 °C on the average day (Figure 23) and 29.1 °C on an extreme summer day (Figure 24). By improving the insulation of opaque enclosures, temperatures move away from the comfort zone, increasing from 27.2 °C to 28.9 °C on the typical summer day and from 29 °C to 30.7 °C on an extreme day. The rest of the proposed solutions do not improve house temperatures if applied individually. However, the application of all measures together improves temperatures, bringing them within the comfort zone on the standard summer day and bringing them very close to the comfort zone on an extreme day.
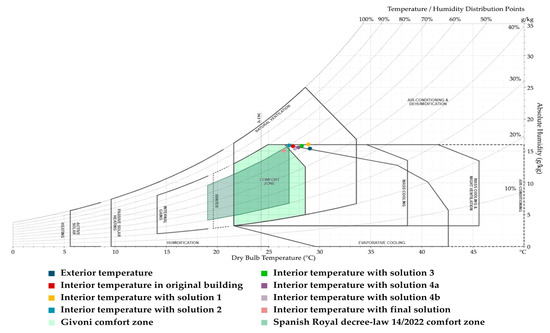
Figure 23.
Givoni chart with exterior and interior temperature measurements for summer typical day.
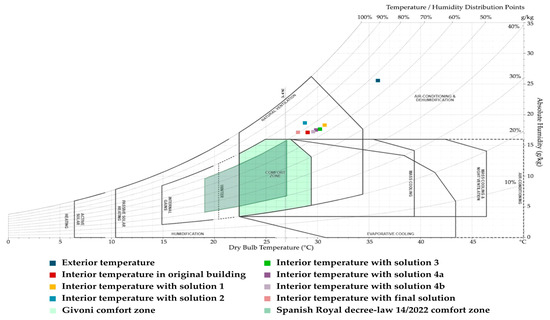
Figure 24.
Givoni chart with exterior and interior temperature measurements for summer extreme day.
The results of the comfort surveys conducted with the users of the dwelling show that for all occupants of the dwelling, the average thermal sensation inside the house was perceived as cold or cool in December and January and hot or very hot in July and August. The average thermal sensation remained cool or cold for 87.5% in February and cool for 50.0% in November. Additionally, it remained hot for 25% of occupants in June and September. During the months of April, May and October, the average thermal sensation was considered slightly cool to slightly hot for most occupants (87.5%). The hottest month was August, with 62.5% of occupants considering it very hot, and the coldest month was January, with 87.5% of occupants considering the wind chill to be cold (Figure 25 and Figure 26a).
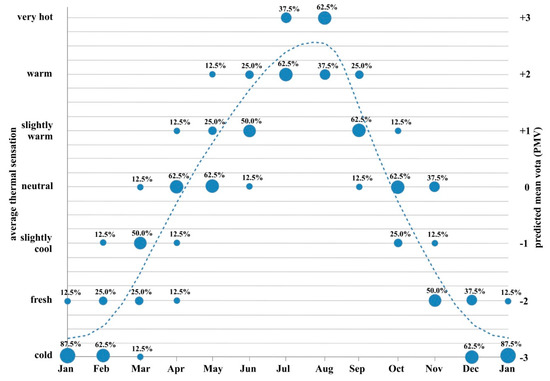
Figure 25.
Results of user surveys on indoor thermal sensation.
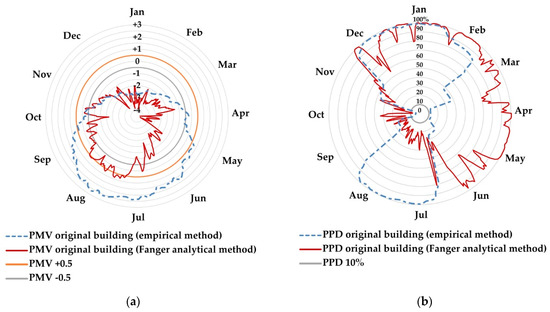
Figure 26.
Empirical method by means of surveys of housing users, calculated analytically for the original building using the parametric Fanger comfort equation for the calculation of the estimated average vote (PMV) and by means of the equation for calculating the percentage of unsatisfied people (PPD): (a) thermal sensation (PMV); (b) percentage of dissatisfied (PPD).
The occupants were dissatisfied with thermal comfort in the winter, specifically December and January (100%). They considered the thermal sensation unpleasant because they felt it was too cold. In February, the percentage dropped to 88%, in November to 50%, in March to 37.5%, and in April to 12.5%. In the summer, all occupants considered the thermal sensation unpleasant because they felt it was too hot in July and August. In June and September, the percentage of dissatisfied people dropped to 25%, and in May, the percentage dropped to 12.5%. In October, the percentage of dissatisfied occupants was 0% (Figure 26b). Analytical calculations of wind chill estimation in the house according to the Fanger method show PMV values below −1 from November to June. However, values below −2 were reached across the board from December to May, and even values of −3 on many days in January and February. During the summer, values above +1 were not reached (Figure 26a). In line with these data, the results of the PPD calculations show values close to 100% from December to May and values close to 10% from July to October. The results show two very different times of the year, with much greater discomfort in the cold months than in the warm months (Figure 26b).
By increasing the insulation of opaque enclosures, the results for estimating the thermal sensation improve in winter but worsen in summer. In winter, the PMV results go from average values below −3 in the original house to average values above −2.5 with the improved insulation. In summer, results go from average values around +0.5 to average values above +1. PPD values improve by 5–10% on average in winter, but worsen in summer by 20% on average, from PPD values below 35% in the original house to values above 55% in the modified house. The remaining construction improvements, applied individually, hardly cause any change in the results of the PMV and PPD calculations according to the Fanger method. However, the final solution with the application of all measures together substantially improves wind chill estimation (PMV) and percentage of dissatisfied (PPD) both in winter and summer. In winter, the PMV results go from average values below −3 in the original house to average values above −1.5 with the final solution and remain between −0.5 and +0.5 from May to November. On the other hand, PPD values improve by 20–50% on average all year round (Figure 27a,b).
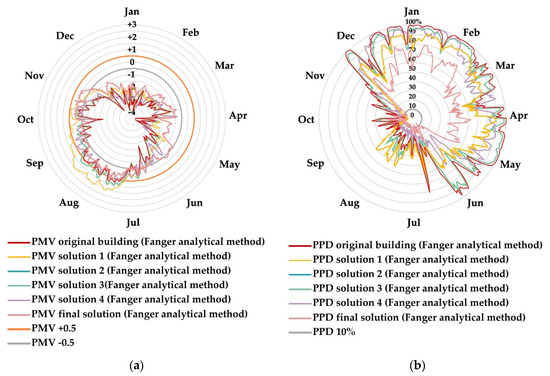
Figure 27.
Fanger method calculated analytically with the proposed energy rehabilitation improvements using the parametric Fanger comfort equation for the calculation of the estimated average vote (PMV) and by means of the equation for calculating the percentage of unsatisfied people (PPD): (a) wind chill estimation (PMV); (b) percentage of dissatisfied (PPD).
4. Discussion
4.1. Energy Efficiency
In relation to improvements in energy efficiency, the analysis of the yielded results shows that the improvement of the thermal insulation of the opaque parts of the building’s enclosures considerably reduces the energy need for heating in winter (−29%) but slightly increases the energy need for cooling in summer (+6%). The reason for this performance can be found in the greenhouse effect inside the house, which also increases (Figure 28). For this reason, in this warm climate with mild winters, over-insulating façades and roofs does not improve the annual energy performance of the house. In the traditional houses of the Spanish Mediterranean, improving the thermal insulation and solar factor of glazing or solar shading has very little influence on the overall energy need (heating and cooling). This is because the size of the windows is very small. Increasing the window–wall ratio (WWR) does have an important influence on the overall energy need because the heat gains from solar radiation are greatly increased. This positively reduces the winter heating needs but progressively increases the cooling needs if the solar protection of the glazing is not improved, because it increases the greenhouse effect in the summer. Therefore, when increasing WWR, increased glass insulation is necessary to reduce heating needs in the winter, but it is also very important to improve the solar shading of windows in the summer. Regarding the increase in natural ventilation in summer, our calculations show that this is a particularly positive measure because it reduces cooling needs in summer but does not increase heating needs in winter. This improvement is most optimal if natural ventilation is used on warm days in spring and autumn. Finally, this research confirms that the best results are obtained by performing a complex multi-factor analysis that allows several parameters to be modified at the same time, reducing the overall annual need (cooling + heating) by up to 87%. The reduction is even greater with the latest regulation on urgent energy saving measures approved by the Spanish government, because it widens the setpoint temperature range [79].
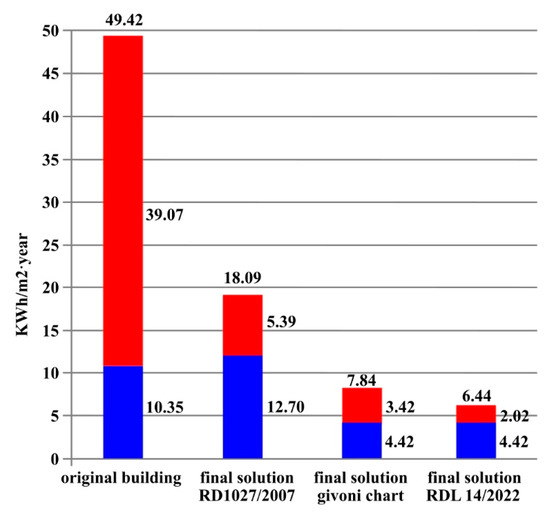
Figure 28.
Simulation results of the calculations of heating and cooling demands using the software “Design Builder”, comparing the results of the original house and the house with the proposed set of improvements simultaneously, in accordance with RD 1027/2007, with Givoni chart and with RDL 14/2022.
Through the obtained savings in energy consumption, it is possible to obtain a recovery period of 16 years that is below the limits defined by European Regulation (EU) 244/2012 [80], which develops Directive 2010/31/EU [81].
For the calculation of the Net Present Value (NPV), the global cost at the financial level was considered with a calculation period of 30 years [82], according to the values indicated in Annex A of the UNE-EN 15,459 [83] standard. In the calculations, a useful life of the windows of 20 years and the insulation of 50 years were also considered (Figure 29). In addition, the recovery of the investment obtained shows that it would not be necessary to introduce additional costs for maintenance.
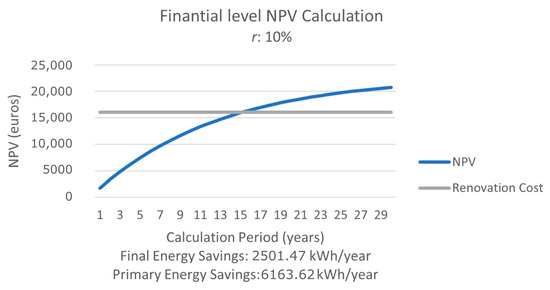
Figure 29.
Financial-level Net Present Value (NPV) calculation.
4.2. Indoor Temperatures
The on-site measurements of the original building show that the indoor temperatures of the house are outside the comfort limits set by the current Spanish standard [36] 59% of hours per year. The comparative analysis of the results obtained with the simulations of the different energy improvement proposals shows that none of them individually managed to sufficiently improve the thermal performance of the house. Improving the thermal insulation of opaque envelopes beneficially increases indoor temperatures in winter, but very detrimentally increases temperatures in summer. This is due to the increased greenhouse effect inside the house during the summer because the increased thermal insulation hinders the thermal dissipation of internal heat gains. The improvement of glazing characteristics has very little influence on indoor temperatures due to the small size of the windows of the original house. However, with the increase in WWR, if glazing insulation and solar protection are not improved, there will be an increase in colder hours in winter and a very significant increase in excessively hot hours in summer. Additionally, the incorporation of only natural ventilation in the original house does not improve indoor temperatures much either because there is little greenhouse effect due to the small size of the windows. The results of the simulations carried out show that only the combined application of all the proposed improvements allows an increase in winter temperatures and a reduction in summer temperatures. This joint measure does have a very beneficial effect on indoor temperatures in the house, reducing the annual hours outside the comfort limits set by current Spanish regulations to 9% (Figure 30).
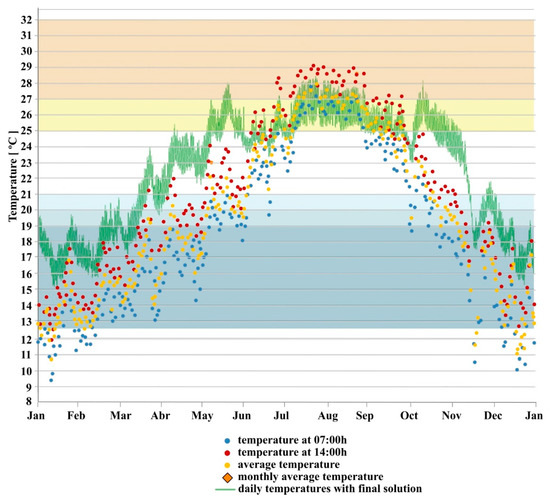
Figure 30.
On-site interior temperature measurements in the original building and interior temperatures simulated considering final solution. 3. Thermal Comfort.
In relation to thermal comfort, the comparative analysis of the results obtained applied to the Givoni bioclimatic graph shows that in summer, the original house only requires natural ventilation to create a comfortable indoor climate. In winter, the original dwelling is far away from the comfort zone and requires the joint improvement of the thermal insulation of the walls and the glazing to achieve an indoor environment that is close to the comfort zone. No single solution achieves comfortable conditions. In spring and autumn, the original house stays within the comfort zone on warm days, but on cold days it does not, and needs improved insulation to maintain comfort (Figure 18, Figure 19, Figure 20, Figure 21, Figure 22 and Figure 23). However, this increase in insulation is clearly detrimental to summer comfort, as it increases the greenhouse effect inside the house. Therefore, only the combined application of all the proposed energy improvements can improve comfort all year round. This is because, in winter, improved insulation helps retain heat inside the house. In addition, the increased size of the glazing helps capture more solar radiation, while in summer, cross ventilation helps dissipate the heat inside the house, and movable sunscreens prevent heat from entering through solar radiation.
The analysis of the results obtained allows us to consider that the current energy saving regulations in Spain do not sufficiently consider the specific characteristics of the BShs climate. The regulations limit the minimum operating temperature in summer and the maximum operating temperature in winter, as well as the range of permissible relative humidity. However, they do not consider it necessary to establish an appropriate relationship between temperature and relative humidity depending on the time of year to ensure adequate comfort. Therefore, it may be considered more appropriate to propose a mixed solution that combines the psychometric diagrams of Givoni with the temperature and relative humidity limits imposed by Spanish regulations, specifically for each season of the year (Figure 31 and Figure 32).

Figure 31.
Proposed diagram in winter.
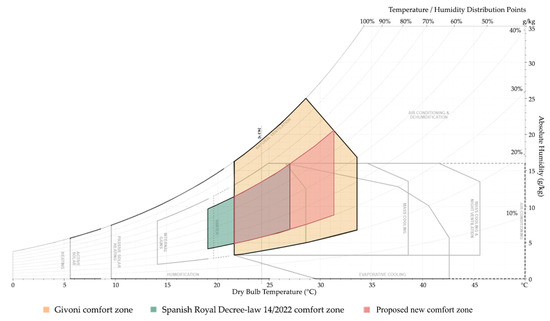
Figure 32.
Proposed diagram in summer.
From the comparative analysis of the results of the application of the Fanger method, the values of the analytical calculations for estimating the wind chill in the original house are much lower than those obtained in the surveys carried out. The PMV values obtained using the parametric Fanger comfort equation are less than −0.5 most of the year, with many days in January and February with cold wind chill (−3), and only exceed +0.5 from late July to early September (Figure 33a). However, our surveys show values below −0.5 from November to March and values above +0.5 from May to September, with the annual number of days with cold or cool and hot or very hot wind chill being balanced. Similarly, PPD values obtained analytically are above 80% from December to the end of June and below 30% from July to November (Figure 33b). However, our surveys show discomfort among users both in the cold months, from December to February, and in the warmer months, July and August. These differences between the results of the analytical calculations and the surveys show that the Fanger method does not sufficiently reflect the discomfort caused by excessive summer heat in the BShs climate. It also does not reflect the smaller temperature oscillation between the annual minimum and maximum temperatures in this climate, which results in mild and increasingly shorter winters. Considering the existing deviation between the results of the analytical calculations and the surveys with respect to the original dwelling, a proportional modification of the results obtained in the calculations of the final solution is proposed (Figure 33a,b).
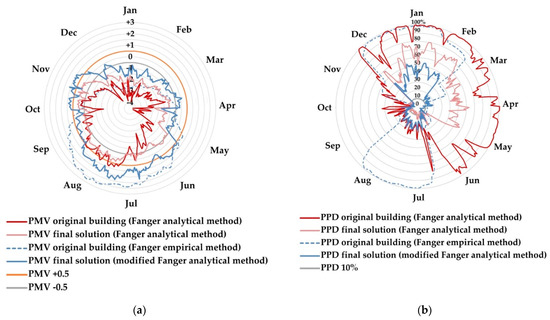
Figure 33.
Proportional modification of the results obtained in the calculations of the final solution using Fanger method calculated for the original building and with the final energy rehabilitation: (a) wind chill estimation (PMV); (b) percentage of dissatisfied (PPD).
5. Conclusions
This research demonstrates the value of using design and energy retrofitting criteria that are adapted to the specific climate of the area rather than following national guidance. The results reinforce the importance of designing for a specific climate and ensuring retrofitting is conducted holistically and simultaneously to suit the local climate. Each intervention was found to influence the thermal behaviour of the building because of its specific climatic context. This implies that retrofitting buildings to improve their energy performance to comply with European and national regulations needs to be questioned. As shown in this paper, there are specific areas of Europe that require a contextualised approach rather than a standardised one.
The best solution, in the case of a dry Mediterranean climate, is to take advantage of passive opportunities to heat the house through solar radiation in winter (“free heat”) and protect the building from solar radiation (“unwanted heat”) in summer.
In a BShs climate, it is necessary to act simultaneously and improve thermal insulation together with increased glazing size, control of solar incidence on windows and the use of natural ventilation with the support of ceiling fans in summer to achieve energy-efficient and comfortable houses without the use of air conditioning. Partial improvements show limited results that are only effective for certain parts of the year.
Energy efficiency regulations in Spain, which are based on European regulations, are wrong to prioritise in a generalised manner improvements in the insulation and airtightness of dwellings. Furthermore, in contrast to other research and current regulations that defend the benefits of natural ventilation only at night, this work shows that in BShs climates it is also advisable to use daytime ventilation supported by ceiling fans.
An excess of insulation on walls and glazing has a detrimental effect by increasing the demand for energy for cooling in summer. This translates into increased cooling costs. Our analysis of the results shows that combined solutions of improving insulation, increasing the WWR with mobile sun protection systems and improving natural ventilation with the support of ceiling fans in the summer season are more optimal.
The use of flexible solutions has been a permanent feature in vernacular architecture and is confirmed in this study. In this way, solar radiation in winter can be adequately used to reduce the demand for heating energy and at the same time reduce the solar incidence in summer when the sun increases the demand for energy for cooling.
Our research shows that this solution allows cooling and heating requirements to be reduced by up to 87%, reducing the operational needs of air conditioning systems and their energy consumption. If air conditioning systems are used, interior temperatures rise by an average of 5 °C in winter and drop by an average of 2 °C in summer, reducing the annual hours outside the comfort limits established by current Spanish regulations from 59% to 9%. This helps the house stay within the comfort zone of the Givoni diagram all year, with a comfortable thermal sensation during 67% of the year according to the Fanger method.
The main limitation associated with this research was the practical challenge of measuring indoor temperatures in an inhabited house with the air conditioning switched off. In this case, it was necessary to adapt the data collection to the needs of the building users, which meant that measurements were taken by a researcher when it was convenient for the occupants, rather than using automatic data collection systems. The air conditioning was not used so as not to artificially influence the thermal behaviour of the building on the days the measurements were taken. There was no control of occupant behaviour on the days the measurements were not taken, and the researchers acknowledge that the temperatures recorded may have been affected a little by the occupants’ behaviour on the “non- measurement” days. Despite this limitation, our data set provides a valuable source to inform the modelling exercises. Another constraint was the geometric and constructive conditions that must be maintained in the traditional house typology studied. These circumstances prevented changes in the size of the windows and the use of overhangs and other solar protection elements due to their aesthetic impact.
This research demonstrates the importance of modifying the comfort criteria of energy regulations to better adapt the design criteria to the particularities of the dry Mediterranean climate. This research offers an alternative solution to the comfort standards of the current Spanish regulations. We consider it appropriate to correlate temperatures and relative humidity based on psychrometric diagrams specifically adapted to the temperature limits established in Spain. Our research also demonstrates the need to adapt Fanger’s analytical method of comfort estimation to the particularities of the dry Mediterranean climate to bring the analytical results closer to the actual statistics of the users. This will require further research.
To conclude, this research demonstrates that buildings are more energy-efficient and comfortable the more they are adapted to their local climate. It proves the maxim that there is no cheaper energy than that which is not needed, helping to reinforce the importance of passive design principles and question the applicability of national codes and guidance.
Author Contributions
Conceptualization, C.P.-C., Á.B.G.-A. and A.L.-P.; methodology, C.P.-C., Á.B.G.-A. and A.L.-P.; software, C.P.-C. and A.L.-P.; validation, C.P.-C., A.G.-G., Á.B.G.-A. and S.E.; formal analysis, A.L.-P.; investigation, C.P.-C., A.L.-P., A.G.-G. and Á.B.G.-A.; resources, A.L.-P.; data curation, C.P.-C. and A.L.-P.; writing—original draft preparation, C.P.-C. and A.L.-P.; writing—review and editing, C.P.-C., A.L.-P., Á.B.G.-A. and S.E.; visualization, C.P.-C. and A.L.-P.; supervision, C.P.-C., A.G.-G., Á.B.G.-A. and S.E.; project administration, C.P.-C.; grant acquisition, Colegio Territorial de Arquitectos de Alicante (CTAA). All authors have read and agreed to the published version of the manuscript.
Funding
This research received an external grant from the Colegio Territorial de Arquitectos de Alicante (CTAA).
Data Availability Statement
The data presented in this study are available on request from the corresponding author.
Conflicts of Interest
The authors declare no conflict of interest.
References
- Di Foggia, G. Energy efficiency measures in buildings for achieving sustainable development goals. Heliyon 2018, 4, e00953. [Google Scholar] [CrossRef]
- Balaras, C.A.; Droutsa, K.; Argiriou, A.A.; Asimakopoulos, D.N. Potential for energy conservation in apartment buildings. Energy Build. 2000, 31, 143–154. [Google Scholar] [CrossRef]
- Tsemekidi Tzeiranaki, S.; Bertoldi, P.; Diluiso, F.; Castellazzi, L.; Economidou, M.; Labanca, N.; Ribeiro Serrenho, T.; Zangheri, P. Analysis of the EU Residential Energy Consumption: Trends and Determinants. Energies 2019, 12, 1065. [Google Scholar] [CrossRef]
- Zakari, A.; Khan, I.; Tan, D.; Alvarado, R.; Dagar, V. Energy efficiency and sustainable development goals (SDGs). Energy 2022, 239, 122365. [Google Scholar] [CrossRef]
- Scrucca, F.; Ingrao, C.; Barberio, G.; Matarazzo, A.; Lagioia, G. On the role of sustainable buildings in achieving the 2030 UN sustainable development goals. Environ. Impact Assess. Rev. 2023, 100, 107069. [Google Scholar] [CrossRef]
- Hafez, F.S.; Sa’di, B.; Safa-Gamal, M.; Taufiq-Yap, Y.H.; Alrifaey, M.; Seyedmahmoudian, M.; Stojcevski, A.; Horan, B.; Mekhilef, S. Energy Efficiency in Sustainable Buildings: A Systematic Review with Taxonomy, Challenges, Motivations, Methodological Aspects, Recommendations, and Pathways for Future Research. Energy Strategy Rev. 2023, 45, 101013. [Google Scholar] [CrossRef]
- European Union. Directiva 2010/31/UE del Parlamento Europeo y del Consejo de 19 de mayo de 2010 Relativa a la Eficiencia Energética de los Edificios (Refundición); European Union: Maastricht, The Netherlands, 2010. [Google Scholar]
- European Union. Directiva (UE) 2018/844 del Parlamento Europeo y del Consejo, de 30 de mayo de 2018, por la que se Modifica la Directiva 2010/31/UE Relativa a la Eficiencia Energética de los Edificios y la Directiva 2012/27/UE Relativa a la Eficiencia Energética; European Union: Maastricht, The Netherlands, 2018. [Google Scholar]
- Agencia Estatal Boletín Oficial del Estado. Real Decreto 732/2019, de 20 de diciembre, por el Que se Modifica el Código Técnico de la Edificación, Aprobado por el Real Decreto 314/2006, de 17 de marzo; Agencia Estatal Boletín Oficial del Estado: Madrid, Spain, 2019. [Google Scholar]
- Agencia Estatal Boletín Oficial del Estado. Real Decreto 390/2021, de 1 de junio, por el que se Aprueba el Procedimiento Básico para la Certificación de la Eficiencia Energética de los Edificios; Agencia Estatal Boletín Oficial del Estado: Madrid, Spain, 2021. [Google Scholar]
- López-Ochoa, L.M.; Las-Heras-Casas, J.; Olasolo-Alonso, P.; López-González, L.M. Towards nearly zero-energy buildings in Mediterranean countries: Fifteen years of implementing the Energy Performance of Buildings Directive in Spain (2006–2020). J. Build. Eng. 2021, 44, 102962. [Google Scholar] [CrossRef]
- López-Ochoa, L.M.; Las-Heras-Casas, J.; Olasolo-Alonso, P.; López-González, L.M. Environmental and energy impact of the EPBD in residential buildings in hot and temperate Mediterranean zones: The case of Spain. Energy 2018, 161, 618–634. [Google Scholar] [CrossRef]
- Olcina, J.; Serrano-Notivolit, R.; Miró, J.; Meseguer-Ruiz, O. Tropical nights in the Spanish Mediterranean coast: Recent evolution (1950–2014). Clim. Res. 2019, 78, 225–236. [Google Scholar] [CrossRef]
- Miró, J.; Olcina, J. Cambio climático y confort térmico. Efectos en el turismo de la Comunidad Valenciana. Rev. Investig. Turísticas 2020, 20, 1–30. [Google Scholar]
- Kottek, M.; Grieser, J.; Beck, C.; Rudolfm, B.; Rubel, F. World Map of the Köppen-Geiger climate classification updated. Meteorol. Z. 2006, 15, 259–263. [Google Scholar] [CrossRef]
- Agencia Estatal Boletín Oficial del Estado. Orden FOM/588/2017, de 15 de Junio, por la que se Modifican el Documento Básico DB-HE “Ahorro de Energía” y el Documento Básico DB-HS “Salubridad”, del Código Técnico de la Edificación, Aprobado por Real Decreto 314/2006, de 17 de Marzo; Agencia Estatal Boletín Oficial del Estado: Madrid, Spain, 2017. [Google Scholar]
- Lucon, O.; Ürge-Vorsatz, D.; Ahmed, A.Z.; Akbari, H.; Bertoldi, P.; Cabeza, L.F.; Eyre, N.; Gadgil, A.; Harvey, L.D.; Jiang, Y.; et al. Climate Change 2014: Mitigation of Climate Change. In IPCC Working Group III Contribution to AR5: Chapter 9—Buildings; Cambridge University Press: Cambridge, UK, 2015. [Google Scholar]
- Georgiou, G.; Eftekhari, M.; Lupton, T. Investigating the effect of tightening residential envelopes in the Mediterranean region. In Proceedings of the 14th International Conference on Sustainable Energy Technologies, Nottingham, UK, 25–27 August 2015. [Google Scholar]
- Asdrubali, F.; Baldinelli, G.; Bianchi, F. A quantitative methodology to evaluate thermal bridges in Buildings. Appl. Energy 2012, 97, 365–373. [Google Scholar] [CrossRef]
- Evola, G.; Margani, G.; Marletta, G. Energy and cost evaluation of thermal bridge correction in Mediterranean climate. Energy Build. 2011, 43, 2385–2393. [Google Scholar] [CrossRef]
- Arias, N.; Bobadilla, A. Evaluación experimental y análisis de la mejora con aislamiento para el caso del puente térmico en el frente de forjado. Inf. Constr. 2017, 69, e188. [Google Scholar] [CrossRef]
- Pérez-Carramiñana, C.; González-Avilés, Á.B.; Galiano-Garrigós, A.; Lozoya-Peral, A. Optimization of Architectural Thermal Envelope Parameters in Modern Single-Family House Typologies in Southeastern Spain to Improve Energy Efficiency in a Dry Mediterranean Climate. Sustainability 2022, 14, 3910. [Google Scholar] [CrossRef]
- Figueiredo, A.; Kämpfb, J.; Vicente, R. Passive house optimization for Portugal: Overheating evaluation and energy performance. Energy Build. 2016, 118, 181–196. [Google Scholar] [CrossRef]
- Pastor, R. Un edificio patrimonial de la huerta valenciana, la barraca, Construcción con Tierra, Investigación y Documentación. In Proceedings of the XI CIATTI 2014 Congresos de Arquitectura de Tierra en Cuenca de Campos, Valladolid, Spain, 26–28 September 2014. [Google Scholar]
- Givoni, B. Comfort, climate analysis and building design guidelines. Energy Build. 1992, 18, 11–23. [Google Scholar] [CrossRef]
- Givoni, B. Man, Climate, and Architecture; Elsevier: Amsterdam, The Netherlands, 1969. [Google Scholar]
- Olgyay, V.; Olgyay, A.; Lyndon, D.; Olgyay, V.W.; Reynolds, J.; Yeang, K. Design with Climate, Design with Climate; Princeton University Press: Princeton, NJ, USA, 1963. [Google Scholar]
- Bluyssen, P.M. Towards new methods and ways to create healthy and comfortable buildings. Build. Environ. 2010, 45, 808–818. [Google Scholar] [CrossRef]
- Brager, G.S.; De Dear, R.J. Thermal adaptation in the built environment: A literature review. Energy Build. 1998, 27, 83–96. [Google Scholar] [CrossRef]
- Cuce, E.; Sher, F.; Sadiq, H.; Cuce, P.M.; Guclu, T.; Besir, A.B. Sustainable ventilation strategies in buildings: CFD research. Sustain. Energy Technol. Assess. 2019, 36, 100540. [Google Scholar] [CrossRef]
- Fabbri, K. Indoor thermal comfort perception: A questionnaire approach focusing on children. In Indoor Thermal Comfort Perception: A Questionnaire Approach Focusing on Children; Springer: Berlin/Heidelberg, Germany, 2015; pp. 1–302. [Google Scholar]
- Galiano-Garrigós, A.; Marcos, C.L.; Kouider, T.; Gutiérrez, P.J.J. Juan Gutiérrez. Reassessing thermal comfort in modern architecture: E.1027 as a case study. Build. Res. Inf. 2022, 50, 230–254. [Google Scholar] [CrossRef]
- Meir, I.A.; Roaf, S.C. The future of the vernacular towards new methodologies. In Vernacular Architecture in the Twenty-First Century: Theory, Education and Practice; Taylor & Francis: Abingdon, UK, 2014; pp. 215–230. [Google Scholar]
- Nicol, F.; Roaf, S. Post-occupancy evaluation and field studies of thermal comfort. Build. Res. Inf. 2005, 33, 338–346. [Google Scholar] [CrossRef]
- Nicol, J.F.; Humphreys, M.A. Adaptive thermal comfort and sustainable thermal standards for buildings. Energy Build. 2002, 34, 563–572. [Google Scholar] [CrossRef]
- Tzempelikos, A.; Athienitis, A.K. The impact of shading design and control on building cooling and lighting demand. Sol. Energy 2007, 81, 369–382. [Google Scholar] [CrossRef]
- Santamouris, M.; Sfakianaki, A.; Pavlou, K. On the efficiency of night ventilation techniques applied to residential buildings. Energy Build. 2010, 42, 1309–1313. [Google Scholar] [CrossRef]
- Michael, A.; Demosthenous, D.; Philokyprou, M. Natural ventilation for cooling in mediterranean climate: A case study in vernacular architecture of Cyprus. Energy Build. 2017, 144, 333–345. [Google Scholar] [CrossRef]
- Jalaei, F.; Jrade, A. Integrating Building Information Modeling (BIM) and energy analysis tools with green building certification system to conceptually design sustainable buildings. J. Inf. Technol. Constr. 2014, 19, 494–519. [Google Scholar]
- Golneshan, A.A.; Yaghoubi, M.A. Simulation of ventilation strategies of a residential building in hot arid regions of Iran. Energy Build. 1990, 14, 201–205. [Google Scholar] [CrossRef]
- Agencia Estatal Boletín Oficial del Estado. Real Decreto 178/2021, de 23 de Marzo, por el que se Modifica el Real Decreto 1027/2007, de 20 de Julio, por el que se Aprueba el Reglamento de Instalaciones Térmicas en los Edificios; Agencia Estatal Boletín Oficial del Estado: Madrid, Spain, 2021. [Google Scholar]
- Líder-Calener Unified Tool Software; v2.0.2253.1167; Dirección General de Arquitectura, Vivienda y Suelo del Ministerio de Transportes, Movilidad y Agenda Urbana y por el Instituto para la Diversificación y Ahorro de la Energía (IDEA): Madrid, Spain, 2021.
- Grupo de Termotecnia de la Asociación de Investigación y Cooperación Industrial de Andalucía (AICIA) en la Escuela Técnica Superior de Ingenieros de la Universidad de Sevilla. HU CTE-HE 2019 y CEE (Version 2.0.2203.1160 de 26 de Abril de 2021) [Computer software]; Dirección General de Arquitectura, Vivienda y Suelo del Ministerio de Transportes, Movilidad y Agenda Urbana e Instituto para la Diversificación y Ahorro de la Energía (IDEA): Madrid, Spain, 2020. [Google Scholar]
- Aldersoni, A.A.; Chow, D.H.C. Adapting Traditional Passive Strategies within Contemporary House to Decrease High energy consumption Impact in Nejd Region, Saudi Arabia. Earth Environ. Sci. 2019, 329, 12007–12015. [Google Scholar]
- Schulze, T.; Eicker, U. Controlled natural ventilation for energy efficient buildings. Energy Build. 2013, 56, 221–232. [Google Scholar] [CrossRef]
- Alhamad, I.M.; AlSaleem, M.; Taleb, H. Passive heating and cooling potential strategies: A comparison between moderate summers and warm winters climate zones. J. Phys. Conf. Ser. 2019, 1276, 12059–12067. [Google Scholar] [CrossRef]
- Pérez-Carramiñana, C.; Maciá-Mateu, A.; Sirvent-García, G.; Lledó-Llorca, I. Study of Natural Ventilation and Solar Control Strategies to Improve Energy Efficiency and Environmental Quality in Glazed Heated Swimming Pools in a Dry Mediterranean Climate. Sustainability 2022, 14, 8243. [Google Scholar] [CrossRef]
- Albatayneh, A. Optimisation of building envelope parameters in a semi-arid and warm Mediterranean climate zone. Energy Rep. 2021, 7, 2081–2093. [Google Scholar] [CrossRef]
- Albatayneh, A.; Alterman, D.; Page, A.; Moghtaderi, B. The significance of building design for the climate. Environ. Clim. Technol. 2018, 22, 165–178. [Google Scholar] [CrossRef]
- Prieto, A.; Knaack, U.; Auer, T.; Klein, T. Passive cooling & climate responsive facade design exploring the limits of passive cooling strategies to improve the performance of commercial buildings in warm climates. Energy Build. 2018, 175, 30–47. [Google Scholar]
- Ferrara, M.; Virgone, J.; Fabrizio, E.; Kuznik, F.; Filippi, M. Modelling Zero Energy Buildings: Parametric study for the technical optimization. Energy Procedia. 2014, 62, 200–209. [Google Scholar] [CrossRef]
- Simon, F.; Ordoñez, J.; Girard, A.; Parrado, C. Modelling energy use in residential buildings: How design decisions influence final energy performance in various Chilean climates. Indoor Built Environ. 2019, 28, 533–551. [Google Scholar] [CrossRef]
- Harkouss, F.; Fardoun, F.; Biwole, P.H. Passive design optimization of low energy buildings in different climates. Energy 2018, 165, 591–613. [Google Scholar] [CrossRef]
- Causone, F.; Pietrobon, M.; Pagliano, L.; Erba, S. A high performance home in the Mediterranean climate: From the design principle to actual measurements. Energy Procedia. 2017, 140, 67–79. [Google Scholar] [CrossRef]
- Ozarisoy, B.; Altan, H. Systematic literature review of bioclimatic design elements: Theories, methodologies and cases in the South-eastern Mediterranean climate. Energy Build. 2021, 250, 111281. [Google Scholar] [CrossRef]
- Pesic, N.; Roset, J.; Muros, A. Natural ventilation potential of the Mediterranean coastal region of Catalonia. Energy Build. 2018, 169, 236–244. [Google Scholar] [CrossRef]
- Ozarisoy, B.; Altan, H. A novel methodological framework for the optimisation of post-war social housing developments in the South-eastern Mediterranean climate: Policy design and lifecycle cost impact analysis of retrofitting strategies. Sol. Energy. 2021, 225, 517–560. [Google Scholar] [CrossRef]
- O’Donovan, A.; O’Sullivan, P.D.; Murphy, M.D. Predicting air temperatures in a naturally ventilated nearly zero energy building: Calibration, validation, analysis and approaches. Appl. Energy. 2019, 250, 991–1010. [Google Scholar] [CrossRef]
- Dervishi, S.; Pashako, F.; Dushaj, X.; Dervishi, I.O. Energy performance optimization of traditional housing in Mediterranean climate. J. Build. Eng. 2022, 45, 103423. [Google Scholar] [CrossRef]
- Stazi, F.; Bonfigli, C.; Tomassoni, E.; Di Perna, C.; Munafò, P. The effect of high thermal insulation on high thermal mass:Is the dynamic behaviour of traditional envelopes inMediterranean climates still possible? Energy Build. 2015, 88, 367–383. [Google Scholar] [CrossRef]
- Panchenko, V.A. Solar Roof Panels for Electric and Thermal Generation. Appl. Sol. Energy 2018, 54, 350–353. [Google Scholar] [CrossRef]
- Heiselberg, P.K.; O’Donnavan, A.; Belleri, A.; Flourentzou, F.; Zhang, G.Q.; da Graca, G.C.; Breesch, H.; Justo-Alonso, M.; Kolokotroni, M.; Pomianowski, M.Z.; et al. Ventilative Cooling Design Guide: Energy in Buildings and Communities Programme; Department of Civil Engineering, Aalborg University: Aalborg, Denmark, 2018; p. 122. [Google Scholar]
- Diakaki, C.; Grigoroudis, E.; Kolokotsa, D. Towards a multi-objective optimization approach for improving energy efficiency in buildings. Energy Build. 2008, 40, 1747–1754. [Google Scholar] [CrossRef]
- Alahmer, A.; Mayyas, A.; Mayyas, A.A.; Omar, M.A.; Shan, D. Vehicular thermal comfort models; a comprehensive review. Appl. Therm. Eng. 2011, 31, 995–1002. [Google Scholar] [CrossRef]
- Alahmer, A.; Abdelhamid, M.; Omar, M. Design for thermal sensation and comfort states in vehicles cabins. Appl. Therm. Eng. 2012, 36, 126–140. [Google Scholar] [CrossRef]
- Pfafferott, J.; Herkel, S.; Jäschke, M. Design of passive cooling by night ventilation: Evaluation of a parametric model and building simulation with measurements. Energy Build. 2003, 35, 1129–1143. [Google Scholar] [CrossRef]
- Rosaleny, M. La barraca valenciana. Història i recuperació d’una arquitectura resilient Anu. D’arquitectura I Soc. 2021, 1, 124–144. [Google Scholar]
- Design Builder; v.7.0.1.006; DesignBuilder Software Ltd.: Stroud, Reino Unido, 2021.
- Hajdukiewicz, M.; Geron, M.; Keane, M.M. Formal calibration methodology for CFD models of naturally ventilated indoor environments. Build. Environ. 2013, 59, 290–302. [Google Scholar] [CrossRef]
- Zhai, Z. Application of Computational Fluid Dynamics in Building Design: Aspects and Trends. Indoor Built Environ. 2006, 15, 305–313. [Google Scholar] [CrossRef]
- Ayad, S.S. Computational study of natural ventilation. J. Wind. Eng. Ind. Aerodyn. 1999, 82, 49–68. [Google Scholar] [CrossRef]
- Ministerio de Fomento. Documento Descriptivo Climas de Referencia; Ministerio de Fomento: Madrid, Spain, 2017. [Google Scholar]
- Chazarra, A.; Flórez, E.; Peraza, B.; Tohá, T.; Lorenzo, B.; Criado, E.; Moreno, J.V.; Romero, R.; Botey, R. Mapas Climáticos de España (1981–2010) y ETo (1996–2016); Ministerio para la Transición Ecológica, Agencia Estatal de Meteorología: Madrid, Spain, 2018. [Google Scholar]
- Melikov, A.K.; Kaczmarczyk, J. Air movement and perceived air quality. Build Environ. 2012, 47, 400–409. [Google Scholar] [CrossRef]
- Birru, D.; Wen, Y.-J.; Rubinstein, F.M.; Clear, R.D. Ceiling fans as extenders of the summer comfort envelope. ASHRAE Trans United States 1983, 89. Available online: https://www.osti.gov/biblio/5241401 (accessed on 1 March 2023).
- Zhai, Y.; Zhang, Y.; Zhang, H.; Pasut, W.; Arens, E.; Meng, Q. Human comfort and perceived air quality in warm and humid environments with ceiling fans. Build Environ. 2015, 90, 178–185. [Google Scholar] [CrossRef]
- Arens, E.; Xu, T.; Miura, K.; Hui, Z.; Fountain, M.; Bauman, F. A study of occupant cooling by personally controlled air movement. Energy Build. 1998, 27, 45–59. [Google Scholar] [CrossRef]
- Rohles, F.H.; Konz, S.A.; Jones, B.W. Enhancing Thermal Comfort with Ceiling Fans. In Proceedings of the Human Factors Society Annual Meeting; SAGE Publications: Los Angeles, CA, USA, 1982; pp. 118–122. [Google Scholar] [CrossRef]
- Agencia Estatal Boletín Oficial del Estado. Real Decreto Ley 14/2022, de 1 de Agosto, de medidas de sostenibilidad económica en el ámbito del transporte, en materia de becas y ayudas al estudio, así como de medidas de ahorro, eficiencia energética y reducción de la dependencia energética del gas natural; Agencia Estatal Boletín Oficial del Estado: Madrid, Spain, 2022. [Google Scholar]
- European Parlament and Council of the European Comunity. Directive 2010/31/EU of the European Parliament and of the Council of 19 May 2010 on the Energy Performance of Buildings; European Parlament and Council of the European Comunity: Brussels, Belgium, 2010. [Google Scholar]
- EU Commission. Commission Delegated Regulation (EU) No 244/2012 of 16 January 2012 Supplementing Directive 2010/31/EU of the European Parliament and of the Council on the Energy Performance of Buildings by Establishing a Comparative Methodology Framework for Calculating; EU Commission: Brussels, Belgium, 2012. [Google Scholar]
- Galiano-Garrigós, A.; González-Avilés, Á.; Rizo-Maestre, C.; Andújar-Montoya, M. Energy Efficiency and Economic Viability as Decision Factors in the Rehabilitation of Historic Buildings. Sustainability 2019, 11, 4946. [Google Scholar] [CrossRef]
- CEN. European Committee for Standardization—UNE EN 15459-1:2018 Energy Performance of Buildings—Economic Evaluation Procedure for Energy Systems in Buildings—Part 1: Calculation Procedures, Module M1-14; European Committee for Standardization: Brussels, Belgium, 2018. [Google Scholar]
Disclaimer/Publisher’s Note: The statements, opinions and data contained in all publications are solely those of the individual author(s) and contributor(s) and not of MDPI and/or the editor(s). MDPI and/or the editor(s) disclaim responsibility for any injury to people or property resulting from any ideas, methods, instructions or products referred to in the content. |
© 2023 by the authors. Licensee MDPI, Basel, Switzerland. This article is an open access article distributed under the terms and conditions of the Creative Commons Attribution (CC BY) license (https://creativecommons.org/licenses/by/4.0/).