1. Introduction
Historic and cultural districts are defined as areas with a high concentration of historical buildings and abundant cultural relics that can reflect traditional patterns and historical styles in a relatively integrated and authentic manner. Therefore, they are usually important areas that carry out functions related to residency, the economy, and culture. In the space where tradition and modernity coexist, old and new buildings are interwoven. At the same time, they also face the contradiction between preservation and development. Historical and cultural districts need to explore a balance between the spatial changes caused by economic development and the protection needs that limit the material environment [
1].
As an important region where an urban sense of place and identity is concentrated, historic and cultural districts are typically located in the city center. Thus, their revitalization is closely related to urban revitalization [
1]. The basic elements of historical and cultural districts are cultural lineage and morphology, including spatial contours, urban texture, street patterns, overall cityscape features, buildings, and structures [
2]. Since the 1990s, China has entered a period of rapid modernization, urbanization, and globalization, as well as a special period when social and economic transitions overlap. With rapid changes in the internal structure and expansion of external contours, historic districts in cities face the predicament of preservation and development, which involves the gradual disappearance of historical heritage and the continuous deterioration of the living environment.
The Charter for the Conservation of Historic Towns and Urban Areas established in 1987 protects the street patterns and spatial forms and formal appearance (scale, size, style, construction, materials, colors, and decoration) in historic towns and historic urban areas. To achieve the effective protection and sustainable development of historical and cultural districts, researchers focus on the spatial form, street density, street continuity, height–width ratio [
3,
4,
5,
6], skyline [
7,
8,
9], and store density [
10]. Architectural features focus on architectural style, material, roof form, roof material, gable form [
11,
12,
13], height, and width [
14,
15]. The architectural details focus on traditional façade elements, window and door ratios, and facade opening degrees [
10,
16,
17]. Steven Tiesdell emphasizes that new buildings should respect not only the spatial form of historical districts, including the scale and size of buildings, but also the architectural features, including vertical and horizontal rhythms, facade emptiness and fullness, and recognizable materials and practices [
1].
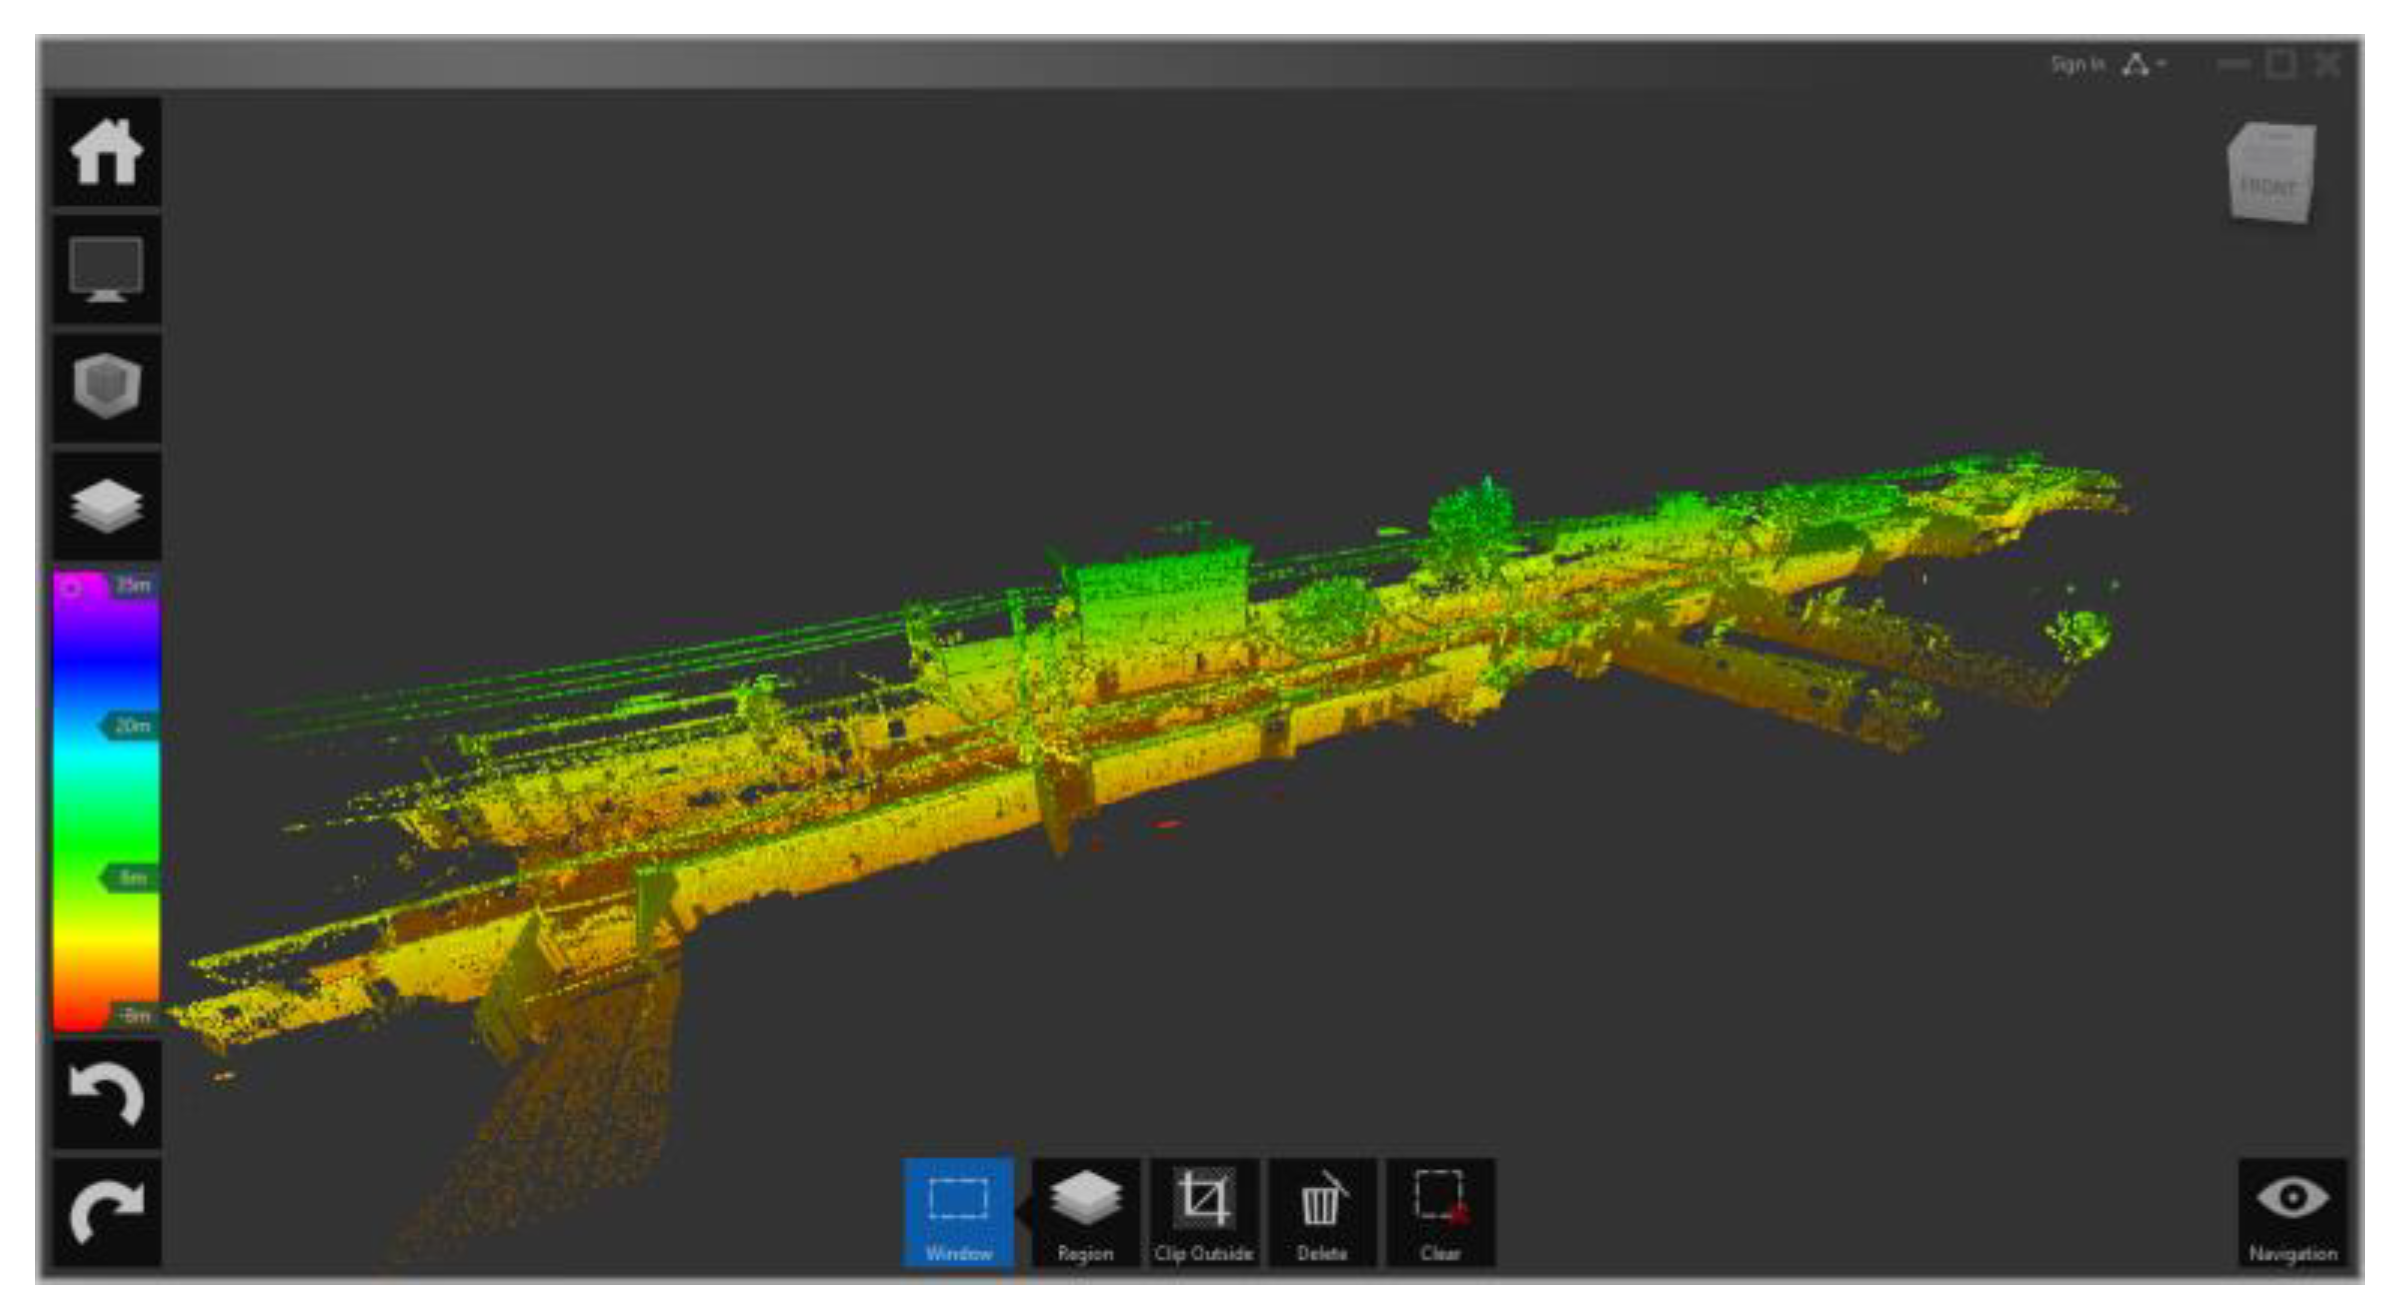
In addition, with the development of technology, 3D scanning technology is an important technical means of heritage preservation. Three-dimensional laser scanning technology has several advantages, including non-contact data acquisition, a high data sampling rate, high resolution, high precision, and multi-directional data acquisition. These capabilities enable the technology to efficiently capture 3D information about the structure, details, and materials of a given object or site. However, it is important to note that while 3D laser scanning can quickly obtain accurate and detailed data, the process of creating 3D models from these data can still be time-consuming, and additional post-processing may be required. It has been widely used in data collection, archiving, data analysis, status investigation and monitoring, and digital display [
18,
19,
20]. The study not only involves cultural heritage, such as ancient sites [
21], ancient buildings [
22], and cave temples [
23], but also includes larger-scale historical and cultural cities [
24] and historical and cultural districts [
25]. In addition, with the development of computer technology, 3D scanning technology can be combined with GIS (Geographic Information System) and BIM (Building Information Modeling). Murphy Maurice proposed a new concept of HBIM (Heritage Building Information Modelling), which includes 3D laser scanning, point cloud data processing, parametric logic design, parametric modeling, and HBIM model value assessment [
26]. The combination of HBIM and GIS can extend the research scope from the building scale to the city scale [
27]. BIM and HBIM can provide parametric modeling for buildings, automatic score and 3D point cloud semantics, and spatial analysis in combination with GIS thematic mapping, which ensures sustainable preservation and management of each life cycle [
28,
29].
Traditional manual surveying has limitations in efficiency and accuracy because historic and cultural districts have overlapped elements from different historical periods, with a large number of buildings on both sides that are diverse in style and structure. Additionally, with a mixed pattern of commercial and residential, the store signs conceal a large amount of building information. The intervention of digital preservation provides important technical support for the protection of historical districts. The 3D model of a historic district constructed by UAV (unmanned aerial vehicle) tilt photogrammetry technology can be used to analyze the posting rate, spatial enclosure, and visibility of the current street space and make suggestions for the design of public space renewal in the historic district [
30]. The combination of 3D laser scanning and photogrammetry techniques can create high-precision 3D models [
31]. Traditional manual surveying can be time-consuming and labor-intensive compared to 3D laser scanning, even though scanning large scales can also be time-consuming; however, manual surveying is prone to omissions and errors, which can be avoided with scanning technology. Through 3D laser scanning, it is possible to quickly obtain information about various features, including facades, second contours, commercial spaces, open space structures within the hidden fabric, skyline perception, and the evolution of old street skyline profiles. Furthermore, point cloud datasets obtained through 3D laser scanning can be used to perform spatial analysis, providing a more substantiated understanding of the site [
32].
To sum up, the research on the preservation of the space form of historic and cultural districts is mainly based on the qualitative and quantitative analysis of the street space features or architectural form features [
33,
34,
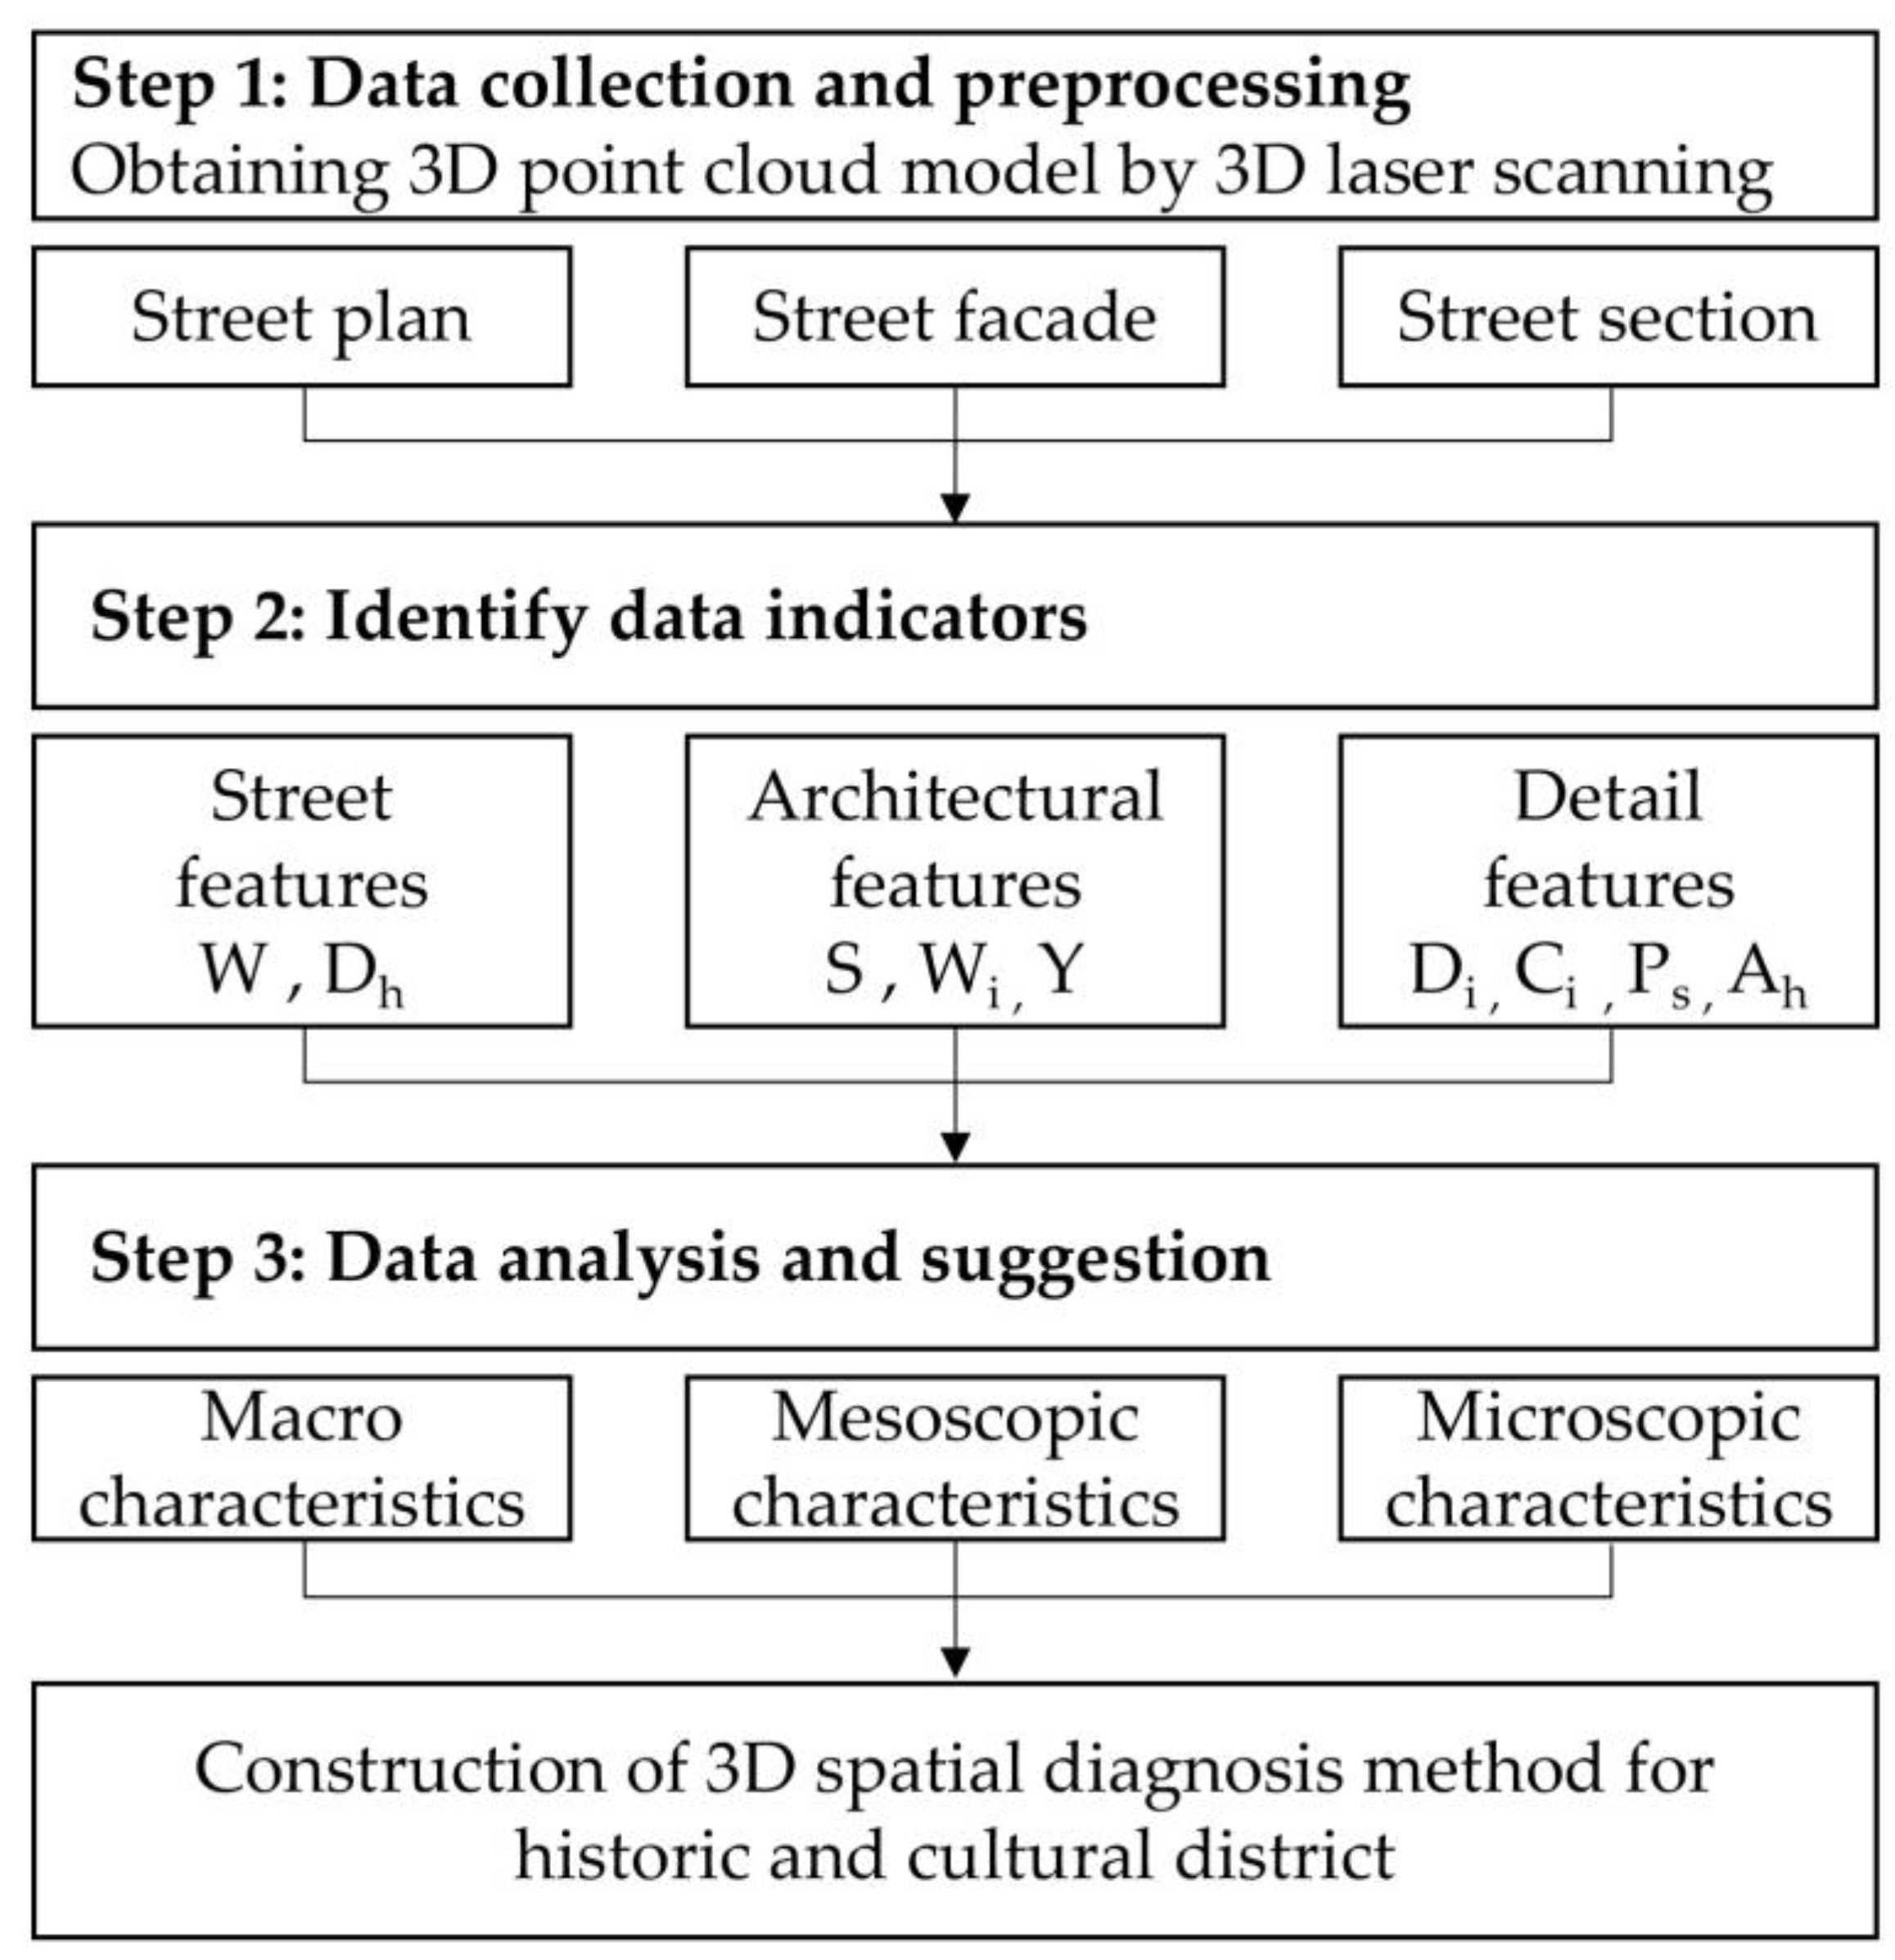
35]. Due to the lack of systematic research, it is difficult to form a macro-to-micro understanding of historic and cultural districts. At the same time, in recent years, there has been a trend to use digital technology to analyze spatial characteristics but relatively few studies have combined it with the spatial form of the historic and cultural district, which needs to be strengthened. Therefore, this study aims to create a complete set of analysis methods for the 3D characteristics of the historic and cultural district. We hope to provide some quantitative indexes for the extraction, protection and renewal of street culture features. The 3D diagnostic framework enables efficient and accurate data collection of historical and cultural districts. It outperforms traditional manual methods by reducing labor consumption and enhancing accuracy. The indicator establishment stage involved a literature review to find commonly used quantitative indicators of spatial characteristics. During the analysis stage, quantitative data analysis with SPSS can provide an effective description of street characteristics and control building data for updated designs. The framework has broad application prospects. It can be used to compare pre- and post-design outcomes, guide and evaluate designs, and provide technical support for sustainable preservation. By combining with new technology such as HBIM and GIS, the framework can achieve full life cycle management and protection in the future.
4. Conclusions
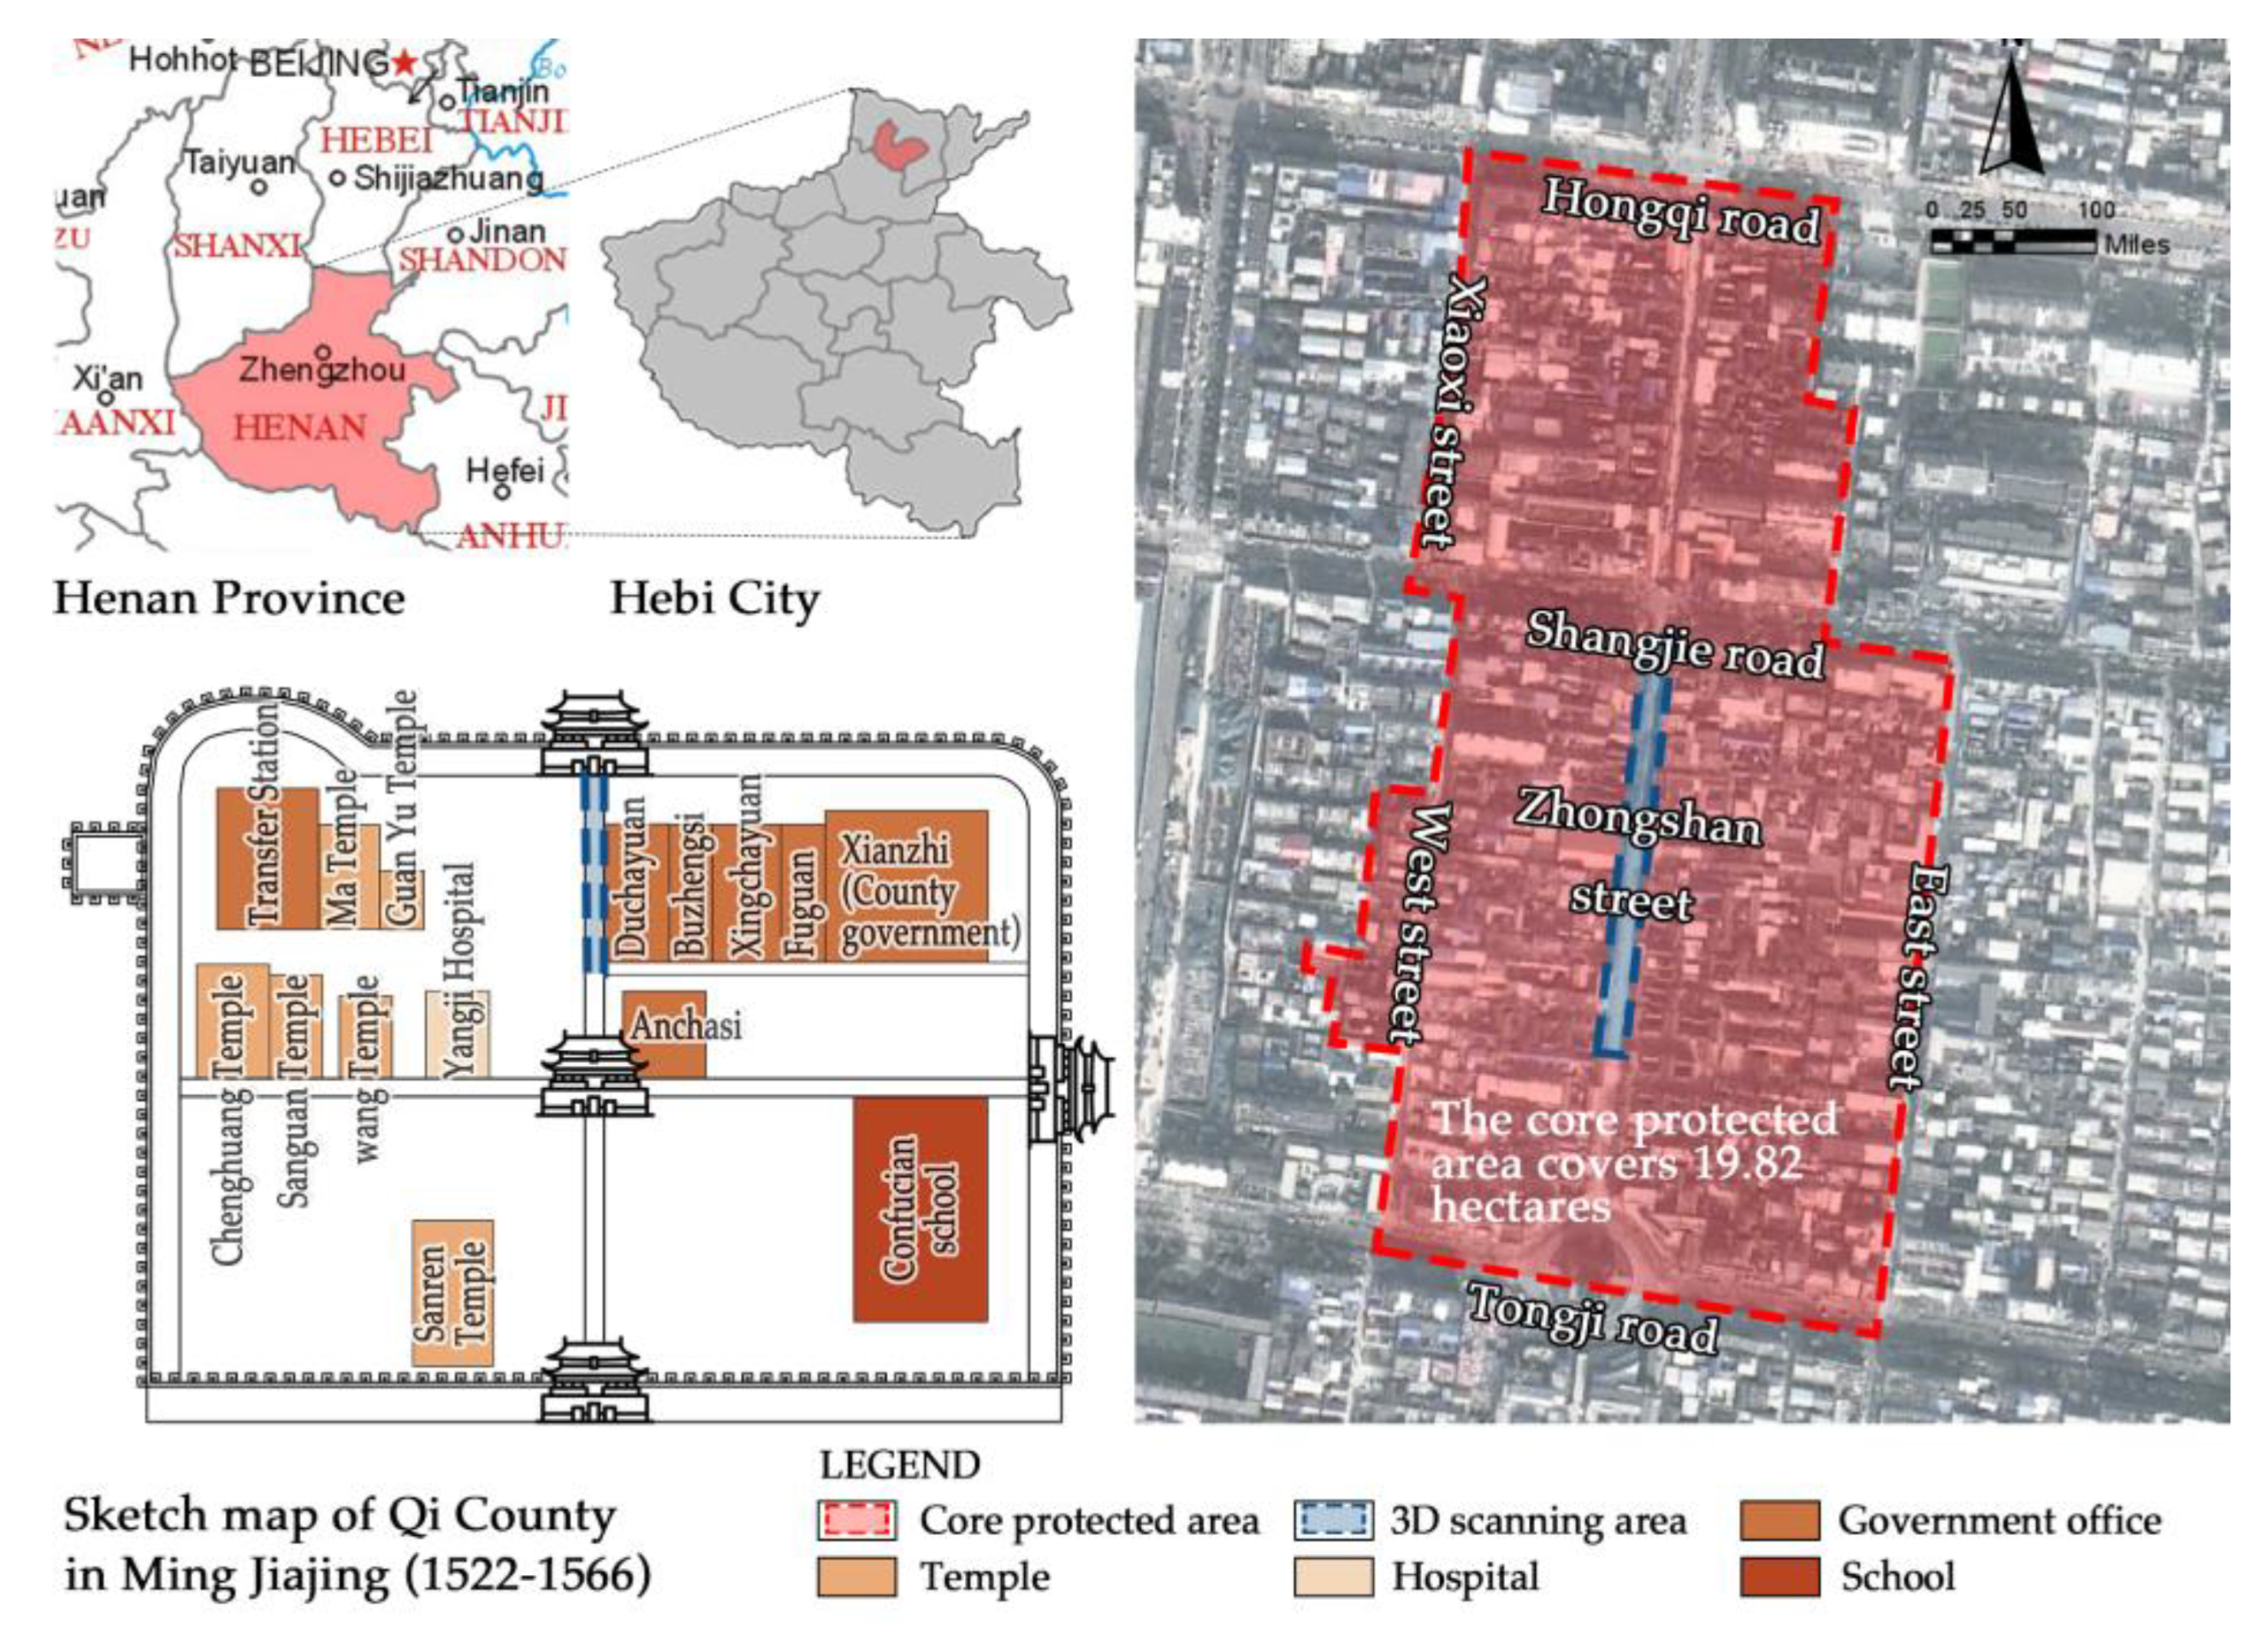
This study constructs a systematic 3D spatial quantitative diagnosis method, covering the whole process, from 3D data acquisition to index establishment, and then to data analysis and suggestions. The method is applied to the historical and cultural district of Zhongshan Street in Qi County. The main conclusions are as follows:
This study involved three stages of analysis. The first stage focused on efficient and accurate data collection and processing of historical blocks using 3D laser scanning equipment. The resulting point cloud model could be quickly viewed through AutoCAD for arbitrary data acquisition and output. The point-cloud-based data management system ensured the permanent preservation of information data and facilitated future visual management of the historical and cultural blocks in the study area. This system also aided in the dynamic monitoring of changes in historical and cultural blocks over different periods.
In the second stage, we reviewed the literature on street, building, and detailing features and extracted nine commonly used indicators. With these indicators, we constructed a system of diagnostic framework from the macro to micro level. This system allowed us to quickly obtain spatial characteristics.
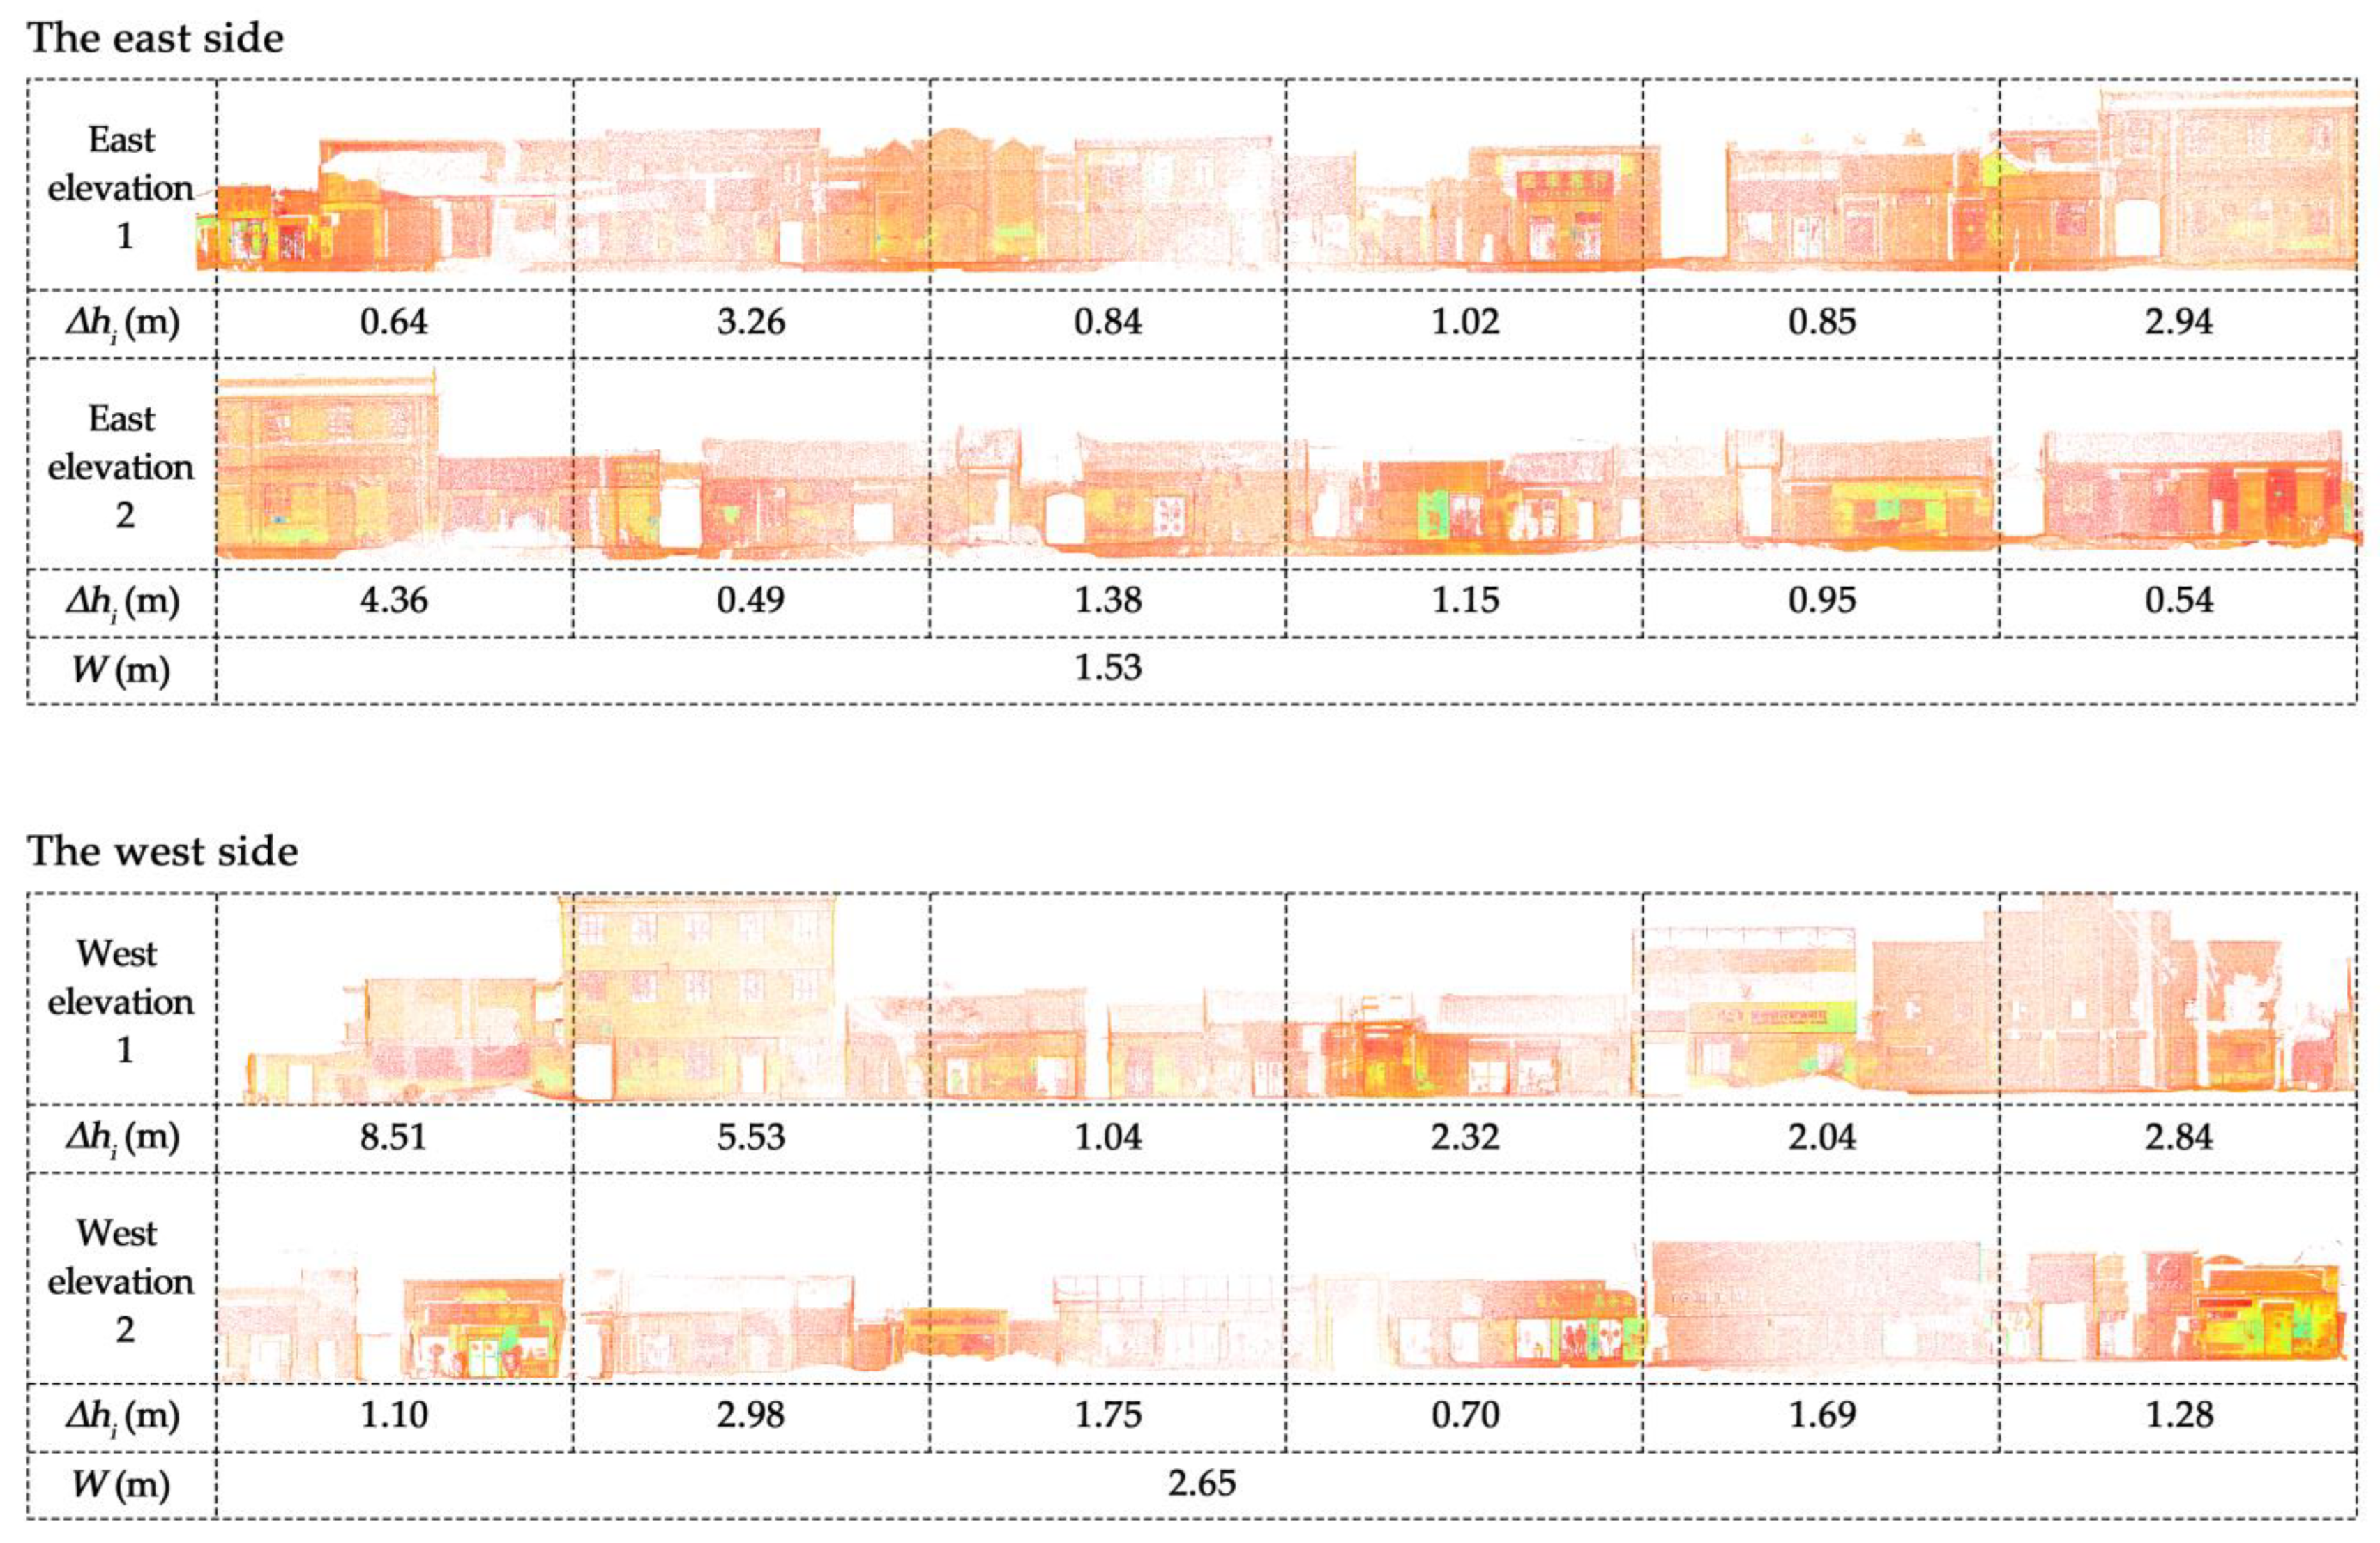
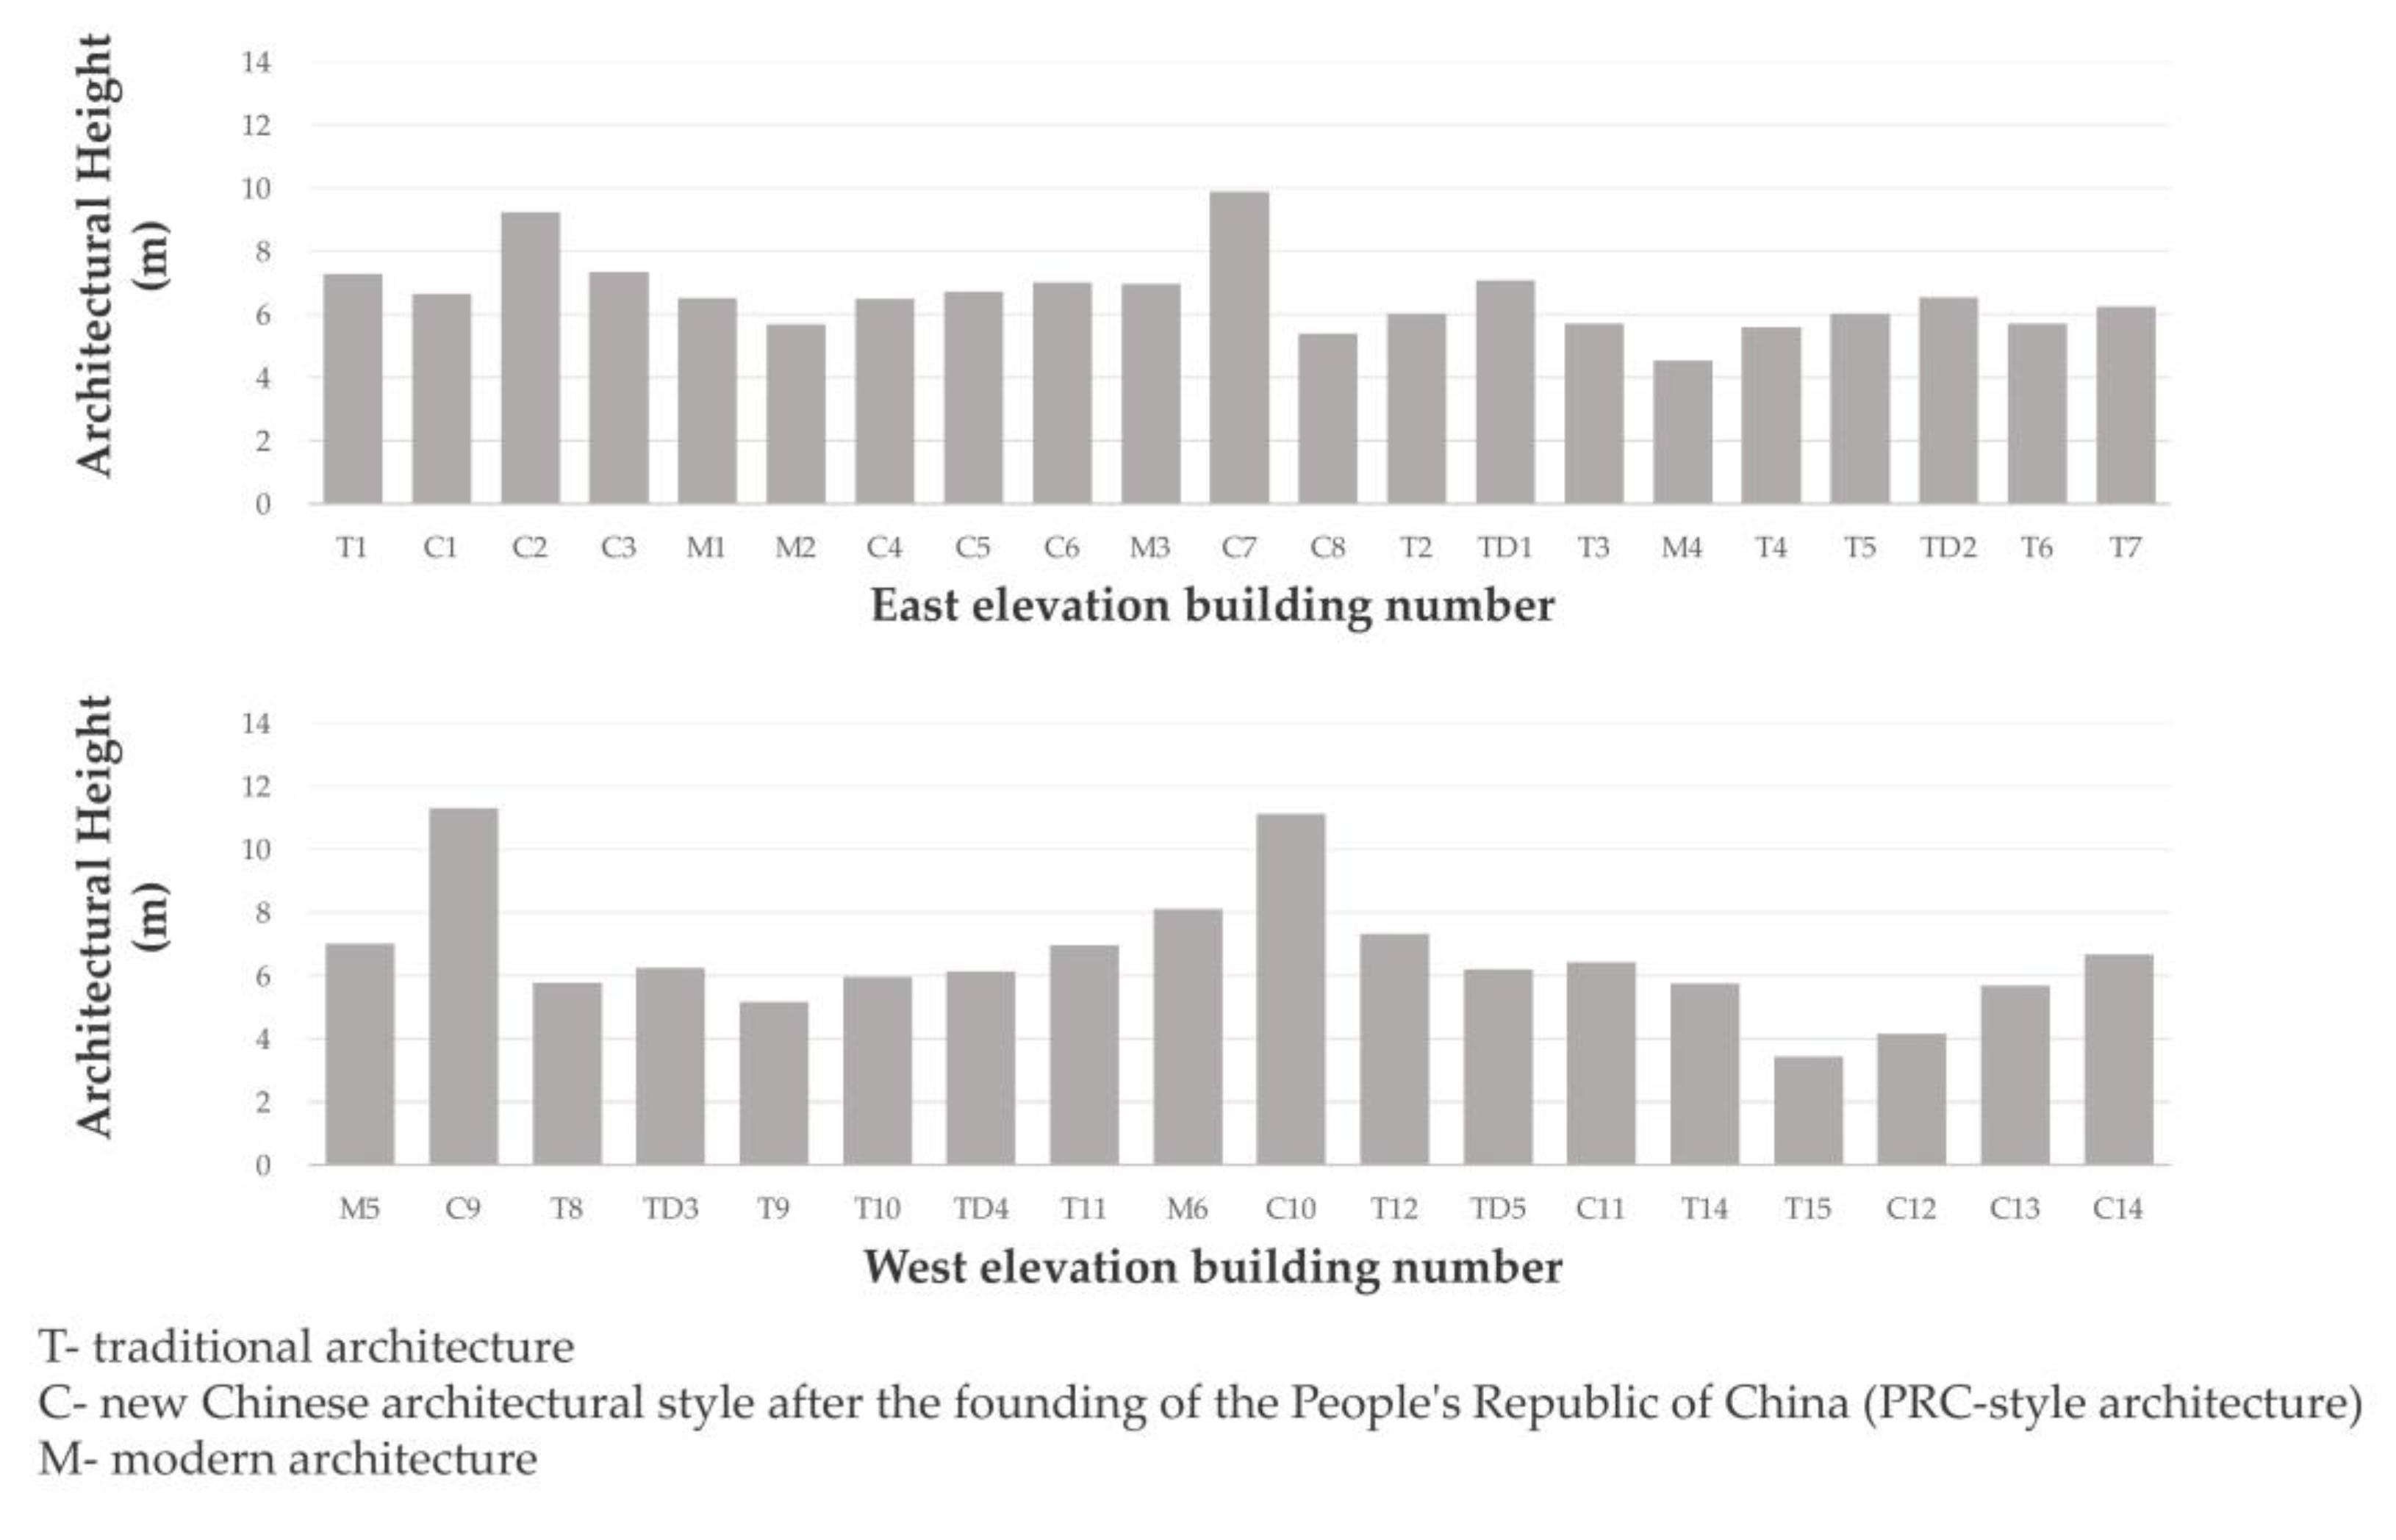
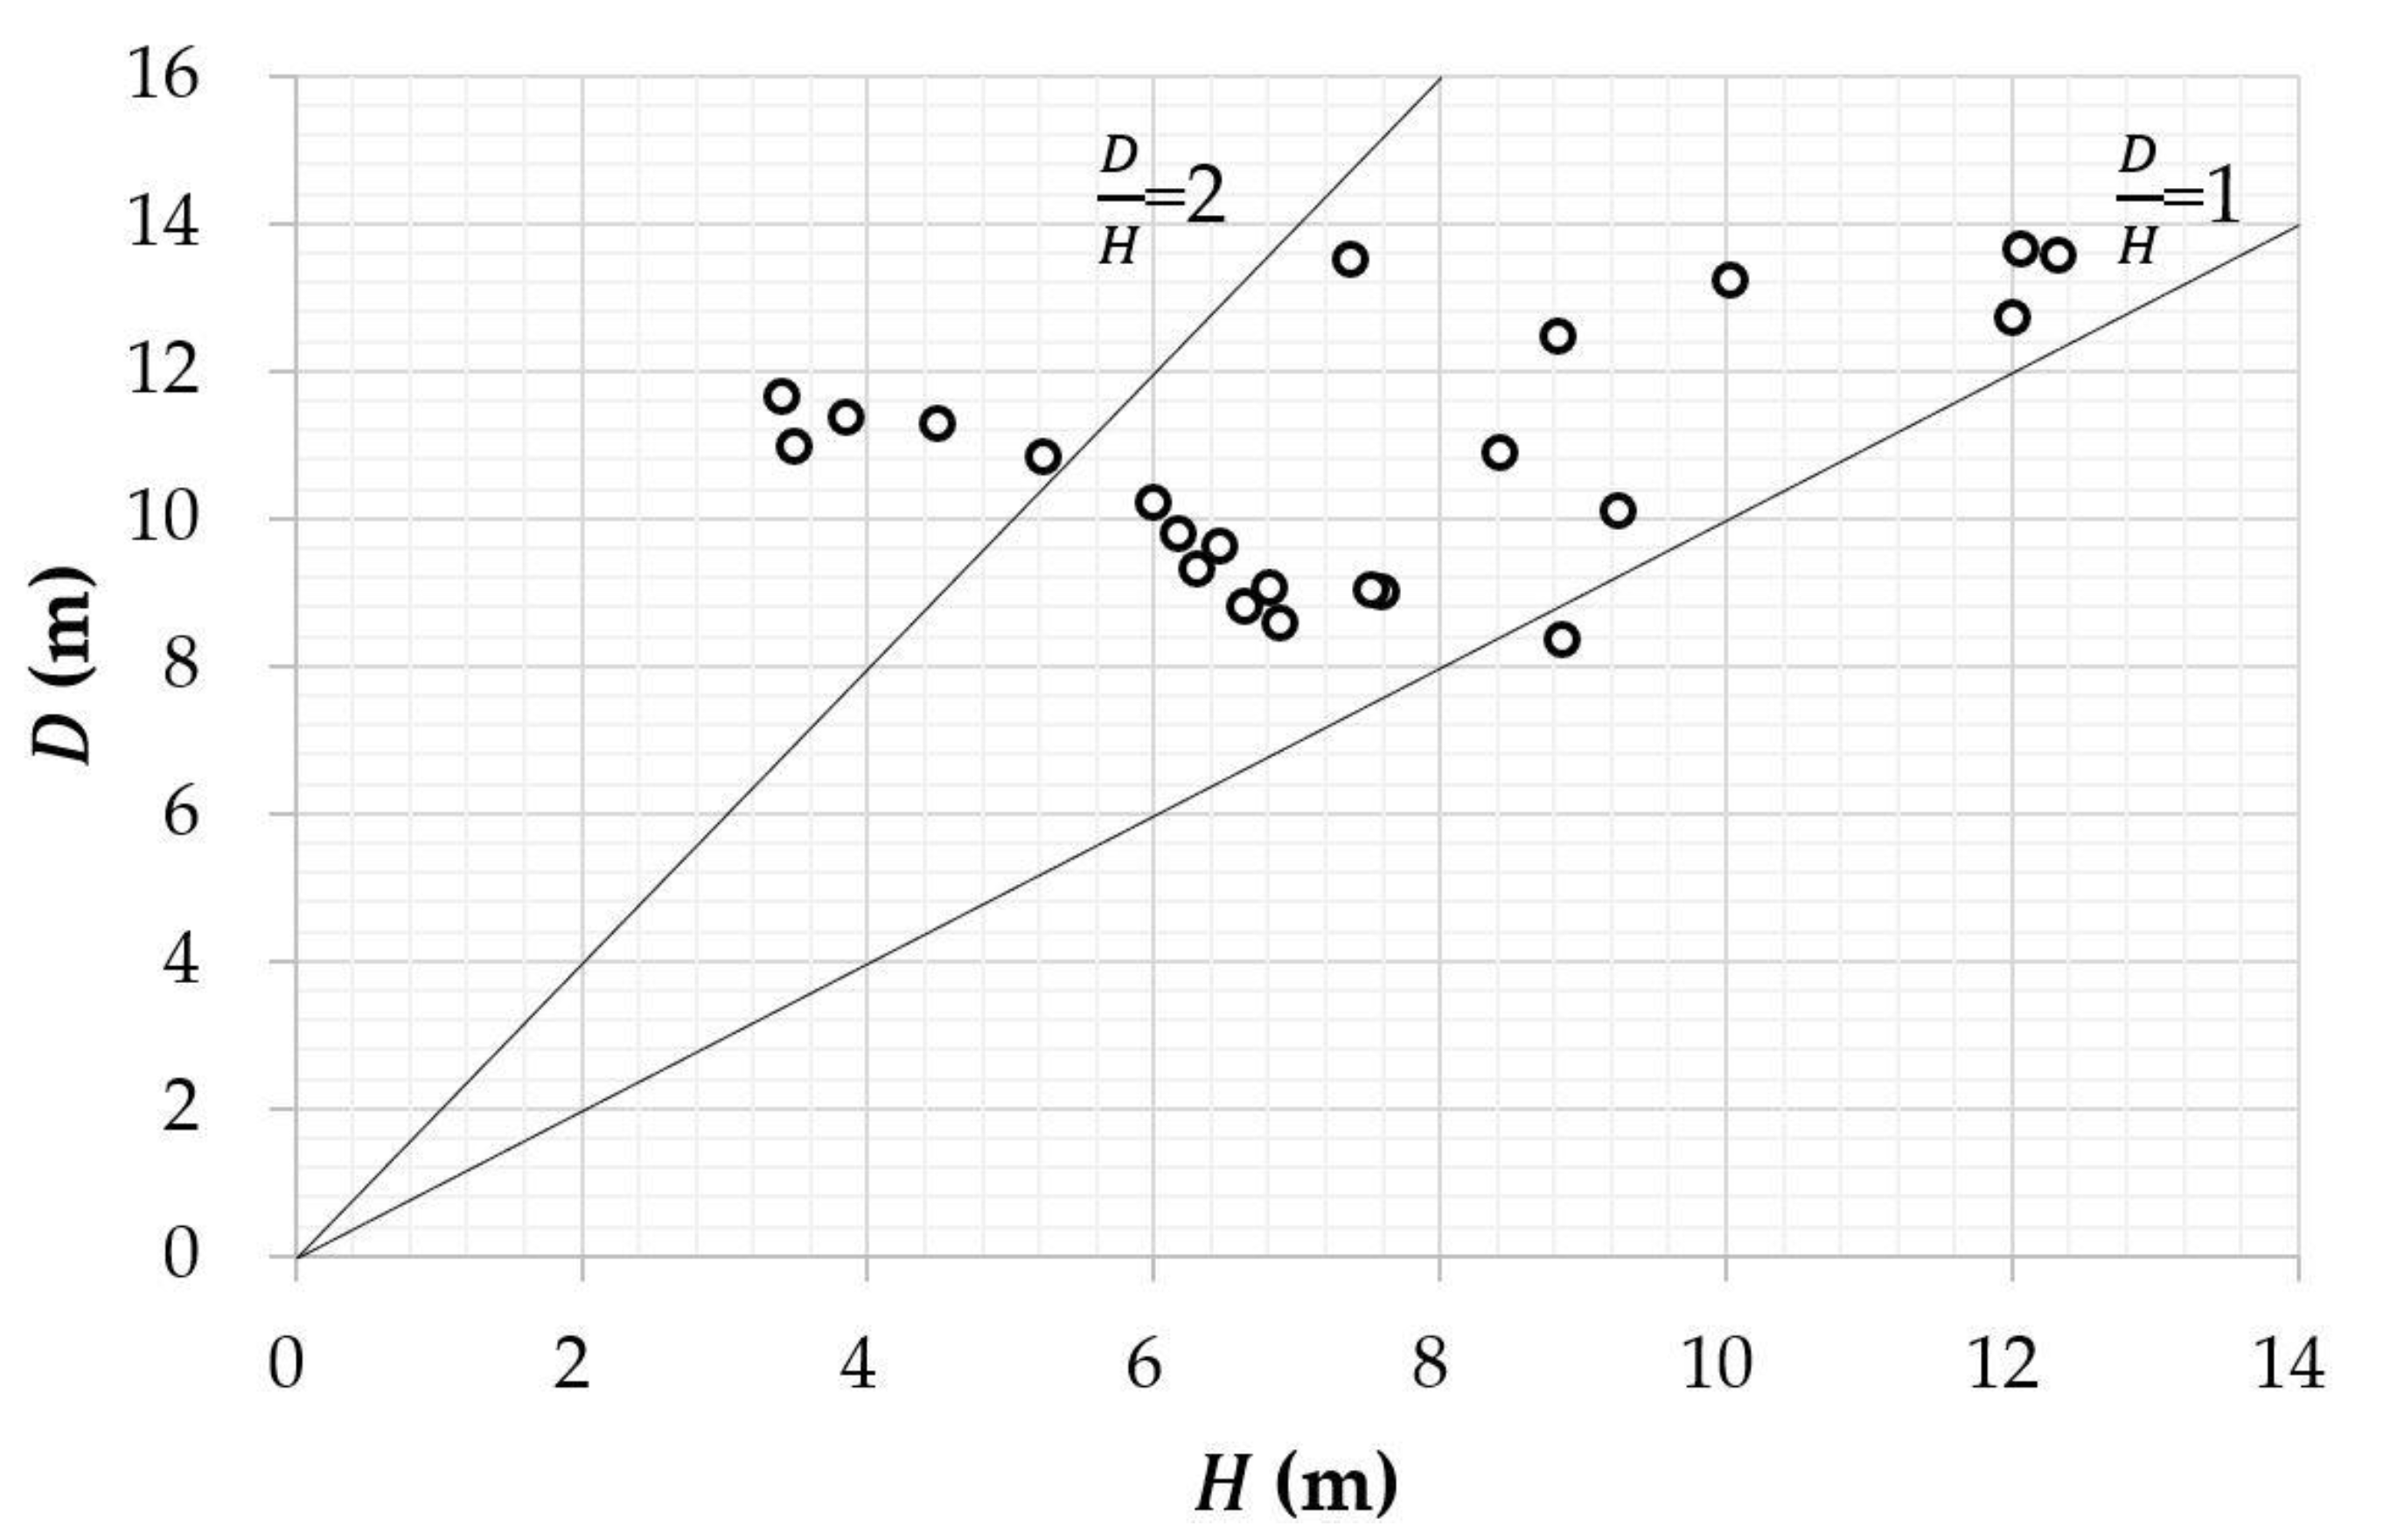
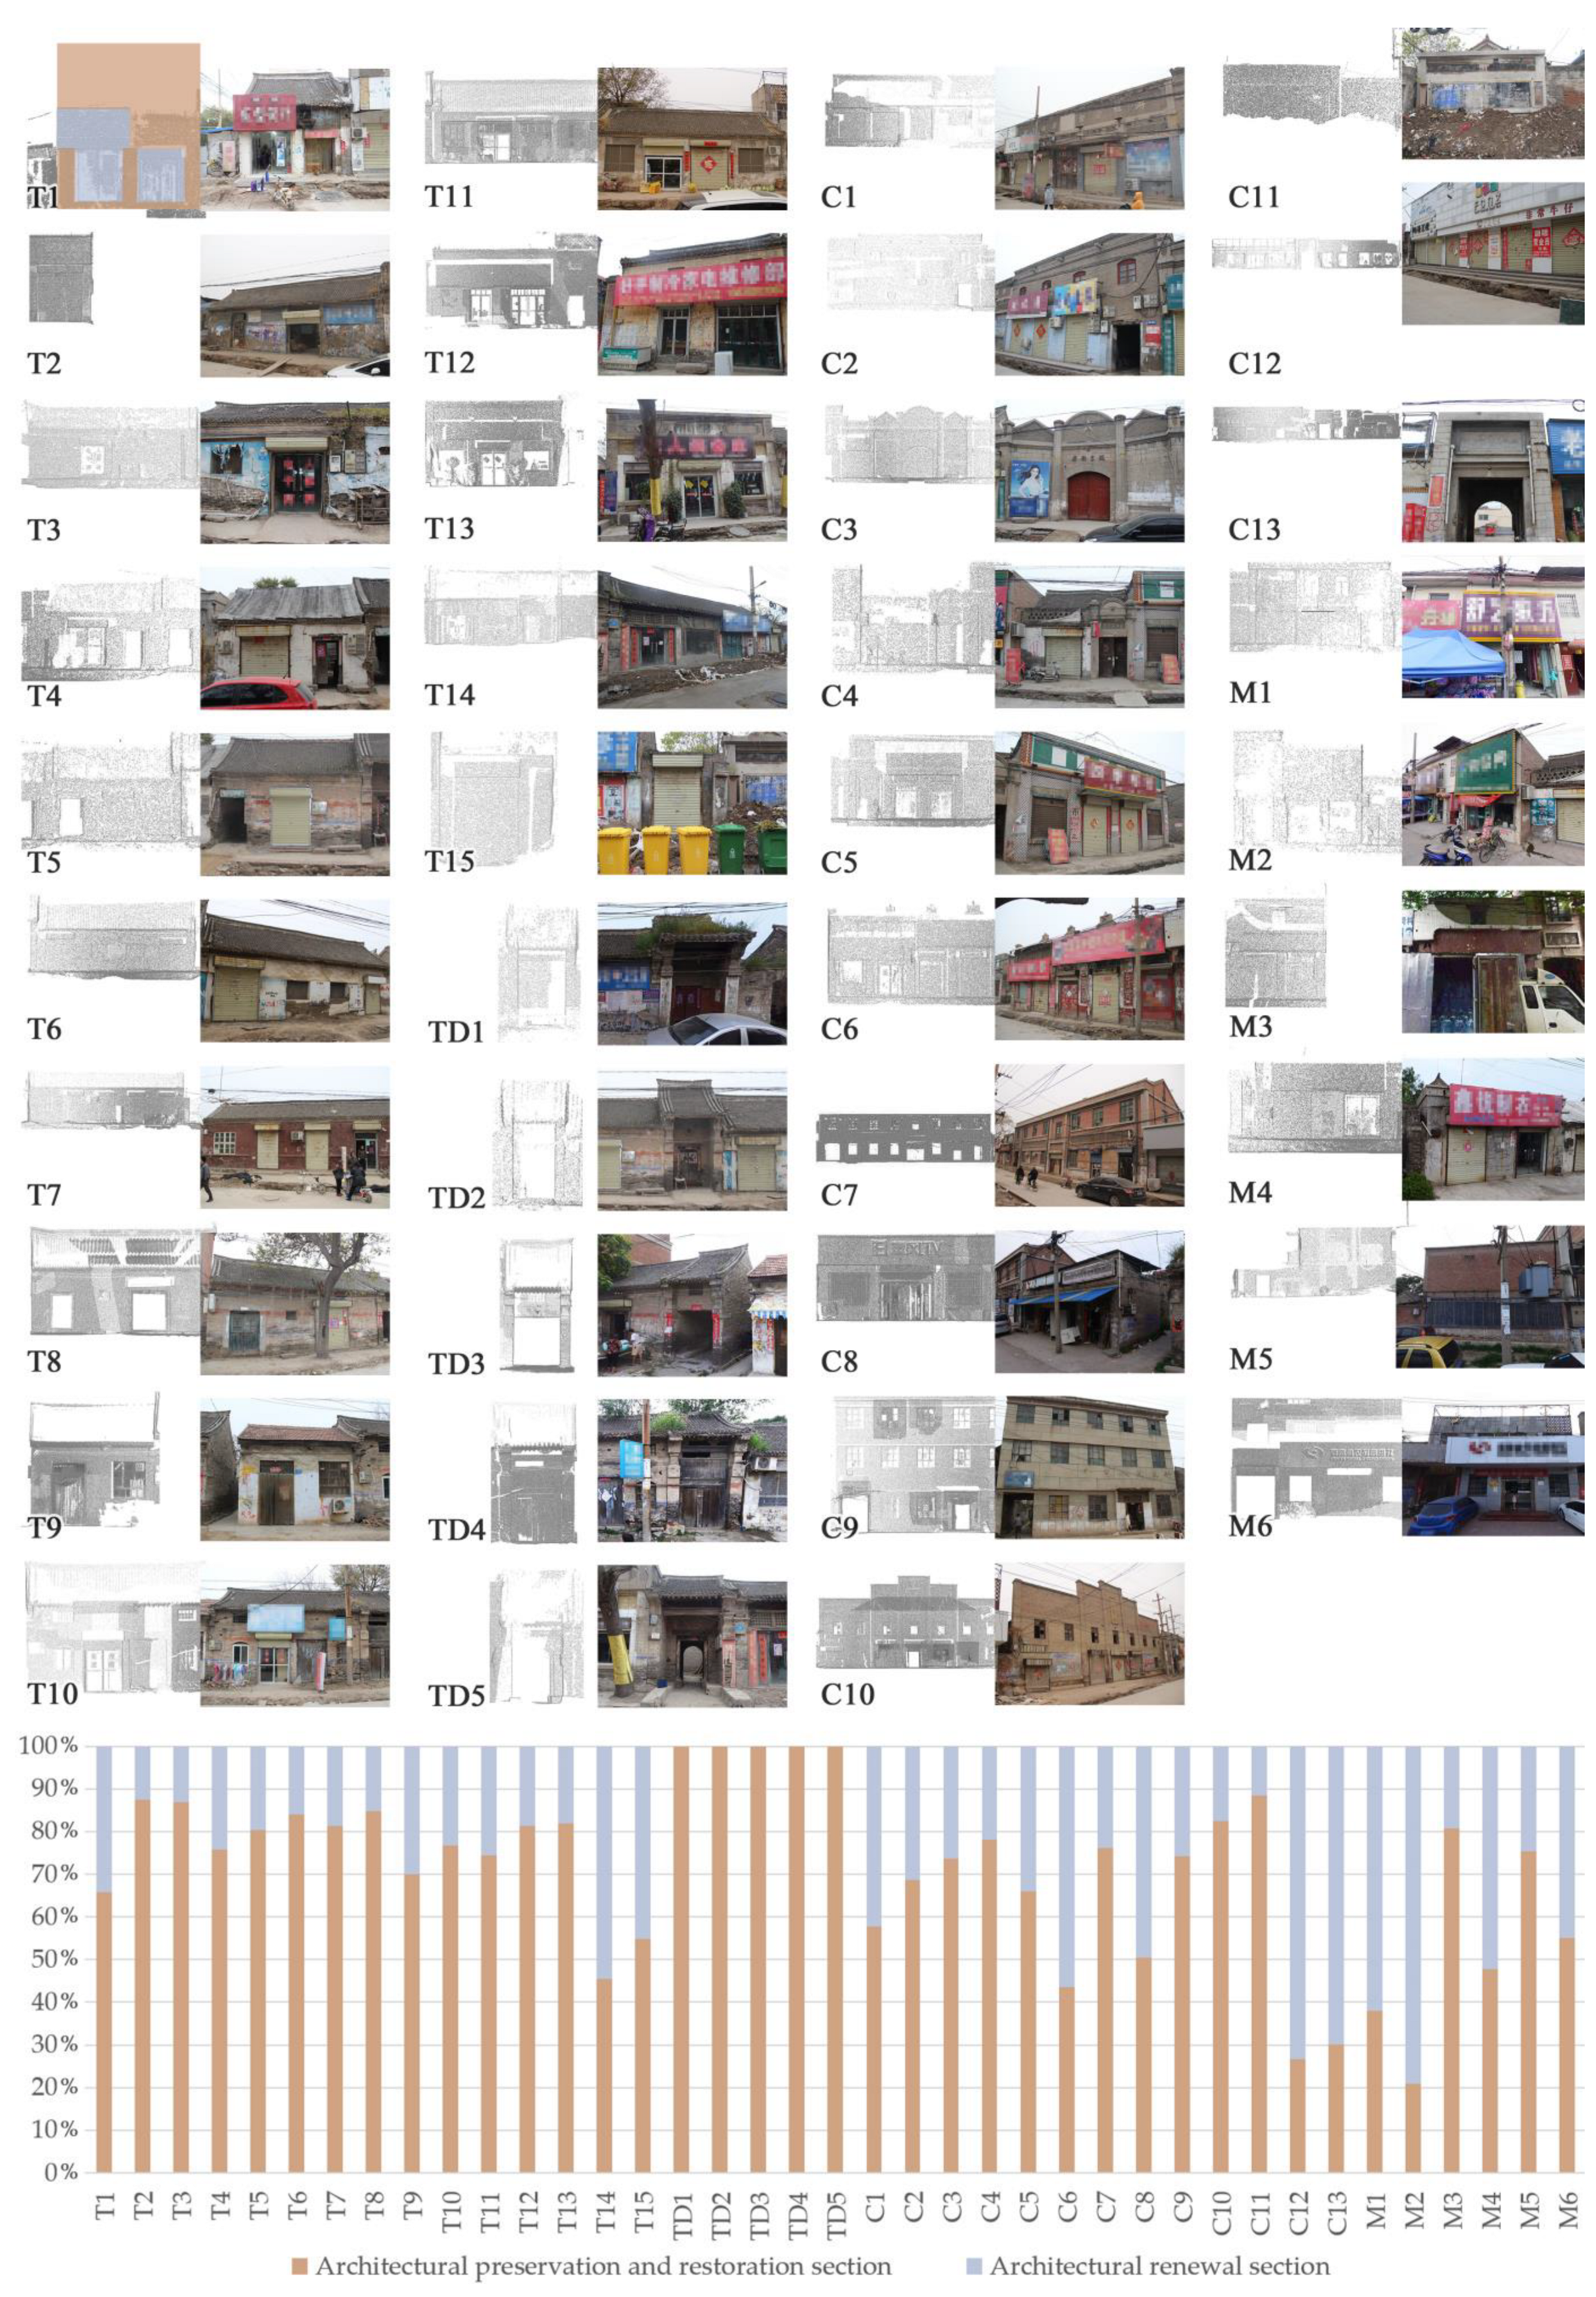
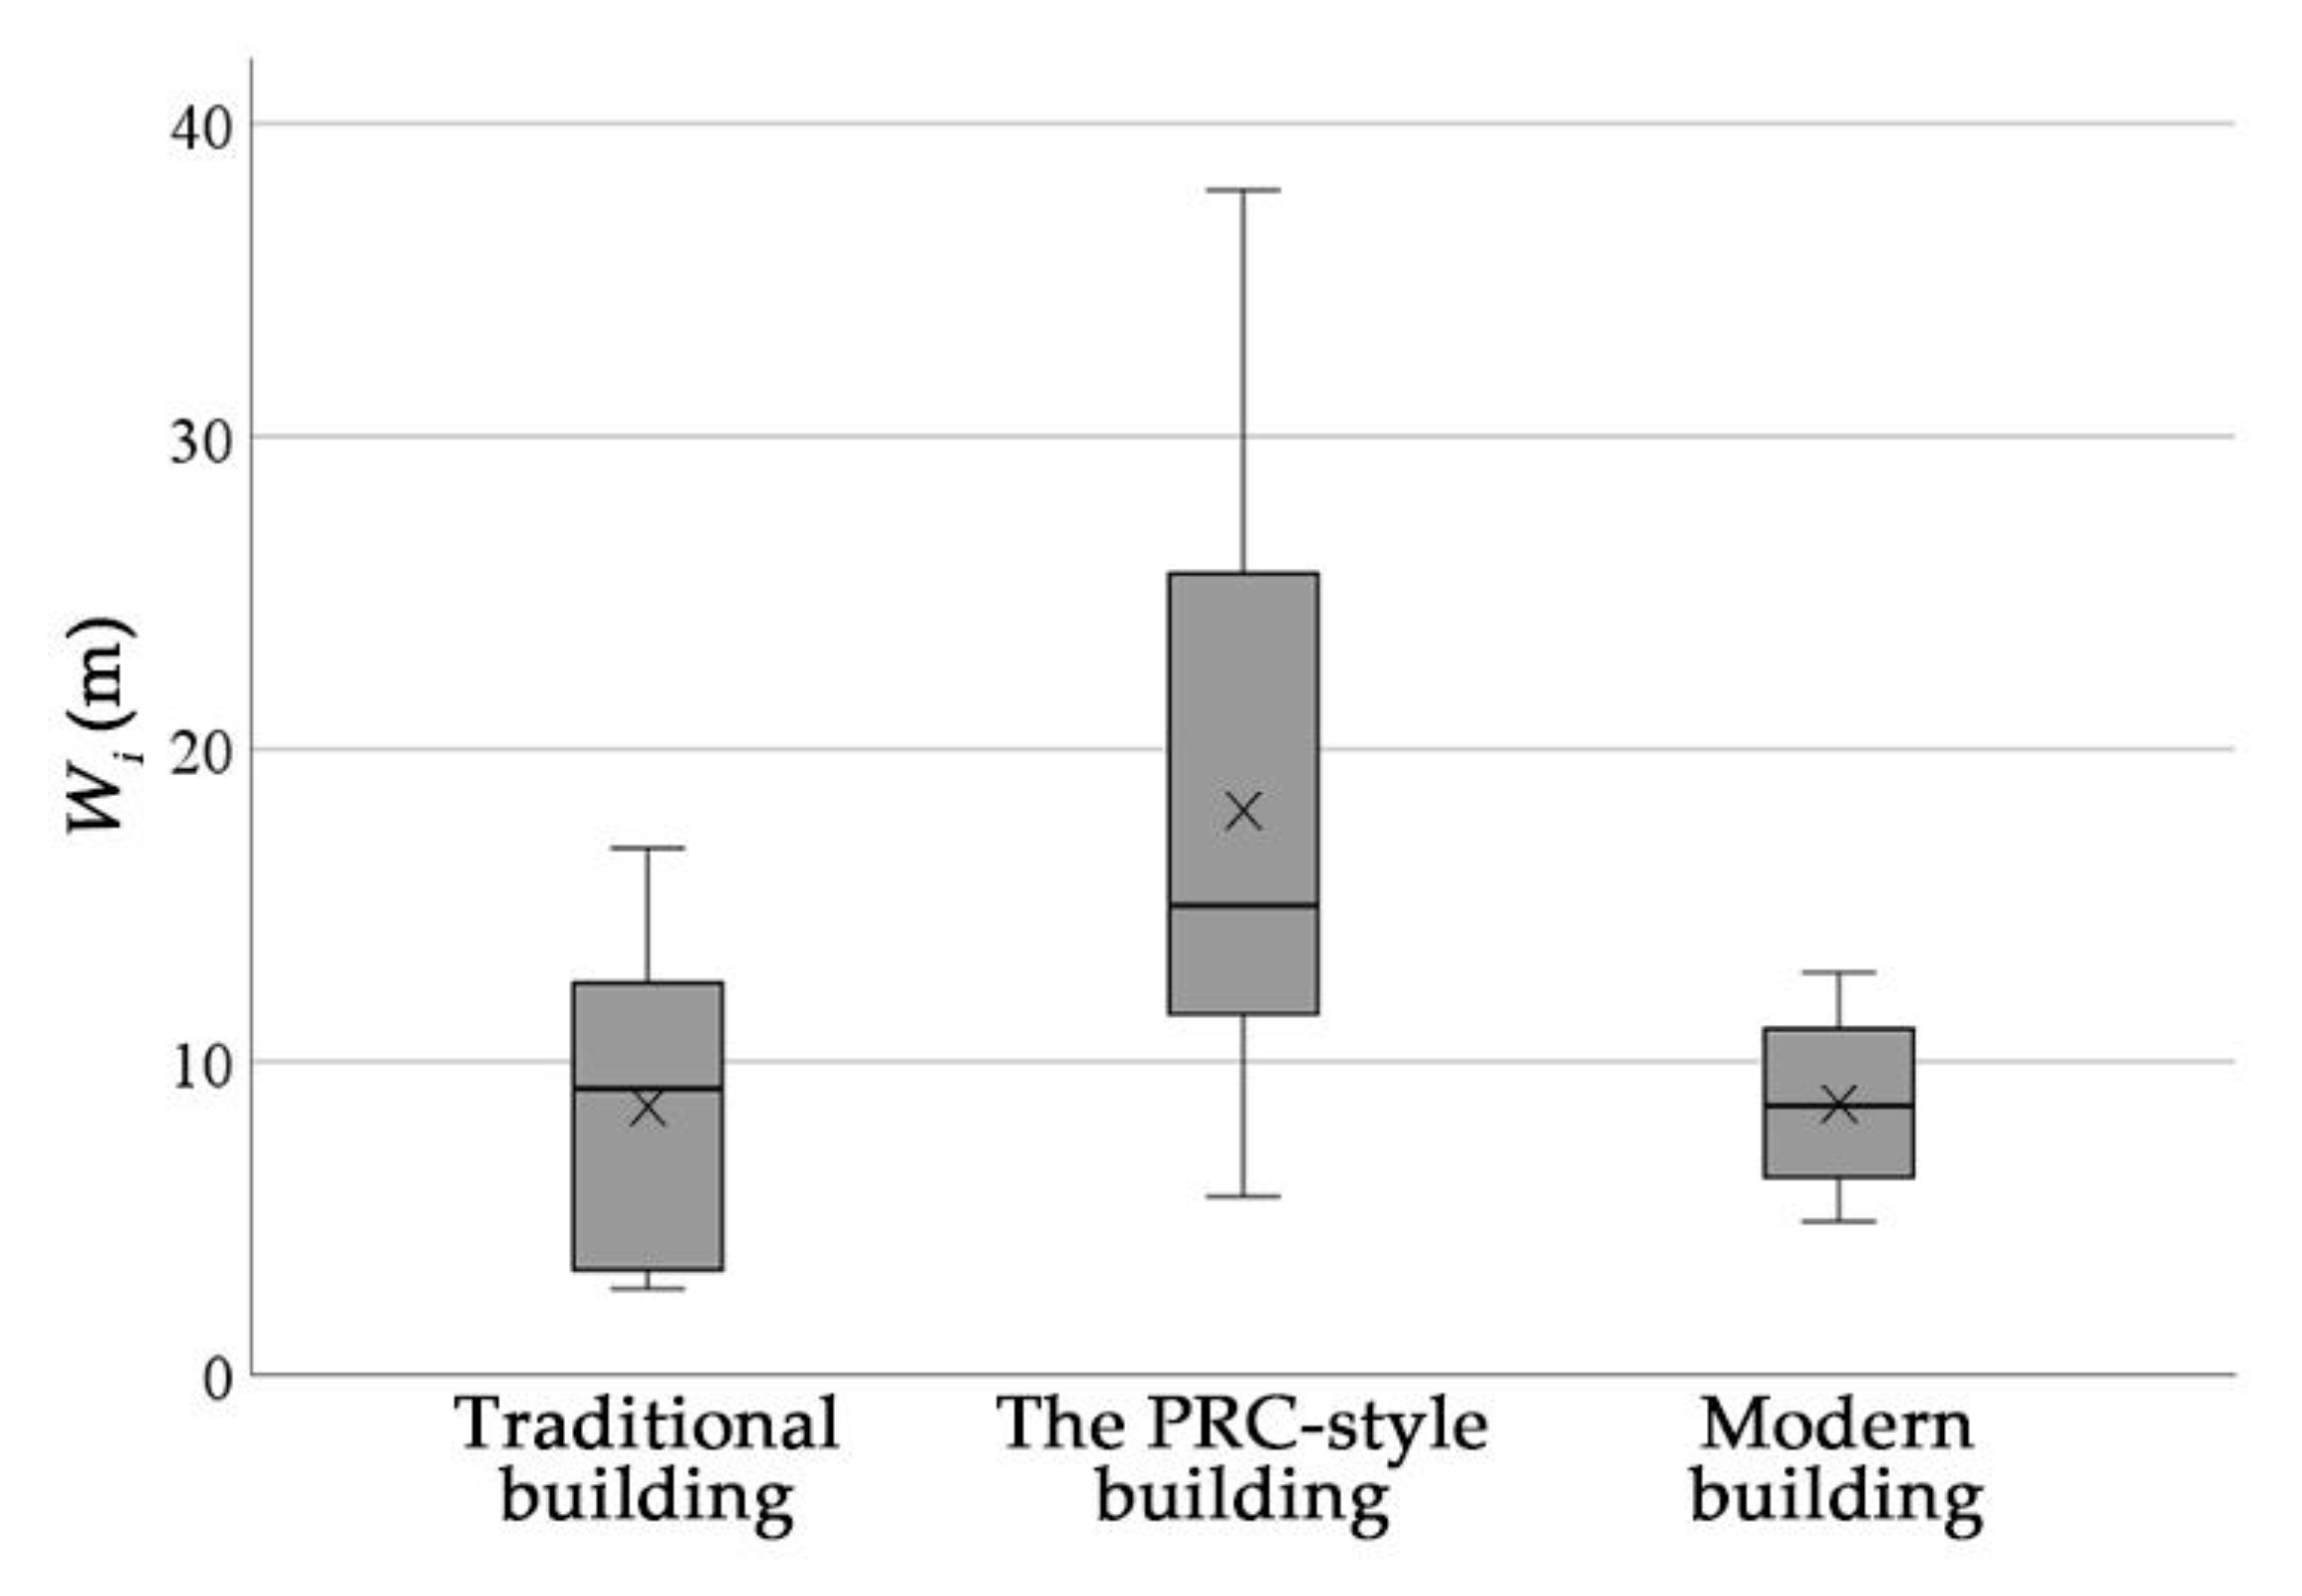
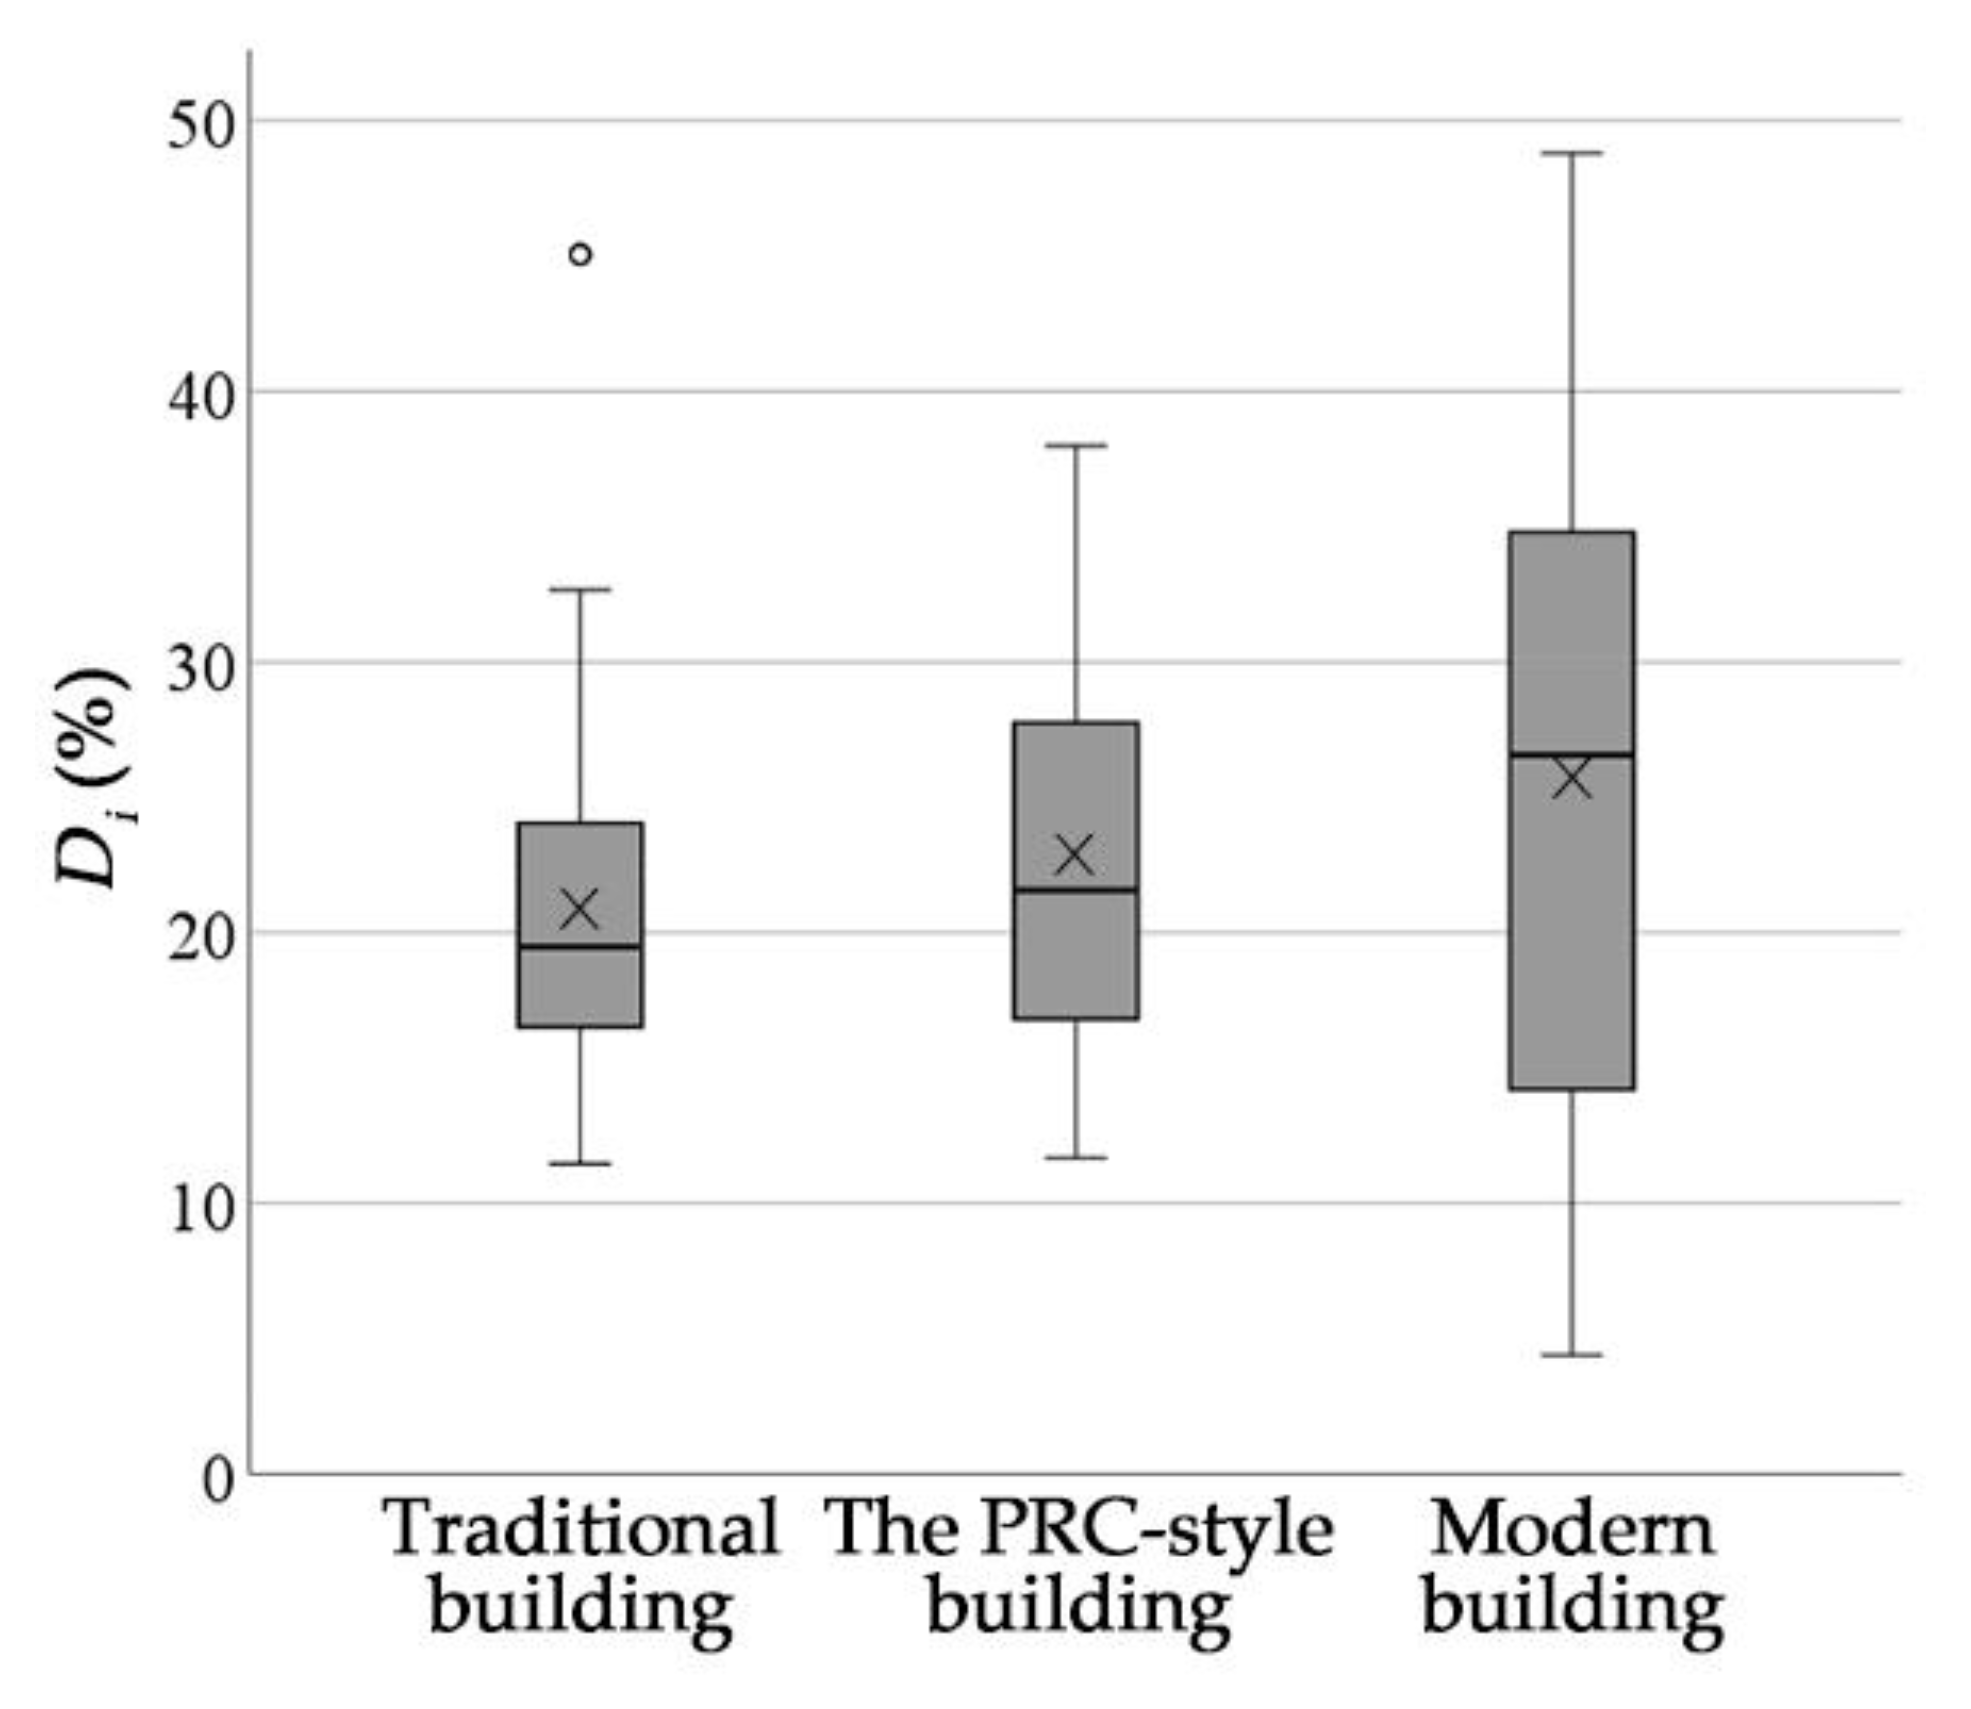
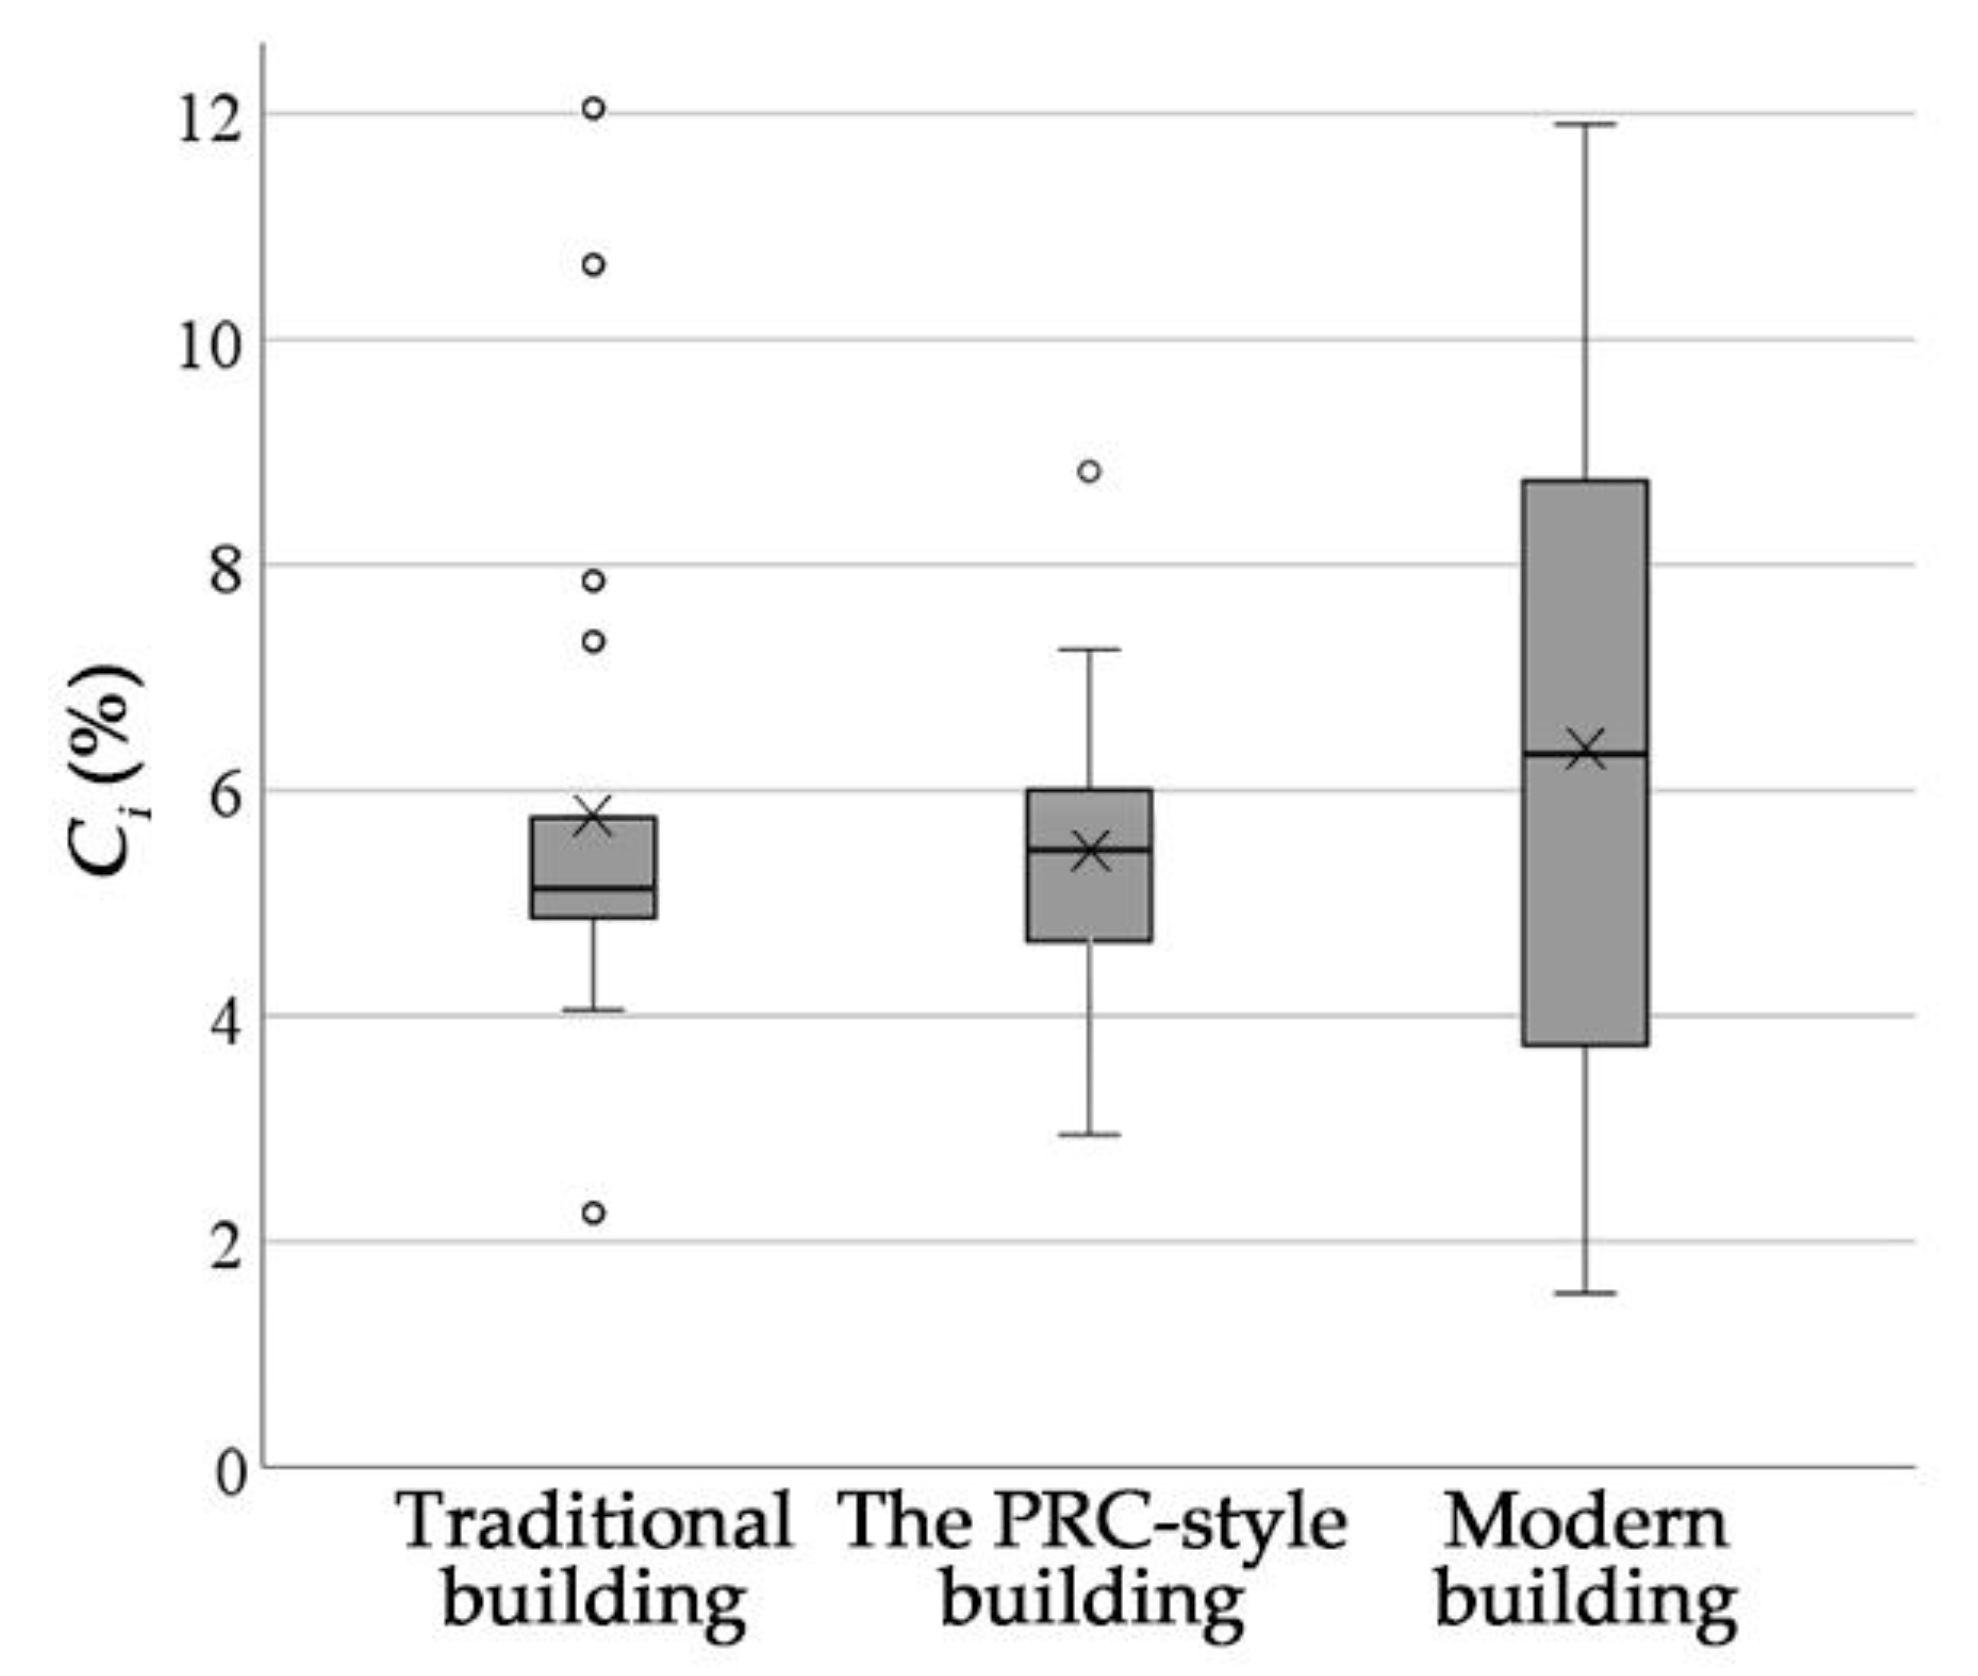
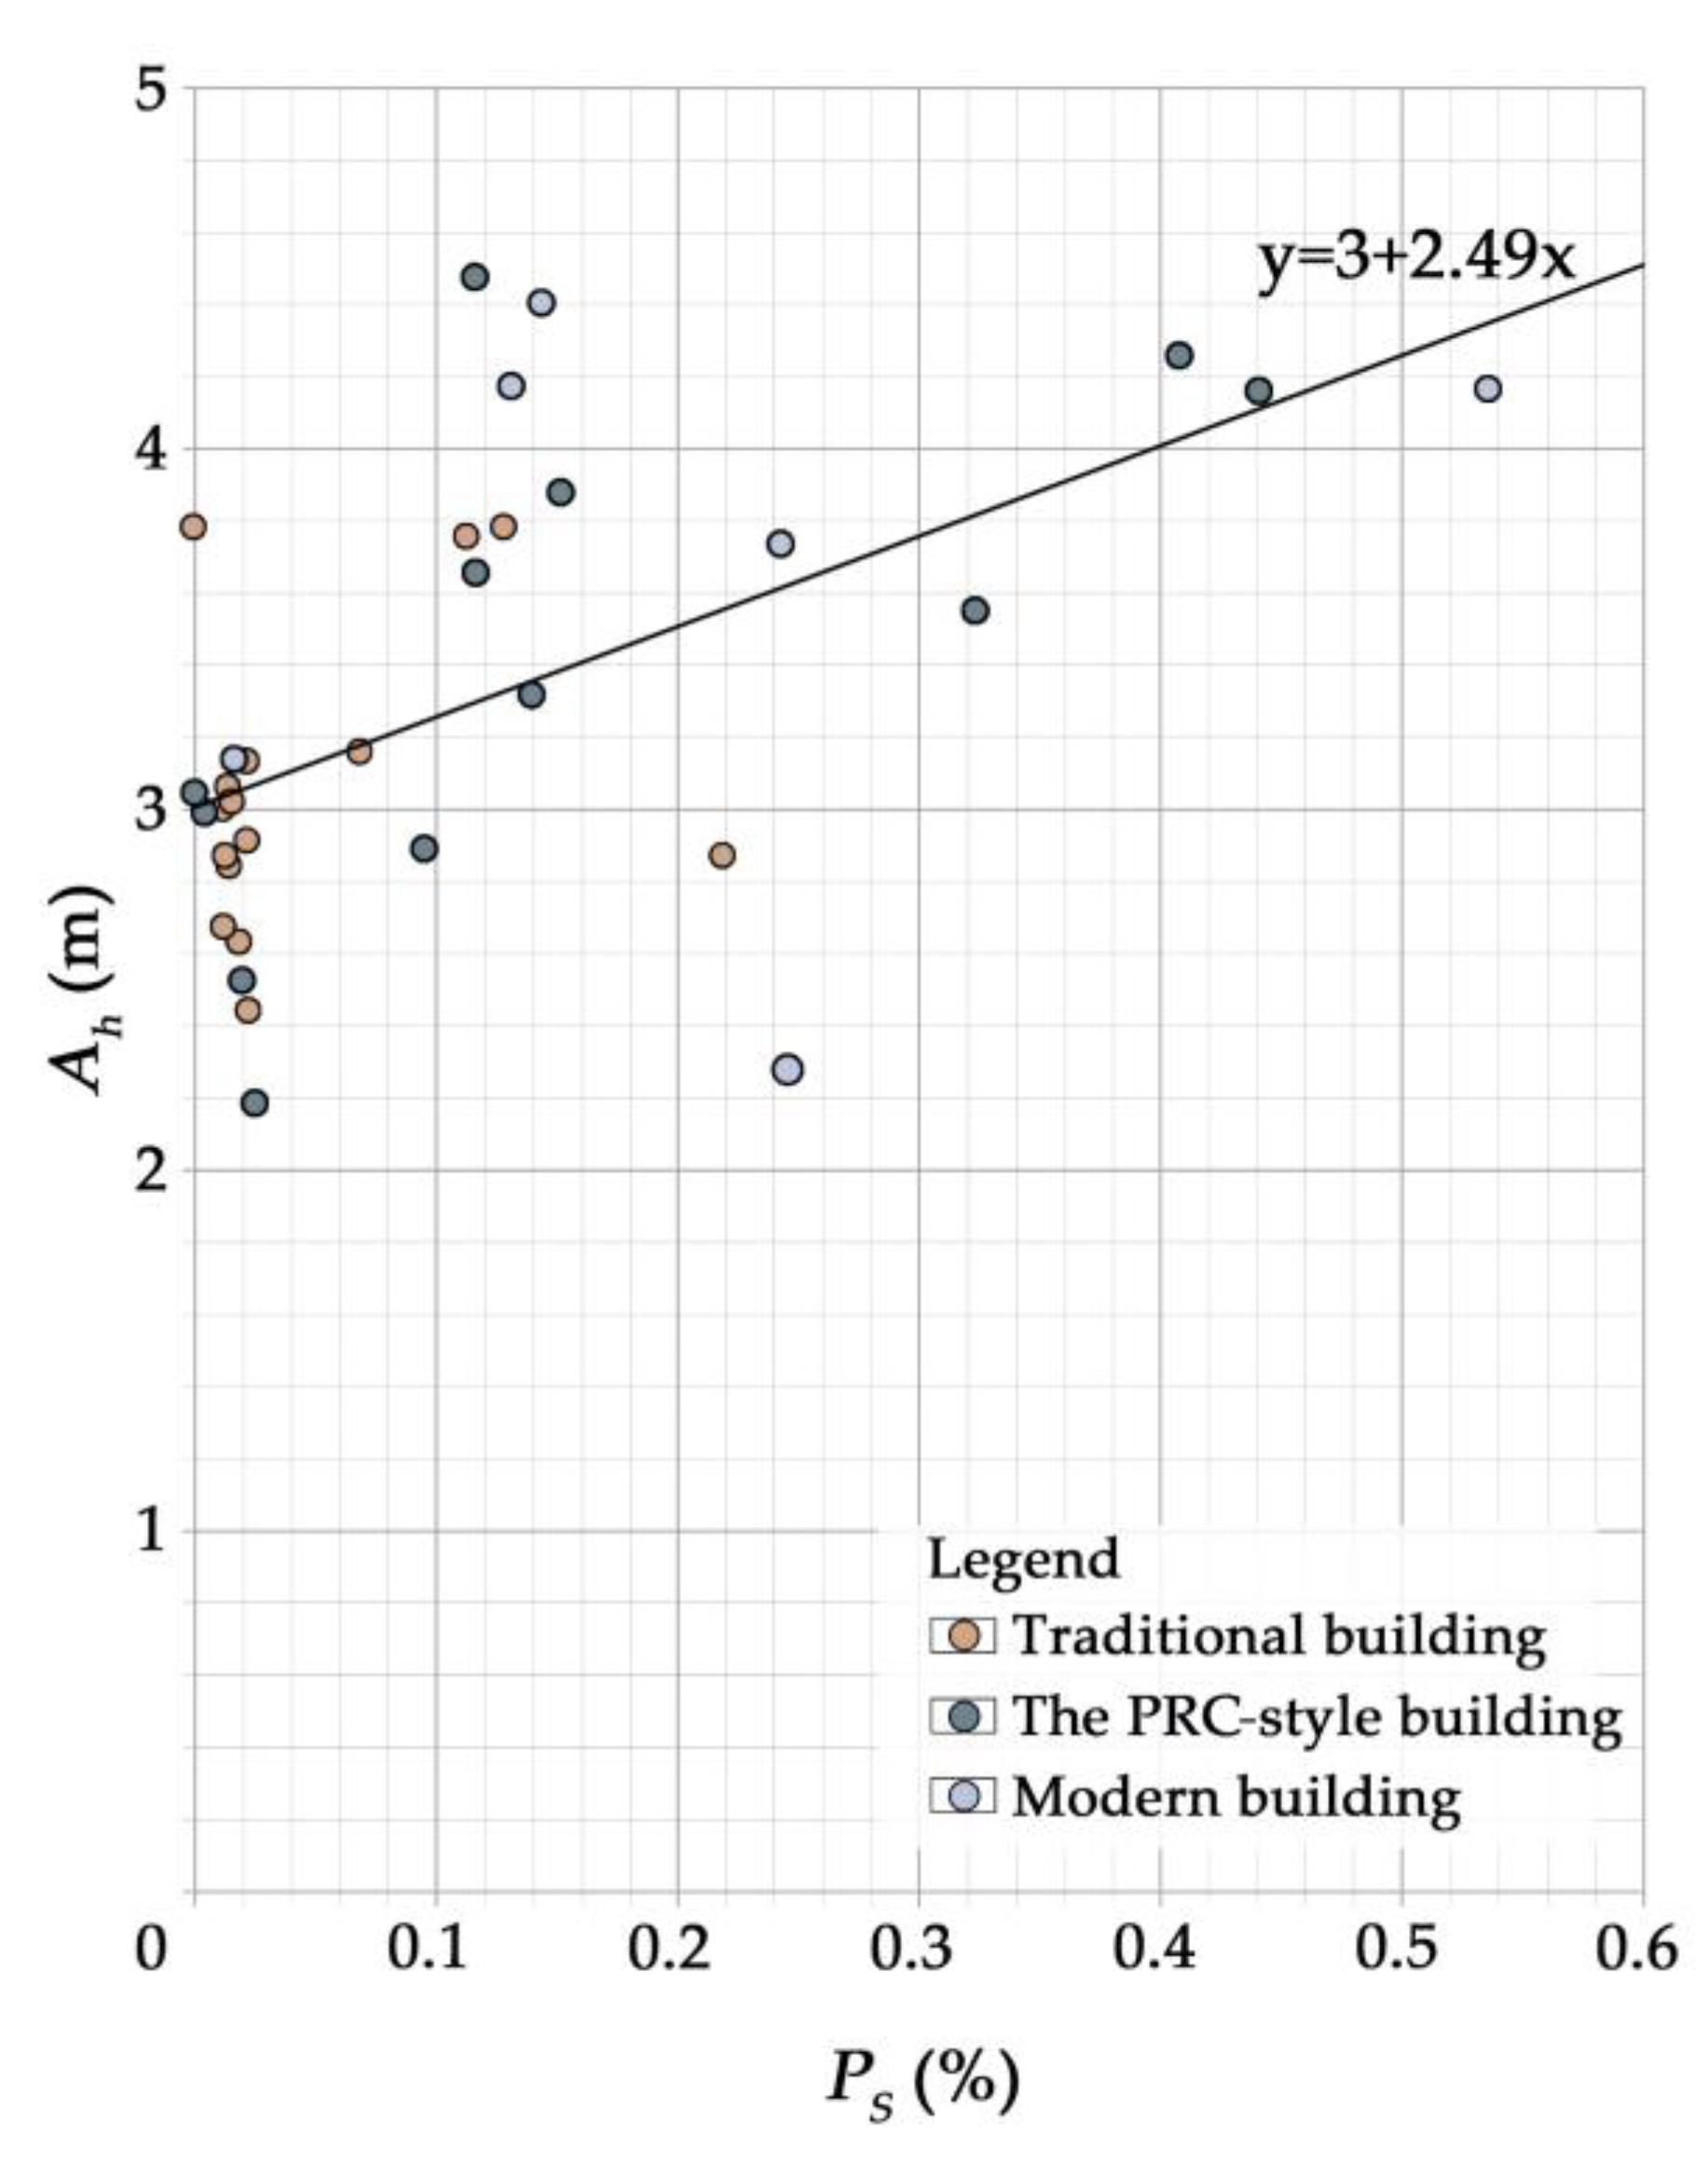
In the third stage, data analysis and suggestions were provided based on the 3D diagnosis approach’s data indicators. Using Zhongshan Street in Qi County as an example, we quantitatively analyzed and summarized factors. At the macroscopic level, we evaluated the traditional characteristics of street spaces through the calculation of and . At the meso architectural level, we analyzed , , and to determine which buildings along the old street require preservation or updating and how to control the facade width and height to achieve harmony with the traditional architectural scale. At the micro detail level, we analyzed facade windows, doors, and the second contour line to understand the problems of modern buildings that do not conform to traditional styles. We addressed these issues by referring to the corresponding data of traditional buildings through the analysis of the diagnostic index system.
This study provides an effective and general approach for other historic districts that have multi-period architectural styles or multiple functions coexisting under the urgent need for spatial quality improvement. The method has broad application prospects. Applying the 3D quantitative diagnosis method with the analysis of the current situation characteristics of the district can scientifically reveal the spatial characteristics of streets in order to better protect and present the historical and cultural characteristics of Zhongshan Street, continue the historical heritage and the spatial experience of traditional streets and alleys, and provide theoretical support for the preservation and sustainable development of the district. Thus, the unique characteristics of the historic and cultural district can be better preserved and presented through the continuation of the historical lineage and the spatial experience of the traditional streets.
Compared with other methods in the technical field, this 3D diagnostic framework is more efficient than the traditional manual measurement, and it can grasp high-precision actual measurement data and reduce the difficulty of mapping historical buildings. In the index field, this study establishes a macro-to-micro index system based on the synthesis of the building facade features commonly mentioned in the existing studies, so it not only grasps the typical characteristics of the district more comprehensively and quickly but also can make effective suggestions from more dimensions. However, this study still has some limitations for the establishment of complex feature indicators, which need further improvement. In the future, BIM and HBIM can be introduced on the basis of research to provide sustainable protection and management for all of the life cycle of buildings [
53]. In addition, based on the spatial analysis of the GIS platform, a thematic map could be formed to realize the integration and analysis of qualitative and quantitative data [
54].


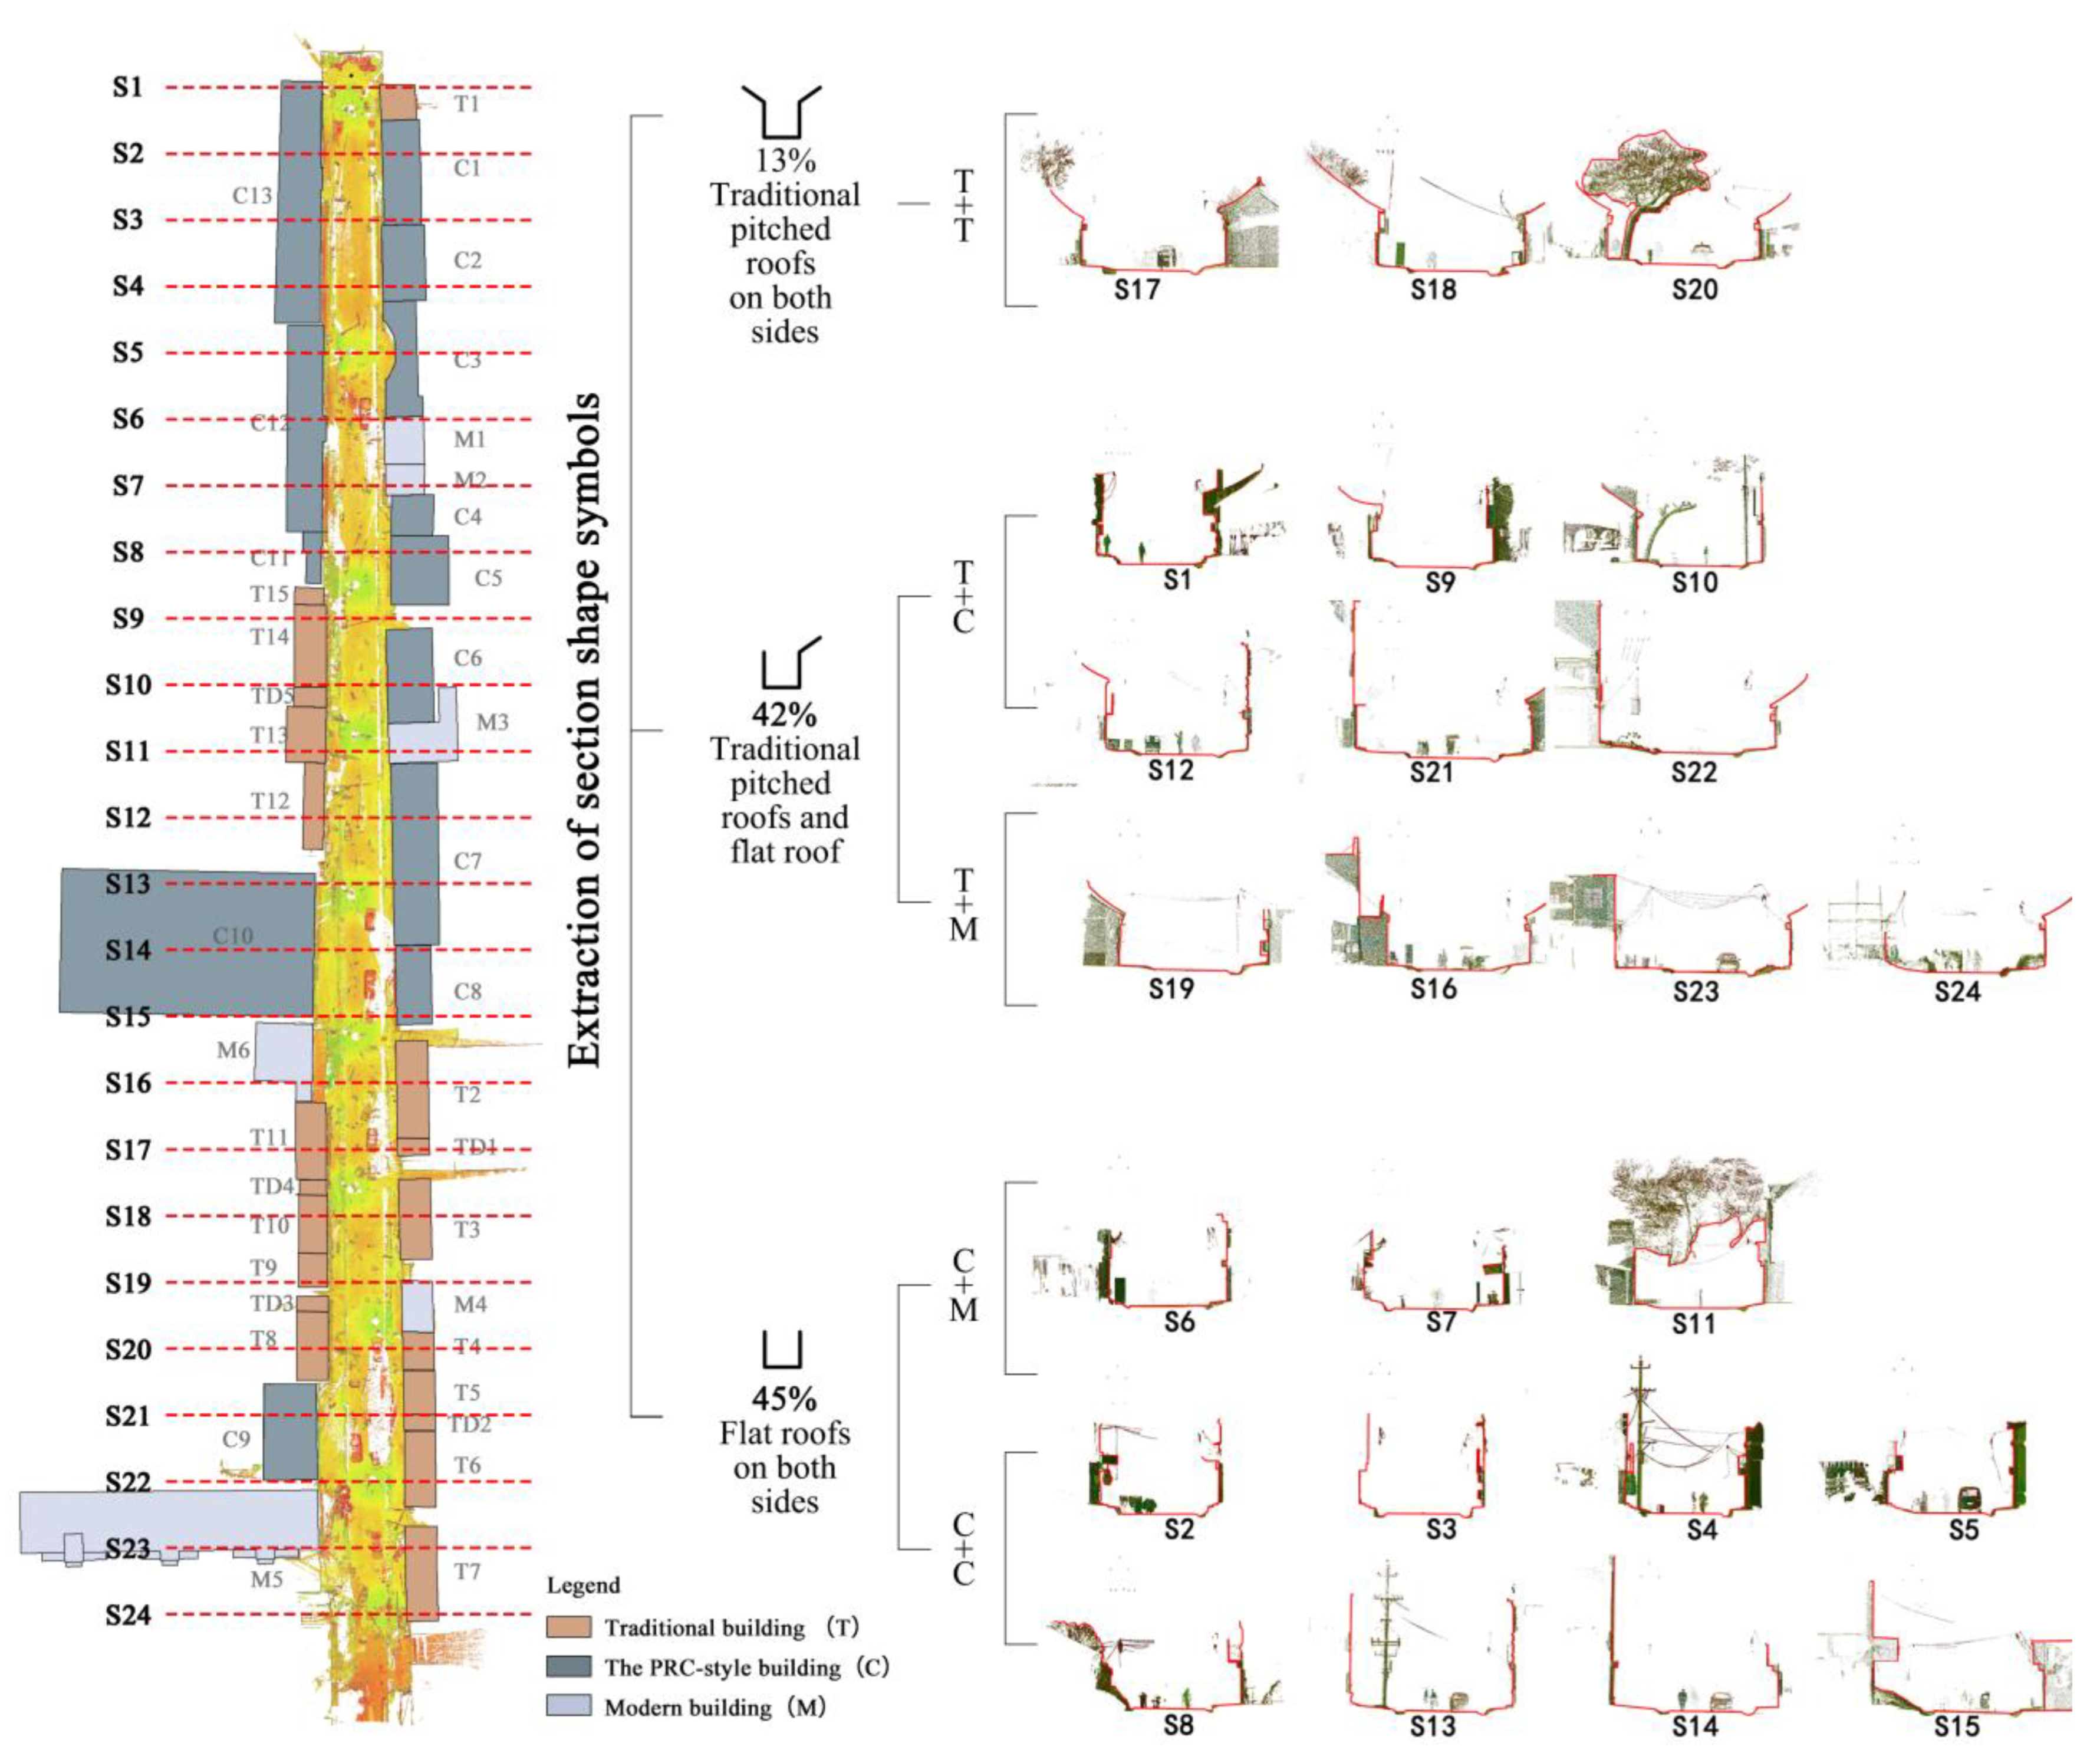
 ) that create spatial diversity. The first vocabulary (
 ) represents the traditional form of Zhongshan Street, where both sides of the street have traditional Yingshan roofs. The second and third vocabularies (
 and
and  ) are characterized by flat-roofed buildings on one or both sides of the street. Together, these three vocabularies shape the spatial diversity of the street section (Figure 7).


