Abstract
Given the current need to reduce the Urban Heat Island (UHI) worldwide, one of the strategies that can contribute to this mitigation is green façades. In this context, the aim of this research is to evaluate a Living Wall System (LWS) as a strategy to reduce the urban heat island in Santo Domingo, Dominican Republic, using outdoor test cells. This research was focused on the monitoring of two different façades, an LWS and a reference façade, during the warmer months. For the comparison, the parameters measured were air temperature, relative humidity, surface temperature and environmental variables. In addition, thermal images were taken. Results reveal that during the days selected, the average outdoor air temperature difference between the LWS compared to the reference façade was 5.3 °C, whereas during the day, the average was 3.3 °C. Concerning surface temperature, in the case of the LWS, the temperature was higher and had greater fluctuations than the reference façade. This behavior was confirmed by the results obtained with thermal images. In conclusion, using an LWS in a tropical climate helps the urban microclimate, which contributes to urban heat island effect mitigation during the warmer months.
1. Introduction
The urban heat island phenomenon is a result of a high excess of heat from fast-heating urban surfaces consisting of buildings, asphalt, bare ground and short grass, directly affecting human health and well-being [,]. In addition, urban morphology can have an influence, increasing shortwave radiation and trapping longwave radiation, resulting in an intensification of heat storage in cities []. However, to mitigate this effect, it is necessary to continuously study and characterize strategies that contribute to its reduction; one of them is the implementation of green walls that can contribute to decreasing air temperature and creating a better environment in urban areas [,,,,].
Within the classification of green walls are green façades and living wall systems (LWS), according to their growing method. Green façades are rooted in the ground and grow vertically, whereas living wall substrate stands are vertically attached to the building envelope [].
Furthermore, worldwide research into green walls or infrastructure as a strategy to help mitigate UHI has been and continues to be carried out, taking into account two approaches: simulations and measurements. In the case of carrying out simulations, there are several programs such as ENVI-met, PALM (Parallelized Large-Eddy Simulation Model), Mitras, Miskam, etc., and within the studies are those carried out by Czáder et al. (2009), who modelled the flow and dispersion in a street canyon with vegetation using the Miskam program []. Herath et al. (2018) performed a simulation by modelling in ENVI-met green walls and green roofs in a tropical urban context as an urban heat island adaptation strategy []. In addition, Herath et al., studied the green infrastructure effects in the tropical Sri Lankan urban context as a UHI mitigation strategy using ENVI-met software []. Shafiee et al. (2020) carried out an assessment of the effect of living wall systems on the improvement of the urban heat island phenomenon, analyzing day and night temperature and relative humidity fluctuations using the ENVI-met program []. In addition, Shahidan et al. (2021) analyzed the outdoor microclimate of green buildings on environmental affects using the PALM program [].
In 2022, Alsaad et al., evaluated the potential of living walls in mitigating the effects of heat waves in Central European cities located in Germany using the ENVI-met program []. Abdulateef and Al-Alwan modeled, using ENVI-met, the effectiveness of urban green infrastructure in reducing the surface urban heat island using Baghdad city as a case study []. Zheng et al., assessed the implementation of green infrastructure and increasing reflective pavements as mitigation strategies in a subtropical climate by evaluating meteorological parameters with ENVI-met software []. Moreover, Ciacci et al. (2022) studied the influence of green façades as a building-level rehabilitation strategy in an industrial area of Florence, Italy, as a microclimatic parameter to improve outdoor environmental conditions and validate their effectiveness as a UHI mitigation strategy, adopting the ENVI-met program to perform outdoor simulations [].
On the other hand, there are studies that use measurements, as is the case of Price et al. (2015), who assessed a vertical greenery system as a strategy in urban heat island mitigation []. In 2018, Chun and Guldmann studied the impact of greening on the urban heat island, taking seasonal variations and mitigation strategies into account []. Vox et al., carried out an experimental study of green walls at the University of Bari (Italy) to analyze their thermal behavior during warm and cold days []. Meanwhile, in 2019, Rojas-Cortorreal et al., evaluated green infrastructure as a tool for urban mitigation and adaptation in the city of Santo Domingo, Dominican Republic []. Cui et al. (2021) quantified the response of the surface urban heat island to urban greening in northern global megacities []. In 2022, Marando et al., carried out research related to urban heat island mitigation by green infrastructure in European Functional Urban Areas [].
Additionally, Jiang et al. (2023) researched the impact of green roofs and green façades on building thermal performance in a subtropical climate in China by monitoring surface temperature []. Furthermore, Pragati et al., assessed the importance of green systems in order to improve thermal comfort and minimize the causes of the urban heat island by evaluating an integrative green building design [].
According to previous literature reviews, it is necessary to carry out more research related to the capacity of green walls to improve the conditions of the urban microclimate, especially the impact on hygrothermal comfort that façades can have when installed at street level using a measurement approach []. In addition, Susca et al., comment in their review that the effect of green walls on HVAC energy consumption and nighttime air temperature and their behavior in the urban environment has hardly been investigated, especially in climates such as the Dominican Republic (Aw) []. On the other hand, Geletic et al., commented, in their conclusions on simulations carried out into the effects of street trees, green roofs and green walls, that field measurements are necessary to improve knowledge of the role of these types of systems []. For these reasons, it is necessary to build on the few experimental investigations on green walls that enable improving the urban microclimate, especially in the Caribbean. In this paper, two samples have been monitored, a living wall system and a reference façade. The objective of this research is to evaluate a living wall system (LWS) as a strategy to reduce the urban heat island in Santo Domingo, Dominican Republic, using outdoor test cells. During the warmer months, data on air temperature, relative humidity and surface temperature of the samples were measured, and thermal images were taken, comparing and discussing the results obtained.
2. Materials and Methods
2.1. Urban Structure of Santo Domingo
The city of Santo Domingo de Guzmán was founded in 1498 on the southern coast of Hispaniola Island on the east side of the Ozama River, and in 1502, the city was transferred to the west side of the river. Santo Domingo is located on karstic formations on the marine terrace of the city’s reef [].
Within the urban structure of the city of Santo Domingo, the safeguarding of various natural spaces was foreseen to cushion urban growth; among these was the Green Belt of the city of Santo Domingo, an area of 130 km2 with eight demarcated environmental zones and a special management zone. However, since the expansion processes were not fully controlled over time, its extension was reduced. To mitigate this situation, five urban parks were created for environmental protection. In the city and surrounding areas, there are 122.63 km2 of natural heritage with metropolitan and/or national incidence []. Table A1 shows the demographic level of Santo Domingo.
2.2. Urban Heat Island in Santo Domingo
In Santo Domingo, as in other cities, there has been an increase in temperature over the years due to the growth of the city and the loss of vegetation. To verify this, Rojas-Cortorreal et al., carried out an investigation in the city of Santo Domingo considering data from a weather station located in the “Polígono Central” as the most impacted area by urban and economic development. The climatic data were divided into triennia from 1995 to 2018, finding that the average temperature in the city of Santo Domingo increased between 0.8 °C and 1.5 °C from 1995 to 2018 []. Figure A1 shows the evolution of the temperature in Santo Domingo from 1976 to 2018.
In addition, to complement the existence of the UHI in Santo Domingo, a surface urban heat island (SUHI) effect map has been prepared (Figure 1). For the creation of this map, indirect remote measurement using satellite and aerial sensors that detect radiation emitted by surfaces was used. This type of map shows the surface urban heat island effect as a temperature difference between surfaces such as roofs and tree canopies or open fields and parking lots []. For the data, an atmospherically corrected surface reflectance dataset from Landsat 8 TIRS at 100 m spatial resolution was used to produce a multi-temporal median composite from 1 January 2019 to 31 December 2020. From this, an NDVI (Normalized Difference Vegetation Index) was calculated as part of the data needed for the SUHI formula []. Regarding the method, the surface urban heat island (SUHI) formula [] was used, and the ArcGIS program [] was used to produce the map.
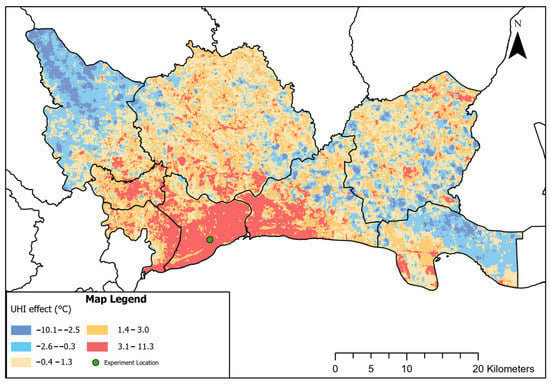
Figure 1.
Surface urban heat island (SUHI) effect in Santo Domingo [,], and the location of the experiment in the green dot.
Figure 1 presents the difference between the mean surrounding vegetation temperature and the land surface temperature per pixel in the urban environment of Santo Domingo, where there is a large area in red corresponding to the urban overcrowding that the city has suffered over the years. In this area, higher temperature differences were recorded around the Energy Efficiency and Renewable Energy Laboratory of the PUCMM located in the “Polígono Central”, from 3.1 °C to 11.3 °C, where the experimentation of the case study presented in this paper was carried out (green dot).
2.3. General Climate Conditions in Santo Domingo
According to the Köppen–Geiger climate classification, the Dominican Republic has a Tropical Savanna Climate (Aw) [], with two climatic periods, a dry season (December–February) and a wet season (May–October), and with periods of heavy rainfall and hurricane seasons []. The annual average temperature is 26.1 °C. The warmest month, on average, is June, with an average temperature of 27.2 °C, and the coolest month on average is January, with an average temperature of 24.4 °C []. The yearly average relative humidity is 80%, and the average wind speed is 2.22 m/s []. The annual average amount of precipitation in Santo Domingo is 1384.3 mm []. In Santo Domingo, the average daily global horizontal irradiance is 6.4 kWh/m2/day []. Figure 2 presents the annual temperature range and the radiation range chart for Santo Domingo.
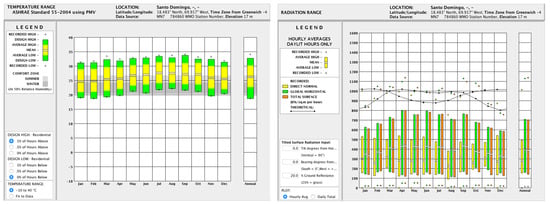
Figure 2.
Temperature range (left) and radiation range (right) charts for Santo Domingo [].
2.4. Experimental Setup
This study was carried out in two experimental test cells located in the Laboratory of Energy Efficiency and Renewable Energies (36 m above ground level on the roof of the building of the Faculties of Health Sciences and Engineering) of the Pontificia Universidad Católica Madre y Maestra (PUCMM), Santo Domingo Campus in the Dominican Republic. A living wall system (M1) and a reference façade (M2) were monitored in real conditions. The study samples were south facing, and different sensors and devices were used. The experiments were carried out as a passive system from July to August 2022, during the warmer months. Six consecutive days (21–26 July) were graphed for better presentation of the results and to compare daytime and nighttime behavior. The day of 23 July was selected.
The data and results obtained in this research are directly comparable because they have the same physical behavior and errors, because the methodology used is the most appropriate and reliable for this type of experiment, since the data enable comparing technologies assembled in twin cells and under the same weather conditions using identical equipment. In addition, as five of the six walls have high levels of insulation, the laboratory can be classified as a “guarded test cell” [].
2.5. Description of Test Cells
The test cell utilized in this study has an exterior dimension of 3 3 3 m, and interior dimensions of 2.04 m wide and 2.04 m high. The depth of the cell will vary depending on the thickness of the test sample. The test sample is separated from the floor by 90 cm. These test cells have wheels to allow rotation and to evaluate the façades in different orientations. The samples were south facing, with the Caribbean Sea in front of the Laboratory. The main structure of the modules is made of laminated steel and has a steel frame as a substructure that houses the glass wool insulation, fastened with plywood boards. In the interior, expanded polystyrene (EPS) was installed and bordered with plywood, which serves as an interior finish. On the outside, an aluzinc sheet that serves as a finish was installed. The free space for the placement of the samples is 2.04 × 2.04 m. The total thickness of the walls is 0.51 m, and the thermal transmittance is 0.0439 W/m2·K [,].
2.6. Samples Configuration
2.6.1. Living Wall System (M1—Module 1)
The living wall system was composed of two sections: the support structure and the container system. The structure was formed of a 6″ (152.4 mm) concrete block with 20 mm of cement mortar on both sides. The container system was made up of 25 mm recycled polyethylene board and a geotextile mesh, which creates pockets where the substrate and plants were placed (Figure 3a). This sample has a thermal transmittance of 1.142 W/m2·K []. Sansevieria trifasciata ‘Hahnii’, belonging to the Asparagaceae family, Crassuloideae subfamily and Sansevieria genus, was the plant used for this study []. Drip irrigation was programmed at 7:00 am every day for a period of 10 min.
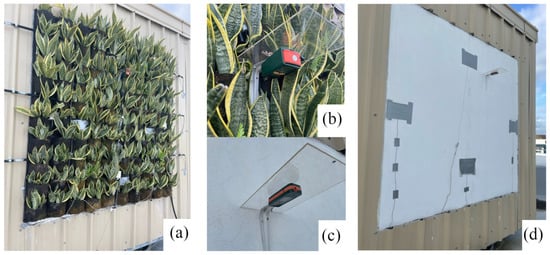
Figure 3.
(a) General view of the living wall system. (b) Datalogger in the LWS. (c) Datalogger in the reference façade. (d) General view of the reference façade.
2.6.2. Reference Façade (M2—Module 2)
The façade selected as a reference (Figure 3d) is one of the most used in the Dominican Republic and is made of the same materials as the supporting structure of the LWS: a 6″ (152.4 mm) concrete block, plus 20 mm of cement mortar on both sides, with 1.907 W/m2·K of thermal transmittance [].
2.7. Monitoring and Control Systems
Monitoring was carried out during the warmer months to evaluate the incorporation of a living wall system, which improves the environmental conditions in its immediate surroundings; an RHT20 humidity and temperature datalogger [] was installed at 10 cm separation from the study samples and at a height of 2.3 m from the ground (Figure 3b,c). In addition, four surface temperature sensors were placed on the outside façade of each sample (Figure 4a,b). The laboratory has a Davis Vantage Pro 2 weather station [], which was used to measure outdoor weather conditions, registering wind direction, wind speed, air temperature, relative humidity, solar radiation, barometric pressure, dew point, etc. (Figure 4c). The data of the surface temperature and the weather station were recorded every minute in a programmable automation controller, known as PAC; however, for this study they were resampled every 30 min to obtain more understandable figures []. To create graphs, the .csv files generated from the measured variables were used. Table A2 presents the characteristics of the sensors (Appendix A, Table A2), and Figure 4 shows the sensors used.
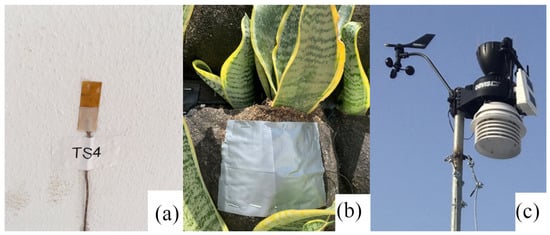
Figure 4.
General view of the sensors: (a,b) surface temperature in the samples. (c) Weather station.
2.8. Infrared Thermography (IRT)
Evaluation of the surface temperature of buildings can be carried out through the application of infrared thermography, which is a non-destructive technique that presents a wide variety of applications due to its unique capabilities. Currently, there are two approaches for thermography inspections: active and passive. The passive approach measures the difference in temperature of the object produced by standard conditions, while the active approach measures the temperature differences of the object by considering outside stimulation []. Passive thermography was used in this study.
A model T420 thermal camera from FLIR Systems was utilized to carry out the thermograms. This camera has 240 × 320 pixels of IR resolution, FOL 18 mm objective, FOV of 25° × 19°/0.4 m, spatial resolution (IFOV) of 1.36 milliradians and a spectral range of 7.5 to 13 microns. In this research the thermal range used was −20 °C to 120 °C, and the procedure followed was based on UNE-EN 13187: 1998/ISO 6781: 1983 modified: “Thermal performance of buildings. Qualitative detection of thermal irregularities in building envelopes. Infrared method” []. The emissivity values of the construction materials (mortar: 0.92 and geotextile: 0.94) [] were considered, enabling an accurate temperature value.
The thermal images were performed on a typical tropical sunny day, under normal drying conditions, in the morning between 09:30 am and 10:30 am, on 28 July 2022. Flir Tool+ software, version 6.4.18039.1003, was used to adjust some of the environmental parameters after taking thermograms, as well as to measure the temperature by placing points or rectangles. The iron color palette was used, where blue is the coldest temperature and yellow is the highest temperature, thus identifying the coldest point in the thermal images.
3. Results and Discussion
3.1. Effect of LWS on Outdoor Air Temperature
Figure 5a shows the comparison between the outdoor air temperature and the outdoor air temperature at 10 cm from the living wall system—LWS (M1) and the reference façade (M2). During the selected days, the pattern of behavior was quite similar in each test cell, with small variations. However, the outdoor air temperature located at 10 cm from the LWS presented a lower temperature than the reference façade, with some exceptions, with a maximum difference between them of 16.6 °C (25 July—13:00 h), a minimum of 0.1 °C (21 July—5:30 h) and an average of 5.3 °C. In the case of M1, the outdoor air temperature at 10 cm from the sample reached a maximum of 36.5 °C, while in M2 the maximum was 42.3 °C. In both cases, the outdoor air temperatures at 10 cm from the samples were higher than the outdoor air temperature, with some exceptions. It is important to note that these higher temperature values at M1 and M2 are due to the surface material of the samples. In the case of M1, the geotextile is black and therefore absorbs more radiation, and in the case M2, the white surface reflects more radiation, thus affecting the conditions near the samples. The phenomena shown in this situation are due to the walls receiving shortwave solar radiation and longwave thermal radiation. The net radiation absorbed by the wall’s external surface is both transferred from the wall to the outdoor air and transferred to the interior. Any exterior surface receiving solar radiation will transfer heat to the air layer close to the façade, increasing the air temperature; on the LWS façade, this temperature increase is lower than on the reference façade.
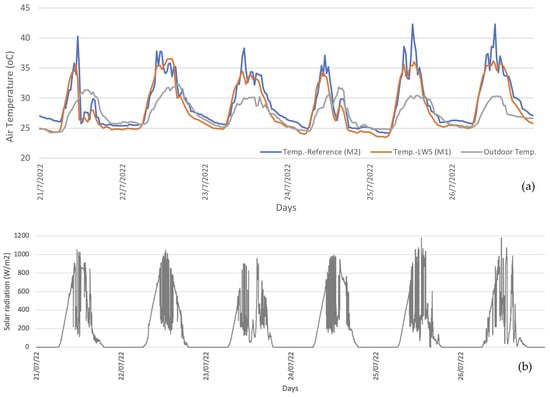
Figure 5.
(a) Air temperature profiles during the selected days (21–26 July). (b) Solar radiation.
During the daytime, the outdoor air temperature registered at 10 cm from the LWS was more stable to the effect of solar radiation (Figure 5b) than the air temperature measured at 10 cm from the reference façade, which presented more abrupt fluctuations.
The findings indicate that when implementing a living wall system as a façade on a building, the outdoor air temperature near the LWS decreases, thus contributing to the improvement of the urban microclimate. Similar studies carried out in tropical or subtropical climates [,] and those in other climatic zones confirm that the incorporation of green façades on buildings helps with the reduction of the air temperature [,,,]. Alsaad et al., found that a living wall reduced the radiant temperature by up to 3.04 K []. Susca et al., indicated that a south orientation façade had the best UHI mitigation potential, of up to 8 °C []. Shafiee et al., showed that a panel living wall system can reduce the ambient air temperature by up to 8.7 °C. In addition, a living wall reduces temperature fluctuations by decreasing the maximum and increasing the minimum temperatures of ambient air []. Herath et al., confirmed that green walls and green roofs significantly reduce outdoor air temperature []. In addition, Oquendo-Di Cosola et al., demonstrated in their review that in humid subtropical climates, continuous green walls can achieve temperature reductions of between 1.1 °C and 14 °C, while modular green walls range between 6.1 °C and 20.8 °C [].
Figure 6a shows the daily behavior of the outdoor air temperature and the outdoor air temperature located at 10 cm from the LWS (M1) and the reference façade (M2). It can be observed that from dawn, the outside temperature increases; the outdoor air temperatures at 10 cm from the samples also increase in both test cells. This temperature continues to rise and after sunset begins to drop. The maximum difference between M1 and M2 was 15.0 °C (11:30 h), the minimum was 0.1 °C (23:00 h) and the average was 3.3 °C. In the case of M1, the outdoor air temperature at 10 cm from the sample reached a maximum of 35.6 °C, while in M2 the maximum was 40.3 °C. In both cases, the outdoor air temperatures at 10 cm from the samples were higher than the outdoor air temperature, with some exceptions. During the daytime, from 10:00 h to 12:00 h, solar radiation (Figure 6b) is higher, and thus a sharp increase in the outdoor air temperature of the reference façade can be observed while the increase of the LWS façade is less abrupt.
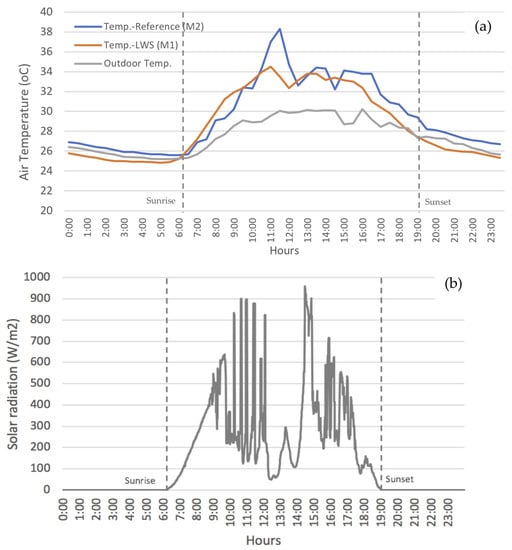
Figure 6.
(a) Daily air temperature profiles of both samples. (b) Solar radiation.
At night, the outdoor air temperature located at 10 cm from the LWS (M1) drops below the exterior temperature, while the reference façade (M2) remains above it. The difference between them is less than two degrees. Nevertheless, this small difference is not trivial, as the upper temperature limit to fall asleep is set at 26 °C. The outdoor air temperature at the LWS (M1) remains under 26 °C, while the outdoor air temperature at the reference façade (M2) is above 26 °C. The impact of this small temperature difference is related to the possibility of using night ventilation for free cooling or the need to use active cooling systems to be able to sleep.
3.2. Surface Temperature Performance Measured with Sensors
Figure 7 presents the surface temperatures that occur on the geotextile mesh in the living wall system (M1) and on the external cement mortar of the reference façade (M2). It can be observed that each of the surface temperatures (M1 and M2) maintains a pattern of behavior throughout the selected days. In the case of the LWS (M1), there is greater fluctuation than for the reference façade (M2). The maximum surface temperature in M1 was 41.1 °C and the minimum was 16.8 °C, while in M2 the maximum was 38.2 °C and the minimum was 26.0 °C. It is important to note that these higher temperature values at the LWS (M1) are due to the color of the geotextile, which is black, absorbing more radiation, while the reference façade (M2) reflects more radiation due to its white surface.
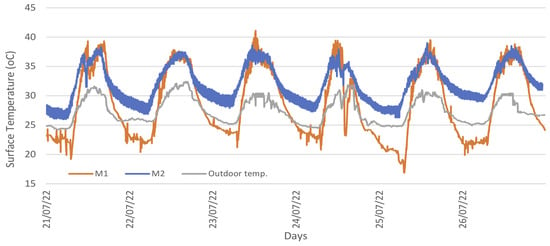
Figure 7.
Surface temperatures during the selected days (21–26 July).
Similar studies such as Abdulateef and Al-Alwan (2022) indicate that green infrastructure has an apparent role in reducing surface temperature []. Jiang et al., showed that the average external surface temperature reductions on different façades were 4.5 °C, 4.2 °C and 9.7 °C on sunny days []. Furthermore, Vox et al., observed that during warm days the surface temperature on a green wall was lower than on a reference façade by up to 9 °C [].
The daytime and nighttime superficial thermal performance of one day in both modules (M1 and M2) is presented in Figure 8. It can be seen that from sunrise, practically all temperatures begin to increase as expected, and the surface temperatures begin to decrease in the middle of the day. The living wall system presents a greater fluctuation than the reference façade; M1 even has the highest values in the middle of the day. The maximum surface temperature on the geotextile mesh in the LWS (M1) was 40.5 °C and the minimum was 21.2 °C, while on the external cement mortar on the reference façade (M2), the maximum was 37.9 °C and the minimum was 27.9 °C.
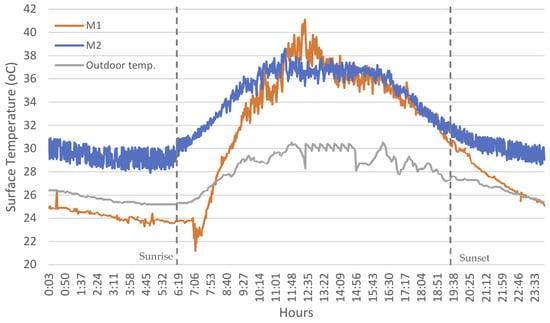
Figure 8.
Daily surface temperatures in the LWS and reference façade.
3.3. Surface Temperature Performance Applying IRT
Figure 9a,b shows thermograms for an overview and detail of the living wall system (M1), while Figure 9c shows an overview of the reference façade (M2). It can be seen in Figure 9a that in the LWS there are areas of moisture that correspond to the pockets that contain the substrate; this can be seen in detail in Figure 9b. In the case of M2, it can be observed that on the whole, the façade presents similar temperatures on its entire surface, except for the points where the sensors are installed, which present higher temperatures.
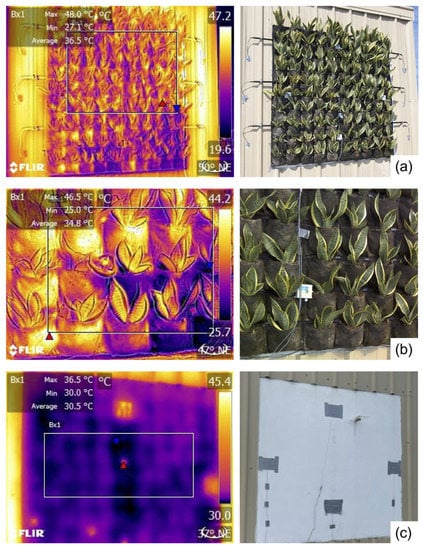
Figure 9.
Thermal images of the samples. (a,b) Living wall system and (c) reference façade.
The maximum surface temperature in M1 was 48.0 °C, with a minimum of 27.1 °C, while the average was 36.5 °C (Figure 9a). In the LWS the maximum surface temperature was 46.5 °C, with a minimum of 25.0 °C and an average of 34.8 °C. In the reference façade, the maximum surface temperature was 36.5 °C, with a minimum of 30.0 °C, while the average was 30.5 °C (Figure 9c).
3.4. Effect of LWS on Outdoor Relative Humidity
Figure 10 shows the outdoor relative humidity and the outdoor relative humidity located at 10 cm from the samples. It can be observed that each of the samples presents a similar behavior pattern during the selected days. However, the reference façade (M2) presents the greatest difference in outdoor relative humidity, with the lowest and highest values. The maximum difference in percentage of outdoor relative humidity between LWS (M1) and the reference façade (M2) was 66% (21 July—11:00 h), and the minimum was 0.7% (23 July—20:30 h). In the case of M1, the outdoor relative humidity at 10 cm from the sample reached a maximum of 97.5% and a minimum of 48.5%, while in M2 the maximum was 100% and the minimum was 27.5%. Outdoor relative humidity was outside the comfort range (40–60%) for most hours of the day, except for the periods when solar radiation and temperature were higher.
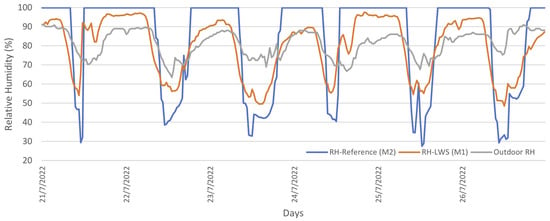
Figure 10.
Relative humidity profiles during the selected days (21–26 July).
In addition, it was seen that M1 and M2 located at 10 cm from the samples present a higher and lower percentage of outdoor relative humidity compared to the outdoor relative humidity. Analogous studies carried out in tropical climatic areas, as well as in other different climatic areas, confirm this performance [,]. Alsaad et al., found that a living wall had an impact on relative humidity for buildings, which was increased by a maximum of 5.07% []. Furthermore, Vox et al., indicated that air relative humidity in an experiment carried out in Italy was in the range of 30–60% [].
Figure 11 presents the comparison between M1 and M2 for one day (23 July) regarding the outdoor relative humidity. It can be observed that from dawn, the outdoor relative humidity at 10 cm from the samples starts to decrease following the behavior pattern of the outdoor relative humidity; however, in M2 this decrease starts later, at around 8:00 h, and when it starts to get dark the outdoor humidity increases again. The maximum difference in percentage of outdoor relative humidity between LWS (M1) and the reference façade (M2) is 66% (11:00 h), and the minimum is 0.9% (9:00 h). In the case of M1, the outdoor relative humidity at 10 cm from the sample reaches a maximum of 96.6% and a minimum of 54%, whereas in M2 the maximum is 100% and the minimum is 32.1%. In addition, it can be said that the incorporation of this typology of LWS regulates relative humidity near the façade, improving the urban microclimate compared to the reference façade. This is due to the thermoregulatory effect of green walls generated by photosynthesis and evapotranspiration of plant leaves, which is called the thermal balance of vegetation [].
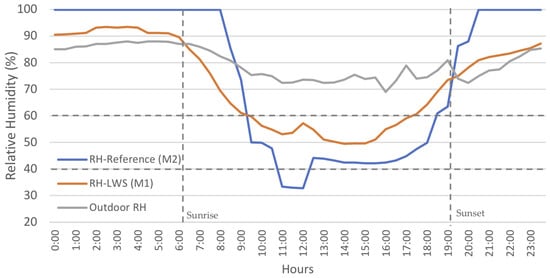
Figure 11.
Daily relative humidity profiles of both samples.
Regarding relevant quantities, it can be said that for the day (25 July—13:00 h) of maximum difference in outdoor air temperature (located at 10 cm from the samples) between M1 (living wall system) and M2 (reference façade), the relative humidity in M1 was 56.6% and was 27.5% in M2, whereas the surface temperatures in M1 and M2 were 31.6 °C and 33.7 °C, respectively. However, the day on which the maximum difference in relative humidity occurred (located at 10 cm) between both samples was 21 July—11:00 h, when the air temperature in M1 was 33.1 °C and in M2 was 40.3 °C, and the surface temperatures in M1 and M2 were 29.2 °C and 31.7 °C, respectively.
4. Conclusions
The objective of this research was to perform a comparative evaluation of a living wall system located in a tropical climate as a strategy to contribute to the improvement of the urban microclimate in the Dominican Republic, and as a response to the lack of experimental research on green façades in the Caribbean. For this purpose, a living wall system (LWS) (M1) and a reference façade (M2) were monitored in two experimental cells located in Santo Domingo, Dominican Republic during the warmer months.
The major finding of this analysis is that through implementing a living wall system as a façade on a building, the outdoor air temperature near the LWS decreases. During the days selected, the average temperature difference between M1 compared to the reference façade (M2) was 5.3 °C, whereas during one day the average was 3.3 °C.
Concerning surface temperature, the results revealed that the LWS (M1) presents a greater fluctuation than the reference façade (M2). The maximum surface temperature in M1 was 41.1 °C and the minimum was 16.8 °C, while in M2 the maximum was 38.2 °C and the minimum was 26.0 °C. In this case it is important to note that these higher temperature values in the LWS are due to the color of the geotextile, which is black, absorbing more radiation, while the reference façade, having a white surface, reflects more radiation. This behavior was confirmed with the results obtained with the IRT. At building level, an LWS will moderate the outdoor surface temperature, which will lower the surface temperature to which pedestrians are exposed, affecting the street climate.
In the specific conditions of this study, the lowest percentage of relative humidity in the middle of the day occurred on the reference façade, followed by the LWS, with both samples presenting lower percentages than the exterior relative humidity. The relative humidity is higher than the comfort range during the nighttime.
From the data of outdoor temperature and relative humidity, it can be concluded that during the period monitored, the outdoor air was never within the comfort range (21–26 °C; 40–60%). Nevertheless, the reduction of temperature and relative humidity at night will reduce the consumption of HVAC systems, which will reduce CO2 emissions and anthropogenic heat. In this research it has been proven that in tropical weather conditions, an LWS absorbs the sun’s energy, providing shade and performing evapotranspiration, resulting in cooler surfaces, regulating the humidity and reducing urban temperatures.
The findings in this research help fill the lack of experimental studies of living wall systems installed in tropical climates, confirming that an LWS is an effective means of improving the urban microclimate, which contributes to the reduction of the urban heat island. However, the research presented in this paper can be further deepened by applying the monitoring period to colder months, as well as by increasing the number of sensors at different distances from the green façade to quantify how far the implementation of a green façade affects the urban microclimate. On the other hand, it would be interesting to evaluate other types of vegetation to make comparisons and verify which of these typologies would be the most suitable for a humid tropical climate. Additionally, it would be of interest to evaluate the green façades on several buildings located in different urban morphologies to determine which layout would have better performance and provide a better solution for the urban microclimate, as well as carry out simulations to compare with the data obtained experimentally.
Author Contributions
L.R.-V.: conceptualization, writing—original draft, visualization, supervision, methodology, investigation, data curation, funding acquisition and formal analysis. B.A.: writing—review and editing, and methodology. J.F.-G.: writing—review and editing, and methodology. V.F.-S.: writing—review and editing, methodology, investigation and conceptualization. O.M.-L.: writing—original draft, visualization and data curation. J.F.: Writing—review and editing, methodology and investigation. All authors have read and agreed to the published version of the manuscript.
Funding
This research was funded by FONDOCYT 2018-2019 and FONDOCYT 2020–2021, MESCyT—Ministry of Higher Education Science and Technology, grant number 2018–2019-3C1-069 and 2020–2021-3B1-067, FAVE Project “Experimental characterization of the thermal behavior of green facades as a passive system for energy saving in buildings and CO2 capture”, and VENTACK Project “Development of a convective ventilation device or “Stack” to provide a comfortable and healthy environment”. The authors also want to thank Project PID2020-114873RB-C32 funded by MCIN/AEI/10.13039/501100011033.
Data Availability Statement
Not applicable.
Acknowledgments
The authors thank Isabela Pichardo for developing the SUHI map of Santo Domingo. In addition, the authors would like to thank Luis Montero, Isaac Ramos, Madelaine Batista and Esmeralda Rodríguez for their help as research assistants.
Conflicts of Interest
The authors declare no conflict of interest. The funders had no role in the design of the study; in the collection, analyses or interpretation of data; in the writing of the manuscript; or in the decision to publish the results.
Appendix A
Appendix A.1. Demographic Level of Santo Domingo
The city of Santo Domingo is made up of the demarcations of the National District and Santo Domingo (Municipalities of Santo Domingo Oeste, Los Alcarrizos, Pedro Brand, Santo Domingo Este, Guerra, Boca Chica and Santo Domingo Norte). Land use in the City of Santo Domingo, out of a total of 1393.78 km2 (2.95% of the national territory), is divided into: 47.22% agricultural, 30.92% natural, 21.84% urban and 0.02% aquifer []. Table A1 presents the characteristics of the city at a demographic level.

Table A1.
Population and surface data of Santo Domingo [].
Table A1.
Population and surface data of Santo Domingo [].
| Zone | Area (km2) | Density (Inhab/km2) | Population |
|---|---|---|---|
| Distrito Nacional | 91.58 | 10,537.67 | 965,040 |
| Santo Domingo | 1302.20 | 1823.35 | 2,374,370 |
| Total | 1393.78 | 3,394,410 |
Appendix A.2. Temperature in Santo Domingo from 1976 to 2018
Figure A1 shows the maximum, minimum and average temperature in Santo Domingo from 1976 to 2018, where it can be observed that the maximum temperature difference in this period was 1.8 °C, the minimum temperature difference was 3.3 °C and the average temperature difference was 2.2 °C. This confirms that there has been an increase in temperature over these 42 years [].

Figure A1.
Maximum, minimum and average temperature in Santo Domingo from 1976 to 2018.
Appendix A.3. Sensor’s Characteristics
Table A2 presents the characteristics of the sensors used in this study.

Table A2.
Sensors’ specifications [,].
Table A2.
Sensors’ specifications [,].
| Sensor | Location | Unit | Precision Level | Error Level |
|---|---|---|---|---|
| Superficial temperature | Sample | °C | N/A | ±2.2 °C |
| Air temperature | Sample | °C | ±1.0 °C (−10 to 40 °C) ±2.0 °C (all other ranges) | N/A |
| Relative humidity | Sample | % RH | ±3%RH (40 to 60%) ±3.5%RH (20 to 40 and 60 to 80%) ±5%RH (0 to 20 and 80 to 100%) | N/A |
N/A: Not available.
References
- Kim, H.H. Urban heat island. Int. J. Remote Sens. 1992, 13, 2319–2336. [Google Scholar] [CrossRef]
- Cui, F.; Hamdi, R.; Yuan, X.; He, H.; Yang, T.; Kuang, W.; Termonia, P.; De Maeyer, P. Quantifying the response of surface urban heat island to urban greening in global north megacities. Sci. Total Environ. 2021, 801, 149553. [Google Scholar] [CrossRef] [PubMed]
- Marando, F.; Heris, M.P.; Zulian, G.; Udías, A.; Mentaschi, L.; Chrysoulakis, N.; Parastatidis, D.; Maes, J. Urban heat island mitigation by green infrastructure in European Functional Urban Areas. Sustain. Cities Soc. 2022, 77, 103564. [Google Scholar] [CrossRef]
- Wang, X.; Li, H.; Sodoudi, S. The effectiveness of cool and green roofs in mitigating urban heat island and improving human thermal comfort. Build. Environ. 2022, 217, 109082. [Google Scholar] [CrossRef]
- Wang, C.; Ren, Z.; Dong, Y.; Zhang, P.; Guo, Y.; Wang, W.; Bao, G. Efficient cooling of cities at global scale using urban green space to mitigate urban heat island effects in different climatic regions. Urban For. Urban Green 2022, 74, 127635. [Google Scholar] [CrossRef]
- Zheng, T.; Qu, K.; Darkwa, J.; Calautit, J.K. Evaluating urban heat island mitigation strategies for a subtropical city centre (a case study in Osaka, Japan). Energy 2022, 250, 123721. [Google Scholar] [CrossRef]
- Koch, K.; Ysebaert, T.; Denys, S.; Samson, R. Urban heat stress mitigation potential of green walls: A review. Urban For. Urban Green 2020, 55, 126843. [Google Scholar] [CrossRef]
- Balany, F.; Ng, A.W.M.; Muttil, N.; Muthukumaran, S.; Wong, M.S. Green Infrastructure as an Urban Heat Island Mitigation Strategy—A Review. Water 2020, 12, 3577. [Google Scholar] [CrossRef]
- Susca, T.; Zanghirella, F.; Colasuonno, L.; Del Fatto, V. Effect of green wall installation on urban heat island and building energy use: A climate-informed systematic literature review. Renew. Sustain. Energy Rev. 2022, 159, 112100. [Google Scholar] [CrossRef]
- Czáder, K.; Balczó, M.; Eichhorn, J. Modelling of Flow and Dispersion in A Street Canyon with Vegetation by Means of Numerical Simulation; BME Áramlástan Tanszék: Budapest, Hungary, 2009. [Google Scholar]
- Herath, H.M.P.I.K.; Halwatura, R.U.; Jayasinghe, G.Y. Modeling a Tropical Urban Context with Green Walls and Green Roofs as an Urban Heat Island Adaptation Strategy. Procedia Eng. 2018, 212, 691–698. [Google Scholar] [CrossRef]
- Herath, H.M.P.I.K.; Halwatura, R.U.; Jayasinghe, G.Y. Evaluation of green infrastructure effects on tropical Sri Lankan urban context as an urban heat island adaptation strategy. Urban For. Urban Green 2018, 29, 212–222. [Google Scholar] [CrossRef]
- Shafiee, E.; Faizi, M.; Yazdanfar, S.A.; Khanmohammadi, M.A. Assessment of the effect of living wall systems on the improvement of the urban heat island phenomenon. Build. Environ. 2020, 181, 106923. [Google Scholar] [CrossRef]
- Shahidan, S.; Martha, H.G.; Moriwaki, R.; Awaludin, A.; Supraba, I.; Utami, S. Outdoor Micro-Climate Analysis of Green Buildings on Environmental Affects Using PALM Software. Int. J. Integr. Eng. 2021, 13, 268–280. [Google Scholar]
- Alsaad, H.; Hartmann, M.; Hilbel, R.; Voelker, C. The potential of facade greening in mitigating the effects of heatwaves in Central European cities. Build. Environ. 2022, 216, 109021. [Google Scholar] [CrossRef]
- Abdulateef, M.F.; Al-Alwan, H.A.S. The effectiveness of urban green infrastructure in reducing surface urban heat island. Ain Shams Eng. J. 2022, 13, 101526. [Google Scholar] [CrossRef]
- Ciacci, C.; Banti, N.; Di Naso, V.; Montechiaro, R.; Bazzocchi, F. Experimentation of Mitigation Strategies to Contrast the Urban Heat Island Effect: A Case Study of an Industrial District in Italy to Implement Environmental Codes. Atmosphere 2022, 13, 1808. [Google Scholar] [CrossRef]
- Price, A.; Jones, E.C.; Jefferson, F. Vertical Greenery Systems as a Strategy in Urban Heat Island Mitigation. Water Air Soil Pollut. 2015, 226, 247. [Google Scholar] [CrossRef]
- Chun, B.; Guldmann, J.M. Impact of greening on the urban heat island: Seasonal variations and mitigation strategies. Comput. Environ. Urban Syst. 2018, 71, 165–176. [Google Scholar] [CrossRef]
- Vox, G.; Blanco, I.; Schettini, E. Green façades to control wall surface temperature in buildings. Build. Environ. 2018, 129, 154–166. [Google Scholar] [CrossRef]
- Cortorreal, G.M.R.; Peña, J.; Roset, J.; García, A. La infraestructura verde como herramienta de mitigación y adaptación urbana en la ciudad de Santo Domingo, República Dominicana. In Proceedings of the 13th Congreso Internacional Ciudad y Territorio Virtual, Barcelona, Spain, 2–4 October 2019. [Google Scholar] [CrossRef]
- Jiang, C.; Zhou, Y.; Li, K.; Wei, D. Impact of green roof and green facade on building thermal performance and carbon sequestration in subtropical climate of China. J. Build. Phys. 2023, 46, 602–629. [Google Scholar] [CrossRef]
- Pragati, S.; Priya, R.S.; Pradeepa, C.; Senthil, R. Simulation of the Energy Performance of a Building with Green Roofs and Green Walls in a Tropical Climate. Sustainability 2023, 15, 2006. [Google Scholar] [CrossRef]
- Cosola, V.O.-D.; Olivieri, F.; Ruiz-García, L. A systematic review of the impact of green walls on urban comfort: Temperature reduction and noise attenuation. Renew. Sustain. Energy Rev. 2022, 162, 112463. [Google Scholar] [CrossRef]
- Geletič, J.; Lehnert, M.; Resler, J.; Krč, P.; Middel, A.; Krayenhoff, E.S.; Krüger, E. High-fidelity simulation of the effects of street trees, green roofs and green walls on the distribution of thermal exposure in Prague-Dejvice. Build. Environ. 2022, 223, 109484. [Google Scholar] [CrossRef]
- Brea, E.; Domínguez, M.; Roca, L.; Silvestre, R.; Delmonte, J. An Architectural Guide. Santo Domingo, 1st ed.; Fundación Edwin Walter Palm: Santo Domingo, Dominican Republic, 2006. [Google Scholar]
- Ayuntamiento del Distrito Nacional. Plan de Ordenamiento Territorial. Análisis del Contexto Municipal; Ayuntamiento del Distrito Nacional: Santo Domingo, Dominican Republic, 2018. [Google Scholar]
- Health Canada. The Urban Heat Island Effect: Causes, Health Impacts and Mitigation Strategies. 2009. Available online: https://www.canada.ca/en/health-canada/services/environmental-workplace-health/reports-publications/climate-change-health/climate-change-health-adaptation-bulletin-number-1-november-2009-revised-december-2010-health-canada-2009.html (accessed on 3 July 2022).
- Sobrino, J.A.; Irakulis, I. A Methodology for Comparing the Surface Urban Heat Island in Selected Urban Agglomerations Around the World from Sentinel-3 SLSTR Data. Remote Sens. 2020, 12, 2052. [Google Scholar] [CrossRef]
- Environmental Systems Research Institute (ESRI). ArcGIS. Available online: https://www.arcgis.com/index.html (accessed on 1 June 2022).
- Köppen-Geiger. World Climates after Köppen-Geiger. Available online: http://www3.shastacollege.edu/dscollon/images/Maps-Images/world_climate_map.jpg (accessed on 4 March 2022).
- Izzo, M.; Rosskopf, C.M.; Aucelli, P.P.C.; Maratea, A.; Méndez, R.; Pérez, C.; Segura, H. A New Climatic Map of the Dominican Republic Based on the Thornthwaite Classification. Phys. Geogr. 2010, 31, 455–472. [Google Scholar] [CrossRef]
- Weatherbase. Monthly-Weather Averages Summary. Santo Domingo, Dominican Republic. Available online: http://www.weatherbase.com/weather/weather.php3?s=68487&cityname=Santo-Domingo-Nacional-Dominican-Republic (accessed on 21 June 2022).
- Oficina Nacional de Meteorología (ONAMET). Informe del Tiempo. 14 July 2021. Available online: https://onamet.gov.do/m/ (accessed on 6 March 2022).
- Worldwatch Institute. Aprovechamiento de los Recursos de Energía Sostenible de la República Dominicana; Worldwatch Institute: Washington, DC, USA, 2015. [Google Scholar]
- UCLA Energy Design Tools Group. Climate Consultant. 2018. Available online: https://www.sbse.org/resources/climate-consultant (accessed on 15 June 2022).
- Cattarin, G.; Causone, F.; Kindinis, A.; Pagliano, L. Outdoor test cells for building envelope experimental characterization—A literature review. Renew. Sustain. Energy Rev. 2016, 54, 606–625. [Google Scholar] [CrossRef]
- Ruiz-Valero, L.; Faxas-Guzmán, J.; Ferreira, J.; González, V.; Guerrero, N.; Ramirez, F. Thermal Performance of Facades Based on Experimental Monitoring of Outdoor Test Cells in Tropical Climate. Civ. Eng. J. 2021, 7, 1982–1997. [Google Scholar] [CrossRef]
- Ruiz-Valero, L.; Faxas-Guzmán, J.; Arranz, B.; Flores-Sasso, V.; Céspedes, L. Living wall system for improved thermal performance of facades located in tropical climate. Case study in Dominican Republic. Build. Environ. 2022, 222, 109419. [Google Scholar] [CrossRef]
- World of Succulents. Sansevieria Trifasciata ‘Hahnii’. 2022. Available online: https://worldofsucculents.com/sansevieria-trifasciata-hahnii-birds-nest-sansevieria/ (accessed on 15 February 2022).
- EXTECH. RHT20: Humidity and Temperature Datalogger. Available online: https://www.extech.com/products/RHT20 (accessed on 21 August 2022).
- Davis Instruments. Weather Station Vantage Pro2TM. 2022. Available online: https://www.davisinstruments.com/solution/vantage-pro2/ (accessed on 7 February 2022).
- Kylili, A.; Fokaides, P.A.; Christou, P.; Kalogirou, S.A. Infrared thermography (IRT) applications for building diagnostics: A review. Appl. Energy 2014, 134, 531–549. [Google Scholar] [CrossRef]
- EN 13187:1998; Thermal Performance of Buildings. Qualitative Detection of Thermal Irregularities in Building Envelopes. Infrared Method (ISSO 6781:1983 modified). European Committee for Standardization (CEN): Brusels, Belgium, 1998.
- Neila, J. Arquitectura Bioclimática en un Entorno Sostenible, 1st ed.; Munilla-Lería: Madrid, Spain, 2004. [Google Scholar]
- Oficina Nacional de Estadística (ONE). SICEN-Sistema Interactivo de consulta Censo 2010. Available online: http://sicen.one.gob.do/ (accessed on 4 July 2022).
- Oficina Nacional de Meteorología (ONAMET). Temperaturas en República Dominicana, Santo Domingo. Available online: https://onamet.gob.do/ (accessed on 4 July 2022).
Disclaimer/Publisher’s Note: The statements, opinions and data contained in all publications are solely those of the individual author(s) and contributor(s) and not of MDPI and/or the editor(s). MDPI and/or the editor(s) disclaim responsibility for any injury to people or property resulting from any ideas, methods, instructions or products referred to in the content. |
© 2023 by the authors. Licensee MDPI, Basel, Switzerland. This article is an open access article distributed under the terms and conditions of the Creative Commons Attribution (CC BY) license (https://creativecommons.org/licenses/by/4.0/).