Abstract
Glulam beams connected with steel splints and bolts (GBSBs) are subjected to cyclic reciprocating dynamic loads in practice, which eventually leads to damage accumulation and structure failure. In order to promote the development of GBSBs, an experimental study was carried out, and theoretical analysis of the fatigue behavior of GBSBs was conducted. Three static load test beams and six fatigue test beams were designed and fabricated, taking into account the different stress levels and fatigue limit loads. Theoretical analysis of the data, linear regression analysis, and electron microscopy analysis of the material were carried out. The test results show that the GBSBs have good fatigue properties and that fatigue damage mainly occurs near the loading point. As the number of load cycles increases, the mid-span deflection and strain of the beam increase by a significant amount, and linear degradation of the stiffness occurs. In addition, a linear regression analysis of the amplitude of the fatigue load and the fatigue life was carried out, resulting in a fatigue limit load of 0.5435 Fu.
1. Introduction
Glulam is an engineered wood product in which the laminated plies are glued together by means of an adhesive. In recent years, glulam has been widely used in building and bridge construction due to its obvious advantages of environmental protection, light weight, and high strength [1]. With the continuous improvement of glulam production technology, the strength of glulam structures has been improved, and they have been recommended for use in high-rise buildings and long-span bridges by relevant national policies. For instance, steel plywood bolts are usually used to expend the span length of the glulam, so that it can be applied in long-span bridge safely.
At present, many researchers have conducted experimental studies to investigate the engineering behaviors of glulam [2,3,4,5,6,7]. However, most of them considered that the glulam serves under static loads. Previous studies have shown that 80% of engineering structures are damaged and fail due to long-term fatigue. Compared to the static load, fatigue load would increase the deformation and stress. In practice, the glulam may not only be subjected to static loads; dynamic loads caused by human activities, vehicles, machinery, etc., could also be involved.
Previous researchers have conducted experiments to investigate the fatigue characteristics and failure mechanism of wood. For instance, Christian Odin Clorius [8] studied the fatigue performances of a reduced-scale wood element considering the effect of humidity and loading frequency. A relationship between the fatigue life and the loading frequency were obtained under low humidity conditions and a damaged viscoelastic materials (DVM) model under high humidity conditions. Combined with the energy principle and the cumulative damage theory, a fatigue life prediction model was proposed for wood. Madhoushi M. [9] carried out fatigue tests on fiberglass fiber-reinforced plastic (GFRP) reinforced glulam structures. The results show that the fatigue life decreased with the increase in the fatigue limit load. Kyanka G.H. [10] summarized the research progress of the fatigue behaviors of some engineering wood products. He pointed out that there is a lack of corresponding test standards. Molina J.C. [11] studied the effect of adhesive content and wood moisture on the fatigue properties of the glulam. Chaplain M. [12] studied the cyclic torsional damage theory of glulam beams through experiments and numerical simulations and pointed out that a larger load amplitude results in more significant torsional damage. Enam M. et al. [13] evaluated the fatigue behaviors of the emerging Structural Composite Timber (SCL) bridge stringers (LVL and PSL). They indicated that the stringers have a service life of up to 60 years, and their strength and stiffness barely attenuate with time. Hansen L.P. [14] conducted a fatigue test on a 2 m-long European spruce using the four-point bending method and found that the fatigue performance was related to the grain angle of the wood, and the larger the grain angle of the spruce, the worse the fatigue performance. H. Shi et al. [15] and C. Yang et al. [16] conducted three-point fatigue bending experiments on composite sandwich beams with GFRP face sheets and paulownia wood cores. The fatigue failure laws and damage mechanisms were obtained by comparing static and fatigue bending properties between sandwich beams with and without a lattice web. C. Wu [17] conducted an experimental study on the static and fatigue performance of proposed GFRP-timber bolted connections and investigated the effect of bolt diameter, number of bolt rows, number of bolt columns on the static and fatigue behaviors of the connections.
However, most of the existing studies on wood fatigue focus on the fatigue behaviors of glulam beams. Reinforced structures, such as the steel plywood-bolt connection glulam structure mentioned above, are subjected to repeated traffic loads when working as parts of a bridge. It is of great significance to understand the behaviors of these structures under fatigue load, which would provide the basis for improving the fatigue-resistance of GBSBs. In this study, fatigue load tests considering different load levels were conducted. The effects of load amplitude and frequency on the strain and deflection of the GBSBs were tested and analyzed. Static load tests were also conducted as the control group. Their fatigue failure modes and failure mechanisms were compared and analyzed. Regression analyses were conducted finally to correlate the fatigue life and the fatigue load amplitude, which can be used to preliminarily predict the fatigue load limit of a GBSB. This research can guide the design and practical application of GBSB structures.
2. Materials and Methods
2.1. Design and Fabrication of GBSB Beams
Northeast larch was used as the base material, referring to the design specification for wood structures (GB50005-2017) and the American specification ASTM D198-02. These standards also indicate that when the span-to-height ratio of the specimen is not less than 18, the influence of shear deformation can be ignored. Therefore, GBSB beams with 3750 mm in length, 110 mm in width, and 192 mm in height were used. The glulam beams were cut along the mid-span, and the corresponding bolt holes were punched and finally spliced by 8 mm thick Q345 steel plates and 12 mm diameter 8.8 grade bolts. Details of the specimen and the location of the punched holes are shown in Figure 1a. Detailed images of the joints on glulam beams are shown in Figure 1b.
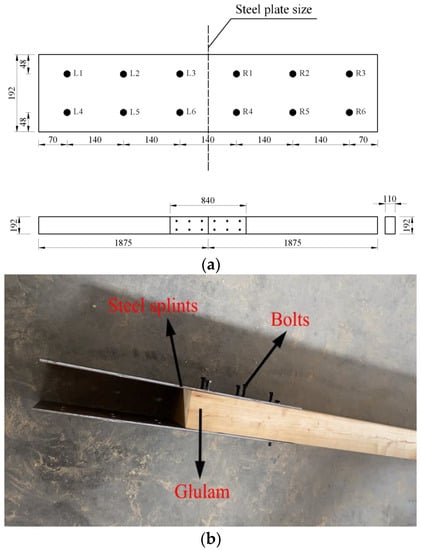
Figure 1.
Specimen construction; (a) schematic diagram of the dimensions of the test components (mm); (b) detailed images of the joints on glulam beams.
Anti-loose design: Tightness between the bolt and the connector would seriously affect the testing results. In the present work, an anti-loosening design was employed to mitigate the abnormal movement. Two retrofitting components, i.e., nylon self-locking lock nut and double-stack self-locking lock washers, were involved in this reforming design.
- (1)
- Nylon self-locking lock nut
As shown in Figure 2a, the nylon self-locking lock nut is characterized by adding a nylon ring to the metal nut. During the installation process, since the inner diameter of the nylon ring is smaller than the outer diameter of the bolt, the thread of the bolt squeezes the nylon embedded in the nut, making the deformation of the nylon fit closely with each thread. Therefore, the nylon and the thread can be completely contacted and extruded. The extruded nylon has a great rebound force on the bolt, which increases the friction between them and decreases the loosening possibility. Moreover, the nylon itself is of good fatigue and vibration resistance.
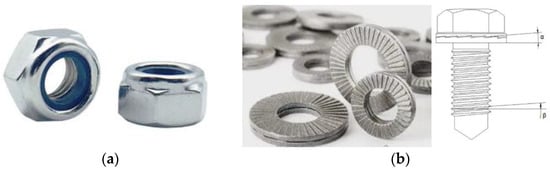
Figure 2.
Anti-loose design: (a) nylon self-locking locknut; (b) double-stack self-locking lock washers.
- (2)
- Double-stack self-locking lock washers
As shown in Figure 2b, the double-stacked self-locking anti-loosening washer contains two independent washers. The wide tooth surface needs to be on the inside, while the narrow tooth surface is on the outside, and the inclination angle of the wide tooth surface should be larger than that of the bolt thread (i.e., α > β). Sliding along the inclined surface can occur between the wide tooth surfaces on the inner side of the two washers, which increases both the tension force and the axial force, thereby achieving an anti-loosening effect. Moreover, a constant torque electric wrench is used to mitigate the adverse influence of the loosening between the bolt and the nut on the fatigue performance.
2.2. Loading Program
All the tests were completed at the Central South University of Forestry and Technology. Both the static load test and fatigue test were completed using an electro-hydraulic servo fatigue testing machine. Four-point bending tests were conducted. To ensure the equipment was in a normal working condition and all the components were well connected, a pre-load was applied at the beginning with a uniform increasing speed of 1 KN/s from 0 to 8 kN. The load was kept at 8 kN for 2 min before unloading.
For tests considering static loads, the static load was applied as multi-step static loading. The stepped increment was 3 kN when the accumulative load was less than 40 kN, while it decreased to 2 kN once the load magnitude reached 40 kN.
Regarding the fatigue loading tests, sinusoidal loads were applied at a loading frequency of 3 Hz. Figure 3 shows the specimen undergoing 3 load cycles in one second. After applying a predetermined load cycle (For example, 0 × 104 cycles, 10 × 104 cycles, 30 × 104 cycles), the beam was unloaded followed by applying a static load onto the specimen to measure its deflection and strain.
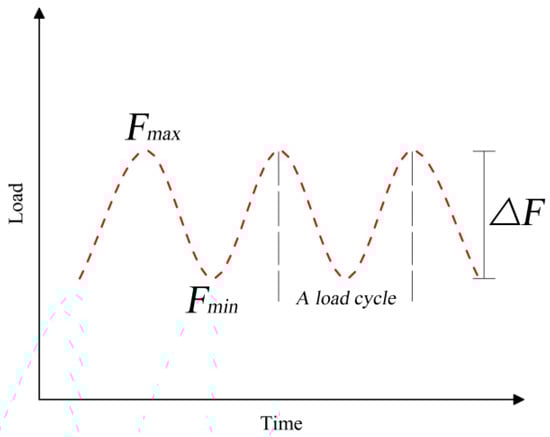
Figure 3.
Loading system.
Allocations of the displacement measurement gauges can be seen in Figure 4. Gauges were installed on both sides of the mid-span, two supports, and under the 1/4 span. Moreover, considering the maximum bending moment generated in the pure bending section of the beam, 5 strain gauges were installed equidistantly along the height direction of the beam (outside the steel plate range). In addition, 2 strain gauges were arranged on the top and bottom surfaces of the beam. Finally, 3 strain gauges were installed equidistantly along the height direction at the mid-span of the steel plate. During the test, a DH3818 static strain acquisition system was used to collect the strain and displacement synchronously. The schematic diagram of the loading is shown in Figure 4. As can be seen from Figure 4b, the span of the beam is 3456 mm, the distance between the two loading points is 1152 mm, and the distance of the support from the end of the beam is 147 mm.
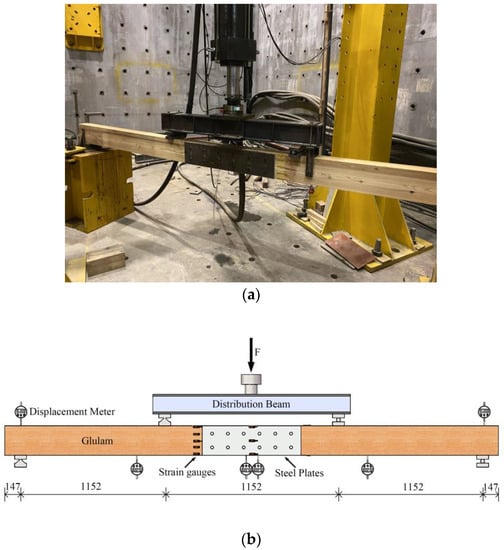
Figure 4.
Schematic diagram of specimen loading; (a) loading device; (b) instrument arrangement.
2.3. Test Conditions
Setup of the test is described in this section from the following several aspects.
- (1)
- Loading condition
In the present study, both static load tests and fatigue load tests were involved. Nine beams were tested. Three of them (named G1, G2, and G3) were tested under static load, and the average value of their static ultimate load (Fu) was 74.3 kN. The other six beams (named F1, F2, F3, F4, F5, and F6) were tested under sinusoidal loads with different stress level. Details are given in Table 1.

Table 1.
Load parameters of fatigue specimens.
- (2)
- Loading frequency and stress ratio
Loading frequency must be appropriately selected for the tests because a high loading frequency would accelerate the heat accumulation of the beam, thereby reducing its moisture content and weakening its fatigue behaviors. On the contrary, a low loading frequency would be more time-consuming. Therefore, a frequency of 1–5 Hz was finally selected according to [9,18,19,20]. The wooden beam is a flexible material, and the resulting deflection is much larger than that of reinforced concrete beams under the same load levels. Thus, the smaller the stress ratio, the larger the stress amplitude, and the larger the deflection amplitude produced. Therefore, the setting of the loading frequency and the selection of the stress ratio are consistent with the displacement amplitude that the instrumentation can achieve under this stress ratio. Taking the above factors into overall consideration, the loading frequency was selected as 3 Hz, and the stress ratio was 0.2.
- (3)
- Moisture content
Engineering properties of GBSBs depend on their moisture content. Molina has proved through experiments that high moisture content significantly reduces the fatigue properties of wood. As a key parameter, the moisture content must be measured before the load test. The moisture content of 10 larch laminated timber elements measuring 20 × 20 × 20 mm was determined, and the moisture content was 10–12%, which meets the test requirements.
- (4)
- Maximum fatigue load cycles
A maximum load cycle of 2 million was generally considered for concrete structures, as specified in GB 50010-2010. This limit number was also adopted for many wood structures [21,22,23]. The present work applied it to GBSBs.
3. Static Testing Results and Analyses
Through conducting static load tests, it has been found that the G1, G2, and G3 behave similarly under the static load. Taking G3 as an example, Figure 5 shows the failure mode of each component of the beam. When the load reached 40.9 kN, the crisp sound appeared for the first time, and the wood fibers on the tension zone began to yield, accompanied by the generation of cracks at the bottom of the beam. As the load increased, the sound of wood fiber tearing appeared constantly in the beam, and the height difference between the two sides of the beam gradually increased. When the load reached 58.6 kN, the beam started to produce popping sounds. Several cracks appeared and extended from the R4 bolt hole to the mid-span of the beam. Meanwhile, the sound of tearing remained. It should be noted that the upper side of the beam did not present obvious longitudinal penetration cracks. The beam showed that the pin grooves yielded first and then sheared along the grain. Finally, many cracks were generated, and the beam failed. However, the bolts did not produce obvious bending deformation.
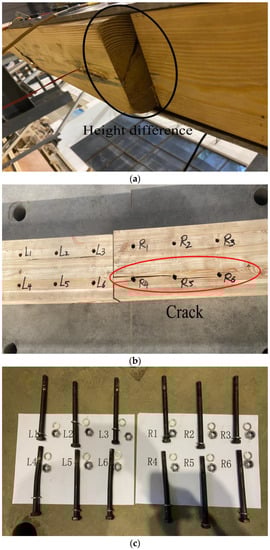
Figure 5.
Static test failure phenomenon diagram: (a) left side wooden beam sinking; (b) beam bottom penetration cracks; (c) bolt bending situation.
The testing results are summarized in Table 2. Regarding both the static ultimate load and the mid-span deflection, the difference between either specimen is not higher than 3.2%. It can be concluded that the specimens have been well prepared with minor differences. The static ultimate load, mid-span deflection, and maximum normal stress were taken as the average of these three specimens, i.e., 74.30 kN, 86.36 mm, and 63.35 MPa, respectively. The static testing results can provide corresponding references for estimating the limit load of the structure under fatigue loads.
Table 2.
Static test results.
In addition, the mid-span deflection curves are shown in Figure 6. It can be seen that the slopes of these curves increase with increasing load at the early stage, indicating that the steel plywood-bolt connection can improve the early stiffness of the glulam beam. The reason is that the applied load at the early stage is relatively small, and the relative slip is small, and they are not capable of overcoming the frictional resistance between the glulam beam and the steel plate. Under such circumstances, the glulam beam and the outer clamp steel plate can work well together, resulting in an increasing stiffness; however, as the load increases, the pressure on each pin groove of the glulam also increases. The stress concentration near the bolt hole results in a plastic deformation of the localized wood. At this time, the load growth rate slows down, and the stiffness gradually decreases. From the present studies, it can be determined that wooden beams exhibit certain plastic properties.
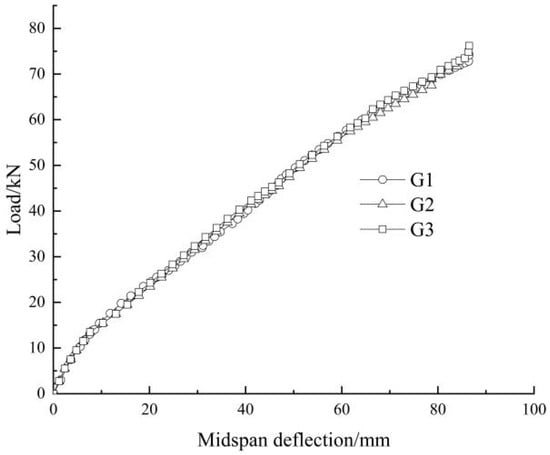
Figure 6.
Static test beam load–deflection curve.
4. Fatigue Test Results and Their Analysis
4.1. Destruction of the Beam
Under the fatigue cyclic loads, both F1 and F2 were not damaged after 2 million load cycles. The fatigue limit loads Fmax of F1 and F2 were 29.72 and 37.15 kN, respectively. In terms of their appearance after loading, no obvious changes were observed for F1, with some slight wrinkles around the loading point only. Regarding the F2, even though it was not completely fractured, the final residual deformation reached 13 mm, and many wrinkles appeared both near the loading point and at the compression zone of the pure bending section. The outermost wood fibers in the compression zone of the glulam beams on both sides of the mid-span truncation line cracked, and the wood beams on both sides of the mid-span truncation line were continuously squeezed under cyclic load conditions, causing the wood fibers to squeeze and embed each other. The glulam beams on both sides slightly settled at the mid-span truncation line. This demonstrates that the glulam beams generated irreversible rotation on both sides. Figure 7 shows the results of F3–F6. The fracture mainly occurred near the loading point. Under the cyclic load conditions, the compression zone first accumulated some fatigue damage and then generated some plastic deflection. The height of the plastic zone on the compression zone then gradually transferred to the tension zone. Consequently, the specimens demonstrated a tensile failure. After 300,000 load cycles, a row of bolt holes on the lower side of the glulam beam on the left side formed a crack throughout, as shown in Figure 7a, and the crack continued to expand with the increasing number of cyclic loads. Meanwhile, the mid-span deflection continued to increase, causing a continuous decrease in the stiffness. However, the appearance of the right part of the glulam beam did not show an obvious failure. From Figure 7b, when load cycles increased to 1.013 million, the right part of the glulam beam broke suddenly. After removing the steel plate, it was found that the threaded portion of the bolt was embedded in the glulam, as shown in Figure 7c. It can be seen that the contact between the glulam pin groove and the bolt became closer under cyclic loads. As shown in Figure 7d,e, Different from F3, the yield of the wood fibers under tension and shear failure along the grain could also be observed for F4 and F5. In addition, wood fiber tears occurred in glulam under high stress. This is because when the load amplitude is high, the height of the plastic zone under compression increases continuously, resulting in a stress redistribution and bulking effect. It is worth noting that F6 failed only after 11,300 load cycles. During the cyclic loading process, no obvious crack propagation phenomenon could be found on its appearance surface. The fatigue damage accumulated rapidly, and finally a sudden brittle failure occurred, as shown in Figure 7f.
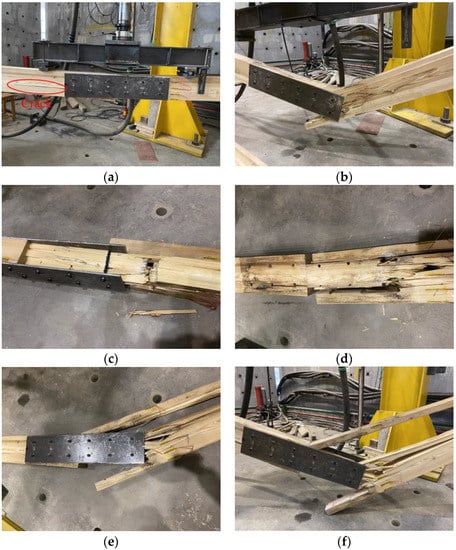
Figure 7.
Fatigue failure morphology of the test beam; (a) crack generation; (b) the right part of the glulam beam broke suddenly; (c) destruction pattern of glulam beam after removal of steel plates; (d) damage pattern of specimen F4; (e) damage pattern of specimen F5; (f) sudden brittle damage of specimen F6.
In addition, the fatigue life and maximum positive stress of each test beam are shown in Figure 8 below.
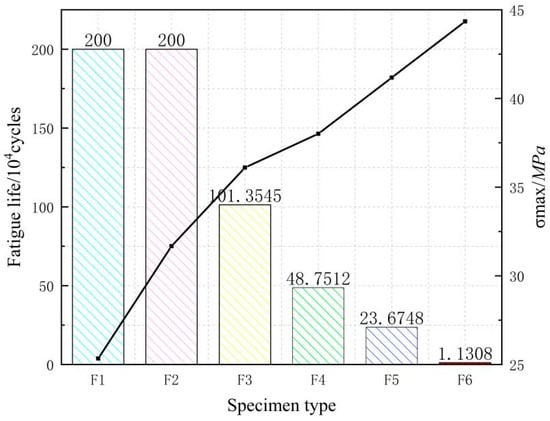
Figure 8.
Fatigue life of specimens.
As can be seen from the graph, specimens F1 and F2 are not fatigue-damaged, and their fatigue life is more than 2 million times; the rest of the specimens are fatigue-damaged.
4.2. Mid-Span Deflection
Figure 9 demonstrates the curves of mid-span deflection versus load amplitude of F2 after several different load cycles. It can be seen that the mid-span deflection changed linearly with the load cycles, indicating that the specimen behaved elastically. As the number of load cycles increased, the mid-span deflection of the beam increased, and the slope of the curve decreased, indicating that the bending stiffness of the beam continuously decreased. This is because the continuous increase in the load cycles resulted in the accumulation of fatigue damage. The mid-span deflection of the beam was increased by 11.83%, and the curve slope was decreased by 10.99% after 1.8 million load cycles.
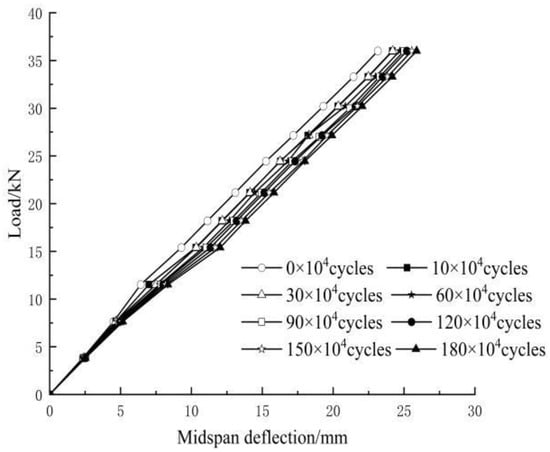
Figure 9.
F2 load-mid-span deflection curve.
4.3. Load–Deflection Ratio
The load–deflection ratio (defined as the ratio of load to mid-span deflection) varies with the number of fatigue cycles to fully reflect the relationship between load and mid-span deflection. The load–deflection ratio versus number of the load cycles is shown in Figure 10.
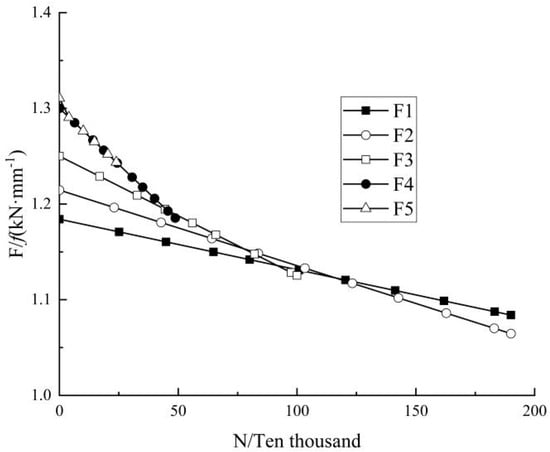
Figure 10.
The curve of load–deflection ratio with the number of cycles.
It can be seen that the load-to-deflection ratios decreased gradually with the increase in the load cycles, indicating the decrease in the beam stiffness. In addition, a larger load amplitude would result in a larger load-to-deflection ratio at the beginning and a larger reduction rate in the late period. After 2 million load cycles, a load–deflection ratio of F1 (Fmax = 0.40 Fu) decreased almost linearly with the increase in load cycles, from 1.184 to 1.085 kN/mm, where a decrease of 5.3% could be observed. After the fatigue tests, when a static load was applied, tensile brittle failure could be observed for one side of the glulam beam, while the other side did not show obvious damage. The test results are shown in Table 3. Compared with the limit load obtained under static load (74.30 kN), this limit load was decreased by 3.23%, indicating that the fatigue cyclic load presents a negligible effect on the static performance of the specimen at relatively low stress levels. In terms of F2 (Fmax = 0.50 Fu), the load–deflection ratio was reduced from 1.214 to 1.064 kN/mm after 2 million load cycles, where a decrease of 12.35% could be observed. Its fatigue limit load was 65.89 kN, 11.31% lower than that obtained through the static load test. It can be seen that the bearing capacity and stiffness of the specimens were weakened with the increase in the load amplitude. Regarding F3, F4, and F5, the load-to-deflection ratio at fatigue failure decreased by 9.968%, 8.815%, and 5.105%, respectively, compared with the initial value.
Table 3.
Static load damage results for specimens F1 and F2.
4.4. Load–Strain Curve
Taking the specimen F1 as an example, after the fatigue cyclic load reached 0, 1.1 million, and 2 million times respectively, the static test measured the strain of the specimen along the section height under various loads. The results are shown in Figure 11.
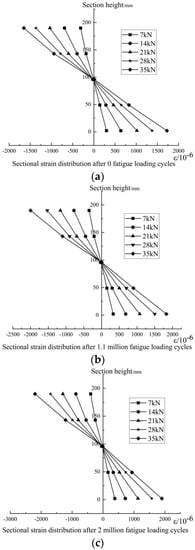
Figure 11.
Load−strain curve of specimen F1; (a) sectional strain distribution after 0 fatigue loading cycles, (b) sectional strain distribution after 1.1 million fatigue loading cycles, (c) sectional strain distribution after 2 million fatigue loading cycles.
It can be seen that, after experiencing the cyclic loads, the strain of the beam basically satisfies the linear variation law along the beam height and is symmetrically distributed up and down along the neutral axis. Both the tensile strain and the compressive strain gradually increased with the increase in load cycles. A more obvious increase could be observed for the compressive strain than the tensile strain. After 1.1 million load cycles of 35 kN, the maximum compressive strain on the compression zone of the test beam was increased by 21.08% compared with that without any cyclic loads. The maximum tensile strain on the tensile side was increased by 6.15%. After 2 million load cycles, the maximum compressive strain on the compression zone of the test beam under the same load was increased by 33.21%, and the maximum tensile strain on the tensile side was increased by 10.22%. In addition, the neutral axis did not shift significantly.
5. Bending Stiffness Degradation
In order to deeply study the fatigue performance of the GBSB, the bending stiffness of the fatigue test beam after each cyclic load was calculated. The mid-span deflection f of an elastic-plastic element under a four-point concentrated bending load can be obtained based on the minimum stiffness principle, which can be written as:
where B is the stiffness; F is the concentrated load applied to the GBSB; L is the span of the glulam beam; b is the slope of the load–deflection curve; k is a coefficient related to the load form and support conditions. For four-point bending tests, k is taken as 23/1296.
Polynomial fitting is performed on the curve of mid-span deflection against load amplitude, and the slope bN of the curve after Nth load cycles can be estimated. The relationship between the stiffness BN and bN is shown in formula (3). The test results are summarized in Table 4, where the number of the load cycles is in the tens of thousands.
Table 4.
Bending stiffness of specimens after N fatigue loading cycles.
Figure 12 demonstrates the changes of bending stiffness degradation with number of cycles. Each beam had different degrees of bending stiffness degradation, and the stiffness gradually decreased with the increase in loading cycles. A nearly linear correlation could be observed. With the increase in load amplitude, the stiffness degradation increased significantly. Regression analyses were carried out on the residual bending stiffness and the number of cycles, which can be expressed as:
where B0 is the initial stiffness of the beam; λ is the degradation rate of the bending stiffness of the test beam, which reflects the change rate of the damage accumulation of the GBSB under fatigue loads; and N is the number of fatigue cycles.
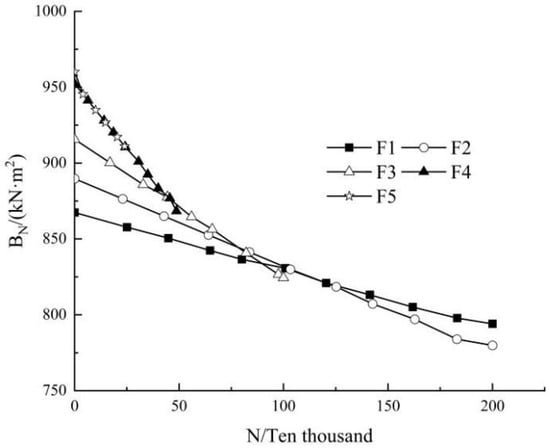
Figure 12.
Measured curve of bending stiffness degradation.
Table 5 lists the test results of the initial bending stiffness, stiffness degradation rate, and failure bending stiffness ratio (the ratio of the bending stiffness to the initial stiffness of the test beam when the test beam fails) under different stress levels. It can be seen that with the increase in the stress level, the bending stiffness degradation rate increased significantly, indicating that with the increase in load amplitude, the damage accumulation of the specimen also increased. It can be seen from the table that the failure bending stiffness ratio of the GBSB was greater than 0.87, indicating that the bending stiffness degradation of the beam slowed down before approaching damage, and damage occurred as soon as the bending stiffness decayed to 0.87 of the initial bending stiffness.
Table 5.
Test results of bending stiffness degradation of test beams.
6. Fatigue Life and Fatigue Limit Load
Table 6 lists the fatigue life of each test beam under different stress levels, Figure 8 compares the fatigue life and stress relationships for each specimen.
Table 6.
Test beam fatigue life.
It can be seen that the fatigue life of the GBSB gradually decreased with the increase in the stress level. When the stress level was 0.4 and 0.5 Fu, the fatigue life of the beams is over 2 million load cycles. However, the stress level of 0.5 Fu resulted in a more obvious fatigue damage to the specimen than 0.4 Fu. There existed more wrinkles on the compression zone of the pure bending section, and the outermost wood fibers in the compression zone of the glulam beams were cracked. Moreover, the residual bearing capacity of the specimen (i.e., the static load of the specimen after 2 million cycles) under a stress level of 0.5 Fu was significantly lower than that under 0.4 Fu. When the stress level increased to 0.57 Fu, the fatigue life was 1.01 million load cycles. According to Borg Madsen [24], if the stress level does not exceed the static bearing capacity proportional limit, the glulam beam does not suffer fatigue failure. According to [25] and the static load test results, the static load ratio limit was generally within the range of 0.45 to 0.50 Fu, while a stress level of 0.57 Fu would cause a fatigue failure of the beam; therefore, it can be preliminarily estimated that the fatigue limit load of the GBSB would be between 0.50 and 0.57 Fu. Linear regression analysis was performed on the fatigue load amplitude and the fatigue life for beams F2, F3, F4, F5, and F6. The expression can be written as:
It is known from Figure 13 that the linear correlation coefficient of the curve is greater than 0.95, indicating a good correlation. It is worth noting that the fatigue load of F1 is 0.40 Fu, while the fatigue limit load of the GBSB is roughly 0.50 to 0.57 Fu, so the F1 data were not taken into account in the linear analysis. Substituting a fatigue life of 2 million life cycles into Equation (5), the fatigue limit load was eventually determined to be 0.5435 Fu. Similarly, our group has carried out experimental studies on glulam beams without joints [26]. It should be noted that the test beams with and without joints have exactly the same dimensions and are loaded in the same way. Finally, the fatigue limit load for the glulam beam without joints is 0.55 Fu. This shows that the fatigue limit load of the glulam beam connected with steel splints and bolts is slightly reduced, but the effect is not significant.
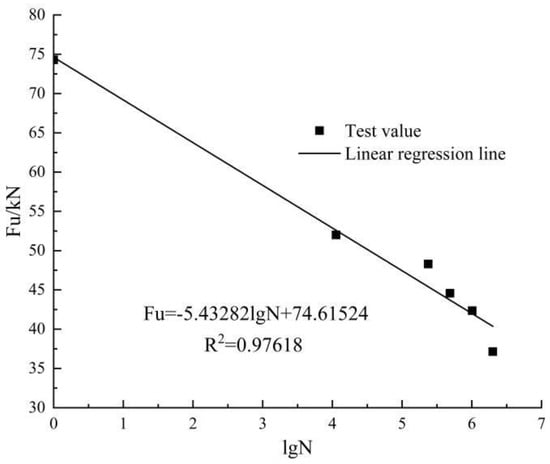
Figure 13.
Relationship between fatigue upper limit load and fatigue life.
7. Electron Microscope Analyses
Wood consists of wood cells. The shape, size, and direction of these cells and their spatial disposition affect the properties of the wood. Especially for the porous layered fibers, the spatial disposition of the cells is very complex, making the stress responses of wood much more complicated than those of metal materials. To study the damage mechanism of the glulam structure from a microscopic viewpoint, the photographs of the specimens were acquired using a scanning electron microscope (SEM), and the main reasons for the fatigue failure of the wood structure were further explored. Because of the limitation on the sample dimension for SEM, small samples with a volume smaller than 1 × 1 × 1 cm were taken from F3, F4, F5, and F6. Since the results for specimens F3 and F5 are better, Figure 14 illustrates the SEM appearances of specimens F3 and F5.
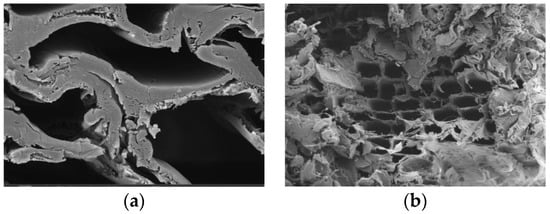
Figure 14.
SEM topography of the test beam; (a) specimen F3; (b) specimen F5.
Due to the porous layered structure of the wood, the fatigue damage process is complicated. It can be seen from Figure 14 that, under the cyclic load, the cavities were visibly squeezed, making the wood fiber layer more tightly packed and the cross-section denser. At the same time, the stress concentration here would produce more elastic and plastic deformation, and the overall volume of the material decreased. In Figure 14b, under a relatively high amplitude, wood fiber yields under compression, and tiny gaps with helical orientations are formed on the cell wall. The fractured section showed a curl-like feature. Hence, the nature of the damage accumulation process is an irreversible and energy-consuming evolution process of the internal microstructure, which finally appears as macroscopic cracks.
8. Conclusions
In this study, static load tests and fatigue tests were carried out on GBSBs considering different stress levels. Linear regression analysis of data and electron microscope analyses were also carried out. The following conclusions can be drawn:
- The fatigue failure of the GBSB mainly occurs near the loading point. Fracture in the tension zone is the final failure mode. Similar to the failure mode of the beam under a static load, two sides of the beam do not fail simultaneously. Under the cyclic loads, the elastic deformation and plastic deformation of the test beam coexist. After repeated fatigue loading, the strain in the compression zone increases faster than the strain in the tension zone.
- With the increase in the stress level, the fatigue life of GBSB decreases significantly. When the stress ratio is 0.2 and the stress level does not exceed 0.5 times the static limit load, the fatigue life is greater than 2 million load cycles, indicating a good fatigue performance. The linear regression analysis of load amplitude and the fatigue life predicts that the fatigue limit load of the GBSB is 0.5435 Fu.
- The bending stiffness of the GBSB decreases almost linearly with the increase in the number of load cycles. As the stress level increases, the stiffness degradation is more obvious. Equations for the stiffness degradation at different stress levels are presented.
- Analysis by electron microscopy shows that fatigue damage accumulation is an irreversible, energy-consuming evolution of the internal microstructure, which eventually manifests itself as macroscopic cracks.
Due to the limited number of test samples, some errors may exist in the testing data. A simulation could be conducted in the future for a more detailed study.
Author Contributions
Conceptualization, A.C. and L.Y.; methodology, A.C. and L.Y.; software, L.Y.; validation, J.Z. and G.H.; formal analysis, L.Y.; investigation, C.L.; resources, H.W.; data curation, L.Y.; writing—original draft preparation, L.Y.; writing—review, A.C.; visualization, L.Y.; supervision, A.C.; project administration, A.C.; funding acquisition, A.C. All authors have read and agreed to the published version of the manuscript.
Funding
This work was supported by Hunan Provincial Natural Science Foundation Project (2021JJ31160); Key Project of Scientific Research of Hunan Provincial Education Department (19A526); Project of High-level Talent Introduction of Central South University of Forestry Science and Technology (2019YJ036); Hunan Provincial Science and Technology Innovation Program Funding Project (2020RC4049).The support is gratefully acknowledged, and the authors declare that they have no conflict of interest.
Institutional Review Board Statement
Not applicable.
Informed Consent Statement
Not applicable.
Data Availability Statement
All data, models, and code generated or used in this study are available upon request from the corresponding author.
Conflicts of Interest
The authors declare no conflict of interest.
References
- Beudon, C.; Oudjene, M.; Djedid, A.; Annan, C.-D.; Fafard, M. Life Cycle Assessment of an Innovative Hybrid Highway Bridge Made of an Aluminum Deck and Glulam Timber Beams. Buildings 2022, 12, 1616. [Google Scholar] [CrossRef]
- Wang, Y.; Hou, Q.; Xu, T.; Qu, S.; Zhang, B. The bending-shear behaviors of steel reinforced fast-growing poplar glulam beams with different shear-span ratios. Constr. Build. Mater. 2021, 300, 124008. [Google Scholar] [CrossRef]
- Guo, N.; Zhang, Y.; Mei, L.; Zhao, Y. Experimental Study on Flexural Performance of the Prestressed Glulam Continuous Beam after Long-Term Loading. Buildings 2022, 12, 895. [Google Scholar] [CrossRef]
- Šuhajdová, E.; Schmid, P.; Novotný, M.; Pěnčík, J.; Šuhajda, K.; Uhlík, O. Experimental Research on Hybrid Hardwood Glue-Laminated Beams. Buildings 2023, 13, 1055. [Google Scholar] [CrossRef]
- Thorhallsson, E.R.; Hinriksson, G.I.; Snæbjörnsson, J.T. Strength and stiffness of glulam beams reinforced with glass and bas-alt fibres. Compos. Part B Eng. 2017, 115, 300–307. [Google Scholar] [CrossRef]
- Tazarv, M.; Carnahan, Z.; Wehbe, N. Glulam timber bridges for local roads. Eng. Struct. 2019, 188, 11–23. [Google Scholar] [CrossRef]
- Jockwer, R.; Steiger, R.; Frangi, A.; Serrano, E. Load-carrying capacity and failure modes of glulam beams with reinforced notches. Eur. J. Wood Wood Prod. 2015, 74, 481–482. [Google Scholar] [CrossRef]
- Odin, C.C. Fatigue in Wood an Investigation in Tension Perpendicular to the Grain; Danmarks Tekniske Universitet: Kongens Lyngby, Danmarks, 2001; pp. 1–109. [Google Scholar]
- Madhoushi, M.; Ansell, M.P. Experimental study of static and fatigue strengths of pultruded GFRP rods bonded into LVL and glulam. Int. J. Adhes. Adhes. 2004, 24, 319–325. [Google Scholar] [CrossRef]
- Kyanka, G.H. Fatigue properties of wood and wood composites. Int. J. Fract. 1980, 16, 609–616. [Google Scholar] [CrossRef]
- Molina, J.C.; Calil Junior, C.; Carreira, M.R. Pullout strength of axially loaded steel rods bonded in glulam at a 450 angle to the grain. Mater. Res. 2009, 12, 427–432. [Google Scholar] [CrossRef]
- Chaplain, M.; Nafa, Z.; Guenfoud, M. Damage of Glulam Beams Under Cyclic Torsion: Experiments and Modelling. In Damage and Fracture Mechanics; Springer: Dordrecht, The Netherlands, 2009; pp. 349–356. [Google Scholar]
- Enam, M.; Mtenga, P.; Tawfiq, K.; Yazdani, N. Behavior of structural composite lumber T-lumber bridge girdersafter fatigue loading. J. Bridge Eng. 2011, 16, 471–478. [Google Scholar] [CrossRef]
- Hansen, L.P. Experimental investigation of fatigue properties of laminated wood beams. In Proceedings of the 1991 International Timber Engineering Conference, London, UK, 2–5 September 1991; pp. 203–210. [Google Scholar]
- Shi, H.; Fang, H.; Liu, W.; Xia, Z. Flexural fatigue behavior and life prediction of web reinforced GFRP-balsa sandwich beams. Int. J. Fatigue 2020, 136, 105592. [Google Scholar] [CrossRef]
- Yang, C.; Li, X.; Fang, H.; Shi, H.; Liu, W.; Zhu, D. An experimental investigation of static and fatigue behaviour of GFRP sandwich beams with a web reinforced wood core. Constr. Build. Mater. 2020, 253, 119194. [Google Scholar] [CrossRef]
- Wu, C.; Zhang, Z.; He, L.; Tam, L.-H. Experimental study on the static and fatigue performances of GFRP-timber bolted connections. Compos. Struct. 2023, 304, 116435. [Google Scholar] [CrossRef]
- Li, L.; Gong, M.; Smith, I.; Li, D. Exploratory study on fatigue behaviour of laterally loaded, nailed timber joints, based on a dissipated energy criterion. Holzforschung 2012, 66, 863–869. [Google Scholar] [CrossRef]
- Tannert, T.; Zhu, H.; Myslicki, S.; Walther, F.; Vallée, T. Tensile and fatigue investigations of timber joints with glued-in FRP rods. J. Adhes. 2016, 93, 926–942. [Google Scholar] [CrossRef]
- Madhoushi, M.; Ansell, M.P. Behaviour of timber connections using glued-in GFRP rods under fatigue loading. Part I: In-line beam to beam connections. Compos. Part B Eng. 2008, 39, 243–248. [Google Scholar] [CrossRef]
- Yeoh, D.; Fragiacomo, M.; Carradine, D. Fatigue behaviour of timber–concrete composite connections and floor beams. Engi-Neering Struct. 2013, 56, 2240–2248. [Google Scholar] [CrossRef]
- Weaver, C.A.; Davids, W.G.; Dagher, H.J. Testing and analysis of partially composite fibre-reinforced polymer-glulam concrete bridge girders. Bridge Eng. 2004, 9, 316–325. [Google Scholar] [CrossRef]
- Davids, W.G.; Nagy, E.; Richie, M.C. Fatigue behaviour of composite-reinforced glulam bridge girders. Bridge Eng. 2008, 13, 183–191. [Google Scholar] [CrossRef]
- Chuanyao, C. Fatigue and Fracture; Huazhong University of Science and Technology Press: Wuhan, China, 2001; pp. 17–25. (In Chinese) [Google Scholar]
- Zhou, X.; Cao, L.; Zeng, D.; He, C. Analysis of Flexural Bearing Capacity of Glulam Beams. Archit. Struct. 2015, 45, 91–96. (In Chinese) [Google Scholar]
- Cao, L.; Zhang, Z.; Zeng, D.; He, G.; Cai, J. Experimental research on fatigue behavior of larch glulam beams. J. Build. Struct. 2016, 37, 27–35. (In Chinese) [Google Scholar]
Disclaimer/Publisher’s Note: The statements, opinions and data contained in all publications are solely those of the individual author(s) and contributor(s) and not of MDPI and/or the editor(s). MDPI and/or the editor(s) disclaim responsibility for any injury to people or property resulting from any ideas, methods, instructions or products referred to in the content. |
© 2023 by the authors. Licensee MDPI, Basel, Switzerland. This article is an open access article distributed under the terms and conditions of the Creative Commons Attribution (CC BY) license (https://creativecommons.org/licenses/by/4.0/).