Abstract
The contribution of GFRP (glass fiber reinforced polymer) fabric to the bending behavior of steel RHS (rectangular hollow section) beams was investigated by experimental and numerical studies. In the first part of the study, small-scale RHS profiles were strengthened with GFRP fabrics in ten different configurations in the experimental study. The bending behavior of the profiles was determined by three-point bending tests, and the best strengthening configuration was decided. The numerical models were verified with the experimental results. In the second part, real-size RHS beams were strengthened with the optimum strengthening configuration. In the results of the study, it was determined that the U-shaped strengthening provided the maximum contribution to the RHS beams bending behavior. The minimum GFRP size to be used in strengthening is important, as an insufficient GFRP length leads to GFRP failure, and the number of layers should be increased for more load capacity. A total of 25% of the net beam span was determined to be the minimum GRFP length. In full-size beams, a double-layer GFRP increased the maximum load-bearing capacity by 7%. Formulas were obtained to determine the contribution of single and double-layered U-shaped GFRP to the shape factors of the RHS. With the formulations, the plastic moment capacity can be determined.
1. Introduction
In structures, the need for strengthening may occur as a result of use outside of the design purpose, unpredictable structural loads, and mistakes in workmanship. Steel structures such as buildings, bridges, and communication towers may need to be strengthened due to corrosion effects, fatigue in the structure as time passes, and increased loads as a result of the change in the function of the structure in line with the need. Replacing the section with a new one or welding or bolting a steel plate to the damaged area is widely used in steel bridges that have been subjected to section loss due to corrosion or whose existing sections have become insufficient due to the increase in traffic loads. However, due to the high cost of these solutions, the heavy added materials, the low fatigue performance, the damage to the section during bolting or welding, and the long-term disruption of the use of the structure (economic and temporal losses, etc.), alternative strengthening techniques have been sought [1,2,3,4,5,6,7].
In recent years, the use of composite materials in the repair and strengthening of structures has been increasing rapidly. The use of FRP in the construction industry comes to the fore due to their lightness, easy workability, economy, resistance to environmental conditions and corrosion, and high strength compared to their weight. These benefits make them an alternative for reinforcing structures and increasing the stiffness and strength of structural elements [8,9,10,11,12,13]. CFRP has a good level of mechanical, fatigue, and corrosion resistance. In spite of this, CFRP remains fairly pricey. GFRP is less expensive and has a higher elongation at break than CFRP, but its strength and stiffness are less than those of CFRP. In terms of cost performance, CFRP and GFRP can be used in a variety of structural engineering applications according to the requirements [14,15].
There are experimental and numerical studies investigating the effect of plate and fabric FRP on the axial load capacity of columns [16,17,18,19]. Razavi et al. [20] investigated the contribution of FRP in reinforced concrete columns subjected to cyclic loading. Six reinforced concrete columns were tested in the study. Columns have been strengthened with longitudinal FRP strips installed using the externally bonded reinforcement on groove (EBROG) technique and with full FRP wraps. As a result of the study, it was stated that the use of longitudinal FRP sheets with the EBROG technique reduces the ductility and increases the eccentric load-carrying capacity, while FRP wraps increase the ductility.
Attari et al. [21] investigated the improvement in the seismic performance of the beam–column joint strengthened by different fabric FRP in their study. As a result of the study, it was emphasized that hybrid FRP (glass-carbon) contributed to the ductility and dissipation energy of the beam–column joint. Zia et al. [22] developed an easy and reliable analytical model to calculate the contribution of FRP to the shear strength of the joint using the beam–column joint test data strengthened with FRP plates in the literature.
In studies on the reinforcement of beams with FRP, some examine the effect of FRP plates on the fatigue behavior of steel beams and the propagation of fatigue cracks [23,24,25,26,27,28,29]. In addition, some researchers investigated the contribution of FRP to the buckling behavior of beams with experimental and numerical studies [30,31,32].
Mostafa et al. [33] examined the strengthening of reinforced concrete T beams with FRP and obtained the load–displacement changes of the beams with a four-point bending test using CFRP sheets at different ratios. They emphasized that the shear stress and strain of CFRP can be predicted with the finite element model that they verified using load–displacement and strain data.
In the literature, studies on the contribution of GFRP plates to the bending behavior of steel beams were also carried out. Damatty et al. [34] performed four-point bending tests by bonding GFRP plates to the lower and upper flanges of the steel beam. They also stated that the finite element model adequately represents the real model.
Pham et al. [35] investigated the effect of GFRP plates on the moment capacity of flange steel sections in their study. They created an experimental, numerical, and finite element model using different thickness and length GFRP plates and compared the moment capacities. In the experiments, they bonded the GFRP plate to the bottom flange of the beam. They also examined how the adhesive rupture strength affected the mechanism of failure. By comparing the moment capacity of the experimental, analytical, and finite element models as a consequence of the investigation, they highlighted the contribution of GFRP plates to the bending behavior, which is similar to other studies.
In their study, Eltobgy et al. subjected six RHS specimens strengthened with CFRP to a four-point bending test. They aimed to investigate the behavior of hollow steel beams by applying unidirectional CFRP in the longitudinal and transverse directions. In the study, in which experimental and numerical examinations were conducted, the final loads and deflection were determined through tests. A finite element model validated by tests was used to determine the failure load of the beams. According to the experimental results, it was emphasized that strengthening with CFRP effectively improves the strength and ductility of RHS beams. Furthermore, beams reinforced with longitudinal laminates provide a higher improvement compared to beams strengthened with transverse laminates [36]. Tafsirojjaman et al. used numerical models to forecast the behavior and failure processes of CFRP-strengthened cantilever RHS beams subjected to cyclic loads. The investigations were conducted on RHS steel beams that had varying bond lengths of CFRP (150 mm, 250 mm, 300 mm, and 350 mm). The results were compared with readily available experimental test data to evaluate the numerical models and ensure their accuracy. According to the findings, CFRP-strengthened RHS steel members perform better cyclically than bare steel RHS beams in terms of the moment-rotation hysteresis behavior, secant stiffness, and energy dissipation capacity. The response of RHS beams to variations in the section thickness, layer count, wrapping orientation, CFRP bond length, and elastic modulus was also studied with thorough parametric simulations. In this work, experimental and numerical studies are used to explore simply supported RHS beams strengthened with various configurations of GFRP. Under a static bending load, the strengthened beam’s bending behavior and the changes in stiffness, toughness, and ductility are studied. Additionally, there are shape factor calculations that change depending on the number of layers and the minimum GFRP length for GFRP-strengthened RHS beams [37].
RHS has a variety of uses in the mechanical, structural, and construction industries. RHS’s flat surfaces make it easy to work with and economical for welding and joining. Because of these advantages, the behavior of FRP-reinforced RHS under bending has been investigated in this study. This study has been carried out to contribute to the gap in the literature on the change in the bending behavior of steel RHS profiles strengthened with GFRP of different lengths and layers. Performing parametric studies using numerical models, confirmed with experimental data, provides time and money savings. Therefore, in this study, experimental and finite element models (FEMs) have been used. The FEMs have been verified by experimental data, and the scope of the study has been expanded with FEM studies. In the experimental part, small-scale steel rectangular hollow sections (RHS 20 × 30 × 1) have been strengthened with GFRP in five different configurations. In each configuration, three-point bending tests have been performed using a single layer and double layer of GFRP. The finite element models created in ABAQUS have been verified with experimental data. The results of the experimental and finite element models have been examined and the optimum strengthening configuration has been decided. Using the validated ABAQUS model, the optimum strengthening configuration for steel rectangular hollow section beams (RHS 200 × 300 × 10) has been decided based on the bending behavior. In contrast to other research, this study discusses the impact of the GFRP strengthening shape and layer count on the bending behavior when RHS beams are reinforced with GFRP fabric. Additionally, formulae for calculating the shape factor of strengthened beams according to the quantity of GFRP layers have been established.
2. Experimental Studies
Three-point bending tests were carried out to examine the change in the bending behavior of steel RHS profiles strengthened with GFRP. Since FEM analysis would be carried out, the specimens were selected on a small scale so that the experiments could be carried out easily. Three-point bending tests were performed by bonding GFRP fabrics, in 10 different combinations, to profiles.
2.1. Material Properties
At the first stage of the experimental study, profile tensile tests were carried out with three specimens, which were dimensioned according to the ASTM standard [38]. The average stress–strain curves of three samples were obtained. The RHS profile has an average yield strength of 250 MPa, an average tensile strength of 282 MPa, and an elastic modulus of 200 GPa (Figure 1). The GFRP composite used in the strengthening has a tensile strength of 2300 MPa, an elastic modulus of 76 GPa, an elongation at break of 2.97%, and an elastic modulus of the adhesive of 1900 MPa with a density of 1.13 g/cm3.
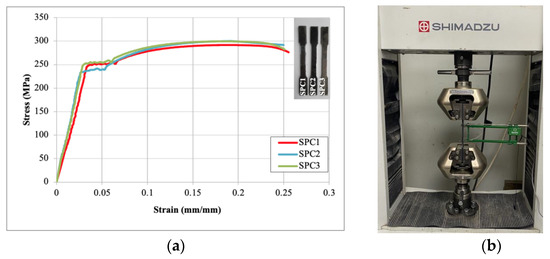
Figure 1.
(a) Stress-strain curves (b) tensile test.
2.2. Preparation of Specimens
An RHS 20 × 30 × 1 profile made of S235 steel was used in the experiments. The length of the profile was 500 mm. In the bonding process, after the steel surfaces were cleaned of oil, rust, and dirt with sandpaper, the GFRP fabric was bonded. Epoxy was used as an adhesive to bond the GFRP to the profile. In order to distribute the epoxy evenly on the surface and obtain a uniform adhesion surface, the GFRP surfaces were compressed (Figure 2).
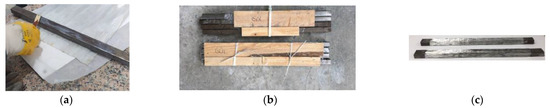
Figure 2.
Preparation of specimens (a) applying adhesive (b) compression of GFRP surfaces (c) specimens.
The profiles were strengthened by bonding GFRP fabric in 10 different combinations. Those that were not strengthened were expressed as "Reference". The expression LY refers to the number of GFRP fabric layers. Bonding a single layer of GFRP fabric with a length of 10 cm to the middle of the bottom of the span was named “10_1LY”, bonding a double layer of GFRP in the same combination was named “10_2LY”, and bonding a single and double layer of GFRP fabric with a length of 40 cm to the middle of the bottom of the span was named “40_1LY and 40_2LY”. The bonding of GFRP on the bottom and side surfaces of the profiles was named U. The GFRP widths used were 5, 10, and 40 cm. As an example, a 10 cm single-layer GFRP fabric bonding was named U10_1LY (Figure 3).
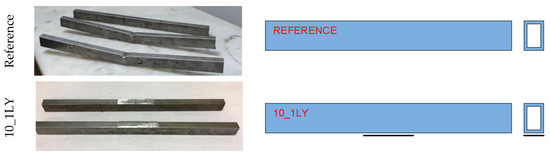
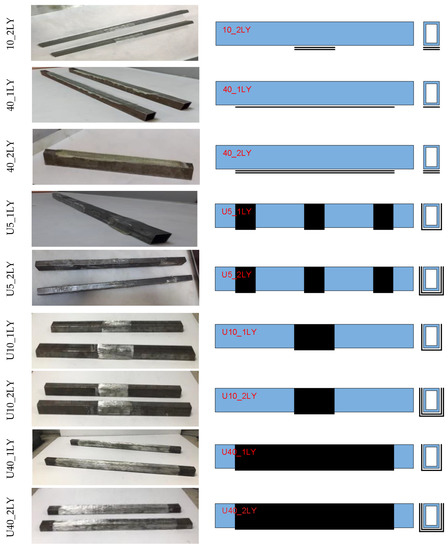
Figure 3.
Strengthening combinations.
2.3. Experimental Setup
The three-point bending test machine has 50 kN capable of applying load (Figure 4). The loading time for the machine has been given automatically as 3 kN/s. A total of 20 data per second were recorded in the test. The midpoints of the profiles have been taken as a reference for vertical displacement.
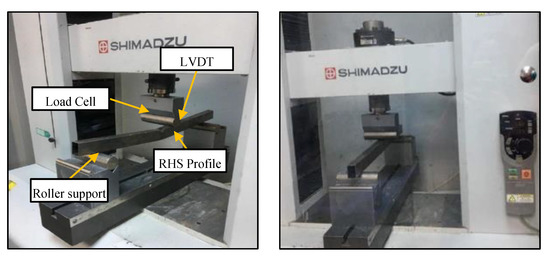
Figure 4.
Three-point bending test machine.
The effective span of the 500 mm long specimen was 400 mm. The loading was applied so that the profile was bent on the strong axis (Figure 5).
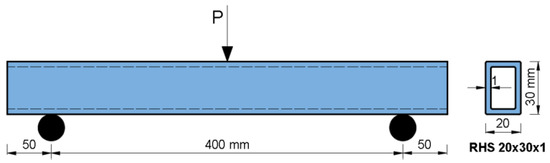
Figure 5.
Geometry of the specimens.
3. Finite Element Modelling
In ABAQUS software, a static loading numerical analysis was carried out with displacement control as the loading type to model the behavior of the experimental setup under a monotonic displacement loading of 100 mm. In order to calculate the stress distribution, plastic deformation, reaction forces, stiffness degradation for cohesive surface, and displacements numerically, 11 three-dimensional finite element models based on the experimental investigation were created. All the components of the test specimen were modelled to replicate the same experimental condition (Figure 6).
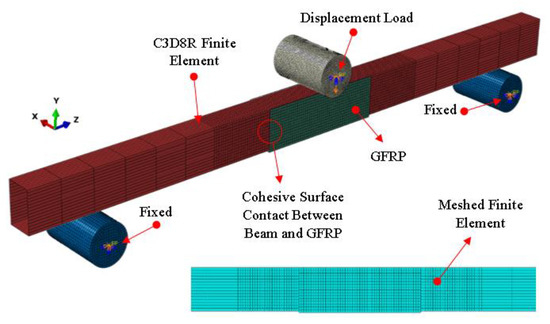
Figure 6.
Finite element model of experimental specimens and boundary conditions.
Additionally, in order to investigate the GFRP effects, nine three-dimensional finite element models in real sizes were developed. The details of all the finite element models are given in Table 1.

Table 1.
Details of finite element models.
The true stress–strain relationship was obtained and used for the material model in ABAQUS. All the stress–strain relationships were converted into true stress and strain as required for ABAQUS input [39]. Equations (1) and (2) were used for this purpose:
where εT is the true strain, εeng is the engineering strain, σT is the true stress, and σeng is the engineering stress. For the S235 steel material, the elastoplastic stress–strain curve, which was obtained from tension tests, was used. The ductile damage mechanisms were also taken into consideration. The Poisson ratio and Elastic Young modulus for steel material were taken as 0.3 and 200 GPa, respectively. The material behavior of the GFRP composite was assumed to be linear elastic, and the Hashin [40] damage criteria provided by the ABAQUS software were used to assess the degree of damage. The nominal thickness of the glass fibers, as reported by the manufacturer, was 0.37 mm. The mechanical properties of the steel and GFRP are presented in Table 2.
Table 2.
Material properties.
The RHS and GFRP were modelled using S4R shell elements, which are linear 4-noded quadrilateral thick shell elements with six degrees of freedom per node [41,42,43]. The mesh sensitivity analysis was undertaken, and the findings revealed that a mesh size of 2 mm × 2 mm (length by width) was adequate for RHS rectangular hollow sections. The remaining regions also had a rough mesh size of 25 mm × 2 mm (length by width) (Figure 7).
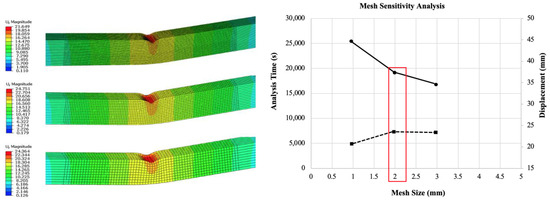
Figure 7.
Mesh sensitivity analysis.
Modelling the contact between the different model parts is one of the most critical processes. If the contact is improperly modeled, the results of the analysis will not reflect the real behavior of the elements definitely. In the case of the contact between the steel beam with the load and supports and the steel beam with GFRP, two relevant properties were considered. The first one is the tangential and normal behavior of the contact-surface interaction considering small sliding surface-to-surface contact. The second one is the cohesive surface behavior between the steel beam and GFRP (Figure 6). Surface-based cohesive behavior provides a simplified way to model cohesive connections with negligibly small interface thicknesses using the traction–separation constitutive model [39].
According to the experimental data, debonding occurred at the adhesive–steel contact for all the strengthened specimens. Therefore, the ABAQUS cohesive surface model was used to simulate the interfacial behavior. Cohesive zone modelling (CZM), which employs cohesive laws, is effective at predicting debonding failure mechanisms. The ability to predict debonding failure modes is a strong point of cohesive zone modeling (CZM), which employs a variety of cohesive laws. In order to assess the potential of damage initiating in the adhesive layer under mixed-mode loading, the quadratic stress criteria were used.
In Equation (3), tn, ts, and tt stand for normal and two shear tractions, respectively; σmax and τmax are the maximum values of the bond stress in the normal and shear directions, respectively; and the angle brackets show that only tensile normal tractions are relevant to the criterion [43]. It was found that in the experimental setup using displacement-control loading, all the specimens failed at the same time as the steel member started to yield. The Von Mises failure criteria [41] were applied to determine the yielding of the steel member in order to model this scenario in Finite Element Analysis. Debonding of the GFRP from the beam, which was modeled using the Hashin failure criteria [40] in the numerical analysis, was also discovered to be the second mode of failure. The element meshing employed in the model is one of the most essential issues in Finite Element Analysis, as the correctness of the results is heavily dependent on it. Different mesh sizes were investigated in order to find an acceptable mesh that produces correct results in less computational time. The alternative strategy is to utilize a fine mesh in high-stress areas and a rough mesh in the remaining areas, as shown in Figure 6. The boundary conditions of the models were specified according to the experimental setup, as shown in Figure 6.
4. Results and Discussion
4.1. Experimental Results
The load–displacement curves of the single and double-layered combinations and the references, as well as post-experimental images of the specimens, are presented in Figure 8.
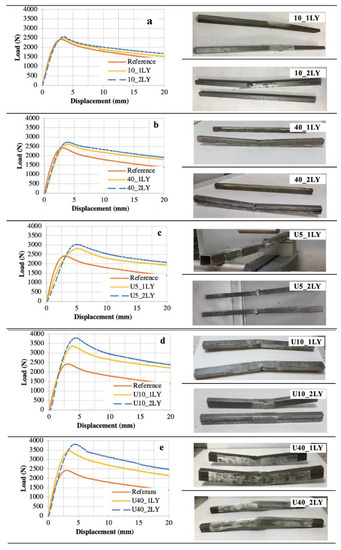
Figure 8.
Load–displacement curves and deformation shapes of the specimens (a) 10_LY configurations (b) 40_LY configurations (c) U5_LY configurations (d) U10_LY configurations (e) U40_LY configurations.
The test results for the single-layer and double-layer specimens of all the combinations were compared as curvilinear and column charts (Figure 9).
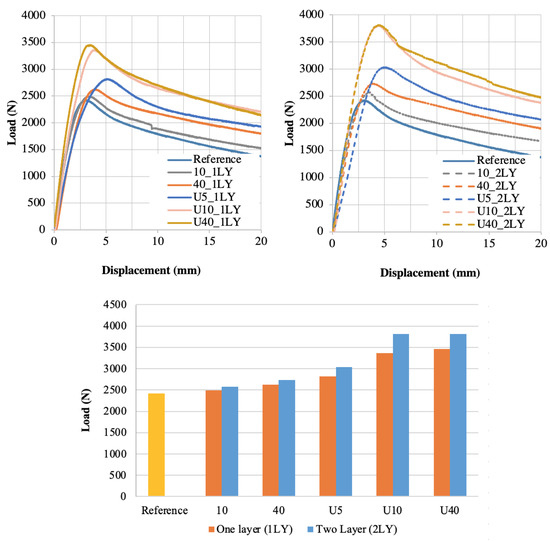
Figure 9.
Comparison of all combinations strengthened with a single and double layer of GFRP fabric.
From Figure 8 and Figure 9, the reference has the lowest load-carrying capacity, with 2423.44 N. The lowest load capacity was obtained as 2495.23 N in 10_1LY and the highest as 3483.30 N in U40_1LY in the single-layer specimens. Similarly, the lowest load capacity was obtained as 2573.08 N in 10_2LY and the highest as 3887.97 N in U40_2LY in the double layer specimens. When the single-layer and double-layer specimens were compared to one another, the double layers demonstrated a maximum increase of 4% in the lower 40 cm and 12% in the U shape 40 cm. A greater load capacity increase was provided by U-shaped strengthening than by bottom strengthening.
When the GFRP length effect was examined, the 40_1LY specimen carried 5% more load than 10_1LY. Similarly, in a double layer of the same configuration, 40_2LY carried 6% more load than 10_2LY.
In the U-shaped strengthening, the U40_1LY configuration carried 3.5% more load than U10_1LY. Similarly, U10_1LY carried 20% more load than U5_1LY. Similar behavior was observed in the double layers. While there was a 2% difference between U40 and U10, there was a 25% difference in the load capacity between U5 and U10. In the U5 configuration, the impact of the GFRP length was successfully exposed.
In order to better examine the change in the behavior of the profiles, parameters such as the moment, stiffness, toughness, and ductility capacity of the specimens were calculated from the average of the test results. The slope of the initial linear part of the load–displacement curves was used to determine the stiffness, and the ratio of the ultimate displacement to yield displacement was used to determine the ductility. The toughness was calculated using the area under the load–displacement graphs and averaged (Table 3).
Table 3.
Parameters calculated from the bending test results.
The lowest moment capacity was obtained in the reference (24,2340 N.mm). Among the single-layer specimens, the lowest moment capacity of 249,520 N.mm was obtained at 10_1LY. The highest moment was obtained in the U40_1LY specimen, with 348,330 N.mm. In all the configurations, higher values were obtained in the double-layer specimens than in the single-layer specimens. Similar to the results of the single-layer specimens, the lowest moment was obtained at 10_2LY (257.310 N.mm) and the highest at U10_2LY (380,810 N.mm). In the strengthened specimens, the lowest stiffness was obtained in the U5_2LY specimen (695.41 N/mm), and the highest stiffness was obtained in the U40_1LY (1300.52 N/mm). Although the toughness results were similar to the load and moment results, the ductility results were similar to the stiffness results. The stiffness and ductility results show that the fiber effect decreases as the GFRP length decreases, and the contribution of epoxy comes to the fore. On the other hand, the load, moment, and toughness results show that the fiber contribution does not increase much when the GFRP adhesion surface is increased outside the bending zone. This can be understood from the bending behaviors of the U10 and U40 specimens, which were very close (Table 3).
4.2. FEM Verification Results
When comparing the experimental and FEM models, the reference model has the most similar behavior in terms of load and stiffness. In the strengthened models, sufficient similarity was obtained in terms of the load and displacement (Figure 10).
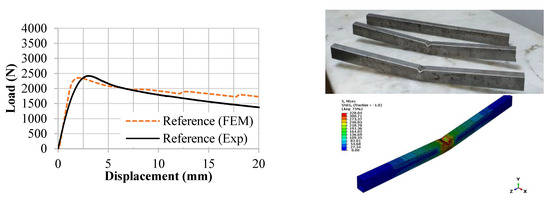
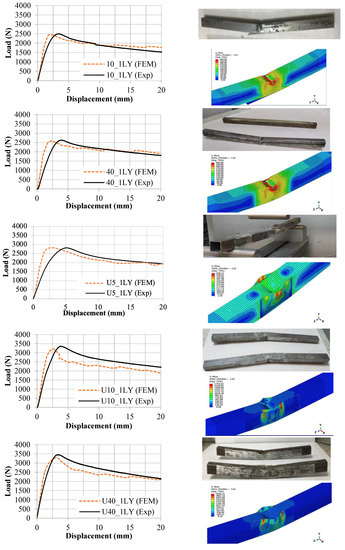
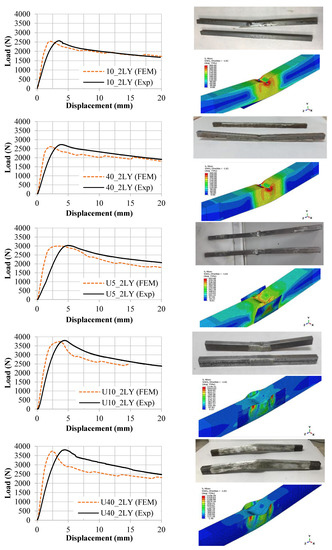
Figure 10.
Load–displacement curves and deformation shapes of experimental and FEM models.
The U40_1 LY configuration had a maximum difference of 5.3% when comparing the compatibility of the maximum loads as a result of the test and FEM. With a difference of 0.06% and 0.13%, respectively, the U5_1LY and U5_2LY configurations had the highest agreement. In comparing the test and FEM results for load displacement, it was shown that the FEMs could only deviate by a maximum of 5.3% (Table 4).
Table 4.
Test and FEM load capacity comparison.
4.3. Real-Size Beam FEM Analysis Results
In order to examine the effect of the strengthening combinations on the bending behavior of a real-sized beam, a static loading numerical analysis displacement-control was carried out by selecting a steel rectangular hollow section profile with a length of 5000 mm and a cross-section of RHS 200 × 300 × 10.
The Von Mises failure criteria [41] were used to model the yielding of the steel in the finite element modeling of the real-sized beams, and the Hashin failure criteria [40] were used to model the debonding of the GFRP from the beam. The U-shaped GFRP strengthening combination, which obtained higher values in all the parameters considered in the experimental study, was used in real-size beam FEMs. The U-shaped GFRP fabric was bonded in the middle of the span of the beam in single and double layers at lengths of 50, 75, 100, and 125 cm. Since the beams were in real size, the letter R was used in the nomenclature. The real size of the unstrengthened beam was named R-Reference. The GFRP bonded beams were also named R-U50_1 LY, R-U50_2 LY, R-U75_1 LY, R-U75_2 LY, R-U100_1 LY, R-U100_2 LY, R-U125_1 LY, and R-U125_2 LY. As a result of the FEM analysis, load–displacement curves and beam deformation shapes were obtained for GFRP strengthening combinations of different lengths (Figure 11).
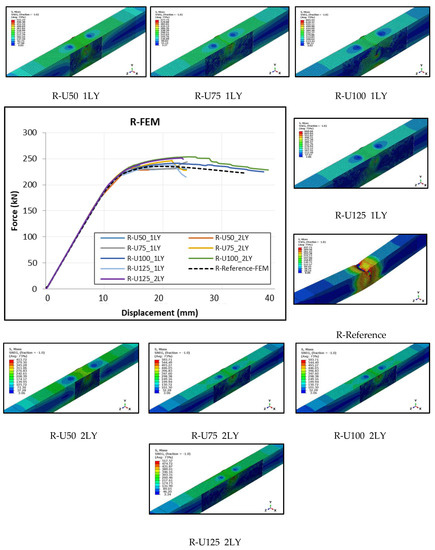
Figure 11.
Comparison of FEM analyses beam models.
When the load–displacement curves of the FEM analyses were examined, the R-Reference beam had the lowest load capacity (234.90 kN), and the R-U125_2LY had the highest load capacity (253.7 kN). The load capacities of the single and double-layer GFRP strengthening forms were compared according to the FEM analysis results of the real-size beam. The load-carrying capacity increased as the GFRP length and layer number increased. All the strengthening types had a higher load capacity, in the range of 0.04–8%, compared to the capacity of the R-Reference (Figure 12).
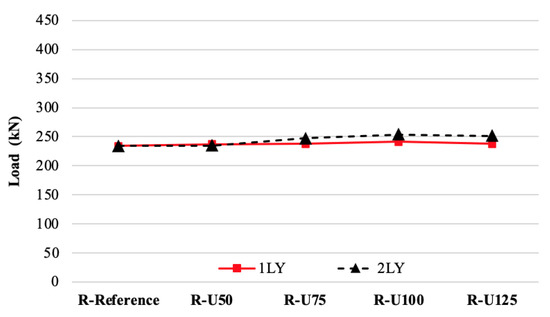
Figure 12.
Single and double-layer beams’ load capacities.
The moment, stiffness, bending stiffness, and toughness parameters of the beams were calculated from the FEM analysis results (Table 5). In the FEM analysis results of the single-layer specimens, according to the R-Reference, R-U100_1LY had 1.2% and R-U125_1LY had 2.8% more load and moment capacity, respectively. Due to the insufficient GFRP adhesion surface area and the number of layers, R-U50_1L and R-U75_1LY had 1.7% lower load and moment capacities than the reference. Both the lowest R-U50_2LY (0.04%) and highest R-U125_2LY (8%) of the double-layer specimens had load and moment capacity. When the single and double layers were compared to one another, the increase in the number of layers resulted in a 2–7% increase in capacity.
Table 5.
R-FEM beam models FEM analyses results.
Although the load and moment values are close to each other, the highest capacity in both the single and double-layer beams was obtained in R-U125. In both the single and double-layer beams, the R-U125 had the most rigid behavior. It was observed that the R-U100 beam had the closest stiffness to the R-Reference in the single and double layers. The stiffness in the elastic region was slightly greater than in the reference in all the strengthened R-FEM models. The maximum load capacities increased as a result of GFRP strengthening. The steel’s behavior was more prominent in the elastic region. The toughness capacity had the highest value in R-U100_1LY in the single layers and R-U100_2LY in the double layers. When the beams were evaluated in terms of ductility, the ductility of the R-U100_1LY and R-U100_2LY beams increased by 7% and 4%, respectively, according to the R-Reference. The R-U100 beam had the highest capacity in both the single and double layers when the toughness and ductility values were considered because of more displacement capacity (Table 5).
In addition to these evaluations, the shape factors of the RHS were calculated. The shape factor, defined as the ratio of the plastic moment to the yield moment of the section, is a function of the cross-section form or shape and is expressed with S (Equation (4)):
Shape factors were obtained for all the beams in the R-FEM analyses. For the R-Reference, the shape factor was calculated as 1.21 by proportioning the plastic moment obtained from the FEM analysis to the elastic moment. The result obtained was verified with the shape factor calculated for RHS 200 × 300 × 10 from the steel profile tables (Table 6).
Table 6.
R-FEM shape factors and plastic moments.
Using the shape factors obtained for all the beams from the FEM analyses, separate formulas for single and double layers were produced. The variable x in the formula is the area of the U-shaped GFRP (Figure 13).
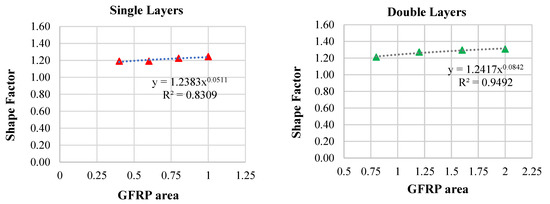
Figure 13.
Single and double-layer GFRP combinations shape factors.
While 83% convergence was achieved with the formula in the single layers, 95% convergence was achieved in the double layers. The shape factors and plastic moment capacities were calculated by increasing the GFRP length by 25 cm with the defined formulas so that the entire beam span would be strengthened (Table 6). The shape factors of the single-layer beams varied between 1.25 and 1.31 and those of the double-layer beams varied between 1.34 and 1.45 (Figure 14).
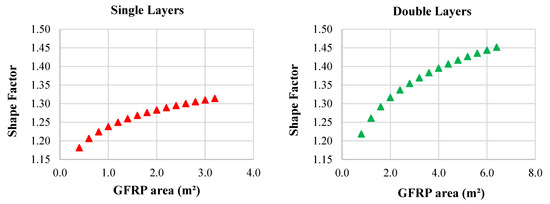
Figure 14.
Shape factors calculated for single and double layers using equations.
Similarly, the plastic moment capacities were higher in the double layers. Compared to the unreinforced R-FEM reference beam, the highest plastic moment capacity was obtained in the R-U400, where the entire support span was reinforced, with an increase of 8.5% in the single layers and 20% in the double layers.
5. Conclusions and Recommendations
The aim of this study was to investigate the effects of glass fiber reinforced polymers (GFRP) on the bending behavior of steel rectangular hollow sections. According to the tests and verified FEM results, the following conclusions are drawn.
The ABAQUS program successfully simulates the bending behavior of fabric GFRP-reinforced RHS beams. Strengthening with fabric GFRP contributed significantly to the bending behavior of the RHS beams. Applying GFRP in different lengths and shapes changes the bending behavior. Wrapping the beam with U-shaped GFRP had a higher contribution than just bonding it under the beam. The short GFRP length failed to strengthen due to insufficient surface area for adhesion. This result indicates that the minimum GFRP length should be determined. In this study, the minimum GRFP length was obtained as 25% of the net beam span under the effect of the three-point bending test.
An increase in GFRP layers increases the load capacity. When the U-shaped reinforcement was applied in two layers, it provided a maximum load increase of 7% in full-size beams, although this changed depending on the GFRP length. In addition, an increase in layers caused an increase in the bending stiffness and toughness while reducing the ductility.
Shape factor formulas developed depending on the GFRP fabric length for U-shaped strengthening will contribute to the literature.
Author Contributions
E.B. contributed to the investigation, resources, writing—reviewing and editing, and supervision. E.A. contributed to the data curation, writing—original draft preparation, and visualization. M.S.S. created the FEM model and contributed to the software and validation. All authors have read and agreed to the published version of the manuscript.
Funding
This research received no external funding.
Data Availability Statement
Not applicable.
Conflicts of Interest
The authors declare no conflict of interest.
References
- Polyzois, D.J.; Raftoyiannis, I.G.; Ungkurapinan, N. Static and dynamic characteristics of multi-cell jointed GFRP wind turbine towers. Compos. Struct. 2009, 90, 34–42. [Google Scholar] [CrossRef]
- Alshurafa, S.A.; Polyzois, D. An experimental and numerical study into the development of FRP guyed towers. Compos. Struct. 2018, 201, 779–790. [Google Scholar] [CrossRef]
- Sundarraja, M.C.; Sriram, P.; Ganesh Prabhu, G. Strengthening of hollow square sections under compression using FRP composites. Adv. Mater. Sci. Eng. 2014, 2014, 396597. [Google Scholar] [CrossRef]
- Shaat, A.; Fam, A. Axial loading tests on short and long hollow structural steel columns retrofitted using carbon fibre reinforced polymers. Can. J. Civ. Eng. 2006, 33, 458–470. [Google Scholar] [CrossRef]
- Teng, J.G.; Yu, T.; Fernando, D. Strengthening of steel structures with fiber-reinforced polymer composites. J. Constr. Steel Res. 2012, 78, 131–143. [Google Scholar] [CrossRef]
- Schnerch, D.; Rizkalla, S. Strengthening of scaled steel–concrete composite girders and steel monopole towers with CFRP. FRP Compos. Civ. Eng. 2004, CICE 2004, 43–54. [Google Scholar]
- Pham, N.V.; Ohgaki, K.; Miki, T.; Hidekuma, Y. Seismic Retrofitting Method Using CFRP Sheets for H-Section Steel Beam with Variable Cross Section. J. Struct. Eng. 2022, 148, 4. [Google Scholar] [CrossRef]
- Capozucca, R.; Magagnini, E. Experimental response of masonry walls in-plane loading strengthened with GFRP strips. Compos. Struct. 2020, 235, 111735. [Google Scholar] [CrossRef]
- Arslan, M.E.; Durmuş, A.; Hüsem, M. Cyclic behavior of GFRP strengthened infilled RC frames with low and normal strength concrete. Sci. Eng. Compos. Mater. 2019, 26, 30–42. [Google Scholar] [CrossRef]
- Zhang, Y.; Li, N.; Wang, Q.; Li, Z.; Qin, X. Shear Behavior of T-Shaped Concrete Beams Reinforced with FRP. Buildings 2022, 12, 2062. [Google Scholar] [CrossRef]
- Panda, K.C.; Bhattacharyya, S.K.; Barai, S.V. Shear behaviour of RC T-beams strengthenedwith U-wrapped GFRP sheet. Steel Compos. Struct. 2012, 12, 149–166. [Google Scholar] [CrossRef]
- Sundarraja, M.C.; Rajamohan, S.; Bhaskar, D. Shear Strengthening of RC Beams Using GFRP Vertical Strips—An Experimental Study. J. Reinf. Plast. Compos. 2008, 27, 14. [Google Scholar] [CrossRef]
- Aghayari, R.; Moradi, M. Improving the punching shear strength of RC slabs by FRP and steel sheets. J. Rehabil. Civil. Eng. 2016, 4, 1–17. [Google Scholar]
- Xian, G.; Guo, R.; Li, C.; Hong, B. Mechanical properties of carbon/glass fiber reinforced polymer plates with sandwich structure exposed to freezing-thawing environment: Effects of water immersion, bending loading and fiber hybrid mode. Mech. Adv. Mater. Struct. 2023, 30, 814–834. [Google Scholar] [CrossRef]
- Guo, R.; Li, C.; Xian, G. Water absorption and long-term thermal and mechanical properties of carbon/glass hybrid rod for bridge cable. Eng. Struct. 2023, 274, 115176. [Google Scholar] [CrossRef]
- Sirach, N.; Smith, S.T.; Yu, T.; Mostafa, A. Axial compressive behaviour of circular FRP-confined multi-tube concrete columns. Compos. Struct. 2022, 281, 114972. [Google Scholar] [CrossRef]
- Shi, F.; Wang, L.B.; Du, H.; Zhao, M.; Li, H.; Wang, F.Q.; Wang, S.J. Axial Compression Behavior of FRP Confined Laminated Timber Columns under Cyclic Loadings. Buildings 2022, 12, 1841. [Google Scholar] [CrossRef]
- Zhou, J.K.; Lin, W.K.; Guo, S.X.; Zeng, J.J.; Bai, Y.L. Behavior of FRP-confined FRP spiral reinforced concrete square columns (FCFRCs) under axial compression. J. Build. Eng. 2022, 45, 103452. [Google Scholar] [CrossRef]
- Tao, Z.; Han, L.H.; Zhuang, J.P. Axial loading behavior of CFRP strengthened concrete-filled steel tubular stub columns. Adv. Struct. Eng. 2007, 10, 37–46. [Google Scholar] [CrossRef]
- Razavi, M.; Mostofinejad, D.; Eftekhar, M. Behavior of RC columns and those strengthened with FRP composite under an innovative reversing cyclic eccentric axial loading. Eng. Struct. 2021, 241, 112438. [Google Scholar] [CrossRef]
- Attari, N.; Youcef, Y.S.; Amziane, S. Seismic performance of reinforced concrete beam–column joint strengthening by FRP sheets. Structures 2019, 20, 353–364. [Google Scholar] [CrossRef]
- Zia, A.; Pu, Z.; Holly, I.; Umar, T.; Tariq, M.A.U.R. Development of an Analytical Model for the FRP Retrofitted Deficient Interior Reinforced Concrete Beam-Column Joints. Appl. Sci. 2022, 12, 2339. [Google Scholar] [CrossRef]
- Aljabar, N.J.; Zhao, X.L.; Al-Mahaidi, R.; Ghafoori, E.; Motavalli, M.; Koay, Y.C. Fatigue tests on UHM-CFRP strengthened steel plates with central inclined cracks under different damage levels. Compos. Struct. 2017, 160, 995–1006. [Google Scholar] [CrossRef]
- Aljabar, N.J.; Zhao, X.L.; Al-Mahaidi, R.; Ghafoori, E.; Motavalli, M.; Powers, N. Effect of crack orientation on fatigue behavior of CFRP-strengthened steel plates. Compos. Struct. 2016, 152, 295–305. [Google Scholar] [CrossRef]
- Ghafoori, E.; Schumacher, A.; Motavalli, M. Fatigue behavior of notched steel beams reinforced with bonded CFRP plates: Determination of prestressing level for crack arrest. Eng. Struct. 2012, 45, 270–283. [Google Scholar] [CrossRef]
- Colombi, P.; Fava, G. Fatigue crack growth in steel beams strengthened by CFRP strips. Theor. Appl. Fract. Mech. 2016, 85, 173–182. [Google Scholar] [CrossRef]
- Ghafoori, E.; Motavalli, M.; Nussbaumer, A.; Herwig, A.; Prinz, G.S.; Fontana, M. Design criterion for fatigue strengthening of riveted beams in a 120-year-old railway metallic bridge using pre-stressed CFRP plates. Compos. Part. B Eng. 2015, 68, 1–13. [Google Scholar] [CrossRef]
- Hu, L.; Feng, P.; Zhao, X.L. Fatigue design of CFRP strengthened steel members. Thin-Walled Struct. 2017, 119, 482–498. [Google Scholar] [CrossRef]
- Yu, Q.Q.; Chen, T.; Gu, X.L.; Zhao, X.L.; Xiao, Z.G. Fatigue behaviour of CFRP strengthened steel plates with different degrees of damage. Thin-Walled Struct. 2013, 69, 10–17. [Google Scholar] [CrossRef]
- Krishna, G.V.; Narayanamurthy, V.; Viswanath, C. Effectiveness of FRP strengthening on buckling characteristics of metallic cylindrical shells. Compos. Struct. 2021, 262, 113653. [Google Scholar] [CrossRef]
- Ghafoori, E.; Motavalli, M. Normal, high and ultra-high modulus carbon fiber-reinforced polymer laminates for bonded and un-bonded strengthening of steel beams. Mater. Des. 2015, 67, 232–243. [Google Scholar] [CrossRef]
- Aydin, E.; Aktas, M. Obtaining a permanent repair by using GFRP in steel plates reformed by heat-treatment. Thin-Walled Struct. 2015, 94, 13–22. [Google Scholar] [CrossRef]
- Mostafa, A.A.B.; Razaqpur, A.G. Finite element model for predicting post delamination behaviour in FRP-retrofitted beams in flexure. Constr. Build. Mater. 2017, 131, 195–204. [Google Scholar] [CrossRef]
- El Damatty, A.A.; Abushagur, M.; Youssef, M.A. Experimental and analytical investigation of steel beams rehabilitated using GFRP sheets. Steel Compos. Struct. 2003, 3, 421–438. [Google Scholar] [CrossRef]
- Van Pham, P.; Mohareb, M.; Fam, A. Numerical and analytical investigation for ultimate capacity of steel beams strengthened with GFRP plates. Eng. Struct. 2021, 243, 112668. [Google Scholar] [CrossRef]
- Eltobgy, H.H.; Abu-Sena, A.B.; Abdelnabi, O.N. Behaviour of Rectangular Hollow Steel Beams Strengthened with CFRP Sheets Applied in Longitudinal and Transversal Directions. Int. J. Sci. Technol. Res. 2021, 10, 65–77. [Google Scholar]
- Tafsirojjaman, T.; Fawziaa, S.; Thambiratnam, D.; Zhao, X.-L. Numerical investigation of CFRP strengthened RHS members under cyclic loading. Structures 2020, 24, 610–626. [Google Scholar] [CrossRef]
- ASTM A370-10; Standard Test Methods and Definitions for Mechanical Testing of Steel Products. ASTM (American Society for Testing and Materials): West Conshohocken, PA, USA, 2010.
- Simulia, D. ABAQUS Version 6.13. Analysis User’s Manual; Abaqus 6.13 Documentation; Dassault Systèmes Inc.: Providence, RI, USA, 2013. [Google Scholar]
- Hashin, Z. Failure Criteria for Unidirectional Fiber Composites. ASME J. Appl. Mech. 1980, 47, 329–334. [Google Scholar] [CrossRef]
- Nasery, M.M.; Ağacakoca, E.; Yaman, Z. Experimental and numerical analysis of impactor geometric shape effects on steel beams under impact loading. Structures 2020, 27, 1118–1138. [Google Scholar] [CrossRef]
- Shadan, P.; Kabir, M.Z. Enhancing Local Buckling Behavior of SHS Braces Using GFRP and CFRP Wrap. J. Compos. Constr. 2018, 22, 5. [Google Scholar] [CrossRef]
- Chen, B.; Roy, K.; Uzzaman, A.; Lim, J.B. Moment capacity of cold-formed channel beams with edge-stiffened web holes, un-stiffened web holes and plain webs. Thin-Walled Struct. 2020, 157, 107070. [Google Scholar] [CrossRef]
Disclaimer/Publisher’s Note: The statements, opinions and data contained in all publications are solely those of the individual author(s) and contributor(s) and not of MDPI and/or the editor(s). MDPI and/or the editor(s) disclaim responsibility for any injury to people or property resulting from any ideas, methods, instructions or products referred to in the content. |
© 2023 by the authors. Licensee MDPI, Basel, Switzerland. This article is an open access article distributed under the terms and conditions of the Creative Commons Attribution (CC BY) license (https://creativecommons.org/licenses/by/4.0/).