Abstract
The computational modeling of hysteretic dampers is a powerful tool for design, allowing us to predict and optimize damper performance. In this research, a numerical model, based on Chaboche’s nonlinear kinematic hardening constitutive law, was implemented. The parameters of this law were identified and validated by inverse analysis, based on the macro-hysteretic response of the hexagonal honeycomb steel damper. The validated model was applied to simulate the cyclic loading behavior of five proposed steel plate shear yielding dampers (SPSYDs), which were then used to compare the hysteretic performance in terms of effective stiffness, effective damping, and energy dissipation capacity. The parametric analysis of design variables performed on the SPSYDs demonstrated that the plate depth does not modify the effective damping, and the thickness is the most significant factor affecting the maximum displacement, dissipation energy and endurance cycles. The comparison of the performance of the dampers allowed us to establish design guidelines for the SPSYDs, which allow the device to be adjusted with the requirements of the building in which it is installed.
1. Introduction
Although the conventional approach to seismic-resistant building design prioritizes people’s safety over structural damage [1], localized plastic deformation, or failure of lateral load-resisting structural elements, can still occur during earthquakes. To ensure the structural integrity of buildings, the damaged element must be completely replaced [2]. This has a significant impact on repair costs. The estimated damage losses from the 2010 earthquake in Chile (8.8 Mw) were around USD 30 billion in total, with USD 21 billion in infrastructural damage [3]. In this context, seismic protection systems are an additional effective construction element that help to mitigate structural damage and, therefore, increase people’s safety. Depending on their control mechanisms, these protection systems can be classified as active, semi-active, hybrid, and passive [4]. Passive protection systems are the focus of this article, as they provide highly efficient and low-cost structure damping without the need for an external energy source [5,6].
Dampers are a type of passive control system and can be classified into displacement-dependent, velocity-dependent and motion-dependent devices or re-centering systems [7]. Displacement-dependent devices are activated in the presence of a relative displacement between their ends. This kind of damper is subdivided into frictional [8] and metallic dampers [9]. The latter, also known as yielding or hysteretic dampers, dissipate energy through plastic deformation occurring within the damper material [10,11].
Research on hysteretic dampers has focused on the design of new devices and the improvement of existing ones. In the first case, damper topologies with enhanced dissipation capacity are sought, such as hexagonal plates in the Hexagonal Honeycomb Steel Damper (HHSD) [12] and corrugated tubes in the Accordion Metallic Damper (AMD) [13]. In contrast, among the proposals for improving existing dampers is the Multi-Slit Damper (MSD), which solves the problem of fracture at large displacements of the Steel Slit Damper (SSD). The SSD is a standard structural wide-flange section with slits cut on the web [14], while the MSD consists of two steel plate slit dampers: a Weak (W-SD) and a Strong Slit Damper (S-SD). The W-SD is activated in small earthquakes, and its deformation is limited in large earthquakes, giving way to the deformation of S-SD and preventing fracture [15]. Another example is the proposed improvement of the TADAS damper, which facilitates assembly and reduces manufacturing costs [16].
Regarding the shape of the damper, several authors have proposed different configurations: concentric cylinders [17], I-shaped plate [18], steel plate [19,20] and tube [11,21], among others.
The absence of a standard procedure for the selection or design of dampers may be justified by the variety of geometries, the complexity of stress distribution, and specific performance requirements, such as the flexibility and dissipation capacity of each application.
In the absence of this standard for the design and performance evaluation procedure, benchmarking is not straightforward. Table 1 shows that different materials, dimensions and loading protocols are used, making it difficult to say whether one damper is better than another.

Table 1.
Comparison between investigations of shear dampers.
Finite element methods have been used to identify the influence of design parameters on the mechanical behavior of parts and mechanisms [28], and, when combined with optimization algorithms, the design can be improved [29]. In the case of dampers, numerical analysis based on finite element modeling has proven to be an effective tool for the design and evaluation of the hysteretic behavior of dampers, and for the optimization of their inter-story drift performances [15,21,30,31,32,33,34].
The plastic deformation in dampers can be related to axial, bending, torsion and shear stresses, or a combined state. Dampers that are primarily subjected to shear stresses include TLYD, SL and LYSPD [17,18,19]. Other devices, such as BSD, CHSD and SBYC, are subjected to shear and bending stresses [20,21,35], while the recently proposed MYP and TSTD operate under pure-bending conditions [36] and torsional yielding [37], respectively. In addition, metallic dampers exposed to shear stresses may be connected to the structural member as an energy dissipation panel combined with bracing, in an interior column or as a shear wall or link type [9,25,38,39,40,41].
Materials undergoing cyclic deformations within the plastic range exhibit numerous mechanical phenomena, such as ratcheting [42], the Bauschinger effect [43,44] and low cycle fatigue damage [45]. The large continuous incremental plastic deformations of metallic materials also induce the accumulation of damage, microcracks and macroscopic fractures, causing the dampers to lose their ability to dissipate energy. Computational simulations which aim to predict such mechanical behavior must, therefore, consider these effects through a suitable constitutive law in conjunction with a set of parameters validated via experimental tests. Some of the most used laws are multilinear pure isotropic hardening [17], bi or multilinear coupled isotropic–kinematic hardening [10,46], coupled isotropic and Armstrong–Frederick kinematic hardening [27] and complex Chaboche-type coupled isotropic–kinematic hardening formulations [18,20,47,48]. In this work a Chaboche-type formulation was used.
The purpose of this work is to study five different Steel Plate Shear Yielding Dampers (SPSYD) through computational simulations, using finite elements to compare their performances. It also seeks to determine the impact of geometric parameters, such as the depth and thickness of the plate and the number of diagonals considered in the damper.
This work determines the parameters that define a damper and ways to adapt them to the requirements of an individual building. All of this was achieved prior to the experimental phase. These parameters are: elastic stiffness, yield force, yield displacement, maximum force and displacement reached, ductility, cycles until failure, effective stiffness, effective damping and dissipated energy.
The article is organized as follows: Section 2 describes the finite element model and research procedure used in this study. Section 3 presents the hysteresis curves, the failure modes and the characteristic parameters of a damper, as well as the influence of thickness, depth and number of diagonals on the behavior of the device. A discussion of the results and design recommendations is presented in Section 4. Conclusions and research projections are presented in Section 5.
2. Materials and Methods
The finite element analysis was performed in Ansys Workbench 19.1 software. The proposed model was calibrated and validated by the study of the HHSD [12] and, subsequently, used to evaluate the behavior of new dampers. Thus, only validation of the plasticity model and related parameters was performed, based on the HHSD study [12]. Then, maintaining these conditions, new geometries were proposed and their results were compared. Thus, the study carried out requires an experimental stage in the future, before the dampers can be used in a structure.
The SPSYD dampers can be installed on the structure, as shown in Figure 1a. In this investigation, the different SPSYDs are modeled as a three-dimensional body consisting of three parts: two support plates and a dissipating plate. The support plate transmits the movement of the building to the dissipating plate located in the central area of the damper (see Figure 1b). An assessment of the performance of five different SPSYDs was performed. The plates were identified as P1, P2, P3, P4 and P5 and are described in further detail in Section 3. Furthermore, a parametric analysis was performed. Thus, the effects of changes in depth (D) and thickness (T) were independently studied, keeping the other dimensions constant. The influence of modifying the number of diagonals on two dampers was also studied, since the diagonals connect the support plates between them.
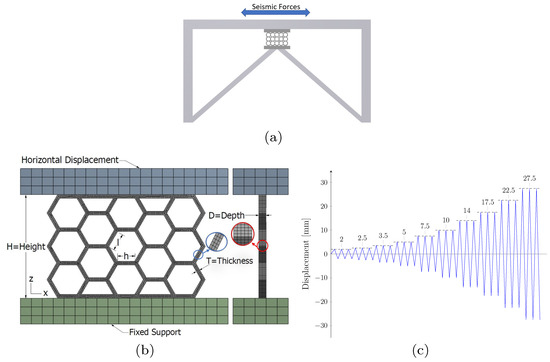
Figure 1.
(a) SPSYD installation scheme in the structure. (b) HHSD with dimension nomenclature, mesh and boundary conditions for the FE model. (c) Cyclic loading protocol.
2.1. Finite Element Model
In the HHSD study, the finite element model was implemented in ABAQUS and the kinematic–isotropic hardening model was used for plastic behavior. This model is based on the Chaboche model according to the software manual [49].
In this research, to simulate the plastic behavior of the material, a Chaboche-type rate-independent nonlinear kinematic hardening model was used [50]. This model has proved suitable for predicting the yielding and strain hardening of several hysteretic dampers under cyclic loads [18,23,51].
The Chaboche model implemented in Ansys comprises a linear elasticity zone, the Von Mises yield criterion and the associated flow rule. The latter depends on the back stress (), which is defined by Equations (1) and (2) [23,48,52]. Thus, the back stress is composed of n kinematic models (Equation (1)), each identified by the subscript i. Furthermore, the evolution of the i-th back stress (), defined by Equation (2), is related to the plastic strain increment , the equivalent plastic strain increment and the material constants and , which correspond to terms of the hardening and dynamic recovery functions, respectively.
We implemented one kinematic model (see Figure 2a), so the data required for the software were the stress and plastic strain curves of the material, the yield stress, and the constants and of the nonlinear kinematic hardening model. Additionally, the elastic behavior of the material was defined by Young’s modulus and Poisson’s ratio. To simulate the damage to the material, an element death technique was implemented in the software parametric design language (APDL) using the ekill command. The onset of the deactivation of kill elements occurs when the stress or strain threshold is exceeded. The deactivated element remained in the model with a stiffness value close to zero [53]. This technique allowed us to predict the failure mode of the investigated plate by removing the killed elements from the model and required only one failure parameter for calibration.
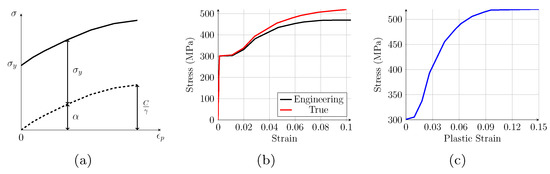
Figure 2.
(a) Chaboche model with one kinematic model. (b) Experimental engineering and true stress–strain behavior of the material. (c) True stress vs. true plastic strain data for initial direct kinematic hardening model calibration.
The boundary conditions are shown in Figure 1b. The bottom support plate was completely fixed. The top plate was constrained for vertical displacement in the z-axis, and horizontal displacement in the x-axis was given by the loading protocol, shown in Figure 1c. Note that a similar protocol was also applied in the study of the BD [44]. On the other hand, the displacements in the y-axis direction were not constrained; however, only the material nonlinearity and large deflections were considered.
2.2. FE Model Calibration and Validation
The steel data obtained in the HHSD investigation [12] were used to model the low cycle behavior of the material. Initial yield stress, Poisson’s ratio and Young’s modulus were directly set with the values 301 MPa, 0.3, and 200 GPa, respectively. In addition, the engineering stress–strain ( vs. ) curve of the steel reported in [12] was used to obtain the true stress–strain ( vs. ) relationship (see Figure 2b), through equations and . Furthermore, the hardening curve in the plastic range (see Figure 2c) required for the direct calibration of the initial parameter set of the plasticity model can be obtained from and , where is the plastic strain, is the elastic strain, and E is the Young’s modulus of the material. In Figure 2c the endpoint of the curve was the plastic strain 0.1 with a stress of 520 MPa. However, to avoid problems due to any element exceeding that value of plastic deformation, the curve was extended, maintaining the stress value up to the plastic strain of 0.15. The parameters = 9.8476 GPa and = 30.523 were identified via automatic curve fitting of the nonlinear kinematic hardening model.
With the parameters of the plasticity model already identified, we proceeded to the validation of the model. For this purpose, two different HHSDs were simulated, named HHSD n°1 and HHSD n°7 in [12]. Their dimensions in millimeters were L = 213.62, D = 10, T = 5 and l = h = 23.09 and their H was 140 and 185 for HHSD n°1 and n°7, respectively. The HHSD dimension nomenclature is shown in Figure 1b.
The simulated dampers were discretized using a three-dimensional 20-node brick-like element with three degrees of freedom of displacement in the three orthogonal directions of space (SOLID186). The element included a mixed formulation capability of large deformations of incompressible elastoplastic materials. The convergence analysis of the mesh concerning the element size is shown in Table 2. For this analysis, a displacement of 3 mm was applied in both positive and negative directions and the maximum supported forces and were recorded, respectively. In addition, Table 2 shows the errors of these forces concerning those obtained with the elements of 1 mm. Since the computation time, when decreasing the element size from 2 to 1 mm, increased more than 7 times, when applying the complete loading protocol of Figure 1c the computation time was very high. For this reason, a mesh with elements of 2 mm was selected, since it presented a good relation between accuracy and computation time.
Table 2.
Mesh convergence with respect to element size.
The equivalent plastic strain of 0.1 was used as the limit value for the ekill function, since the maximum stress supported by the material occurs at this plastic strain value (see Figure 2c). The HHSDs studied in [12] are made up of two parallel plates. Due to this distribution, the behavior of each of the plates is expected to be the same, and the total force of the system is the sum of the forces of the components. For this reason, only one plate was simulated in order to reduce computational costs and the force values obtained were multiplied by two to obtain the force of the complete device and compare the results shown in Figure 3a,b. These figures compare the experimental and simulated hysteresis shown in [12] with the curve obtained with the model described in this research, showing good correlation.
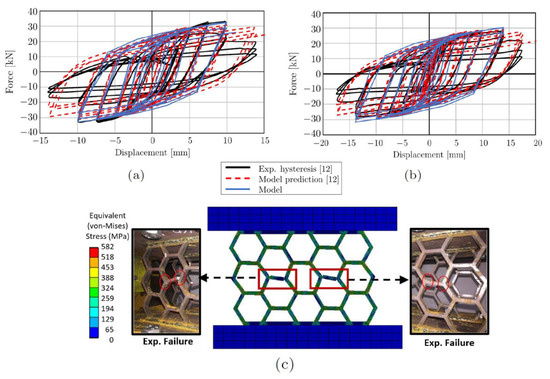
Figure 3.
Model validation. Comparison of load–displacement hysteresis curves from models and experiments of (a) HHSD n°1 and (b) HHSD n°7 and (c) comparison of fracture zones of HHSD model and experiments.
Note that the model was not able to compute the last cycle due to convergence issues related to the overall loss of the carrying load capacity of the material when certain elements reached the plastic strain threshold set to trigger the ekill command. Note that the maximum energy dissipation capacity of the HHSD was mainly determined by the cycle at maximum load reached. Using this methodology, the displacement exhibiting the maximum and minimum force values withstood by both dampers was found to be in agreement with the results presented in [12]. Regarding the magnitude, the variations were close to 5% in the case of HHSD n°1. For HHSD n°7, the greatest difference between our model and [12] was 7.8% in the magnitude of the minimum supported force.
Furthermore, [12] notes that HHSD n°1 begins to lose about 20% of its dissipation capacity in each consecutive cycle starting at cycle 19. The FE simulation lost convergence after the 19th cycle (14 mm applied displacement). This was regarded as a consequence of the considerable loss of load-carrying capacity of the damper at the onset of fracture (see Figure 3a). This allowed the model to be validated in terms of the prediction of the supported cycles and the maximum loads. Furthermore, Figure 3c shows that the model proposed in this research was able to reproduce the same damper deformations and local failure locations observed in the experimental test of the HHSD [12].
3. Results
After the modeling and validation phases, new geometries inspired by the HHSD were proposed. The design process started by orienting the material in the direction of the principal stresses of the plate. Based on the results, the design was modified and ways to make it more flexible were studied. The behavior of these new geometries were obtained with computational simulations. If the performance of the plate was similar to that of one of the plates of the HHSD n° 1, the influence of the parameters on the design was studied, otherwise a new plate was designed.
3.1. Simulation Results of SPSYDs
As the dissipating plate is subjected to shear stresses, the principal stresses are oriented in 45°. Therefore, geometry P1 was designed with diagonals in that orientation (see Figure 4a). This plate was able to support small displacements, because it was very rigid, as shown by its hysteresis curve (see Figure 5a). The criterion for establishing the number of cycles that a damper can withstand is that if, at a given displacement value, the force between two consecutive cycles decreases by more than 10%, the damper cannot continue to dissipate energy due to the degradation of the material’s properties. Based on this criterion, P1 supported 5 load cycles and produced fractures in the vertical bars in the area near the support plate, as shown in Figure 6a. This failure mode was related to the bars oriented at 45° that were not attached to the support plates, generating higher stresses in the vertical bars that joined the diagonal to the base. For this reason, geometry P2 was proposed (see Figure 4b), keeping the bars oriented at 45°, but without the vertical bars that failed in P1. By not having these bars, P2 reached lower forces than P1 (see Figure 5b). P2 failed in cycle 11, after undergoing a decrease of 14% when applying the 5 mm displacement for the second time. The fracture occurred in the central rhombus of the geometry (see Figure 6b), which corresponded to the intersection of the diagonals whose two ends were directly connected to the support plates.
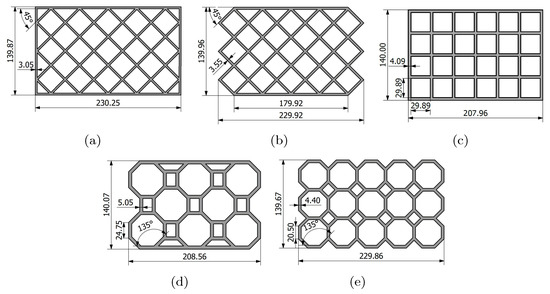
Figure 4.
Dissipating plates for SPSYD (a) P1, (b) P2, (c) P3, (d) P4 and (e) P5 (dimensions in mm).
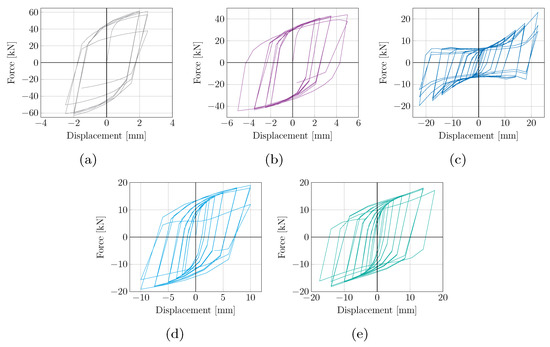
Figure 5.
Hysteresis curves of SPSYDs (a) P1, (b) P2, (c) P3, (d) P4 and (e) P5.
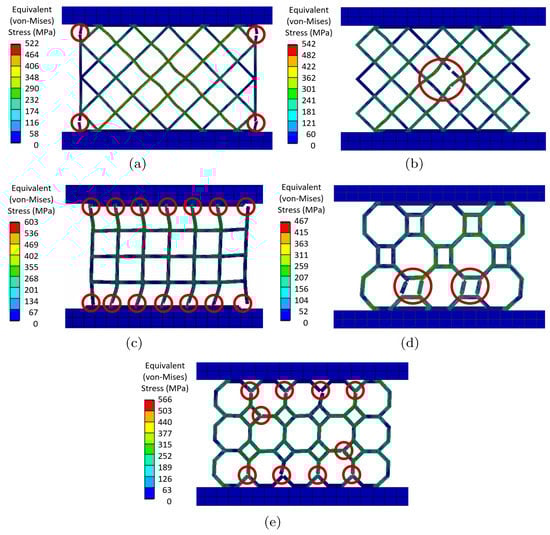
Figure 6.
Failure modes of SPSYDs (a) P1 [ cycle], (b) P2 [ cycle], (c) P3 [ cycle], (d) P4 [ cycle] and (e) P5 [ cycle].
Since the first two geometries analyzed supported few load cycles due to their stiffness, P3 was proposed (see Figure 4c). In this design, 45° diagonals were avoided and the support plates were connected vertically. Being more flexible, P3 reached small forces compared to P1 and P2. In the hysteresis of P3 (Figure 5c), due to its low stiffness, the pinching phenomenon occurred, leading to a reduction in dissipated energy. This phenomenon also occurred in other dampers subjected to shear stress [17,26,54]. P3 could withstand 25 cycles of the loading protocol, due to its flexibility. In cycle 26, when applying the displacement of 22.5 mm for the second time, the force associated with this displacement decreased by 26% with respect to the previous cycle. P3 failed in the areas close to the support plates, as shown in Figure 6c.
The results of P1, P2 and P3 showed that the 45° diagonals have an important influence on the behavior of a damper subjected to shear stresses, since they stiffen the structure and avoid the phenomenon of pinching in the hysteresis. Thus, the diagonals of geometries P1 and P2 were modified through bifurcation with rectangles in order to make them more flexible, which corresponds to the design of geometry P4. On the other hand, since P3 was very flexible, it was modified by adding diagonal zones at 45°, obtaining the P5 geometry. Thus, P4 and P5 geometries have polygons in their design, inspired by HHSD design.
The P4 geometry is shown in Figure 4d. Regarding its behavior, it had stable hysteresis and reached forces greater than P3 (see Figure 5d). Regarding the failure mode, P4 withstood 16 cycles and the force did not decrease significantly, but when a negative displacement of 10 mm was applied, the force decreased by 18% compared to the previous cycle. This reduction doubled in the following cycle and was associated with the fracture of a bar in the lower left rectangle (see Figure 6d).
Finally, P5 geometry is shown in Figure 4e. P5 had stable hysteresis until cycle 21 (see Figure 5e). In cycle 22, when the displacement was increased to 17.5 mm, the force was reduced by 15.6% relative to the force of 14 mm in cycle 21, due to fractures in the lower and upper zones (Figure 6e).
It is important to mention that to compare hysteresis curves, the dampers were designed with the same depth (10 mm) and similar values to the material volume and the height of a single plate of HHSD n° 1, with variations of less than 0.48% and 0.23%, respectively.
Figure 7 shows the envelope curves of the studied geometries, demonstrating the successive union of the maximum force of the first cycle at each displacement value. In this case, envelope curves were considered up to the point at which the maximum force magnitude occurred in the direction of positive and negative displacements. After that, the properties of the material began to degrade, reducing the force supported by the damper, as well as the amount of energy dissipated.
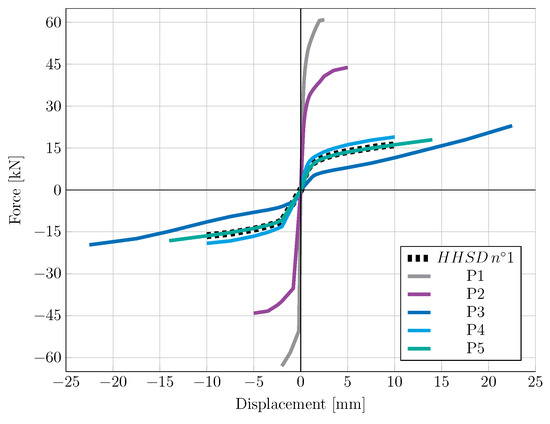
Figure 7.
Comparison of the envelope curves of the studied geometries.
In Figure 7, the black segmented line represents the behavior of a plate of HHSD n°1. P4 and P5 supported forces similar to, or greater than, HHSD n°1 with close displacement values, while P3 was less rigid and supported larger displacements.
Additionally, yielding dampers are characterized through parameters such as elastic stiffness (), yield force (), yield displacement () and ductility (). The ductility of a damper is obtained by [5], where is the maximum displacement achieved by the damper and is the yield displacement. Table 3 shows the aforementioned parameters for the studied geometries and the maximum forces (, ) and displacement values (, ) achieved in the positive and negative directions. All these parameters can be obtained from the hysteresis curve, as shown in Figure 8. Table 3 also shows the number of full cycles of the loading protocol that it withstood until its degradation and the number of nodes and elements of the model.
Table 3.
Summary of finite element analysis results.
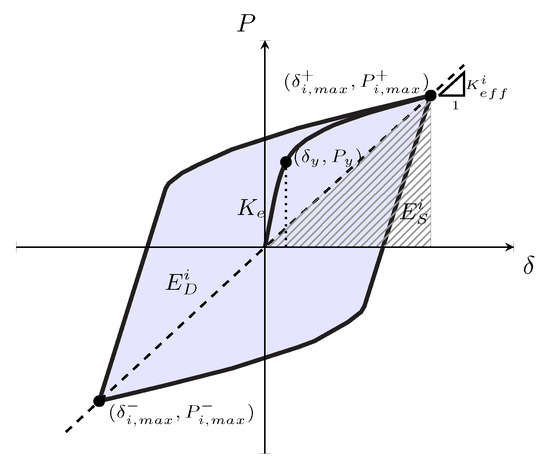
Figure 8.
Parameters of a damper from the hysteresis curve.
In addition to the parameters in Table 3, dampers are characterized by effective stiffness, dissipated energy, and effective damping, also known as equivalent viscous damping. The effective stiffness of each cycle was the slope between the extreme points of a cycle of the hysteresis curve (see Figure 8) and was calculated using Equation (3) [35]. This value allowed us to determine the elastic deformation energy (), which was related to the effective damping (), as shown in Equation (4) [55]. Effective damping represents the energy dissipation capacity of a hysteretic system and is related to the displacement of the damper [1,35]. Finally, the energy dissipated in each cycle () was the area under the hysteresis curve for that cycle.
The effective stiffness value was calculated for each cycle supported by the damper. However, to simplify its visualization, Figure 9a shows the average effective stiffness of the cycles at the same displacement. In all geometries, a decrease in stiffness was observed as the applied displacement increased. This decrease followed a potential trend in P3, P4 and P5, which had the same behavior of the reference damper HHSD n°1. In P1 and P2, the trend was unclear because they were very rigid and, thus, supported small displacements.
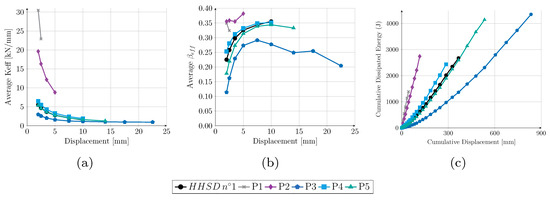
Figure 9.
Relevant parameters for P3, P4 and P5. Average values for the three cycles at the same applied displacement: (a) Effective stiffness and (b) effective damping. (c) Cumulative dissipated energy vs. cumulative displacement.
Figure 9b shows the average effective damping values for each applied displacement. In geometries P3, P4 and P5, the damping in the first stage increased along with the applied displacements. After reaching the maximum value, it began to decrease due to the fracture of the plate. In P1 and P2, the effective damping values had slightly higher magnitudes with respect to the other geometries. However, it was impossible to replicate the trend because, in P2, the first three values were very similar to each other, while P1 only had two points.
Finally, Figure 9c shows the cumulative dissipated energy vs. cumulative displacement of the damper, which is the value of the total path of the device. Although P3 had the lowest stiffness (see Table 3) and dissipated the lowest amount of energy in each cycle, Figure 9c, it dissipated the most energy, since it withstood greater displacements of the loading protocol. Additionally, P1 and P2 were stiffer and dissipated a lot of energy, but had the lowest accumulated displacement values. This implies that the device failed prematurely and could not continue to protect the building from seismic loads.
3.2. Influence of Depth and Thickness on the Behavior of Dampers
Considering the geometries with the best performance (P3, P4 and P5), we studied how the dimensions of depth (D) and thickness (T) affected their behavior.
In the variation of depth (D), the nomenclature used was PX–DX, where PX is the number specifying the geometry and DX is the depth of the plate. For each geometry, there were three depths of 8, 10 and 12 mm. All other dimensions remained the same. For the change in thickness (T), the nomenclature was PX–TX, where PX is the number of the geometry and TX refers to the factor by which the original thickness was multiplied. In this case, the geometries were 10 mm deep and the thickness was amplified by 1.5 and by 2, to obtain PX-T1.5 and PX-T2, respectively. The increase in thickness was based on the neutral line in the original design to minimize the height change of the geometry.
Figure 10 shows the envelope curves, the effective stiffness and damping graphs and the cumulative dissipated energy vs. cumulative displacement for the three dampers. The blue curves correspond to P3, the light blue curves correspond to P4 and the emerald curves correspond to P5. In the envelope curves, D changed, and the shape of the curve remained the same and shifted on the vertical axis, as the supported force increased proportionally to this dimension. The same proportional relationship was also fulfilled for the elastic stiffness shown in Table 4 and the effective stiffness in Figure 10. In contrast, as T increased, the envelope curve had greater curvature in the plastic zone, and the number of cycles decreased (see Table 4). Additionally, modifying T produced a larger change in elasticity and effective stiffness. Regarding effective damping, this value remained the same in the three dampers in which D varied. However, as T varied, the effective damping changed.
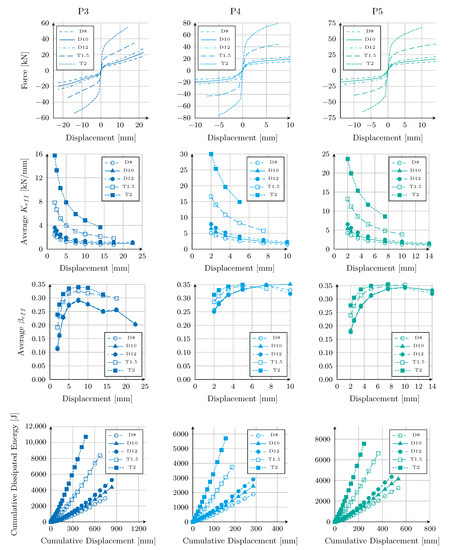
Figure 10.
Influence of depth (D) and thickness (T) on the behavior of dampers P3, P4 and P5. D10 is the original design of each plate.
Table 4.
Summary of the numerical analysis of the parametric variations of depth and thickness of the plates.
In the cumulative dissipated energy curve in Figure 10, an increase in T implied a sudden increase in the dissipated energy. However, the cumulative displacement that the damper could support decreased significantly. Despite the above, P3-T2 was the plate that dissipated the most energy and had a cumulative displacement of 478 mm, which was higher than the cumulative displacements of all P4 plates and slightly less than the cumulative displacement of P5 at 10 and 12 mm deep. Conversely, increasing D increased the dissipated energy but did not affect the accumulated displacement. To quantify how each of these parameters affected the behavior of the damper, the coefficient between the elastic stiffness and the volume of the material was calculated, as shown in Figure 11. These values showed that T had a greater effect on the elastic stiffness value than D for the three geometries.
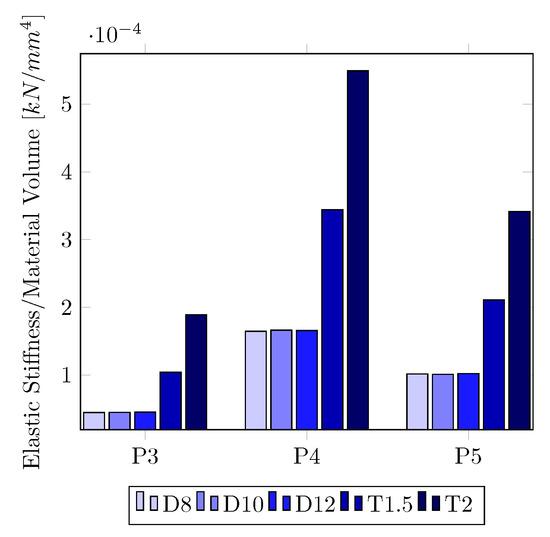
Figure 11.
Variation of elastic stiffness per unit volume for geometries P3, P4 and P5.
Concerning the failure modes, the change in D and T did not influence the fracture zones, as shown in Figure 6c–e.
P3-D8 reached its greatest force in both directions in cycle 25; however, this cycle could not be fully calculated, due to convergence problems associated with the elimination of elements. Thus, P3-D8 only withstood 24 cycles. P3 with depths of 10 and 12 mm withstood 25 cycles, since in cycle 26, the forces decreased by 26% and 28%, respectively. On the other hand, as the thickness increased, the number of cycles that the damper could withstand decreased, since P3-T1.5 and P3-T2 dissipated energy with a decrease of less than 10% in forces up to cycles 23 and 20, respectively.
P4 with a depth of 8, 10, or 12 mm supported 16 cycles. In cycle 17, the force was reduced by 13% in the hysteresis for P4-D8 and 17.6% for P4-D12. By varying T, the damper supported fewer cycles, as shown in Table 4. In cycle 14 for P4-T1.5, the drop in force was 15.6%. In P4-T2, and specifically in cycle 13, the force at -7.5 mm was less than the force achieved at −5 mm, and, thus, it lost the ability to dissipate. Conversely, P5 supported 21 cycles at 8 mm and 10 mm depths. In cycle 22, when a displacement of 17.5 mm was applied, both dampers supported less force than in cycles at 14 mm. The P5-D12 supported 20 load cycles, as the force was reduced by 15.4% when comparing the magnitudes between the first and third cycles at 14 mm. By varying T, P5-T1.5 and P5-T2 supported 18 and 15 load cycles, respectively.
The shape of the hysteresis curve did not vary with changes in depth and thickness for P4 and P5. In P3, the pinching phenomenon in the hysteresis curve was maintained when the depth varied; however, when the thickness increased, the plate stiffened considerably and the pinching phenomenon disappeared, increasing the energy dissipation capacity, as shown in Figure 12.
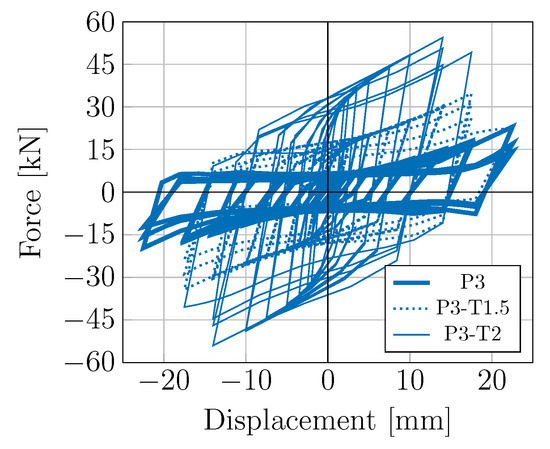
Figure 12.
Hysteresis curves of P3 (original design), P3-T1.5 and P3-T2.
3.3. Influence of the Number of Diagonals on the Behavior of Dampers
In this stage of the investigation, the aim was to improve the dissipation capacity of P4 and P5 by varying the number of diagonals in the design. As an increasing number of diagonals join the damper support plates, the energy dissipated by the device increases. This hypothesis was also verified by the HHSD n°1 damper, whose original design did not have a full diagonal, as shown in Figure 13g. Thus, the number of diagonals present in P4 and P5 varied, as shown in Figure 13, maintaining their initial dimensions of thickness, depth and height (see Figure 4d,e). In HHSD n°1, the thickness, depth and height used in the calibration and validation of the model were maintained. We chose to keep the dimensions constant and not the volume of material, since Figure 11 showed that thickness had a significant impact on the behavior of the damper. Keeping the volume constant did not allow us to separate the effect of the diagonals from the effect of the thickness in the behavior of the device. It is important to mention that the highlighted diagonals in Figure 13 joined the support plates in one direction, but since the design was symmetrical, we found the same number of diagonals in the other direction.
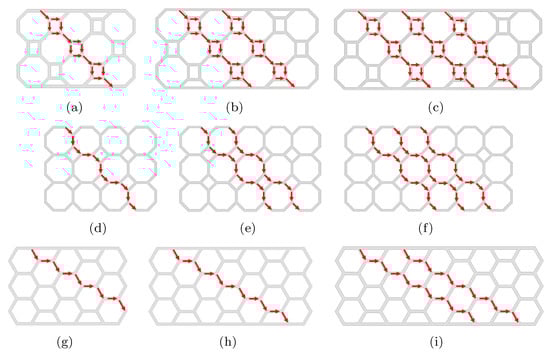
Figure 13.
Schematic view of the number of diagonals in dampers P4, P5 and HHSD. (a) P4-d1, (b) P4-d2, (c) P4-d3, (d) P5-d1, (e) P5-d2, (f) P5-d3, (g) HHSD-d0, (h) HHSD-d1 and (i) HHSD-d2. P4-d1, P5-d2 and HHSD-d0 are the original designs analyzed in the previous sections.
Figure 14 shows the envelope curves, the effective stiffness and damping graphs and the cumulative dissipated energy vs. cumulative displacement for P4 and P5 with one, two and three diagonals and for HHSD n°1 with zero, one and two diagonals. The light blue curves correspond to P4, the emerald curves correspond to P5 and the black curves correspond to HHSD. The number of diagonals in Figure 14 was represented by the number followed by a d. So “2d” means that the damper has two diagonals. In the graphs of effective stiffness, effective damping and dissipated energy, the original design of each damper was represented with triangular markers, since initially P4, P5 and HHSD had one, two and zero diagonals, respectively.
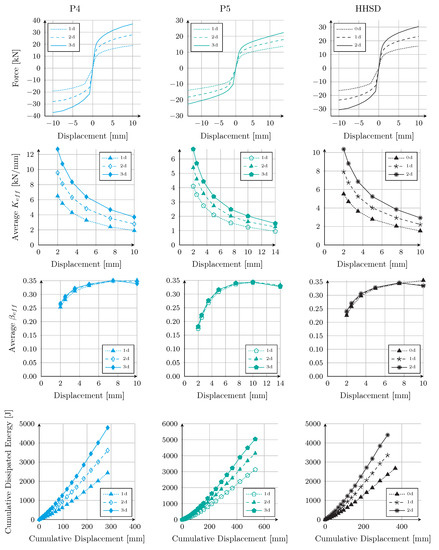
Figure 14.
Influence of number of diagonals on the behavior of dampers P4, P5 and HHSD. 0d, 1d, 2d and 3d represent the number of diagonals in the plate. The behavior of the original design is represented by triangular markers.
The envelope curves of Figure 14 show that an increase in the number of diagonals implied greater forces without reducing the maximum displacement that the geometry could support before fracturing (see Table 5). Hence, the effective stiffness increased by adding more diagonals to the design; however, the effective damping values remained constant.
Table 5.
Summary of numerical performance results as a function of parametric variation of number of diagonals in the design.
Finally, the accumulated energy dissipated increased as more diagonals were included. In P4 and P5, the cumulative displacement did not change, since they withstood 16 and 21 cycles of the load protocol, respectively, with one, two or three diagonals. The HHSD without diagonals withstood 18 cycles; however, with one and two diagonals, it withstood 17 cycles. To quantify the variation, the energy dissipated per unit volume of material was compared, since, when adding diagonals, a plate of greater horizontal length was used. This value is shown in Table 5 as the dissipation rate. P4 increased its energy dissipation per volume unit by 8.4% with two diagonals and 13.5% with three diagonals, compared to the design with one diagonal. In P5, the increase was 7.1% and 9.2% with two and three diagonals, respectively. In the HHSD, as adding diagonals meant one less load cycle, there was a decrease in the rate of dissipation per unit volume. When increasing from zero to one diagonal, the dissipation rate decreased by 8.1%, but when increasing to two diagonals, it increased by 3.5% compared to the HHSD with one diagonal. Thus, we verified that the increase in diagonals in P4 and P5 allowed improvement in the dissipation of these dampers, since the energy dissipated per unit volume of material increased. In the HHSD, the energy dissipated increased, but as it supported fewer cycles, the rate of energy per unit volume decreased.
Regarding the failure modes, the variation in the number of diagonals of the design did not modify the fracture zones exposed in Figure 3 and Figure 6d,e.
Finally, Table 5 shows the variation in the characteristic parameters of the dampers. The results show that the elastic stiffness increased by adding more diagonals to the design, which implied a lower yield displacement and a higher yield force. Additionally, the magnitudes of the maximum and minimum forces of the damper increased, as shown in the envelopes of Figure 14. As the maximum displacements did not vary, but the yield displacement decreased when considering more diagonals, the ductility increased.
4. Discussion
The purpose of this research was to compare the influence of material distribution on the design of five dampers, based on steel plates, through computational simulations. In addition, the effect of geometric parameters, such as the depth and thickness of the plate and the number of diagonals considered in the design, were evaluated to improve the performance of the devices.
Simulations showed that to withstand larger displacements, the damper must have less stiffness. This decreases the magnitude of the hysteresis curve forces; however, the total energy dissipated may be higher, as the devices support larger displacements. In contrast, Figure 9a,b showed that lower stiffness meant lower effective damping values, so it was necessary to find geometry that reconciled these two aspects. As for the trends observed in the effective stiffness and effective damping curves, these were similar to those reported in other damper studies [1,35,56].
Dampers with a performance equal to, or greater than, HHSD n°1 had elastic stiffness values less than 13 and yielded forces less than 9.2 kN. Thus, they were capable of withstanding displacements equal to, or greater than, 10 mm. In terms of cumulative energy dissipation values, P3 and P5 dissipated more energy than a plate of HHSD n°1 using the same amount of material and supporting larger displacements. At the same applied displacement, P4 was stiffer and dissipated more energy than HHSD n°1; however, due to its stiffness, it could only withstand 16 cycles. Thus, when looking at the total curves, it dissipated a slightly smaller amount of energy. P2 dissipated almost as much energy as HHSD n°1, but displayed a much lower cumulative displacement, which is not a good feature for a damper. P1 was more rigid than P2 and supported very small displacements, so it is not recommended as a hysteretic damper.
Based on the exposed stress distributions and the failure modes, we established that, when designing hysteretic dampers subjected to shear stresses, if the material is aligned at 45°, the plate is more rigid, since principal stresses are oriented in that direction. This happened in P1 and P2. Additionally, when 45° diagonals are not attached to the support plate, higher stresses are created in the vertical bars connecting the diagonal to the base. This was why P1 failed.
In addition, the results showed the influence of the number and shape of the diagonals in the design. A dissipating plate without diagonals at 45° is more flexible and supports large displacements with lower force values, which was the case for P3. However, as it is less rigid, pinching appears in the hysteresis curve, which reduces its dissipation capacity. To reduce pinching, the plate’s thickness can be increased. This same effect has been reported for the slit damper [54] and the corrugated steel plate damper [24]. In P4 and P5, 45° diagonals were more flexible because their orientation was interrupted by horizontal and vertical bars. Thus, the stress modified its line of action and the damper withstood more cycles than P1 and P2, with force values higher than P3, compared with the same displacement, and without the presence of pinching in its hysteresis curve.
Otherwise, fracture zones did not depend on the changes in depth and thickness in P3, P4 and P5. Depth changes modified the elastic stiffness of the plate without a significant influence on the number of cycles supported by the damper.
The effect of plate thickness on stiffness was greater than that of depth. This was observed in the variation in the number of cycles that the damper could withstand. Furthermore, Figure 11 shows the elastic stiffness divided by the volume of material, allowing the effect of these two parameters to be quantified. Across all geometries, the coefficient had a higher value with increasing thickness, indicating that it had a greater effect on damper stiffness.
On the other hand, the change in the number of diagonals did not affect the failure mode or the number of cycles that P4 and P5 could withstand. However, increasing the number of diagonals allowed us to increase the stiffness of the damper and the amount of dissipated energy.
Figure 15 shows the coefficient between the total dissipated energy and the material volume of the plate for the modifications of depth and thickness for P3, and also the number of diagonals in P4 and P5. The black line shows the dissipated energy per unit volume of the original design. Increasing the depth to 12mm on the P4 and P5, the dissipation per unit volume decreased, indicating this was a less efficient design than the original, while for the P3 it stayed about the same. Regarding the change in thickness, in P3, when increasing the thickness by 50% (T1.5) or doubling it (T2), the dissipation increased about the same. For P4, when doubling the thickness (T2) the dissipation increased considerably (see Figure 15b), but the maximum displacement decreased. On the other hand, for P5, when the thickness doubled, the damper dissipated less energy per volume unit than the original plate (see Figure 15c). Diagonals were analyzed only on P4 and P5. In both dampers, increasing the diagonals implied an increase in dissipation; however, this increase was greater between the designs with one and two diagonals than those with between two and three diagonals. This graph would allow us to modify the design of the dampers and improve them, considering the stiffness and lateral displacement requirements of a given building, based on the influence of each of the aspects evaluated in this research.
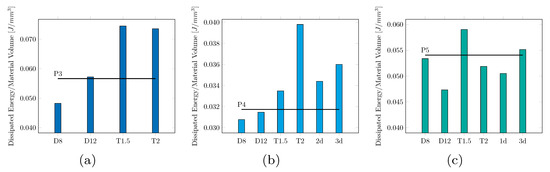
Figure 15.
Coefficient between total dissipated energy and material volume of the dissipating plate for P3 (a), P4 (b) and P5 (c) when depth, thickness, and the number of diagonals vary. The black line represents the coefficient of the original damper design.
Finally, we compared the energy dissipation capacity as a function of effective damping. P3 had values between 0.1 and 0.3, while P4 and P5 had values between 0.2 and 0.35. These effective damping values were higher than those of Steel Plate Fuses, which are between 0.1 and 0.25 [57] and similar to those of Comb-Teeth dampers (CTDs), which are between 0.2 and 0.4 [27]. Thus, SPSYDs P3, P4 and P5 performed adequately as seismic dampers.
5. Conclusions
A computational procedure was adapted to investigate the influence of the design of the dissipating plate in steel plate shear yielding dampers (SPSYDs). The complete set of parameters that define a damper were determined for five studied dampers (elastic stiffness, yield force, yield displacement, maximum force and displacement reached, ductility, cycles until failure, effective stiffness, effective damping and dissipated energy), so that it was possible to compare them with other dampers. The numerical results allowed us to determine the three best geometries to work as dampers and to assess the dissipation behavior of the different investigated SPSYDs as a function of variations in shape and internal dimensions. The geometries proposed in this paper were inspired by the HHSD and the design process was focused on understanding the influence of the material orientation on the damper performance. Our findings were as follows.
- The performance of a damper can be significantly affected in terms of flexibility and dissipation capacity through modification of its geometry and by maintaining a constant amount of material.
- The presence of infill material patterns oriented at 45° and generating diagonals of connected material between the support plates increases the rigidity of the damper under shear stresses. To avoid premature fracture, interruptions of these diagonals using bars or material configuration with orientation changes should be used to increase flexibility and maintain uniform flow stress distribution.
- Considering the damper designs resulting in adequate seismic performance (P3, P4, P5), a change in plate depth does not affect the effective damping. Stiffness is indeed directly proportional to this dimension.
- A variation in the thickness of the plate causes a significant change in the damper flexibility, since it modifies the resistive amount of material in the shear plane.
- The number of infill material diagonals influences the stiffness and the dissipated energy capacity, without affecting the maximum number of cycles that the damper withstands prior to failure.
Thus, this study allowed us to establish the influence of the design parameters on the behavior of SPSYDs and the orientation of the material, which allows researchers to improve the performance of these devices before the experimental phase. In addition, the design indications allow parameters, such as effective stiffness, effective damping and maximum forces, to be adjusted, based on the requirements of the building, to achieve better protection and to reduce repair costs after an earthquake. If the effective damping required by the building matches the designed damper, the depth of the plate and the number of diagonals of the design can be modified to adjust the stiffness to the requirements, without affecting the maximum displacement that the device supports. On the other hand, if a greater variation in stiffness is needed, the thickness can be modified.
In addition, this research demonstrated that, by modifying the material orientation in the damper plate design, it is possible to improve its performance, using the same amount of material. Thus, P3 and P5 supported larger displacements and dissipated more energy than HHSD. In regard to P1, P2 and P4, which were stiffer, more energy per cycle was dissipated than HHSD, but fracture occurred at a lower number of load cycles. Thus, several damper options were proposed and studied, which can be used, depending on the specific requirements of the building to be analyzed.
Future research should be orientated toward the experimental validation of the model. In addition, new geometries can be studied with diagonals oriented at angles other than 45° and researchers should investigate other ways to make them more flexible, as well as considering damper sizing methodologies to increase the energy dissipation per unit volume of material, while satisfying the seismic protection requirements of a building.
Author Contributions
Conceptualization, F.B. and J.H.; methodology, F.B. and J.H.; validation, F.B. and J.H.; investigation, F.B.; resources, J.H.; data curation, F.B.; writing—original draft preparation, F.B. and J.H.; writing—review and editing, V.T.; visualization, F.B., J.H. and V.T.; supervision, J.H.; All authors have read and agreed to the published version of the manuscript.
Funding
Funding was provided by the Agencia Nacional de Investigación y Desarrollo (ANID) through Beca de Doctorado Nacional/2020-21200973.
Institutional Review Board Statement
Not applicable.
Informed Consent Statement
Not applicable.
Data Availability Statement
Data sharing is not applicable to this article.
Conflicts of Interest
The authors declare no conflict of interest.
References
- Teruna, D.R.; Majid, T.A.; Budiono, B. Experimental study of hysteretic steel damper for energy dissipation capacity. Adv. Civ. Eng. 2015, 2015, 631726. [Google Scholar] [CrossRef]
- Sahoo, D.R.; Singhal, T.; Taraithia, S.S.; Saini, A. Cyclic behavior of shear-and-flexural yielding metallic dampers. J. Constr. Steel Res. 2015, 114, 247–257. [Google Scholar] [CrossRef]
- de Chile, G. Propuestas Plan de Acción de Restauración y Reconstrucción Patrimonial Debido al Terremoto y Maremoto del 27 de Febrero del 2010. 2010. Available online: https://www.google.com.hk/url?sa=t&rct=j&q=&esrc=s&source=web&cd=&ved=2ahUKEwi0hcqH6eH9AhWqTmwGHcI9AcMQFnoECAkQAQ&url=https%3A%2F%2Fwww.desarrollosocialyfamilia.gob.cl%2Fpdf%2Fplan-reconstruccion-resumen-ejecutivo.pdf&usg=AOvVaw11j3ne0X5iaWvuhdk3_D4N (accessed on 13 March 2023).
- Saaed, T.E.; Nikolakopoulos, G.; Jonasson, J.E.; Hedlund, H. A state-of-the-art review of structural control systems. J. Vib. Control. 2015, 21, 919–937. [Google Scholar] [CrossRef]
- Javanmardi, A.; Ibrahim, Z.; Ghaedi, K.; Benisi Ghadim, H.; Hanif, M.U. State-of-the-Art Review of Metallic Dampers: Testing, Development and Implementation. Arch. Comput. Methods Eng. 2020, 27, 455–478. [Google Scholar] [CrossRef]
- Teruna, D.R.; Wijaya, H. Seismic fragility assessment of building with metallic hysteretic damper in consideration of stiffness ratio. Key Eng. Mater. 2018, 765, 377–382. [Google Scholar] [CrossRef]
- Ranaei, O.; Aghakouchak, A.A. A new hybrid energy dissipation system with viscoelastic and flexural yielding strips dampers for multi-level vibration control. Arch. Civ. Mech. Eng. 2019, 19, 584–597. [Google Scholar] [CrossRef]
- Francavilla, A.B.; Latour, M.; Piluso, V.; Rizzano, G. Design criteria for beam-to-column connections equipped with friction devices. J. Constr. Steel Res. 2020, 172, 106240. [Google Scholar] [CrossRef]
- Zhai, Z.; Guo, W.; Yu, Z.; He, C.; Zeng, Z. Experimental and numerical study of S-shaped steel plate damper for seismic resilient application. Eng. Struct. 2020, 221, 111006. [Google Scholar] [CrossRef]
- Jarrah, M.; Khezrzadeh, H.; Mofid, M.; Jafari, K. Experimental and numerical evaluation of piston metallic damper (PMD). J. Constr. Steel Res. 2019, 154, 99–109. [Google Scholar] [CrossRef]
- Xiao, L.; Li, Y.; Hui, C.; Zhou, Z.; Deng, F. Experimental Study on Mechanical Properties of Shear Square Section Steel Tube Dampers. Metals 2022, 12, 418. [Google Scholar] [CrossRef]
- Javanmardi, A.; Ghaedi, K.; Ibrahim, Z.; Huang, F.; Xu, P. Development of a new hexagonal honeycomb steel damper. Arch. Civ. Mech. Eng. 2020, 20. [Google Scholar] [CrossRef]
- Motamedi, M.; Nateghi-A, F. Study on mechanical characteristics of accordion metallic damper. J. Constr. Steel Res. 2018, 142, 68–77. [Google Scholar] [CrossRef]
- Chan, R.W.K.; Albermani, F. Experimental study of steel slit damper for passive energy dissipation. Eng. Struct. 2008, 30, 1058–1066. [Google Scholar] [CrossRef]
- Naeem, A.; Kim, J. Seismic performance evaluation of a multi-slit damper. Eng. Struct. 2019, 189, 332–346. [Google Scholar] [CrossRef]
- Zongjing, L.; Ganping, S. Test and evaluation of modified TADAS devices with different grades of steel. Earthq. Eng. Eng. Vib. 2020, 19, 451–464. [Google Scholar] [CrossRef]
- Eskandari, M.; Najafabadi, E.P. Experimental and analytical study of telescopic lead yielding damper. J. Constr. Steel Res. 2018, 150, 371–383. [Google Scholar] [CrossRef]
- Nuzzo, I.; Losanno, D.; Cilento, F.; Caterino, N. Analytical and numerical modelling of shear-link device for seismic energy dissipation in frame structures. Eng. Struct. 2020, 214, 110630. [Google Scholar] [CrossRef]
- Zhang, C.; Zhu, T.; Wang, L.; Wu, M. Ultra-low cycle fatigue performance evaluation of the miniaturized low yield strength steel shear panel damper. J. Constr. Steel Res. 2017, 135, 277–284. [Google Scholar] [CrossRef]
- Guo, L.; Wang, J.; Wang, W.; Wang, H. Experimental, numerical and analytical study on seismic performance of shear-bending yielding coupling dampers. Eng. Struct. 2021, 244, 112724. [Google Scholar] [CrossRef]
- Park, H.Y.; Kim, J.; Kuwahara, S. Cyclic behavior of shear-type hysteretic dampers with different cross-sectional shapes. J. Constr. Steel Res. 2021, 187, 106964. [Google Scholar] [CrossRef]
- Nuzzo, I.; Losanno, D.; Caterino, N.; Serino, G.; Bozzo Rotondo, L.M. Experimental and analytical characterization of steel shear links for seismic energy dissipation. Eng. Struct. 2018, 172, 405–418. [Google Scholar] [CrossRef]
- Yadav, D.; Sahoo, D.R. Validation of hysteretic behavior and prediction of energy dissipation potential of aluminium shear yielding devices. Int. J. Mech. Sci. 2021, 194, 106204. [Google Scholar] [CrossRef]
- Wang, W.; Song, J.l.; Su, S.Q.; Cai, H.l.; Zhang, R.F. Experimental and numerical studies of an axial tension-compression corrugated steel plate damper. Thin-Walled Struct. 2021, 163, 107498. [Google Scholar] [CrossRef]
- Bai, J.; Huang, J.; Duan, L.; Cui, G.; Li, F.; Zhu, L. Seismic performance of a shear-type energy dissipation brace: Experimental investigation and numerical analysis. Eng. Struct. 2022, 273, 115011. [Google Scholar] [CrossRef]
- Kim, J.; Eom, T.S.; Kim, S.B.; Park, H.Y. Mechanical characteristics of H-shaped shear panel damper fabricated by SPHC steel according to stiffener reinforcement and stud support installation. Structures 2022, 42, 563–574. [Google Scholar] [CrossRef]
- Montazeri, E.; Kazemi, S.M.; Askariani, S.S. Finite element parametric study on the cyclic response of steel frames equipped with comb-teeth dampers. Structures 2021, 31, 111–126. [Google Scholar] [CrossRef]
- Huynh, N.T.; Nguyen, T.V.T.; Tam, N.T.; Nguyen, Q.M. Optimizing Magnification Ratio for the Flexible Hinge Displacement Amplifier Mechanism Design. In Lecture Notes in Mechanical Engineering. Proceedings of the 2nd Annual International Conference on Material, Machines and Methods for Sustainable Development (MMMS2020); Long, B.T., Kim, H.S., Ishizaki, K., Toan, N.D., Parinov, I.A., Kim, Y.H., Eds.; Springer International Publishing: Cham, Switzerland, 2021; Volume 2021, pp. 769–778. [Google Scholar] [CrossRef]
- Chau, N.L.; Dao, T.P.; Nguyen, V.T.T. An Efficient Hybrid Approach of Finite Element Method, Artificial Neural Network-Based Multiobjective Genetic Algorithm for Computational Optimization of a Linear Compliant Mechanism of Nanoindentation Tester. Math. Probl. Eng. 2018, 2018, 7070868. [Google Scholar] [CrossRef]
- Chen, Y.; Chen, C.; Jiang, H.; Liu, T.; Wan, Z. Study of an innovative graded yield metal damper. J. Constr. Steel Res. 2019, 160, 240–254. [Google Scholar] [CrossRef]
- Keykhosro Kiani, B.; Hosseini Hashemi, B. Development of a double-stage yielding damper with vertical shear links. Eng. Struct. 2021, 246, 112959. [Google Scholar] [CrossRef]
- Pan, P.; Cao, Y.; Wang, H.; Sun, J. Development of double-stage yielding coupling beam damper. J. Constr. Steel Res. 2020, 172, 106147. [Google Scholar] [CrossRef]
- Ahmadi, Z.; Aghakouchak, A.A.; Mirghaderi, S.R. Cyclic behavior of moment frames with conventional or slit Infills. J. Constr. Steel Res. 2021, 178, 106494. [Google Scholar] [CrossRef]
- Quan, C.; Wang, W.; Li, Y. Hysteretic model and resilient application of corrugated shear panel dampers. Thin-Walled Struct. 2022, 178, 109477. [Google Scholar] [CrossRef]
- Ahmadie Amiri, H.; Najafabadi, E.P.; Estekanchi, H.E. Experimental and analytical study of Block Slit Damper. J. Constr. Steel Res. 2018, 141, 167–178. [Google Scholar] [CrossRef]
- Ghandil, M.; Riahi, H.T.; Behnamfar, F. Introduction of a new metallic-yielding pistonic damper for seismic control of structures. J. Constr. Steel Res. 2022, 194, 107299. [Google Scholar] [CrossRef]
- Lie, W.; Wu, C.; Luo, W.; Wu, C.; Li, C.; Li, D.; Wu, C. Cyclic behaviour of a novel torsional steel-tube damper. J. Constr. Steel Res. 2022, 188, 107010. [Google Scholar] [CrossRef]
- Giannuzzi, D.; Ballarini, R.; Huckelbridge, A.; Pollino, M.; Valente, M. Braced Ductile Shear Panel: New Seismic-Resistant Framing System. J. Struct. Eng. 2014, 140, 04013050. [Google Scholar] [CrossRef]
- Ye, J.; Yan, G.; Liu, R.; Xue, P.; Wang, D. Hysteretic behavior of replaceable steel plate damper for prefabricated joint with earthquake resilience. J. Build. Eng. 2022, 46, 103714. [Google Scholar] [CrossRef]
- Wang, J.; Men, J.; Zhang, Q.; Fan, D.; Zhang, Z.; Huang, C.H. Seismic performance evaluation of a novel shape-optimized composite metallic yielding damper. Eng. Struct. 2022, 268, 114714. [Google Scholar] [CrossRef]
- Valente, M.; Castiglioni, C.A.; Kanyilmaz, A. Welded fuses for dissipative beam-to-column connections of composite steel frames: Numerical analyses. J. Constr. Steel Res. 2017, 128, 498–511. [Google Scholar] [CrossRef]
- Xu, L.Y.; Fan, J.S.; Yang, Y.; Wang, C. Ratcheting assessment of low yield point steel BLY160: Experimental analysis and constitutive modelling. Mech. Mater. 2020, 148, 103460. [Google Scholar] [CrossRef]
- Gao, Y.; Shi, G.; Wang, X. Mechanical properties of low yield point steels subjected to low-cycle structural damage. J. Constr. Steel Res. 2021, 183, 106733. [Google Scholar] [CrossRef]
- Ghaedi, K.; Ibrahim, Z.; Javanmardi, A.; Rupakhety, R. Experimental Study of a New Bar Damper Device for Vibration Control of Structures Subjected to Earthquake Loads. J. Earthq. Eng. 2021, 25, 300–318. [Google Scholar] [CrossRef]
- Benavent-Climent, A.; Escolano-Margarit, D.; Arcos-Espada, J.; Ponce-Parra, H. New metallic damper with multiphase behavior for seismic protection of structures. Metals 2021, 11, 183. [Google Scholar] [CrossRef]
- Rahnavard, R.; Hassanipour, A.; Mounesi, A. Numerical study on important parameters of composite steel-concrete shear walls. J. Constr. Steel Res. 2016, 121, 441–456. [Google Scholar] [CrossRef]
- Morch, H.; Duchêne, L.; Harzallah, R.; Tuninetti, V.; Habraken, A.M. Efficient temperature dependence of parameters for thermo-mechanical finite element modeling of alloy 230. Eur. J. Mech. A/Solids 2021, 85, 104116. [Google Scholar] [CrossRef]
- Chaboche, J.L. Constitutive equations for cyclic plasticity and cyclic viscoplasticity. Int. J. Plast. 1989, 5, 247–302. [Google Scholar] [CrossRef]
- ABAQUS Inc. Chapter Models for metals Subjected to Cyclic Loading. In ABAQUS Theory Manual Version 6.7. Available online: http://130.149.89.49:2080/v6.7/books/usb/default.htm?startat=pt05ch18s02abm16.html (accessed on 13 March 2023).
- ANSYS Inc. ANSYS Mechanical APDL Material Reference, Release 15.0; ANSYS Inc.: Canonsburg, PA, USA, 2013. [Google Scholar]
- Briones, B.; de la Llera, J.C. Analysis, design and testing of an hourglass-shaped copper energy dissipation device. Eng. Struct. 2014, 79, 309–321. [Google Scholar] [CrossRef]
- ANSYS Inc. ANSYS Mechanical Help System, Release 19.3, Rate-Independet Plasticity; ANSYS Inc.: Canonsburg, PA, USA, 2019. [Google Scholar]
- ANSYS Inc. ANSYS Mechanical APDL Command Reference, Release 13.0; ANSYS Inc.: Canonsburg, PA, USA, 2010. [Google Scholar]
- Keykhosro Kiani, B.; Hosseini Hashemi, B.; Torabian, S. Optimization of slit dampers to improve energy dissipation capacity and low-cycle-fatigue performance. Eng. Struct. 2020, 214, 110609. [Google Scholar] [CrossRef]
- Chopra, A.K. Dynamics of Structures: Theory and Applications to Earthquake Engineering; Prentice-Hall: Hoboken, NJ, USA, 2001. [Google Scholar]
- Zhao, B.; Lu, B.; Zeng, X.; Gu, Q. Experimental and numerical study of hysteretic performance of new brace type damper. J. Constr. Steel Res. 2021, 183, 106717. [Google Scholar] [CrossRef]
- Lin, X.; Li, H.; He, L.; Zhang, L. Experimental study on seismic behavior of the damage-control steel plate fuses for beam-to-column connection. Eng. Struct. 2022, 270, 114862. [Google Scholar] [CrossRef]
Disclaimer/Publisher’s Note: The statements, opinions and data contained in all publications are solely those of the individual author(s) and contributor(s) and not of MDPI and/or the editor(s). MDPI and/or the editor(s) disclaim responsibility for any injury to people or property resulting from any ideas, methods, instructions or products referred to in the content. |
© 2023 by the authors. Licensee MDPI, Basel, Switzerland. This article is an open access article distributed under the terms and conditions of the Creative Commons Attribution (CC BY) license (https://creativecommons.org/licenses/by/4.0/).