Article

Effects of the Location of Heating Sources on Indoor Air Quality in Rural Buildings of Qingdao (China) in Winter as Determined by Experimental Monitoring

1
College of Architecture and Urban Planning, Qingdao University of Technology, Qingdao 266033, China
2
Innovation for Sustainable Maritime Architecture Research and Technology, Qingdao University of Technology, Qingdao 266033, China
3
Department of Architecture, The University of Kitakyushu, Kitakyushu 808-0135, Japan
*
Author to whom correspondence should be addressed.
Buildings 2023, 13(3), 792; https://doi.org/10.3390/buildings13030792
Submission received: 29 January 2023 / Revised: 7 March 2023 / Accepted: 13 March 2023 / Published: 17 March 2023
(This article belongs to the Special Issue Living Walls in Green Buildings)

Abstract

:
In winter, many rural people in the coastal areas of northern China burn coal for both cooking and heating. As a result, the rural population is seriously affected by indoor air pollution. To analyze the influence of the location of heating sources on the air quality within rural buildings, 60 buildings with coal heating were surveyed and monitored using an Intelligent Built Environmental Monitor for eight days. In addition, four typical rural buildings with different locations of heating sources were selected for a transient analysis. The peak concentration of CO2 was 2869 ppm in House 1 with a coal-fired stove in the living room. The average particulate matter (PM) levels were 89 μg/m3, 150 μg/m3, and 182 μg/m3 for PM 1.0, PM 2.5, and PM 10, respectively, in House 2 where a stove was situated in a room adjacent to the living room. House 3, where stoves were in separate rooms, had PM 1.0, PM 2.5, and PM 10 values of 25 μg/m3, 39 μg/m3, and 49 μg/m3, respectively, and the lowest CO2 concentration (564 ppm) was found in House 4. The data collected showed that the CO2, PM 1.0, PM 2.5, and PM 10 concentrations within Houses 1 and 2 far exceeded the standard for indoor air quality. The findings suggested that coal-fired stoves, as a heating source, should be situated away from the living room and adjacent rooms, and this change would clearly reduce the concentrations of CO2 and particulate matter. Suitable courtyard ventilation was necessary for houses with two or more heating sources.

1. Introduction

The rural areas of northern China are remote and tend to be economically underdeveloped with unevenly distributed energy resources [1]. Thus, the burning of coal in winter for both food preparation and heating is common [2]. Coal combustion is inefficient and leads to high levels of air pollution, including CO2 and particulate matter PM 2.5 and PM 10, severely affecting the quality of indoor air [3]. It is estimated that the pollution of ambient and indoor air by particulate matter resulted in 1.79 million premature deaths in China alone during 2019 [3]. Therefore, the rural population in northern China is particularly prone to inhaling pollutants from coal combustion during the winter and their health is seriously affected by indoor air pollution [4].
A study by Cheng et al. [5] examined people’s adaptations to living in cold climatic regions of China. The authors found that people tended to wear thicker clothing, drank hot drinks, altered their activity patterns, and insulated their houses. A further study by Shao et al. [6] recorded people’s behavior using continuous tracking for the objective assessment of environmental factors and for subjective responses, obtaining specific data on the heating needs of people in these remote areas. Zhang et al. [7] reported that people adapt by wearing thicker clothes and heating their houses, while Wang et al. [8] investigated adaptations in naturally ventilated houses. Neutral temperatures in the cold Harbin climate were found to be lower than those in warmer areas. Inhabitants of severely cold areas were observed to have developed specific forms of heating [9]. Li et al. [10] compared the indoor air quality (IAQ) of traditional dwellings constructed of rammed earth with the more commonly found buildings, finding that the inhabitants of the former experienced more comfortable thermal environments and IAQ than the residents of other dwellings. Zhao et al. [11] investigated low-income residents in rural China, observing that they wore thicker clothing during winter to reduce heating requirements, while Li et al. [12] observed that satisfaction with thermal conditions was associated with differences in culture and that these differences should be taken into account when formulating building standards in rural areas. Thus, additional research into the thermal environmental conditions in the rural areas of cold climatic zones is important for the inhabitants of these regions [13,14].
A report by Han et al. [15] described the adverse health effects of using solid fuels for domestic heating, which was extended by the findings of Chen et al. [16] on reduced IAQ in rural areas resulting from space heating. An comparison of the indoor environments of older people in five rural and five urban houses [17] in Beijing, China, showed that the urban houses were associated with greater warmth and comfort during the winter months than those in rural areas due to differences in the type of heating used. Studies have proven that there are adverse effects on health from the gaseous pollutants and PM emitted during coal combustion [18]. Li et al. [19] recently published a review on the solid fuel combustion emitted by Chinese residents and its impact on air quality, both ambient and indoor. PM 10 has often been studied in previous research. Studies on the air quality during winter in northern China indicate poorer air quality during the cold season than in warmer weather [20,21]. The deep inhalation of PM 2.5 can lead to numerous adverse effects, such as the development of circulatory and respiratory diseases [4,22]. Fine particles can reduce lung function and cause heart disease, lung disease, and respiratory disease, and the risk is more significant for vulnerable groups, such as children, the elderly, and sufferers of cardiopulmonary disease. Gao et al. [23] assessed the PM 2.5 inhaled daily by people using solid fuels in Tibet, southwest China, from 2006 to 2007, while Du et al. [24] estimated the daily inhalations of PM 1.0, PM 2.5, and PM 10 by residents in rural regions of China during winter. Huang et al. [25] calculated that the mass fraction of PM 1.0 in PM 2.5 inhaled in rural areas approached 90%. The health risk caused by PM exposure is related to mass concentration and factors, such as the distribution of particle sizes and particle diameter. Domestic coal burning results in the release of an estimated 45% of the average monthly level of fine outdoor PM 2.5, reaching 57% during hazy winter periods, exceeding the amount produced by the power and transportation industries combined [26]. Fine particles are able to penetrate the respiratory tract deeply, even into blood vessels. They can usually absorb more toxic pollutants and have a greater impact on health. For example, a relationship was observed between levels of submicron PM 1.0 and increased premature birth risk in China [3,27]. It is also estimated that over 30 million premature deaths resulting from air pollution occurred in China between 2000 and 2016 [28].
In addition, high levels of indoor CO2 affect human health [29] and working efficiency [30,31] as both short- and long-term adverse consequences that reduce the productivity of both staff and students [32]. According to a survey conducted by Hou et al. [3], the median annual indoor concentration of CO2 in northwest China is higher than 1000 ppm. Wang et al. [33] found that the concentrations of indoor CO2 in cold regions of China during the winter months exceeded the standard. In a typical indoor environment, a higher level of CO2 is associated with both reduced air quality and symptoms such as headache, mucous irritation, and slow performance [34].
Indoor air quality research and field measurement activities have primarily been conducted in inland China [35,36,37]. There are few studies on rural living environments in northern coastal areas, and data such as the pollutant levels in indoor environments are still insufficient. The climate environment and family structure, as well as additional factors affecting air quality, differ between inland and coastal areas. More field studies and activities need to be performed for rural dwellings in the coastal regions of northern China. Therefore, the quality of the air within four rural dwellings with different heating sources was monitored for eight days, including air temperature, relative humidity, CO2, PM 1.0, PM 2.5, and PM 10, to investigate indoor air in rural areas along the northern coast of China and provide necessary data to enhance the quality of indoor air in these and similar regions.

2. Investigation Methods

2.1. Study Areas and Typical Rural Buildings

The study area was selected in villages in the Laoshan District of Qingdao within the southern part of Shandong Peninsula, China. The eastern and southern parts of the Laoshan District border the Yellow Sea, and the climate is influenced by the interaction between land and sea, with transitional characteristics of continental and maritime climates. Winter is windy with low temperatures in the local district. However, there is rarely severe cold and high humidity. The temperature in autumn and winter is 2–3 °C higher than inland, and the humidity is 5–7% lower than inland. The influence of the coastal climate could lead to higher indoor humidity in test houses compared with inland rural houses.
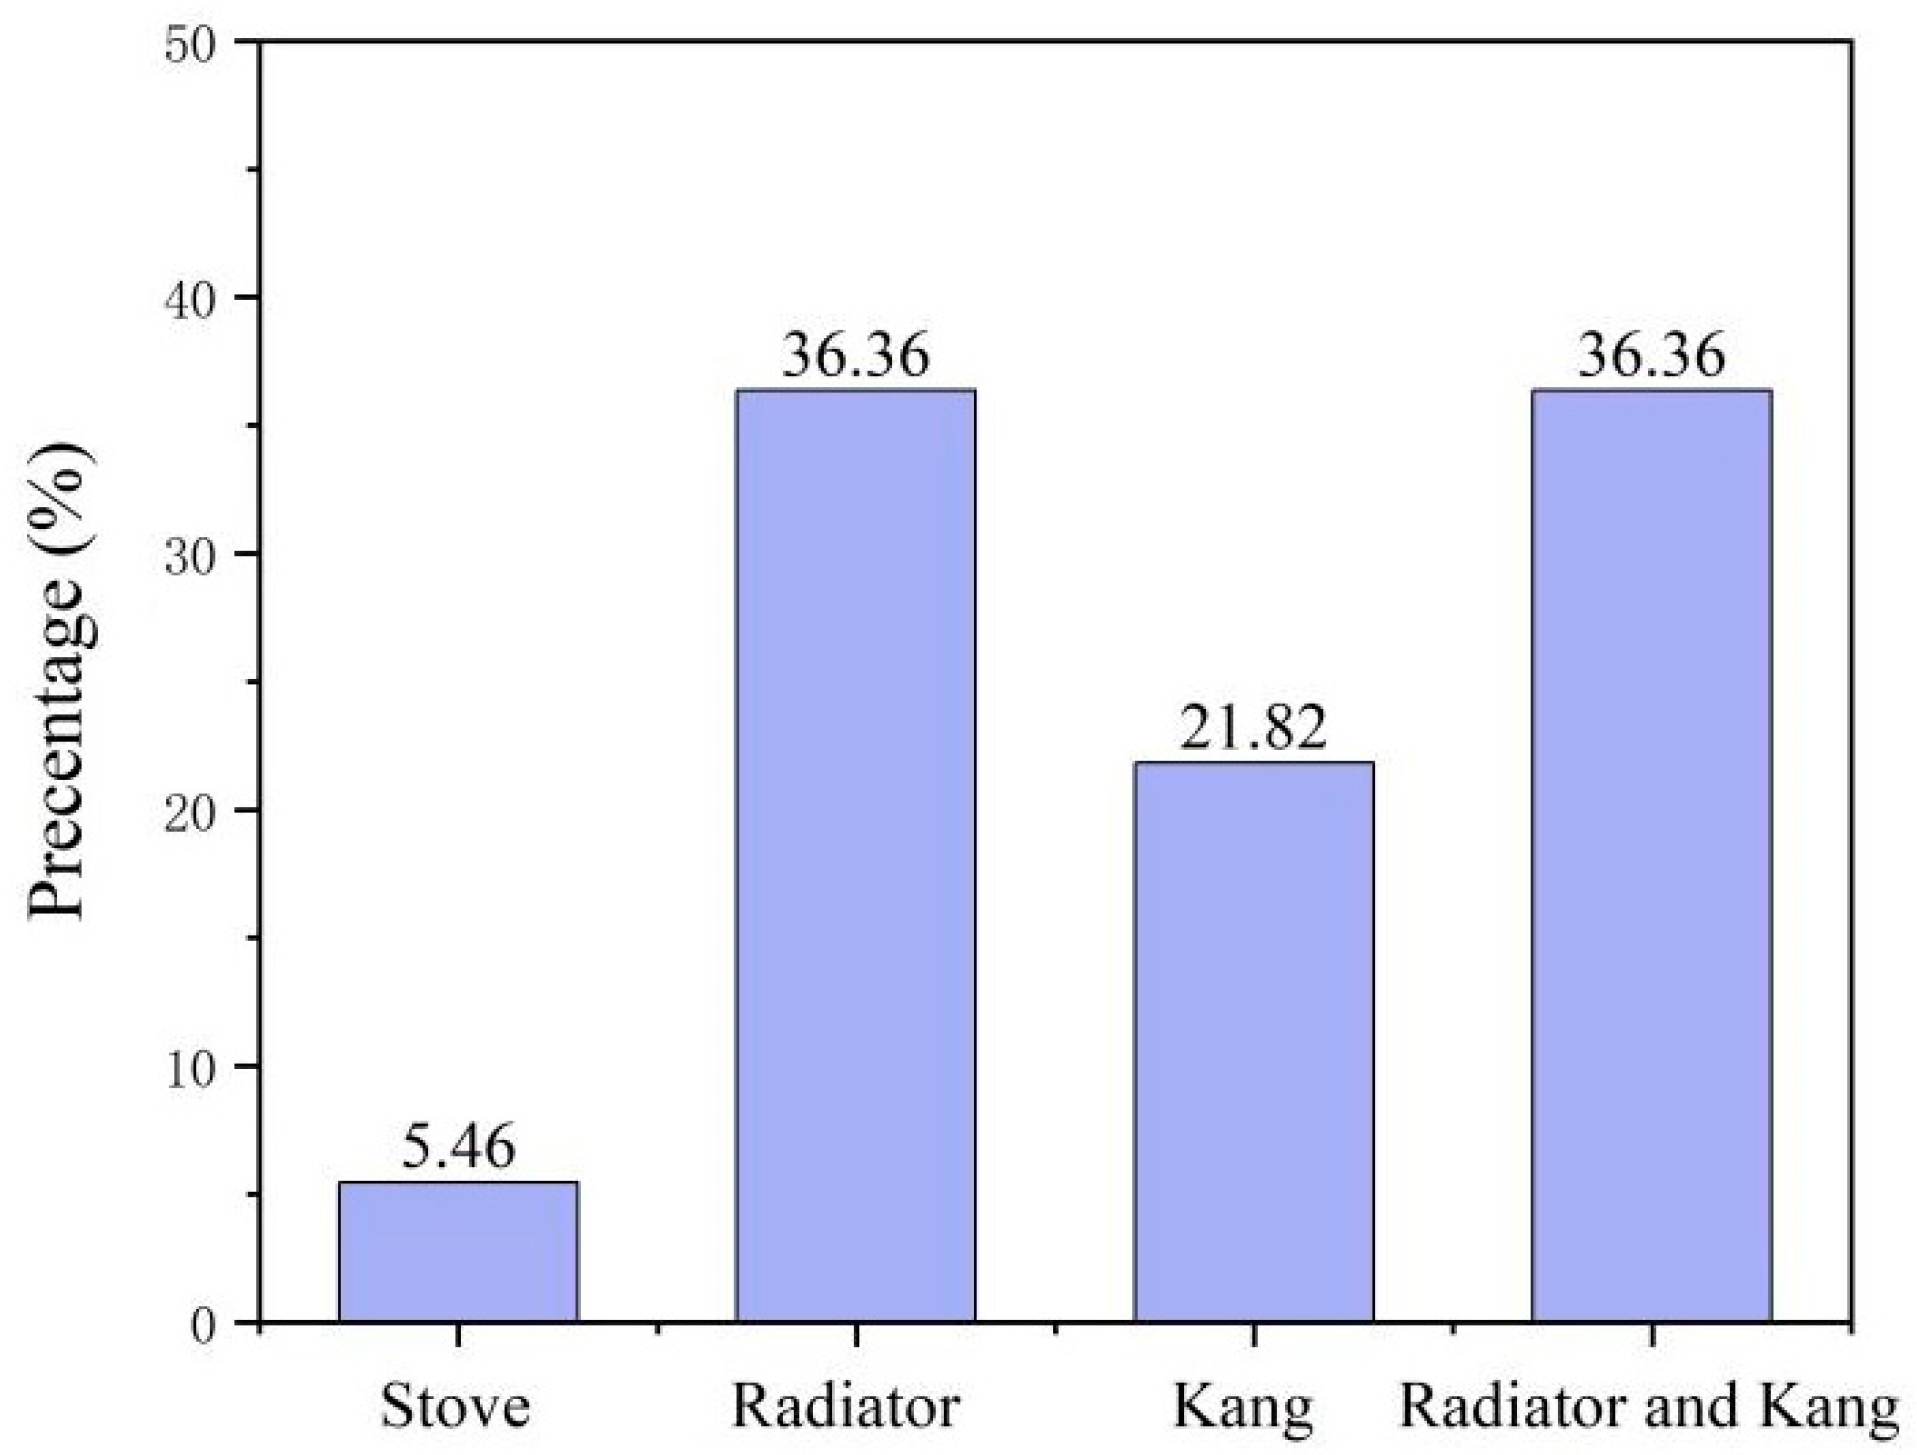
In this survey, a total of 60 rural houses in five villages in the Laoshan District were surveyed, and only a few houses were found to be heated by air conditioning. Most houses still used traditional heating methods, such as stoves, radiators driven by a stove, a kang driven by a stove, a radiator and a kang driven by a stove, and other ways of burning coal or firewood for indoor heating. Figure 1 shows the percentage of the four most frequently occurring heating methods in the buildings studied. On the one hand, four rural houses were selected to analyze the quality of the indoor air in relation to variations in the location of the heating source. In addition, a distribution of the air quality within 60 houses was utilized to show the global state.
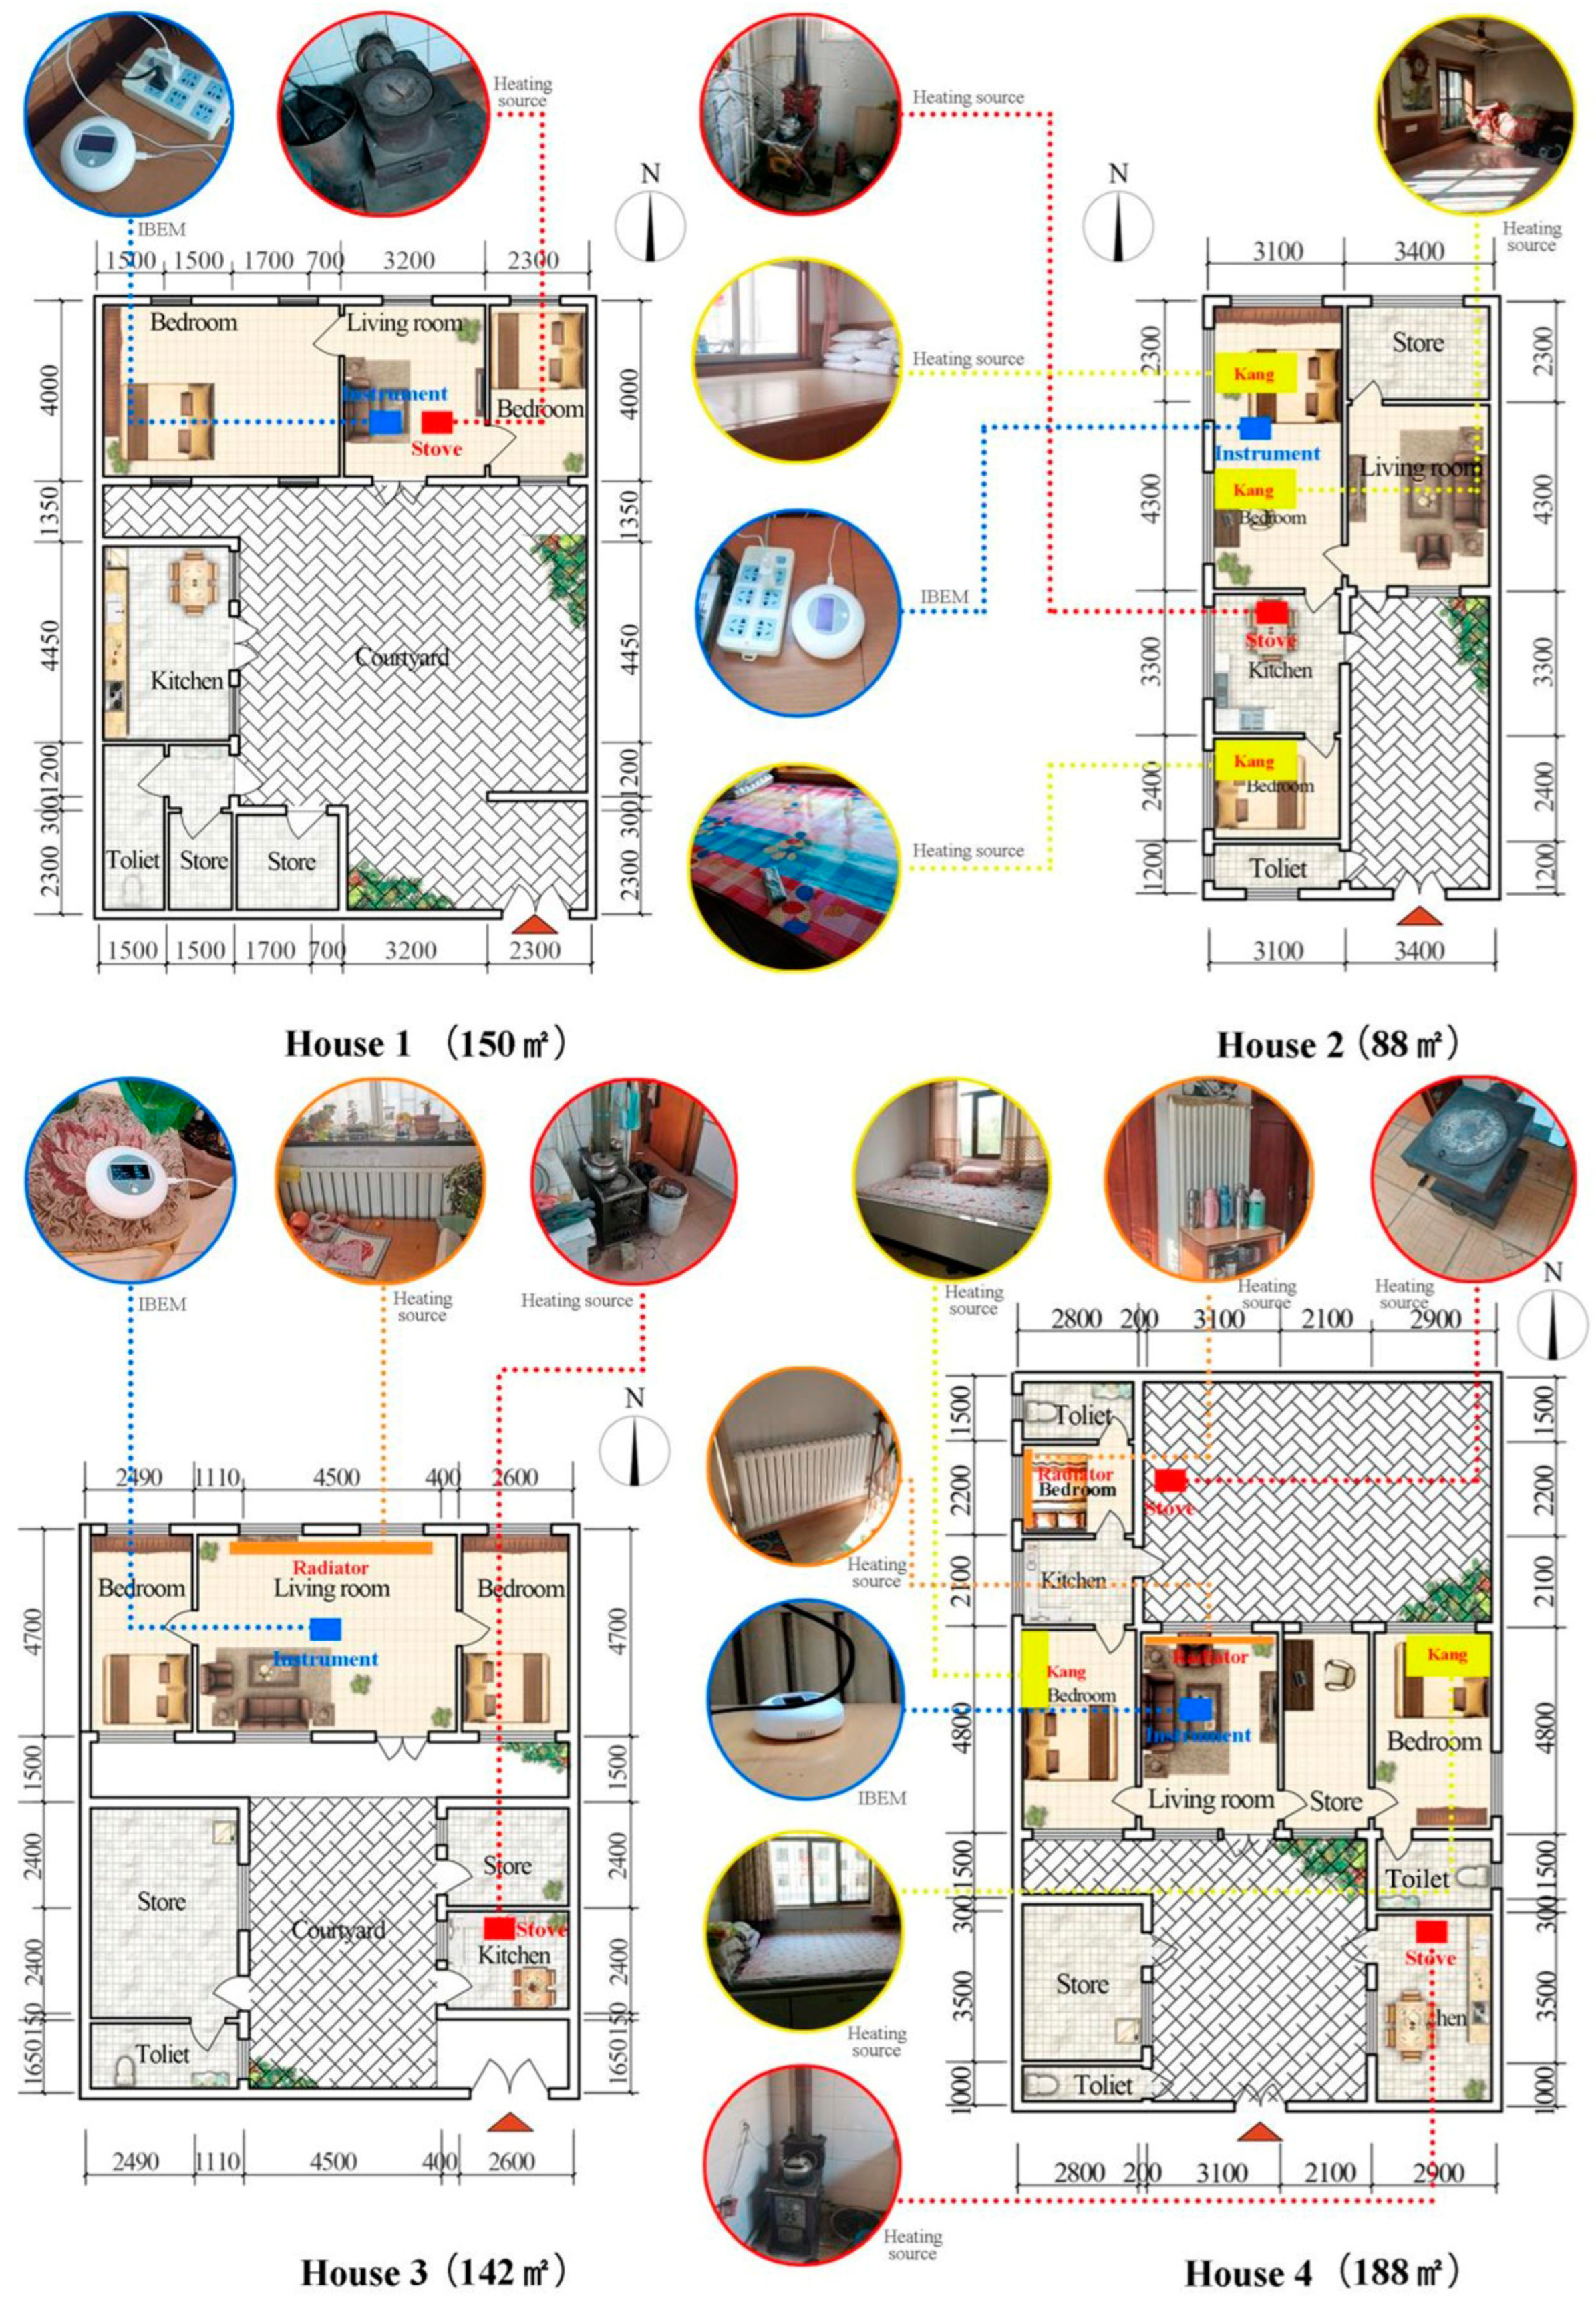
Figure 2 shows the locations and characteristics of the buildings monitored. All four buildings have courtyards, and only House 1 has a sunroom. Owing to the bad weather conditions in the cold coastal areas, the front yard (backyard) of Houses 2 and 4 were closed, which could reduce the air mobility of the houses compared with an open courtyard.

2.2. Measurement Methodology

The critical factors in this study were the type of heating facility and its location within the dwelling. According to a previous survey, there were four potential locations for heating facilities. Table 1 shows the typical locations of heating facilities and their percentages in this survey. House Type I was heated directly by a coal-fired stove situated in the living room. In House Type II, the stove was situated in an adjacent room connected to the living room and drove a kang. In the two other house types, the stoves were situated in separate adjacent rooms, with House Types III and IV having one and two heating sources, respectively. Figure 3 shows the floor plan of the four typical house types and the heating location of the buildings monitored.
Owing to the close proximity of the four buildings and the small differences in outdoor climates, an Intelligent Built Environment Monitor (IBEM) was used to detect and record the outdoor temperature, humidity, and wind speeds and directions in the flat locations between the buildings. In the building, the IBEM was in the main room where residents spend the most time and, therefore, the thermal environment had the largest influence on residents. Under this condition, the test position of House 1 was in the same space as the heating source; the test position of House 2 was in the adjacent space with the heating source, and the test positions of Houses 3 and 4 were far away from the space where the heating source was located. The thermal environment, including air temperature and relative humidity, and the concentrations of air pollutants, including CO2, PM 1.0, PM 2.5, and PM 10, were recorded using the IBEM.
Table 2 indicates the accuracies and ranges of the measuring instruments. All instruments were calibrated and debugged before use. The instruments were situated 1.5 m above ground level in the main rooms of the dwellings and data were collected at 10 min intervals on eight consecutive days between 21 and 28 December 2020.

3. Results and Analysis

3.1. Transient Variations in Air Temperature and Relative Humidity in Typical Houses

Figure 4 illustrates the variations observed in both air temperature and relative humidity over the measuring period in the four monitored buildings and the outdoor environment. The average temperature outdoors during the monitoring period was −1.2 °C while the average relative humidity was 55%. The average wind speed was 3.4 m/s, and the prevailing wind direction shifted from EEN to NWN. Similar fluctuations were observed within the four buildings (Figure 4). The air temperature within Houses 1–3 increased by 15.5 °C compared with the outdoor temperature. Owing to fewer radiators, it was still lower than in House 4, and in the four rural buildings, only the air temperature of House 4 met the winter heating standard [38]. This phenomenon could be owing to the use of both a kang and a radiator along with thermal insulation. The transient relative humidity in Figure 4b shows that the low relative humidity in House 4 could be the result of the increased temperature within the house. Only the relative humidity of Houses 1 and 2 met the requirement for a comfortable indoor setting. These findings indicated that the indoor thermal environment was not adequate for comfort and that it merits more attention.
Table 3 shows the temperature and relative humidity (maximum, minimum, and average) of the indoor air over the measurement period. It is apparent that the minimum indoor temperature of House 3 was only 5.9 °C, which was much lower than that of the other houses, probably because it has neither a closed courtyard nor a sunshine room. The indoor temperature differences in Houses 3 and 4 were 12.8 °C and 12.3 °C, respectively. This indicates that houses with radiators are better at heating. The peak and average values of the indoor temperature of Houses 1 and 3 were very close, but the indoor relative humidity of House 3 was lower than that of Houses 1 and 2, which could be because the open courtyard of House 3 enables the infiltration of more outdoor dry air.

3.2. Transient Variations in Indoor CO2 Levels in Typical Houses

The CO2 in indoor air is a critical indicator of air quality as it affects reaction times and the ability to make decisions [17]. The variations observed in indoor CO2 concentrations over time in the four dwellings are shown in Figure 5; CO2 concentrations exceeding 1000 ppm represent a threat to the health of the occupants [39]. As seen in Figure 5, the indoor CO2 levels were greater than 1000 ppm in Houses 1 and 2 during the times when the stove was situated in the living room, with the carbon released from coal combustion containing substantial amounts of CO2. In Houses 3 and 4, where the stoves were situated in secondary rooms, there was a sharp reduction in the CO2 levels compared with Houses 1 and 2. In addition, it was easy to spot a sudden increase in the CO2 level, especially in Houses 1 and 2 with the stove situated in the living room. This is usually the result of adding more coal to the stove and indicates that the early stages of coal combustion are associated with significant increments in CO2 levels, posing a significant threat to the health of the occupants.
The levels of CO2 in the four houses over the monitoring period are shown in Table 4. It can be seen that the peak CO2 level was close to 1000 ppm, which has less of an effect on the residents’ health, and the residents felt more comfortable compared with the other rooms, while it was up to 2000–2800 ppm in Houses 1, 2, and 3. CO2 levels over 2000 ppm can have significant effects on the faculties of the room occupants. In addition, the average CO2 levels in Houses 1, 2, and 3 approached 1000 ppm, the upper acceptable limit for indoor CO2 levels. The ASHRAE 180-2018 standard states that CO2 levels of 1000 ppm result in feelings of drowsiness. Exposure to high CO2 levels for extended periods can lead to respiratory disease.
These results indicate that the indoor CO2 levels in these houses exceeded the acceptable standards. Furthermore, despite the location of the stove in an adjacent room in House 3, the room was connected to the living room with improved cross-ventilation, resulting in similar levels of both average and maximum CO2 to Houses 1 and 2. This suggests that coal-fired stoves should be situated in separate spaces as far away as possible from the main living areas of buildings.

3.3. Transient Variations in Particulate Matter (PM) in Typical Houses

Particulate matter derived from coal combustion affects the PM levels within buildings. The specific health hazards associated with PM depend on the type, chemical composition, and particle size of the PM. The present study investigated the indoor levels of PM 1.0, PM 2.5, and PM 10 in four dwellings.

3.3.1. Transient Variations in PM 1.0 Concentrations in Typical Houses

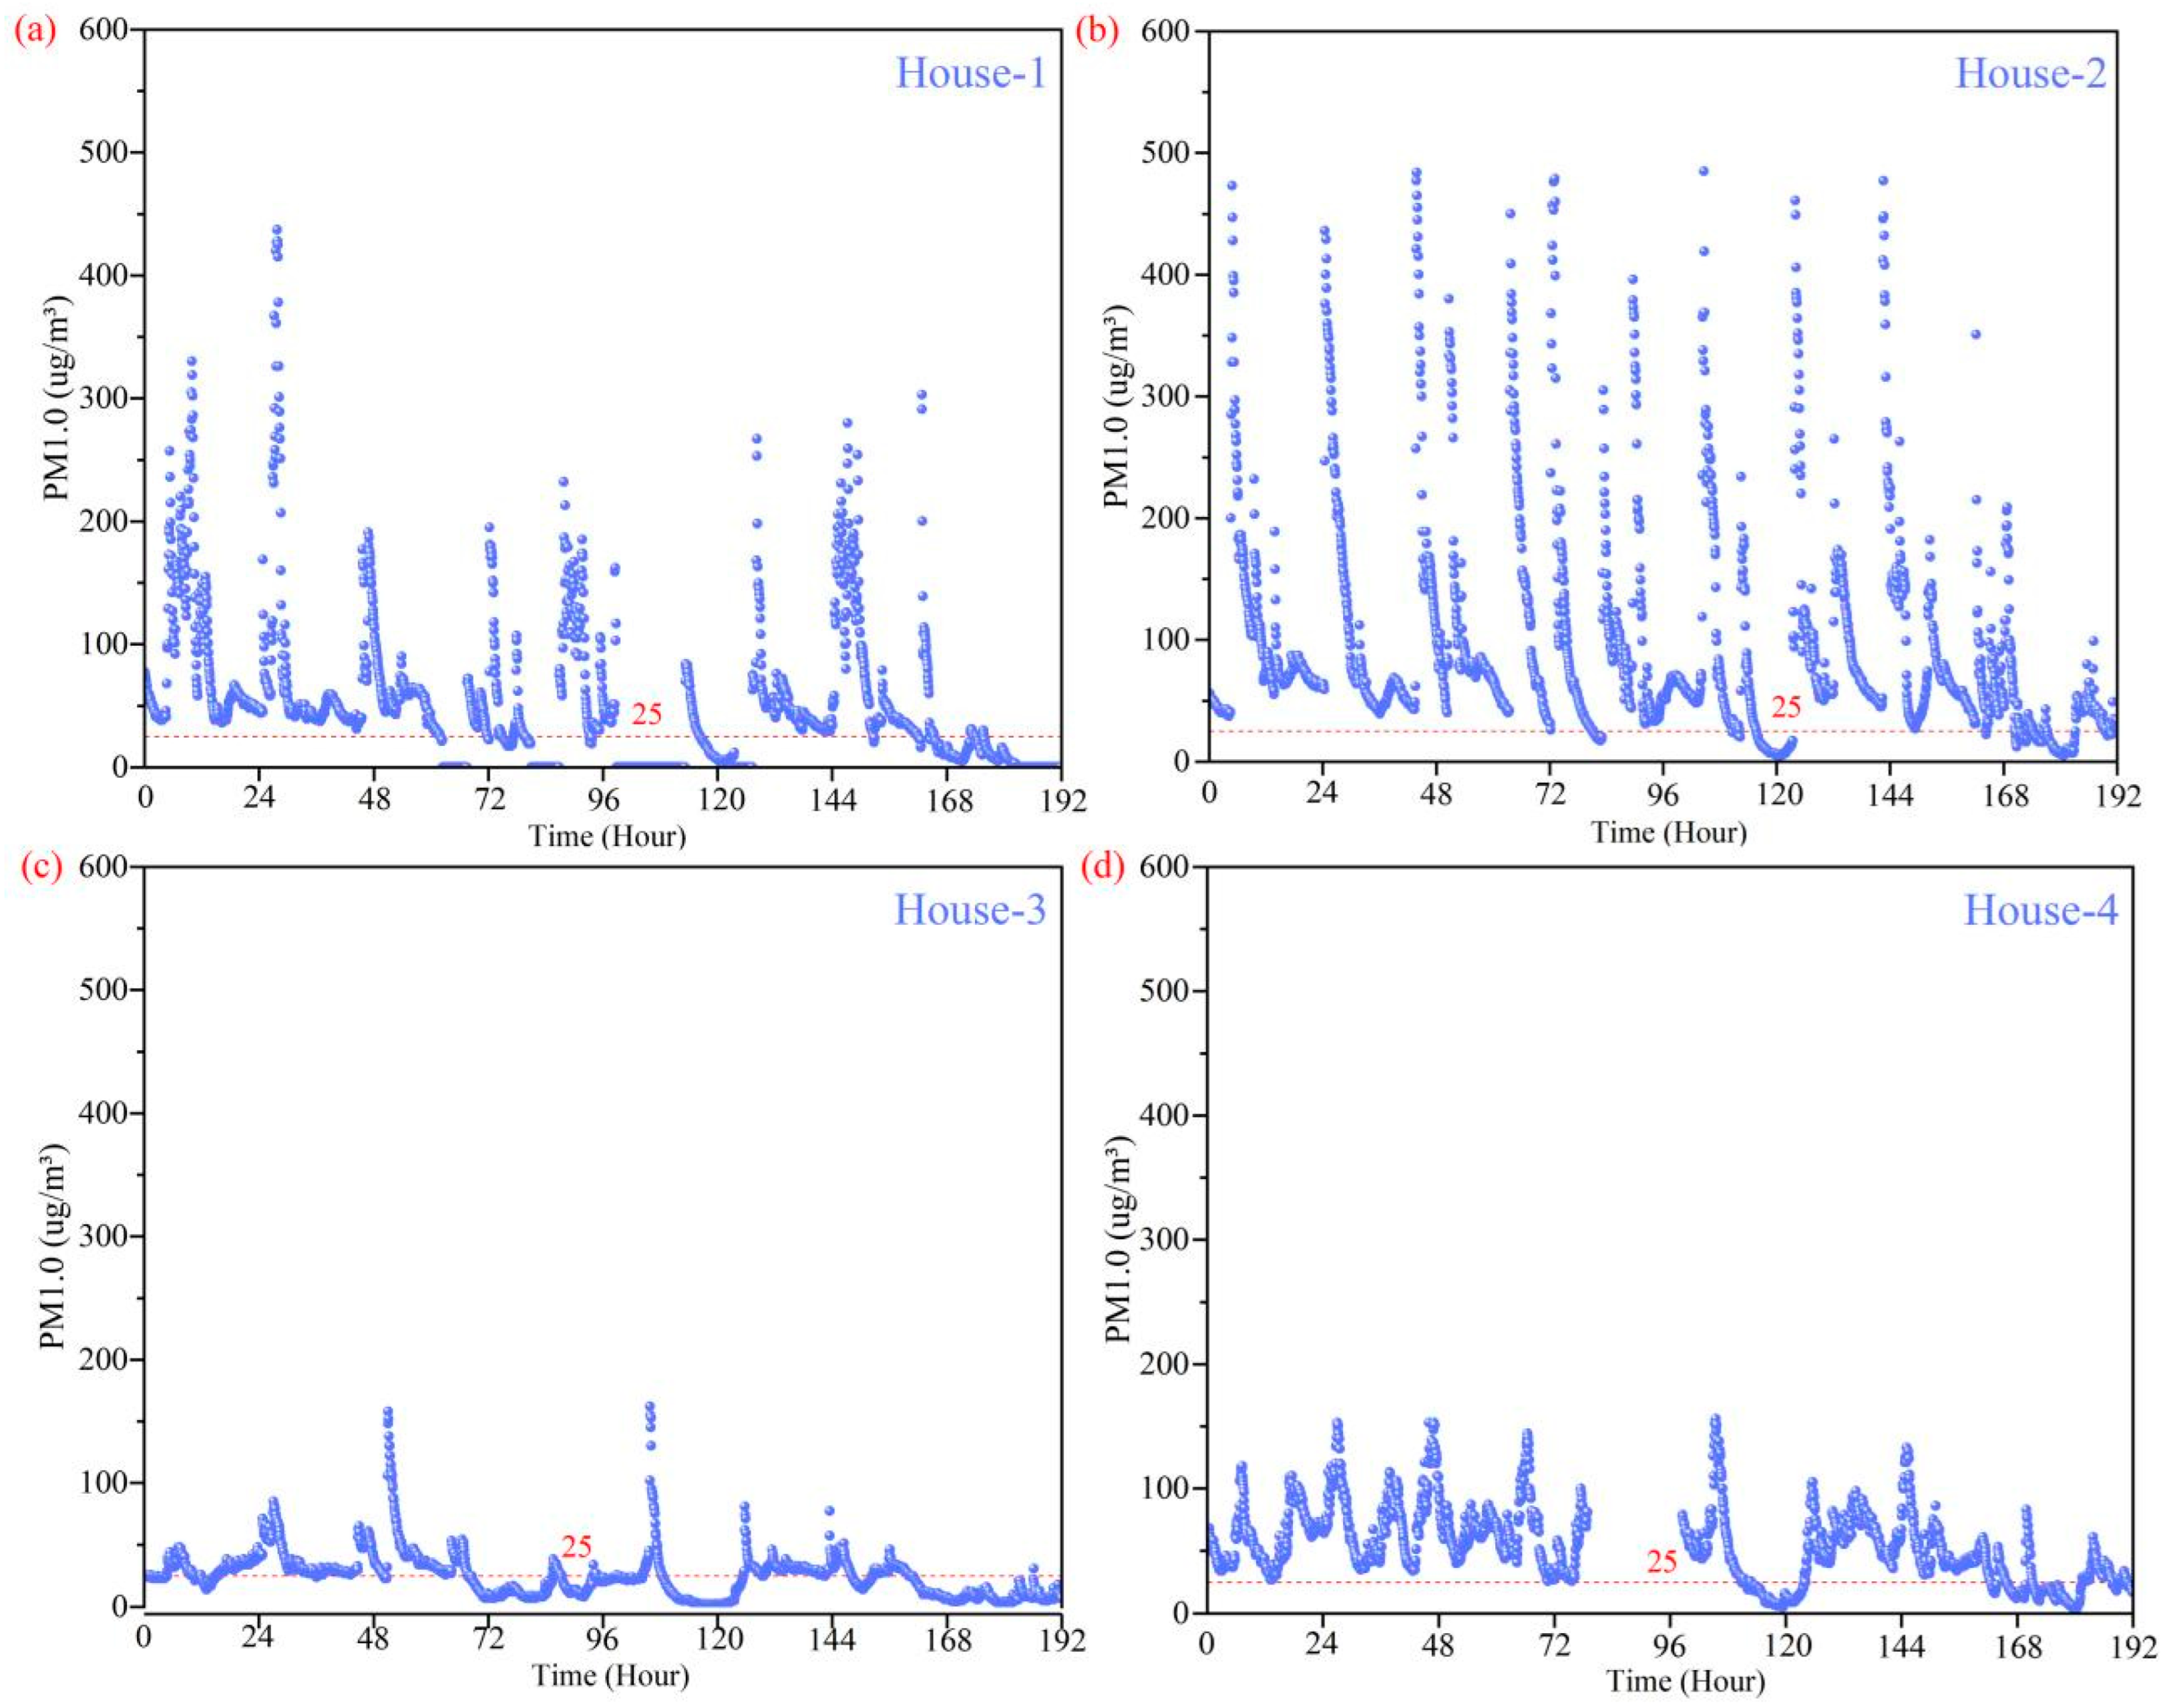
Fine particles, such as PM with diameters ≤ 1.0 μm, are able to penetrate the respiratory tract and even the blood vessels. These particles tend to have large specific surface areas and are thus able to absorb greater amounts of toxic pollutants, with detrimental effects on health. Variations in the indoor PM 1.0 concentrations over time for the four houses are presented in Figure 4. When the indoor PM 1.0 level exceeds that standard of 25 μg/m3 set by the WHO [40], adverse health consequences are likely. Figure 6 shows that the indoor PM 1.0 levels were over 25 μg/m3 for most of the monitoring time in Houses 1 and 2 with the stove situated in the living room. Marked reductions in the PM 1.0 levels were seen in Houses 3 and 4 where the stove was situated in secondary rooms. Furthermore, the levels in House 4 were over 25 μg/m3 over most of the monitoring time, in comparison with House 3, possibly due to the location of two stoves in an adjacent room.
The indoor PM 1.0 levels in the four houses over the monitoring period are shown in Table 5. The maximum PM 1.0 levels in Houses 1 and 2 were 430–480 μg/m3, and approached 150 μg/m3 in Houses 3 and 4. PM 1.0 levels over 400 μg/m3 have been linked with a significant risk of preterm birth [12]. Furthermore, the average PM 1.0 levels in Houses 1, 2, and 4 were 50–90 μg/m3, representing the maximum levels for PM 1.0. This indicates that these PM 1.0 concentrations were excessively high in these houses. PM 1.0 particles are tiny and can reach the alveoli and enter the blood circulation after being inhaled by the residents, thus posing a more serious health hazard. Despite the location of the stove in a secondary room in House 4, the indoor PM 1.0 levels were elevated by cigarette smoking inside the house. This led to higher daily PM 1.0 levels in House 4 compared with House 3.

3.3.2. Transient Variations in the Concentrations of PM 2.5 in Typical Houses

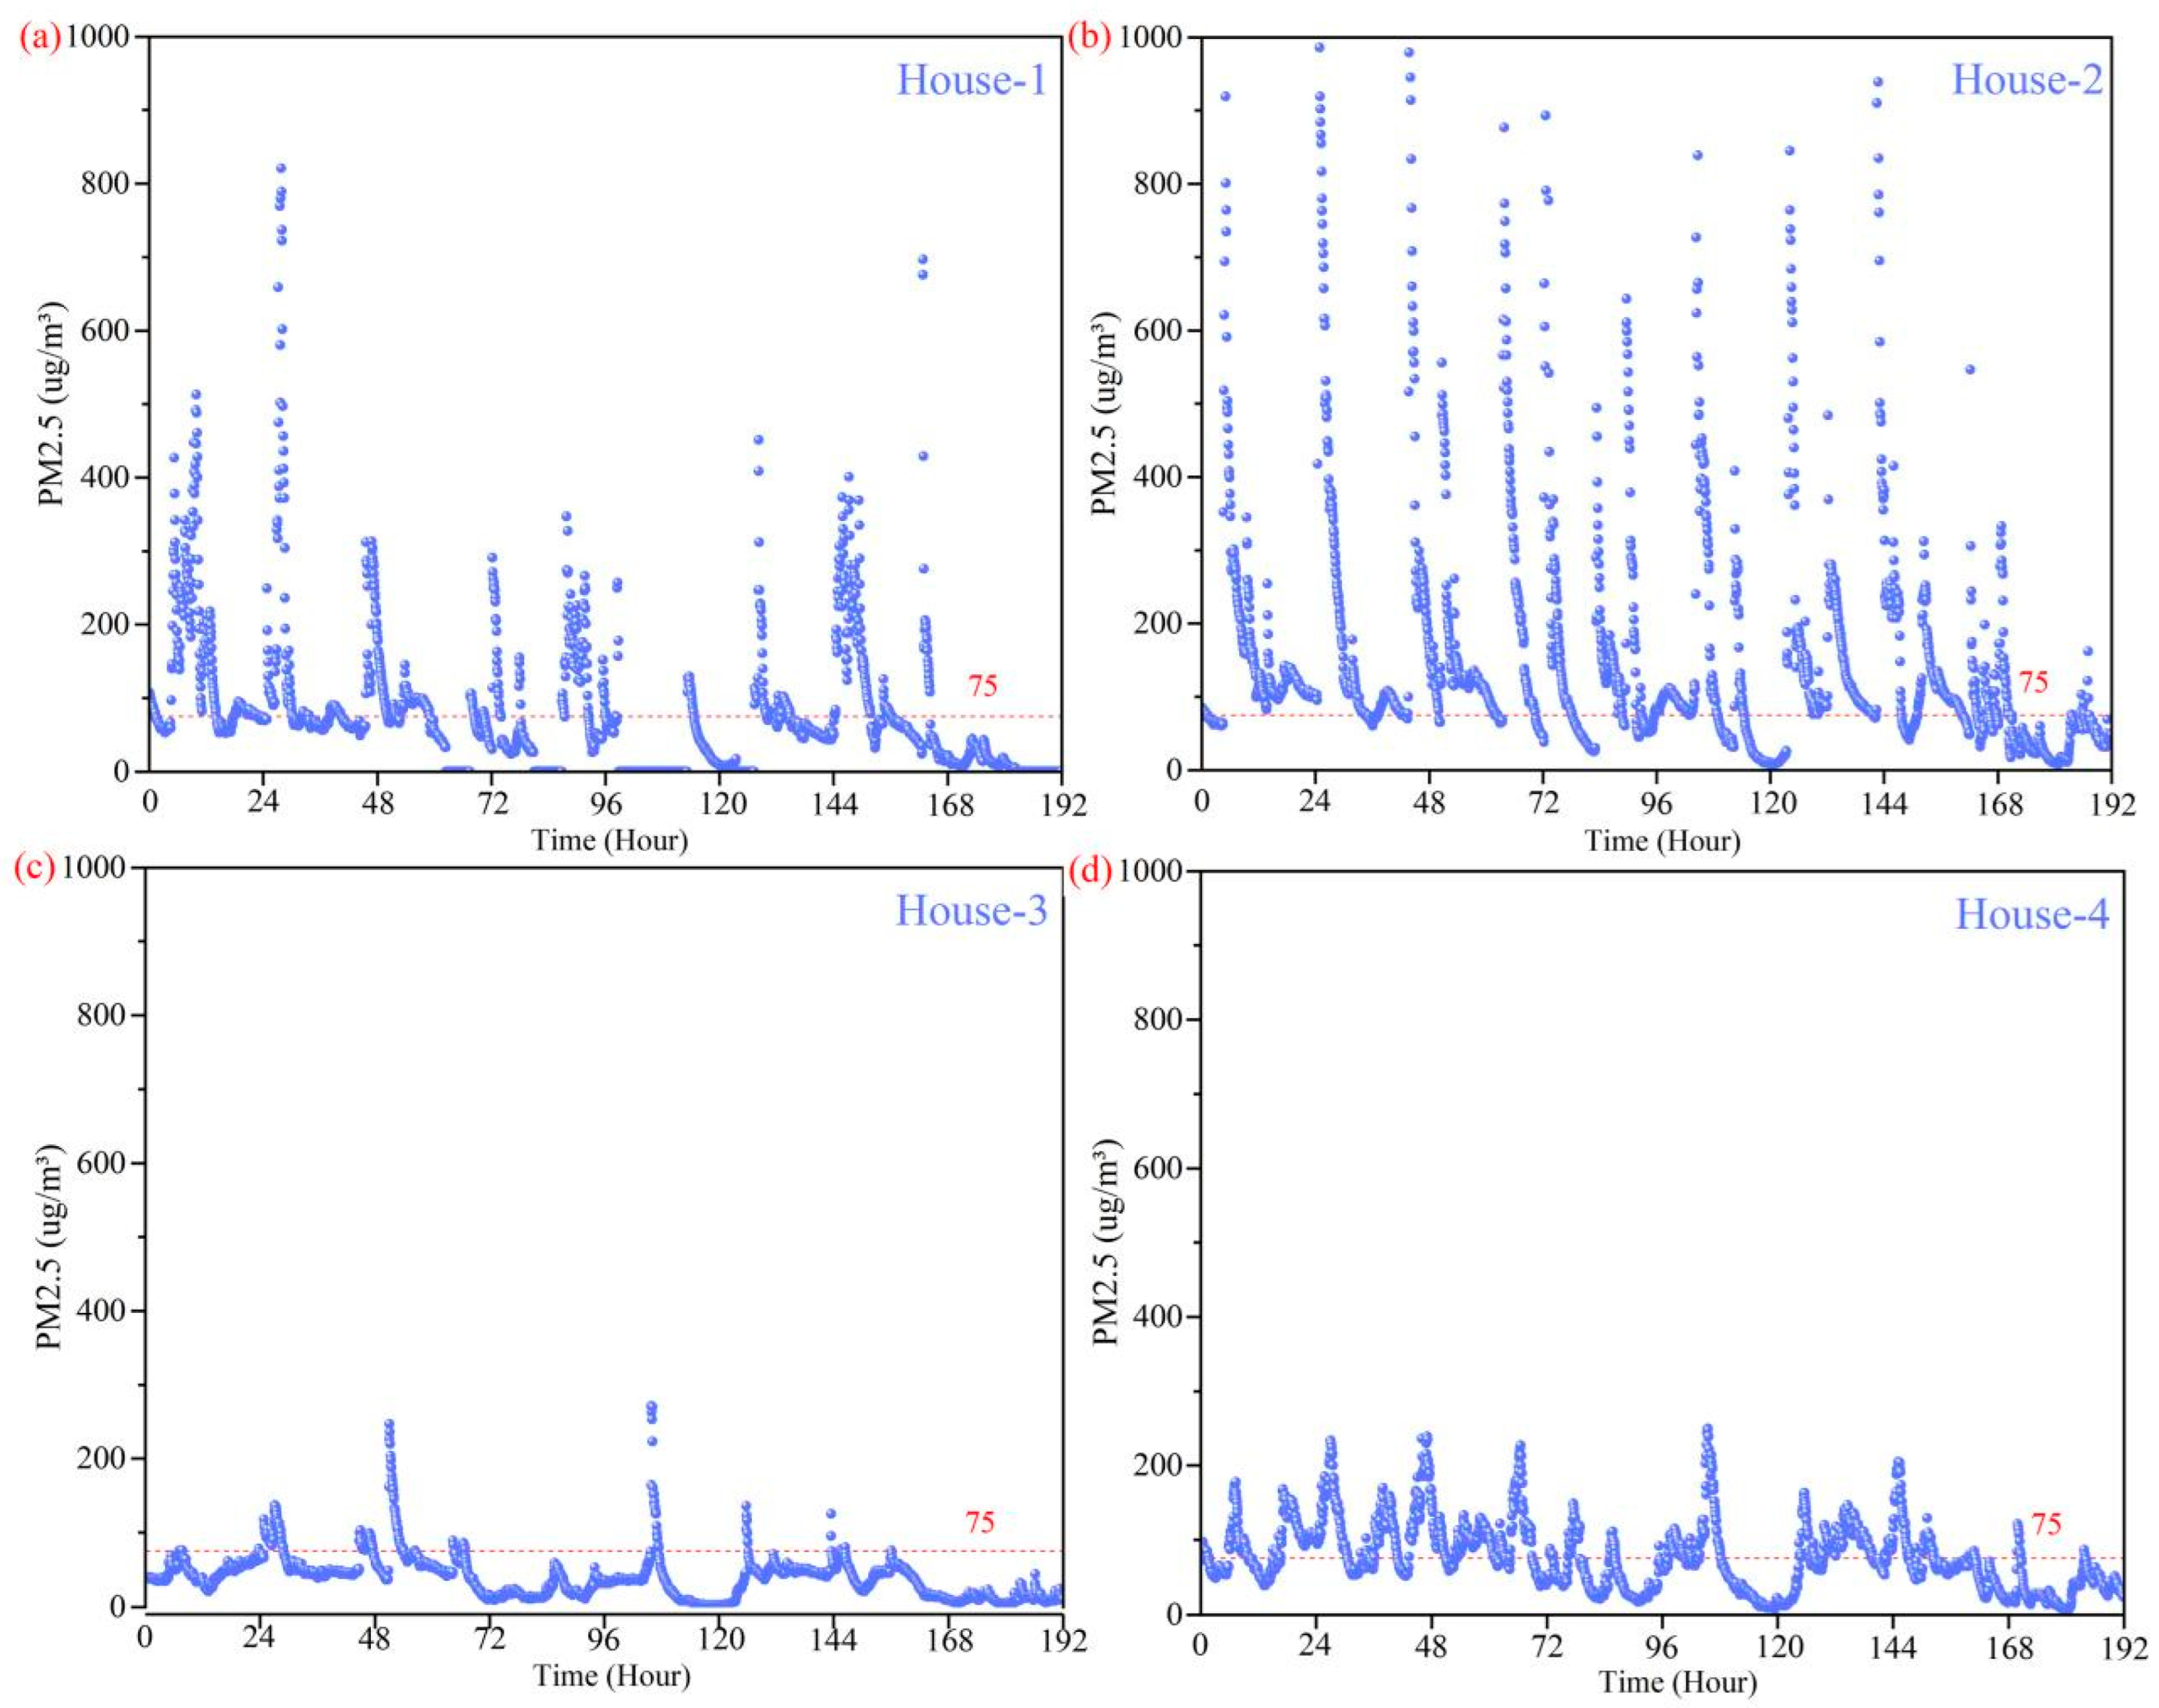
Variations in the indoor PM 2.5 levels in the four houses are shown in Figure 7. The upper limit of the indoor air quality index for PM 2.5 is 75 µg/m3 [41] and levels exceeding this value can result in bronchitis, asthma, and the development of cardiovascular disease. Figure 7 indicates that the indoor levels of PM 2.5 in Houses 1 and 2 exceeded 75 µg/m3 over most of the monitoring period, while those in Houses 3 and 4 were relatively low. Peaks in the PM 2.5 levels were apparent during breakfast and dinner preparations, although these effects were not of long duration and tended to peak during the food preparation, lasting approximately 30 min and not contributing markedly to the daily average. This contrasts with heating, where combustion results in multiple peaks due to the constant supply of fuel and contributes significantly to the daily average PM 2.5 levels.
The indoor PM 2.5 levels in the four houses are shown in Table 6. The average PM 2.5 levels in Houses 1, 3, and 4 were in the range of 40–70 μg/m3, below the PM 2.5 indoor limit. Nevertheless, PM 2.5 peaks approaching 200–800 µg/m3 were seen in these houses, reaching a maximum of 2000 µg/m3 in House 2. This indicates that PM 2.5 levels were significantly in excess of the standard of 75 μg/m3 when a stove was present in the main living room, allowing entry of the particles into the blood via the bronchi and alveoli, and posing increased risks of disease and premature death to the inhabitants [37]. This could have resulted from the relatively small indoor area, poor ventilation due to the enclosed courtyard, and the greater number of stoves than in the other houses.

3.3.3. Transient Variations in the Concentrations of PM 10 in Typical Houses

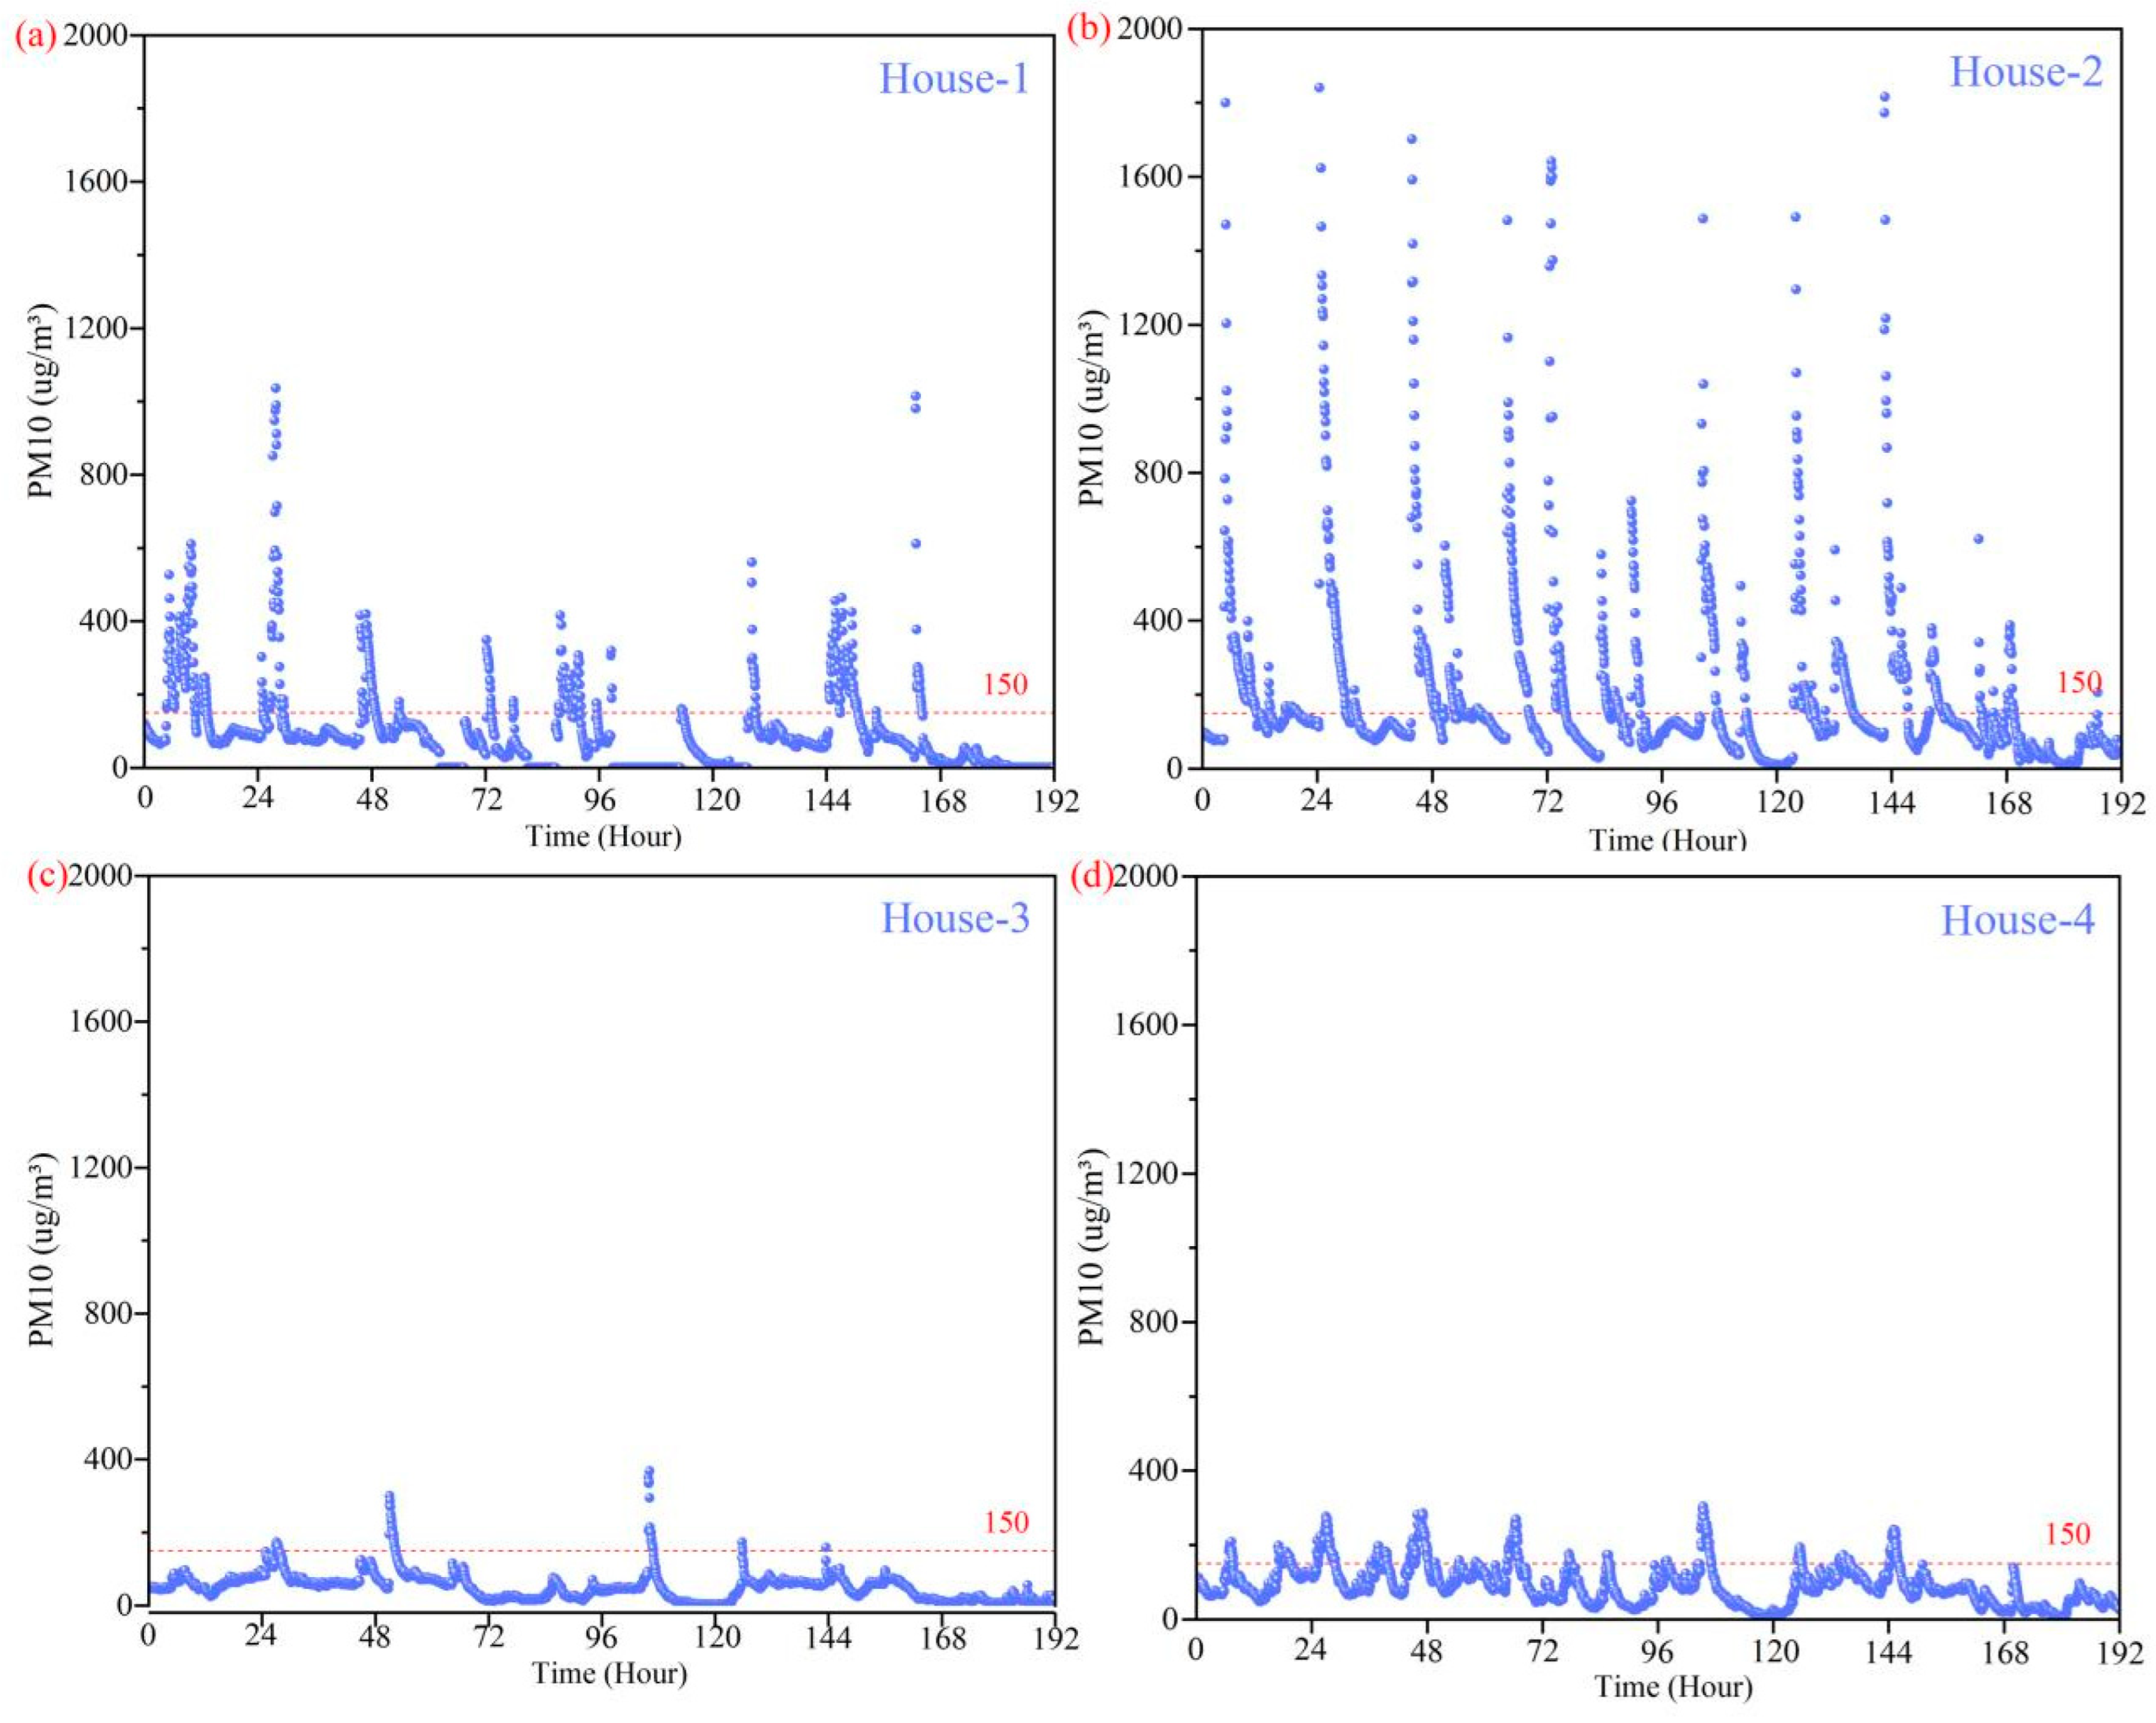
Variations in the PM 10 levels in the four houses over the monitoring period are shown in Figure 8. The IAQ standard for the average PM 10 level is 150 μg/m3 [26]. Concentrations in excess of this can result in pathological changes in the body, especially in children and older adults. As seen in Figure 8, in Houses 1 and 2, where the stove was situated in the living room, the PM 10 levels were above 150 μg/m3, particularly in House 2. This could be the result of the depth of this house and poor ventilation caused by the closed courtyard. The house also had many inhabitants, which would increase the PM 10 levels due to personal activities. The concentration of indoor PM 10 was higher than 150 μg/m3 in Houses 3 and 4, which had relatively less experimental time, where the coal-fired stove was located in the secondary room.
The indoor PM 10 levels in the four houses are shown in Table 7. The average PM 10 level was only above 150 μg/m3 in House 2, although the peak PM 10 level reached 3894 μg/m3. However, the average PM 10 levels in Houses 1, 3, and 4 approached 50–90 μg/m3, below the standard. Peak PM 10 levels reached 300–1000 μg/m3 in Houses 1, 3, and 4. There is a significant link between PM 10 levels and respiratory and cardiovascular mortality, with the increases of 10 μg/m3 linked with a 0.68 % increase in death from respiratory and cardiovascular disease. Thus, these conditions pose a serious risk of respiratory disease for the inhabitants of these dwellings.

3.4. Statistical Distribution of the Evaluation Parameters of Indoor Air Quality in the Houses Surveyed

The transient variation of evaluation parameters clearly showed the patterns of daily variations in the indoor air quality in the typical houses with different heating source locations. Table 8 displays the statistical distribution of air temperature, relative humidity, CO2 concentration, and particulate matter in the 60 houses surveyed. As shown, the air quality was similar in houses of types I and II, where the concentrations of CO2 and particulate matter, including PM 1.0, PM 2.5, and PM 10, were significantly greater than the corresponding reference values in the IAQ standards. When the heating sources were moved to separate secondary rooms or outdoors, the concentrations of indoor CO2 and particulate matter were obviously reduced in the Type III and Type VI houses. However, it was easily observed that there was a similar concentration of CO2, but there was a large difference in the PM levels between Type III and Type VI houses. In addition, the average PM level in Type VI houses was twice as high as that in Type III houses owing to the two heating sources. This phenomenon was owing to the low diffusion rate and, therefore, suitable courtyard ventilation is necessary for houses with two or more heating sources.

4. Conclusions

Owing to the more primitive heating modes, the rural population is especially vulnerable to the inhalation of pollutants resulting from the burning of coal during the cold winters in northern China, and their health is seriously affected by indoor air pollution. There have been few investigations into indoor pollution in rural China. There is insufficient data on the living conditions and indoor pollution in the northern coastal areas of the country. This study experimentally monitored the IAQ in four rural houses over eight days to assess the relationships between the location of the heating source and the quality of the air within the houses. All of the data collected showed that the levels of CO2, PM 1.0, PM 2.5, and PM 10 within dwellings in these coastal villages were unacceptably high in comparison with the IAQ standards.
In this study, the location of the heating source was mainly analyzed on IAQ, while indoor inhabitant behavior, building thermal performance, air permeability, and other relative factors also had a certain influence on IAQ. The presented results showed the IAQ status in the typical houses employing coal-fired stoves as heating sources in rural buildings of Qingdao (China). The principal findings are described below.
(1)
The indoor CO2 concentrations in Houses 1 and 2, where the stove was situated in the living room, were markedly higher than those in Houses 3 and 4 that had stoves in secondary rooms. Only in House 4 was the peak CO2 concentration close to 1000 ppm. In House 3, the adjacent room was connected to the living room, resulting in both average and peak CO2 levels similar to those of Houses 1 and 2. These findings indicate that stoves should be located in separate spaces as far away from the living rooms as possible.
(2)
The peak concentration of PM 1.0 was 430–480 μg/m3 in Houses 1 and 2 where the stove was situated in the main room. Houses 3 and 4, with stoves situated in secondary rooms, had readings close to 150 μg/m3. Compared with House 3, the indoor PM 1.0 of House 4 was above the standard value of 25 μg/m3. This could be because there were two coal-fired stoves in House 4, which is more than in the other houses.
(3)
Over the monitoring period, the peak PM 2.5 levels in Houses 1, 3, and 4 approached 200–800 µg/m3, with a peak value of 2000 µg/m3 in House 2. While peaks of PM 2.5 were apparent during food preparation, the constant fuel supply results in a series of peaks.
(4)
The average PM 10 level in House 2 was above 150 µg/m3 with a peak value of 3894 µg/m3. However, the average PM 10 levels in Houses 1, 3, and 4 were 50–90 µg/m3, below the standard, although the peak values reached 300–1000 µg/m3. Indoor PM 10 values over the 150 µg/m3 standard can lead to organ damage, especially in children and the elderly.
(5)
The heating sources of coal-fired stoves should be separated both from the main room and from the secondary room connected to the main room. This would reduce the indoor levels of both CO2 and particulate matter. Suitable courtyard ventilation is necessary for houses with two or more heating sources.
Author Contributions

Methodology, X.X. and W.G.; software, X.X. and Q.Y. investigation, X.X.; supervision, X.X. and W.G.; writing—original draft, X.X. and S.W.; formal analysis, Q.Y.; writing—review and editing, Q.Y. and S.W. All authors have read and agreed to the published version of the manuscript.

Funding

This paper was funded by the Natural Science Foundation Project of Shandong (grant number ZR2020ME218) and the Open Fund Project of Innovation for Sustainable Maritime Architecture Research and Technology: Research and development of integrated technology for living environment unit of green, livable ecological marine pasture.

Data Availability Statement

Not applicable.

Conflicts of Interest

The authors declare no conflict of interest.

References

  1. Meng, X.; Meng, L.; Gao, Y.N.; Li, H.R. A comprehensive review on the spray cooling system employed to improve the summer thermal environment: Application efficiency, impact factors, and performance improvement. Build. Environ. 2022, 217, 109065. [Google Scholar] [CrossRef]
  2. Zhang, C.; Sun, J.; Lubell, M.; Qiu, L.; Kang, K. Design and simulation of a novel hybrid solar-biomass energy supply system in northwest China. J. Clean. Prod. 2019, 233, 1221–1239. [Google Scholar] [CrossRef]
  3. Liu, F.D.; Yan, L.Y.; Meng, X. A review on indoor green plants employed to improve indoor environment. J. Build. Eng. 2022, 53, 104542. [Google Scholar] [CrossRef]
  4. Meng, X.; Yan, L.Y.; Liu, F.D. A new method to improve indoor environment: Combining the living wall with air-conditioning. Build. Environ. 2022, 216, 108981. [Google Scholar] [CrossRef]
  5. Cheng, B.; Fu, Y.; Khoshbakht, M.; Duan, L.; Zhang, J.; Rashidian, S. Characteristics of thermal comfort conditions in cold rural areas of China: A case study of stone dwellings in a Tibet village. Buildings 2018, 8, 49. [Google Scholar] [CrossRef] [Green Version]
  6. Shao, N.; Ma, L.; Zhang, J. Study on the rural residence heating temperature based on the resident behavior pattern in South Liaoning province. Energy Build. 2018, 174, 179–189. [Google Scholar] [CrossRef]
  7. Zhang, H.B.; Chen, Y.; Rui, J.W.; Ye, H.J.; Zhang, J.F.; Liu, J. Effects of thermal environment on elderly in urban and rural houses during heating season in a severe cold region of China. Energy Build. 2019, 198, 61–74. [Google Scholar] [CrossRef]
  8. Wang, Z.; Zhang, L.; Zhao, J.; He, Y. Thermal comfort for naturally ventilated residential buildings in Harbin. Energy Build. 2010, 42, 2406–2415. [Google Scholar] [CrossRef]
  9. Shao, T.; Jin, H. A field investigation on the winter thermal comfort of residents in rural houses at different latitudes of northeast severe cold regions, China. J. Build. Eng. 2020, 32, 101476. [Google Scholar] [CrossRef]
  10. Li, Q.; You, R.; Chen, C.; Yang, X. A field investigation and comparative study of indoor environmental quality in heritage Chinese rural buildings with thick rammed earth wall. Energy Build. 2013, 62, 286–293. [Google Scholar] [CrossRef]
  11. Zhao, W.; Chow, D.; Sharples, S. The relationship between thermal environments and clothing insulation for rural low-income residents in China in winter. IOP Conf. Ser. Earth Environ. Sci. 2019, 329, 012023. [Google Scholar] [CrossRef] [Green Version]
  12. Li, B.Z.; Du, C.Q.; Yao, R.M.; Yu, W.; Costanzo, V. Indoor thermal environments in Chinese residential buildings responding to the diversity of climates. Appl. Therm. Eng. 2018, 129, 693–708. [Google Scholar] [CrossRef]
  13. Bonjour, S.; Adair-Rohani, H.; Wolf, J.; Bruce, N.; Mehta, S.; Pruss-Ustun, A.; Lahiff, M.; Rehfuess, E.; Mishra, V.; Smith, K. Solid fuel use for household cooking: Country and regional estimates for 1980–2010. Environ. Health Perspect. 2013, 121, 784–790. [Google Scholar] [CrossRef] [PubMed] [Green Version]
  14. Wang, J.; Liu, S.H.; Liu, Z.F.; Meng, X.; Xu, C.B.; Gao, W.J. An experimental comparison on regional thermal environment of the high-density enclosed building groups with retro-reflective and high-reflective coatings. Energy Build. 2022, 259, 111864. [Google Scholar] [CrossRef]
  15. Han, Y.; Qi, M.; Chen, Y.; Shen, H.; Liu, J.; Huang, Y.; Chen, H.; Liu, W.; Wang, X.; Liu, J. Influences of ambient air PM2.5 concentration and meteorological condition on the indoor PM 2.5 concentrations in a residential apartment in Beijing using a new approach. Environ. Pollut. 2015, 205, 307–314. [Google Scholar] [CrossRef]
  16. Chen, Y.; Shen, H.; Smith, K.; Guan, D.; Chen, Y.; Shen, G.; Liu, J.; Cheng, H.; Zeng, Y.; Tao, S. Estimating household air pollution exposures and health impacts from space heating in rural China. Environ. Int. 2018, 119, 117–124. [Google Scholar] [CrossRef] [Green Version]
  17. Fan, G.; Xie, J.; Yoshino, H.; Yanagi, U.; Hasegawa, K.; Kagi, N.; Liu, J. Indoor environmental conditions in urban and rural homes with older people during heating season: A case in cold region, China. Energy Build. 2018, 167, 334–346. [Google Scholar] [CrossRef]
  18. Li, C.; Kang, S.; Chen, P.; Zhang, Q.; Guo, J.; Mi, J.; Basang, P.; Luosang, Q.; Smith, K.R. Personal PM 2.5 and indoor CO in nomadic tents using open and chimney biomass stoves on the Tibetan Plateau. Atmos. Environ. 2012, 59, 207–213. [Google Scholar] [CrossRef]
  19. Li, Q.; Jiang, J.; Wang, S.; Rumchev, K.; Mead-Hunter, R.; Morawska, L.; Hao, J. Impacts of household coal and biomass combustion on indoor and ambient air quality in China: Current status and implication. Sci. Total Environ. 2017, 576, 347–361. [Google Scholar] [CrossRef] [Green Version]
  20. Tang, B.; Zou, Y.; Yu, B.; Guo, Y.Y.; Zhao, G. Clean heating transition in the building sector: The case of Northern China. J. Clean. Prod. 2021, 307, 127206. [Google Scholar] [CrossRef]
  21. Yan, Y.; Jiao, W.; Wang, K.; Huang, Y.T.; Chen, J.J.; Han, Q.F. Coal-to-gas heating compensation standard and willingness to make clean energy choices in typical rural areas of northern China. Energy Policy 2020, 145, 11698. [Google Scholar] [CrossRef]
  22. Shimada, Y.; Matsuoka, Y. Analysis of indoor PM 2.5 exposure in Asian countries using time use survey. Sci. Total Environ. 2011, 409, 5243–5252. [Google Scholar] [CrossRef]
  23. Gao, X.; Yu, Q.; Gu, Q.; Chen, Y.; Ding, K.; Zhu, J.; Chen, L. Indoor air pollution from solid biomass fuels combustion in rural agricultural area of Tibet, China. Indoor Air 2009, 19, 198–205. [Google Scholar] [CrossRef] [PubMed]
  24. Du, J.; Huang, X.; He, L.; GY, S.L. Characteristics of particulate mercury in typical rural household of Northern China. J. Anhui Agric. 2010, 38, 3690–3963. [Google Scholar]
  25. Huang, Y.; Du, W.; Chen, Y.; Shen, G.; Su, S.; Lin, N.; Shen, H.; Zhu, D.; Yuan, C.; Duan, Y.; et al. Household air pollution and personal inhalation exposure to particles (TSP/PM2.5/PM1.0/PM0.25) in rural Shanxi, North China. Environ. Pollut. 2017, 231, 635–643. [Google Scholar] [CrossRef] [PubMed]
  26. Zhang, Z.; Wang, W.; Cheng, M.; Liu, S.J.; Xu, J.; He, Y.J.; Meng, F. The contribution of residential coal combustion to PM 2.5 pollution over China’s Beijing-Tianjin-Hebei region in winter. Atmos. Environ. 2017, 159, 147–161. [Google Scholar] [CrossRef]
  27. Wang, Y.Y.; Li, Q.; Guo, Y.; Zhou, H.; Wang, X.; Wang, Q.; Shen, H.; Zhang, Y.; Yan, D.; Zhang, Y.; et al. Association of Long-term Exposure to Airborne Particulate Matter of 1 μm or Less with Preterm Birth in China. JAMA Pediatr. 2018, 172, e174872. [Google Scholar] [CrossRef] [Green Version]
  28. Lu, D. Air pollution may be behind millions of deaths in China. New Sci. 2020, 247, 12. [Google Scholar] [CrossRef]
  29. Hou, J.; Zhang, Y.; Sun, Y.; Wang, P.; Zhang, Q.; Kong, X.; Sundell, J. Air change rates at night in northeast Chinese homes. Build. Environ. 2018, 132, 273–281. [Google Scholar] [CrossRef]
  30. Griffiths, M.; Eftekhari, M. Control of CO2 in a naturally ventilated classroom. Energy Build. 2008, 40, 556–560. [Google Scholar] [CrossRef]
  31. Mijakowski, M.; Sowa, J. An attempt to improve indoor environment by installing humidity-sensitive air inlets in a naturally ventilated kindergarten building. Build. Environ. 2017, 111, 180–191. [Google Scholar] [CrossRef]
  32. Lee, S.C.; Chang, M. Indoor and outdoor air quality investigation at schools in Hong Kong. Chemosphere 2000, 41, 109–113. [Google Scholar] [CrossRef]
  33. Wang, Z.; Xie, D.; Tang, R.; Sheng, X. Investigation on indoor air quality at rural houses in winter in severe cold region. Lect. Notes Electr. Eng. 2014, 261, 69–75. [Google Scholar]
  34. Shendell, D.G.; Prill, R.; Fisk, W.J.; Apte, M.G.; Blake, D.; Faulkner, D. Associations between classroom CO2 concentrations and student attendance in Washington and Idaho. Indoor Air 2004, 14, 333–341. [Google Scholar] [CrossRef] [PubMed] [Green Version]
  35. Gao, Y.; Meng, X. A comprehensive review of integrated phase change materials in building bricks: Methosds, performance and applications. J. Energy Storage 2023, 62, 106913. [Google Scholar] [CrossRef]
  36. Hu, C.X.; Wang, Z.H.; Bo, R.F.; Li, C.Y.; Meng, X. Effect of Phase Change Material Cooling Clothing on the Thermal Comfort of Healthcare Workers with Personal Protective Equipment during COVID-2019. Case Stud. Therm. Eng. 2023, 41, 102725. [Google Scholar] [CrossRef]
  37. Xie, X.; Yang, Q.; Gao, W. Field measurement and questionnaire survey on indoor environment in typical coastal villages of Qingdao (China) during the heating period. Case Stud. Therm. Eng. 2021, 26, 101048. [Google Scholar] [CrossRef]
  38. American National Standards Institute. Thermal Environmental Conditions for Human Occupancy; American Society of Heating, Refrigerating and Air-Conditioning Engineers: Peachtree Corners, GA, USA, 2004. [Google Scholar]
  39. GBT 18883-2002; Indoor Air Quality Standard. Ministry of Environmental Protection of the People’s Republic of China: Beijing, China, 2002.
  40. Du, W.; Yun, X.; Luo, Z.; Chen, Y.; Liu, W.; Sun, Z.; Zhong, Q.; Qiu, Y.; Li, X.; Zhu, Y.; et al. Submicrometer PM1.0 Exposure from Household Burning of Solid Fuels. Environ. Sci. Technol. Lett. 2020, 7, 1–6. [Google Scholar] [CrossRef]
  41. Jodeh, S.; Hasan, A.R.; Amarah, J.; Judeh, F.; Salghi, R.; Lgaz, H.; Jodeh, W. Indoor and outdoor air quality analysis for the city of Nablus in Palestine: Seasonal trends of PM 10, PM 5.0, PM 2.5, and PM 1.0 of residential homes. Air Qual. Atmos. Health 2018, 11, 229–237. [Google Scholar] [CrossRef]
Figure 1. Percentage of four types of heating facilities in the buildings surveyed.
Buildings 13 00792 g001
Figure 2. Locations and features of the dwellings monitored in the southern part of Shandong Peninsula, China.
Buildings 13 00792 g002
Figure 3. Location of the heating sources and measuring instruments in the four buildings monitored.
Buildings 13 00792 g003
Figure 4. Variations in (a) the temperature and (b) relative air humidity over time in the four buildings monitored and outdoors.
Buildings 13 00792 g004
Figure 5. Variations in indoor CO2 levels over time in (a) House-1, (b) House-2, (c) House-3 and (d) House-4.
Buildings 13 00792 g005
Figure 6. Variations in the indoor PM 1.0 concentrations with time in (a) House-1, (b) House-2, (c) House-3 and (d) House-4. PM, particulate matter.
Buildings 13 00792 g006
Figure 7. Variations in indoor PM 2.5 concentrations in (a) House-1, (b) House-2, (c) House-3 and (d) House-4 over the monitoring period.
Buildings 13 00792 g007
Figure 8. Variations in the PM 10 concentrations in (a) House-1, (b) House-2, (c) House-3 and (d) House-4 over the monitoring period.
Buildings 13 00792 g008
Table 1. Accuracy and range of the measuring instruments.
House TypeLocation of Heating SourceNumberPercentageTypical House and Inhabitant Number
ILocated in the main room610%House 1 with 5 persons
IILocated in secondary room connected to the main room2135%House 2 with 3 persons
IIILocated in separate secondary rooms or outdoors1220%House 3 with 6 persons
VITwo heating sources located in separate secondary rooms or outdoors2135%House 4 with 6 persons
Table 2. Accuracies and ranges of the measuring instruments.
NameTested ParameterAccuracyMeasuring RangeResolution
IBEMAir temperature±0.3 °C−40~80 °C0.1 °C
IBEMRelative humidity±5%0~99.9%1%
IBEMCO2±75 ppm400~5000 ppm1 ppm
IBEMPM 1.0±10 μg/m30~1000 μg/m31 μg/m3
IBEMPM 2.5±10 μg/m30~1000 μg/m31 μg/m3
IBEMPM 10±100 μg/m30~2000 μg/m31 μg/m3
Table 3. Indoor and outdoor temperatures and relative humidity over the monitoring period.
BuildingsAir TemperatureRelative Humidity
Maximum (°C)Minimum (°C)Average (°C)Standard DeviationMaximum (%)Minimum (%)Average (%)Standard Deviation
Outdoor7.0−12.1−1.23100215514
House 117.710.714.316641524
House 218.411.314.846038514
House 318.75.914.124928395
House 424.412.118.534622325
Table 4. Indoor CO2 levels in the four houses over the monitoring period.
BuildingsMaximum (ppm)Minimum (ppm)Average (ppm)Standard Deviation
House 12869471872364
House 221015361085219
House 31989498746244
House 41021501564175
Table 5. Indoor PM 1.0 levels in the four houses over the monitoring period.
BuildingsMaximum (μg/m3)Minimum (μg/m3)Average (μg/m3)Standard Deviation
House 143754854
House 248568930
House 316212518
House 415645230
Table 6. Indoor PM 2.5 levels in the four houses during the monitoring period.
BuildingsMaximum (μg/m3)Minimum (μg/m3)Average (μg/m3)Standard Deviation
House 182197389
House 21995715046
House 327123916
House 425067545
Table 7. Indoor PM 10 levels in the four houses during the monitoring period.
BuildingsMaximum (μg/m3)Minimum (μg/m3)Average (μg/m3)Standard Deviation
House 11036787107
House 23894818255
House 336824936
House 430479053
Table 8. Evaluation parameters of indoor air quality in the houses surveyed.
House TypeAir Temperature (°C)Relative Humidity (%)CO2 Concentration (ppm)Particulate Matter Concentration (μg/m3)
PM 1.0PM 2.5PM 10
MaxAvgMaxAvgMaxAvgMaxAvgMaxAvgMaxAvg
I17.4 ± 6.214.3 ± 2.464.3 ± 9.651.8 ± 4.12961 ± 6581015 ± 256417 ± 5979 ± 9.3809 ± 39119 ± 311734 ± 136149 ± 14
II17.1 ± 7.214.9 ± 3.461.5 ± 9.150.7 ± 3.92141 ± 3691046 ± 245409 ± 5181 ± 7.3827 ± 34120 ± 291839 ± 186157 ± 29
III17.1 ± 7.413.4 ± 4.145.3 ± 8.438.9 ± 3.21456 ± 315645 ± 111145 ± 2623 ± 4.5269 ± 1745 ± 13316 ± 6942 ± 19
VI23.6 ± 8.218.3 ± 1.943.9 ± 9.133.6 ± 3.41569 ± 309675 ± 108156 ± 3941 ± 3.6274 ± 1681 ± 12309 ± 6498 ± 27
Disclaimer/Publisher’s Note: The statements, opinions and data contained in all publications are solely those of the individual author(s) and contributor(s) and not of MDPI and/or the editor(s). MDPI and/or the editor(s) disclaim responsibility for any injury to people or property resulting from any ideas, methods, instructions or products referred to in the content.