Article

Theoretical Study and Nonlinear Finite Analysis of Four-Line Restoring Force Model for Double-Superimposed Slab Shear Walls

1
Shanghai Pudong Architectural Design & Research Institute Co., Ltd., Shanghai 201206, China
2
China Construction Eighth Engineering Division Co., Ltd., Shanghai 200135, China
*
Author to whom correspondence should be addressed.
Buildings 2023, 13(3), 749; https://doi.org/10.3390/buildings13030749
Submission received: 31 January 2023 / Revised: 1 March 2023 / Accepted: 8 March 2023 / Published: 13 March 2023
(This article belongs to the Special Issue Steel Structures and Sustainable Building Structure System)

Abstract

:
This paper is concerned with the seismic behavior of a superimposed slab shear wall. Based on the test results of the specimens under low cyclic reversal loading, the formulas with respect to the top displacement and capacity of a shear wall in the consecutive loading process are derived. The concrete grade differentiation between the prefabricated layer and the cast-in-site layer of the shear wall is considered to improve the calculating precision. With the help of these equations, the extent of participation of the prefabricated concrete layers in the different loading stages is revealed, demonstrating a great confirmation of the test results. Two ideal conditions, utterly with and without connective effect between a combined interface, are considered to investigate the action of the bond–slip effect. On this basis, the finite element analysis is completed in the framework of OpenSees. Its quadrilinear restoring force model, with the consideration of the stiffness degradation and pinching effect, is established in this paper by various feature points from the theoretical derivation of capacities in different loading stages. The rationality of the restoring force model of the shear wall is testified by the satisfactory agreement of the test results and simulation results.

1. Introduction

A traditional cast-in-site shear wall has found its new feasible form, a superimposed slab shear wall, to make itself quickly adapted in the wave of building industrialization [1,2]. Some researchers in this field have made a relatively clear understanding of its structural performance. Benayoune et al. [3], Choi et al. [4], and Mahendran et al. [5] conducted a series of research focusing on its ordinary flexural and shear behavior.
Furthermore, Md Fudzee et al. [6] made an insight into the seismic performance of a superimposed slab shear wall, which counts for a crucial behavior contributing to its broader application. Kang et al. [7] indicated that the ductility and energy dissipation capacity are decreased by gap opening and shear slip at the panel joints in conventional precast concrete (PC) walls subject to cyclic loading. In this study, to enhance the earthquake resistance of emulative PC walls, two potential methods were studied. Chong et al. [8] proved that the seismic performance of a superimposed reinforced concrete (RC) shear walls is reduced due to the sway behavior and damage concentration at the horizontal joints, and proposed an enhanced horizontal joint method to improve the seismic performance of this type of members. Gu et al. [9] investigated the seismic behaviors of three full-scale T-shaped precast concrete superposed shear wall specimens with cast-in-place boundary columns and special boundary elements and two those of T-shaped cast-in-place shear wall specimens for reference using a quasi-static cyclic loading test. It is proved that the T-shaped superposed precast concrete shear wall specimen with the new connecting method of vertical joint exhibited deformation capacities, higher strengths, and energy dissipation capacities compared with the T-shaped superposed precast concrete shear wall specimen with the traditional overlapped connecting method. Jiang et al. [10] proposed a new type of superimposed reinforced concrete shear wall with insulation (SRCSWI) by integrating the insulation panel into the precast exterior concrete panel to achieve both bearing and insulation capabilities. The feasibility and effectiveness are verified by experiment and finite element simulation. The above research conducted an experimental study on the mechanical behavior characteristics and seismic performance of a superimposed slab shear wall or its improved form. However, these studies did not deeply discuss the restoring force model of a superimposed slab shear wall [11], and the numerical simulation methods used in each study were quite different.
Given that, some scholars have proposed restoring force models and numerical simulation methods suitable for a superimposed slab shear wall as supplementary research means for experimental analysis. For example, according to the low-cycle repeated load test results of a double-wall precast concrete shear wall, Yin et al. [12] analyzed its hysteretic curve and skeleton curve. Then, through the dimensionless treatment of the skeleton curve, the main points and calculation methods of the skeleton curve were summarized, and then a three-line restoring force model of a double-wall precast concrete shear wall was proposed. Such restoring force model provides a feasible scheme for the finite element simulation verification of a superimposed slab shear wall, but the simulation accuracy compared with the test results is insufficient due to its rough description. In addition, the accuracy of a numerical simulation will be affected by the consideration of the concrete grade difference between the prefabricated layer and the cast-in-place layer of the shear wall [13], the bond–slip effect of the composite section [14], the stiffness degradation, the pinching effect [15], and so on, which has not been analyzed in detail in existing studies.
As a vital and fundamental seismic property, the restoring force model of the superimposed slab shear wall plays a key role in the intricate nonlinear dynamic elastic-plastic analysis. However, because some issues mentioned above are pending, such as the bond–slip effect of the composite section and the stiffness degradation effect, there is currently no accurate and concise restoring force model for numerical simulation. In this paper, a quadrilinear model considering stiffness degradation is proposed, which can be used to describe appropriately the load–displacement relationship of a superimposed slab shear wall. The proposed restoring force model is established and calculated with the help of the Pinching4 model from OpenSees. Test results of the specimen W-2/W-5 (cast-in-site edge member) and specimen W-3/W-6 (prefabricated edge member) from Lian [16], together with the test results of the specimen W-2/W-4B from Ye et al. [17], are selected for comparison with the calculation results of the proposed numerical model.

2. The Proposed Restoring Force Model

In this paper, specimens from Lian [16] and Ye et al. [17] are named after W-2 and W-2y, respectively. The details of six test specimens are shown in Figure 1. The details of the test device, loading system, and measuring point arrangement are listed in [16,17]. According to the test results, the failure phenomenon of a double-superimposed slab shear wall can be divided into four stages, namely, the uncracked stage, the inclined crack formation stage, the peak load stage, and the failure stage. The uncracked stage is the stage when the first crack appears from the beginning of loading to the wall. The inclined crack formation stage refers to that when the horizontal cracks develop towards the vertical axis of the wall after the initial cracking stage. The peak load stage is the stage from the formation of inclined cracks to the peak load, where the horizontal and oblique cracks expand rapidly, and diffuse cracks appear in the compression zone, with a small part of concrete peeling off. When the horizontal load of the wall is reduced to 85% of the peak load, the failure stage is reached, and the bearing capacity of the specimen decreases.
According to the above test phenomenon, the restoring force model of a superimposed slab shear wall adopts the corresponding four-line model considering stiffness degradation, which can be shaped and determined by the displacement, curvature, moment, and stiffness obtained by the corresponding cracking load, yield load, peak load, and ultimate load. Determining the value of the above key parameters is the focus of this section.

2.1. Calculation of Displacement

In order to analyze the top displacement of a composite plate shear wall, it is necessary to establish a simplified mechanical model of this kind of structure. According to the mechanical characteristics of a composite plate shear wall, its calculation diagram can be simplified as a cantilever member, as shown in Figure 2. In this figure, H1 represents the height of the rebar joint, H is the height of the shear wall, and E1I1 and E2I2 are the stiffness of the reinforcement joint area and other areas, respectively.

2.1.1. Displacement before Yield

Along with the stiffness degradation, cracks in the shear wall are observed obviously before the yield. Supposing the wall stiffness deteriorates linearly along the height, its stiffness at the top of the rebar joint should be equal to [β + (1 − β)(H1/H)]EI, where EI and βEI are the stiffness at the top and the bottom of the shear wall, respectively. In addition, the complexity of the connection at the top of the rebar joint generates stress concentration. This phenomenon also makes the bottom of the shear wall local stiffness further degrade. Therefore, a reasonable assumption should make the shear wall stiffness in the full range of the rebar joint all equal to the bottom stiffness of βEI. Besides, the shear wall stiffness outside the range of the rebar joint is [β + (1 − β)(x/H)]EI, where H1xH.
Under the horizontal force at the top of the shear wall, according to the displacement calculation formula of two cantilever beam models with different stiffnesses [18], the corresponding bending displacement is:
Δ b = P 3 β E I . H 3 ( H H 1 ) 3 + P H ( 1 β ) 3 E I 1 2 ( 1 β ) 2 ( H 1 2 H 2 ) + ( 1 β ) H ( H 1 H ) + H 2 ln H 1 β + H H 1 H β
The shear displacement is:
Δ s = P H 1 β G A + P H ( 1 β ) G A ln H β H + ( 1 β ) H 1
where GA is the shear stiffness. Then, the total displacement is derived as:
ΔYIELD = Δb + Δs
It can be seen from the equations above that the stiffness degradation factor β is crucial to determine the displacement. Obtained from the average cracking load and cracking displacement of six specimens, β has a recommended value of 0.23 for calculating theoretical cracking displacement. Meanwhile, it has a recommended value of 0.1 for calculating the theoretical yield displacement after obtaining the average results of the yield load and yield displacement from the tests. By substituting the corresponding β into Equation (3), the theoretical cracking displacement and yield displacement can be determined. The results are summarized in Table 1.

2.1.2. Peak Displacement

Under the peak load, the bottom section of the shear wall reaches the corresponding ultimate curvature. The distribution of the sectional curvature along the height of the shear wall at this moment is shown in Figure 3a. As the load increases from the peak point to the ultimate point, the plastic range at the bottom of the shear wall is fully developed and ends up with a formative plastic hinge with a certain height. The distribution of the sectional curvature at this moment is shown in Figure 3b.
(1) At the peak load, the top displacement due to bending of the plastic hinge is:
Δ b p = 1 2 ( H l p ) l p ϕ y + 1 2 ( H l p ) l p ϕ u + 1 6 l p 2 ϕ y + 1 3 l p 2 ϕ u
where lp is the length of the plastic hinge, ϕy is the yield curvature, and ϕu is the ultimate curvature. Zhang et al. [19] proposed a series of formulas to describe the plastic hinge. The length of the plastic hinge considering the effect of the bend–shear ratio is:
l p = 0.33 M u / V u H 0.03 H
The yield curvature [20] is:
ϕ y = ε y ( 1 ξ n ) h w = 2 ε y h w
The ultimate curvature [21] is:
ϕ u = φ u ε c u x n = φ u ε c u 1.25 ξ h w
where
ξ = N b w h w + ρ y w f y w f c + 2.5 ρ y w f y w
and
ε c c = ε c + 2.5 λ v ε c                                                                                                             λ v 0.32 6.2 ε c + 25 λ v ε c                                                                                               λ v   >   0.32
In the above equations, ρyw is the ratio of the distributed vertical reinforcement. Fyw is the yield strength of the distributed vertical reinforcement. ξ is the relative height of the compressive zone. φu is the strain coordination factor, normally varying from 1.1 to 1.3 [22,23]. For the superimposed slab shear wall, the test results give a recommended value of 1.1. λν is the stirrup characteristic value, which is specified to be 0.12 per provision in the code JGJ 3-2010. Εc is the peak strain of the compressive concrete. εcc is the peak strain of the confined compressive concrete. εcu is the ultimate strain of the confined compressive concrete, which equals to 2.2εcc per provision in Chinese code [24].
At the peak load, the top displacement due to the shear of the plastic hinge is:
Δ s p = l p V p K s
where Ks is the shear stiffness of the plastic hinge. Ks = [ρsh/(1 + 4sh)]Esbwhw based on the 45° diagonal compressive concrete equivalent truss model from Park [25]. ρsh is the ratio of the horizontal reinforcement in the shear wall. n is the ratio of the elastic module of the rebar to the elastic module of concrete, namely, n = Es/Ec. At the peak load, the top displacement due to both bending and shearing is:
Δ p = Δ b p + Δ s p
The elastic displacement is:
Δ e = H l p H Δ Y I E L D
The total displacement is:
Δ e = H l p H Δ Y I E L D
Table 1 summarizes the calculated results and the test results at the peak load.

2.1.3. Ultimate Displacement

(1) At the ultimate load, the top displacement due to bending of the plastic hinge [26] is:
Δ b u = 1 2 ϕ u l p 2 + ϕ u l p ( H l p )
(2) At the ultimate load, the top displacement due to the shear of the plastic hinge should not be less than the displacement at the peak load. To be conservative, the displacement under the ultimate load can be replaced by the displacement at the peak load, namely, Δ s u = Δ s p .
(3) At the ultimate load, the top displacement due to both bending and shearing is:
Δ = Δ e + Δ u
where Δ u =   Δ b u + Δ s u . Comparisons between the calculated results and the corresponding test results at the ultimate load are summarized in Table 1.
It can be concluded from Table 1 that the calculated results and the test results are in good agreement among cracking displacement, yield displacement, peak displacement, and ultimate displacement, which verifies the accuracy of the displacement calculation method in the residual force model proposed in this paper.

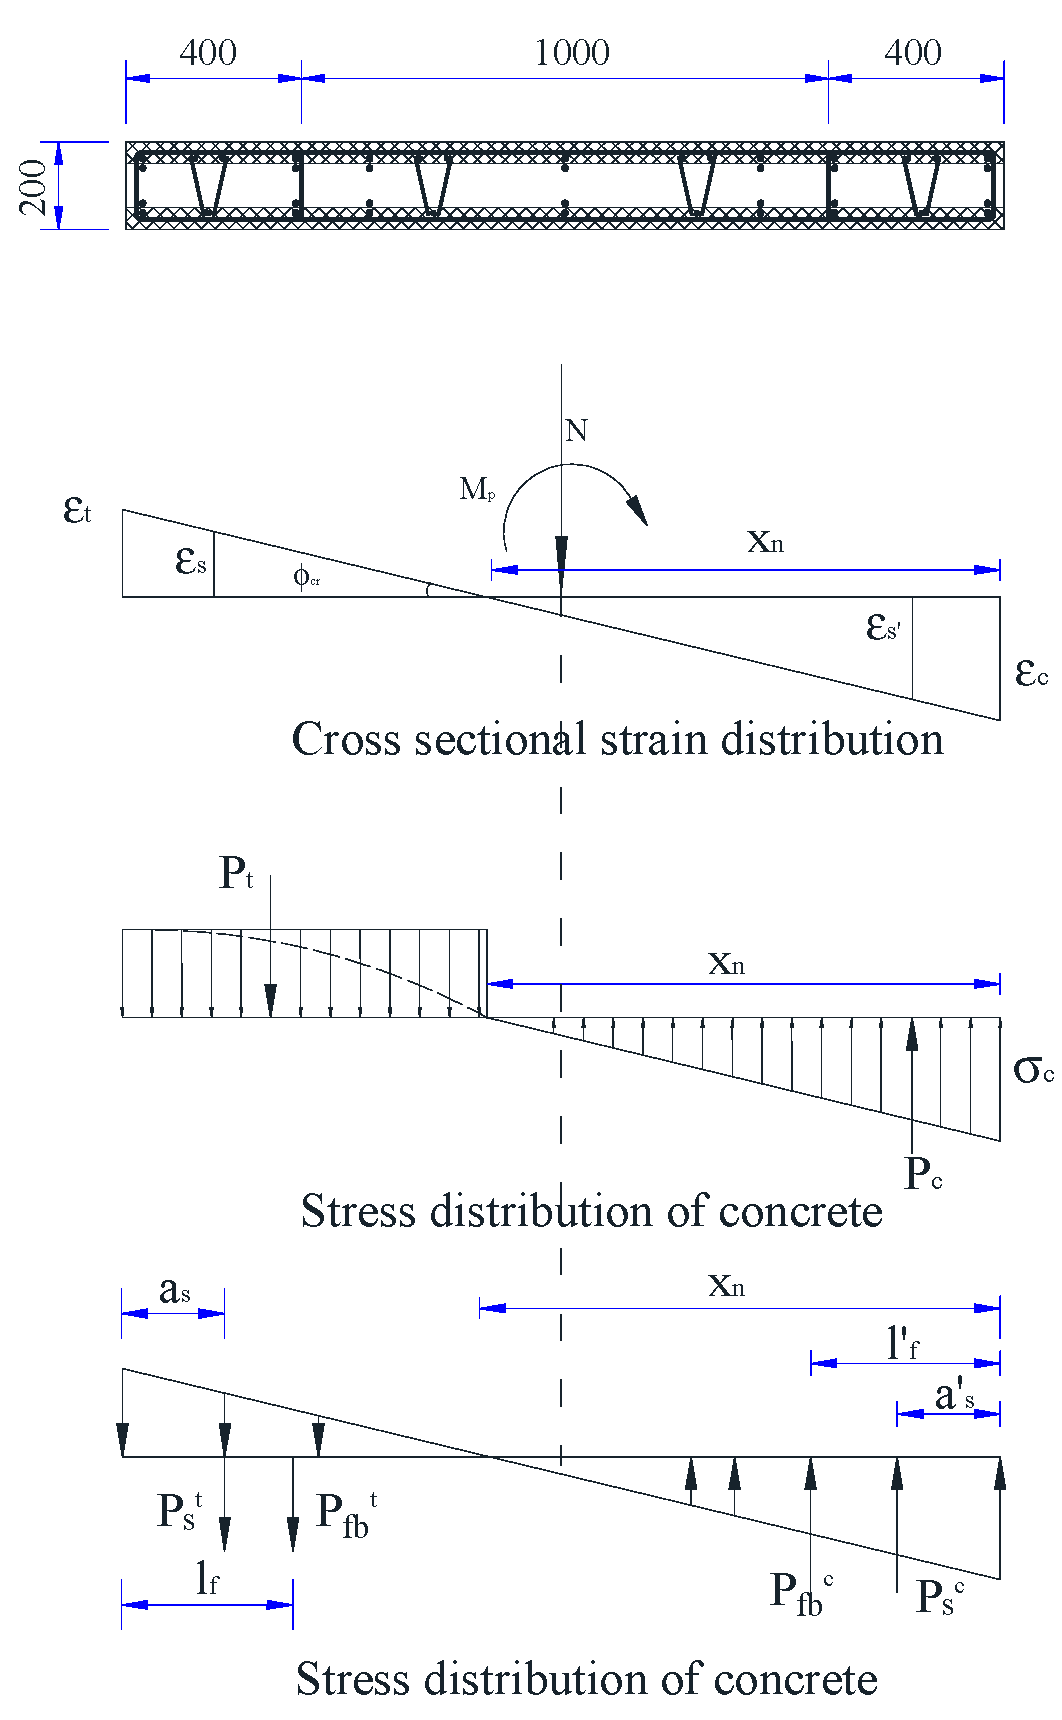
2.2. Calculation of Moment and Curvature

Whether there is a slip effect between composite interfaces is the key problem to be solved by the restoring force model of the superimposed slab shear wall. If there is no slip effect, an overall analysis model can be implemented to calculate the cracking load and yield load.

2.2.1. Peak Load

Figure 4 gives a strain–stress relationship in the cross section of the shear wall (take specimen W-3, for example). The analytical assumptions include: (a) plane cross-section assumption, (b) ignorance of tensile concrete action, (c) ideal elastic-plastic constitutive relationship of the rebar, and (d) strength enhancement of concrete caused by the confinement effect of the stirrup. Two extreme situations are considered: (1) no connective effect between the combined interfaces and (2) perfectly connective effect between the combined interfaces. By contrasting the calculating results with the test results, whether there is a slip effect between the combined interfaces can be determined. The no-slip effect will make the application of the overall analysis model possible.
Regarding the shear wall under the peak load, the longitudinal reinforcement at both ends of the cross section will yield when the compressive zone height xnlc. Therefore, assuming the longitudinal reinforcement within 1.5xn from the outmost edge of cross-sectional compressive zone height, all the yield under the peak load is appropriate. Based on the vertical force equilibrium, Equation (16) is derived.
N + P f b t + P y s t = P y c + P c + P y s c
where N is the vertical compression force of the cross section. P f b t is the resultant tension force of the distributed longitudinal reinforcement. f f b and ρ v are the tension strength of the distributed longitudinal reinforcement and its reinforcement ratio respectively. lc is the length of confined concrete zone. P y s t is the resultant tension force of the rebar in the confined concrete zone. P y c is the resultant compression force of concrete in the confined concrete zone. f c c is the uniaxial compression strength of confined concrete. P c is the resultant force of the compression of concrete in the unconfined concrete zone. P y s c is the resultant compression force of the reinforcement in the compressive zone of confined concrete. When it comes to the symmetrically reinforced shear wall, P y s t = P y s c . Thus, Equation (16) can be simplified to Equation (17).
N + P f b t = P y c + P c
The bending capacity of the shear wall under the peak load can be derived from the bending moment equilibrium through the cross-sectional centroid, which is shown in Equation (18).
M p = f c c b w ( h w l c ) / 2 + 0.5 b w f c ( x n l c ) ( h w 2 x n 3 2 l c 3 ) + 2 f y A s ( h w / 2 a s ) + f f b ρ v ( h w 1.5 x n ) b w ( 1.5 x n l c ) / 2
When the compressive zone height xn < lc, the longitudinal reinforcement in the tensile zone will yield, but those in the compressive zone will not. Based on the cross-sectional equilibrium, Equation (19) is derived.
N + P f b t + P y s t = P y c + P y s c
Similarly, by applying the bending moment equilibrium through the cross-sectional centroid, the bending capacity of the shear wall can be presented in Equation (20).
M p = f c c b w x n h w x n / 2 + f y A s h w / 2 a s + σ y A s h w / 2 a s + f f b ρ v h w 1.5 x n b w 1.5 x n l c / 2
Then, the peak load can be expressed as
Fp = Mp/H
(1) No connective effect between combined interfaces
In the test, the specimen W-3 is a typical example of a nonconnected shear wall. Hence, it can be treated as three totally separate walls, namely, two prefabricated walls on both sides and one cast-in-site concrete wall in the middle.
(i) Prefabricated wall
On the basis of the cross-sectional equilibrium relationship and Equation (20), the bending capacity Mp = 205.34 kN m and the compressive zone height xn = 73.2 mm.
(ii) Cast-in-site wall
The bending capacity of the middle cast-in-site shear wall can only reach the cracking moment capacity of the plain concrete shear wall with the same section due to its nonreinforced condition. In this context, the bending capacity of the separated shear wall is 410.68 kN m; then a calculated peak load of 136.89 kN can be derived from Equation (21), making a great difference compared with a test peak load of 407 kN.
(2) Perfectly connective effect between combined interfaces
A coordinate working mechanism of the shear wall will form when no slip effect exists between the combined interfaces. Under the ultimate load, the prefabricated wall is slower to reach the ultimate state due to higher concrete strength compared with the cast-in-site wall. Because of this phenomenon, to be conservative, the concrete strength of the prefabricated shear wall can be the same as that of the cast-in-site wall.
A compressive zone height xn = 208.2 mm is obtained from the cross-sectional equilibrium. It indicates that only the outermost reinforcement in the compressive zone reaches the yield point, which matches well with the test phenomenon. From Equation (20), the bending capacity of the connected wall is Mp = 1053.38 kN; then the calculated peak load of 351.13 kN can be derived from Equation (21), making an error of 13.72% compared with the test result of 407 kN.
Through the analysis above, the theoretical strength of the shear wall inferred by the no-slip condition is more consistent with test results. In fact, the same conclusion also can be found in the test phenomena [16,17]. Therefore, it is feasible to ignore the bond–slip effect between the superimposed surfaces. Here, the overall analysis model can be applied to calculate the shear wall strength under the cracking load and yield load.

2.2.2. Cracking Load

Under the load lower than the cracking load, the concrete will remain in the elastic stage. Its cross-sectional strain linearly distributes along the cross-sectional height, as shown in Figure 5. When the maximum tensile strain εt = εtu, the concrete of the tensile zone becomes invalid. Meanwhile, due to the relatively small strain of both compression and tension, the plane cross section assumption is still applicable when the concrete is close to cracking. The cross-sectional stress distribution shown in Figure 5 can be further inferred according to the constitutive relationship of concrete. According to the existing test phenomenon [16,17], the range of the shear wall tension zone under normal working conditions is generally small. Therefore, the stress distribution shape in the tensile zone can be replaced by a rectangular shape to facilitate the subsequent formula derivation. Based on the geometrical relationship, the following equation can be derived:
ϕ c r = ε t u h x n = ε c x n = ε s h x n
From equilibrium relationship, it gives: N + P t + P s t + P f b t = P c + P s c + P f b c . With a known compressive zone height of xn, the bending capacity is obtained from the bending moment equilibrium through the cross-sectional centroid:
M c r = P c ( h 2 x n 3 ) + P t h x n 2 + P s t ( h 2 a s ) + P s c ( h 2 a s ) + P f b t ( h 6 + x 2 l f 3 ) + P f b c ( h 2 x l f 3 )
The stress and strain distribution under the cracking load considering the differences of concrete strength grade are shown in Figure 5. Under the cracking load, the stress in the prefabricated layer and that in the cast-in-site layer are different due to different strength grades of concrete. Hence, the distinction of concrete strength grade in these two kinds of wall layer should be considered as a stand-alone variable, as discussed below:
(1) Neglecting concrete strength grade differences
Generally, the lower concrete strength grade of the cast-in-site layer can be treated as the representative of the concrete strength grade of the overall cross section. Based on the equilibrium equation, the height of the compressive zone xn = 862.93 mm. From Equation (22), an inferred bending capacity under the cracking load is Mcr = 484.09 kN m. Meanwhile, the corresponding cracking load is 161.36 kN, which has 23.16% error compared with the test result of 210 kN.
(2) Considering concrete strength grade differences
Assuming that the concrete compressive stress at the outermost section of the prefabricated layer is σyc = η1σc, the concrete in the compressive zone has the relationship shown in Equation (24):
0.5 σ y c x n × b w 2 + 0.5 σ c x n × b w 2 = 0.5 b w σ c x n ( η 1 2 + 1 2 )
It is supposed that the concrete compressive enhancement factor is ξc = (η1/2 + 1/2), where η1 = 1.4 and ξc = 1.2, which is inferred based on the concrete strength relationship between the prefabricated layer and the cast-in-site layer. According to the equilibrium equation, the concrete at the tensile zone has the relationship presented in Equation (25), in the premise of a hypothetical tensile stress of σyt = η2ft at the outmost section of the concrete tensile zone.
σ y t ( h x n ) × b w 2 + f t ( h x n ) × b w 2 = b w f t ( h x n ) ( η 2 2 + 1 2 )
It is supposed that the concrete tensile enhancement factor is ξt = (η2/2 + 1/2), where η2 = 1.2 and ξt = 1.1. Such equation is inferred based on the concrete strength relationship between the prefabricated layer and the cast-in-site layer. Taking the prefabricated concrete strength enhancement effect into account, the bending capacity under the cracking load is Mcr = 555.462 kN·m, which is inferred from Equation (23). The corresponding calculated cracking load is 185.154 kN, which has 11.83% error compared with the test result of 210 kN. As shown in the results, a higher concrete strength grade in the prefabricated wall gives a higher cracking resisting capacity, which simultaneously assists in postponing the stretch of the concrete crack.

2.2.3. Yield Load

After the concrete cracking, the cracks gradually increase, accompanying the load increment. Concrete at the tensile zone becomes invalid very soon, shifting the load to the tensile reinforcement. The cross section yields when the reinforcement is at the yield point. Meanwhile, concrete at the compressive zone is still at its elastic stage, as shown in Figure 6.
Based on the cross-sectional geometric relationship, the following equation can be derived:
ϕ y = ε c x n = ε s h 0 x n
Then, the equilibrium relationship N + P S t + P f b t = P c + P s c + P f b c and the height of compressive zone xn are derived. Afterwards, by employing the bending moment equilibrium through the cross-sectional centroid, the yield bending capacity of the shear wall is
M f = P c ( h 2 x n 3 ) + P s t ( h 2 a s ) + P s c ( h 2 a s ) + P f b t ( h 6 + x 2 l f 3 ) + P f b c ( h 2 x l f 3 )
Under the yield load, the stresses of the prefabricated layer and the cast-in-site layer are different because of differences between the concrete strength grades, as shown in Figure 6. Hence, whether the concrete strength grade of these two layers is consistent should be taken as a separate variable to be introduced.
(1) Neglecting concrete strength grade differences
The lower concrete strength grade shall be a representative of the concrete strength of the overall cross section. Based on the equilibrium equation, the height of the compressive zone is xn = 392.92. From Equation (27), a derived bending capacity under the yield load is Mf = 862.705 kN·m. Meanwhile, the yield load is 287.56 kN, which gives an error of 17.84% compared with the test result of 350 kN.
(2) Considering concrete strength grade differences
It is supposed that the compressive stress of the concrete at the edge of the prefabricated layer σyc = η1σc. By replacing the concrete strength grade of the prefabricated layer with the grade of the cast-in-site layer, Equation (28) is derived.
0.5 σ y c x n × b w 2 + 0.5 σ c x n × b w 2 = 0.5 b w σ c x n ( η 1 2 + 1 2 )
Based on the relationship between the concrete strength grades of the prefabricated layer and cast-in-site layer, the hypothesis relationship’s concrete compressive enhancement factor of ξc = (η1/2 + 1/2) can be established, where η1 = 1.4. Then, the equation ξc = 1.2 can be derived. The yield bending capacity Mf is 1006.069 kN·m, which is derived from Equation (27), under the consideration of the prefabricated concrete strength enhancement effect. Meanwhile, the yield load is 335.356 kN, which gives an error of 4.18% compared with the test result of 350 kN. Obviously, a higher concrete strength grade of the prefabricated layer enhances the yield capacity of the overall shear wall.

2.2.4. Ultimate Load

Ultimate load is defined as 85% of the peak load in the descending branch of the load–displacement curve. That is, Fu = 0.85Fp. Taking W-3, for instance, the calculated ultimate load is 298.5 kN, which has 2% error compared with the test result.
Table 2 summarizes the results of W-2, W-5, W-6, W-4B, and W-2y. It gives a relatively preferable coherence between the test results and the calculated results, except for a big deviation of the specimen W-6 regarding the cracking load and the yield load. The calculated results of the no-slip overall model, although slightly lower, provide a great agreement with the test results. This conclusion testifies the truss rebar embedded in the wall, guaranteeing a synergetic working mechanism of the overall shear wall.
Currently, different codes have different provisions with respect to the concrete grades of the prefabricated wall and the cast-in-site wall. The enhancement effect due to a higher concrete grade of the prefabricated layer should be taken into account while calculating the cracking capacity. Furthermore, a higher concrete strength grade will also contribute to the deferral of crack emergence. In consequence, the prefabricated concrete of the shear wall is recommended to use a higher concrete grade in the practical application.

2.3. Calculation of Stiffness

The cracking stiffness, the yield stiffness, the peak stiffness, and the ultimate stiffness are calculated by the equations below, respectively:
K c r = P c r Δ c r
K f = P f P c r Δ f Δ c r
K p = P p P f Δ p Δ f
K u = P u P p Δ u Δ p

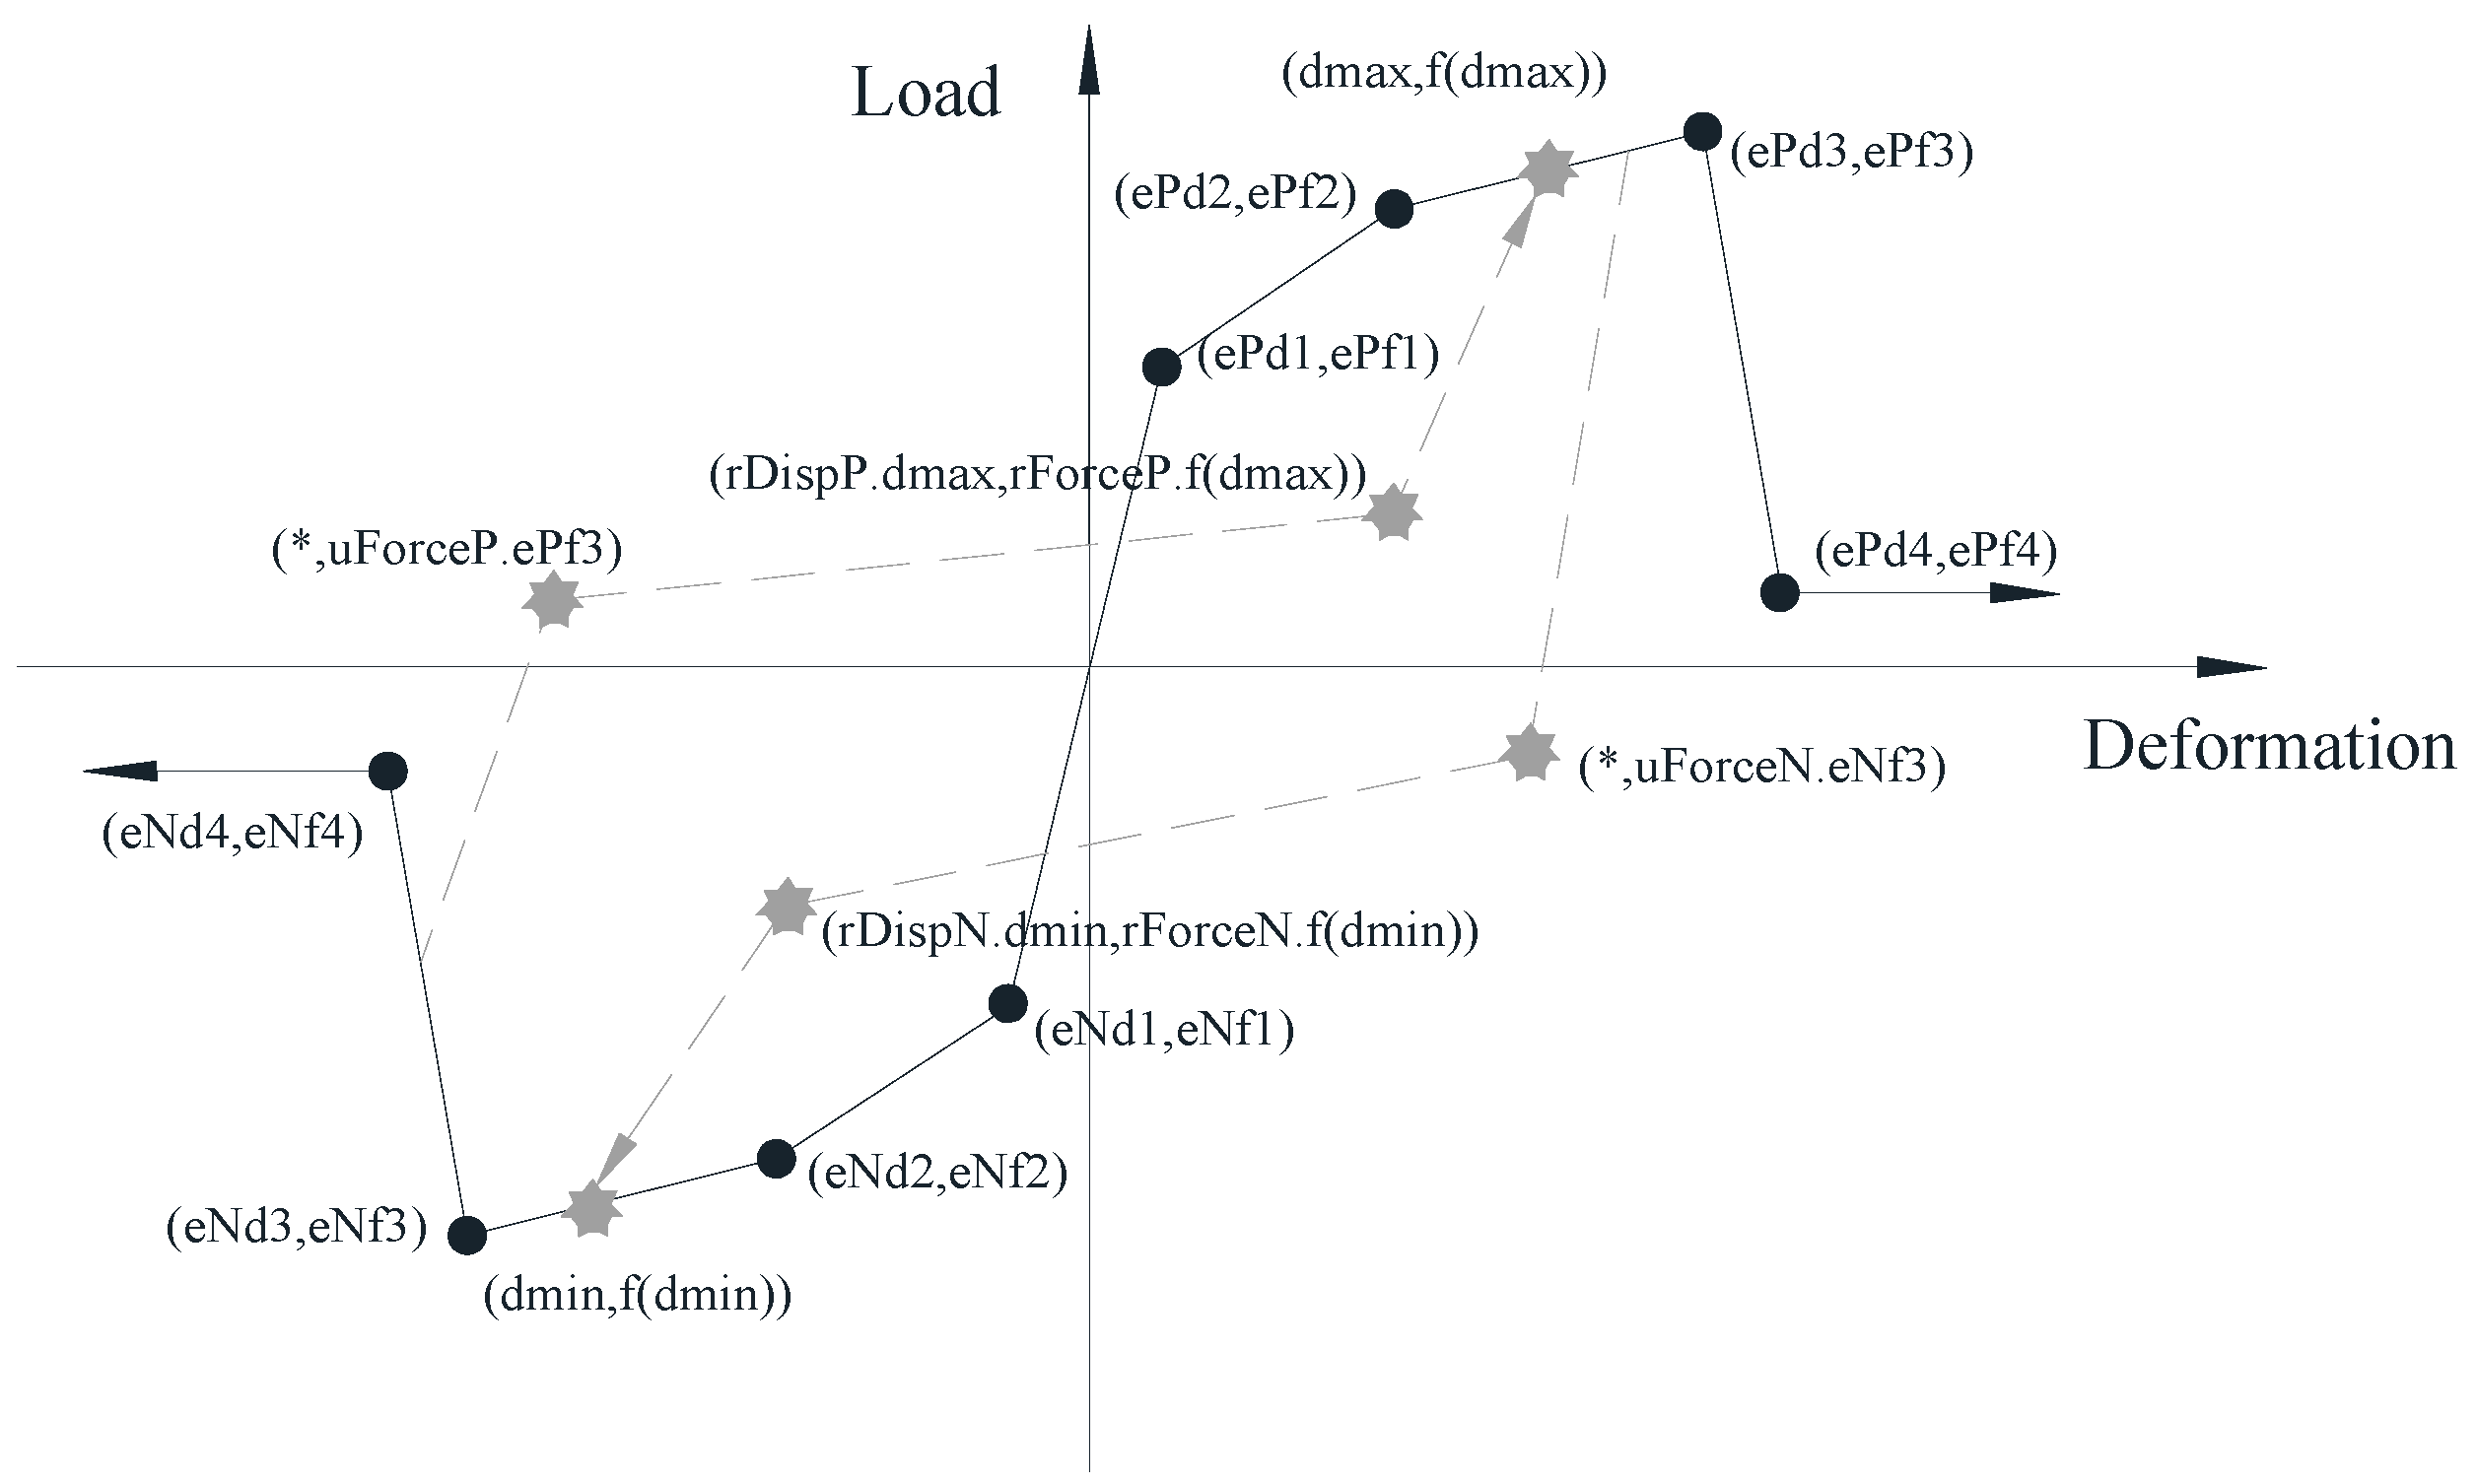
3. Hysteretic Principle Based on Pinching4 of OpenSees

3.1. Introduction of Pinching4

The Pinching4 model describes the hysteretic response of a material with a pinch effect, as shown in Figure 7. Its parameters include a backbone curve under monotonous loading, an unloading–reloading path under cyclic loading, and three failure criteria, namely, unloading stiffness degradation criterion, reloading stiffness degradation criterion, and strength deterioration criterion. The dashed line in Figure 8 illustrates a typical trilinear unloading–reloading path of this model.

3.2. Determination of Backbone Curve

The Pinching4 model defines a generalized one-dimensional load-deformation response, which can be further adjusted based on practical needs. On account of the load–deformation relationship of the preceding part of the paper, the load and the corresponding displacement at the cracking point, yield point, peak point, and ultimate point can be selected as four control points of the backbone curve. With the symmetrical backbone curve applied, the reversal loading condition can be considered.

3.3. Determination of Unloading–Reloading Path

The trilinear unloading–reloading path needs two independent points along the line, indicating the end of unloading and the start of reloading. In order to define the load at the end of unloading, the utilization of the minimum (maximum) load under monotonous loading is appropriate, which is denominated as uForceN*(-F) and uForceP*F. In order to define the load at the start of reloading, the utilization of the minimum (maximum) load under current loading is appropriate, which is denominated as rForceN*Fmin and rForceP*Fmax. As for the displacement at the start of reloading, the utilization of minimum (maximum) displacement under current loading is appropriate, which is denominated as rDispN* Δmin and rDispP* Δmax, where F and Δ are generalized load and displacement, which are specifically stated as stress and strain in the paper.
As stated above, the simulated pinch effect is determined by the value of uForce, rForce, and rDisp. The parametric values of the specimens W-2, W-5, and W-2y can be assigned as uForce = −0.65, rForce = 0.35, rDisp = 0.3. The parametric values of the specimens W-3, W-6, and W-4B can be assigned as uForce = −0.45, rForce = 0.35, rDisp = 0.3. Additionally, with the symmetrical backbone curve applied, the reversal loading condition can be considered.

3.4. Simulation of Degradation Effect

In the hysteretic response, the simulation of the degradation effect in the Pinching4 model is realized by the parameters of reloading stiffness degradation, unloading stiffness degradation, and strength deterioration. These three failure parameters have a unanimous format, which is expressed in the generalized failure index theory proposed by Park and Ang [27] in 1985:
δ i = α 1 Δ max α 3 + α 2 E i E m o n o t o n i c α 4 lim
where δi indicates the damage index (which gives 0 in the nondamage condition and 1 in the failure condition). E indicates the energy dissipation in the hysteretic loading. Emonotonic indicates the energy dissipation in the monotonous loading. Δ indicates the positive failure displacement of the monotonous loading. −Δ indicates the negative failure displacement of the monotonous loading.
(1) Unloading stiffness degradation:
k i = k 0 1 δ i k
where k0 indicates the initial unloading stiffness. ki indicates the current unloading stiffness. δ i k indicates the value of the current stiffness damage.
(2) Reloading stiffness degradation:
d max = d max , 0 1 δ i d
where dmax,0 indicates the displacement at the end of the reloading in the nonstiffness degradation condition. dmax indicates the current displacement at the end of the reloading in the stiffness degradation condition. δ i k indicates the value of the current stiffness damage.
(3) Strength deterioration:
f max = f max , 0 1 δ i f
where fmax,0 indicates the initial maximum envelope strength. fmax indicates the current maximum envelope strength. δ i f indicates the value of the current strength damage.
As for the superimposed slab shear wall, the relevant parameters of degradation in OpenSees are defined as set gammaK [list −0.2 −0.2 0.3 0.2 0.9], set gammaD [list 0.5 0.5 2.0 2.0 0.5], set gammaF [list 0.0 0.0 0.0 0.0 0.0], and set gammaE 10.

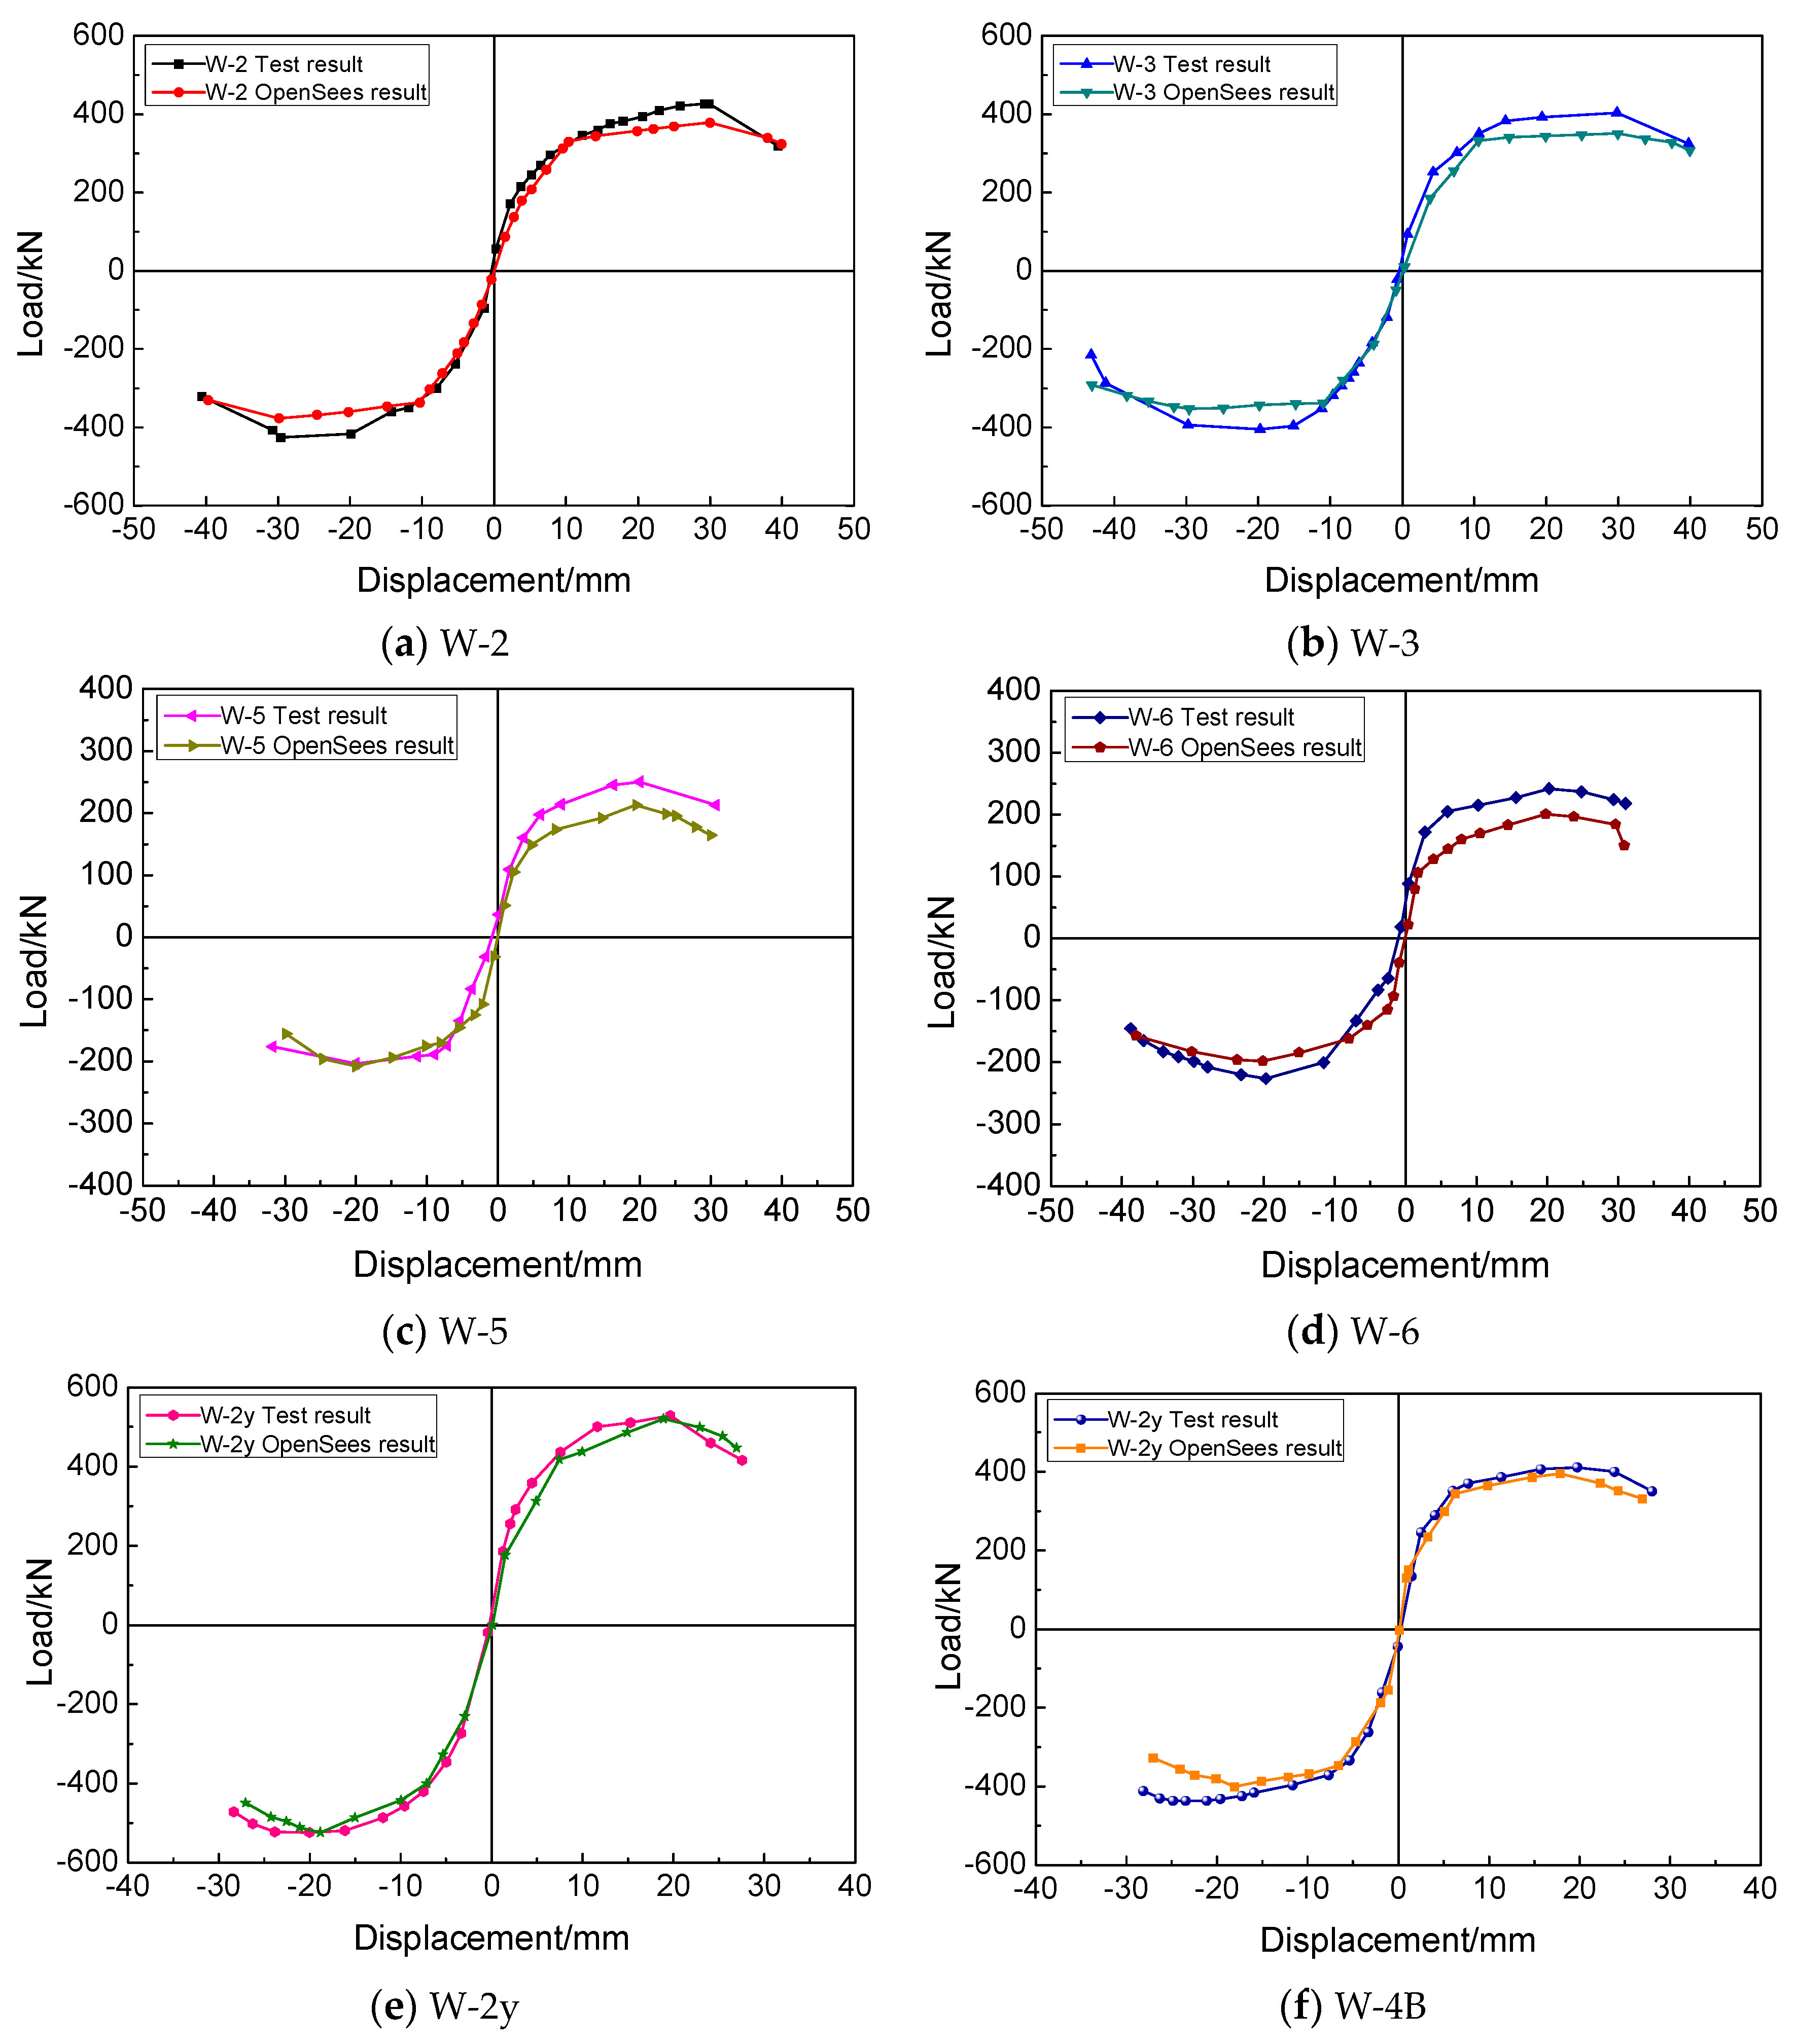
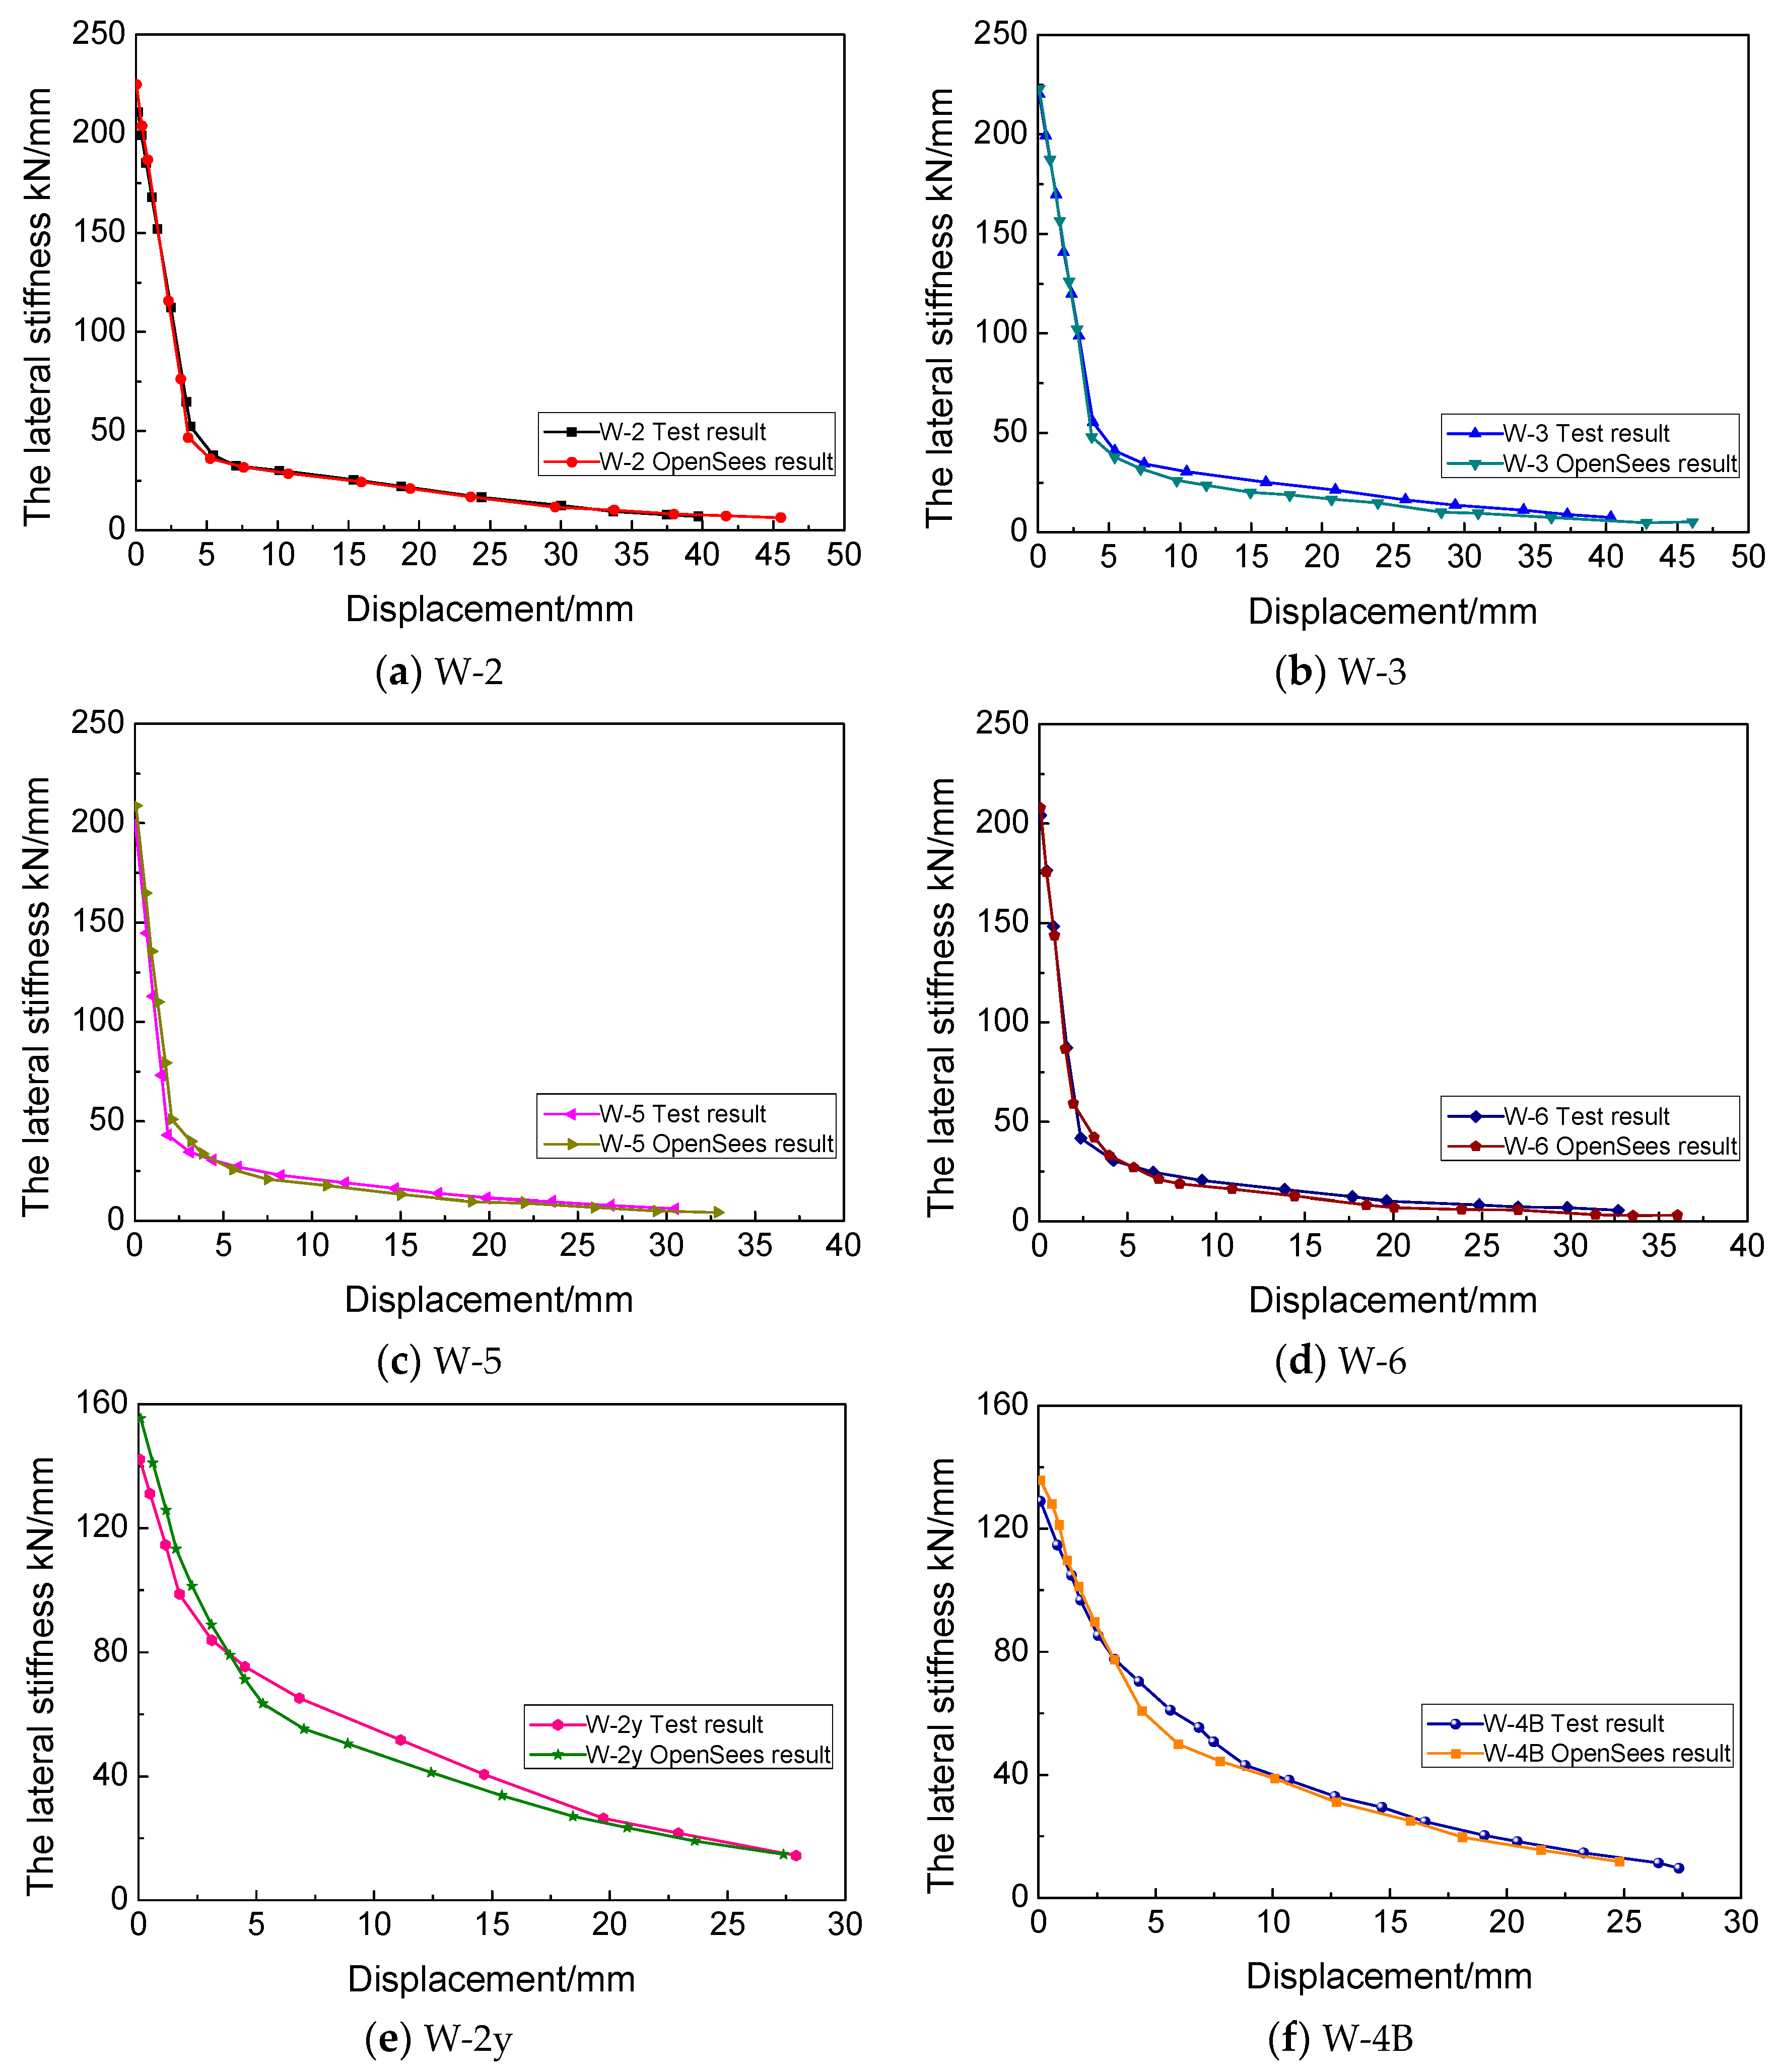
4. Verification of Hysteretic Model

In order to improve the calculation efficiency, the shear wall is simulated by combining two NodeLink element models and the Pinching4 material model. The parameters described in the Pinching4 model can be calibrated by a series of data from theoretical analysis, and the parameter fitting method of Pinching4 is consistent with [28]. The pseudo-static analysis of the model is carried out, and the displacement loading mode is consistent with the comparison test [16,17].
In virtue of restoring the force model proposed in this paper, six shear wall specimens are calculated under low-cyclic reversal loading. A comparison of the calculated results and test results with respect to the hysteretic curve, backbone curve, and secant stiffness degradation curve is illustrated in Figure 8, Figure 9 and Figure 10, respectively.
From these figures, the calculated results are basically consistent with the test results, indicating a suitable reflection of hysteretic property under low-cyclic reversal loading. The calculated parameters, such as peak point, ultimate displacement, loading stiffness, unloading stiffness, and pinch effect, show significant consistency with the test results. Such phenomenon verifies the feasibility of the theoretical calculating method proposed in this paper, and the pinch effect of the superimposed slab shear wall has also been proved to be suitable for modeling by using the Pinching4 model in OpenSees.

5. Conclusions

This paper makes a theoretical inference regarding the mechanical properties of superimposed slab shear wall under low-cyclic reversal loading. Moreover, it elaborates the extent of participation of a prefabricated layer to the load resisting of the superimposed slab shear wall. On this foundation, the restoring force model of the superimposed slab shear wall is established in this paper. Several conclusions are summarized below:
(1)
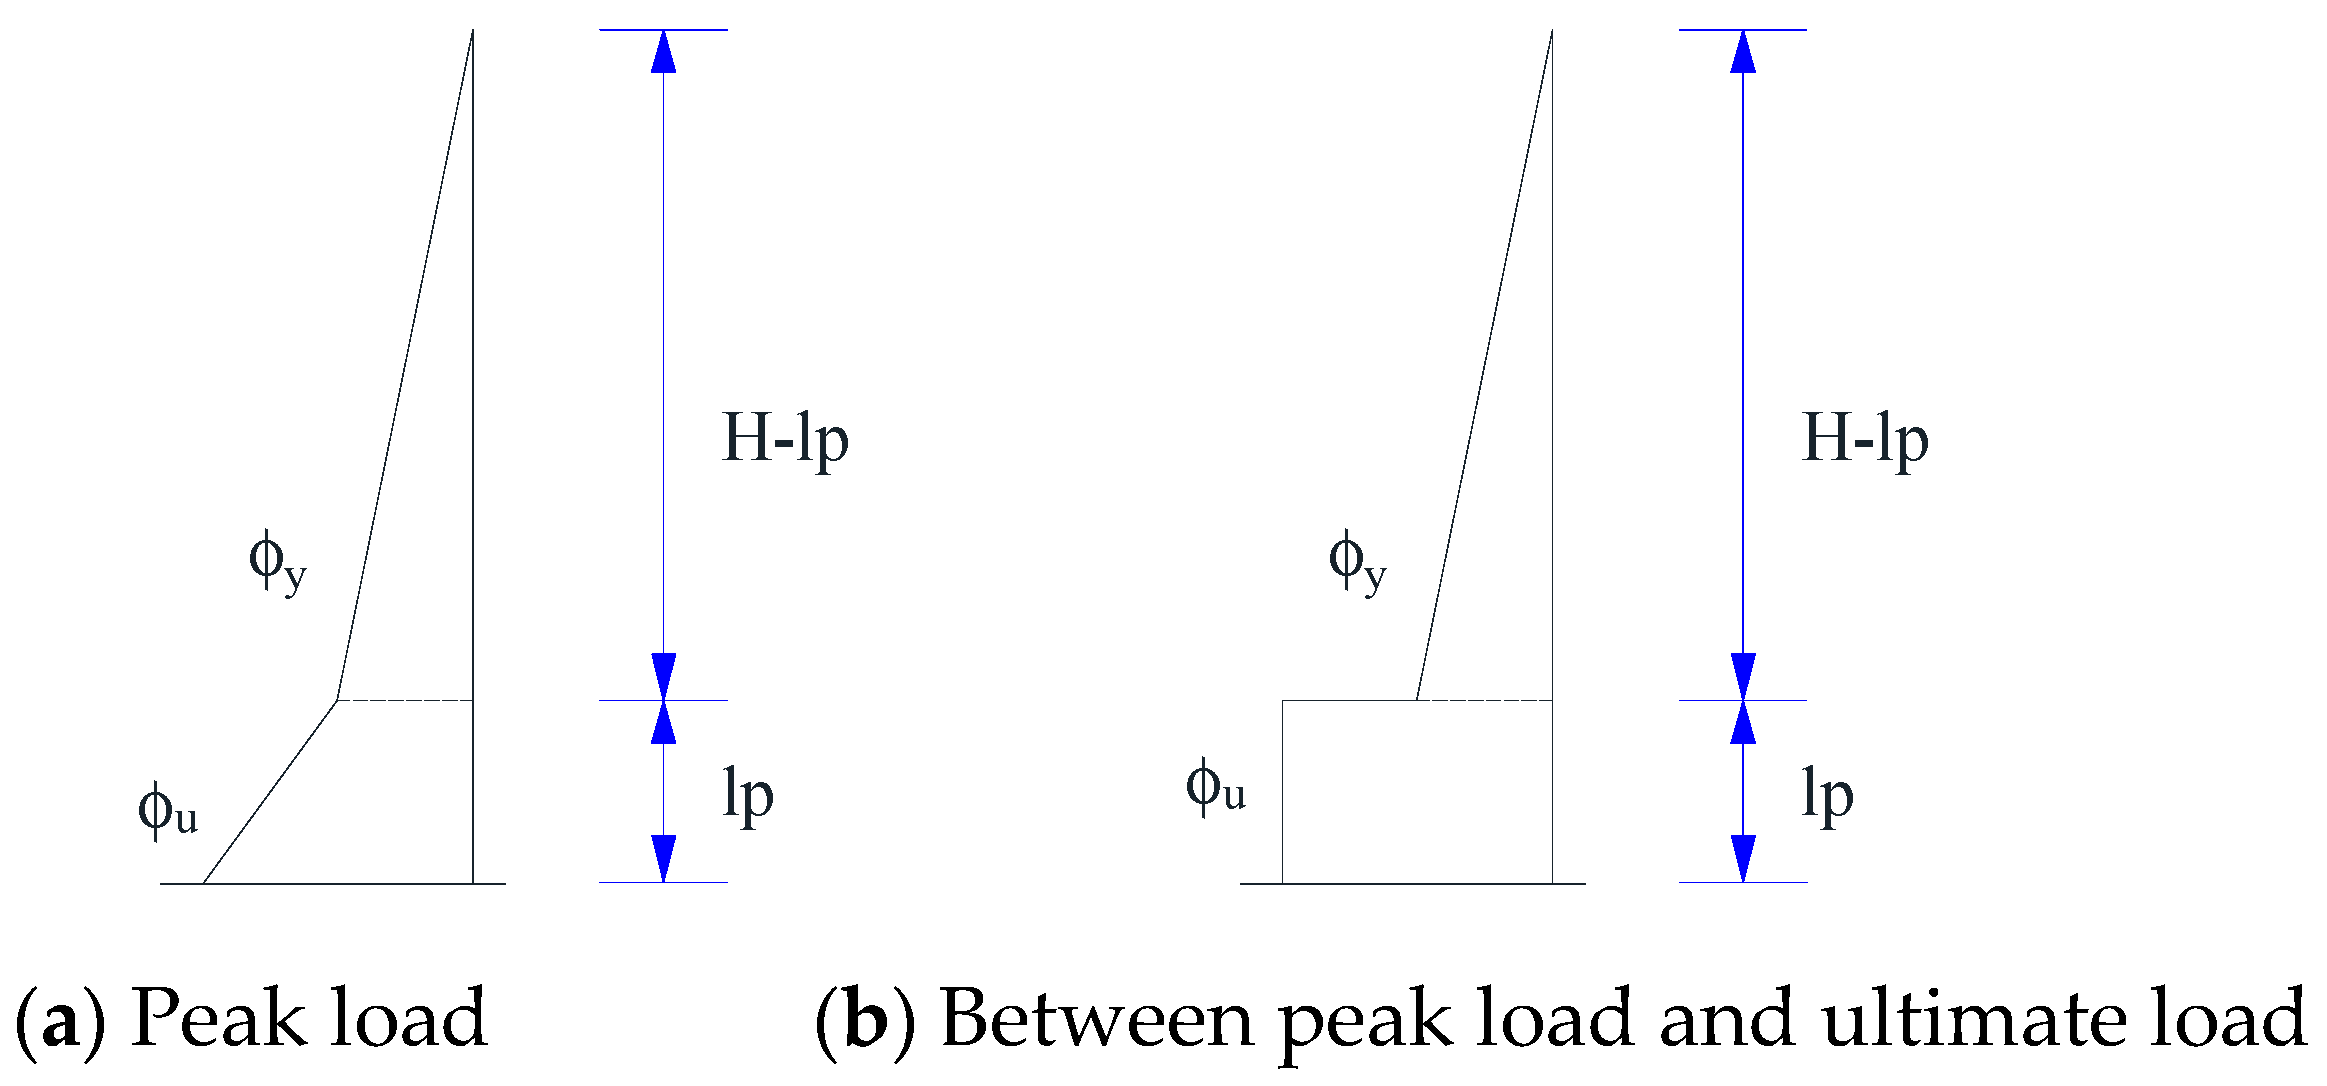
The connection influence of the rebar joint is considered in calculating the displacement before yield. The bottom stiffness reduction factor is inferred from the test results. The bend–shear ratio is considered in calculating the length of the plastic hinge under the peak load and ultimate load. The consistency between the test results and the calculation results verifies the effectiveness of the several displacement calculation methods proposed in this paper.
(2)
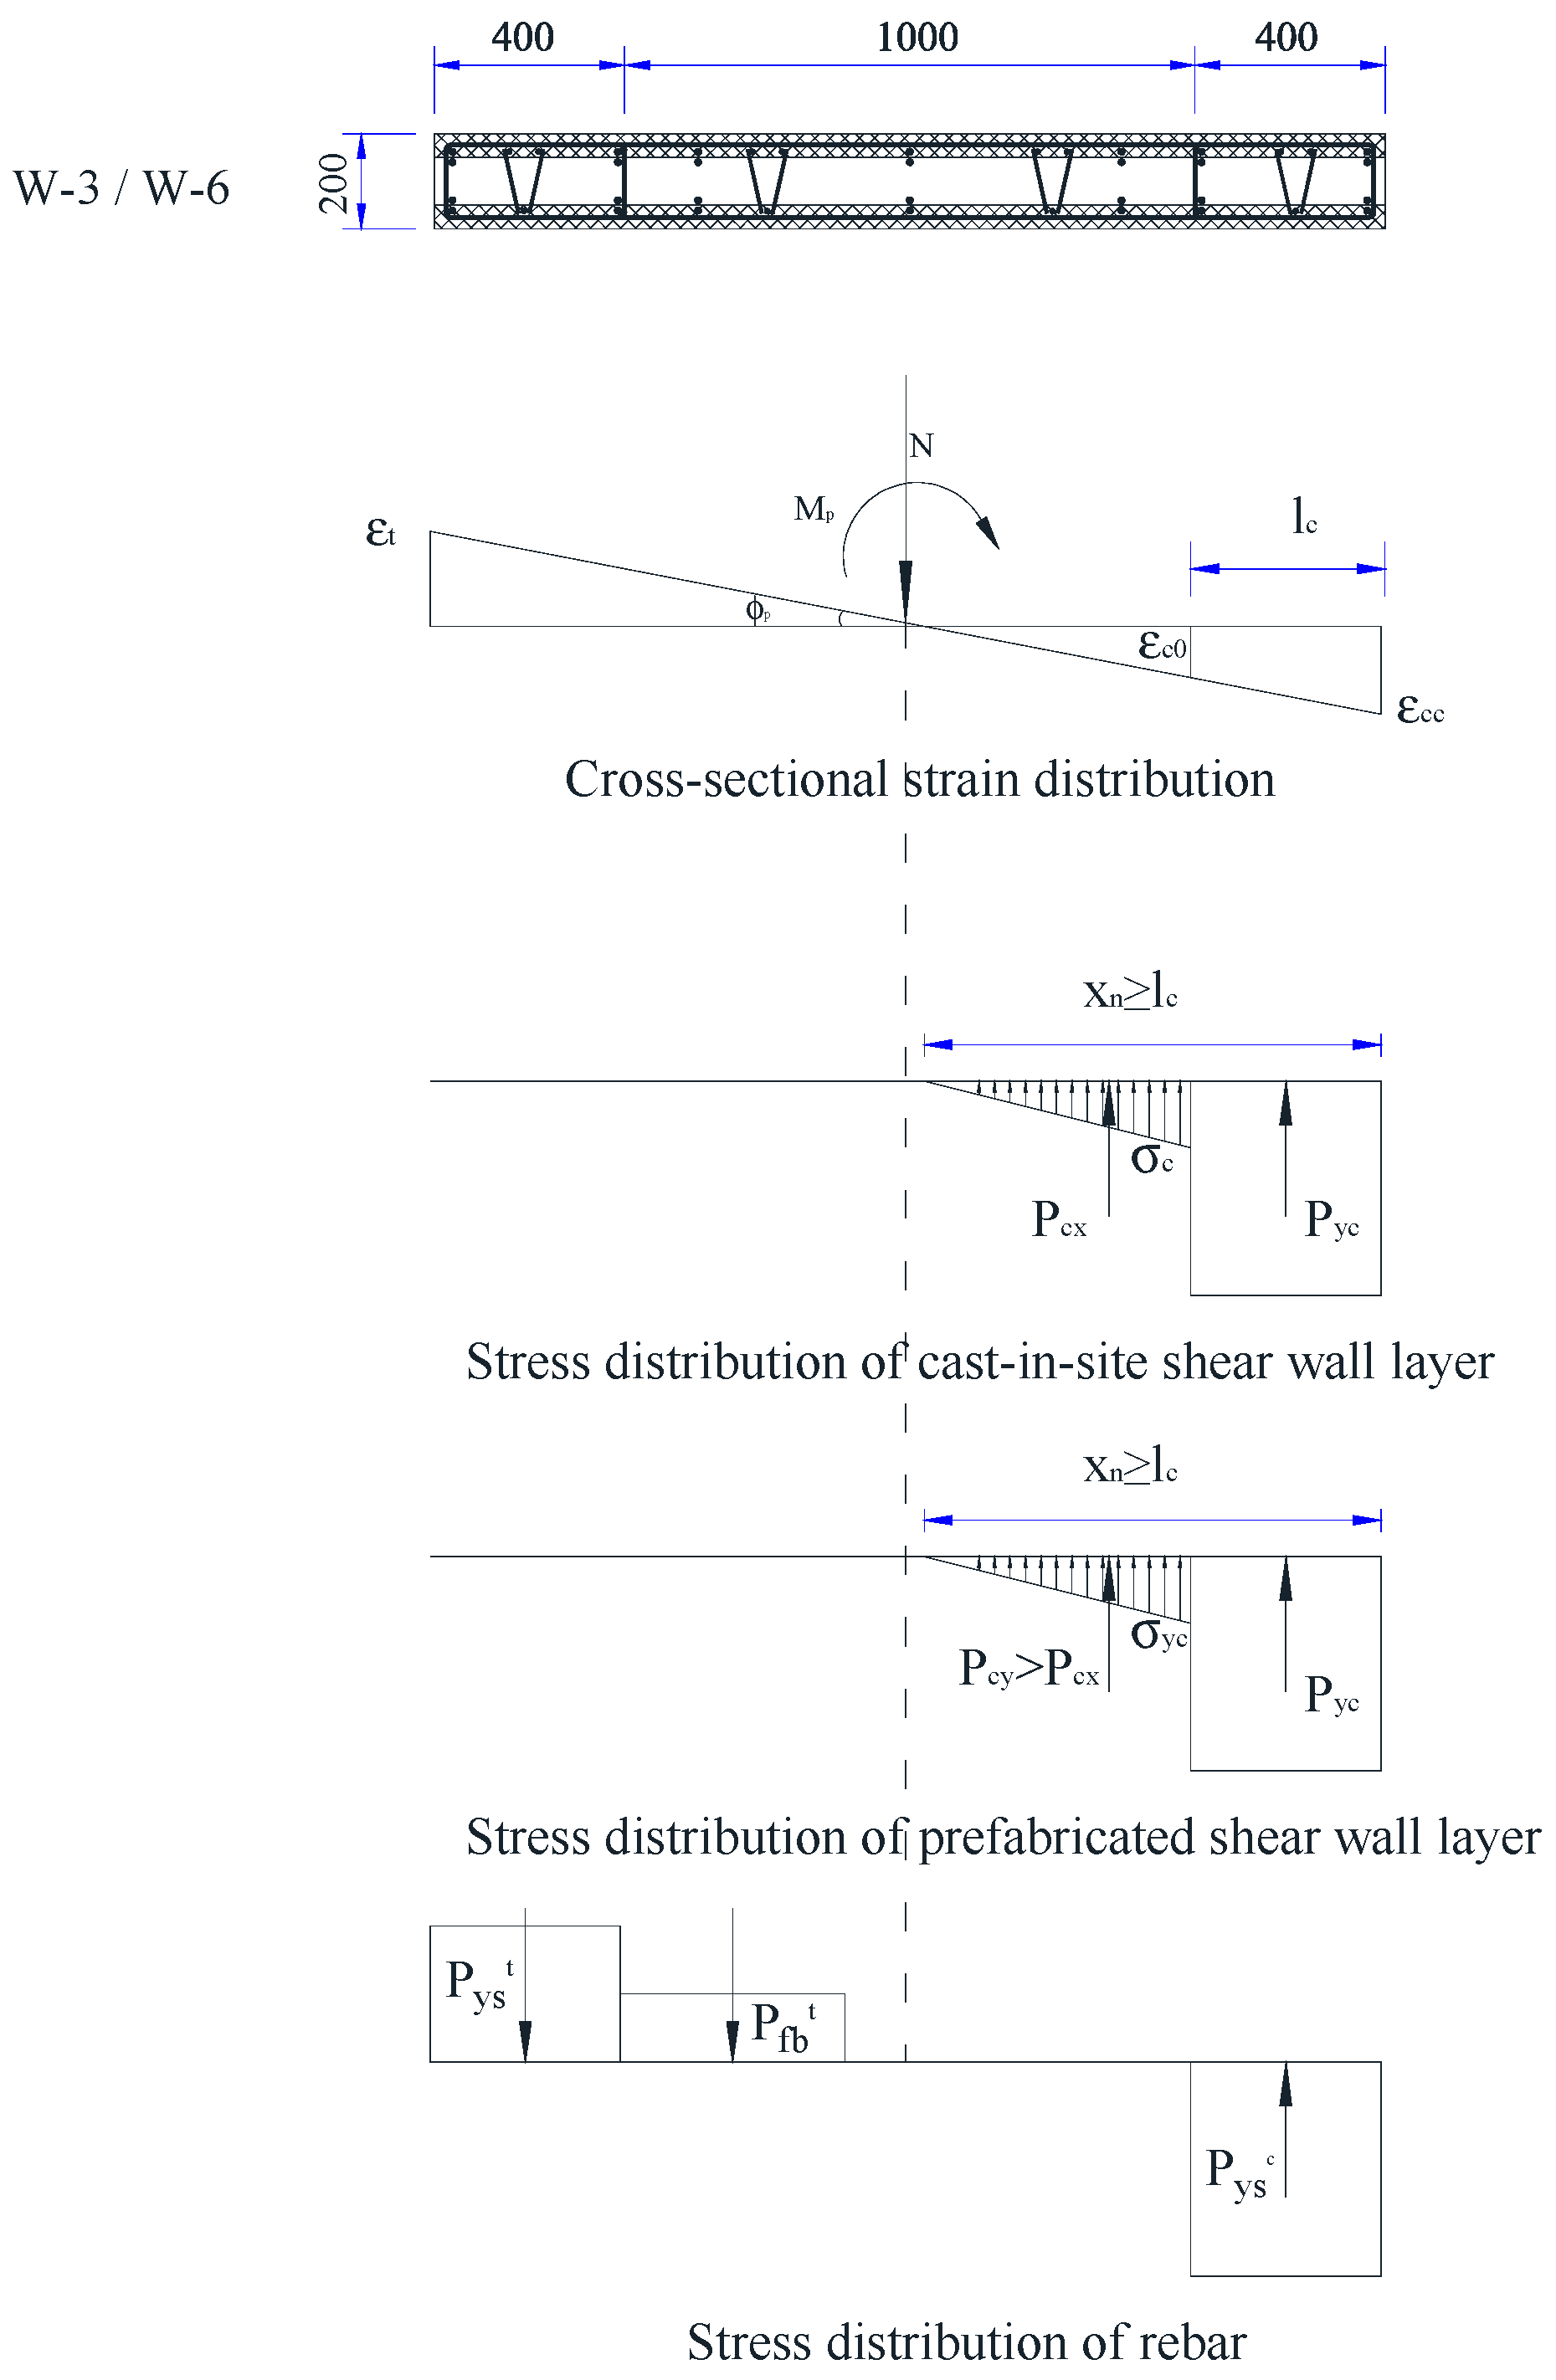
Two conditions are considered while calculating the peak load of six superimposed slab shear walls: no connective effect and perfectly connective effect between combined interfaces. Calculating the results of the perfect connection condition model provides a better consistency with the test results, and it is therefore feasible to ignore the bond–slip effect between the superimposed surfaces. Moreover, the no-slip property between the combined interfaces also offers a good integral performance for the superimposed slab shear wall.
(3)
On the assumption of a plane cross section, differences of concrete strength grades between the prefabricated layer and the cast-in-site layer result in different stresses. Although they share an identical strain. The calculated results counting for the enhancement of a higher concrete strength grade of the prefabricated layer are closer to the test results. Additionally, a higher concrete strength will also prevent crack extension. Regarding different provisions concerning the concrete strength grade of the prefabricated wall and cast-in-site wall from different local codes, the application of a higher concrete grade of the prefabricated wall is recommended in design.
(4)
Based on the mechanism of the superimposed slab shear wall, a quadrilinear restoring force model is established with the help of the Pinching4 model from OpenSees. The parameters of the backbone curve are determined by theoretical inference. The hysteretic curve of the superimposed slab shear wall is simulated under the consideration of the strength deterioration and pinch effect during the loading process, which significantly meets with the test results. The established force restoring model can be representative of the performance of the superimposed slab shear wall under low-cyclic reversal loading.

Author Contributions

Conceptualization, D.Z. and Y.Z.; data curation, J.B.; formal analysis, Y.Z. and J.B.; funding acquisition, Y.Z.; investigation, S.Y.; methodology, D.Z.; project administration, S.Y.; resources, D.Z.; software, B.H.; supervision, Y.Z.; validation, B.H.; visualization, B.H.; writing—original draft preparation, D.Z.; writing—review and editing, B.H. and J.B. All authors have read and agreed to the published version of the manuscript.

Funding

This research was funded by the Shanghai Rising-Star Program, grant number 21QB1406400.

Data Availability Statement

Data will be made available on request.

Acknowledgments

This research was sponsored by the Shanghai Rising-Star Program, grant number 21QB1406400. Any opinions, findings, conclusions, or recommendations expressed in this article are those of the authors and do not necessarily reflect the views of the sponsors.

Conflicts of Interest

The authors declare no conflict of interest.

References

  1. Ma, W.; Xu, K.; Cheng, B.; Zhang, Y.; Chen, R.; Chen, D. Experimental study on the seismic behavior of a new single-faced superposed shear wall with the concealed column. Structures 2021, 33, 4446–4460. [Google Scholar] [CrossRef]
  2. Meng, L.; Zhu, L.; Sun, R.; Su, H.; Ye, Y.; Xu, L. Experimental investigation on seismic performance of the double-superimposed shear wall with different vertical connections. Struct. Concr. 2022, 23, 1439–1452. [Google Scholar] [CrossRef]
  3. Benayoune, A.; Abdul Samad, A.A.; Trikha, D.N.; Abang Ali, A.A.; Ellinna, S.H.M. Flexural behaviour of pre-cast concrete sandwich composite panel–experimental and theoretical investigations. Constr. Build. Mater. 2008, 22, 580–592. [Google Scholar] [CrossRef]
  4. Choi, K.B.; Choi, W.C.; Feo, L.; Jang, S.J.; Yun, H.D. In-plane shear behavior of insulated precast concrete sandwich panels reinforced with corrugated GFRP shear connectors. Compos. Part B Eng. 2015, 79, 419–429. [Google Scholar] [CrossRef]
  5. Mahendran, M.; Subaaharan, S. Shear strength of sandwich panel systems. Aust. J. Struct. Eng. 2002, 3, 115–126. [Google Scholar] [CrossRef]
  6. Md Fudzee, M.F.; Hamid, N.H. Seismic Performance of Insulated Sandwich Wall Panel Subjected to Lateral Cyclic Loading; Trans Tech Publications Ltd.: Stafa-Zurich, Switzerland, 2014. [Google Scholar]
  7. Kang, S.M.; Kim, O.J.; Park, H.G. Cyclic loading test for emulative precast concrete walls with partially reduced rebar section. Eng. Struct. 2013, 56, 1645–1657. [Google Scholar] [CrossRef]
  8. Chong, X.; Xie, L.; Ye, X.; Jiang, Q.; Wang, D. Experimental Study on the Seismic Performance of Superimposed RC Shear Walls with Enhanced Horizontal Joints. J. Earthq. Eng. 2019, 23, 1–17. [Google Scholar] [CrossRef]
  9. Gu, Q.; Dong, G.; Ke, Y.; Tian, S.; Wen, S.; Tan, Y.; Gao, X. Seismic behavior of precast double-face superposed shear walls with horizontal joints and lap spliced vertical reinforcement. Struct. Concr. 2020, 21, 1973–1988. [Google Scholar] [CrossRef]
  10. Jiang, Q.; Shen, J.; Chong, X.; Chen, M.; Wang, H.; Feng, Y.; Huang, J. Experimental and numerical studies on the seismic performance of superimposed reinforced concrete shear walls with insulation. Eng. Struct. 2021, 240, 112372. [Google Scholar] [CrossRef]
  11. Gu, Q.; Zhao, D.; Li, J.; Peng, B.; Deng, Q.; Tian, S. Seismic performance of T-shaped precast concrete superposed shear walls with cast-in-place boundary columns and special boundary elements. J. Build. Eng. 2022, 45, 103503. [Google Scholar] [CrossRef]
  12. Yin, X.; Xiao, Q. Restoring Force Model of Double-Wall Precast Concrete Shear Walls. In Proceedings of the 2018 3rd International Conference on Smart City and Systems Engineering (ICSCSE), IEEE, Xiamen, China, 29–30 December 2018; pp. 332–335. [Google Scholar]
  13. Jia, L.; Li, Q.; Zhang, Y.; Zhao, W.; Du, M. Experimental study of the hysteretic behavior of prefabricated frame-shear wall structures with grouting sleeve connections. J. Build. Eng. 2022, 57, 104704. [Google Scholar] [CrossRef]
  14. Wang, M.; Guo, S. Seismic behavior of superimposed reinforced concrete shear walls with X-shaped steel plate bracings under different axial load ratios. Struct. Des. Tall Spéc. Build. 2021, 30, e1889. [Google Scholar] [CrossRef]
  15. Gu, Q.; Zhao, D.; Tan, Y.; Gao, H.; Deng, Q.; Wang, X. Experimental study on L-shaped precast concrete superposed shear walls under quasi-static cyclic loading with different axial compressive load ratios. Eng. Struct. 2022, 254, 113857. [Google Scholar] [CrossRef]
  16. Lian, X.; Ye, X.; Wang, D.; Jiang, Q.; Chang, L. Experimental Analysis of Seismic Behavior of Superimposed Slab Shear Walls. Hefei Univ. Technol. 2009, 32, 105–109. [Google Scholar]
  17. Ye, Y.; Sun, R.; Xue, Z.; Wang, H. Experimental study on seismic behavior of SCC and precast NC composite shear wall. J. Build. Struct. 2014, 35, 138–144. [Google Scholar]
  18. Kou, J.; Liang, W.; Deng, M. Experimental and theoretical study of restoring force model of fiber reinforced concrete shear walls. China Civ. Eng. J. 2013, 46, 58–70. [Google Scholar]
  19. Zhang, S.; Lv, X.; Zhang, H. Experimental and analytical studies on the ultimate displacement of RC shear walls. China Civ. Eng. J. 2009, 42, 10–16. (In Chinese) [Google Scholar]
  20. Loss, C.; Tannert, T.; Tesfamariam, S. State-of-the-art review of displacement-based seismic design of timber buildings. Constr. Build. Mater. 2018, 191, 481–497. [Google Scholar] [CrossRef]
  21. Wang, B.; Shi, Q.-x.; Cai, W.-z.; Peng, Y.-g.; Li, H. Research on the calculation method for the deformation capacity of RC shear walls with a flange. Eng. Mech. 2020, 37, 167–175. [Google Scholar]
  22. Wang, C.; Teng, Z. Theory of Concrete Structure; China Architecture & Building Press: Beijing, China, 1985. (In Chinese) [Google Scholar]
  23. Zhang, Z.W.; Bai, G.L.; Qin, C.G.; Li, J.R.; Liu, H.Q. Shaking table test of fabricated concrete shear wall structure and study on damage mechanism of strong earthquake. Structures 2022, 43, 645–656. [Google Scholar] [CrossRef]
  24. GB 50010-2010; Code for Design of Concrete Structures. Standards Press of China: Beijing, China, 2010.
  25. Park, R.; Paulay, T. Reinforced Concrete Structures; John Wiley & Sons: New York, NY, USA, 1975. [Google Scholar]
  26. Wang, W.; Wang, J.; Guo, L.; Hu, P. Development of hysteretic model for LEM-filled CFS shear walls under cyclic loading. Eng. Struct. 2023, 280, 115651. [Google Scholar] [CrossRef]
  27. Park, Y.J.; Ang, A.H.S. Mechanistic seismic damage model for reinforced concrete. J. Struct. Eng. 1985, 111, 722–739. [Google Scholar] [CrossRef]
  28. Li, Z.; Chen, F.; He, M.J.; Zhou, R.; Cui, Y.; Sun, Y.; He, G. Lateral performance of self-centering steel-timber hybrid shear walls with slip-friction dampers: Experimental investigation and numerical simulation. J. Struct. Eng. 2021, 147, 04020291. [Google Scholar] [CrossRef]
Figure 1. Detail of superimposed slab shear wall.
Buildings 13 00749 g001
Figure 2. Calculation diagram of displacement.
Buildings 13 00749 g002
Figure 3. The distribution of the curvature of the shear wall under the peak load and ultimate load.
Buildings 13 00749 g003
Figure 4. Strain and stress distribution of the section under the peak load.
Buildings 13 00749 g004
Figure 5. Stress and strain distributions under the cracking load.
Buildings 13 00749 g005
Figure 6. Stress and strain distribution at the yield point.
Buildings 13 00749 g006
Figure 7. Hysteretic principle of the Pinching4 model.
Buildings 13 00749 g007
Figure 8. Comparison of the test results and the calculated results of hysteretic curves.
Buildings 13 00749 g008
Figure 9. Comparison of the test results and the calculated results of the backbone curves.
Buildings 13 00749 g009
Figure 10. Comparison of the test results and the calculated results of the stiffness degradation curves.
Buildings 13 00749 g010
Table 1. Comparison of calculated displacement and test displacement.
NumberCracking DisplacementYield DisplacementPeak DisplacementUltimate Displacement
Calculated
(mm)
Test
(mm)
ErrorCalculated (mm)Test
(mm)
ErrorCalculated (mm)Test
(mm)
ErrorCalculated (mm)Test
(mm)
Error
W-23.733.822.3%10.9610.316.3%29.8929.9351.4%45.5739.8614.3%
W-33.923.8651.4%11.9910.81510.9%31.1229.366%46.4340.4914.7%
W-52.031.84510.1%7.468.5412.7%19.2420.14.3%3330.538%
W-61.832.13514.3%7.648.6912.1%20.1619.81.8%36.1432.6110.8%
W-4B1.251.241.1%6.436.785.1%17.8119.8610.3%24.8427.6110%
W-2y1.621.8311.9%7.546.978.2%18.719.644.8%27.5527.810.9%
Table 2. Comparison of the calculated strength and test strength.
NumberCracking LoadYield LoadPeak LoadUltimate Load
Calculated
(kN)
Test
(kN)
ErrorCalculated
(kN)
Test
(kN)
ErrorCalculated
(kN)
Test
(kN)
ErrorCalculated
(kN)
Test
(kN)
Error
W-2176.120011.9%333.6833204.28%379.34426.511.06%322.43200.8%
W-3185.521011.6%335.3563504.18%351.1340713.73%298.5304.52%
W-5105.91006%166.520016.7%208.73223.56.6%177.4192.57.8%
W-6107.89019.8%158.4820522.7%20123012.6%170.85188.59.4%
W-4B154.514010.4%347.338710.3%39641411.4%33630211.5%
W-2y183.41801.9%415.64548.4%518.45220.7%440.64136.7%
Disclaimer/Publisher’s Note: The statements, opinions and data contained in all publications are solely those of the individual author(s) and contributor(s) and not of MDPI and/or the editor(s). MDPI and/or the editor(s) disclaim responsibility for any injury to people or property resulting from any ideas, methods, instructions or products referred to in the content.

