Abstract
Many factors affect the earthquake vulnerability of reinforced concrete (RC) structures, constituting a large part of the existing building stock. Short column in RC structures is one of the reasons for earthquake damage. Significant damages may occur due to brittle fractures in structural elements when the shear resistances are exceeded under the effect of high shear stress in short columns formed due to architectural and topographic reasons. This study created structural models for three situations: the hill slope effect, band-type window and mezzanine floor, which may cause short column formation. The structural analyses by SAP2000 were compared with the reference building model with no short columns. Structural analyses were performed separately according to strength-based and deformation-based design approaches in the updated Türkiye Building Earthquake Code (TBEC-2018). Short column formation; the effects on soft-storey irregularity, the relative storey drifts, column shear force, plastic rotation in columns, roof displacement, base shear force and column damage levels were investigated. As a result of the analysis, it was determined that the relative drifts from the first floor of the building decreased significantly due to the band-type window and slope effect, which caused the second storey to fall into the soft-storey status. In addition, short-column formation caused a significant increase in both plastic rotation demand and shear force in short columns.
1. Introduction
The first step in protecting a settlement from an earthquake disaster is to form and possess a theoretical prediction of the consequences: structural damage and socio-economic losses that may happen after the earthquake. In fact, it is crucial to assess the effects of any potential earthquake to prepare for management during a catastrophic situation. As well as anticipating and taking appropriate measures to reduce the vulnerability and expected losses on the part of guaranteeing urban resilience [1,2,3].
In order to reduce the impact of an earthquake in settlement areas, existing design codes must be applied strictly. The robustness of earthquake defence mechanisms of buildings is in inverse proportion to the presence of negative parameters in the buildings. The more negative parameters mean a weaker defence mechanism for the building. Therefore, it is essential to avoid negative parameters as much as possible. These parameters that cause building damage and total collapse are usually included in seismic design codes. The factors that would reduce buildings’ performances under the impact of earthquakes are also available in rapid visual safety evaluation and damage classification of present structures. These negative criteria include short columns, the hill-slope effect, the year of construction, a weak/soft storey, a lateral or vertical discontinuity and a visible building’s quality. Filling RC frames with half-height infill walls, creating band windows and using inter-mediate beams on stairwells are the primary causes of short-column formation. If the building is clearly on a hill or a slope with a high slope (more than 30°), it increases the effects of earthquakes to a certain extent. The differences in stiffness and strength between stories and the variation in storey height within a building are considered in the soft storey/weak storey parameter. Vertical irregularity can be considered as the case of a substantial change in the stiffness, mass and dimensions or interruption of vertical structural elements, such as columns or lateral resisting systems. The performance of workmanship and material quality during and after the construction process reveals the quality of the building. These parameters are included in the Turkish Rapid Assessment Method, the Canadian Seismic Screening Method, the Japanese Seismic Index Method and similar rapid assessment methods [4,5,6,7,8,9,10]. This study investigated the short-column effect in detail according to two different design principles in the updated Türkiye Building Earthquake Code.
Short column damage is one of the common types of damage observed after earthquakes [11,12]. In particular, the decrease in the effective height of the column due to many effects, especially architectural reasons, causes the shear force on the column to increase too much, and the column reaches its bending capacity [13]. Suppose no prediction was made for this decrease in the free height of the column during the design phase. In that case, sudden and brittle shear damage occurs, especially in the column with insufficient reserve shear capacity. Particularly in the case of brittle damage to the short columns in the basement and lowest floor, they may cause a total collapse of the structure [14,15]. Therefore, in cases where it is not possible to eliminate the factors causing the short column, the effect of these columns on the structural performance should be evaluated in detail, and precautions should be taken if necessary.
In order to determine the structural performance, member-based damage conditions must be evaluated first. The earthquake performance of a building can be defined as “the building safety condition determined in connection with the level and distribution of the damages that may occur in that building under earthquake effect”. In recent earthquakes, it has been reported that structures with columns that suffered shear force damage could not dissipate enough energy during the earthquake and collapsed altogether [16,17,18]. The number, distribution and location of columns likely to exhibit brittle behaviour in buildings are also very important for global performance.
Experimental and analytical studies in the literature emphasised that short columns are a very important parameter for structural performance. Meral [19] determined the effects of short column behaviour on reinforced concrete structures with non-linear inelastic time history analysis, and the base shear force demands were higher in short column models compared to the reference buildings, while the displacement demands were calculated as low. Şeker and Bedirhanoğlu [20] investigated the behaviour of short columns with insufficient shear strength with representative samples produced in the laboratory. As expected, the samples produced brittle collapse with shear damage, and the experiments explained the behaviour of such short columns under lateral loads. Balık and Bahadır [21] investigated the effects of window spacing on short-column behaviour using different reinforcement methods. They discussed the results of producing seven reinforced concrete frames with two floors, 1/5 scale and single span. Işık et al. [22] examined the formation of short columns in reinforced concrete structures built on sloping soils and revealed that plastic hinges formed earlier in short columns. Haji et al. [23] conducted experimental studies using three different methods for reinforcing the reinforced concrete circular short columns. They observed a good correlation between analytical values and experimental results. Chen et al. [24] investigated the behaviour of reinforced concrete short columns under constant compression loading experimentally and theoretically. Moretti and Tassios [25] presented experimental results on eight full-scale reinforced concrete short columns. The relative performance of the tested samples was evaluated according to various ductility criteria. As a result of these studies, it was observed that the stiffness of the columns increased with decreasing effective length. Therefore, the initial stiffness and load-carrying capacity of the structure increased slightly in the global behaviour of the structure. However, it has been reported that the structure could not achieve the desired ductile behaviour due to shear damage in the columns. In addition, short-column damages come to the fore in studies on damage caused by destructive earthquakes in different parts of the world [26,27,28,29]. Moreover, short-column effects are clearly identified in studies using rapid assessment methods used for reinforced concrete structures [30,31,32].
Within the scope of this study, first of all, short column formation is explained with theoretical details. In other words, the effects of short column formation, which negatively affects the earthquake performance of the building, are examined in detail. Then, in addition to three different structural models that may cause short column formation, including the hill slope effect, the band-type window, and the mezzanine floor, a total of four different models were created, including a structural model without any short columns, in order to make comparisons. Structural analyses were performed using SAP2000 software v20. The band-type window is placed on the outer axes in the x calculation direction in the SAP2000 model, the hill slope effect is placed on the two adjacent axes in the x direction, and the mezzanine floor is placed on three storeys. The band-type window, slope effect and mezzanine floor are modelled as bar members in SAP2000 models with short column lengths of 0.7 m, 1.5 and 2 m, respectively, to be closest to the actual formation. In the structural model, only the short-column effect is considered a variable. The results were compared among themselves and those obtained for the reference building model without short columns. In the study, most possible scenarios that may cause the formation of short columns are remarked on. Depending on these scenarios, changes in storey drifts (especially in soft-storey formation) and column shear force distributions in the structural model, changes in plastic rotation demands and capacities in columns, damage distribution and global changes in building performance were examined, different structural parameter results that were not included in previous studies were taken into account. The main novelty of the study is that the short column effect is revealed according to both strength-based and deformation-based design approaches specified in the Turkish Building Earthquake Code (TBEC-2018), which is currently in place in Türkiye.
2. Short Column in RC Structures
The two main components of the works performed to estimate the effect of earthquakes are detecting earthquake hazards and determining buildings’ vulnerability. Determining the vulnerability of building systems is generally possible by examining and classifying the current building stock and other structures and obtaining the damage potential curves. These potential damage curves are used in the preparation of earthquake scenarios [33]. While obtaining these curves, it is necessary to consider the aspects of the building stock that are peculiar to the region.
Knowing buildings’ characteristics that may negatively affect their earthquake behaviour in areas where strong seismic motions can be expected will enable setting forth more serious approaches to mitigate hazard risk levels. Being aware of the negative parameters both in terms of the designs of new buildings to be constructed and of examining the current building stock constitutes a significant part of reducing vulnerability.
Vertical load-bearing elements in framed system structures consist of columns. Columns have two essential roles in such systems. The first is safely transferring all the vertical and lateral loads that act on the structure to the foundation system. The second role is to keep the relative storey drifts caused by lateral loads within the allowed limits [34]. In brief, while designing columns that serve as vertical load-bearing elements in building systems, it has to be taken care that the set forth limits are not exceeded in terms of load and deformation [35].
Columns as vertical load-bearing elements may involve some negative parameters that would weaken the defence mechanism of the building. One of these parameters is short columns that may form in time. Short columns have formed in different ways. Short columns may occur either because the original column length-to-depth ratio is small or due to an obstacle along a certain height of the column (e.g., low brick masonry wall), in which case the effective length of the column is reduced. The sudden and explosive nature of shear failure in a short column was first pointed out by Yamada and Furui in 1968 [36]. Although considerable experimental and theoretical research has been conducted on this subject, especially in the 1970s and ’80s, neither a generally accepted way of predicting the behaviour of short columns exists nor special provisions concerning the design of such elements are included in the majority of codes [37].
The term short column refers to columns shorter than the other columns in the same storey and expected to be subjected to brittle shear fractures [38]. Short column effects appear during earthquakes, particularly on the exterior walls of buildings where the walls do not extend up to the top floor and on the parts of the columns that are not covered by the wall. Typically, in industrial buildings, some gaps are left on the outer walls of the buildings, and some are left on the outer walls to leave space for windows and take light in. If these walls do not extend along the column height, particularly if they are not separated from the frame, the columns may suffer heavy damage during the earthquake. These effects, known as short-column behaviour, can also be seen in Türkiye as they occur worldwide. Many parameters have a role in the formation of a short column. Some of these are wall height, the gaps left on the frame wall and inadequate shear reinforcements. However, one of the primary parameters that cause this behaviour is the vertical gaps left on the frame wall. The shear force generated on the short column is inversely proportional to the short column height [39,40]. Due to the ribbon windows placed on both sides of the columns without any extra measures taken, the calculated height of the column shortens, and the shear force is received at a much higher level than the calculated strength.
Having both long and short columns in the same storey of the building causes these columns to be subjected to different shear forces during the earthquake due to the height difference. Earthquake loads primarily affect long and flexible columns and then affect short columns, where they cause energy accumulation. Due to this accumulation, X-shaped shear cracks occur at both the lower and upper ends of the column. Long and short columns with the same cross-sectional area suffer the same displacement (Δ) under earthquake load (Figure 1). However, short columns are more rigid than long ones, so they are subjected to more earthquake load. This is referred to as the short-column effect and is a point that needs to be considered in the early phases of architectural design [41]. Short column formations in the buildings are given in Figure 2.
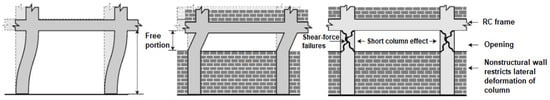
Figure 1.
Behaviour of short and regular columns [42].
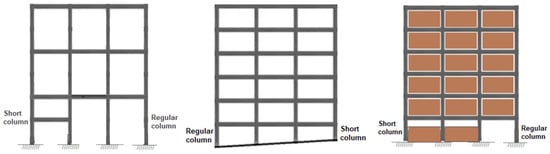
Figure 2.
Short column formations.
One of the most significant causes of damage observed as a consequence of earthquakes is short-column formation. Short columns are subjected to high shear stress, and when the shear resistance is exceeded, brittle collapses take place on these elements. The early strength loss that takes place in these elements also limits the displacement capacity of the building. In turn, brittle collapses become inevitable in buildings with short columns that cannot meet the displacements forced by the earthquake. In addition, since the lateral load capacities of these elements are limited by shear capacities, their bending capacities also cannot be utilized fully [43,44]. Different levels of damage occur due to short columns in earthquakes occurring in different countries of the world [45,46,47]. Figure 3 presents some short-column damages observed in earthquakes.
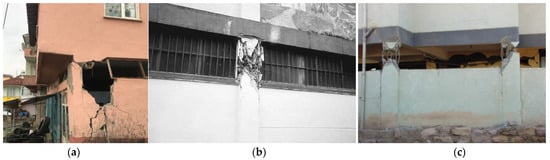
Figure 3.
Short column damages: (a)-24 January 2020 Elazığ earthquake [48], (b)-25 January 1999 Armenia Colombia earthquake [49], (c)-26 January 2001 (Bhuj) India earthquake [50].
3. Performance-Based Assessment and Design Principles
Following numerous destructive earthquakes worldwide, the significance of research, studies and earthquake prevention has recently increased. Due to the vulnerability of both rural and urban building stock, earthquake damages grow. The magnitude of the earthquakes and the poor structural characteristics increase the size of the damage. Knowing the characteristics of buildings that will be adversely affected by their behaviour under earthquakes will reduce damage risk after earthquakes. Determining how well structures perform is the first step in minimizing earthquake damage. After earthquakes in Türkiye, particularly in the past 30 years, protecting existing buildings has become increasingly important. For RC structures already in existence, performance-based assessment procedures are frequently applied. A building’s susceptibility to earthquake damage is known as its seismic vulnerability. Seismic vulnerability relationships make an effort to forecast, for a variety of building classes, the severity and scope of damage at specific seismic demand levels [51].
Using the performance-based design and evaluation technique, it is feasible to calculate the quantities of damage levels caused by design ground motion inside the structural system elements. It is examined whether this damage remains below the permitted damage thresholds for each pertinent element. Reasonable damage limits are established in a way that is consistent with the anticipated performance goals at different earthquake levels [52,53]. The evaluation process aims to calculate the required earthquake force at which the building would meet its performance goals. The highest reaction that a building gives against seismic action during an earthquake is displayed on the demand spectrum used to assess the system performance of the building [54].
Two essential performance-based design and assessment parameters are earthquake demand and capacity [55,56]. Static pushover and capacity curve serve as representations of structural capacity. This capacity curve is created by plotting the relationship between the base shear force and the displacement of the building’s roof. The building system is calculated with gravity loads and lateral forces that increase proportionately up to the target point where structural capacity ends. The non-linear static method’s actual goal is to calculate a building’s target displacement, which is then used to do a final pushover analysis by increasing lateral loads until the target displacement is reached. In conclusion, demand values such as strains, displacements, internal forces and rotations are calculated, and the behaviour of the analysed section is measured for different cross-section performance levels by comparing the strains obtained from the total curvature of the section with the determined upper bound strains [57,58,59].
In this paper, structural analysis was performed by using static pushover analysis while determining the earthquake performance of the reference RC structure model. Pushover analysis is a typical method for determining seismic demand in building designs and evaluations [60]. The pushover curve is calculated using the static multiplier that was produced by applying the theorem of virtual works while considering the mechanism under study’s various kinematic configurations at large displacements [61]. Pushover analysis is one of the most frequently used methods to estimate the non-linear behaviour of buildings [62]. In addition to the target displacement, stress-strain relationships for the material are also important factors in the structural analysis [63].
The building performance of the building model with a short column was determined separately according to two different methods using static pushover analysis. Design and evaluation methods were used according to the strength and deformation in the earthquake code currently used in Türkiye [64].
The strength-based design approach is one of the two main approaches for designing structural systems under the influence of earthquakes: (a) Reduced seismic loads corresponding to the ductility capacity of the structural system defined for a certain predicted performance target are determined. (b) Linear earthquake calculation of the bearing system is made under reduced seismic loads. The strength demands are obtained by combining the reduced internal forces of the element found from this calculation with the internal forces of other loads, taking the excess strength into account when necessary. (c) Member strength demands are compared with the internal force capacities (strength capacities) defined for the anticipated performance target. (d) The relative storey drifts obtained from the earthquake calculation are compared with the allowable limits. (e) The design is completed by showing that the strengths are below the strength capacities and, simultaneously, the relative storey drifts are below the permissible limits. Otherwise, the frame sections are changed, and the calculation is repeated.
The deformation-based design approach is the other main approach for structural building systems under the influence of earthquakes: (a) Internal force-deformation relations compatible with non-linear modelling approaches of existing or previously pre-designed structural systems are determined. (b) Under the earthquake ground motions selected per the predicted performance targets, the structural system’s static or time history analysis is calculated with dynamic incremental methods, and deformation demands of non-linear ductile behaviour and strength demands of brittle behaviour are attained. (c) Obtained deformation and internal force demands are compared with defined deformation and strength capacities by the anticipated performance targets. (d) For existing buildings, the assessment according to deformation is completed by showing that the deformation and strength demands are below or exceed the corresponding deformation and strength capacities. (e) If the deformation and strength demand for new or existing buildings to be strengthened are below the corresponding deformation and strength capacities, the design is completed according to the deformation-based design approach. Otherwise, the frame sections are changed, the calculation is repeated and re-evaluated and the design is finalised according to the deformation.
As in countries with high earthquake risk, earthquake-resistant building design rules have been developed and updated in Türkiye over time. With the current code, design and evaluation principles have been adopted according to both strength and deformation.
This study compared the strength-based design approach, the changes in relative storey-drift, soft-storey formation and column shear force. Additionally, with the deformation-based design approach, roof displacement, capacity curves, and damage to the structural elements and plastic rotations were compared. Therefore, this study allowed a very detailed comparison of the short-column effects.
4. Structural Models and Analysis Results
4.1. Description of the Numerical Model
The chosen RC frame building comprises seven storeys, each of which is 3 m high. The blueprint of the sample RC building is shown in Figure 4. The sample RC building has been designed in accordance with TEBC-2018 principles.
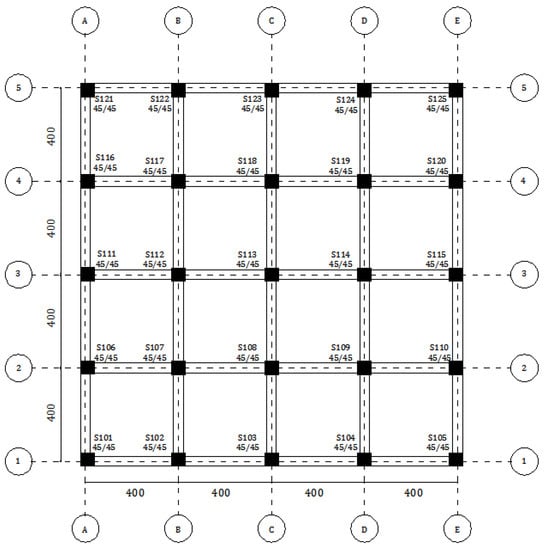
Figure 4.
The blueprint of the sample RC building (all dimensions are in cm).
The structural features considered for the RC building selected as an example are shown in Table 1.

Table 1.
Sample RC model features.
In this study, since two different design approaches in the current seismic design in Türkiye are taken into account, the design spectrum used in this country has been taken into account. For this purpose, the design spectrum obtained for any geographical location in Burdur province was used. Along with the earthquake hazard map currently used in Türkiye, map spectral acceleration coefficients (SS, S1) have been used for the first time. By multiplying these coefficients with the local soil effect coefficients (Fs, F1), the design spectral acceleration coefficients are obtained separately for a short period (0.2 s) (SDS) and a long period (1.0 s) (SD1). These values are directly obtained with the help of the Türkiye Earthquake Hazard Maps Interactive Web Application [65], which has been implemented with the current earthquake code. This study used this application was used for the location where the building will be built. The design spectrum used in structural analysis is shown in Figure 5.
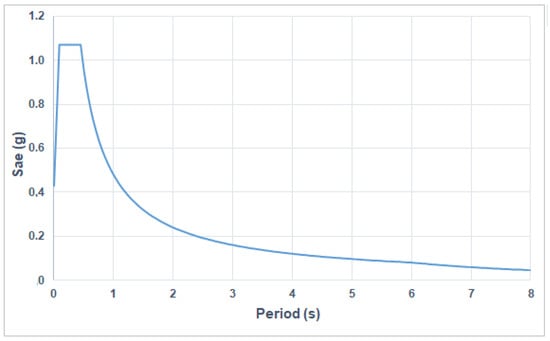
Figure 5.
Design spectrum for structural analyses.
The cross-section and dimensions of the beams and columns used in the reinforced concrete structure chosen as an example are shown in Figure 6. All columns and beams have the same size and reinforcement in the sample RC building model. In the calculations, the effect of slabs on the stiffness of the beams is neglected, and slabs are considered only as loads. As can be seen in Figure 6, a reinforcement selection was made in the columns according to the minimum longitudinal reinforcement ratio (0.01) allowed for the columns of TBEC-2018. In addition, by using crossties with stirrups, the maximum spacing requirement between stirrup arms has been reduced below 25 × Øtransverse. In beam supports, the tension reinforcement is above the minimum reinforcement ratio (0.8 fctd/fyd) and below the maximum reinforcement ratio (ρb, ρmax etc.) given in TS-500-2000 and TBEC-2018. In addition, the compressive reinforcement/tensile reinforcement ratio of the beams in the supports was kept above 0.5and the ductility condition of the beam support section specified for SDS > 0.75 in TBDY-2018 was also met.
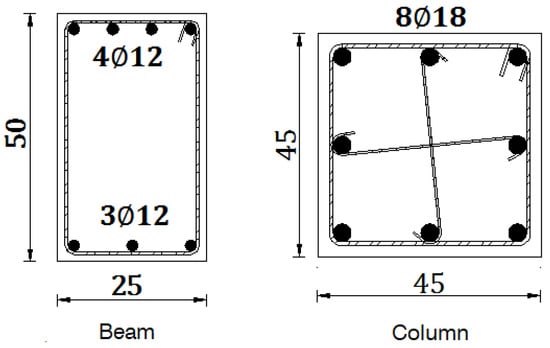
Figure 6.
Cross-sections of columns and beam support.
The reference building model and short column formation models considered in the study are shown in Figure 7. Red-coloured columns are modelled as short columns. Only the appearance of the first 2 storeys is shown for a better understanding of the structural models.
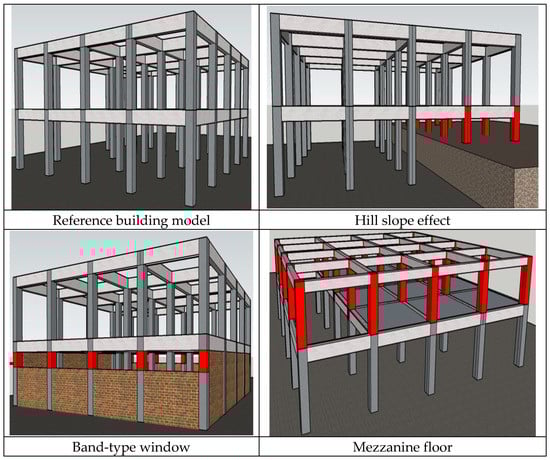
Figure 7.
Four different structural models considered in the study.
Considering the common situations that cause short column formation, a total of four different structural models, including the reference model where no short column formation is expected and three different models where potential short column effects may occur due to the hill slope effect, band-type window and mezzanine floor, were created using SAP2000 software [66]. In the structural models, the blueprint of the sample RC building has not been changed; the short column lengths and their axes are given in Table 2. All other columns not included in this table are considered non-short columns. While creating the structural models, separate short columns were created for the three cases that caused the formation of short columns and were considered in the study. Structural features were kept constant in order to reveal the short-column effect.
Table 2.
Short columns length and their axes.
The fundamental natural periods of all structural models were obtained by eigenvalue analysis. The periods are given in Table 3. Since the short column heights will increase the stiffness values due to the short column formations, the period values have taken lower values in the short column structural models.
Table 3.
The periods of the structural models.
4.2. Investigation of Short Column Effect by the Strength-Based Design Approach
In order to take into account the possible uncertainties in the stiffness and mass distribution of the structural system of the building under the influence of earthquake ground motion, the earthquake calculation was made by considering the additional eccentricity of ±5% for each of the X and Y directions. For each storey, X direction +0.05 additional eccentricity (Ex+), x direction −0.05 additional eccentricity (Ex−), Y direction +0.05 additional eccentricity (Ey+), y direction −0.05 additional eccentricity (Ey−) earthquake calculations were made using four different earthquake directions/eccentricities, and the findings are given below.
4.2.1. Investigation of the Change in Relative Storey Drifts
Considering the highest values obtained from four different earthquake loadings (Ex+, Ex−, Ey+, Ey−) for each storey, the relative drifts in the X direction depending on the storey are shown in Figure 8.
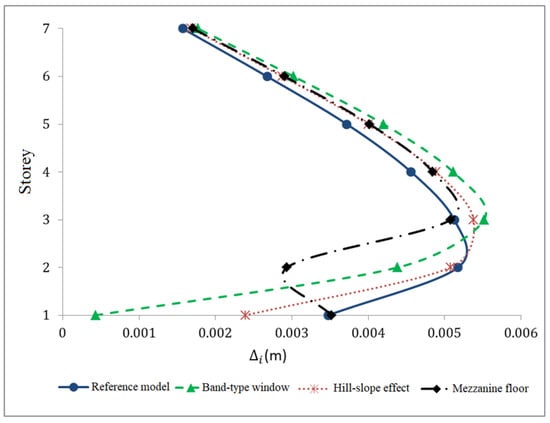
Figure 8.
Comparison of the highest relative storey drifts for each storey.
Short columns formed due to the band-type window formation reduced the relative drifts of the ground storey by 88% compared to the reference model. The short columns formed due to the hill-slope effect reduced the relative drifts of the first storey by 31% compared to the reference model. The short columns formed due to the formation of the mezzanine floor reduced the relative drifts of the second storey by 43% compared to the reference model. Considering the maximum relative drifts of all floors, the highest relative drifts occurred in the band-type window, the hill-slope effect, the reference model and the mezzanine floor model building, respectively.
4.2.2. Investigation of Soft-Storey Formation
Whether there is a soft storey irregularity in a building under investigation is determined by looking at the stiffness irregularity coefficient (). The coefficient of stiffness irregularity () is obtained by dividing the average storey drift ratio at any i-th storey by the average relative storey drift ratio at an upper or a lower storey for either of two perpendicular earthquake directions. The calculation of the stiffness irregularity coefficient () for the calculation direction X is shown in Equation (1).
in Equation (2) is the stiffness irregularity coefficient obtained by dividing the average relative storey drift ratio of the i-th storey by the average relative storey drift ratio of a lower ((i − 1) storey; (upper)) expresses the stiffness irregularity coefficient obtained by dividing the average relative storey drift ratio of the i-th storey by the average relative storey drift ratio of the upper ((i + 1) storey).
Stiffness irregularity coefficients were obtained for each storey’s four different earthquake types (Ex+, Ex−, Ey+, Ey−). The highest soft-storey irregularity coefficients obtained from four different earthquake types were determined as the soft-storey irregularity coefficient of the relevant storey, shown in Figure 9. According to the TBEC-2018, Inter-storey Stiffness Irregularity (Soft Storey) coefficients (nki) were obtained for each of the two orthogonal earthquake directions and four different earthquake types (Ex+, Ex−, Ey+, Ey−) of each storey by considering the effects of ±5% additional eccentricities.
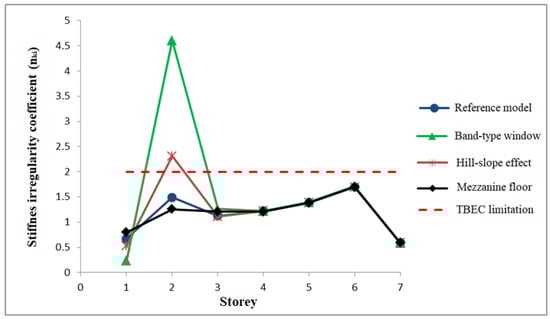
Figure 9.
Stiffness irregularity coefficients (nki) of RC building models.
According to TBEC-2018, if the stiffness irregularity coefficient (nki) is more than 2 on any storey, it is stated that there is a soft storey irregularity in the building. Since the stiffness irregularity coefficients in the second storey of the band-type window and the hill-slope effect models were obtained as 4.6 and 2.3, respectively, soft storey irregularity occurred on these storeys. Therefore, due to the band-type window and the hill-slope effect, the storey where the formation of short columns occurs is considerably more rigid than the upper storey. This causes stiffness irregularity between adjacent storeys. Since the height of the second storey of the structural model, including the mezzanine storey, is lower than that of the reference model, it was a more rigid storey than the second storey of the reference model, which caused the relative drifts of the mezzanine storey to be lower than that of the reference model. Therefore, the mezzanine storey model’s soft-storey irregularity coefficient is less than the reference model’s second storey. Since the stiffness irregularity coefficient was less than 2 in the reference and mezzanine models, soft storey irregularity was not observed in these models.
4.2.3. Investigation of Column Shear Force Variation
In order to examine the effect of short column formation on the column shear force, the shear forces of the columns in the first and second storeys were obtained for four earthquake types (Ex+, Ex−, Ey+, Ey−), and these values are shown in Figure 10. When the shear force of the columns on the first storey is examined, the models with the highest increase in shear force compared to the reference model are the band-type window and the hill-slope effect models, respectively. Shear forces in the first storey columns of the mezzanine floor and reference models were close. When the column shear forces on the second storey are examined, the model with the highest shear force increase is the mezzanine floor model. The shear forces on the second-storey columns of the band-type window and the hill-slope effect models were close to the reference model.

Figure 10.
Column shear forces.
While there was an average increase of 261% in the short columns in the band-type window model compared to the same columns in the reference model, there was a decrease of 49% in the regular columns (non-short) in the same storey compared to the same columns in the reference model. On the other hand, while there was an average of 122% increase in the short columns in the hill-slope effect building model compared to the reference model, there was a 71% decrease in the regular columns on the same storey compared to the reference model. In other words, short columns had to carry the shear- force of non-short columns on the same storey due to the formation of short columns. In the mezzanine floor model, some columns increased by 30% compared to the same columns in the reference model, while a decrease of around 92% occurred in columns S210, S220 and S225.
4.3. Investigation of the Short Column Effect by the Deformation-Based Design Approach
In order to examine the effect of short column formation on section damages, a non-linear behaviour model of each of the reference models, the hill-slope effect, the band-type window and the mezzanine floor models were created. Plastic rotation limits were obtained for the Damage Limitation (DL), the Controlled Damage (CD) and Prevention of Collapse (PC) performance levels conditions given for the lumped plastic hinge model of columns and beams modelled as bar elements in TBEC-2018. After the plastic hinge sections of each structural element were determined, these hinges were assigned to both ends of the column and beam elements. M3 plastic hinge is used for beams, and P-M2-M3 plastic hinge is used for column sections. Moment-curvature analyses obtained plastic hinge properties of the sections. In these analyses, the unwrapped Mander stress-strain diagram was used for the shell concrete and the wrapped concrete for the core concrete. In the moment-curvature analyses, the yield unit strain of reinforcement steel is 0.0021, the tensile strain of reinforcement steel is 0.1, the yield strength of reinforcement steel is 420 MPa and the tensile strength is 550 MPa. A P-joint definition for shear power consumption has not been made, as necessary precautions have been taken regarding shearing in the elements. Second-order effects are neglected in the structural analyses. Horizontal loads were applied to the story mass centers of the model buildings according to the values obtained by multiplying the mode shape amplitude of the X-direction of the floors, and the masses and static pushover analyses were performed. The capacity curves obtained for the X direction are given in Figure 11.
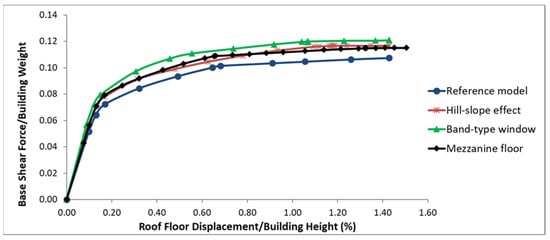
Figure 11.
Comparison of capacity curves.
It is seen that the buildings with the highest ratio of base shear force to building weight are the band-type window, the hill-slope effect, the mezzanine floor and the reference model, respectively. The ratio of the highest base shear force to the weight of the building was obtained in the band-type window with the most rigid behaviour model. So, it can be said that the building with the most rigid behaviour is the band-type window, and the building with the least rigid behaviour is the reference building. In order to determine the damage to the columns and beams, the building should be subjected to a static pushover analysis until the roof displacement demand. Therefore, obtaining the roof displacement demands for each model building in the X direction is necessary. In order to obtain the roof displacement demands of the models, the modal capacity spectrum and the demand spectrum must intersect. The modal capacity spectrum is obtained by axis conversion of the capacity curve obtained as a result of the pushover analysis. The purpose of the axis conversion process is to bring together the capacity curve and the demand spectrum on the same graph. With the axis conversion process, the y-axis of the capacity curve is converted from shear force (Vt) to spectral acceleration (Sae), and the x-axis is converted from roof-floor displacement (Δ) to spectral displacement (Sde). Obtaining the loft displacement request for the reference modal building is given in Figure 12.
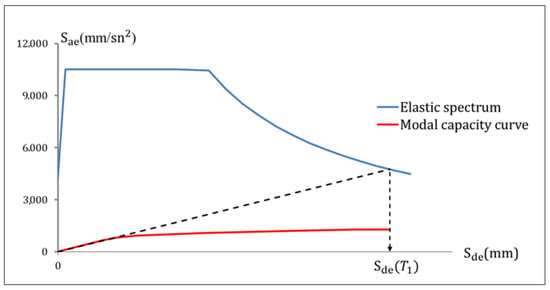
Figure 12.
Obtaining the roof displacement demand for the reference model building.
The slope of the initial tangent shown in black in Figure 12 is calculated by the square of the dominant angular frequency of the reference model building (⍵2). The modal displacement demand is found by intersecting the initial tangent drawn from the modal capacity curve with the demand spectrum (Sde(T1)). The solid roof displacement demand is obtained by multiplying the modal displacement demand with the modal participation factor. The roof displacement demands obtained for all models are given in Figure 13.
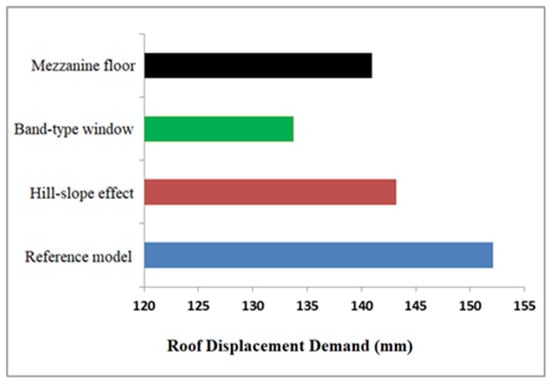
Figure 13.
Comparison of roof displacement demands.
Since the structural models with short columns show a more rigid behaviour, the roof displacement demands are lower than the reference model. The band-type window model with the most rigid behaviour obtained the lowest roof displacement demand. Each of the model buildings was subjected to static pushover analysis until the target displacement demand in order to determine the damage in the structural elements. The blue-colored plastic hinge formed in the structural elements, the plastic rotation occurred in the section as a result of the static push-over analysis remains between the limits given for the Damage Limitation (DL) and the Controlled Damage (CD) in TBEC-2018, so it is in the obvious damage zone. The turquoise-coloured plastic hinge indicates that the plastic rotation in the section is between the Controlled Damage (CD) and Prevention of Collapse (PC) plastic rotation limits, that is, in the advanced damage zone. Section damage limits and specified zones are given in Figure 14. The results for damage situations are shown in Figure 15.
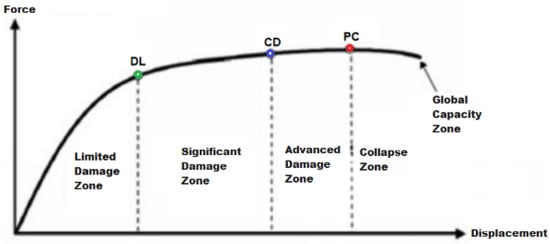
Figure 14.
Section damage limits and damage zones [64].
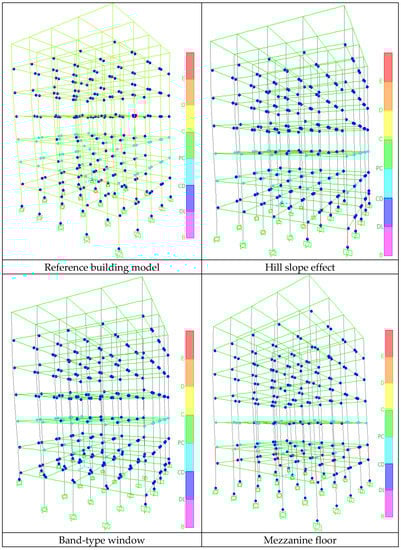
Figure 15.
Damages in the structural elements.
In all models, the columns remained in the zone of either obvious damage or damage limitation zone. The number of columns remaining in the obvious and damage limitation zone for the first and second floors of each structural model is given in Figure 16.
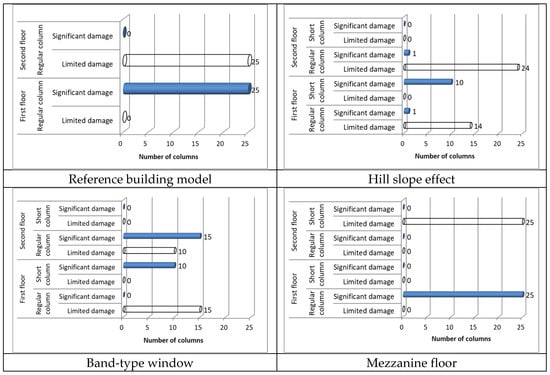
Figure 16.
Column damage zones of the structural models.
The damage zones where the columns are located in the reference and mezzanine models are the same. In other words, the short column formed due to the mezzanine floor did not change the damage zone where the column was located. All the columns, which became short columns due to the band-type window and slope effect, remained in the obvious damage zone as in the reference model. However, in the hill-slope effect and band-type window models, all non-short columns (regular column) are in the damage limitation zone in these models, while they are in the obvious damage zone in the reference model with the effect of the short columns on the same storey. As it can be understood from this, since the roof displacement demands of the short column models are lower than the reference model, these models were subjected to less thrust up to the roof displacement, which contributed positively to the damaged zones of the hill-slope effect, the band-type window and the and non-short columns (regular columns).
As a result of the pushover analysis, the plastic rotations occurring in the short columns increased considerably compared to the reference model. However, since these rotations did not exceed the controlled damage plastic rotation limit in the regulation, the damaged zone in the columns remained the same. Therefore, in order to better understand the short-column effect, it would be more appropriate to compare the plastic rotation of the structural elements instead of the damaged zone where the structural elements are located. The rotations on the first-floor columns are given in Figure 17.
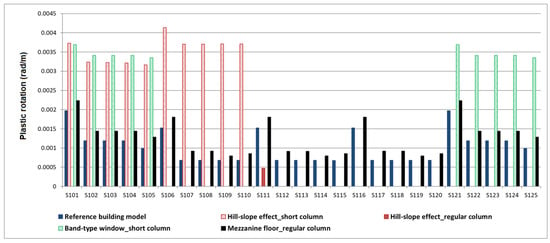
Figure 17.
Comparison of plastic rotations.
Columns with zero plastic rotation are not included in Figure 17. For example, since plastic rotation does not occur in any of the non-short columns in the band-type window model, there is no data on these columns in the figure. The highest plastic rotations were obtained in band-type window models. The plastic rotations occurring in the columns in the hill-slope effect model were close to the band-type window. The rotations occurring in the mezzanine floor model were, on average, 24% higher than in the reference model. Especially in buildings with band-type windows and buildings under the effect of hill slope effect, the increase in plastic rotation demands in columns between S101 and S110 has increased the damage level.
5. Conclusions
- (a)
- Earthquake codes in Türkiye have been updated over time, and the last earthquake code came into force in 2019. In this code, designs can be made according to strength and deformation. In this study, short column effects were tried to be revealed for four different structural models using both methods. The structural models were created for three different situations: the hill slope effect, band-type window and mezzanine floor, which may cause short column formation. The results obtained from the structural analyses using SAP2000 were compared with the reference building model with no short columns. The findings obtained from the study are summarised below;
- (b)
- According to the Strength-based Design Approach:
- (1)
- Short columns formed due to the band-type window formation reduced the relative drifts of the ground storey by 88% compared to the reference model. The mentioned ratio decreased to 31% in buildings with a hill-slope effect. However, the mezzanine floor reduced the second-floor relative drifts by 43% compared to the reference model. It is clear that these effects are related to the increase in rigidity with the decrease in column lengths. In addition to these, the maximum relative drifts of all floors and the highest relative drifts occurred in the band-type window. The displacements are inversely proportional to the column’s stiffness (especially the length of the column). However, while the stiffness increases in short columns, the shear forces obtained by dividing the moments occurring at the column ends by the column length increase significantly;
- (2)
- It was determined that the relative drifts from the first floor of the building decreased significantly due to the band-type window and slope effect, which caused the second floor to fall into the soft-storey status. The soft storey phenomenon is related to the average relative storey drifts of the floors. If the stiffness irregularity coefficient, which is found by dividing the average storey drift ratio in the floor in the direction of the earthquake direction, by the average relative storey drift ratio of one upper or lower storey, is greater than 2.0, soft storey irregularity is observed;
- (3)
- According to TBEC-2018, the stiffness irregularity coefficient (nki) can be more than 2, especially in buildings with band-type windows. This indicates that the irregularity referred to as B2 may be critical for these buildings. A similar situation exists in models with a hill-slope effect, albeit limited. In the case of this irregularity, some limitations have been introduced for the application of the Equivalent Seismic Load Method;
- (4)
- When the changes in the shear forces in the columns are examined, it is seen that the highest increase occurs in the first and fifth axes of the Band-Type buildings and in the first and second axes of the buildings having the hill-slope effect. However, these increases were not at a level that could cause shear damage to the columns. Considering the frequency of stirrups and crossties used, concrete compressive strength and column sections, it is seen that the shear demand does not exceed the shear capacity of the columns.
- (c)
- According to the Deformation-based Design Approach;
- (1)
- Changing stiffness has also changed the period of the buildings and the displacement demand. Here, it is seen that the building with the least ductility requirement is the buildings with Band-Type type short columns. However, it should not be forgotten that the demand for shear force increases in this model inversely proportional to the displacement;
- (2)
- Especially in buildings with the hill slope effect, the increase in plastic rotation demands 4–5 times compared to the reference building has significantly increased the bending damage of the columns in this building. Similarly, in buildings with band-type windows, the plastic rotation demands increase 2–3 times in the relevant axes compared to the reference building. The increase in plastic rotation demands, especially on critical floors, may cause increased column damage and insufficient global performance of the building;
- (3)
- Since the period decreases with the increase in stiffness in short-column models, the roof displacement demands of these models are lower than the reference model. In this situation, it is incorrect to think that the short column models’ performance is better than the reference model. Because of the short column formation, the plastic rotation of the short columns increases considerably, even with low roof demands. In the short-column models created within the scope of the study, the plastic rotations occurring in the short columns increased significantly, but since these values did not exceed the controlled damage limit, the performance status of the models did not change. However, in different buildings with different storey numbers, blueprints and material properties, the plastic rotations increasing in this size in short columns can change the performance status of the buildings.
The Strength-Based Design Approach and Deformation-Based Design Approach showed that short column formation is an important parameter in structural behaviour. Although there are many studies on this subject in the literature, it has been shown in this study that the most critical short column performance is in buildings with band windows, and the most innocent short columns are in buildings with mezzanine floors. The buildings considered in this study are modelled according to the strict design rules given in TBEC-2018. Therefore, none of the vulnerabilities mentioned in this article caused shear damage. However, changes in the models related to rotation and displacement demands have affected the structural performance. The authors plan future and ongoing studies to include structural defects in the models in question. For example, it is estimated that the presence of some parameters that reduce the shear capacity, such as the low concrete strength and the absence of stirrup confinement, will affect the global performance more.
Author Contributions
Conceptualization, M.H.A., C.A. and E.I.; methodology, F.A., M.H.A., E.I., F.A. and C.A.; software, H.U., M.H.A. and C.A.; validation, M.H.A., E.I. and C.A.; formal analysis, F.A., E.H. and M.H.A.; investigation, E.I., M.H.A., C.A. and H.U.; resources, E.I., M.H.A. and H.U.; data curation, E.I., M.H.A. and H.U., writing—original draft preparation, E.I., M.H.A., F.A. and E.I.; writing—review and editing, M.H.A., F.A. and E.I.; visualization, E.H.; supervision, M.H.A. and E.I.; project administration, E.I.; funding acquisition, E.H. All authors have read and agreed to the published version of the manuscript.
Funding
This research received no external funding.
Institutional Review Board Statement
Not applicable.
Informed Consent Statement
Not applicable.
Data Availability Statement
Most data are included in the manuscript.
Conflicts of Interest
The authors declare no conflict of interest.
References
- Yel, N.S.; Arslan, M.H.; Aksoylu, C.; Erkan, İ.H.; Arslan, H.D.; Işık, E. Investigation of the Earthquake Performance Adequacy of Low-Rise RC Structures Designed According to the Simplified Design Rules in TBEC-2019. Buildings 2022, 12, 1722. [Google Scholar] [CrossRef]
- Ademović, N.; Kalman Šipoš, T.; Hadzima-Nyarko, M. Rapid assessment of earthquake risk for Bosnia and Herzegovina. Bull. Earthq. Eng. 2020, 18, 1835–1863. [Google Scholar] [CrossRef]
- Bilgin, H.; Shkodrani, N.; Hysenlliu, M.; Ozmen, H.B.; Isik, E.; Harirchian, E. Damage and performance evaluation of masonry buildings constructed in 1970s during the 2019 Albania earthquakes. Eng. Fail. Anal. 2022, 131, 105824. [Google Scholar] [CrossRef]
- Kaminosono, T. Evaluation method for seismic capacity of existing reinforced concrete buildings in Japan. In Memoria; Centro Nacional de Prevención de Desastes (CENAPRED): Mexico City, México; Agencia de Cooperación Internacional (JICA): Tokyo, Japan; Centro para el Desarrollo Regional (UNCRD): Nagoya, Japan, 1992; pp. 44–53. [Google Scholar]
- National Research Council of Canada (NRCC). Manual for Screening of Buildings for Seismic Investigation; Canadian Standard; National Research Council of Canada: Ottowa, ON, Canada, 1993.
- Okada, T. Needs to Evaluate Real Seismic Performance of Buildings-Lessons from the 1995 Hyogoken-Nambu Earthquake. INCEDE Rep. 1999, 15, 225–231. [Google Scholar]
- Gulay, F.G.; Kaptan, K.; Bal, E.I.; Tezcan, S.S. P25-scoring method for the collapse vulnerability assessment of R/C buildings. Procedia Eng. 2011, 14, 1219–1228. [Google Scholar] [CrossRef]
- Bülbül, M.A.; Harirchian, E.; Işık, M.F.; Aghakouchaki Hosseini, S.E.; Işık, E. A hybrid ANN-GA model for an automated rapid vulnerability assessment of existing RC buildings. Appl. Sci. 2022, 12, 5138. [Google Scholar] [CrossRef]
- Dogan, G.; Ecemis, A.S.; Korkmaz, S.Z.; Arslan, M.H.; Korkmaz, H.H. Buildings damages after Elazığ, Turkey earthquake on 24 January 2020. Nat. Hazards 2021, 109, 161–200. [Google Scholar] [CrossRef]
- Bektaş, N.; Kegyes-Brassai, O. Development in fuzzy logic-based rapid visual screening method for seismic vulnerability assessment of buildings. Geosciences 2023, 13, 6. [Google Scholar] [CrossRef]
- Ghobarah, A.; Galal, K.E. Seismic rehabilitation of short rectangular RC columns. J. Earthq. Eng. 2004, 8, 45–68. [Google Scholar] [CrossRef]
- Moretti, M.; Tassios, T.P. Behaviour of short columns subjected to cyclic shear displacements: Experimental results. Eng. Struct. 2007, 29, 2018–2029. [Google Scholar] [CrossRef]
- ASCE. Seismic Evaluation and Retrofit of Existing Buildings; ASCE/SEI, 41-17; ASCE: Reston, VA, USA, 2017. [Google Scholar]
- Arslan, M.H.; Korkmaz, H.H. What is to be learned from damage and failure of reinforced concrete structures during recent earthquakes in Turkey? Eng. Fail. Anal. 2007, 14, 1–22. [Google Scholar] [CrossRef]
- Tsantilis, A.V.; Triantafillou, T.C. Innovative seismic isolation of masonry infills using cellular materials at the interface with the surrounding RC frames. Eng. Struct. 2018, 155, 279–297. [Google Scholar] [CrossRef]
- Moehle, J.P.; Mahin, S.A. Observations on the behavior of reinforced concrete buildings during earthquakes. ACI Spec. Publ. 1991, 127, 67–90. [Google Scholar]
- Wang, Y.Y. Lessons learned from the “5.12” Wenchuan earthquake: Evaluation of earthquake performance objectives and the importance of seismic conceptual design principles. Earthq. Eng. Eng. Vib. 2008, 7, 255–262. [Google Scholar] [CrossRef]
- Yen, W.P.; Chen, G.; Buckle, I.; Allen, T.; Alzamora, D.; Ger, J.; Arias, J.G. Post-Earthquake Reconnaissance Report on Transportation Infrastructure: Impact of the 27 February 2010, Offshore Maule Earthquake in Chile; FHWA-HRT-11-030; Federal Highway Administration: Richmond, VA, USA, 2011.
- Meral, E. Investigation of short column effects in reinforcement concrete buildings. Int. J. Eng. Res. Dev. 2019, 11, 515–527. [Google Scholar]
- Şeker, M.; Bedirhanoglu, İ. Investigation of shear behaviour of reinforced concrete captive column with low strength concrete. Dicle Univ. J. Eng. (DUJE) 2019, 10, 385–395. [Google Scholar]
- Balik, F.S.; Bahadir, F. Investigation of short column behaviors at 1/5 scaled reinforced concrete frames using different strengthening methods. J. Inst. Sci. Technol. 2019, 9, 433–445. [Google Scholar] [CrossRef]
- Işık, E.; Karasin, İ.B.; Ulu, A.E. Investigation of earthquake behavior of reinforced-concrete buildings built on soil slope. Eur. J. Sci. Eng. 2020, 20, 162–170. [Google Scholar]
- Haji, M.; Naderpour, H.; Kheyroddin, A. Experimental study on influence of proposed FRP-strengthening techniques on RC circular short columns considering different types of damage index. Compos. Struct. 2019, 209, 112–128. [Google Scholar] [CrossRef]
- Chen, C.Y.; Liu, K.C.; Liu, Y.W.; Huang, W.J. A case study of reinforced concrete short column under earthquake using experimental and theoretical investigations. Struct. Eng. Mech. 2010, 36, 197–206. [Google Scholar] [CrossRef]
- Moretti, M.; Tassios, T.P. Behavior and ductility of reinforced concrete short columns using global truss model. ACI Struct. J. 2006, 103, 319–327. [Google Scholar]
- Çelebi, E.; Aktas, M.; Çağlar, N.; Özocak, A.; Kutanis, M.; Mert, N.; Özcan, Z. 23 October 2011 Turkey/Van–Ercis earthquake: Structural damages in the residential buildings. Nat. Hazards 2013, 65, 2287–2310. [Google Scholar] [CrossRef]
- Alih, S.C.; Vafaei, M. Performance of reinforced concrete buildings and wooden structures during the 2015 Mw 6.0 Sabah earthquake in Malaysia. Eng. Fail. Anal. 2019, 102, 351–368. [Google Scholar] [CrossRef]
- Pozos-Estrada, A.; Chávez, M.M.; Jaimes, M.Á.; Arnau, O.; Guerrero, H. Damages observed in locations of Oaxaca due to the Tehuantepec Mw8. 2 earthquake, Mexico. Nat. Hazards 2019, 97, 623–641. [Google Scholar] [CrossRef]
- Liu, C.; Fang, D.; Zhao, L. Reflection on earthquake damage of buildings in 2015 Nepal earthquake and seismic measures for post-earthquake reconstruction. Structures 2021, 30, 647–658. [Google Scholar] [CrossRef]
- Arslan, M.H. An evaluation of effective design parameters on earthquake performance of RC buildings using neural networks. Eng. Struct. 2010, 32, 1888–1898. [Google Scholar] [CrossRef]
- Işik, E.; Ulu, A.E.; Aydin, M.C. A case study on the updates of Turkish rapid visual screening methods for reinforced-concrete buildings. Bitlis Eren Univ. J. Sci. Technol. 2021, 11, 97–103. [Google Scholar]
- Bektaş, N.; Kegyes-Brassai, O. Conventional RVS methods for seismic risk assessment for estimating the current situation of existing buildings: A state-of-the-art review. Sustainability 2022, 14, 2583. [Google Scholar] [CrossRef]
- Ay, B.Ö.; Erberik, M.A. Seismic risk assessment of low-rise and mid-rise reinforced concrete structures in Turkey. In Proceedings of the Sixth National Conference on Earthquake Engineering, Istanbul, Turkey, 16–20 October 2007; pp. 37–48. [Google Scholar]
- Doğangün, A. Betonarme Yapıların Hesap ve Tasarımı; Birsen Yayınevi: Istanbul, Turkey, 2013. [Google Scholar]
- Işık, E. Size effects of columns on buckling. In Proceedings of the 5th International Science Technology and Engineering Conference, St. Petersburg, Russia, 6–8 April 2015. [Google Scholar]
- Yamada, M.; Furui, S. Shear resistance and explosive cleavage failure of reinforced concrete members subjected to axial load. In Proceedings of the 8th International Congress IABSE, New York, NY, USA, 9–14 September 1968; pp. 1091–1102. [Google Scholar]
- Moretti, M.L.; Tassios, T.P. Design in shear of reinforced concrete short columns. Earthq. Struct. 2013, 4, 265–283. [Google Scholar] [CrossRef]
- Bal, İ.E.; Tezcan, S.S.; Gülay, G.F. P25 rapid screening method to determine the collapse vulnerability of r/c buildings. In Proceedings of the Sixth National Conference on Earthquake Engineering, Istanbul, Turkey, 16–20 October 2007; pp. 661–674. [Google Scholar]
- Doğan, T.P.; Kızılkula, T.; Mohammadi, M.; Erkan, İ.H.; Kabaş, H.T.; Arslan, M.H. A comparative study on the rapid seismic evaluation methods of reinforced concrete buildings. Int. J. Dis. Risk Reduct. 2021, 56, 102143. [Google Scholar] [CrossRef]
- Çağatay, İ.H. Investigation of parameters affecting short column of buildings. In Proceedings of the Sixth National Conference on Earthquake Engineering, Istanbul, Turkey, 16–20 October 2007; pp. 29–236. [Google Scholar]
- İnan, T.; Korkmaz, K. Investigation of vertical structural irregularities. Erciyes Üniversitesi Fen Bilim. Enstitüsü Derg. 2012, 28, 240–248. [Google Scholar]
- Guevara, L.T.; Garcia, L.E. The captive-and short-column effects. Earthq. Spectra 2005, 21, 141–160. [Google Scholar] [CrossRef]
- Dowrick, D.J. Earthquake Resistant Design for Engineers and Architects; John Wiley & Sons: Chichester, NH, USA, 1987. [Google Scholar]
- Colomb, F.; Tobbi, H.; Ferrier, E.; Hamelin, P. Seismic retrofit of reinforced concrete short columns by CFRP materials. Compos. Struct. 2008, 82, 475–487. [Google Scholar] [CrossRef]
- Işık, E. The effects of 23 October 2011 Van earthquake on near-field and damaged on structures. Int. Anatolia Acad. Online J. Sci. Sci. 2014, 2, 10–25. [Google Scholar]
- Karakostas, C.; Lekidis, V.; Makarios, T.; Salonikios, T.; Sous, I.; Demosthenous, M. Seismic response of structures and infrastructure facilities during the Lefkada, Greece earthquake of 14 August 2003. Eng. Struct. 2005, 27, 213–227. [Google Scholar] [CrossRef]
- Aliaari, M.; Memari, A.M. Analysis of masonry infilled steel frames with seismic isolator subframes. Eng. Struct. 2005, 27, 487–500. [Google Scholar] [CrossRef]
- Caglar, N.; Vural, I.; Kirtel, O.; Saribiyik, A.; Sumer, Y. Structural damages observed in buildings after the 24 January 2020 Elazığ-Sivrice earthquake in Türkiye. Case Stud. Constr. Mater. 2023, 18, e01886. [Google Scholar] [CrossRef]
- Education and Job. Available online: http://educationandjob1.blogspot.com.tr/2014_05_01_archive.html (accessed on 6 May 2022).
- Jayaguru, C.; Subramanian, K. Seismic behaviour of partially infilled RC frames retrofitted using GFRP laminates. Exp. Tech. 2012, 36, 82–91. [Google Scholar] [CrossRef]
- Eleftheriadou, A.K.; Karabinis, A.I. Seismic vulnerability assessment of buildings based on damage data after a near field earthquake (7 September 1999 Athens-Greece). Earthq. Struct. 2012, 3, 117–140. [Google Scholar] [CrossRef]
- Aydınoğlu, M.N. A response spectrum-based nonlinear assessment tool for practice: Incremental response spectrum analysis (IRSA), ISET. J. Earthq. Technol. 2007, 44, 169–192. [Google Scholar]
- Kutanis, M.; Boru, O.E. The need for upgrading the seismic performance objectives. Earthq. Struct. 2014, 7, 401–414. [Google Scholar]
- İlki, A.; Celep, Z. Betonarme yapıların deprem güvenliği. In Proceedings of the 1. Türkiye Deprem Mühendisliği ve Sismoloji Konferansı, Ankara, Turkey, 1–14 October 2011. [Google Scholar]
- Fajfar, P. Capacity spectrum method based on inelastic demand spectra. Earthq. Eng. Struct. Dyn. 1999, 28, 979–993. [Google Scholar] [CrossRef]
- Gholizadeh, S. Performance-based optimum seismic design of steel structures by a modified firefly algorithm and a new neural network. Adv. Eng. Softw. 2015, 81, 50–65. [Google Scholar] [CrossRef]
- Işık, E.; Kutanis, M. Performance based assessment for existing residential buildings in Lake Van basin and seismicity of the region. Earthq. Struct. 2015, 9, 893–910. [Google Scholar] [CrossRef]
- Chopra, A.K.; Goel, R.K. A modal pushover analysis procedure for estimating seismic demands for buildings. Earthq. Eng. Struct. Dyn. 2002, 31, 561–582. [Google Scholar] [CrossRef]
- Foti, D. A new experimental approach to the pushover analysis of masonry buildings. Comput. Struct. 2015, 147, 165–171. [Google Scholar] [CrossRef]
- Hsiao, F.P.; Oktavianus, Y.; Ou, Y.C. A pushover seismic analysis method for asymmetric and tall buildings. J. Chin. Inst. Eng. 2015, 38, 991–1001. [Google Scholar] [CrossRef]
- Casapulla, C.; Argiento, L.U. The comparative role of friction in local out-of-plane mechanisms of masonry buildings. Pushover analysis and experimental investigation. Eng. Struct. 2016, 126, 158–173. [Google Scholar] [CrossRef]
- Gholipour, M.; Alinia, M.M. Considerations on the pushover analysis of multi-story steel plate shear wall structures. Period. Polytech. Civ. Eng. 2016, 60, 113–126. [Google Scholar] [CrossRef]
- Wang, C.; Xiao, J.; Liu, W.; Ma, Z. Unloading and reloading stress-strain relationship of recycled aggregate concrete reinforced with steel/polypropylene fibers under uniaxial low-cycle loadings. Cem. Concr. Compos. 2022, 131, 104597. [Google Scholar] [CrossRef]
- TBEC-2018; Turkish Building Earthquake Code. T.C. Resmi Gazete: Ankara, Turkey, 2018.
- Available online: https://tdth.afad.gov.tr (accessed on 2 February 2022).
- SAP2000; Integrated Software for Structural Analysis & Design. Computers & Structures, Inc.: Berkeley, CA, USA, 2011.


Disclaimer/Publisher’s Note: The statements, opinions and data contained in all publications are solely those of the individual author(s) and contributor(s) and not of MDPI and/or the editor(s). MDPI and/or the editor(s) disclaim responsibility for any injury to people or property resulting from any ideas, methods, instructions or products referred to in the content. |
© 2023 by the authors. Licensee MDPI, Basel, Switzerland. This article is an open access article distributed under the terms and conditions of the Creative Commons Attribution (CC BY) license (https://creativecommons.org/licenses/by/4.0/).