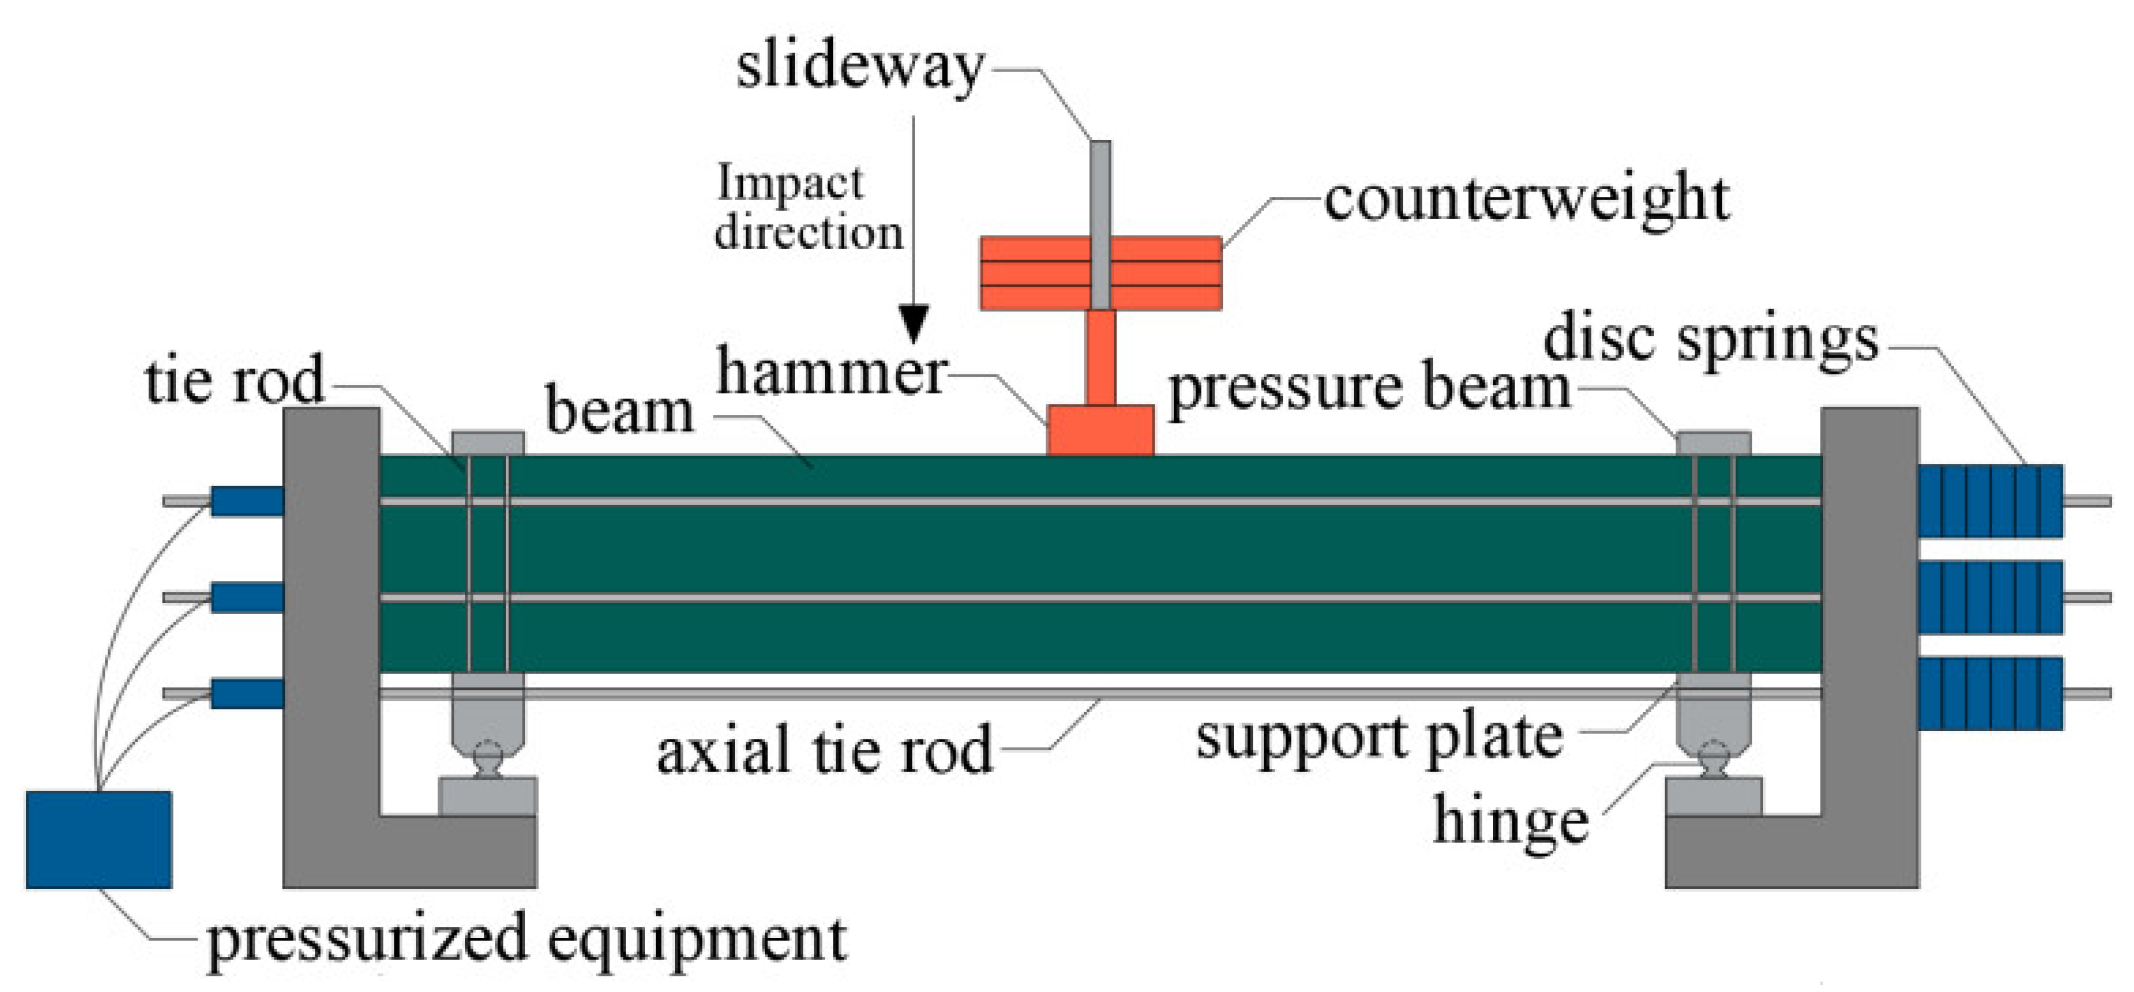
Article

Numerical and Analytical Investigations of the Impact Resistance of Partially Precast Concrete Beams Strengthened with Bonded Steel Plates

1
College of Civil Engineering, Fuzhou University, Fuzhou 350116, China
2
Fujian Provincial Key Laboratory of Advanced Technology and Informatization in Civil Engineering, Fujian University of Technology, Fuzhou 350118, China
3
School of Ecological Environment and Urban Construction, Fujian University of Technology, Fuzhou 350118, China
*
Author to whom correspondence should be addressed.
Buildings 2023, 13(3), 696; https://doi.org/10.3390/buildings13030696
Submission received: 11 November 2022 / Revised: 27 February 2023 / Accepted: 27 February 2023 / Published: 6 March 2023
(This article belongs to the Special Issue Recent Advance in Steel and Composite Structures)

Abstract

:
A building may be subjected to a variety of accidental loads during its service life. Partially precast concrete (PC) beams are a primary structural component. Their impact resistance can have a substantial impact on the overall safety of a structure when it is subjected to an impact load. In this study, numerical analyses were performed on the dynamic response of PC beams strengthened with bonded steel plates subjected to impact loading. The model was verified from four aspects: energy conversion, failure form, impact force–time history curve, and midspan displacement–time history curve. The dynamic response eigenvalues of the peak impact force, peak midspan displacement, and residual midspan displacement were compared between the numerical simulations and experimental tests. The relative inaccuracy of the peak impact force ranged from 9.51% to 14.0%, with an average value of 11.9%. The average relative error for the midspan displacement was −0.09%, with the greatest relative errors varying between −0.64% and 0.3%. The residual value errors of the midspan displacement ranged from −0.95% to 2.38%, with an average relative error of 0.94%. On this basis, the effects of the impact mass, impact height, width, and length of the bonded steel plate on the impact resistance of the components were evaluated. Furthermore, the differences in the equivalent plastic strain contours, impact force–time history curves, and midspan displacement–time history curves under different parameters were compared. The results demonstrated that the failure modes and flexural deformations of the test beams were influenced by the impact mass and impact height. The increase in the length and width of the steel plate had no effect on the impact force response, but the peak and residual values of the midspan displacement decreased, which could significantly increase the impact resistance of the beams. Lastly, the impact mass m, the impact height h, the thickness t of the bonded steel plate, the length of the bonded steel plate hs, and the width of the bonded steel plate bs were all taken into account in the fitting formula. These five parameters were used to predict the peak impact force response, the peak value of the midspan displacement, and the residual value of the midspan displacement. The results demonstrated that the fitting formula had small errors and could accurately reflect the dynamic responses of the PC beams strengthened with bonded steel plates under impact loading.

1. Introduction

Throughout their design service life, buildings may be subjected to a variety of accidental loads including collisions, impacts, and explosions, such as the impact generated by a falling precast component during the process of hoisting a lower component or the impact generated by stones rolling onto buildings in mountainous areas. The safety of a building structure is in danger from these loads because of their short durations and high peak values. In order to prevent catastrophic structural progressive collapse, impact loads should be accounted for in structural designs with reinforced concrete beams in specific circumstances, and the impact resistance of existing structural elements should be assessed. Therefore, research on the impact resistance of building components cannot be ignored.
Many scholars have conducted experimental research and numerical simulations on the impact resistance of reinforced concrete beams. Zhou et al. [1], Yoo et al. [2], and Yoo et al. [3] conducted impact tests on RC beams and UHPC beams with various reinforcement ratios. It was found that increasing the reinforcement ratio could improve the total stiffness of the beam, reduce displacement and damage, and thus, improve the impact resistance of the member. Jin et al. [4] established a 3D mesoscopic simulation method considering concrete heterogeneities, discussed the effect of the hoop ratio on the impact resistance of the member, and found that the hoop ratio has little effect on the midspan deflection of the beam under impact load. Yu et al. [5] conducted drop weight impact tests on 15 RC beams and found that increasing the cross-section size affected the stiffness of the beam, raising the impact force but lowering the peak and residual mid-span displacements. Yoo et al. [2], Yoo et al. [3], Ulzurrun et al. [6], and Mao et al. [7] found that the impact resistance of beams could be improved by using steel fiber-reinforced concrete (SFRC) or ultra-high-performance fiber-reinforced concrete (UHPFRC) as the main body of the beams. Scholars have conducted substantial research on the displacement response of RC beams based on numerical simulation results; established and developed expressions or analytical models for the displacement of RC beams as a function of the impact velocity, impact mass, and impact energy; evaluated the damage degree of reinforced concrete members under impact load; and predicted their deformations (Wongmatar et al. [8]; Hwang et al. [9]; Guo et al. [10]; Pham et al. [11]; Adhikary et al. [12]; Zhao et al. [13]; Yong et al. [14]).
It is no longer possible to increase the impact resistance of existing building components through material strengthening or reinforcement design. The construction process becomes complicated when a strengthening design with an additional UHPC layer is adopted, requiring formwork support, pouring, and formwork removal. In the middle of the last century, some scholars proposed a strengthening technology using bonded steel to improve the flexural load-bearing capacity of reinforced concrete beams (Khouzam et al. [15]; Thamrin and Sari. [16]; Alwis et al. [17]). Therefore, researchers can learn from this strengthening technology that uses bonded steel to improve the impact resistance of reinforced concrete beams. In this study, on the basis of experimental research on the impact loads of PC beams strengthened with bonded steel plates, numerical analyses were performed on the dynamic responses of PC beams under impact loading. The finite element model was verified by comparing the simulated and test results. Numerical analysis was carried out to analyze the key parameters affecting the impact resistance, and a simplified calculation formula was established for predicting the displacement responses of PC beams strengthened with bonded steel plates under impact loading.

2. Finite Element Model and Verification

2.1. Test Device

Ultra-high-heavy-duty drop weight impact testing equipment made up of loading, fixing, axial-compression, and data collection devices was used to conduct drop weight impact tests. A slideway, a drop weight control system, a counterweight steel plate, and a hammer made up the loading regime. The impact speed was regulated by employing the drop weight control system to elevate the hammerhead to various heights along the slideway, and the impact mass was adjusted by raising or lowering the amount of counterweight steel plates. The hammer could rebound along the slideway after impact on this drop weight impact testing device, allowing for secondary impact with gravity. The hammerhead had a cross-sectional diameter of 220 mm and had a shape like a cylinder. Support plates, pressure beams, and tie rods were used to support the test beams. Under the support plate, a hinge was placed to permit rotation of the specimen and to create basic support restrictions. The drop weight impact test setup is shown in Figure 1.

2.2. Test Overview

Four PC beams were fabricated, and each test beam had identical geometric proportions; the specific dimensions can be seen in Figure 2 and Figure 3. Here, the concrete strength grade of the precast components was C30, while the concrete strength grade of postcast components was C40. All of the steel rebars were HRB400 grade. The rectangular beam section dimensions were 220 mm × 450 mm, the beam length was 3000 mm, the support width was 150 mm, their centers were 225 mm from the beam ends, the net span of the beam was 2400 mm, and the shear–span ratio was 3. The concrete had a cover of 30 mm. Since the height of the beam was 450 mm, the diameter of the tensile reinforcing bars was 20 mm, and the diameter of the stirrups was 10 mm, the effective depth was 400 mm. The assembly’s midline was at L/4, and the splicing positions were placed on both sides of the assembly. The postcast layer had a 150 mm thickness, and the postcast portion had a 500 mm length. The longitudinal tensile reinforcement in the postcast section was welded with double-sided lap joints with a lap length of 100 mm and staggered welded connections.
The four test beams were designated as A1, B1, B2, and B3, respectively. Beam A1 was not strengthened with steel plates, and the remaining three test beams were strengthened with bonded steel. The grade of the steel plates was Q235. The reinforcement of beam B1 consisted of a strengthened steel plate with a length of 3000 mm, a width of 220 mm, and a thickness of 2 mm on the bottom of the beam. The steel plate of Beam B2 had the same length and breadth as that of Beam B1, but it was 4 mm thick instead. Beam B3 was strengthened with a steel plate with a length of 3000 mm, a width of 220 mm, and a thickness of 2 mm on the bottom of the beam, and it was set with eight U-shaped steel plate hoops with a width of 60 mm and a thickness of 2 mm.

2.3. Finite Element Model

The numerical analysis was performed using the commercial software LS-DYNA. The keywords for this model were set according to the LS-DYNA user’s manual (LS-DYNA, 2022a; LS-DYNA, 2022b). The numerical analysis simulated the steel reinforcements using the BEAM161 beam element. The steel plates and U-shaped steel plate hoops were simulated using the SHELL163 thin shell element. The beams, hammerheads, support pads, and pressure beams were simulated using the SOLID164 solid element. The material model for steel bars and steel plates used the plastic hardening model (*MAT_PLASTIC_KINEMATIC), which was used to simulate isotropic and kinematically plastic hardening materials and also had the option of strain rate effects. The model can be used for beam, shell, and solid elements and is a very cost-effective model. The model can effectively simulate the elastic−plastic behavior of steel. The material model of the beam concrete adopted the continuous concrete cap damage model (*MAT_CSCM_CONCRETE). This model can be used for solid elements in LS-DYNA, which therefore can be used for the simulation of concrete materials under low-velocity impact loads, and the model has a good response to the stress−strain relationship of concrete materials. The user can select a custom material or directly select concrete (CONCRETE). The specific parameter settings of the above material models are shown in Table 1. A summary of the element types and material models of the individual components of the finite element model in this paper is shown in Table 2.
This model adopts the symmetric penalty function method and realizes the contact control by setting the parameters of the *CONTROL_CONTACT keyword, where SLSFAC is the penalty scale factor of the sliding interface, which was set to the default value of 0.1. ISLCHK indicates whether the initial penetration check is performed on the contact surface. This keyword was enabled in this model.
As a general algorithm, the surface-to-surface contact in LS-DYNA can usually handle the relative sliding contact between objects, such as *CONTACT_AUTOMATIC_SURFACE_TO_SURFACE, *CONTACT_TIED_SURFACE_TO_SURFACE, and *CONTACT_TIEDBREAK_SURFACE_TO_SURFACE. Due to the bonding connection between the test beam solid element and the bottom-pasted steel plate shell element, there is a phenomenon of peeling; hence, for the contact between the two, only tied break contact can be selected. In contrast to the way that the surface-to-surface binding contact binds the master and slave surfaces of the contact, the fixed failure contact adds a new contact surface to the target surface only before the failure stress is reached. A penalty stiffness is used to achieve a “pin connection” between the master and slave contact surfaces. When the contact interface stress exceeds the failure stress, relative sliding or even separation can be achieved between the master and slave surfaces. The setting of the contact parameters is similar to surface-to-surface contact, except that two new failure stresses, NFLS and SFLS, are added. These two parameters determine the failure criterion of the contact surface, as shown in Equation (1).
σ n NFLS 2 + σ s SFLS 2   1
In order to simulate double-sided lap welding, the longitudinal tensile reinforcement at the bottom portion of the test beam was joined using the constraint method of *CONSTRAINED SPOTWELD. The element type of this part adopted a three-dimensional beam element, and the material model adopted a plastic hardening model, where TS1 = TS2 = 40 was defined. Since the test beam did not have obvious dislocation between the superimposed part and the spliced part, and only cracks with a small width appeared, the contact between the precast concrete and the cast-in-place concrete at the superimposed position and the spliced position was set to binding contact *CONTACT_TIED_SURFACE_TO_SURFACE. The contact of the test beam, the hammer head, and the support was set to automatic surface-to-surface contact *CONTACT_AUTOMATIC_SURFACE_TO_SURFACE. The contact mode of the longitudinal reinforcement, stirrup, and concrete was a coupling bond, which did not consider slip failure between the reinforcement and concrete. The contact between the beam and the steel plate was set as surface-to-surface fixed failure contact *CONTACT_TIEDBREAK_SURFACE_TO_SURFACE, and the failure damage between the steel plate and the concrete was simulated by setting the failure stresses of NFLS and SFLS. The gravity load was set to the *LOAD_BODY_OPTION with a value of 9800 mm/ s 2 . The initial velocity was applied to the hammer head by setting *INITIAL_VELOCITY, and the initial velocity was obtained from the velocity collector in Section 2. On the basis of ensuring the accuracy and efficiency of numerical calculations, after repeated trial calculations, the grid density of the reinforcement frame, precast concrete beam, and steel plate was finally determined to be about 50 mm, and the grid density of support pads and hammer was about 35 mm. The above keyword settings were all implemented using the finite element software Hypermesh. Finally, after using this software to divide the finite element model mesh, the k file was output to the LS-DYNA Solver for calculations and solutions. The reinforced skeleton of the test beam, the spliced parts of old and new concrete, and the final finite element model are shown in Figure 4, Figure 5 and Figure 6.

2.4. Validation of the Finite Element Model

As an illustration, test beam B1 was used to confirm the accuracy of the finite element model. The total energy, internal energy, kinetic energy, slip energy, and hourglass energy under impact loading are shown in Figure 7. The total energy at different moments was almost equal to the sum of the other four terms, which shows the energy conversion relationship in the impact process. The fact that the total energy was equal according to the energy conversion curve indicates that the impact process complied with the law of energy conservation. Energy conversion mainly occurred between kinetic and internal energy. The kinetic energy of the hammerhead was converted into internal energy in the beam, causing the beam to undergo deflection, deformation, cracks, and local damage. The slip energy was controlled within a certain range, and there was no negative value, indicating no excessive slip and initial penetration between the beam and the support. The hourglass could be controlled within 5%, ensuring the validity of the developed model. From the energy perspective, the calculation results were relatively ideal.
Figure 8 compares the failure morphology of the PC beam and the equivalent plastic strain contour. Since the concrete used a continuous-cap damage model, the equivalent plastic strain did not refer to the effective plastic strain of the concrete, but to the damage index. To a certain extent, the equivalent plastic strain contour reflects the cracking of concrete, such that the distribution of concrete cracks can be observed indirectly. It can be seen from the comparison diagram that the equivalent plastic strain cloud map obtained by numerical simulation could better reflect the real failure state of each test beam after impact load.
The damage to the test beam in the equivalent plastic strain contour mainly occurred near the contact area of the hammer and on the midspan web and bottom of the beam, and the main damage locations were the same as the test results. The finite element model discretely exhibited the distributed cloud-like micro-cracks in the splicing part. The cracks in the splicing area in the test were developed from the beam web oblique cracks from the midspan. The test and finite element cracks appeared at similar locations and had little damage. This shows that the contact type of concrete was selected correctly during numerical simulation. Test beam B1 had micro-cracks in the superimposed layer, and the plastic strain contour acquired using the numerical simulation indicates that the test beam was damaged in the superimposed layer, but no major damage occurred, indicating that the values of the parameters of the contact surface of the superimposed layer were reliable. Due to the long calculation time for numerical simulations, the mesh was not refined, and the equivalent plastic strain cloud map mainly showed the damage degree of the concrete; cracks did not completely develop, hence the “cracks” of the equivalent plastic strain cloud map appearing as flakes. However, the crack position and the main damage area were accurately simulated; thus, the finite element model was accurate for the simulation of the damage state.
Figure 9 is a comparison diagram of the impact force−time history curves obtained from the test beam tests and numerical simulations. Although the initial reaction time and development trend of the main peak section curve were accurately approximated, there were errors in the increase rate of the curve and the size of the main peak. The curve obtained by the finite element simulation had no obvious oscillating section, which was caused by different boundary conditions. During the test, in order to prevent the support from tilting, there was an air attack on the pressure beam and the top of the beam on one side of the support, such that the test beam was in the vertical position. Displacement could occur in the direction of the beam, resulting in the continuous reflection of the stress wave in the beam height direction, but the finite element simulation did not need to protect the support; the vertical displacement of the beam was restrained by setting spacers and compression beams. Subsequent tests and numerical simulations produced sub-peak segments; the sub-peak segments of the numerical simulation appeared earlier than those measured during the test, with larger peaks and longer durations. This is because the numerical simulation had no oscillation section, and the energy consumed in the second wave peak section included the energy consumed by the experimental oscillation section. Lastly, the test and numerical simulation impact force−time history curves entered the decay section; both were steady and tended to zero. A comparison of the midspan displacement–time history curves produced by the test beam test and numerical simulation is shown in Figure 10. The displacements of the experimental curve and the simulated curve began to respond almost simultaneously, had almost the same growth rate, and reached the peak displacement almost simultaneously. During the increasing and rebounding stages of the displacement, the displacement curve obtained from the test fluctuated, and the test beam reinforced with bonded steel showed a small peak, while the simulated curve was relatively smooth and did not show the second peak. In this paper, a finite element model was established without erosion under relatively ideal conditions. In the displacement spring-back stage, the curves of the test beam reinforced with bonded steel were in good agreement, while the displacement spring-back value of the test beam without reinforcement had a large error. After the displacement rebound, the numerical simulation fitting was relatively good. The curve gradually stabilized after fluctuation and approached the displacement residual value, whose error was extremely small.
Figure 11, Figure 12, Figure 13, Figure 14, Figure 15 and Figure 16 show the impact force−time curves and the midspan displacement−time curves for the remaining specimens. Following the modeling method in Section 2.2, the four strengthening conditions in the tests were simulated, and the main dynamic response characteristic values (peak impact force, peak midspan displacement, and residual midspan displacement) were selected for comparison (Table 3).
The relative errors of the peak impact force were between 9.51% and 14.0%, and the average relative error was 11.9%. The peak impact forces of the test beams reinforced with bonded steel had sizable simulation errors. The peak relative errors of midspan displacement were between −0.64% and 0.3%, and the average relative error was −0.09%, indicating that the finite element model could very accurately simulate the maximum midspan displacements of the test beams under actual working conditions. In addition, the midspan residual displacements of the test beams were extremely accurately simulated under actual working conditions with the residual value errors of midspan displacement between −0.95% and 2.38%, and the average relative error being 0.94%. In general, the finite element model could accurately reflect the failure forms and dynamic responses of the bonded steel-reinforced PC beams under impact loading, and the simulated midspan displacement peak values and residual values were accurate, verifying the correctness and effectiveness of the finite element model.
In order to prepare for the subsequent nonlinear regression analysis of the characteristic values of individual parameters to obtain a nonlinear expression, the effects of individual parameters on the damage modes and dynamic responses of the test beams under the impact load were investigated through the parametric analysis of the impact position, impact mass, impact height, length of the bonded steel plate on the bottom of the beam, and width of the bonded steel plate on the bottom of the beam.

3. Factors Influencing the Impact Resistance

The influences of the impact mass, impact height, length of the bonded steel plate on the bottom of the beam, and width of the bonded steel plate on the bottom of the beam on the dynamic responses of the beams are all quantified in this section using finite element models. A typical model for finite element parameter analysis is established. The parameter settings of the typical model were the same as those of the numerical simulation model, and the same reinforcement method was adopted as for test beam B2. The base loading conditions were as follows: impact mass, height, speed, and energy as 280 kg, 6 m, 10.84 m/s, and 16,464 J, respectively.

3.1. Impact Mass

The impact mass of the typical finite element model was set to be 280 kg, but a PC beam strengthened with a bonded steel plate may be affected by different degrees of impact mass under actual working conditions. Therefore, in this section, the impact mass was increased by 50 kg in turn, and the impacts on the dynamic responses were studied through seven different impact masses, as shown in Table 4.
Comparing the equivalent plastic strain contours of individual parameter analysis models, the influence of different impact masses on the overall failure modes of the test beams was studied, as shown in Figure 17. The damage locations of individual parameter models were roughly the same, mainly occurring in the midspan beam web, near the contact area of the hammer head. In the area where the steel plate was attached, the degree of damage increased with the mass of the blow. Specifically, the local damage range in the compression zone was enlarged, the bending cracks on the bottom of the beam developed more seriously, and the damage area increased significantly. When the impact mass was minimal, local damage in the impact area, the growth of bending cracks at the bottom of the beam, and the formation of web shear diagonal cracks were the main manifestations of the failure modes of the models. However, when there was a larger impact mass, the failure modes primarily manifested in increased local damage in the impact area, complete development of individual cracks, greater damage to the post-poured layer, and the peeling off of the steel plate at the bottom of the beam and the concrete, resulting in peeling damage to the concrete cover.
Figure 18 shows the impact force–time history curves under different impact masses. The impact force–time history curve of each parameter analysis model had a distinct pattern that was primarily evident in the significant differences in the impact force’s primary peak value, secondary peak value, and primary peak and secondary peak durations. However, the initial response time and rising speed of the curves were not much different. The major peak value of the impact force steadily increased with the increasing impact mass, but the impact force’s rate of decrease slowed once it reached its highest value, and the duration of the main peak period of the force increased noticeably. This was due to the more serious overall damage to the beam under the action of the larger impact load, and the increase in deflection of the beam body. When the impact mass was greater, the sub-peak value of the impact force was somewhat enhanced, and the duration of the sub-peak part of the impact force was also extended. The sub-peak section of the impact force responded more quickly. This is because the beam body was seriously damaged and the residual stiffness was reduced after the test beam was subjected to a large impact load, and therefore the secondary impact of the hammer on the beam body was less affected by the beam body’s own resistance mechanism. The curves then stabilized and tended to near zero.
The midspan displacement–time history curves for various impact masses are depicted in Figure 19. The curves of individual models had similar trends in their changes. Because a bigger impact mass could speed up the transmission of the stress wave in the beam body, it follows that the midspan displacement rise rate dramatically increased as the impact mass increased. The displacement peak value and the residual value were obviously increased. Within a certain impact mass range, the difference between the displacement peak value and the displacement residual value increased with the increase in the impact mass. However, when the impact mass was large, the increase in the displacement rebound value was no longer obvious. This is due to the fact that the test beam’s tensile area suffered significant damage from the increase in impact mass. The concrete in this area was removed from the construction site, and the lower tensile longitudinal reinforcement participated in the work, increasing the beam’s midspan deformation recovery ability. However, after the impact mass exceeded a certain range, the lower tensile longitudinal bars and steel plates yielded and the elastic recovery capacity decreased, resulting in an increase in the proportion of plastic deformation.
Figure 20 shows the variations in individual dynamic response characteristic values under different impact masses. Combined with the analysis of the dynamic response characteristic values and their change trend point-line diagrams, the increase in impact mass was accompanied by a significant increase in the peak value of the impact force, which roughly showed a logarithmic growth trend. The impact quality clearly had an impact on the change trend of the midspan displacement peak values and residual values, which primarily exhibited a linear growth trend when the impact quality was raised. However, when the impact mass was 480 kg or more, this linear growth trend could no longer apply due to the severe peeling damage between the steel plate at the bottom of the beam and the bottom of the beam.
In summary, the test beam sustained more localized damage and overall damage as a result of the increased impact mass, which also increased the transmission speed of the stress wave in the beam body and lengthened the duration of the main and secondary peak portions of the impact.

3.2. Impact Height

The impact height of the typical finite element model was set at 6 m, but a PC beam strengthened with a bonded steel plate may be affected by different degrees of impact height in actual working conditions. Therefore, in this section, the impact height was increased by 1 m in turn, and the impact on the dynamic responses was studied through six different impact heights, as shown in Table 5.
The effects of different impact heights on the overall failure modes of the test beams were studied by comparing the equivalent plastic strain contours of individual parameter analysis models, as shown in Figure 21. Bending shear failure occurred for all models. Bending cracks on the bottom of the beam formed more fully as the height of the impact increased, and primarily manifested in the growth of crack breadth and damage area. The damage degree of beam web oblique cracks was aggravated, but the distribution of cracks was reduced. The damage degree of concrete in the compression zone was obviously aggravated, mainly manifesting as the local damage range extending from the top of the beam to the post-poured layer. The concrete cover at the bond of the steel plate had peeling failure, and this failure was aggravated with the increase in the impact height.
Figure 22 shows the impact force–time history curves under different impact heights. The shapes of the curves obtained for individual parameter analysis models were not much different; only the numerical values were different, whereas the initial response time and the rising speed of the impact force were almost the same. However, with the increase in the impact height, the main peak value of the impact force increased significantly, while the secondary peak value was not much different. The impact force decreased after reaching the main peak value, and its descending speed decreased with the increase in the impact height, which prolonged the duration of the main peak period. This is due to the fact that the overall flexural deformation and crack development of the beams increased with the increase in the impact height, and the downward acceleration time and rebound time of the test beam were prolonged. The duration of the sub-peak phase of the impact force increased with the increase in the impact height, due to the decrease in the residual stiffness of the beam after the first impact due to the larger impact height.
The midspan displacement–time history curves for various impact heights are depicted in Figure 23. All curves had similar trends. With the increase in the impact height, the increase rate of the midspan displacement value increased significantly. This is due to the fact that an increase in the impact height promotes an increase in the stress wave transmission height. At the same time, the midspan displacement could reach a larger peak value, and the residual value of the displacement also increased to a greater extent. The spring-back displacements and displacement differences of individual models were almost the same, indicating that, under the load induced by the abovementioned impact height, the test beam could fully exert its elastic deformation ability. However, the rebound displacement and displacement difference of the B-IH9 model decreased, indicating that when the impact height was greater than or equal to 9 m the test beam’s ability to rebound was diminished, and the fraction of plastic deformation of the test beam increased.
Figure 24 shows the variations in the individual dynamic response characteristic values under different impact heights. The peak value of the impact force increased significantly due to the increase in the impact height, and the stiffness of the contact surface material increased due to the influence of the strain rate effect, which further led to an increase in the local contact stiffness. The peak value and residual value of midspan displacement also increased significantly, and the trends were roughly linear. However, when the impact height was 9 m or more, due to the severe peeling damage of the steel plate on the bottom of the beam and the bottom of the beam, the residual value of the midspan displacement was basically linear but had a tendency to rise upward.
In summary, the test beams eventually sustained more local damage and overall damage as a result of the increased impact height’s effects on the transmission rate of the stress wave through the beam body, local contact stiffness at the impact interface, and impact duration.

3.3. Lengths of the Bonded Steel Plates

The use of bonded steel strengthening on the bottom can improve the bearing capacity and rigidity of PC beams, as well as effectively improve their impact resistance. The length of the bonded steel plate of the typical model was 3000 mm. In this section, the length of the steel plate pasted on the bottom was changed to study its effect on the impact resistance of the test beam, as shown in Table 6; the steel plates were set in the center.
We were able to assess the effects of various lengths of bonded steel plate on the overall failure modes of the test beams by comparing the comparable plastic strain contours of individual parameter analysis models, as shown in Figure 25. The overall damage to the test beams greatly decreased with an increase in the length of the bonded steel plate, as mostly seen in the amelioration of local damage and the reduction in damage area. The distribution of cracks was condensed, and midspan bending cracks and oblique beam web cracks were less likely to develop. In addition, the longer bottom steel plate length, as opposed to the shorter bottom steel plate, slowed down the peeling of the concrete cover induced by the steel plate on the bottom of the test beam. The length of the bonded steel plate was found to have a more noticeable restraining effect on the cracks in the beam body and also had a certain control effect on the local damage to the compression zone, which could effectively lessen the damage to the test beam under an impact load.
The impact force–time history curves under various bonded steel plate lengths are depicted in Figure 26. The change forms of the curves were nearly identical as the length of the bonded steel plate increased, and there were no appreciable differences in the characteristic values of the impact force–time history curves. The main indication that the impact force response was unaffected by changes in the steel plate length is that the sub-peak value of the impact force, the duration of the sub-peak section, and the fluctuation trend were all different only in the sub-peak and decay sections of the impact force–time history curve. The midspan displacement–time history curves for the various lengths of bonded steel plates are depicted in Figure 27. The change trends of all model curves were almost the same. With the increase in the length of the steel plate, the increase rate of the midspan displacement value was almost the same, but the peak displacement values decreased. When the length of the steel plate attached to the bottom was less than or equal to 2550 mm, the displacement curve had an obvious oscillation section. This is because the steel plate arrangements of these lengths lost the restraint of the supports at both ends, while the displacement curves of the larger lengths of the steel plates were more stable due to the restraint of the supports on both sides.
Figure 28 shows the variations of individual dynamic response characteristic values under different lengths of the bonded steel plates. The different lengths of the bonded steel plates had little effect on the peak impact force. When the length of the bonded steel plate increased, the peak value of midspan displacement declined, essentially following a linear decay trend, while the residual value of the midspan displacement first increased and then decreased.
In summary, the change in the length of the bonded steel plate did not change the local contact stiffness of the impact, but it had a great impact on the displacement responses and the failure modes of the test beams; the steel plates along the full length of the test beam had the best impact resistance. However, in an actual construction environment, the beam is not suitable for full-length pasting, then the maximum pasting length should be achieved as much as possible. A prefabricated beam can be hoisted after a steel plate is pasted on the bottom.

3.4. Width of the Bonded Steel Plate

The standard model had bonded steel plates with a width of 220 mm. In this section, to determine the impact of the width of the bonded steel plate pasted on the bottom on the laminated beam’s impact resistance, the width of the bonded steel plate pasted on the bottom was adjusted, as shown in Table 7; the steel plates were set in the center.
Comparing the plastic strain contours of individual parameter analysis models, as shown in Figure 29, allowed for examining the effects of various bonded steel plate widths on the overall failure modes of the test beams. With the increase in width of the steel plate, the overall damage degree of the component was obviously reduced. The main manifestations were that the bending cracks on the bottom of the beam developed slowly, the distribution range was reduced, the local damage in the impact contact area decreased, the damage to the post-poured layer was reduced, and the peeling of the concrete cover was reduced. This shows that an increase in the width of the steel plate could significantly reduce the overall failure of the components. This is due to the fact that, when the steel plate width was increased, more of the steel plate surface area participated in tension, and therefore concrete damage in the tension zone was mitigated, more concrete participated in compression at the top of the beam, and local damage was likewise mitigated.
The impact force–time history curves for various bonded steel plate widths are shown in Figure 30. The curve trends of individual parameter analysis models were not noticeably different when the width of the bonded steel plate increased, and the characteristic values of the impact force–time history curves were nearly the same, with just a minor reduction in the secondary peak value of the impact force. This is due to the fact that a narrower steel plate results in a greater overall failure of the test beam under the impact load, and that the test beam’s stiffness would thus diminish after the first impact, making the second impact’s dynamic responses more visible. The width of the steel plate did not, in general, have a major impact on the response of the impact force–time history curves.
The midspan displacement–time history curves under different widths of the bonded steel plates are shown in Figure 31. The change trends of the individual parameter analysis models’ curves were similar. As the width of the bonded steel plates increased, the displacement reacted almost simultaneously, the rate at which the displacement value increased was nearly the same, and the displacement’s peak value and residual value both decreased. Since the local contact stiffness at the point of impact was unaffected by the change in the steel plate width, strain waves were transmitted at the same rate, causing the midspan displacement values to rise at the same rate. In contrast, the peak displacement and displacement residual values decreased as the steel plate width increased because more of the plate’s surface area was exposed to tension, thus reducing local damage.
Figure 32 shows the peak impact force characteristic values under different widths of the bonded steel plates. With the increase in the width of the bonded steel plate, the peak value of the impact force remained unchanged. Figure 33 shows the peak displacement and residual displacement characteristic values under different widths of the bonded steel plates. With the increase in the width of the bonded steel plate, the peak value of the midspan displacement decreased from 82% to 78%, and the residual value decreased from 58.5% to 52%, both showing linear decay trends.
In summary, the changes in the width of the steel plate did not significantly improve the local contact stiffness of the impact point and had no effect on the impact force response, but they had a greater impact on the displacement response. A greater width of the bonded steel plate led to a better impact resistance of the beam.

4. Prediction of the Dynamic Responses

The impact height, impact mass, and thickness of the steel plate attached to the bottom all had a significant impact on the impact force response, whereas the length and width of the bonded steel plate had only a small impact. The impact mass m, the impact height h, and the thickness t of the bonded steel plate were the three parameters used in this study as independent variables.
The peak impact force responses under the effects of the three parameters were found to be nonlinear and to be positively correlated with the impact mass m and the impact height h, but they were negatively correlated with the thickness t of the bonded steel plate as demonstrated by Figure 14 and Figure 18, as well as the results of the drop weight impact tests. Therefore, the nonlinear regression formula of the peak impact force took the form of a power exponential function, as shown in Equation (2). Origin 2021 was used to perform multivariate nonlinear curve fitting for each design condition, and the values of the parameters α 1 α 4 were determined. Finally, the regression formula (Equation (3)) of the impact force peak value as a function of the impact mass, impact velocity, and thickness of the bonded steel was obtained. The correlation coefficient of this formula was R2 = 0.977. The working conditions used in the fitting of this formula and the fitting errors of the final formula are shown in Table 8. For comparison purposes, MAPE was used to represent the main peak value of the impact force after fitting.
F max = α 1 m α 2 h α 3 t α 4
F max = 1396.537 m 0.104 h 0.219 t 0.016
The thickness, length, and width modifications of the bonded steel plate had a significant impact on the displacement response. The development tendencies of the displacement–time history curves were primarily related to the impact height, impact mass, and the steel plate attached to the bottom. Therefore, five parameters were taken as independent variables: the impact mass m, the impact height h, the thickness t of the bonded steel plate, the length of the bonded steel plate hs, and the width of the bonded steel plate bs.
By analyzing the tests and Figure 20, Figure 24, Figure 28, and Figure 32, it was found that the responses of the characteristic values of the midspan displacement curves under the five parameters were quite different. The displacement peak values and residual values were positively correlated with the impact mass m and the impact height h, but negatively correlated with the thickness t, the length hs, and the width bs of the bonded steel plates. The nonlinear regression formula is shown in Equation (4), and nonlinear curve fitting was performed for each design condition. Finally, the nonlinear formulas of the midspan displacement peak value (Equation (5)) and the midspan displacement residual value (Equation (6)) were obtained. The correlation coefficients R2 were 0.994 and 0.964, respectively. Table 9 displays the working circumstances employed in this formula fitting, as well as the final formula fitting error. The fitting errors in Table 9 show that the displacement values produced using several formulas were lower than those from the numerical simulation. Therefore, from the perspective of safety, the safety factor β0 = 1.1 was introduced, and the formulas for the midspan displacement peak value (Equation (7)) and the midspan displacement residual value (Equation (8)) were obtained. The peak midspan displacement after fitting was represented by the MSE for comparison. The residual value of the midspan displacement following fitting was represented by the RMSE.
δ = β 1 m β 2 h β 3 t β 4 h s β 5 b s β 6
δ max = 2.618 m 0.746 h 0.54 t 0.06 h s 0.184 b s 0.212
δ rd = 14.63 m 0.911 h 0.724 t 0.1 h s 0.513 b s 0.336
δ max = 2.88 m 0.746 h 0.54 t 0.06 h s 0.184 b s 0.212
δ rd = 16.093 m 0.911 h 0.724 t 0.1 h s 0.513 b s 0.336

5. Conclusions

In this paper, a comparison of the experimental data and finite element results was first carried out for a PC beam to assess the validity of the model. The finite element analysis software LS-DYNA and the function drawing software Origin were then used to complete the parameter analyses on the PC beams under impact load, and the dynamic response calculation formulas of the parameters with the greatest influence were fitted. The conclusions of the study can be drawn as follows:
(1)
The finite element model was able to accurately reflect the damage form and dynamic responses of bonded reinforced PC beams under impact loading. Comparing the peak impact forces, peak midspan displacements, and residual values from the finite element simulation with the test results, the average relative errors were 11.9%, −0.09%, and 0.94%, verifying the correctness and validity of the finite element models.
(2)
The primary and secondary peak parts of the impact lasted longer due to the increases in the impact mass and height, which also resulted in more localized damage and overall damage to the PC beam. These effects also improved the local contact stiffness of the impact interface.
(3)
Although the local contact stiffness of the impact point was not increased by changing the length of the bonded steel plate, it had a considerable effect on the displacement and the reaction of the impact force. The peak value of the midspan displacement decreased from 32.7 to 31.2 mm and the residual value of the midspan displacement decreased from 23.9 to 20.8 mm as the length of the bonded steel plate increased, substantially reducing the test beam’s damage from the impact force.
(4)
Although the impact point’s local contact stiffness was not increased and the impact force response was unaffected, the breadth of the bonded steel plate significantly changed the displacement response. A wider bonded steel plate led to a greater impact resistance of the beam and lower midspan displacement peak and residual values. Specifically, the midspan residual displacement decreased from 23.4 to 20.8 mm, and the peak midspan displacement decreased from 32.8 to 31.2 mm.
(5)
Using Origin 2021 software, regression analysis was carried out on the formulas of the peak impact force, revealing the peak and residual values of the midspan displacements of the PC beams strengthened with bonded steel plates under impact load. The regression formula was finally obtained. Comparing the results of the fitted calculations with those of the finite element modeling, it was found that the average relative error in the main peak value of the impact force was 0.35%, the average relative error in the peak midspan displacement was 0.09%, and the average relative error in the midspan residual displacement was 0.02%, proving the correctness of the fitted equations.

Author Contributions

Project administration, X.Y.; resources, X.Y.; supervision, X.Y.; formal analysis, C.L.; investigation, C.L.; writing—original draft, C.L.; writing—review and editing, X.L. and T.Z.; data curation, H.M. and S.S.; All authors have read and agreed to the published version of the manuscript.

Funding

The authors would like to acknowledge the financial support from the National Natural Science Foundation of China [No. 52278490], the Science and Technology Planning Project of Fujian [No. 2022Y3001, 2022-K-221], and the Science and Technology Planning Project of Fuzhou [No. 2021-Y-082].

Data Availability Statement

Not applicable.

Conflicts of Interest

The authors declare no conflict of interest.

References

  1. Zhou, X.W.; Wang, X.Y.; Zhang, R.C.; Zhang, G.X.; Xiong, R.S. An experimental study of the effects of different reinforcement ratios on the impact resistance behaviors of reinforced concrete beams. J. Test. Eval. 2020, 48, 2162–2184. [Google Scholar] [CrossRef]
  2. Yoo, D.Y.; Banthia, N.; Kim, S.W.; Yoon, Y.S. Response of ultra-high-performance fiber-reinforced concrete beams with continuous steel reinforcement subjected to low-velocity impact loading. Compos. Struct. 2015, 126, 233–245. [Google Scholar] [CrossRef]
  3. Yoo, D.Y.; Banthia, N.; Yoon, Y.S. Impact resistance of reinforced ultra-high-performance concrete beams with different steel fibers. Am. Concr. Inst. Struct. J. 2017, 114, 113–124. [Google Scholar] [CrossRef]
  4. Jin, L.; Xu, J.D.; Zhang, R.B.; Du, X.L. Numerical study on the impact performances of reinforced concrete beams: A mesoscopic simulation method. Eng. Fail. Anal. 2017, 80, 141–163. [Google Scholar] [CrossRef]
  5. Yu, Y.; Lee, S.; Cho, J.Y. Deflection of reinforced concrete beam under low-velocity impact loads. Int. J. Impact. Eng. 2021, 154, 103878. [Google Scholar] [CrossRef]
  6. Ulzurrun GS, D.; Zanuy, C. Enhancement of impact performance of reinforced concrete beams without stirrups by adding steel fibers. Constr. Build. Mater. 2017, 145, 166–182. [Google Scholar] [CrossRef]
  7. Mao, L.; Barnett, S.J. Investigation of toughness of ultra high performance fibre reinforced concrete (UHPFRC) beam under impact loading. Int. J. Impact. Eng. 2017, 99, 26–38. [Google Scholar] [CrossRef] [Green Version]
  8. Wongmatar, P.; Hansapinyo, C.; Vimonsatit, V.; Chen, W.S. Recommendations for designing reinforced concrete beams against low velocity impact loads. Int. J. Struct. Stab. Dy. 2018, 18, 1850104. [Google Scholar] [CrossRef]
  9. Hwang, H.J.; Kang, T.H.K.; Kim, C.S. Numerical model for flexural behavior of reinforced concrete members subjected to low-velocity impact loads. ACI Struct. J. 2019, 116, 65–76. [Google Scholar] [CrossRef]
  10. Guo, L.; Mao, R.W.; Liu, Z.F.; Li, S.Q.; Wu, G.Y.; Wang, Z.H. Dynamic large deflection response of RC beams under low-speed impact loading. Shock Vib. 2020, 2020, 8812890. [Google Scholar] [CrossRef]
  11. Pham, T.M.; Hao, H. Influence of global stiffness and equivalent model on prediction of impact response of RC beams. Int. J. Impact Eng. 2017, 113, 88–97. [Google Scholar] [CrossRef] [Green Version]
  12. Adhikary, S.D.; Li, B. Simplified analytical models to predict low-velocity impact response of RC beams. Pract. Period. Struct. Des. Constr. 2018, 23, 04018002. [Google Scholar] [CrossRef]
  13. Zhao, W.C.; Qian, J.; Jia, P.Z. Peak response prediction for RC beams under impact loading. Shock Vib. 2019, 2019, 6813693. [Google Scholar] [CrossRef] [Green Version]
  14. Yong AC, Y.; Lam NT, K.; Menegon, S.J. Closed-form expressions for improved impact resistant design of reinforced concrete beams. Structures 2021, 29, 1828–1836. [Google Scholar] [CrossRef]
  15. Khouzam, D.; Elnemr, A.M.; Khattab, E.A.; Hanna, N. Comparison between strengthening of reinforced concrete beams using steel plates and double FRCM layers. Adv. Eng. Mater. Struct. Syst. Innov. Mech. Appl. 2019, 386, 2238–2244. [Google Scholar]
  16. Thamrin, R.; Sari, R.P. Flexural capacity of strengthened reinforced concrete beams with web bonded steel plates. Procedia Eng. 2017, 171, 1129–1136. [Google Scholar] [CrossRef]
  17. Alwis AD, D.; Fernando WJ, B.S.; Mendis, P.; Hettiarachchi, D.; Weerasinghe WP, M. Analysis and design of steel plate composite beams for shear. ICSBE 2020, 174, 355–362. [Google Scholar]
Figure 1. Schematic of the drop weight impact test setup.
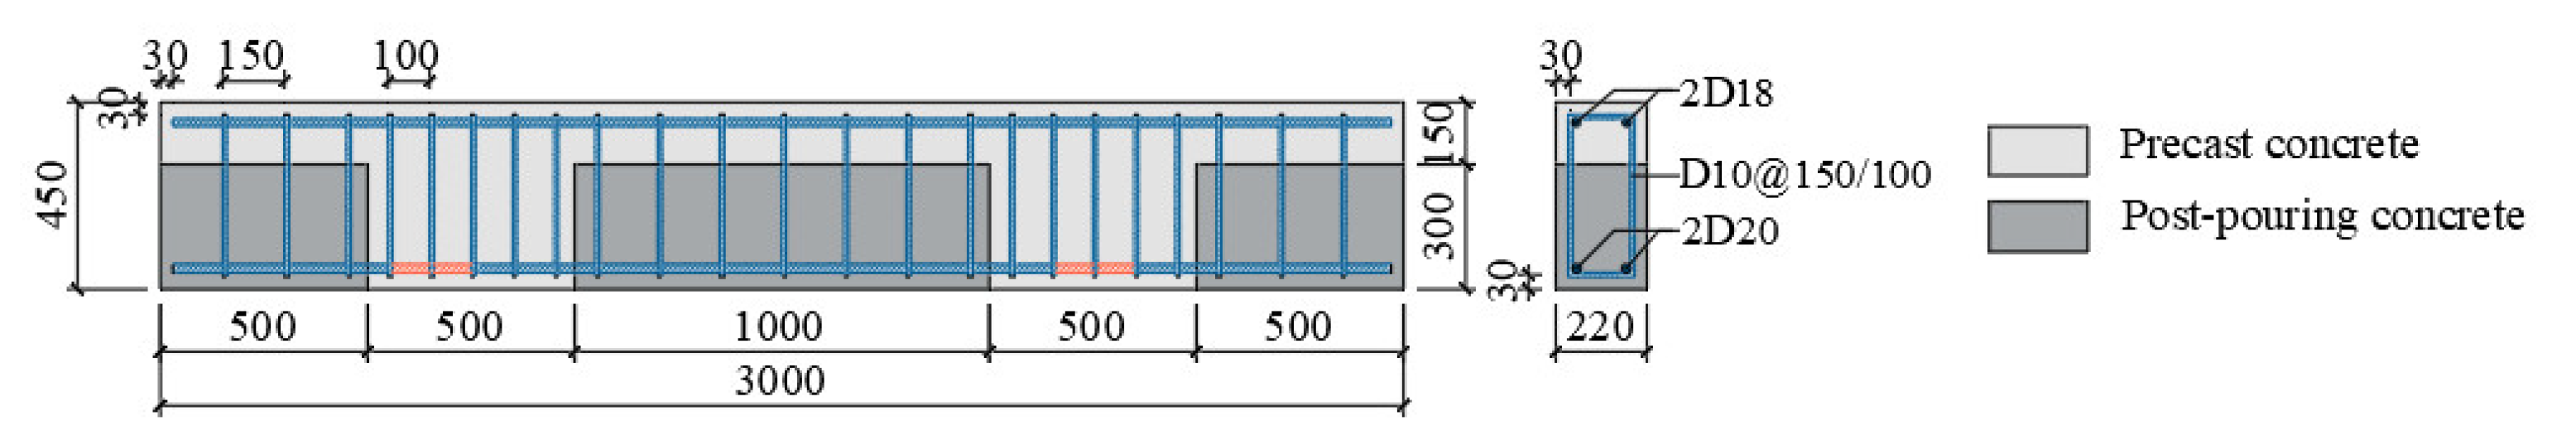
Buildings 13 00696 g001
Figure 2. The details of the concrete and reinforcement for the PC beam: side view (unit: mm).
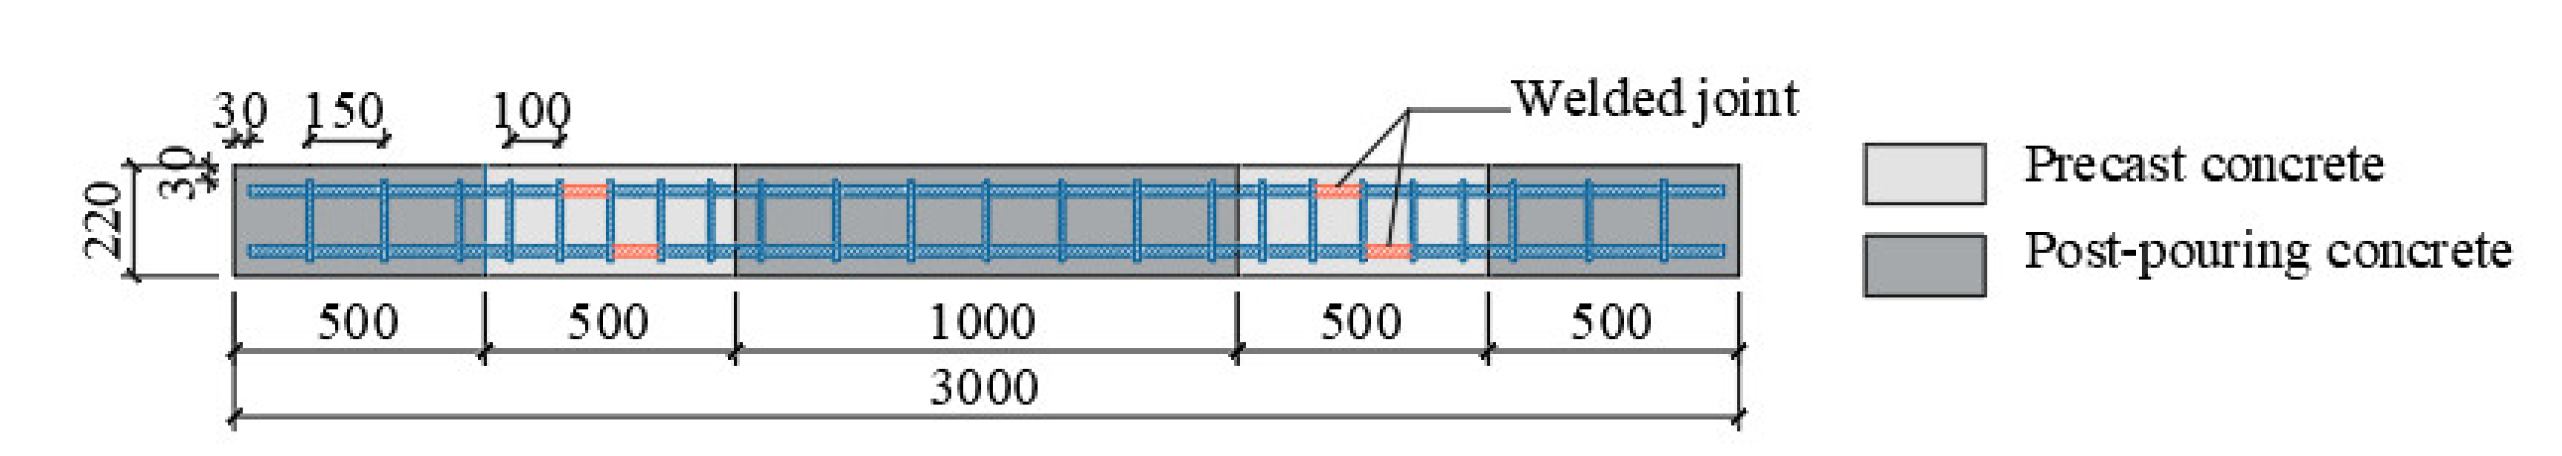
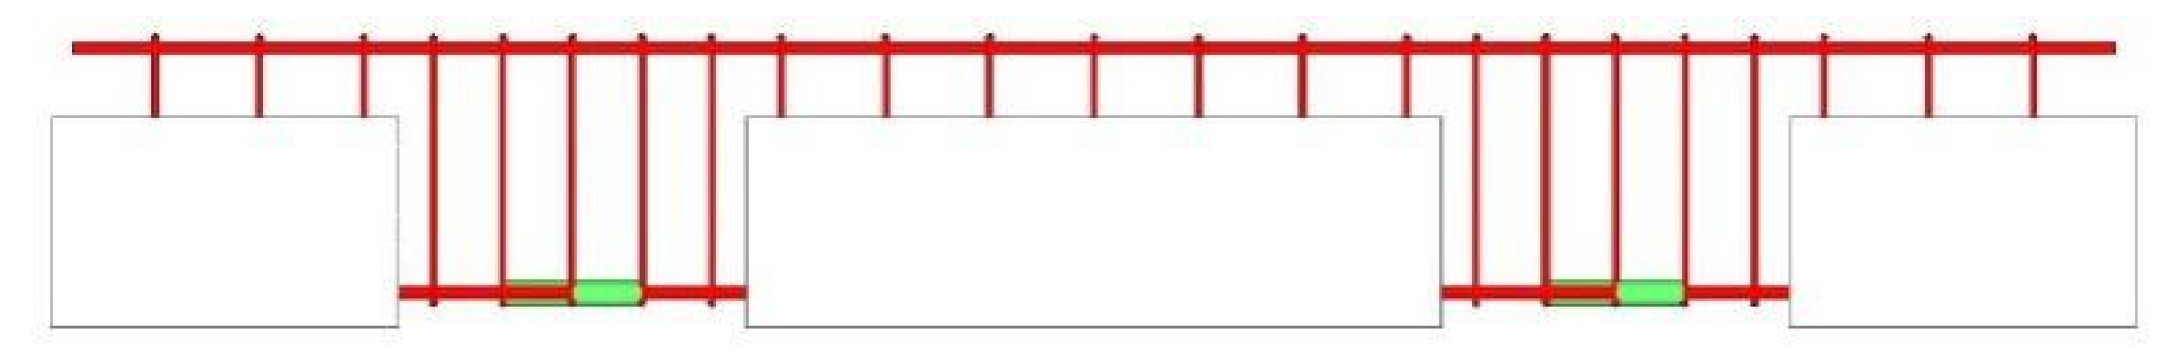
Buildings 13 00696 g002
Figure 3. PC beam reinforcement welding joint positions: plane view (unit: mm).
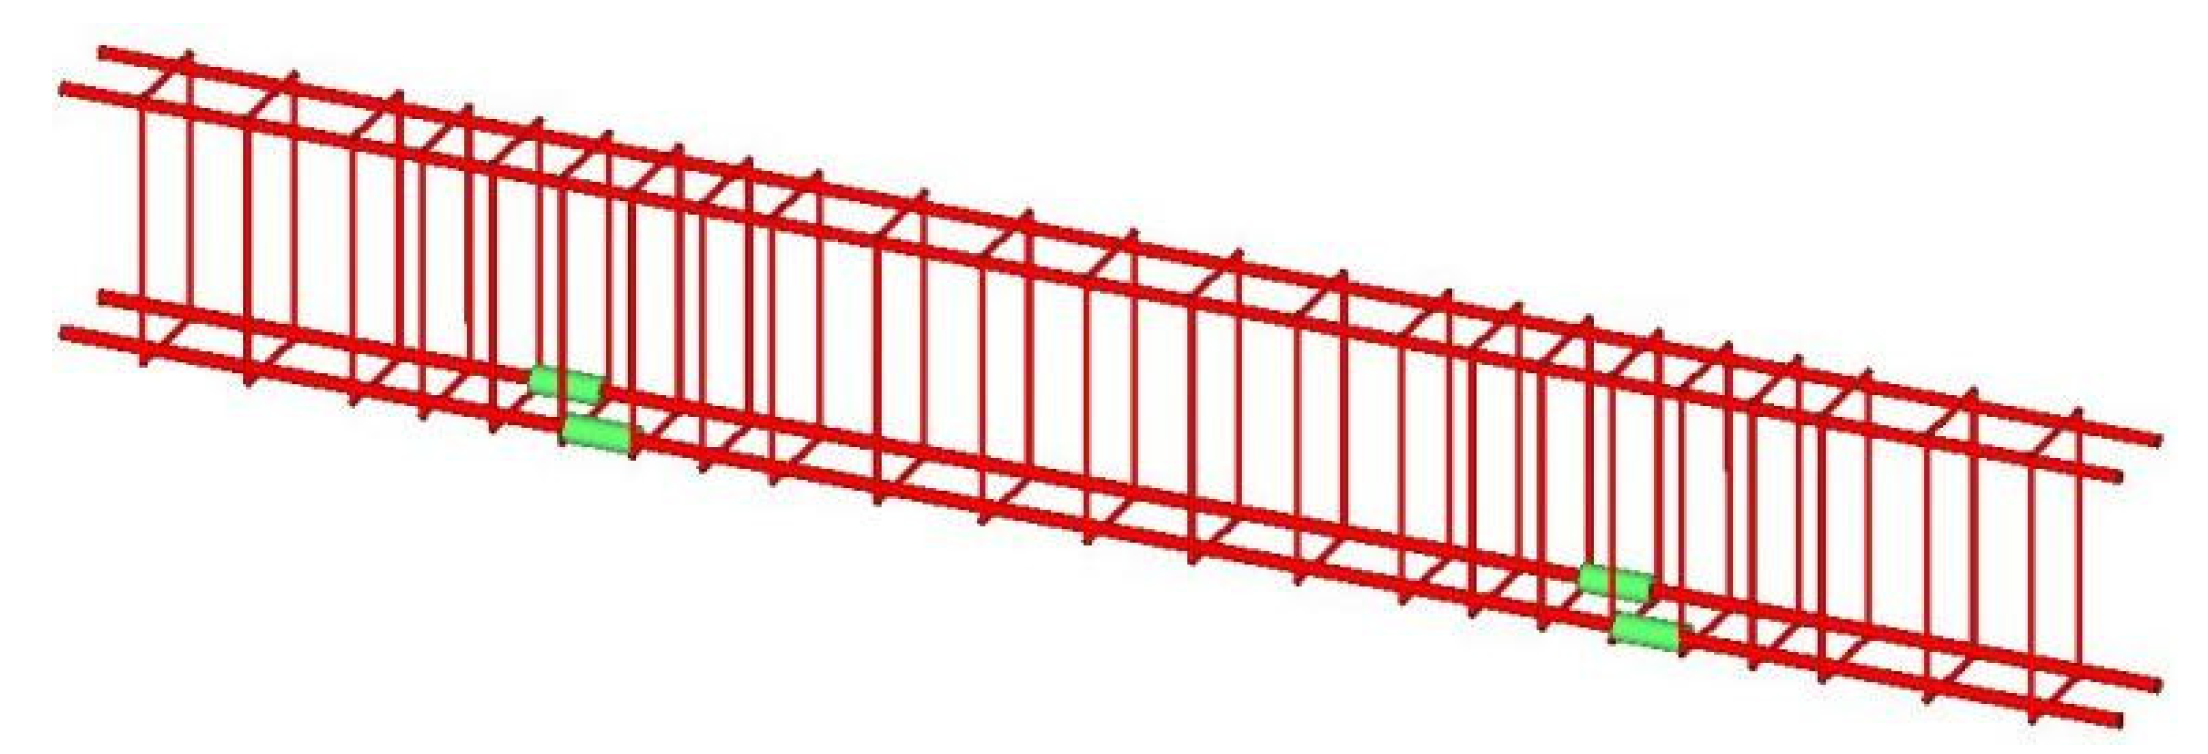
Buildings 13 00696 g003
Figure 4. Reinforcement frame of the PC beam.
Buildings 13 00696 g004
Figure 5. Splicing position of the PC beam.
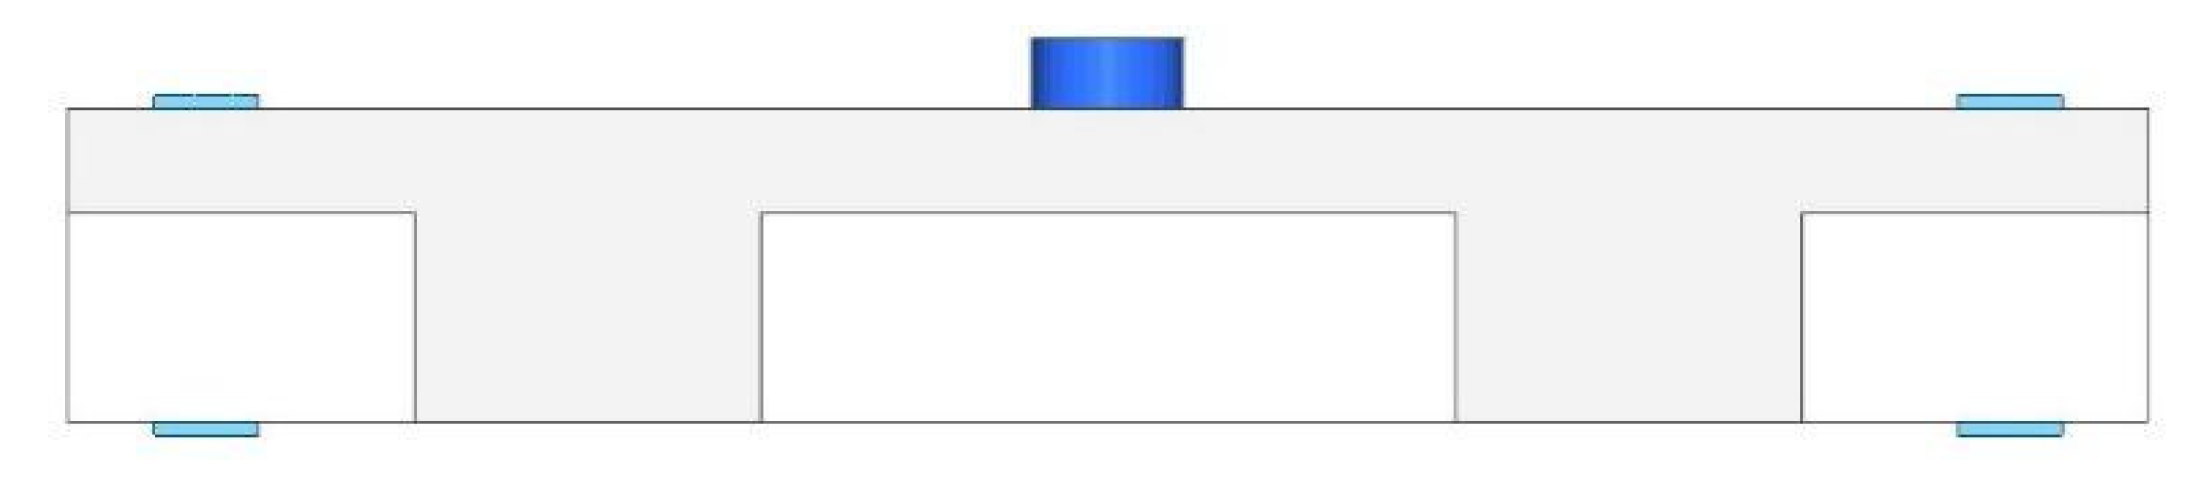
Buildings 13 00696 g005
Figure 6. Drop-hammer impact model of the PC beam.
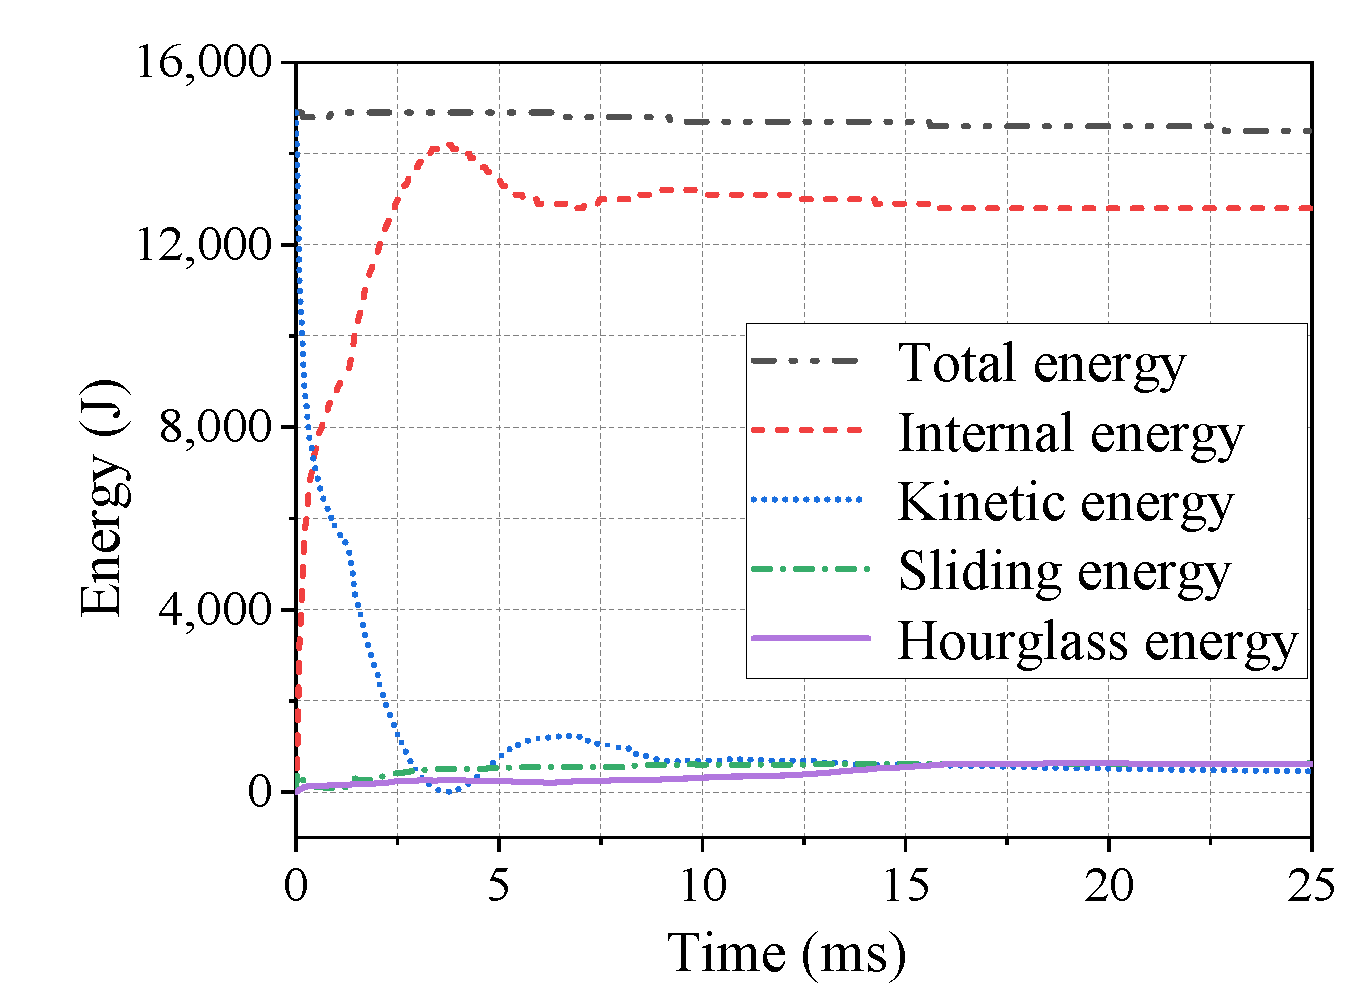
Buildings 13 00696 g006
Figure 7. Energy conversion curve.
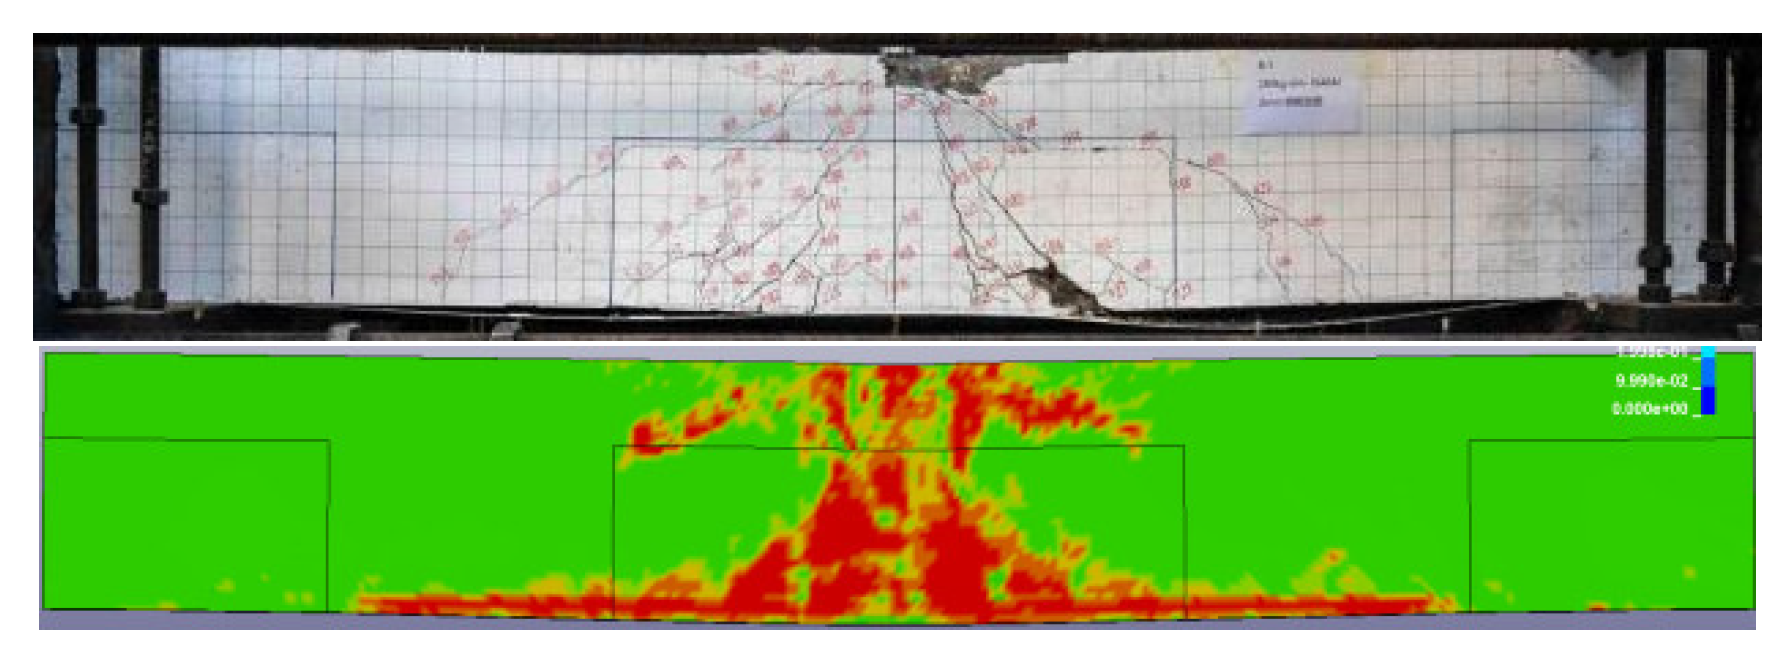
Buildings 13 00696 g007
Figure 8. Comparison of the damage patterns.
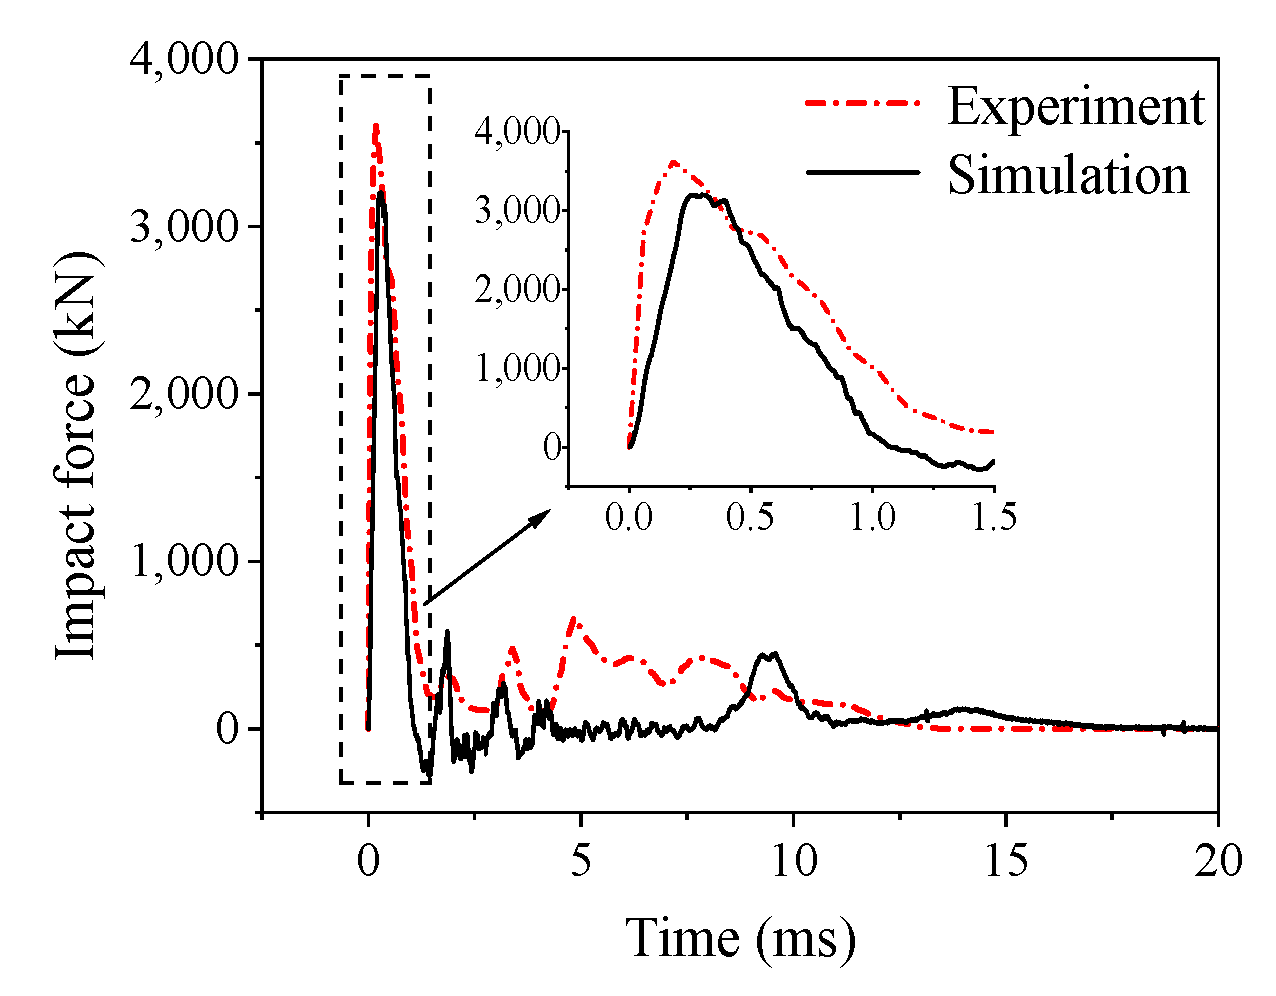
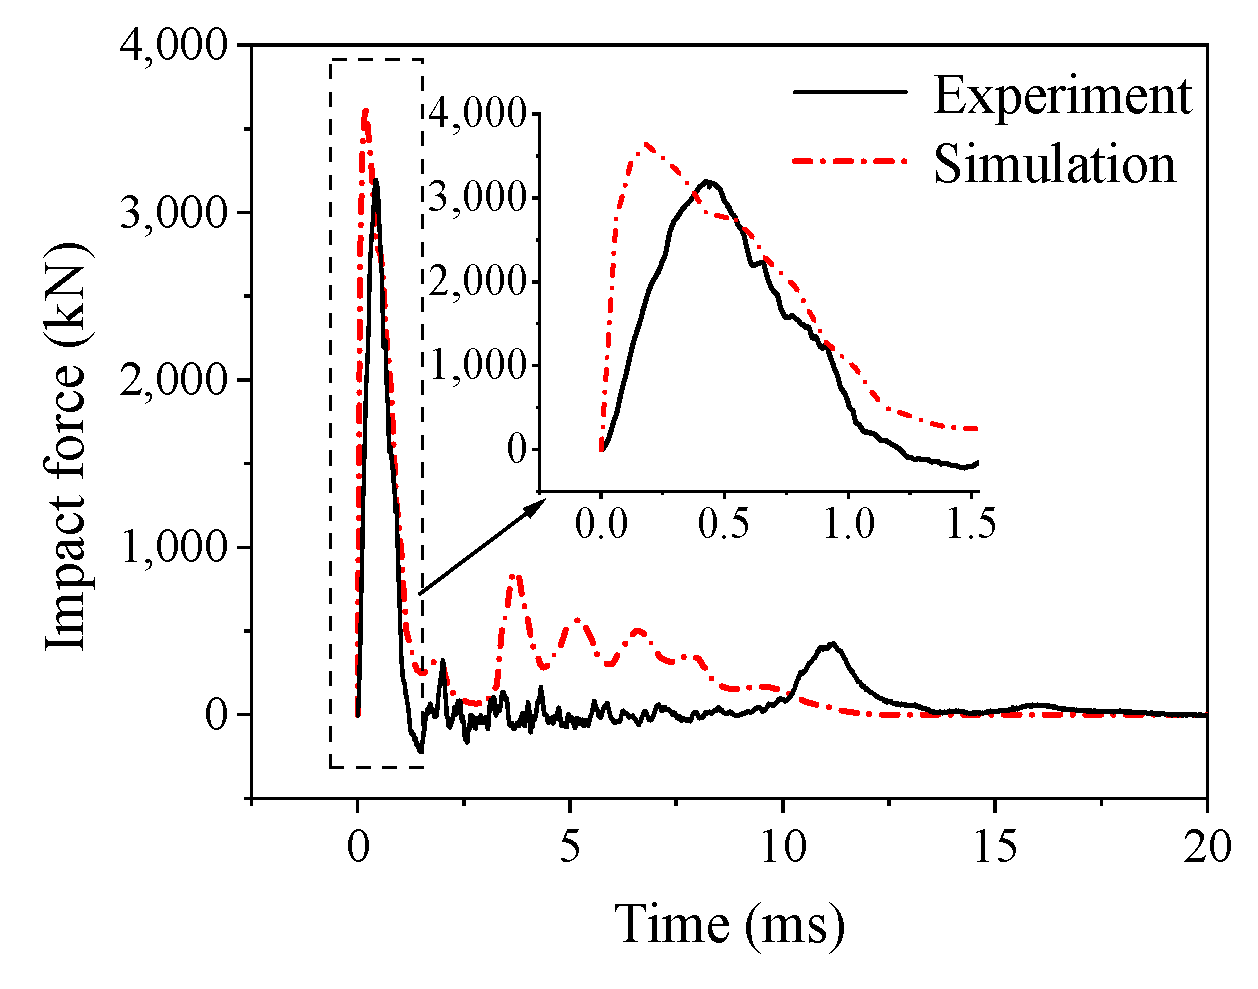
Buildings 13 00696 g008
Figure 9. Comparison of the impact force–time history curves (beam B1).
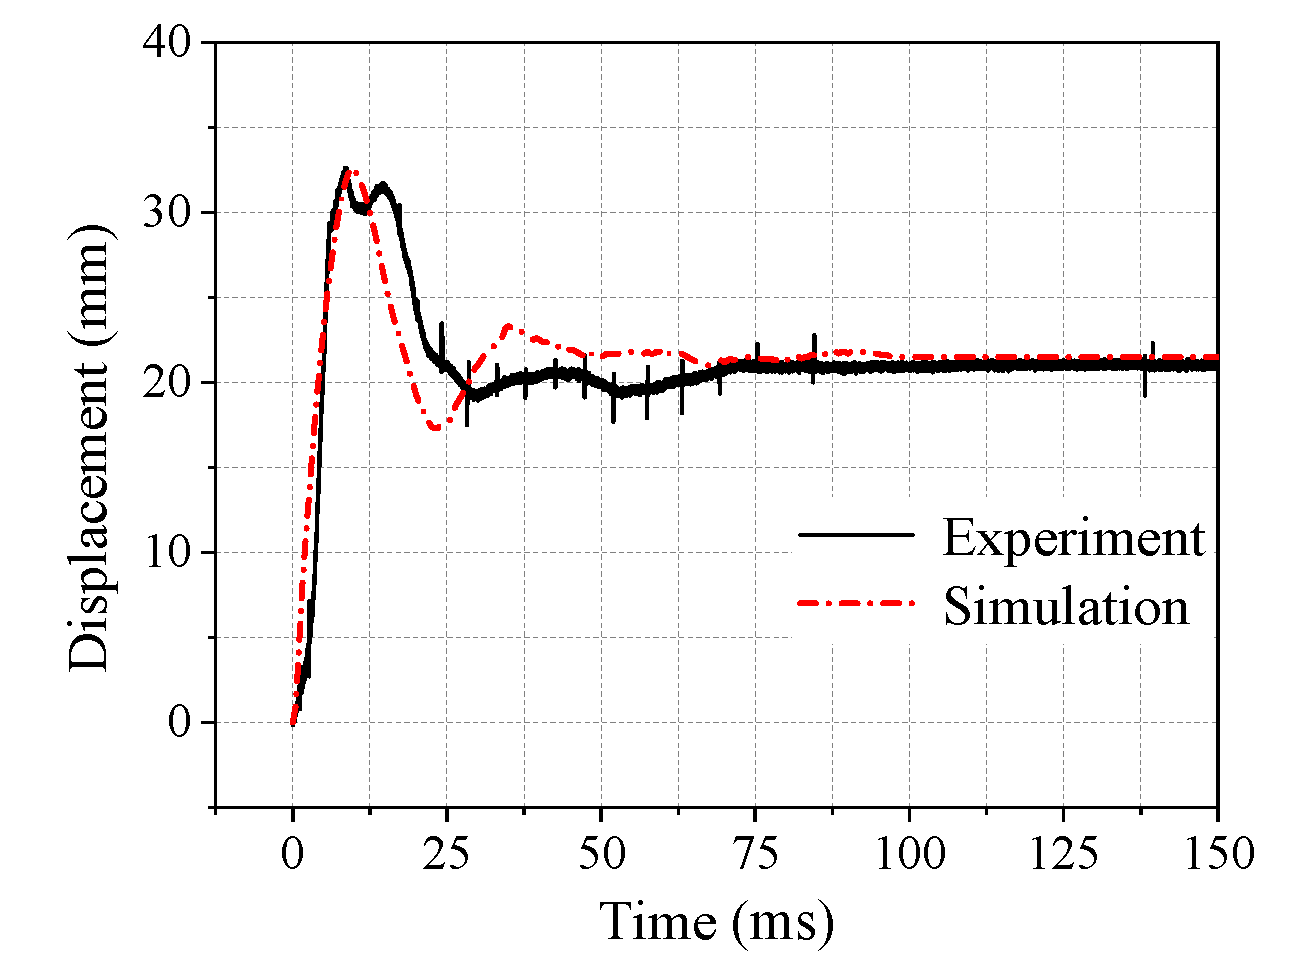
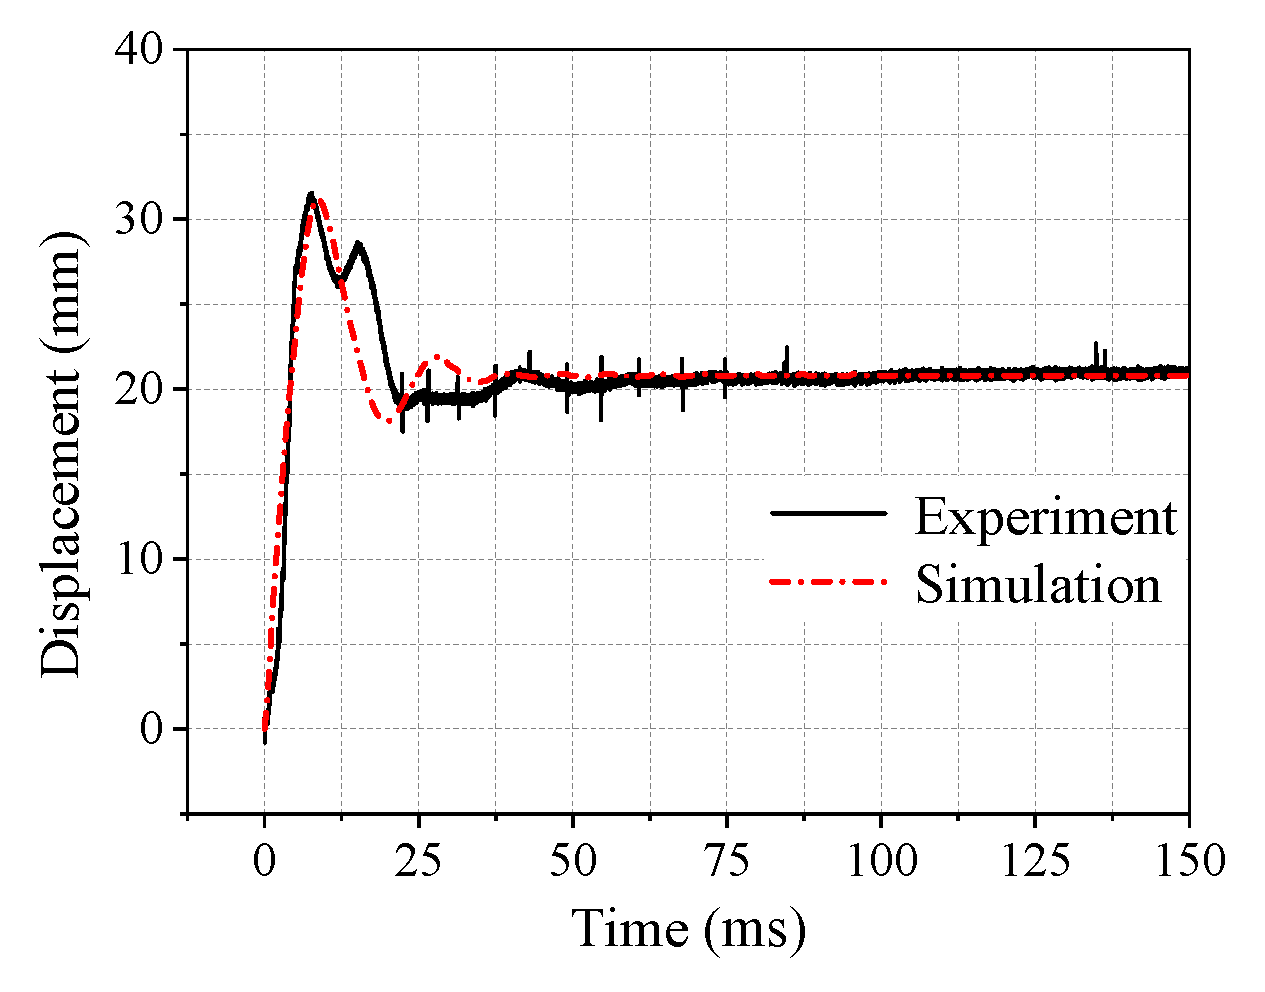
Buildings 13 00696 g009
Figure 10. Comparison of the midspan displacement–time history curves (beam B1).
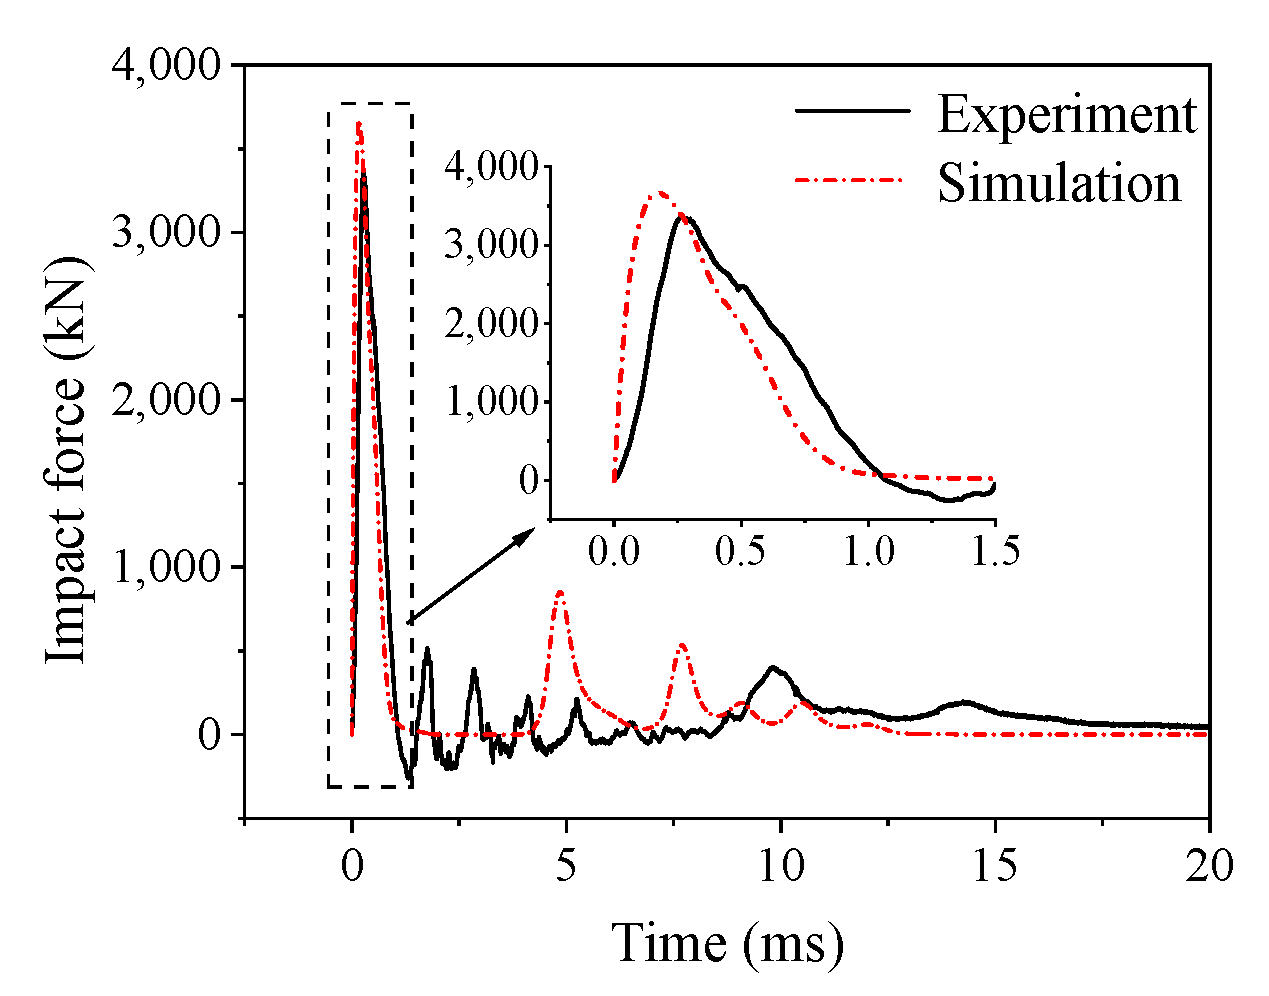
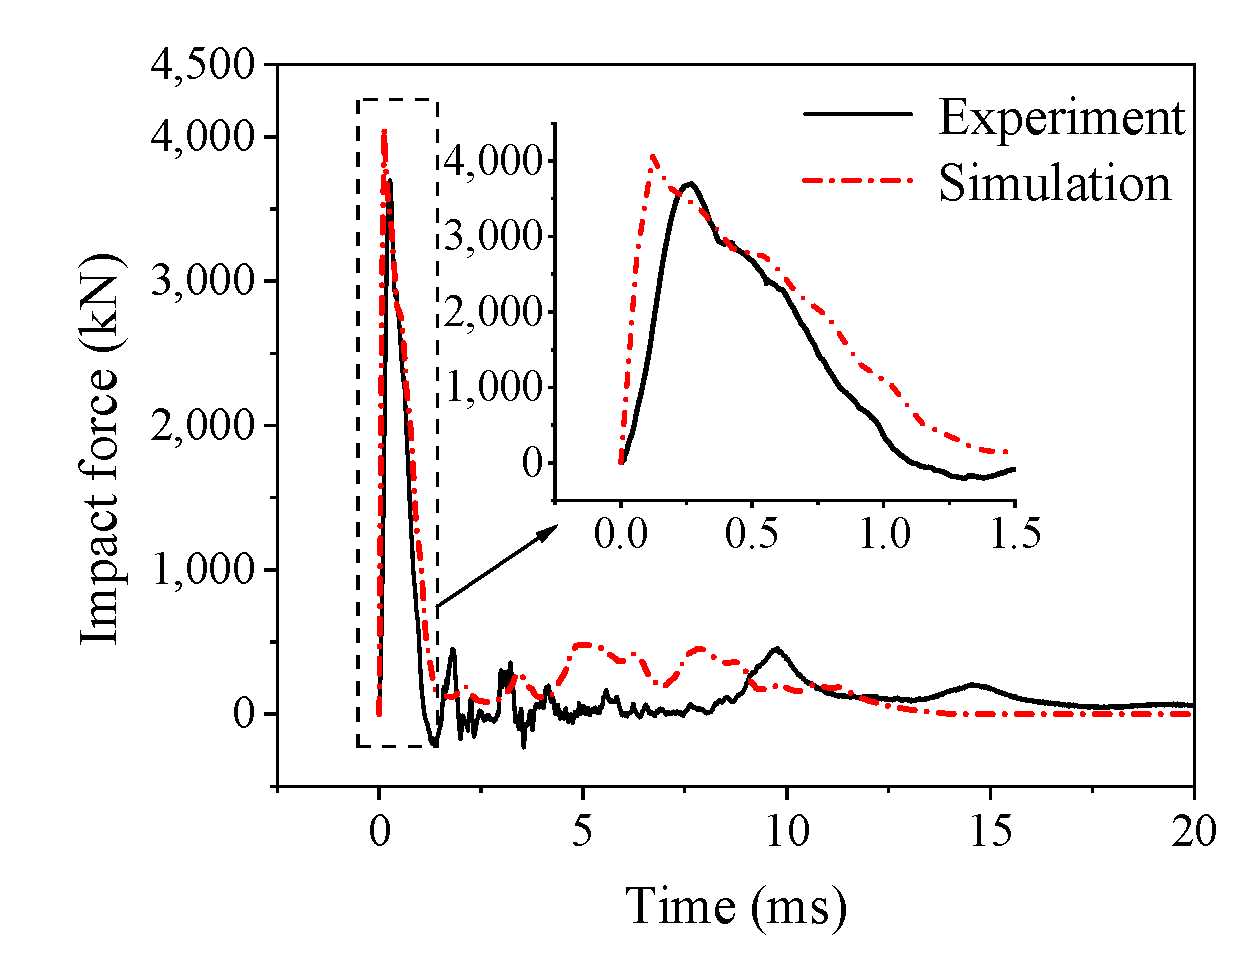
Buildings 13 00696 g010
Figure 11. Comparison of the impact force−time history curves (beam A1).
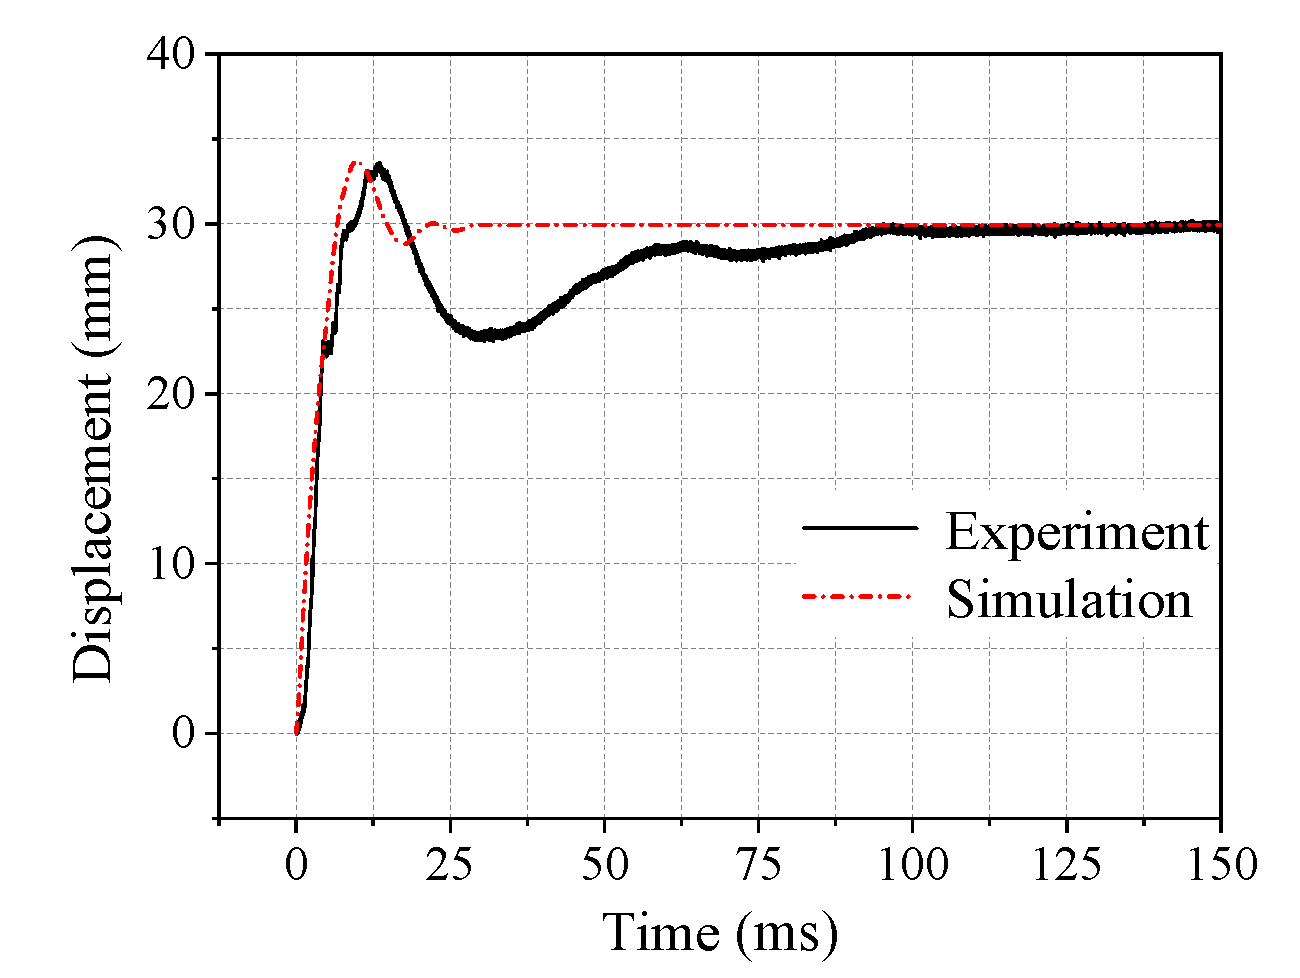
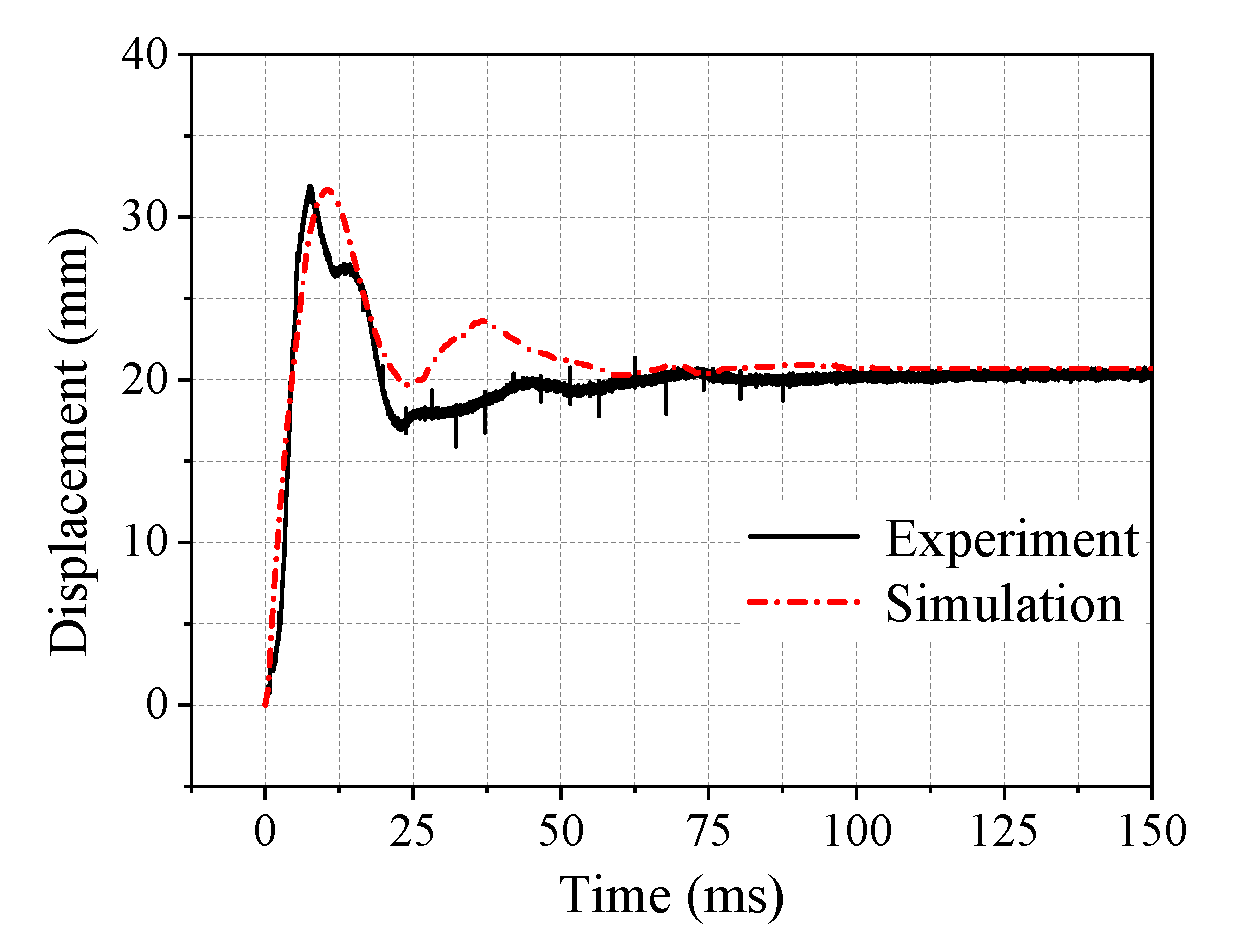
Buildings 13 00696 g011
Figure 12. Comparison of the midspan displacement−time history curves (beam A1).
Buildings 13 00696 g012
Figure 13. Comparison of the impact force−time history curves (beam B2).
Buildings 13 00696 g013
Figure 14. Comparison of the midspan displacement−time history curves (beam B2).
Buildings 13 00696 g014
Figure 15. Comparison of the impact force−time history curves (beam B3).
Buildings 13 00696 g015
Figure 16. Comparison of the midspan displacement−time history curves (beam B3).
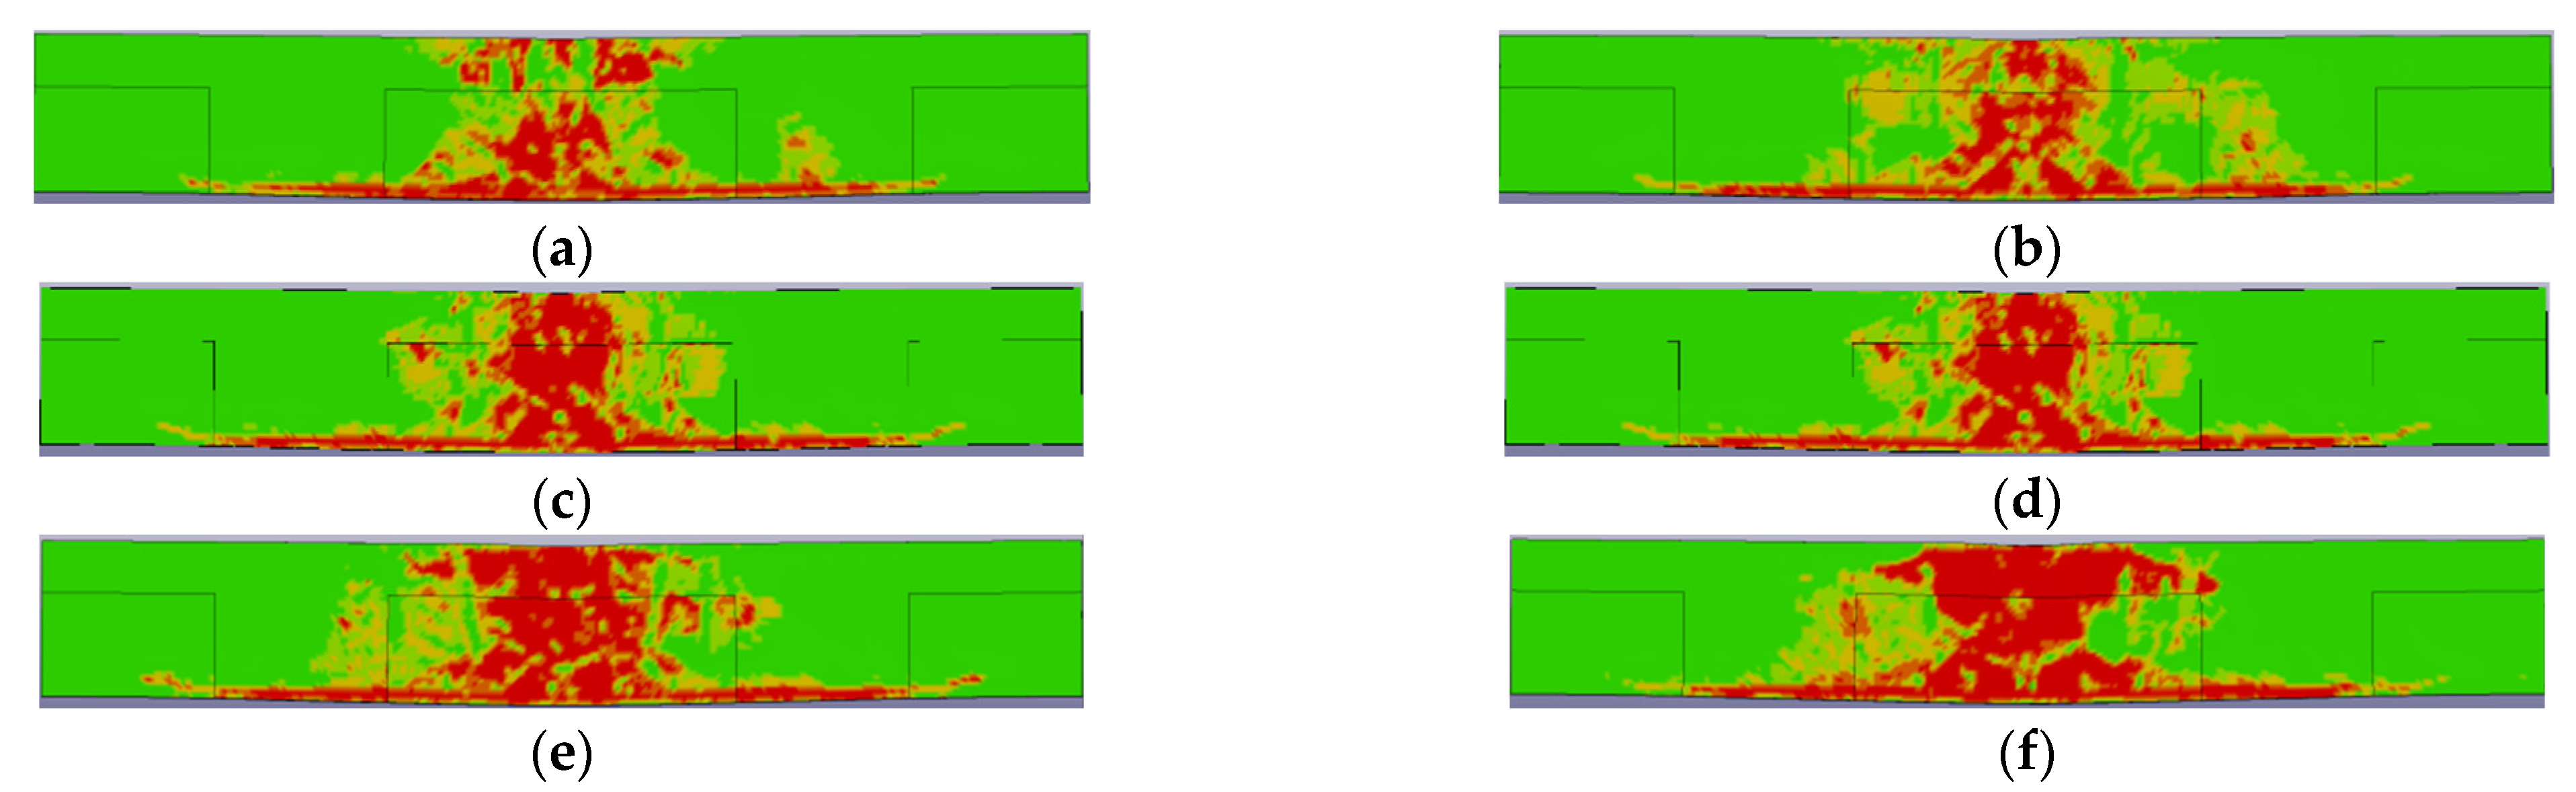
Buildings 13 00696 g016
Figure 17. Equivalent plastic strain contours under different impact masses: (a) B-M130; (b) B-M180; (c) B-M230; (d) B-M280; (e) B-M330; (f) B-M380; (g) B-M430.
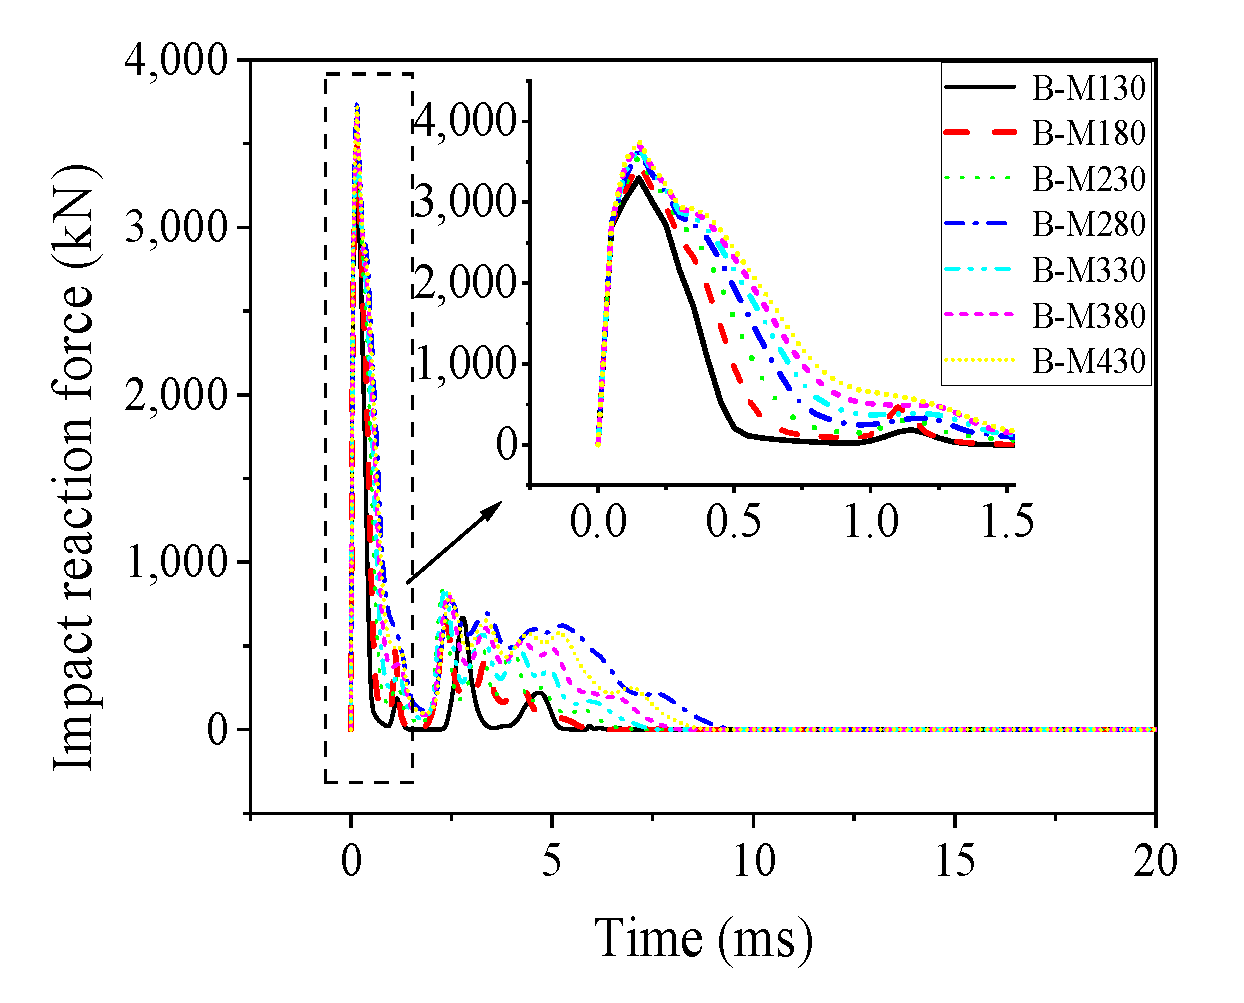
Buildings 13 00696 g017
Figure 18. Impact force–time history curves under different impact masses.
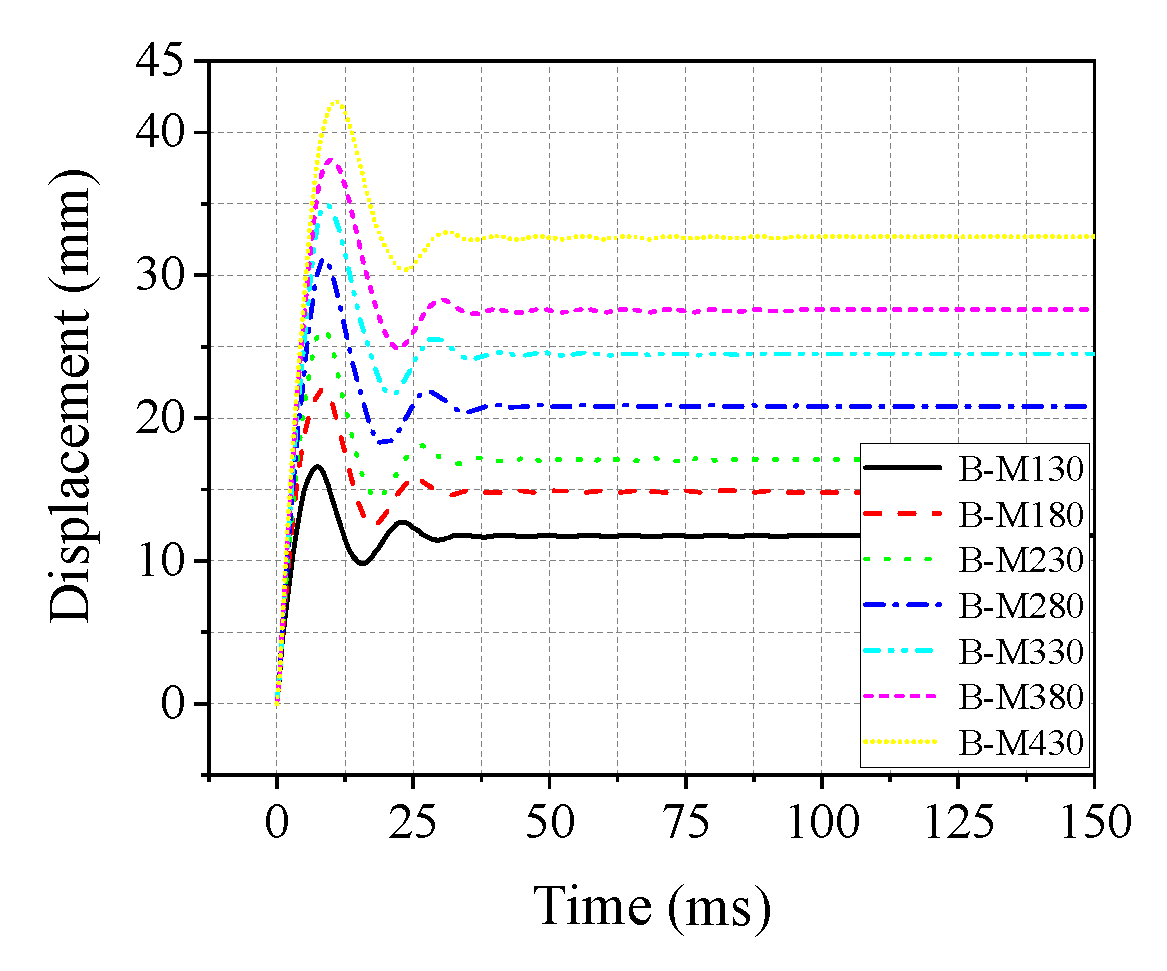
Buildings 13 00696 g018
Figure 19. Midspan displacement–time history curves under different impact masses.
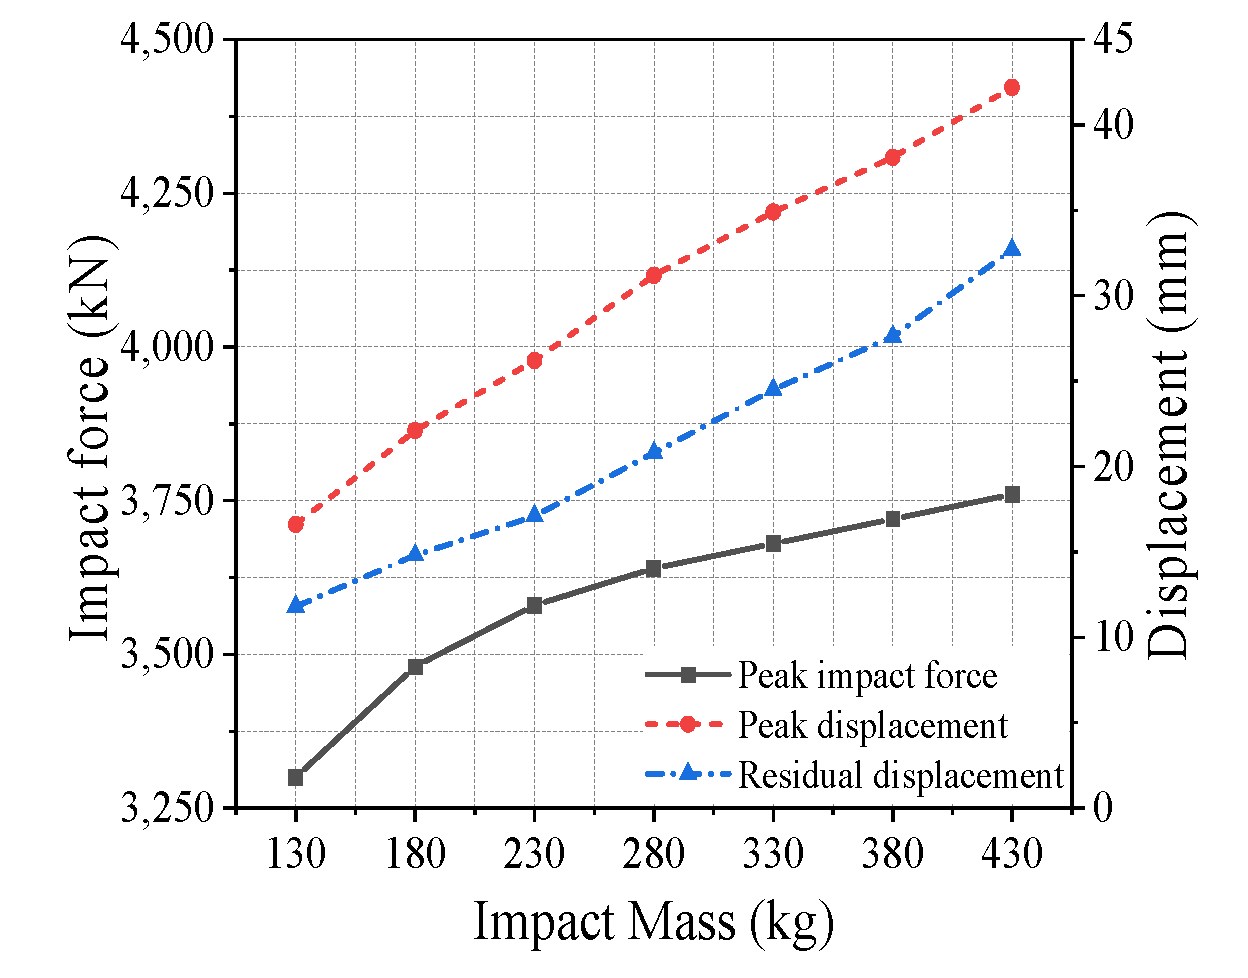
Buildings 13 00696 g019
Figure 20. Variations of the dynamic response characteristic values under different impact masses.
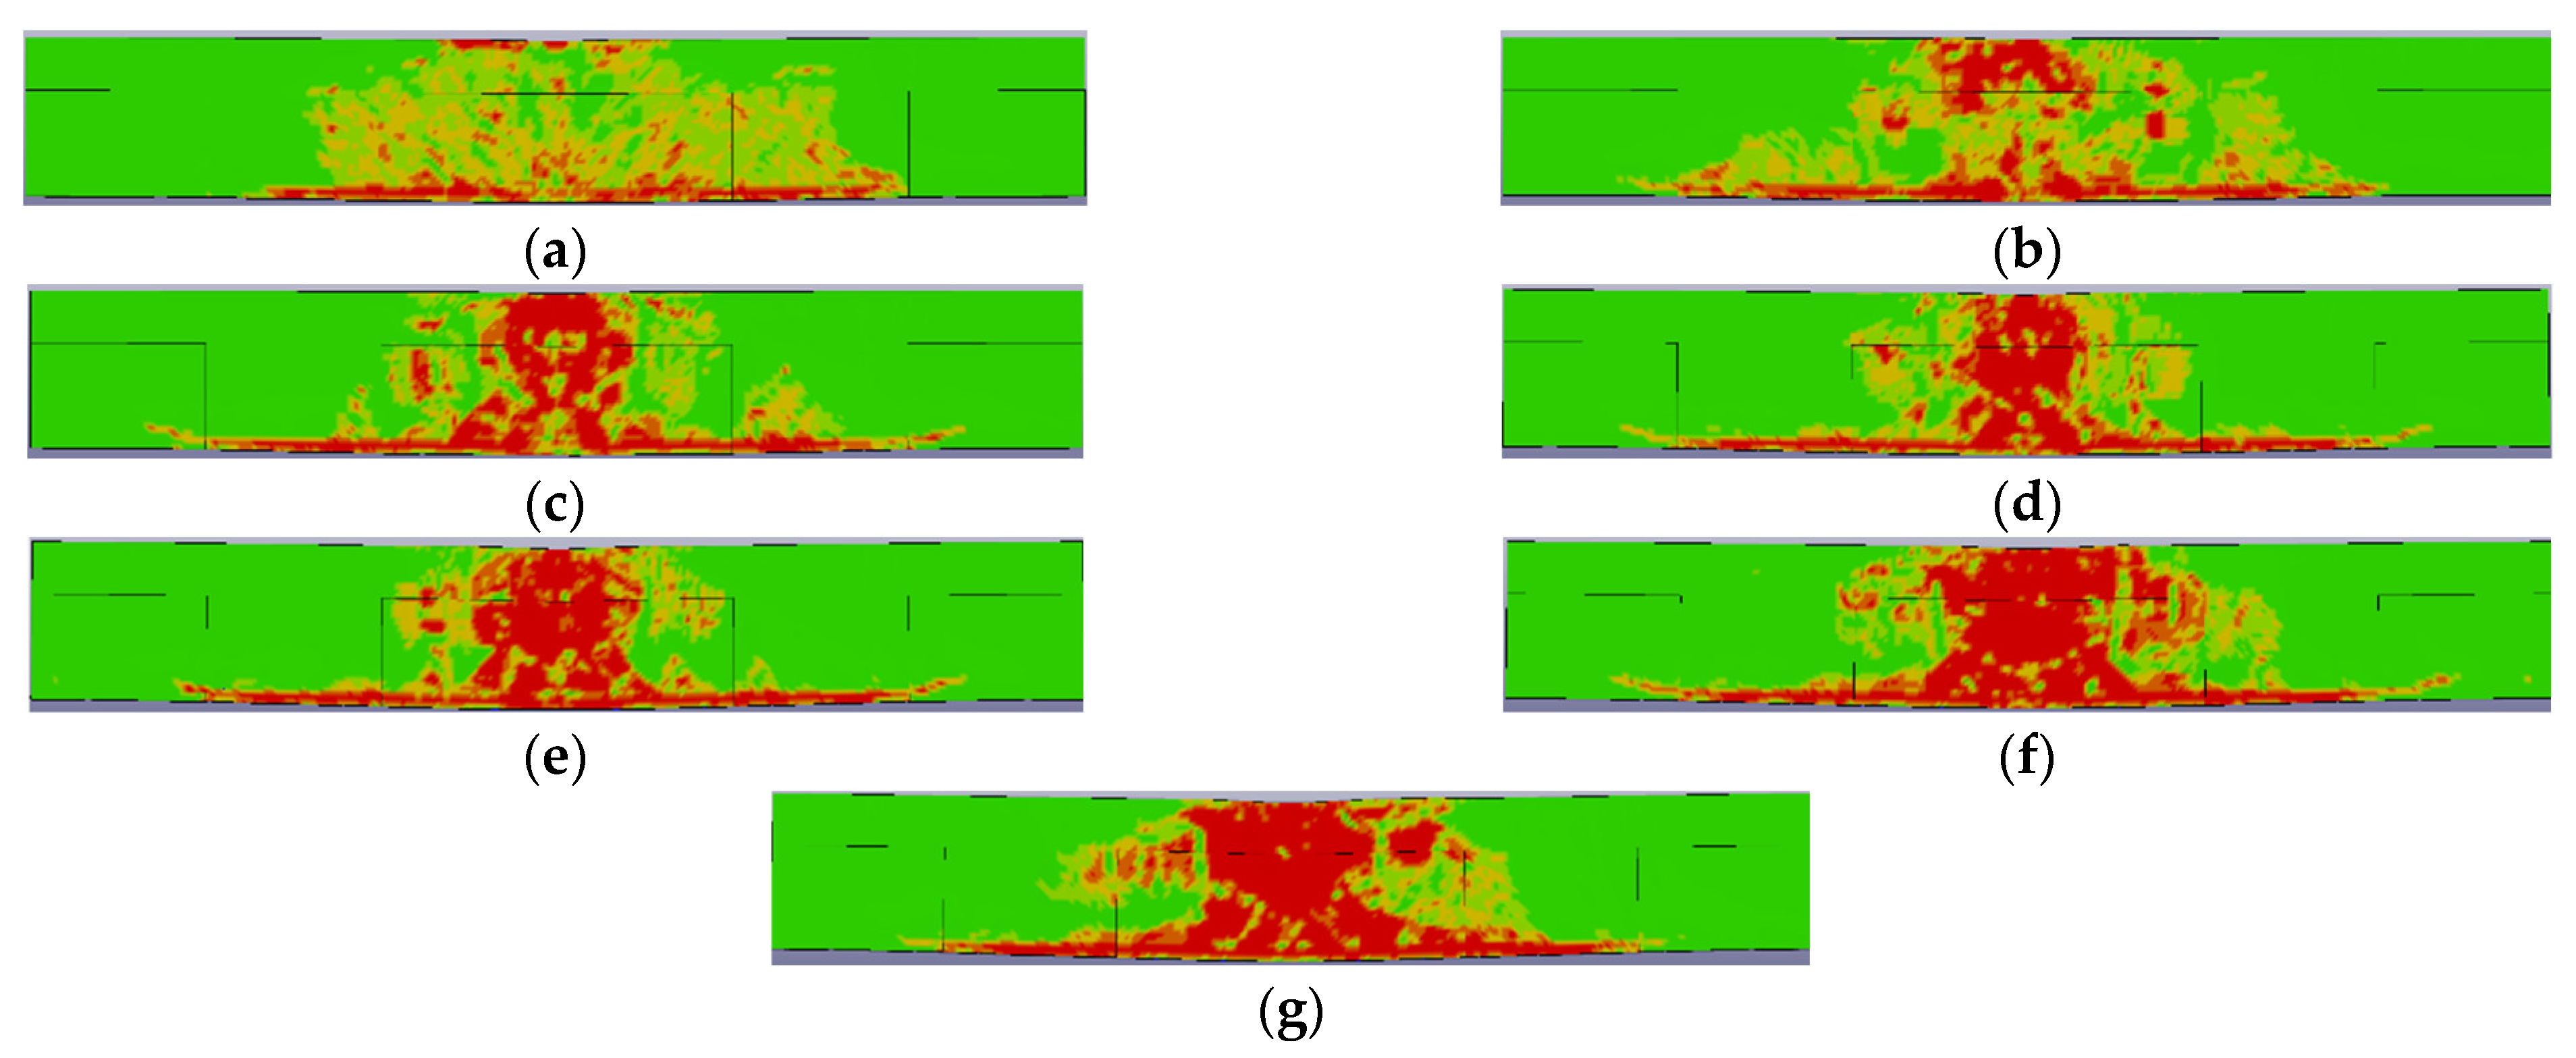
Buildings 13 00696 g020
Figure 21. Equivalent plastic strain contours under different impact heights: (a) B-IH4; (b) B-IH5; (c) B-IH6; (d) B-IH7; (e) B-IH8; (f) B-IH9.
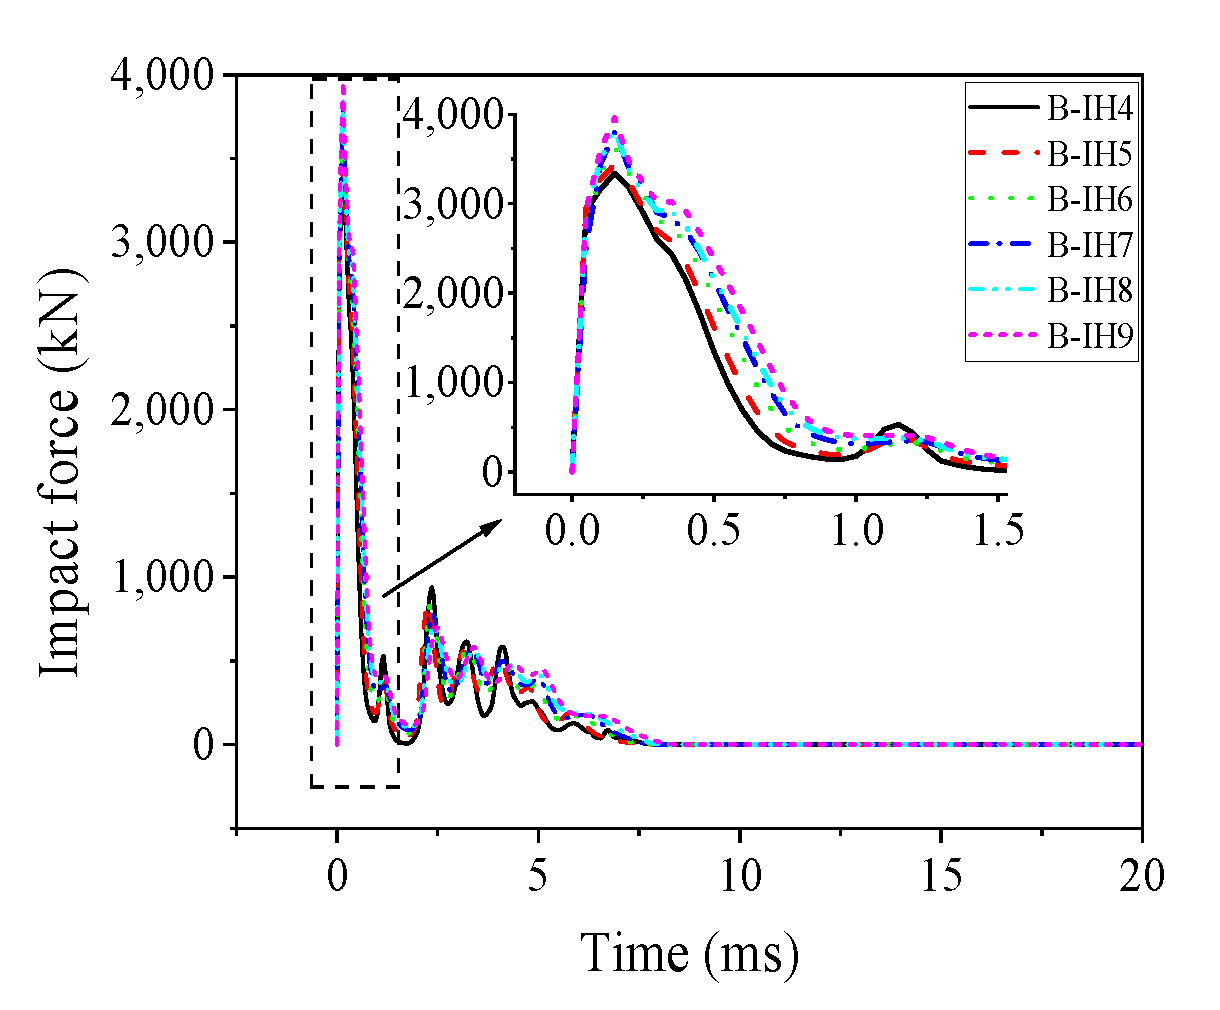
Buildings 13 00696 g021
Figure 22. Impact force–time history curves under different impact heights.
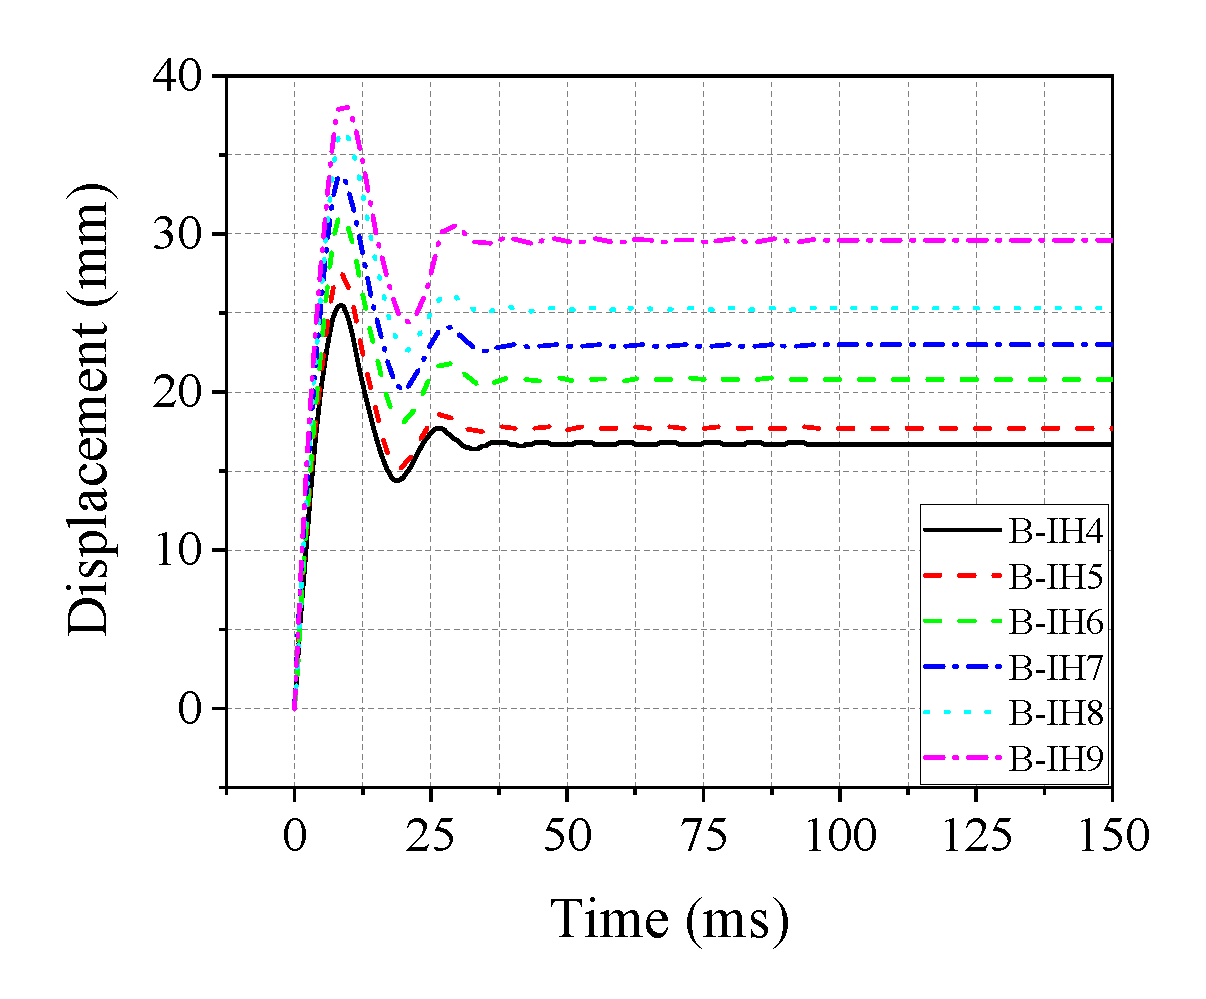
Buildings 13 00696 g022
Figure 23. Midspan displacement–time history curves under different impact heights.
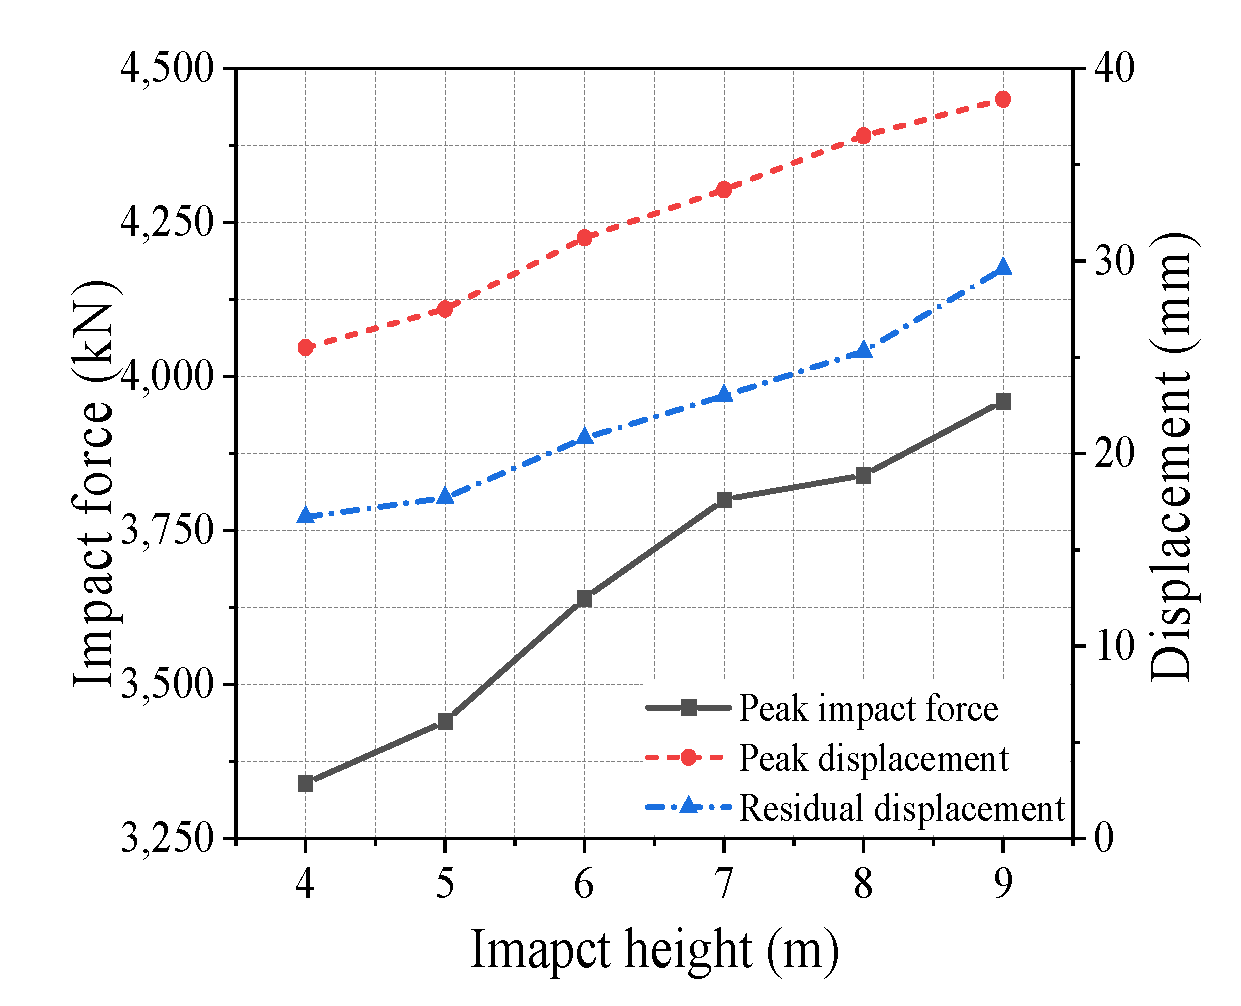
Buildings 13 00696 g023
Figure 24. Variations of the dynamic response characteristic values under different impact heights.
Buildings 13 00696 g024
Figure 25. Equivalent plastic strain contours under different lengths of the bonded steel plates: (a) B-h2100; (b) B-h2250; (c) B-h2400; (d) B-h2550; (e) B-h2700; (f) B-h2850; (g) B-h3000.
Buildings 13 00696 g025
Figure 26. Impact force–time history curves under different lengths of the bonded steel plates.
Buildings 13 00696 g026
Figure 27. Midspan displacement–time history curves under different lengths of the bonded steel plates.
Buildings 13 00696 g027
Figure 28. Variations of the dynamic response characteristic values under different lengths of the bonded steel plates.
Buildings 13 00696 g028
Figure 29. Equivalent plastic strain contours under different widths of the bonded steel plates: (a) B-h2100; (b) B-h2250; (c) B-h2400; (d) B-h2550; (e) B-h2700.
Buildings 13 00696 g029
Figure 30. Impact force–time history curves under different widths of the bonded steel plates.
Buildings 13 00696 g030
Figure 31. Midspan displacement–time history curves under different widths of the bonded steel plates.
Buildings 13 00696 g031
Figure 32. Peak impact force characteristic values under different widths of the bonded steel plates.
Buildings 13 00696 g032
Figure 33. Peak displacement and residual displacement characteristic values under different widths of the bonded steel plates.
Buildings 13 00696 g033
Table 1. Constitutive model parameters.
*MAT_RIGID*MAT_PLASTIC_KINEMATIC*MAT_CSCM_CONCRETE
Density/ ρ 7.85 × 10 9 Density/ ρ 7.85 × 10 9 Density/ ρ 2.3 × 10 9
Elastic modulus/E200,000Elastic modulus/E200,000Drawing options/NPLOT1
Poisson’s ratio/ ν 0.3Poisson’s ratio/ ν 0.3Strain rate effect coefficient/RATE1
Coupling control coefficient/N, COUPLE, M0, 0, 0Yield strength/SIGY427.45Elastic modulus coefficient of restitution/RECOV0
Quality constraint factor/CMO, CON1, CON21, 7, 4Tangent modulus/ETAN2000Retraction coefficient of cap surface/ITRETRC0
Hardening factor/β0Predamage factor/PRED0
Strain rate factor/SRC, SRP40.4, 5Unconfined compressive strength/FPC25.5
Failure strain/FS0.2Maximum particle size/DAGG25.0
Strain rate effect algorithm/VP0Unit options/UNITS2
Table 2. Summary of element types and material models.
Part NameProp NameMaterial Model
Beam bodySOLID164*MAT_CSCM_CONCRETE
Hammer; support padSOLID164*MAT_RIGID
Longitudinal reinforcement; stirrupBEAM161*MAT_PLASTIC_KINEMATIC
Steel plate; U-shaped steel plate hoopsSHELL163MAT_PLASTIC_KINEMATIC
Table 3. Comparison of the eigenvalues of dynamic responses.
IDPeak Impact ForcePeak Midspan DisplacementResidual Value of Midspan Displacement
Test Value (kN)Numerical Value (kN)Error (%)Test Value (mm)Numerical Value (mm)Error (%)Test Value (mm)Numerical Value (mm)Error (%)
A1335336729.5133.633.70.3029.829.90.34
B13204364813.832.632.60.0021.021.52.38
B23194364014.031.431.2−0.6421.020.8−0.95
B33684406010.231.731.70.0020.320.71.97
Table 4. Parameter influence analysis: impact mass.
IDImpact Mass (kg)Peak Impact Force (kN)Peak Midspan Displacement (mm)Residual Value of Midspan Displacement (mm)
B-M130130330016.611.8
B-M180180348022.114.8
B-M230230358026.217.1
B-M280280364031.220.8
B-M330330368034.924.5
B-M380380372038.127.6
B-M430430376042.232.7
Note: B-M280 is a typical model; B indicates beam; M indicates mass; M280 represents an impact mass of 280 kg.
Table 5. Parameter influence analysis: impact height.
IDImpact Height (m)Peak Impact Force (kN)Peak Midspan Displacement (mm)Residual Value of Midspan Displacement (mm)
B-IH44334025.516.7
B-IH55344027.517.7
B-IH66364031.220.8
B-IH77380033.723.0
B-IH88384036.525.3
B-IH99396038.429.6
Note: B-IH6 is a typical model; B indicates beam; IH indicates impact height; IH6 represents an impact height of 6 m.
Table 6. Parameter influence analysis: lengths of the bonded steel plates.
IDLength of Bonded Steel Plate (mm)Peak Impact Force (kN)Peak Midspan Displacement (mm)Residual Value of Midspan Displacement (mm)
B-h21002100362032.723.9
B-h22502250362032.525.4
B-h24002400362032.325.1
B-h25502550362032.124.1
B-h27002700364031.922.7
B-h28502850364031.521.3
B-h30003000364031.220.8
Note: B-h3000 is a typical model; B indicates beam; h3000 indicates that the length of the steel plate is 3000 mm.
Table 7. Parameter influence analysis: widths of the bonded steel plates.
IDWidth of Bonded Steel Plate (mm)Peak Impact Force (kN)Peak Midspan Displacement (mm)Residual Midspan Displacement (mm)
B-b160160364032.823.4
B-b175175364032.523.1
B-b190190364032.322.8
B-b205205364031.422.0
B-b220220364031.220.8
Note: B-b220 is a typical model; B indicates beam; b220 indicates that the width of the steel plate is 220 mm.
Table 8. Comparison of the peak impact force values between the working condition design and formula fitting.
IDImpact Mass (kg)Impact Height (m)Thickness of Bonded Steel Plate (mm)Main Peak Value of the Impact Force (kN)MAPE (kN)Relative Error (%)
C12804433403328−0.36
C228054344034951.59
C32806436403637−0.07
C42807438003762−0.99
C528084384038740.89
C628094396039760.39
C713064330033601.81
C81806434803475−0.15
C92306435803564−0.45
C1033064368037000.54
C1138064372037540.92
C1243064376038021.13
C1328061370537070.05
C1428062367036720.05
C1528063365036520.05
C1628065362236260.12
C1728066360136170.45
Table 9. Comparison of the midspan displacements between the working condition design and formula fitting.
IDImpact Mass (kg)Impact Height (m)Thickness of Bonded Steel Plate (mm)Length of Bonded Steel Plate (MPa)Width of Bonded Steel Plate (mm)Peak Midspan Displacement (mm)MSE (mm)Relative Error (%)Residual Value of Midspan Displacement (mm)RMSE (mm)Relative Error (%)
W128044300022025.524.8 −2.7 16.715.9 −5.0
W228054300022027.528.0 1.8 17.718.7 5.4
W328064300022031.230.9 −1.0 20.821.3 2.4
W428074300022033.733.6 −0.4 2323.8 3.5
W528064300022036.536.1 −1.2 25.326.2 3.7
W628094300022038.438.4 0.1 29.628.6 −3.5
W713064300022016.617.4 5.0 11.810.9 −7.6
W818064300022022.122.2 0.5 14.814.2 −3.8
W923064300022026.226.7 1.8 17.117.8 4.1
W1033064300022034.934.9 0.1 24.524.7 0.9
W1138064300022038.138.8 1.8 27.628.1 1.9
W1243064300022042.242.5 0.8 32.731.5 −3.7
W1328061300022033.233.6 1.1 25.224.4 −3.0
W1428062300022032.632.2 −1.2 21.522.8 6.1
W1528063300022031.931.4 −1.5 21.221.9 3.3
W1628065300022030.530.5 −0.1 20.720.8 0.6
W1728066300022029.930.2 0.8 20.620.4 −0.7
W1828064210022032.733.0 0.9 23.925.6 7.0
W1928064225022032.532.6 0.2 25.424.7 −2.9
W2028064240022032.332.2 −0.4 25.123.9 −4.9
W2128064255022032.131.8 −0.8 24.123.1 −4.0
W2228064270022031.931.5 −1.3 22.722.5 −1.0
W2328064285022031.531.2 −1.0 21.321.9 2.6
W2428064300016032.833.1 0.8 23.423.7 1.3
W2528064300017532.532.4 −0.2 23.123.0 −0.5
W2628064300019032.331.9 −1.3 22.822.4 −1.9
W2728064300020531.431.4 −0.1 2221.8 −0.9
Disclaimer/Publisher’s Note: The statements, opinions and data contained in all publications are solely those of the individual author(s) and contributor(s) and not of MDPI and/or the editor(s). MDPI and/or the editor(s) disclaim responsibility for any injury to people or property resulting from any ideas, methods, instructions or products referred to in the content.

