Article

Seismic Response Analysis of a Large-Span Isolated Structure Equipped with TNRB-DSBs and LRBs

1
College of Transportation and Civil Engineering, Nantong University, Nantong 226019, China
2
Nantong Prefabricated Building and Intelligent Structure Research Institute, Nantong 226014, China
3
School of Civil Engineering, Southwest Jiaotong University, Chengdu 610031, China
*
Author to whom correspondence should be addressed.
Buildings 2023, 13(5), 1288; https://doi.org/10.3390/buildings13051288
Submission received: 22 March 2023 / Revised: 10 May 2023 / Accepted: 13 May 2023 / Published: 15 May 2023
(This article belongs to the Special Issue Recent Advance in Steel and Composite Structures)

Abstract

:
This study focused on comprehensively analyzing the construction, mechanism, and design theory of the Thick Rubber Bearing–Disk Spring Bearing (TNRB-DSB) system, with the aim of evaluating its isolation effect. Mechanical tests were conducted to examine the dynamic characteristics of large-span isolated structures equipped with TNRB-DSBs, and laminated rubber bearings (LRBs), as well as the dynamic responses of non-isolated structures and large-span horizontal isolated structures equipped with natural rubber bearings (NRBs) and LRBs, under various seismic excitations. Finite element software was utilized to compare the behaviors of these structures. The study revealed that the large-span isolated structure equipped with TNRB-DSBs and LRBs had a vertical natural vibration period 1.23 times as long as that of the isolated structure with NRBs and LRBs, and 4.27 times as long as that of the non-isolated structure. The TNRB-DSB system demonstrated good vertical and horizontal isolation capabilities, which compensated for the isolation limitations of other rubber bearings to some extent.

1. Introduction

Structures with base isolation are realized by inserting an isolation layer that consists of isolators and energy dissipation elements, among others, between the foundation and the superstructure. The technique of base isolation can effectively prolong the natural vibration period of the superstructure to avoid the main frequency band of seismic ground motion, simultaneously blocking the upward spread of seismic energy to the superstructure. The utilization of the energy dissipation elements in the isolation layer allows for the consumption of seismic energy, thereby prominently reducing the damage to the superstructure. Since the 1970s, domestic and foreign scholars have carried out a large amount of experimental and theoretical analyses on base-isolation structures and achieved many fruitful results [1,2,3,4,5]. Research has shown that existing base-isolated structures can effectively isolate the horizontal seismic action and generally reduce about 60% of the structural horizontal seismic acceleration response, but they cannot efficiently reduce or even amplify vertical seismic action [6]. However, the huge earthquakes that have occurred at home and abroad in recent years indicate that strong vertical components of ground motions happened, the intensity of which may even exceed seismic horizontal components in high-intensity areas, especially those near faults. For instance, in the 1994 Northridge earthquake in California [7], the peak vertical acceleration was about 1.79 times the peak horizontal acceleration, while the peak vertical acceleration of the 2008 Wenchuan earthquake in China was close to the peak horizontal acceleration.
After the horizontal seismic action of isolated buildings is reduced, vertical ground motion with a high peak value may become the dominant cause of structural failure. This is especially true for large-span spatial structures, which are equally sensitive to the horizontal and vertical responses to earthquakes due to their special structural characteristics [8]. Therefore, traditional isolation bearings such as NRBs, LRBs [9], sliding friction bearings [10], and so on, cannot meet the operating requirements of large-span spatial structures. In view of this, vertical isolation technology has become a hot topic for scholars at home and abroad. Compared with horizontal isolation technology, the development of vertical isolation technology is relatively slow. Some scholars have proposed and developed some vertical or three-dimensional isolation devices [11,12,13]. Some devices have complex shapes and also need additional dampers to increase the vertical damping so as to augment the vertical stiffness of the bearing, which is not conducive to both the processing and the vertical isolation. Taking all the mentioned reasons into consideration, it is vital to design simple and efficient vertical isolation bearings to reduce the vertical seismic action of the large-span structures equipped with base isolation.
The vertical isolation bearing should be designed with many capabilities, such as high vertical bearing capacity, high vertical deformation capacity, good lateral displacement capacity, good energy consumption, and so on. The thick rubber bearing (TNRB) has become one of the important forms of vertical isolation [14]. Compared with the ordinary rubber bearing, the thickness of the rubber layer of the TNRB is significantly increased by 3~5 times. TNRB can effectively extend the structural vertical period of vibration thanks to its small vertical stiffness. Disk spring bearings (DSBs) possess the advantages of variable stiffness, high bearing capacity, and vibration absorption, such that they can also be applied in vertical isolation devices [15].
This paper proposes a combined vertical isolation device, that is, the TNRB-DSB, which consists of the TNRB and DSB used in parallel and without any additional vertical damper. In order to investigate the characteristics of the vertical isolation device, basic mechanical properties tests were carried out to analyze the compressive stress and shear strain correlation of the vertical performance. Moreover, three models, including a large-span isolated structure with TNRB-DSBs and LRBs, a large-span horizontal isolated structure with NRBs and LRBs, and a non-isolated structure, were established in the finite element analysis software SAP2000. Ultimately, the dynamic characteristics and responses of the above three structural models under multiple seismic excitations were comparatively studied.

2. TNRB-DSB Vertical Isolation System

The TNRB-DSB vertical isolation system consists of a TNRB combined with a DSB. Multilayer thin steel plates and thick natural rubber gaskets were alternately placed and vulcanized at a high temperature so as to constitute the TNRB. The vertical stiffness of TNRB could be varied by adjusting the number of thick rubber gaskets and the thickness of the rubber layer. The DSB placed inside the reserved central hole of the TNRB is composed of several disc springs assembled through overlapping, coupling, and other ways of combination. The variation of combining ways and the number of pieces will allow the disc springs to acquire the appropriate vertical stiffness and damping performance. The DSB is constrained by an outer guide cylinder and an inner guide cylinder welded to the upper and lower connecting plates, respectively. For this reason, the DSB only produces compression deformation when subjected to axial pressure. The inner guide cylinder extends a certain depth into the outer guide cylinder and leaves a gap for the vertical deformation of the DSB. The sealing plates and the connecting plates of the TNRB-DSB are connected by bolts. The TNRB-DSB vertical isolation system is shown in Figure 1.

2.1. Material Properties

In view of the fact that rubber is a form of isotropic material, a classic rubber constitutive model, the Mooney–Rivlin model, was adopted. This model is primarily suitable for the simulation of materials with small and medium deformation, such as rubber with a tensile strain less than 100% and a compression strain less than 30%. The strain energy of the rubber material can be decomposed into strain deviator energy and volumetric strain energy, and the strain energy density function is written in polynomial form and the order is one. Thus, the typical constitutive model for the incompressible rubber material, that is, Mooney–Rivlin model, is obtained as follows [16]:
W = C 10 I 1 I 3 + C 01 I 2 I 3
where W is the strain energy density function; I1, I2, I3 denote the invariants of the deformation tensor which are related to the principal elongation δ 1 , δ 2 , δ 3 , I 1 = δ 1 2 + δ 2 2 + δ 3 2 , I 2 = δ 1 δ 2 2 + δ 2 δ 3 2 + δ 1 δ 3 2 , and I 3 = δ 1 δ 2 δ 3 2 1 . Both C10 and C10 are parameters, which can be determined by fitting the data curve of the rubber material test [17].
Take the partial derivative of Equation (1) and the following can be obtained:
W I 1 = C 10 , W I 2 = C 01
It is known that there is a relationship between the true principal stress σ i of rubber materials and their principal elongation δ i , as shown in Equation (3), where Ph denotes any hydrostatic pressure.
σ i = 2 δ i 2 W I 1 + 1 δ i 2 W I 2 + P h
Then, three principal stress differences can be obtained:
σ 1 σ 2 = 2 δ 1 2 δ 2 2 W I 1 + δ 3 2 W I 2 σ 2 σ 3 = 2 δ 2 2 δ 3 2 W I 1 + δ 1 2 W I 2 σ 3 σ 1 = 2 δ 3 2 δ 1 2 W I 1 + δ 2 2 W I 2
In the case of unidirectional stretching or compression, σ 2 is equal to σ 3 . By combining with I 3 = δ 1 δ 2 δ 3 2 1 , Equation (4) can be written as follows:
σ 1 = 2 δ 1 2 1 δ 1 W I 1 + 1 δ 1 W I 2
Substitute Equation (2) into Equation (5), we have the following equation:
σ 1 2 δ 1 2 1 δ 1 = C 10 + 1 δ 1 C 01
According to the uniaxial tensile or compression test, the stress under different elongation values is measured. Take 1 / δ 1 and σ 1 / 2 δ 1 2 1 / δ 1 as the x-coordinate and y-coordinate, respectively. The test data are then returned to a line whose slope is C01 and whose intercept with the Y-axis is C10.
In this paper, the Mooney–Rivlin model was employed to calculate the mechanical properties of the rubber material. The rubber material adopted the hardness of 42°, and its constitutive parameters C10, C01 were determined to be 0.1964 MPa and 4.588 × 10⁻³ MPa, respectively, by experimental data fitting [18]. The shear modulus of rubber Gr was then measured to be 0.392 MPa. The steel in TNRB-DSB was regarded as a linear elastic material. The steel plate, sealing plate, connecting plate, inner cylinder, and outer guide cylinder in the TNRB all used the Q235 material, while the disc spring material was 60Si2MnA. The elastic modulus of the steel was 206 MPa, and the Poisson’s ratio was 0.3.

2.2. Dimension Design

Generally speaking, the thickness of the rubber layer of the TNRB increases significantly compared with that of the ordinary rubber bearing. The first shape coefficient S1 of the former is about 2–5 times that of the latter. The two shape coefficients, S1 and S2, of the bearings are defined as follows [19]: S1 = (Dd)/(4tr); S2 = D/(ntr), where D is the diameter of the effective bearing surface of the rubber layer; d is the diameter of the hole in the middle of the rubber layer. If there is no hole or the hole is filled with rubber or lead, d is 0. n is the number of rubber layers; tr is the thickness of the rubber layer.
According to the current Code for Seismic Design of Buildings [20] in China, the limit of the average surface pressure for Class A, B, and C buildings is set at 10 MPa, 12 MPa, and 15 MPa, respectively. Large-span spatial structures that are densely populated, such as gymnasiums, opera houses, etc., are assigned to Class B so as to take the design surface pressure of 12 MPa. A large-span isolated structure with a span of 90 m is taken as the application example. Based on the basic combination value of the upper load that the vertical isolation device bears, the diameter of the vertical isolation device is determined to be 600 mm. Other major dimensional parameters of the two bearings are shown in Table 1. It can be calculated that the two shape coefficients, S1 and S2, of the LRB bearing are 37.50 and 3.85. TNRB is designed with the same total thickness for the rubber layer as LRB, hence, it of course obtains the same S2 of 3.85. A hole is reserved in the center of the TNRB for the installation of DSB, with an outer diameter of 250 mm and considering an installation allowance of 10 mm. The S1 of TNRB is 7.08.
For the two bearings, both the upper and the lower sealing plates have a thickness of 20 mm, and both the upper and lower connecting plates have a thickness of 25 mm. The diameter of the sealing plates is 600 mm. The side length of the square upper connecting plate is 700 mm, while that of the circular lower connecting plate is 600 mm.
The DSB group in the center of the TNRB consists of several dish springs combined by superposition, coupling, and other ways, as shown in Figure 2. Theoretical calculation and practical measurement prove that the load-deformation curves of disc springs are nonlinear. When the inner diameter d, the outer diameter D, and the thickness t of the material are determined, the ratio of the ultimate displacement to the thickness of the disc spring, h0/t, has an absolute influence on its stiffness characteristic curve. When this ratio is less than or equal to 0.5, the stiffness characteristic curve is approximately linear. Commonly, a larger D is chosen as much as possible to reduce the number of disc springs. However, the space will be underutilized if D/d is too large, while a D/d that is too small will bring difficulties to manufacturing due to the close values of the inner and outer diameters of the disc spring. Given this issue, a D/d value of 1.7–2.5 was chosen, based on engineering experience. The DSB product used for this research was provided by Shanghai Jiuguang Spring Co., Ltd. (Shanghai, China), and it had the following dimensions: D is 250 mm, d is 127 mm, t is 14 mm, H is 19.6 mm, and h0 is 5.6 mm. Hence, the D/d was calculated to be 1.97, which meets the aforementioned requirements. It was determined that the disc spring group would consist of three pieces of disc springs and four pairs of disc springs on account of the requirements of total bearing capacity and total deformation. Furthermore, the disc spring group had to be pre-pressed because of the limited space in the bearings.

2.3. Vertical Stiffness Design

The horizontal stiffness of the TNRB-DSB device is much greater than its vertical stiffness due to the constraints of the guide cylinder. Therefore, the overall vertical stiffness of the TNRB-DSB can be calculated according to the vertical stiffness, Kv1, of the TNRB and the vertical stiffness, Kv2, of the DSB in parallel, namely K v = K v 1 + K v 2 .
It is necessary to figure out how to calculate the vertical stiffness of the ordinary rubber bearing first [21]. The rubber gaskets of the ordinary bearing, which are constrained by the steel plates, will produce a small vertical deformation under the action of a vertical pressure load. Thus, their vertical stiffness, K v 0 , can be expressed as follows:
K v 0 = E c b A n t r = π D E c b S 2 4
where A denotes the effective area of the bearing; Ecb represents the modified volumetric constrained elastic modulus of laminated rubber under vertical pressure loading, which was presented by Lindly [22] and can be calculated using Eab = EcEb/(Ec + Eb); Ec is the bending elastic modulus, and Ec = E0(1+2kS12); Eb is the volumetric constrained elastic modulus of laminated rubber; E0 is the standard elastic modulus of rubber materials; κ represents the correction factor of hardness for rubber materials.
For an ordinary rubber bearing, the formula of its vertical stiffness is based on the elastic theory of small deformation. In contrast, the rubber layers of the TNRB are thicker, such that the sandwich steel plates have weaker constraints on them and the compression deformation of its rubber layers is larger under vertical load. Moreover, the ratio of the vertical load and compression displacement changes constantly as the load varies. Therefore, the correction of vertical stiffness should be carried out considering the deformation characteristics of the rubber layer. Assuming that the rubber is an incompressible material, the volume of the rubber layer remains the same before and after compression, and the cross-section area of the rubber layer will increase after bearing compression. The area in the calculation formula for rubber bearings refers to the effective bearing area of the rubber layer. The correction method assumes that the increase in the cross-section area caused by the transverse deformation of the rubber layer under compression is not included in the effective bearing area. Hence, the correction method merely considers the thickness influence of the rubber layer on the vertical stiffness of the TNRB.
After the thick rubber layer is deformed by compression, its first shape coefficient, S1, is altered to (D − d)/(tr − dv), where dv is the compression of single-layer rubber and can be determined by multiple iterations. Accordingly, the modified bending elastic modulus of laminated rubber E c can be written as [23,24]:
E c = E 0 1 + 2 κ S 1 × E E 0 1 + 2 κ S 1 + E
Then, the vertical stiffness of the TNRB is modified to Kv1′ = Ec′A/(ntr − ndv).
On the other hand, supposing that f is the deformation of the disc spring subjected to the load F, then the vertical stiffness of a single disc spring can be calculated by Equation (9) below [25]:
K v = d F d f = t 3 α D 2 h 0 t 2 3 h 0 t · f t + 3 2 f t 2 + 1
The relationship between the parameters F and t is described by the following equation:
F = f t 3 α D 2 h 0 t f t h 0 t f 2 t + 1
Assuming λ as the ratio of D and d, the parameter α in Equations (9) and (10) can be given by the following equation in relation to λ when the elastic modulus E and Poisson’s ratio μ of the disc spring material are determined:
α = 1 π · 1 μ 2 4 E · λ 1 λ 2 λ + 1 λ 1 2 l n λ
The total vertical stiffness of the disc spring group is calculated according to the series-parallel principle of spring, in which series and parallel formulas are applied to the computation of the composite disc spring and the pair disc spring, respectively.

3. Mechanical Property Test of the TNRB-DSB

3.1. Test Equipment and Test Specimens

The loading testing equipment used in this paper is shown in Figure 3 [26]. The vertical parameters of the compression and shear test device include a maximum vertical pressure of 20,000 kN, a maximum vertical tension of 6000 kN, a maximum vertical displacement stroke of ±700 mm, and a maximum speed of 3 mm/s. Its horizontal parameters include a maximum shear test force of ±6000 kN, a maximum horizontal displacement stroke of ±600 mm, and a maximum speed of 10 mm/s. Test loading control and data acquisition were completed by computer.
Two specimens with a diameter of 600 mm were made for the tests. The first specimen was the LRB [27,28]; the second specimen was the TNRB embedded by a 250 mm diameter DSB in the middle hole, as shown in Figure 4. The basic dimension parameters of the two specimens are described in the first part.

3.2. Test Procedure

The vertical and horizontal stiffness of the LRB and TNRB-DSB were obtained through the basic mechanical properties tests. Based on a design surface pressure of 12 MPa and a bearing diameter of 600 mm in this paper, the specified vertical load P was determined to be 3400 kN. The cyclic loading of the vertical compression performance test was carried out within the range of P ± 0.3 P. Aimed at analyzing the influencing factors of vertical stiffness, the two specimens were designed to be subjected to such loading cases with different pre-pressures (0 kN, 1700 kN, 2040 kN, 2720 kN), vertical pressures (2900 kN, 3400 kN, 3700 kN), and loading frequencies (0.01 Hz, 0.02 Hz, 0.05 Hz, 0.1 Hz). Subjected to different loading frequencies of 0.01 Hz and 0.0082 Hz, the horizontal compression shear tests of the two specimens, with a shear strain γ of 25%, 50%, 75%, and 100%, were respectively performed under the vertical pressure P of 3400 kN. When the loading frequency was 0.01 Hz, the loading cases with a shear strain γ of 100% and different vertical pressures P were also selected to analyze the shear strain correlation of the horizontal performance of the two specimens. In every case of the vertical and horizontal performance tests, the loading was performed in four cycles.

3.3. Test Results

3.3.1. Vertical Compression Performance

Under the designed vertical pressure P of 3400 kN and loading frequency f of 0.1 Hz, the vertical compression performance tests of ±100% shear strain were carried out on the two bearings. Each test condition had four cycles of loading and unloading. The vertical force–displacement curves of the two bearings are shown in Figure 5. It can be seen that the slope of the hysteretic curves of the two bearings is sharp. This is because the rubber and steel plate were vulcanized as a whole and were thus closely bonded to each other. The steel plate restricted the transverse deformation of the rubber layer, which caused the isolation bearings to have high vertical stiffness. Under axial pressure, the vertical displacement of the LRB is much smaller than that of the TNRB-DSB, and the slope of the curve of the latter is slightly less, with a hysteresis curve that is fuller as well.
1.
Loading frequency
The loading frequency correlation test was carried out on both LRB and TNRB-DSB, under the loading frequencies of 0.1 Hz, 0.05 Hz, 0.02 Hz, and 0.01 Hz. For brevity, Table 2 only shows the vertical stiffness of the third loading cycle under different loading frequencies when the vertical pressure was 3400 kN. It shows that the loading frequency has little influence on the vertical mechanical properties of the LRB, especially if the loading frequency is low. However, the vertical compression performance of the TNRB-DSB is sensitive to the change in loading frequency.
2.
Vertical pressure
Table 3 only shows the vertical stiffness of the two bearings under different vertical pressures of 2900 kN, 3400 kN, and 3700 kN, when the loading frequency was 0.1 Hz. The vertical stiffness of the TNRB-DSB and LRB increased slightly as vertical pressure was added. When the vertical pressure was 3700 kN, the vertical stiffness of the TNRB-DSB and LRB was about 1.19 and 1.05 times that of the case at 2900 kN. This is because the augmentation of vertical pressure leads to the strengthening of the restraining effect that the steel plates have on the rubber layers. At this point, the rubber layers are under the three-way stress state, whose compression modulus increases rapidly.
3.
Pre-pressure
With the vertical pressure P at 3400 kN and the loading frequency at 0.1 Hz, the resulting influence of different pre-pressures, 1700 kN, 2040 kN, 2720 kN, and 2900 kN, on the vertical stiffness of the two bearings are listed in Table 4. The vertical stiffness of the supports basically increased with the rise of the pre-pressure. However, when the pre-pressure reached 2900 kN, something unusual happened to the stiffness of the TNRB-DSB. According to the preliminary analysis, it is because, in this working condition, the improper operation of the tester led to the deviation of the inner guide cylinder from the vertical center axis of the support and to the collision with the outer guide cylinder, which resulted in the vertical stiffness surge. This would not return to normal until the next working condition.
4.
The vertical stiffness results
P1 and P2 are assumed to be the lower and the greater pressures in the third cycle, which are 0.7 P and 1.3 P, respectively. Y1 and Y2 are the smaller and the larger displacements in the third cycle. Using the formula Kv = (P2 − P1)/(Y2 − Y1), the vertical compression stiffness of the bearings under each test condition was calculated. The error between the theoretical value and the test value can be determined as follows: (test value-theoretical value)/test value. Due to limited space, only the comparison results for each bearing are given in Table 5, when vertical pressure was 3400 kN and pre-pressure was 0 kN.

3.3.2. Horizontal Compression Performance

Under an axial pressure of 3400 kN and a loading frequency of 0.01 Hz, a horizontal shear performance test with ±100% shear strain was carried out on the two bearings. In the test, four cycles of cyclic loading were carried out. The hysteretic curves of the bearings obtained from the test show that the bearing curves are in the shape of a spinning cone (Figure 6a) and a crescent (Figure 6b). These demonstrate that the TNRB-DSB has a horizontal energy dissipation capacity to some extent, but is not as good as that of the LRB.

4. Seismic Response Analysis of Large-Span Isolated Structures

Earlier in this paper, a constitutive model for rubber bearings was established, which considers the effect of vertical pressure and is more suitable for isolated structures. Two large-span isolated structures with different types of isolation bearings (equipped with LRB or TNRB-DSB) and one large-span non-isolated structure were designed to be the analysis objects. Based on the established models, the finite element method was used to investigate the seismic response characteristics of the large-span isolated structure under the action of the TNRB vertical isolation device and multiple earthquakes.

4.1. Structure Overview

The roof of the large-span isolated structure is a steel grid with an orthogonal normal four-pyramid structure, with a plane size of 60 m × 120 m, a height of 5.2 m, and a mesh size of 6 m × 6 m. The lower part is a two-layer reinforced concrete frame structure supported by peripheral columns, with the same story height of 5 m. The peripheral columns, the frame columns, the main girders, and the secondary beams were designed properly with section forms, sizes, and reinforcement detailing. The upper chord layer of the grid roof was subject to a uniform constant load of 0.55 kN/m2 and a live load of 0.5 kN/m2. The lower chord layer was subject to a uniform constant load of 0.30 kN/m2 and a live load of 0.30 kN/m
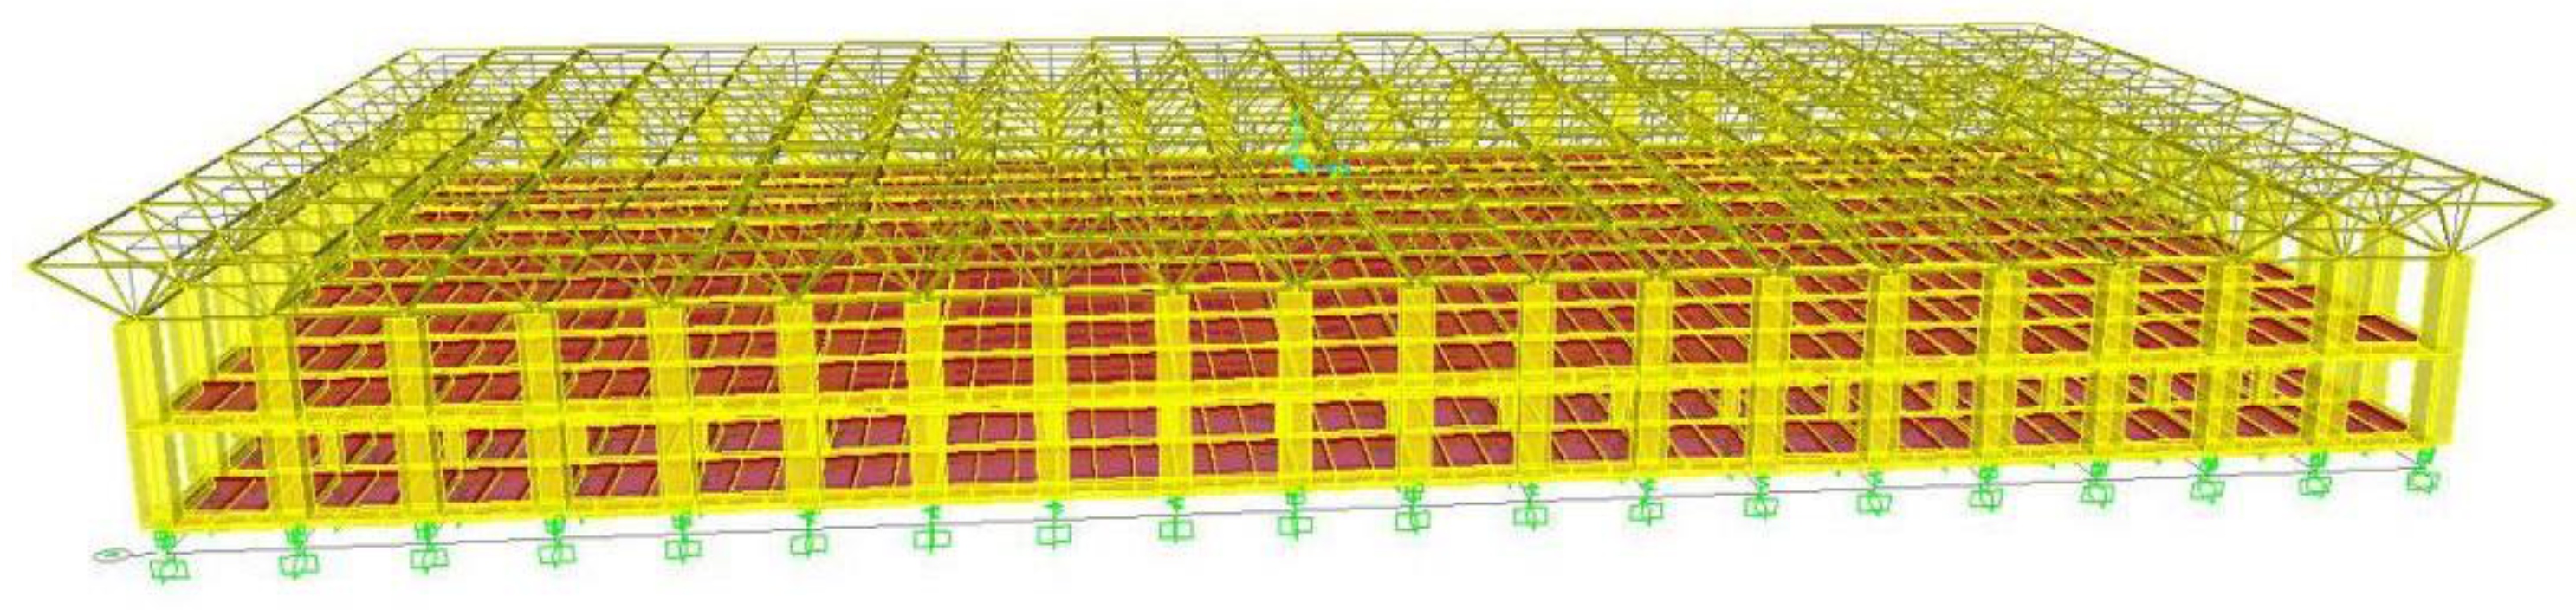
2. Q345 and C40 were selected for steel and concrete materials, respectively. The structural damping ratio takes was 0.02. All the isolation bearings of the structure were placed between the bottom plate of the first floor and the foundation. The diameters of the bearings were calculated to be 600 mm under the conditions of permanent load and variable load. In SAP2000, the link units were used to simulate rubber isolators. The test values for the stiffness and damping ratio of the bearings were input when the support attributes were defined. The three-dimensional finite element model is shown in Figure 7. As with the distribution of supports, dozens of LRBs were arranged around the perimeter of the structures. NRBs or TNRB-DSBs were arranged in the remaining positions of the structures. Some LRBs needed to be arranged to provide sufficient yield force to the structures.
The following assumptions were adopted in the calculation and analysis of the grid structure: (i) an ideally hinged connection pattern was selected for all nodes; (ii) all external loads acted on the joints of the grid roof; (iii) the upper roof structure worked with the lower support structure, and the influence of the wall on the structural stiffness could be ignored; and (iv) it was assumed that none of the reinforced concrete members in the model have reached the fatigue limit. In order to comprehend the dynamic characteristics of the large-span structure, the general finite element software SAP2000 was used to conduct a modal analysis of the structure. The first 11 orders of the natural vibration periods are listed in Table 6.
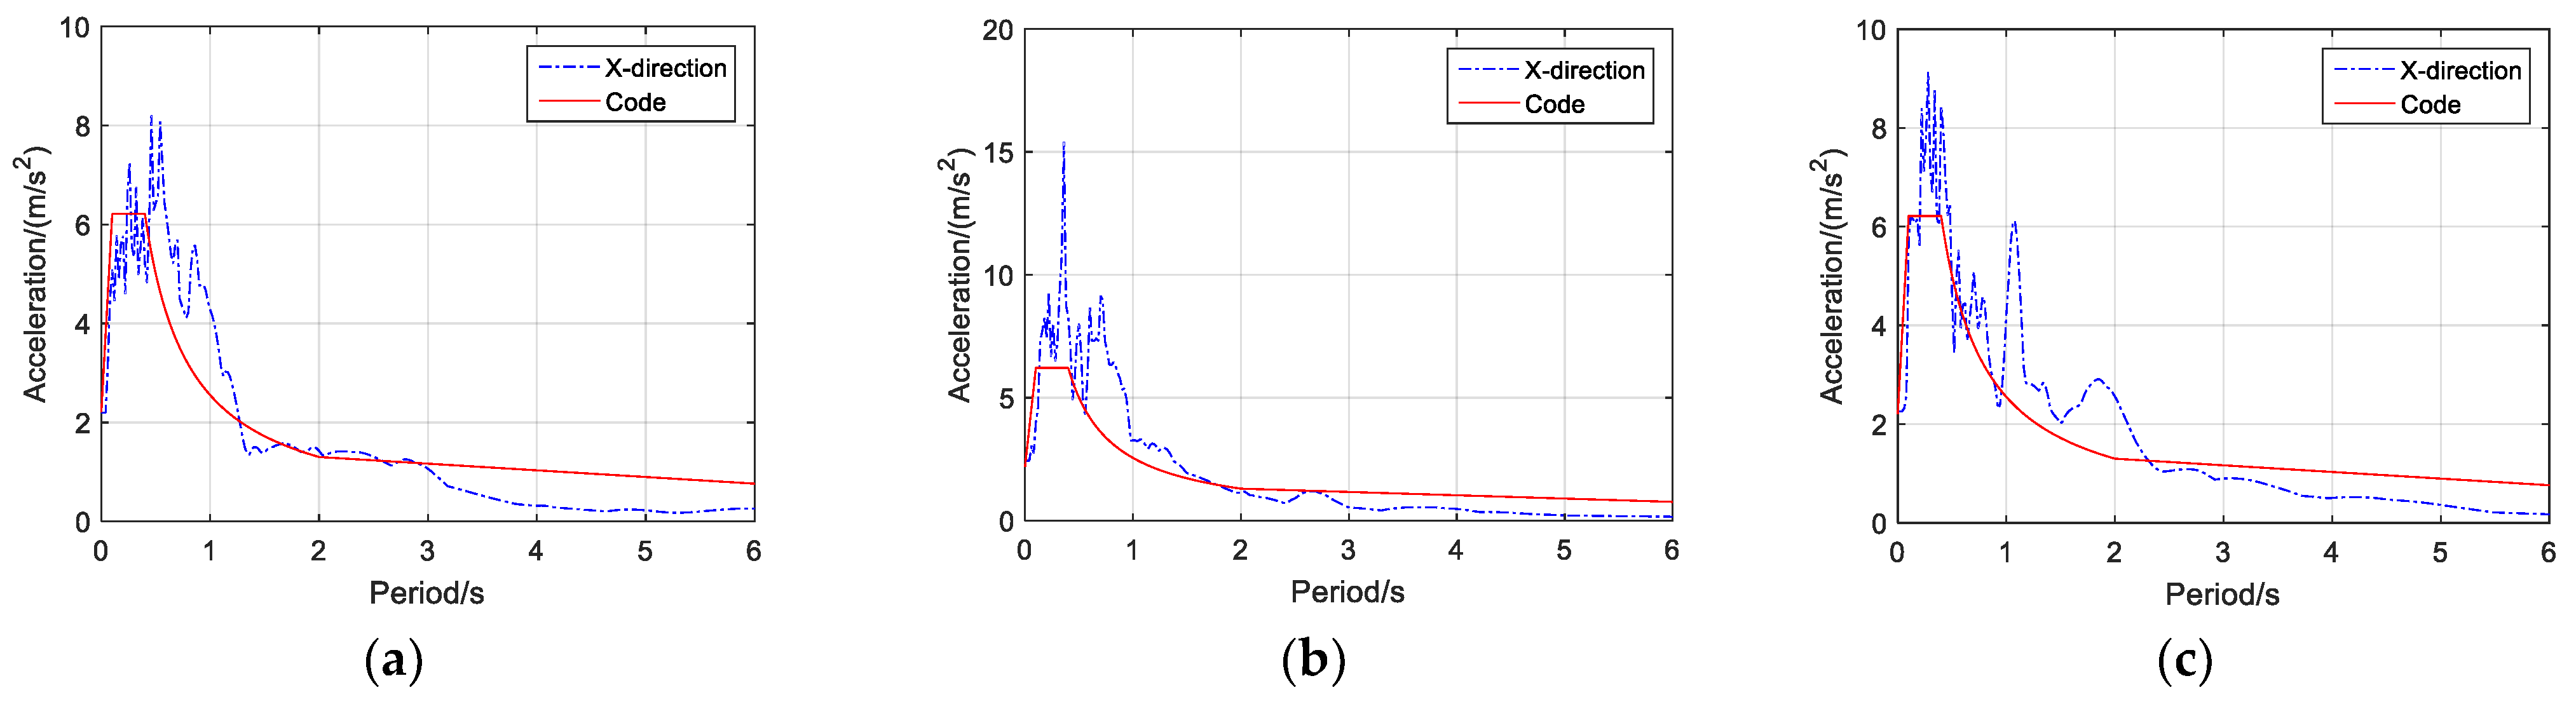
The natural vibration period of the Model I isolated structure is 1.23 times that of the Model II isolated structure, while it is 4.27 times that of the non-isolated structure. For the Model II structure, the mass participation coefficient of the first three order modes is large, successively expressing the y-translational motion, x-translational motion, and z-torsional motion. For the Model I structure, the mass participation coefficients of the mode shape of the first three orders are rather large, and the main modal performances of the first three orders are the same as that of the Model II structure.

4.2. Multiple Seismic Ground Motions

Typical earthquake ground motions from the El Centro records (in 1940) and Taft records (in 1952), were selected as the structural seismic input, which were suitable for type II and type III site soils. The soil condition of the site is an important factor affecting the response results of dynamic tests. Hence, an artificial seismic wave was then synthesized for use in specific soil conditions. Based on the Code for Seismic Design of Buildings of China (CCSDB, GB50011-2010, 2016 edition), the peak value of acceleration in the test was set to 2.2 m/s2. The three-dimensional seismic input was set to be X:Y:Z = 1:0.85:0.65. The seismic fortification intensity of the area where the building is located was 7.5 degrees, with a design basic seismic acceleration of 0.15 g. The earthquake was assigned to the second group. The three seismic waves used in this paper are shown in Figure 8.

4.3. Structural Seismic Response Analysis

(1)
Vertical acceleration response
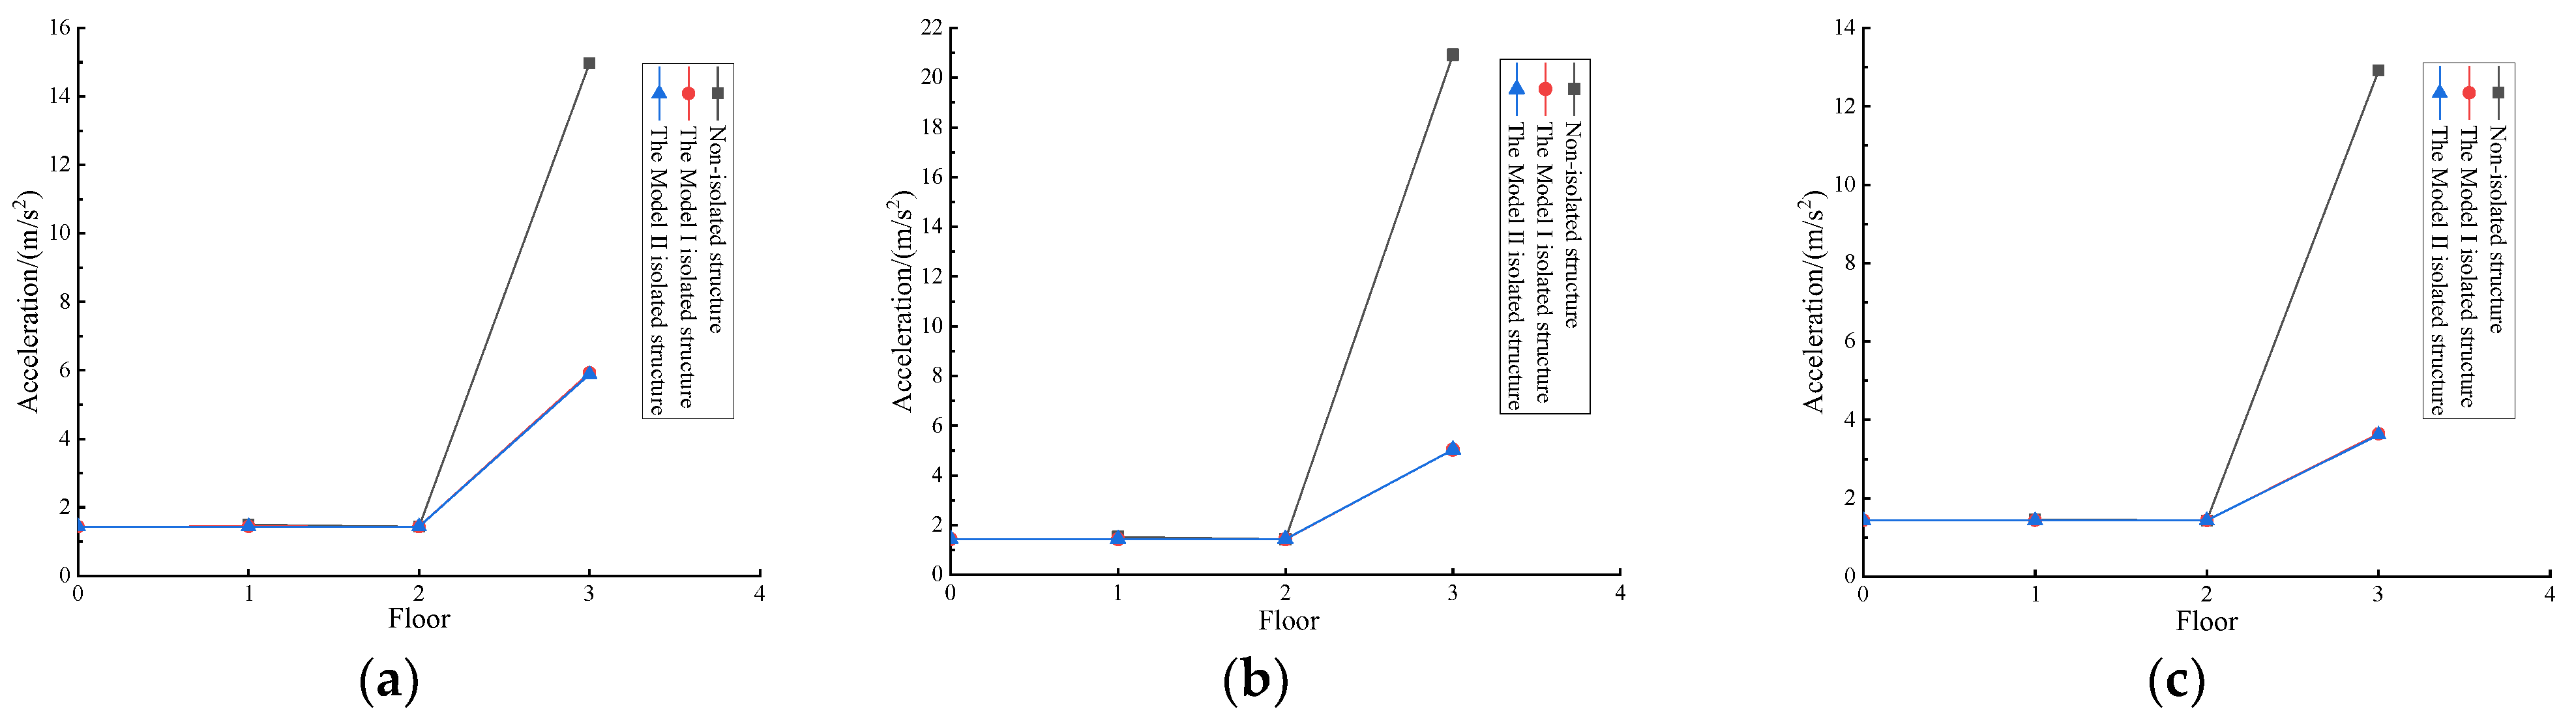
The effectiveness of existing buildings after the installation of seismic isolation devices will be affected by the vertical seismic input. In Figure 9 and Figure 10, the values of 0, 1, 2, and 3 on the x axis refer to the seismic isolation layer, the first layer, the second layer, and the upper-grid layer of the structures.
The following can be seen from the above figures: (1) Different seismic input methods have a great influence on the vertical absolute acceleration of the grid layer, for both the non-seismic and seismic isolation structures. For instance, compared with the vertical seismic input, the peak vertical absolute acceleration of the grid layer for the non-isolated structure under the 3D seismic actions of the El Centro wave, Taft wave, and Artificial wave presented a decrease of 47.1%, 65.8%, and 50.6%, respectively. Accordingly, the peak vertical absolute acceleration of the grid layer for Model I isolated structures increased by 53.9%, 53.2%, and 53.9%, respectively, indicating that the multidimensional characteristics of earthquakes and the spectral characteristics of seismic waves are non-negligible. (2) For the Model I structure, when subjected to the 3D and vertical seismic inputs, the maximum structural seismic isolation rate reached 75.9% (Taft wave condition) and 12.7%. This illustrates that the vertical isolation effect under the 3D seismic input is significantly better than that under the vertical seismic input. This is because considering the horizontal seismic component is conducive to achieving vertical seismic isolation. (3) There is no obvious difference between the vertical acceleration of the Model I and Model II structures, indicating that the seismic isolation effect of the Model I structure is comparable to that of the vertical acceleration response of the Model II structure.
(2)
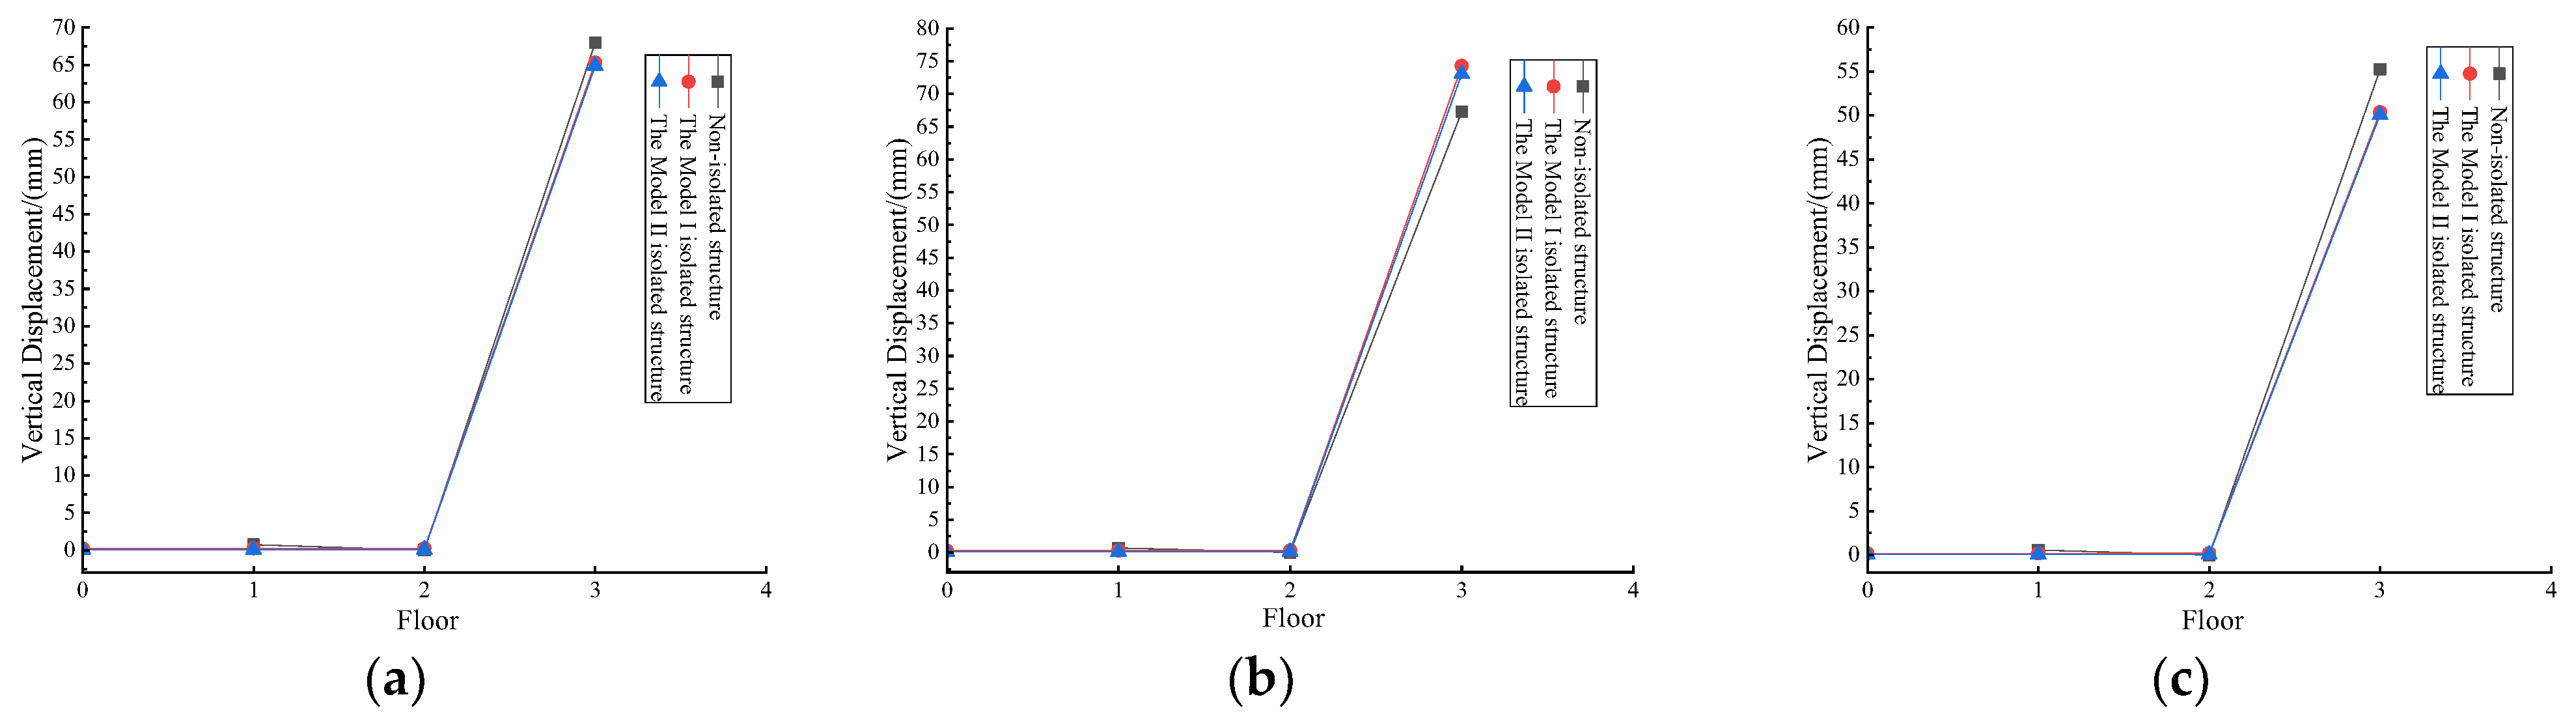
Vertical displacement response
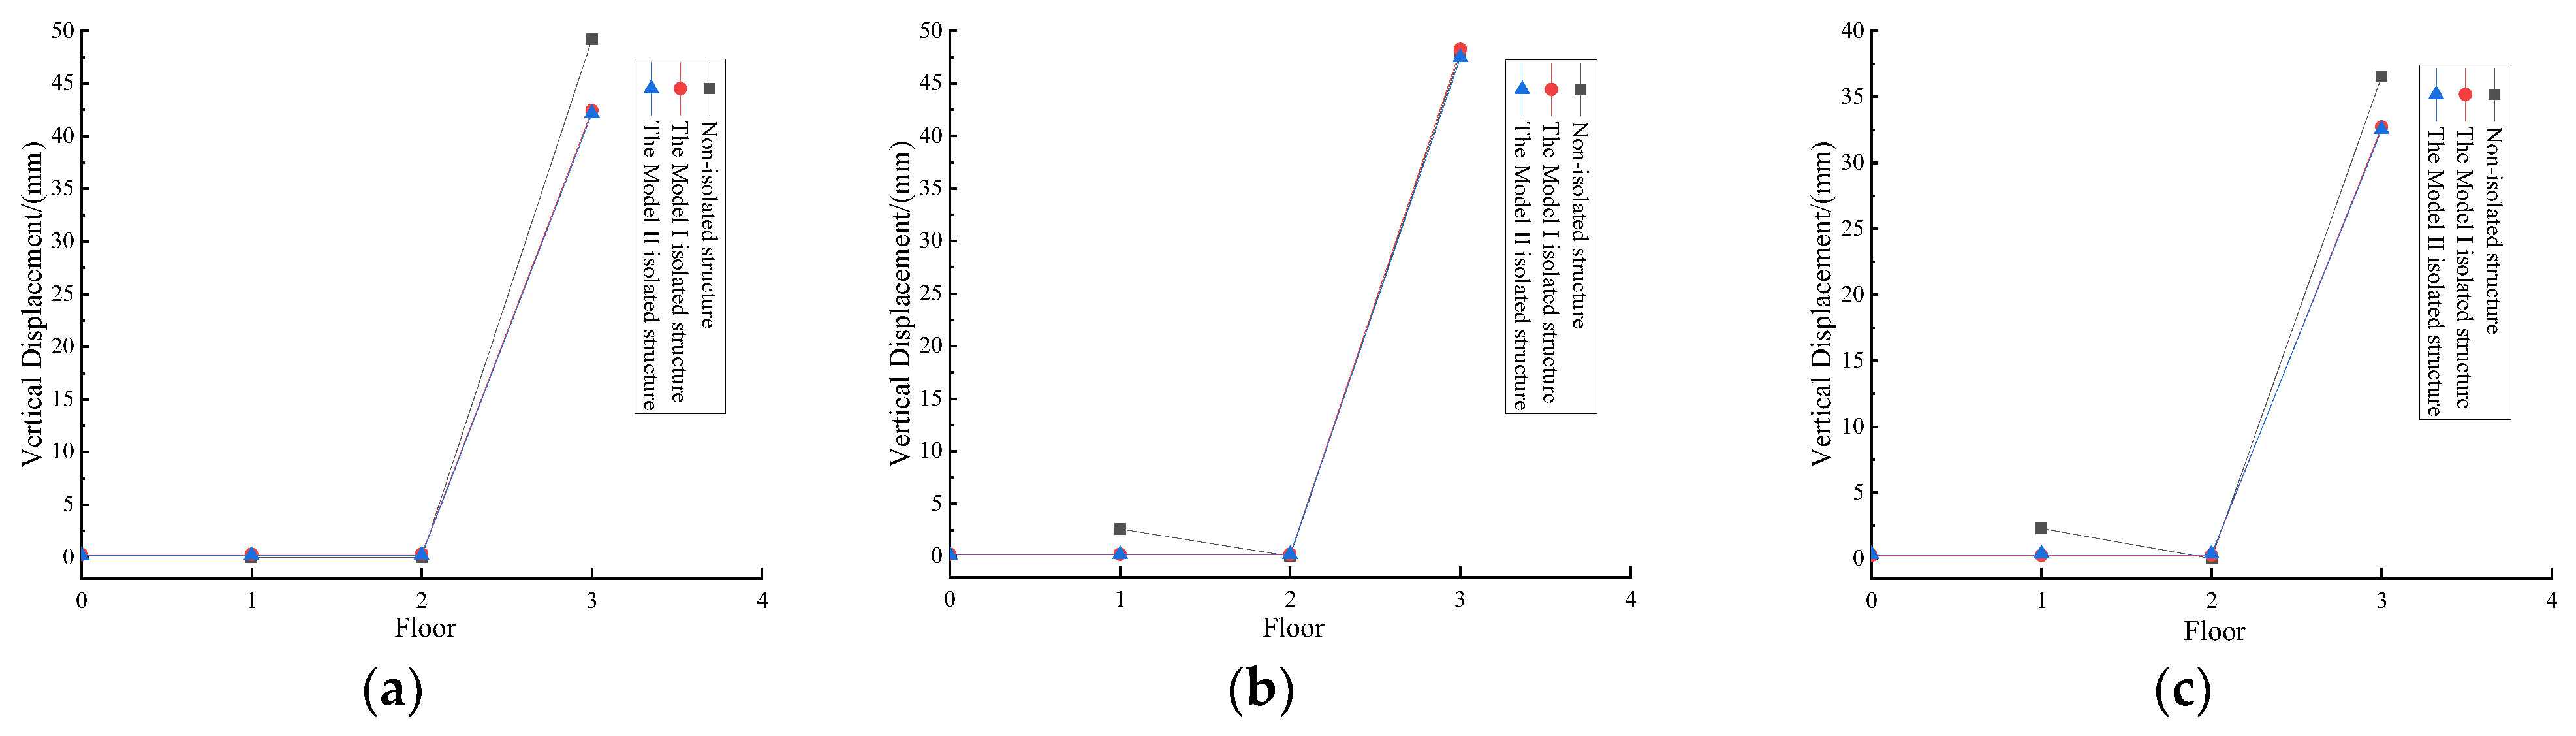
Figure 11 and Figure 12 show the vertical peak displacement response results of the three structural models.
The following can be seen in Figure 11: (1) Under the 3D seismic input, the vertical displacement amplitudes of the seismic isolation layer of the Model I and Model II structures are 0.291 mm and 0.337 mm (allowable value = 0.75h0 = 4.2 mm); (2) The deflection values of the grid roof of the non-seismic isolated structure for the Model I and Model II structures are 48.5 mm, 49.0 mm, and 48.8 mm, respectively (the limit = L2/250 = 0.24, L2 is the short span of the roof); (3) Compared with the Model II structure, the peak vertical displacement of the grid layer of the Model I structure has a maximum increase of 1.6%, which is mainly because the addition of the vertical isolation component, DSB, in the TNRB-DSB reduces the vertical stiffness of the isolation layer to a certain extent. However, the reduction is non-significant.
Through a comparison of Figure 11 and Figure 12, the following points can be noted: (1) The two seismic input methods have a great influence on the vertical displacement of the grid layer for all three structures. For example, compared with the 3D seismic input, the peak vertical displacement of the grid layer for the non-isolated structure under the vertical seismic actions of the El Centro wave, Taft wave, and artificial wave presented an increase of 38.1%, 40.5%, and 51.1%, respectively. Accordingly, those displacement responses for both the two isolated structures under three 3D seismic actions increased by 53.9%, 53.9%, and 54.0%, respectively; (2) Under the 3D seismic input, the maximal displacement difference for the Model I structure under the three seismic waves was 23.9 mm, which also shows the significant influence of spectral characteristics on the structural responses; (3) The vertical displacement responses of the isolated structures are basically smaller than those of the non-isolated structure, under the action of different seismic waves and different input modes; (4) The vertical displacement response law of the two isolated structure models stayed consistent under the three seismic waves.
(3)
Horizontal acceleration response
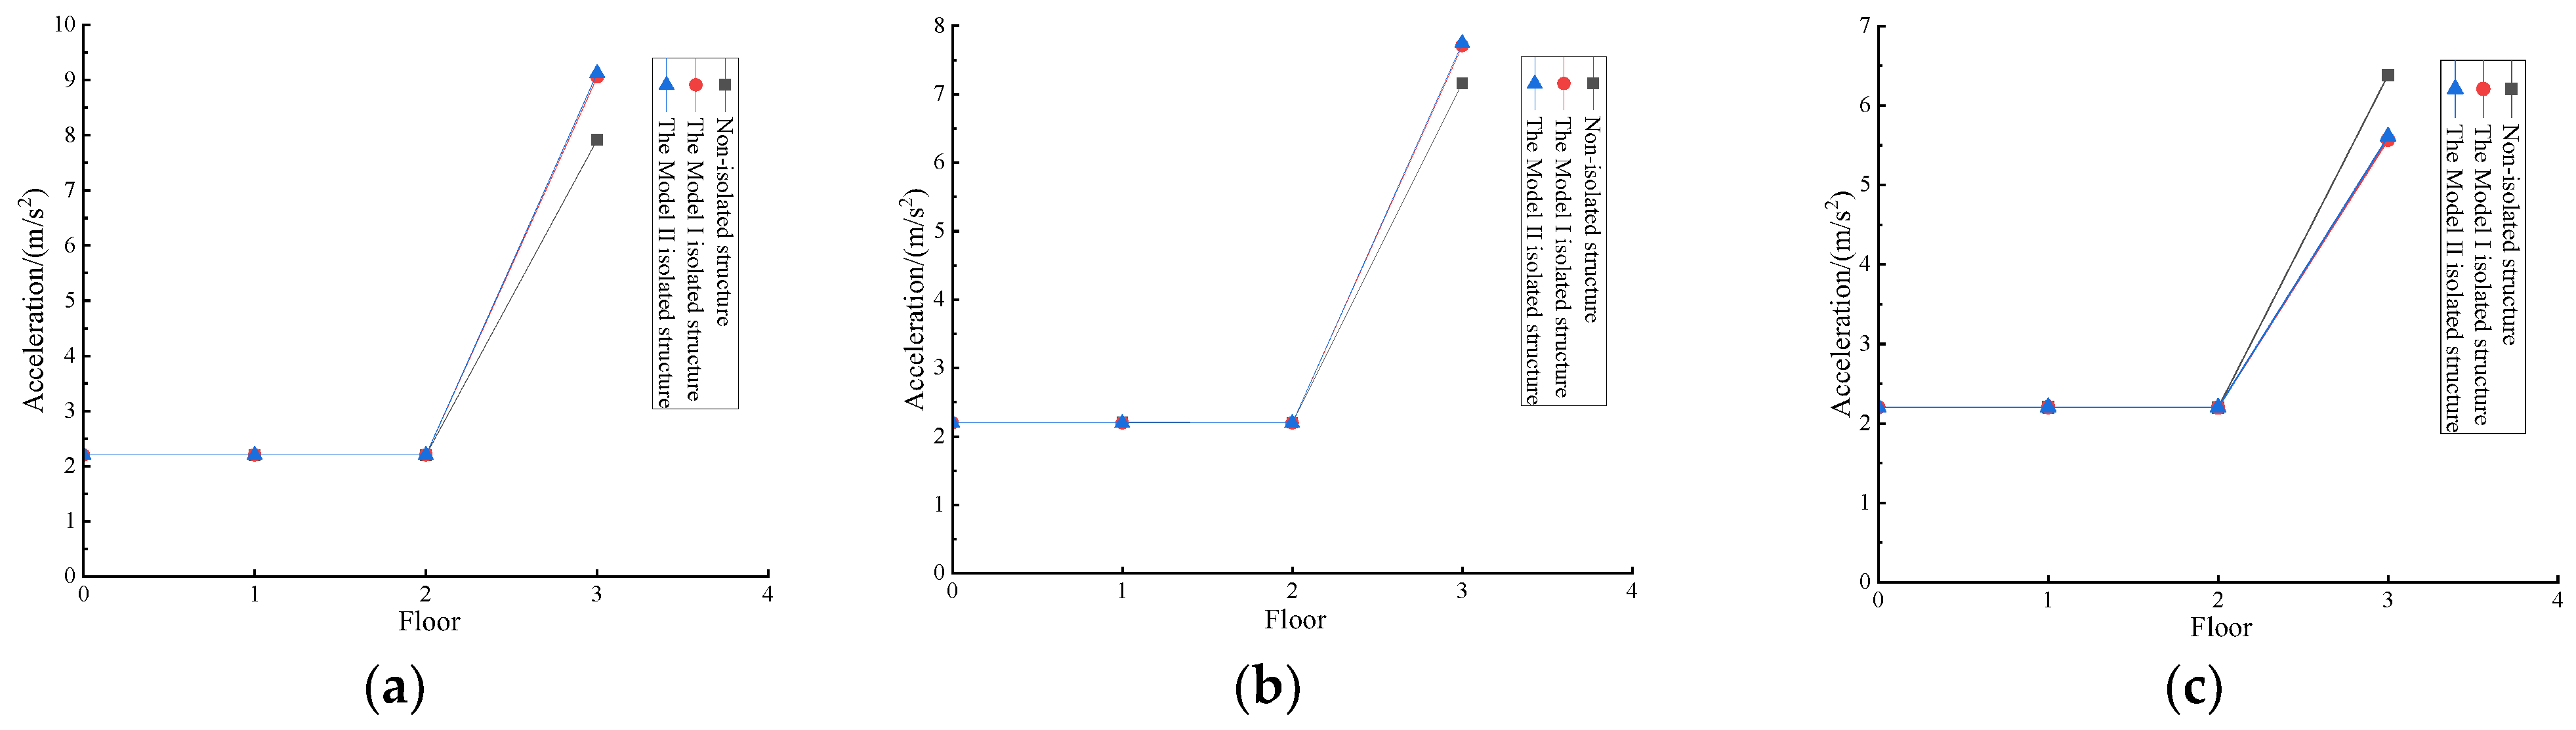
The peak horizontal absolute acceleration results of structures under 3D seismic input and vertical seismic input are shown in Figure 13 and Figure 14.
Figure 13 and Figure 14 show the following: (1) Under the 3D seismic input, the peak horizontal absolute acceleration response results are much larger than those under the vertical seismic input, which is consistent with people’s conventional cognition. (2) Under the 3D seismic input for the Taft wave and artificial wave, the horizontal acceleration response values of the Model I structure are smaller than those of the Model II structure. When subjected to the El Centro wave, the response values of the former structure become greater than those of the latter structure, indicating that the former has a better horizontal seismic isolation effect. When the vertical seismic input occurs, the horizontal acceleration curves of the two isolated structures basically coincide. (3) Compared with the non-isolated structure, the peak horizontal acceleration responses of the two isolated structures are greatly reduced under different seismic inputs, which reflects an excellent horizontal seismic isolation effect. (4) Under the 3D seismic input, the horizontal absolute acceleration of the seismic isolation layer is slightly higher than that of the frame layers. Under the vertical seismic input, the horizontal absolute acceleration response values of the three large-span structures showed an increasing trend with the increase of floors.
(4)
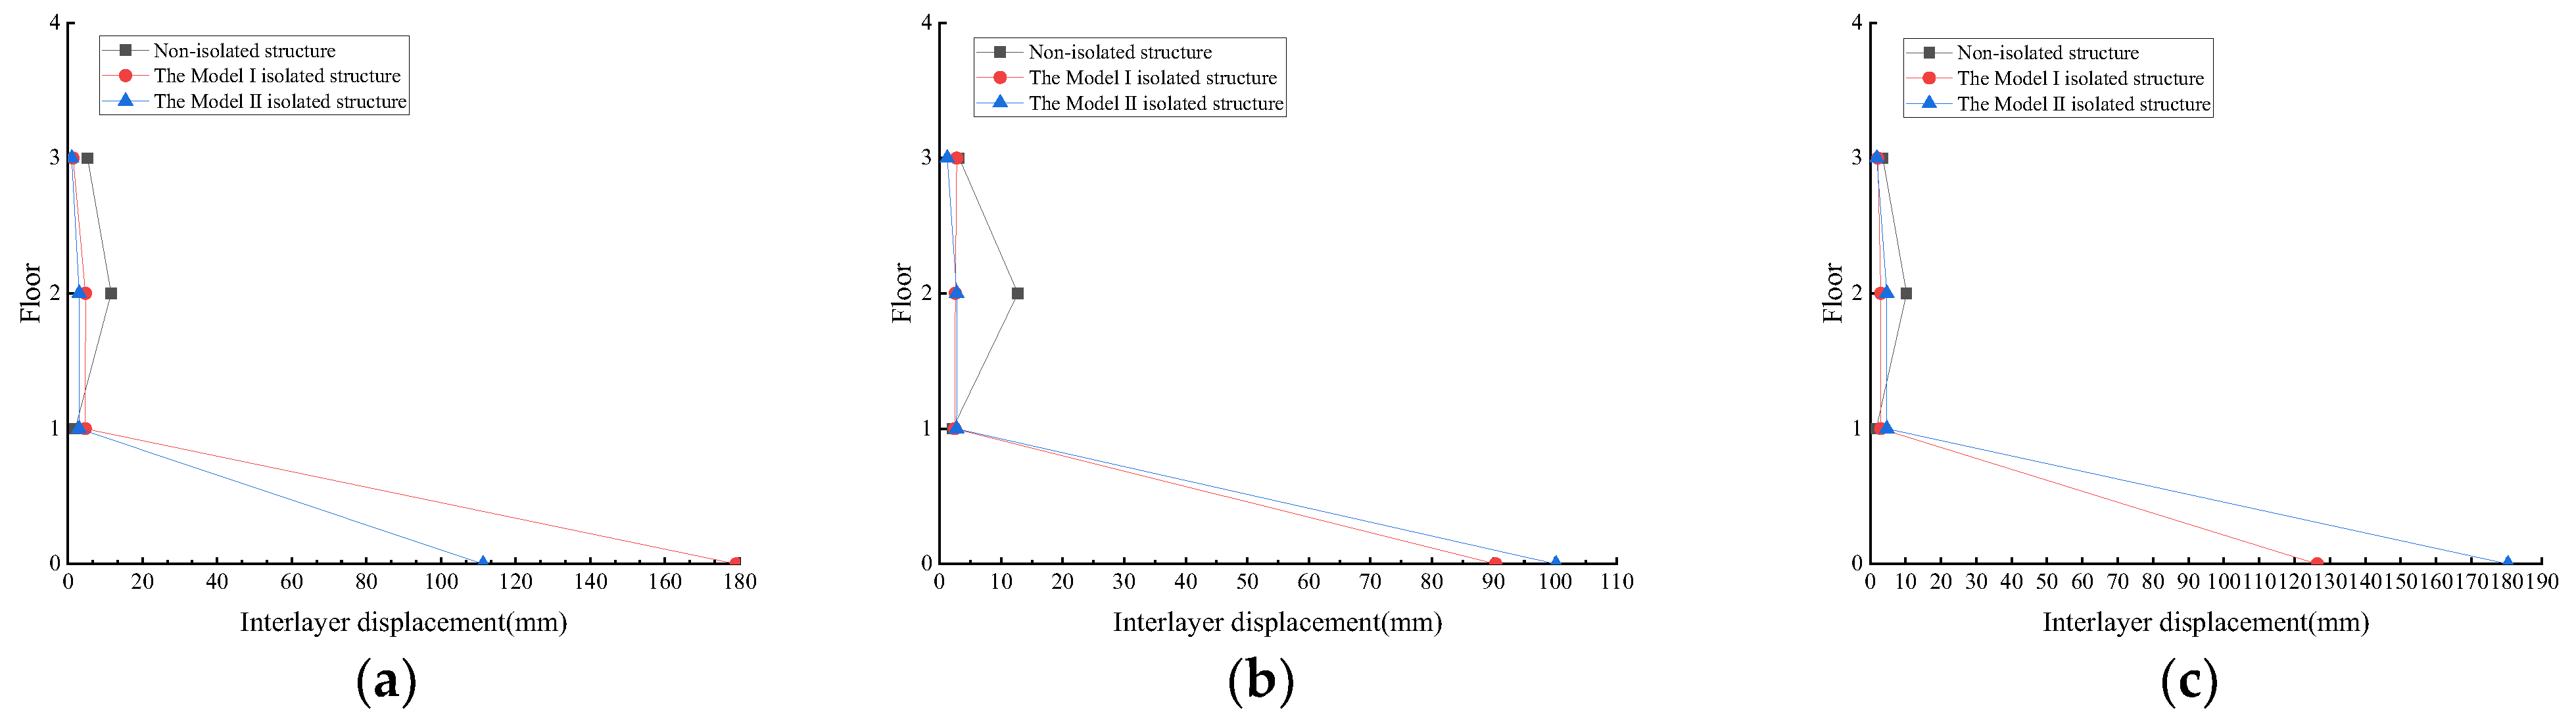
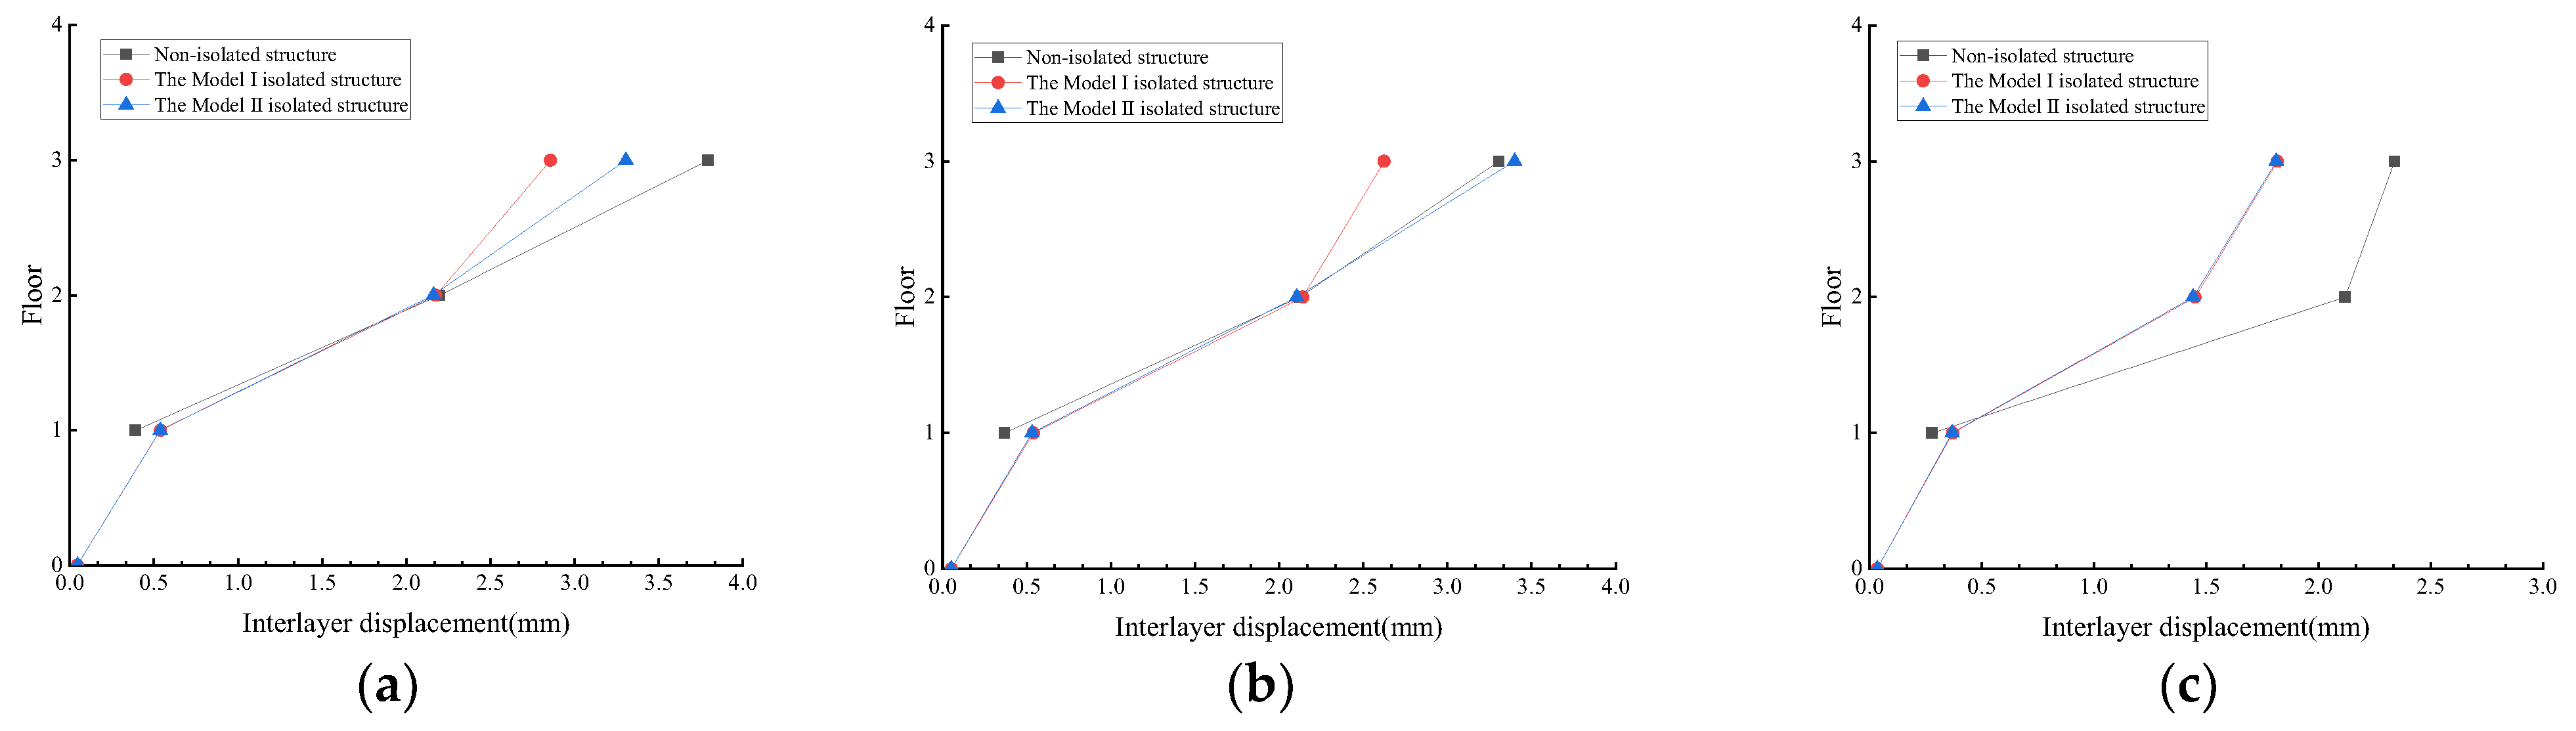
Interlayer displacement response
The interlayer displacement results of the three models are shown in Figure 15 and Figure 16.
The following can be seen in Figure 15 and Figure 16: (1) Under the 3D input method, the largest horizontal interlayer displacement for the two isolated structures occurs in the seismic isolation layers (limited value = 0.55 Dmin = 330 mm). After the seismic wave propagates upward through the isolation layer, the interlayer displacement results of the superstructure of the Model I structure are not obviously different from those of the Model II structure. However, the horizontal displacement of the seismic isolation layer is greatly affected by the horizontal seismic action under different input modes of seismic waves. (2) Under the action of the vertical seismic input, all the interlayer displacement values of the grid layer of the Model I structure do not exceed those of the Model II structure. However, there is no obvious difference in the interlayer displacement response results under the 3D seismic input. (3) The two seismic input methods have a great effect on the horizontal interlayer displacements of the seismic isolation layer. The interlayer displacements of the seismic isolation layer under the 3D seismic input are thousands of times those under vertical input. For the remaining floors, the influence of the two seismic input methods is reflected in the increasing trend of the inter-floor displacement along with the growth of the floor.
The maximum story drift, including the 1st floor, 2nd floor, and the grid layer, are shown in Table 7.
In the above table, it can be observed that the maximum story drift of the three models under rare earthquakes are 1/393, 1/1061, and 1/832, which comply with the provisions of the Code for Seismic Design of Buildings [16] (limit value = 1/50, for reinforced concrete frame structures).
(5)
Analysis of the influence of seismic input methods
The following discussion concerns the impact of two seismic input methods on the vertical seismic response results of the Model I structure. Table 8, Table 9 and Table 10 provide the comparison of vertical acceleration, vertical displacement, and horizontal acceleration under two seismic inputs. Error is defined as the result of (response results under 3D input—response results under vertical input)/response under the 3D input. It should be noted that the horizontal displacement of the isolation layer varies greatly under the two seismic input methods, which need not be discussed here.
As can be seen in the three tables above, compared to vertical seismic input, the vertical acceleration of each floor of the Model I isolated structure under 3D seismic input has a decrease extent of more than 50%. The error of structural vertical displacements is in the range of −55% to 26%. The structural horizontal acceleration results present an increase extent of more than 40%. However, the vertical input will weaken the horizontal acceleration response results of the structures, while the horizontal input will weaken their vertical acceleration response. The above results fully illustrate that in the analysis of the isolated structure’s response, the multidimensional characteristics of earthquakes cannot be ignored.

5. Conclusions

(1) The natural vibration period of the Model I large-span isolated structure is 1.23 and 4.27 times as long as the Model II isolated structure and the non-isolated structure, respectively. The longer the period of natural vibration, the less significant the earthquake force of the structure.
(2) The isolation layer in the Model I isolated structure provides a significant reduction in the horizontal component of seismic waves and exhibits excellent isolation properties during different seven-degree rare seismic excitations and seismic input modes. The peak acceleration responses of the three large-span structures show much higher values under the 3D seismic input as compared to the responses under the vertical seismic input, which aligns with conventional understanding. The vertical isolation effect of the Model I isolated structure with TNRB-DSB under the 3D seismic input is superior to that under the vertical seismic input, as horizontal seismic components are considered, thereby facilitating vertical isolation. These results indicate that TNRB-DSB is capable of ensuring the safety of large-span structures under seismic events of low probability.
(3) When subjected to a vertical seismic input, the interlayer displacement responses of the Model I isolated structure are superior to those of the Model II isolated structure. However, there are no significant differences in the interlayer displacement responses of the two isolated structures under the 3D seismic input.
(4) Under vertical seismic input mode, the horizontal and vertical acceleration response values of the three different large-span structures demonstrate a rising trend with increasing floor levels. The trend does not fit perfectly with 3D seismic input(the horizontal acceleration of structures under 3D seismic input has a reduction). This indicates that the vertical component of ground motion has a greater impact on the response value of steel grid roof structures in contrast to the horizontal seismic component. Therefore, special attention should be given to the seismic design of steel grid roof structures in engineering.
(5) There are noticeable distinctions in the response values of the time history analysis results between the non-isolated and isolated large-span structures subjected to various seismic actions or input modes. For instance, under two seismic input modes, the maximum difference in the vertical acceleration peak values of non-isolated structures experiencing the Taft waves was 13.75 m/s2. Moreover, under the vertical seismic input, the vertical acceleration peak value difference of the Model I structure subjected to the El Centro wave and Artificial wave was 3.49 m/s2. This highlights the significance of seismic spectrum characteristics and multi-dimensional seismic features in the structural response, which cannot be disregarded.

Author Contributions

Conceptualization, H.G.; Methodology, Z.G.; Software, X.Z.; Formal analysis, L.F., Z.C., J.D. and F.H.; Investigation, W.Q.; Data curation, Y.S. Writing—review & editing, C.Z. All authors have read and agreed to the published version of the manuscript.

Funding

This research was funded by The National Natural Science Foundation of China (Grant No. 51808298 & 52208395), the Science and Technology Plan Project of Nantong (Grant No. MS22022067), and the University Students Innovation and Entrepreneurship Training Program of Jiangsu (Grant No. 202210304062Z). The authors appreciatively acknowledge the financial support of the above-mentioned agencies.

Data Availability Statement

The data used to support the findings of this research are available from the corresponding author upon request.

Conflicts of Interest

The authors declare that there are no conflict of interest.

Abbreviations

AcronymInterpretation
TNRB-DSBThick Rubber Bearing-Disk Spring Bearing
TNRBThick rubber bearing
NRBsnatural rubber bearings
NRBnatural rubber bearing
DSBDisk Spring Bearing
LRBsLaminated Rubber Bearings
LRBLaminated Rubber Bearing

References

  1. Li, S.; Tan, P.; Ma, H. Applicability of equation of motion and damping matrix of base-isolated structure in dynamic response analysis. J. Vib. Shock 2023, 42, 198–206+248. (In Chinese) [Google Scholar]
  2. Shi, S.; Du, D.; Xu, J.; Wang, S. Multi-level early-warning system for base-isolated structures based on real-time monitoring data and its application on the Old Hall of Nanjing Museum. J. Build. Struct. 2022, 43, 47–57. (In Chinese) [Google Scholar]
  3. Zheng, W.; Tan, P.; Li, J.; Wang, H.; Liu, Y.; Xian, Z. Superelastic pendulum isolator with multi-stage variable curvature for seismic resilience enhancement of cold-regional bridges. Eng. Struct. 2023, 284, 115960. [Google Scholar] [CrossRef]
  4. Xu, W.; Du, D.; Wang, S.; Liu, W.; Li, W. Shaking table tests on the multi-dimensional seismic response of long-span grid structure with base-isolation. Eng. Struct. 2019, 201, 109802. [Google Scholar] [CrossRef]
  5. Gu, Z.; Wang, S.; Du, D.; Liu, W. Random seismic responses and reliability of isolated structures based on probability density evolution method. J. Vib. Shock 2018, 37, 97–103. (In Chinese) [Google Scholar]
  6. Xu, W.; Wang, S.; Liu, W.; Du, D.; Gu, Z. Shaking table test on vertical seismic responses of isolated large span structure. J. Build. Struct. 2020, 41, 19–31. (In Chinese) [Google Scholar]
  7. Bozorgnia, Y.; Niazi, M.; Campbell, K.W. Relationship between vertical and horizontal ground motion for the Northridge earthquake. In Proceedings of the 11th World Conference on Earthquake Engineering, Acapulco, Mexico, 23 June 1996. [Google Scholar]
  8. Kawaguchi, M. Design problems of long span spatial structures. Eng. Struct. 1991, 13, 144–163. [Google Scholar] [CrossRef]
  9. Liu, Y.; Zhong, W.; Mercan, O.; Tan, P.; Zhou, F. A new nonlinear model to describe the degradation law of the mechanical properties of lead-rubber bearings under high-speed horizontal loading. Struct. Control Health Monit. 2021, 28, e2836. [Google Scholar] [CrossRef]
  10. Zheng, W.; Wang, H.; Tan, P.; Li, J.; Liu, Y. Numerical modeling and experimental validation of Sliding-LRBs considering hysteretic strength degradation. Eng. Struct. 2022, 262, 114374. [Google Scholar] [CrossRef]
  11. Chen, Z.; Ding, Y.; Shi, Y.; Li, Z. Research on isolation performance of three-dimensional isolation device with vertical variable stiffness for long-span spatial structure. J. Build. Struct. 2019, 40, 35–42. (In Chinese) [Google Scholar]
  12. Liu, Y. Study on the Vibration Control of SMA-Friction Three-Dimensional Isolation and TMD Hybrid Structures. Master’s Thesis, Henan Polytechnic University, Jiaozuo, China, 2019. (In Chinese). [Google Scholar]
  13. Shimada, T.; Suhara, J.; Inoue, K. Three Dimensional Seismic Isolation System for Next-Generation Nuclear Power Plant With Rolling Seal Type Air Spring and Hydraulic Rocking Suppression System; American Society Mechanical Engineers: New York, NY, USA, 2005; pp. 183–190. [Google Scholar]
  14. Li, J.; Shang, Q.; Luo, Q.; Wang, T. Tests for mechanical performance of thick rubber bearings. J. Vib. Shock 2019, 38, 157–165. (In Chinese) [Google Scholar]
  15. Cao, Y.; Pan, P.; Sun, J.; Wang, H. Mechanical properties and isolation effect of disc spring–single friction pendulum 3D vibration isolation device. J. Build. Struct. 2022, 43, 44–53. (In Chinese) [Google Scholar]
  16. Boyce, M.C.; Arruda, E.M. Constitutive models of rubber elasticity: A review. Rubb. Chem. Technol. 2000, 73, 504–520. [Google Scholar] [CrossRef]
  17. Zheng, M.; Wang, W.; Chen, Z.; Wu, L. Determination for mechanical constants of rubber Mooney-Rivlin model. China Rubb. Indust. 2003, 50, 462–465. (In Chinese) [Google Scholar]
  18. Lin, R. Response Analysis of Long-Span Isolated Structures Under Inconsistent Seismic Inputs. Master’s Thesis, Nanjing University of Technology, Nanjing, China, 2013. (In Chinese). [Google Scholar]
  19. Iyengar, R.N.; Lyengar, K.T.S.R. A nonstationary random process model for earthquake accelerograms. Bull. Seismol. Soc. Am. 1969, 59, 1163–1188. [Google Scholar]
  20. GB 50011-2010; Code for Seismic Design of Buildings. China Architecture and Industry Press: Beijing, China, 2016. (In Chinese)
  21. CECS 126: 2001; Technical Specification for Seismic-Isolation with Laminated Rubber Beating Isolators. China Association for Engineering Construction Standardization: Beijing, China, 2001. (In Chinese)
  22. Lindley, P.B. Natural Rubber Structural Bearings. Jt. Seal. Bear. Syst. Concr. Struct. 1981, 1, 353–378. [Google Scholar]
  23. Li, Y.; Ma, Y.; Zhao, G. Study on the time-varying law of mechanical properties for natural rubber bearing used in offshore bridge considering the diameter size effect. World Earthq. Eng. 2020, 36, 169–177. (In Chinese) [Google Scholar]
  24. GB/T 20688.3-2006; Rubber Bearings Part 3: Elastomeric Seismic-Protection Isolators for Buildings. Standards Press of China: Beijing, China, 2006.
  25. GB/T 1972-2005; Disc Spring. Standards Press of China: Beijing, China, 2005. (In Chinese)
  26. GB/T 20688.1-2007; Rubber Bearings Part 1: Seismic-Protection Isolators Test Methods. Standards Press of China: Beijing, China, 2007. (In Chinese)
  27. Zheng, W.; Wang, H.; Li, J.; Shen, H. Parametric Study of Superelastic-Sliding LRB System for Seismic Response Control of Continuous Bridge. J. Bridge Eng. 2020, 25, 04020062. [Google Scholar] [CrossRef]
  28. Zheng, W.; Tan, P.; Liu, Y.; Wang, H.; Chen, H. Multi-stage superelastic variable stiffness pendulum isolation system for seismic response control of bridges under near-fault earthquakes. Struct. Control Health Monit. 2022, 29, e3114. [Google Scholar] [CrossRef]
Figure 1. The configuration of the TNRB-DSB: (a) cross-section view; (b) visual view.
Buildings 13 01288 g001
Figure 2. Diagram of DSB: (a) calculation diagram; (b) 3D view.
Buildings 13 01288 g002
Figure 3. The loading testing equipment.
Buildings 13 01288 g003
Figure 4. Test model of the TNRB-DSB.
Buildings 13 01288 g004
Figure 5. Force-displacement curves of vertical compression. (a) LRB; (b) TNRB-DSB.
Buildings 13 01288 g005
Figure 6. Force–displacement curves of horizontal shear. (a) LRB; (b) TNRB-DSB.
Buildings 13 01288 g006
Figure 7. Structural 3D finite element model.
Buildings 13 01288 g007
Figure 8. Acceleration response spectra: (a) El Centro wave; (b) Taft wave; (c) Artificial wave.
Buildings 13 01288 g008
Figure 9. Vertical acceleration of structures under 3D seismic input. (a) El Centro wave (b) Taft wave (c) Artificial wave.
Buildings 13 01288 g009
Figure 10. Vertical acceleration of structures under vertical seismic input. (a) El Centro wave (b) Taft wave (c) Artificial wave.
Buildings 13 01288 g010
Figure 11. Vertical displacement of structures under 3D seismic input. (a) El Centro wave (b) Taft wave (c) Artificial wave.
Buildings 13 01288 g011
Figure 12. Vertical displacement of structures under vertical seismic input. (a) El Centro wave (b) Taft wave (c) Artificial wave.
Buildings 13 01288 g012
Figure 13. Horizontal acceleration of structures under 3D seismic input. (a) El Centro wave (b) Taft wave (c) Artificial wave.
Buildings 13 01288 g013
Figure 14. Horizontal acceleration of structures under vertical seismic input. (a) El Centro wave (b) Taft wave (c) Artificial wave.
Buildings 13 01288 g014
Figure 15. Interlayer displacement of structures under 3D seismic input. (a) El Centro wave (b) Taft wave (c) Artificial wave.
Buildings 13 01288 g015
Figure 16. Interlayer displacement of structures under vertical seismic input. (a) El Centro wave (b) Taft wave (c) Artificial wave.
Buildings 13 01288 g016
Table 1. The parameters of the rubber bearings.
BearingsDiameter of Bearing (mm)Diameter of Lead Core (mm)Diameter of Opening (mm)Thickness of Single Rubber Layer (mm)Numbers of Rubber LayersThickness of Single Steel Plate (mm)Number of Steel Plates
LRB600120/4392.838
TNRB600/26012132.812
Table 2. The vertical stiffness of the bearings under different loading frequencies (kN/mm).
Loading Frequencies0.01 Hz0.02 Hz0.05 Hz0.1 Hz
LRB2399.672369.032397.282382.17
TNRB-DSB492.24524.70529.06584.07
Table 3. The vertical stiffness of the bearings under different vertical pressures (kN/mm).
Vertical Pressure2900 kN3400 kN3700 kN
LRB2355.992382.172472.75
TNRB-DSB507.49 584.07 604.19
Table 4. The vertical stiffness of the bearings under different pre-pressures (kN/mm).
Pre-Pressure1700 kN2040 kN2720 kN2900 kN
LRB2349.482391.322418.962355.99
TNRB-DSB280.05 454.74 1642.93 507.49
Table 5. Error in vertical stiffness results, between theoretical value and test value.
Loading Frequency (Hz)LRBTNRB-DSB
Theoretical Value (kN/mm)Test Value (kN/mm)ErrorModified Theoretical Value (kN/mm)Test Value (kN/mm)Error
0.12163.352382.179.19%458.67584.0721.47%
0.052163.352397.289.76%423.26529.0620.00%
0.022163.352369.038.68%402.01524.7023.38%
0.012163.352399.679.85%394.93492.2419.77%
Table 6. Natural vibration period of the large-span truss structures (s).
Nominal ModesNon-Isolated StructureIsolated Structure with TNRB-DSB (Model I)Isolated Structure with NRB and LRB (Model II)
10.5912.5232.052
20.5032.4712.035
30.3422.0981.867
40.2501.0290.993
50.2461.0180.980
60.2370.7350.719
70.2090.6370.629
80.2020.6000.599
90.1820.5920.584
100.1770.5010.500
110.1750.5010.496
Table 7. The maximum story drift under the action of rare earthquakes.
StructureSeismic WaveMaximum Interlayer Displacement Angle
Non-isolated structureEl Centro wave1/432
Taft wave1/393
Artificial wave1/487
Model I isolated structureEl Centro wave1/1055
Taft wave
Artificial wave
1/832
1/1389
Model II isolated structureEl Centro wave1/1657
Taft wave1/1794
Artificial wave1/1061
Table 8. Vertical acceleration under two seismic input methods (m/s2).
Seismic WaveFloorVertical Input3D InputError
El Centro waveIsolation layer2.202 1.437 −53.3%
1st floor2.202 1.437 −53.2%
2nd floor2.202 1.434 −53.6%
Grid layer9.059 5.887 −53.9%
Taft waveIsolation layer2.200 1.438 −53.0%
1st floor2.200 1.438 −53.0%
2nd floor2.200 1.435 −53.3%
Grid layer7.710 5.033 −53.2%
Artificial waveIsolation layer2.202 1.438 −53.1%
1st floor2.204 1.439 −53.2%
2nd floor2.200 1.435 −53.3%
Grid layer5.569 3.619 −53.9%
Table 9. Vertical displacement under two seismic input methods (mm).
Seismic WaveFloorVertical Input3D InputError
El Centro waveIsolation layer0.247 0.291 15.12%
1st floor0.256 0.315 18.73%
2nd floor0.262 0.319 17.87%
Grid layer65.317 42.443 −53.89%
Taft waveIsolation layer0.281 0.201 −39.80%
1st floor0.291 0.209 −39.23%
2nd floor0.298 0.214 −39.25%
Grid layer74.265 48.250 −53.92%
Artificial waveIsolation layer0.190 0.244 22.13%
1st floor0.197 0.265 25.66%
2nd floor0.202 0.269 24.91%
Grid layer50.373 32.720 −53.95%
Table 10. Horizontal acceleration under two seismic input methods (m/s2).
Seismic WaveFloorVertical Input3D InputError
El Centro waveIsolation layer0.007 2.200 99.7%
1st floor0.082 1.228 93.3%
2nd floor0.245 1.219 79.9%
Grid layer0.639 1.226 47.9%
Taft waveIsolation layer0.006 2.200 99.7%
1st floor0.058 0.690 91.6%
2nd floor0.174 0.728 76.1%
Grid layer0.456 0.878 48.1%
Artificial waveIsolation layer0.004 2.200 99.8%
1st floor0.052 1.328 96.1%
2nd floor0.157 1.355 88.4%
Grid layer0.409 1.360 69.9%
Disclaimer/Publisher’s Note: The statements, opinions and data contained in all publications are solely those of the individual author(s) and contributor(s) and not of MDPI and/or the editor(s). MDPI and/or the editor(s) disclaim responsibility for any injury to people or property resulting from any ideas, methods, instructions or products referred to in the content.

