Abstract
Geopolymer-based sustainable red mud bricks (SRMBs) were cast using industrial by-products under ambient curing. The ingredients used were red mud, fly ash, ground granulated blast furnace slag and alccofine, along with quarry dust and alkali activators as binders. This paper briefly presents the characterization, strength and durability studies conducted on SRMBs. The optimization techniques were used to fix the right mix proportions. The optimized mix proportion was identified as R45F40G10A05: 45% red mud, 40% fly ash, 10% ground granulated blast furnace slag and 5% alccofine. The compressive, flexural and split tensile strength of the ambient-cured specimens after 28 days were observed as 35.38 MPa, 6.4 MPa and 1.67 MPa, respectively. The results were analysed and validated by the finite element method using Analysis of Systems (ANSYS) software. The percentage of water absorption in the SRMBs was less than 6%, and it was an entirely efflorescence-free product with a pleasing appearance and colour. Fifty percent of the targeted compressive strength was acquired after three days of ambient curing. SRMBs are a green product casted by encapsulating industrial by-products into a functional building element. Thus, SRMBs are a suitable and alternative product to conventional clay burnt bricks.
1. Introduction
General
In recent years, the development of infrastructure with low/zero carbon dioxide (CO2) emissions have been necessary to protect the earth’s environment. Cement is one of the restorative materials in the construction industry and is also the primary source for high CO2 emissions. For each tonne of cement production, approximately one tonne of CO2 is emitted, which induces global warming [1,2,3,4,5]. Thus, low emission of carbon dioxide (CO2)-based materials and methods are the need of the hour. Geopolymers, a term coined by Davidovits in the 1970s, are sustainable and have low emissions of CO2. Geopolymers are inorganic alumino-silicates that form long-range, covalently bonded, amorphous networks [6]. At the same time, Davidovits and Davidovits [7] have presented a paper on rock-based geopolymers, that is, ferro-silico-aluminate (Fe-O-Si-O-Al-O).
The materials used for geopolymer bricks include fly ash, red mud, ground granulated blast furnace slag [8], waste material emanated from aggregate industries [9], construction and demolition wastes [10], waste glass powder, etc. In the alkali-activated material, when the calcium content increases, the solution of the pH increases. The activation of pH in sodium hydroxide is higher when compared with sodium carbonate and sodium sulphate [11].
Bayer’s technology produces red mud (RM), a waste residue, for generating alumina from bauxite ore. Aluminium refineries generate a large quantity of red mud. The quality of bauxite ore determines the production of red mud. In India, the production of red mud is about 1.5 tonnes for each tonne of alumina extracted [12]. The annual production of red mud in 2020 globally was about 175 million tonnes. In India, nine million tonnes of red mud are generated per annum (Press Information Bureau, Ministry of Mines) [13]. The red mud is an airborne, as the particle sizes are less than 4.5 microns. Red mud is deposited in and around alumina refineries in dry stacks or as slurry impoundments. Hence, a long-term solution and optimal usage of red mud is required. Red mud is airborne material which may get deposited in the lungs of the inhabitants and the living beings of the locality. According to the Central Pollution Control Board (CPCB), India [14], red mud is utilized for steel making process, additives, paints, etc. The effective utilization of red mud by encapsulating it in brick reduces the spreading of the material in the air and conserves the green cover.
Fly ash (FA) is a lightweight, fine grey powder with mostly spherical and pozzolanic particles. FA is a by-product generated from coal-fired thermal power plants. FA is silt-sized particles ranging from 10 to 100 microns, [15] collected from the electrostatic precipitator (ESP). Fly ash is classified as class C or class F ash, depending on the calcium oxide content in its chemical composition. According to the Central Electricity Authority, India (CEA) Reports [16] 2020–21, coal-fired energy will remain prominent in the foreseeable future.
Ground granulated blast furnace slag (GGBS) is a by-product from the steel industry. The global production of GGBS is approximately 270 million tonnes, and in India, GGBS production is around 7.2 million tonnes [17]. GGBS is one of the ingredients used to form SRMBs and is added in small percentages.
The last ingredient, alccofine (AL), is a material which is an ultra-fine slag-based substance used in low proportions in the mixture to increase the strength of the sustainable red mud bricks (SRMBs).
Manufacturing sand (MS) produced from quarries is encouraged to be used as a building material in India to avoid the depletion of natural river sand. Quarry dust (QD) is a by-product of manufactured sand from quarries that acts as filler material in the SRMBs.
Alkali activators such as sodium silicate and a low molarity sodium hydroxide solution are used as binding materials in the SRMBs. The alkali activators used as binding material can be sodium/potassium-based solutions [18]. Zhuang stated that the strength of the geopolymer is based on the ratio of sodium silicate to sodium hydroxide solution. The ratio of sodium silicate to sodium hydroxide solution is a fixed value for a particular product.
According to Madani et al. [9], the experimental process of geopolymer brick production was done by mixing and moulding, compaction with a pressure of 15 MPa and curing. Borrelli et al. stated that, the brick and block production was prepared in a precast concrete plant using the method of dry mixing of the ingredients, activation and vibro compaction [10]. The mixing the ingredients in a pan mixer and pouring the mixture in a rubber mould of size 200 × 100 × 100 mm were done by Chitambar Ganesh et al. [8].
Geopolymers form an amorphous network, having a long-term covalently bonded alumino-silicate and ceramic-like structure [6]. According to Davidovits [19], geopolymer cement is a high alkali (K-Ca)-Poly(sialate-siloxo) cement. The polymerization is accomplished through an inorganic polycondensation reaction. Mohsen and Mostafa (2010), Claudio Ferone et al., (2011), Saravanan et al., (2013), Alharthy et al., (2020) and Mahmoodi et al., (2021) [20,21,22,23,24] achieved a compressive strength from 25 to 70 MPa for geopolymer-based bricks at elevated temperatures from 60 to 70 °C for 24 h. The authors, Zheng and Li (2016) [20] and Jiang and Li (2019) [25] obtained a higher compressive strength (20 MPa to 50 MPa) by using a steam curing method with the temperature maintained from 105 °C to 215 °C. Zhao et al., (2012), Naggar et al., (2019), Manikandan et al., (2021) and Hameed et al., (2021) [26,27,28,29,30] attained a compressive strength of 1.4 MPa–20.3 MPa at ambient temperature.
None of the studies reported in the literature used ingredients such as RM, FA, GGBS and AL in combination in the geopolymer-based bricks using ambient curing.
The objective of this research is to use industrial waste by-products to produce an eco-friendly, environmentally sustainable, ambient-cured red mud bricks with a good mechanical properties and durability. As the waste products are casted in a contained form, pollution is avoided and thus the carbon footprints are reduced, which is a need for society. Sustainable red mud bricks of a rectangular shape and 228 × 108 × 80 mm in size, resembling the colour of conventional clay burnt bricks, were generated in the current study. By combining the above ingredients in appropriate proportions with the alkali activators sodium silicate and very low molarity (4 M) sodium hydroxide solution in a binder ratio of 0.35–0.5. The optimized mix proportion was identified as R45F40G10A05: 45% red mud, 40% fly ash, 10% ground granulated blast furnace slag and 5% alccofine. The standard experimental methods for measuring mechanical properties such as compressive, flexural and tensile strength and durability tests such as water absorption, initial rate of water absorption and alternate wetting and drying tests were performed as per Indian code provisions. Thus, the different ingredients were mixed in proper proportions to produce SRMBs, a value-enriched building material. In addition, SRMB is a suitable alternative to conventional clay-burnt bricks.
2. Materials and Methods
2.1. Materials
In this investigation, the materials red mud, fly ash, ground granulated blast furnace slag and alccofine were used as fines, confirming to code provisions (IS 12089:1987) [31], along with quarry dust that acted as filler. The red mud was procured from HINDALCO, Odisha, India, as a by-product of alumina refineries. Class ‘F’ fly ash was collected directly from the electrostatic precipitators of the thermal power station at Mettur, Tamilnadu, India. Ground granulated blast furnace slag is a by-product of the steel industry and was procured from JSW industry, Salem, Tamilnadu, India, which was added in a small percentage. Alccofine, an ultrafine processed form of GGBS, was added in small percentage as the last ingredient. AL was procured from Counto microfine product, Pvt Ltd., Goa, India. The filler, quarry dust, is a by-product of manufactured sand and the material was obtained from local quarries. Alkali activators such as sodium silicate and sodium hydroxide flakes were obtained commercially and added to the mix as a very low molarity (4 M) sodium hydroxide solution. The proportion of the materials were chosen based on various trials and the optimal mix was fixed accordingly.
2.2. Characterization of Materials
The physical properties of the materials are given in Table 1, and the particle size distribution of the filler material is presented in Figure 1. The chemical composition of RM, FA, GGBS, and AL were analysed using the X-ray fluorescence (XRF) method, and the results are presented in Table 2, Table 3, Table 4 and Table 5. The chemical composition of the red mud varied slightly compared to the red mud utilized by Prasetyoko et al. and Panwar et al. [32,33]. The content of iron oxide present in the red mud was 54.26%, slightly more than that of the values presented by other researchers. A similar variation was observed in the chemical composition of the other materials. The chemical composition of the fly ash is presented in Table 3. The results were compared with the fly ash used by Nordin et al., (2016) and Rafieeizonooz et al., (2021) [34,35]. The fly ash used in the present research was rich in alumina when compared to the other fly ashes. At the same time, the silica content was low. The chemical composition of the GGBS and AL was determined and the results are presented in Table 4 and Table 5. The slag used by Pfingsten et al., (2018), Hammad et al., (2021), Sagar et al., (2020) and, Panda et al., (2020) [36,37,38,39] were compared with the GGBS and AL used in this investigation. The calcium oxide in our materials was low compared to the other studies.

Table 1.
Physical properties of the materials.
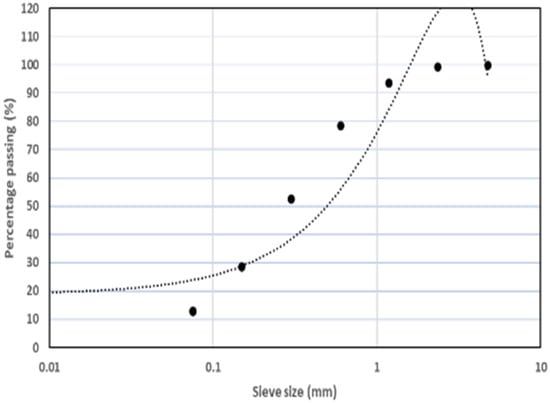
Figure 1.
Particle size distribution of quarry dust.

Table 2.
Chemical composition of red mud.

Table 3.
Chemical composition of fly ash.

Table 4.
Chemical composition of ground granulated blast furnace slag.

Table 5.
Chemical composition of alccofine.
The fines are captured through a high-resolution image technique called field emission scanning electron microscopy (FESEM). Figure 2 displays the microscopic images of the red mud. Iron was the most significant element in this image compared to other components. Figure 3 examines the image of the fly ash, showing that most of the material is spherical and high in silica and alumina. Meanwhile, GGBS and alccofine, shown in Figure 4 and Figure 5, were also scanned by FESEM. GGBS and alccofine resemble each other, as AL is an ultra-fine processed form of GGBS. EDAX determined the elemental composition of each material using the X-ray technique. This technique was used in conjunction with FESEM. The results are provided as the elemental composition by mass percentage with a graphical representation that displays the primary element with a higher peak. Thus, Figure 2, Figure 3, Figure 4 and Figure 5 display the elemental composition and graphical representation of the RM, FA, GGBS and AL, along with the FESEM images. XRD is an expeditious analytical technique to determine the structure of materials. The XRD measurement pattern of the industrial by-products used in this research is represented in Figure 6a–d. The main peak of the samples is presented next to the XRD analysis. The peak indicates the presence of iron oxide in Figure 6a and aluminium silicon oxide in Figure 6b. The XRD pattern for GGBS and AL is presented in Figure 6c,d.
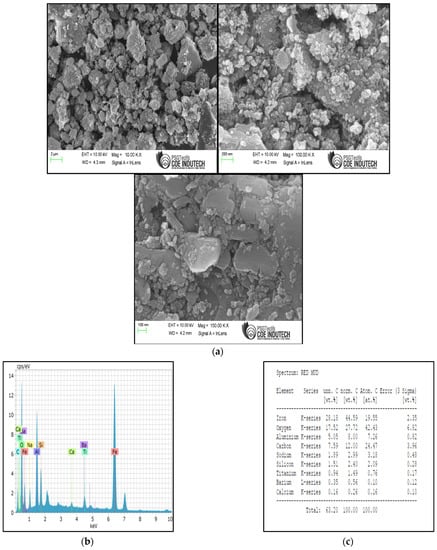
Figure 2.
(a) Field emission scanning electron microscope images of red mud. (b,c) Energy dispersive X-ray analysis of red mud.
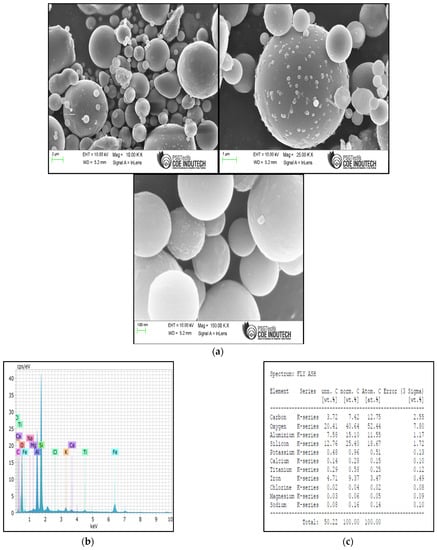
Figure 3.
(a) Field emission scanning electron microscope images of fly ash. (b,c) Energy dispersive X-ray analysis images of fly ash.
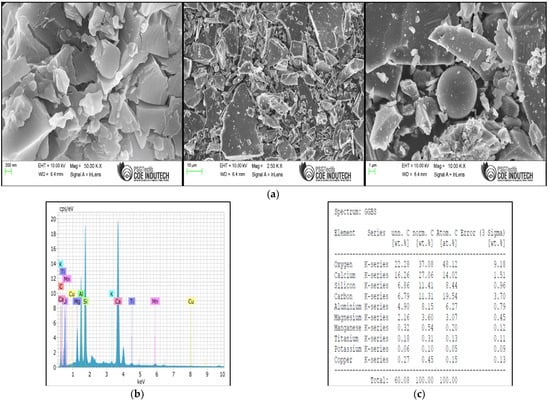
Figure 4.
(a) Field emission scanning electron microscope images of ground granulated blast furnace slag. (b,c) Energy dispersive X-ray analysis of ground granulated blast furnace slag.

Figure 5.
(a) Field emission scanning electron microscope images of alccofine. (b,c) Energy dispersive X-ray analysis of alccofine.
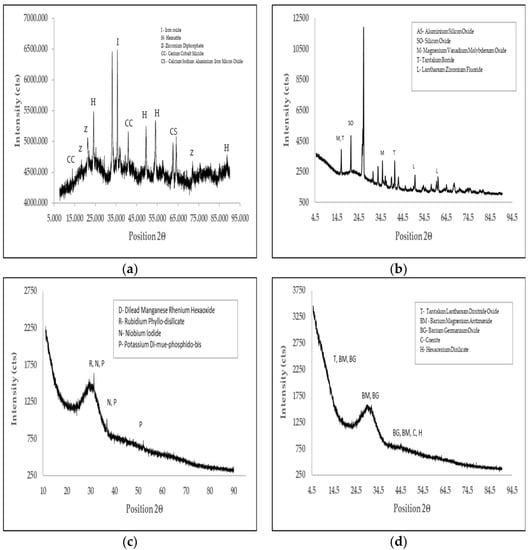
Figure 6.
(a) X-ray diffraction pattern of red mud sample. (b) X-ray diffraction pattern of fly ash sample. (c) X-ray diffraction pattern of ground granulated blast furnace slag sample. (d) X-ray diffraction pattern of alccofine sample.
Thermogravimetric analysis was performed for the RM, FA, GGBS and AL. According to Zawrah et al. [40], no significant loss was observed above 800 °C in the absence of thermal decomposition reactions. The residual mass of the different components during temperature changes is presented in Figure 7 up to a maximum of 1200 °C. The residual mass and the maximum temperature for the ingredients are shown in Table 6. Thus, the thermal stability of the ingredients was stable. There was no major loss in the residual mass of all the samples used as fines. All the samples used to make the SRMBs remained stable up to 1198.9 °C.
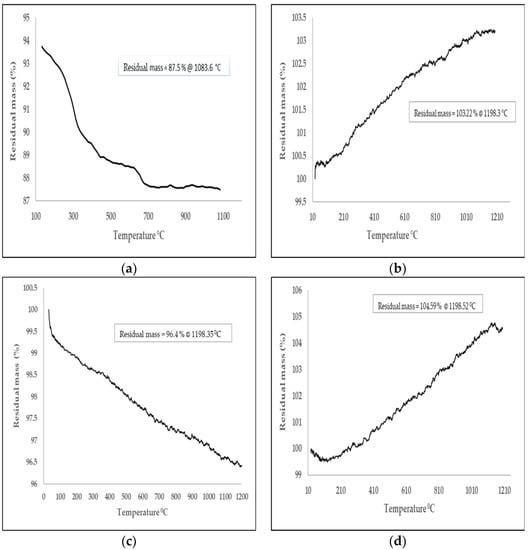
Figure 7.
(a) Thermogravimetric analysis of red mud sample. (b) Thermogravimetric analysis of fly ash sample. (c) Thermogravimetric analysis of ground granulated blast furnace slag sample. (d) Thermogravimetric analysis of alccofine sample.

Table 6.
Thermogravimetric analysis of the ingredients.
3. Preparation of Sustainable Red Mud Bricks
The red mud was available in pellet form and was pulverized using a ball mill. The particle size achieved was about 1 micron. The fines (RM, FA, GGBS and AL) were mixed with the filler material (QD) at different proportions along with the alkali activators, as given in Table 7. The proportions were mixed in different groups of samples such as A, B, C and D with subscripts 1, 2, 3 and 4. Group A indicates the varied proportion of RM and FA. Group B indicates the composite ratio of RM, FA and GGBS. Group C indicates the mixed proportion of RM, FA and AL and group D indicates the mix of RM, FA, GGBS and AL. The mix R30F70G00A00 represents red mud at 30 per cent, fly ash at 70 per cent, ground granulated blast furnace slag at zero per cent and alccofine at zero per cent. The mix design was calculated based on the specific surface of the fine materials, as given in Table 1. The RM, GGBS and AL were proportioned by conforming to IS 12089:1987 [31] and FA conformed to IS 3812 (Part 1): 2013 [41].

Table 7.
Mix proportions.
The optimization was fixed by using the Minitab 20.1.1 tool. The regression equation was generated by the general linear model of the variable of the mix proportions with the experimentally identified compressive strength using the factor coding method (−1, 0, +1). The compressive strength is denoted by X1 and the residuals RM, FA, GGBS and AL are indicated as Y1, Y2, Y3 and Y4. The equation of regression for X1 was generated by the general linear regression method given below, where the values were interpreted from Table 8, and the coefficients of linear regression and regression statistics are given in Table 9. The value of R2 was 0.994, which is highly acceptable. The regression analysis results using ANOVA (analysis of variance) are shown in Table 8. The values mentioned in Table 8 show the relationship among the variables, where the coefficient of determination R2 is evaluated. In this formulation, Y3 and Y4 are not considered as the major parts as Y1 and Y2 are. Y11 + Y12 + … are the terms of the coefficients as given in Table 8. The residual plots and the interaction plots based on X1 are shown in Figure 8.

Table 8.
Coefficients from linear regression.

Table 9.
Regression statistics by ANOVA.
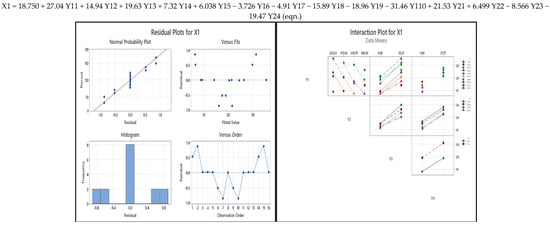
Figure 8.
Residual plots and interaction plots from the general linear model for X1 (compressive strength).
The factorial design (Table 10) was analysed by the Plackett–Burman (PB) method and was found to be significant where the p-value was less than 0.05 as mentioned in Table 8. By identifying the critical variables, the probability output and predicted values for the compressive strength X1 are given in Table 11. From the results of the Table, sample number 16 pertaining to group D achieved a higher percentile which indicates the optimal proportions. From the various mix proportions, the ratio of filler to fine materials was 2:1, and two parts of filler were added for every one part of fines. The mix proportions of the fines were determined as RM:FA:GGBS:AL 9:8:2:1 (parts by weight). The fine material was proportioned as nine parts of red mud with eight parts fly ash, two parts ground granulated blast furnace slag and one part alccofine. The alkali activators, sodium silicate solution and 4 M sodium hydroxide solution were mixed in the ratio of 2.5:1 by volume. The sodium silicate solution contained undissolved silicon dioxide (SiO2) nanoparticles, which induces additional intra-atomic bonding by increasing the viscosity of the liquid phase, which binds the particles together. Thus, the mixture was prepared 24–36 h before the addition of the dry ingredients. The said ingredients were blended well with the alkali-activated solution, which was transferred through a conveyor belt and fed into the feeder box. The mixture was compressed into bricks using a hydraulic ram, with a pressure of 15 MPa for the respective standard shape and size (228 mm × 108 mm × 80 mm) with sharp edges and corners. The SRMBs were then left for curing at ambient temperature for a minimum three days to a maximum of twenty-eight days. SRMB abidance adhered to the code provision prescribed by the Indian Standard Institution (IS 1077:1992) and [IS 3495 (Part 1 to Part 3)] [42,43,44,45]. The quality check of the brick, such as tests for compressive strength, flexure strength, split tensile, water absorption, initial water absorption, alternate wetting and drying and efflorescence was performed on the initial age day, i.e., the 3rd day from the date of casting the bricks; hence, the process was optimized after day 28 of curing until 90 days from casting. The curing was only done at ambient temperature (nearly 22 °C to 35 °C).

Table 10.
Factorial identification by Plackett–Burman method.

Table 11.
Probability and predicted output as percentile.
Figure 9 shows the graphical representation of the probability and predicted output showing some similarities in small variations. The normal probability plot based on the resulting compressive strength is represented in Figure 10. The optimal point from the response surface regression results is listed in Table 12 and Figure 11, where A represents compressive strength and B represents tensile strength and the Pareto chart for the resulting compressive and tensile strengths is given in thirteen runs. From the above observations, the optimum value from the analysis and experimental set-up was identified as sample D4 with mix R45F40G10A05 after twenty-eight days of ambient curing.
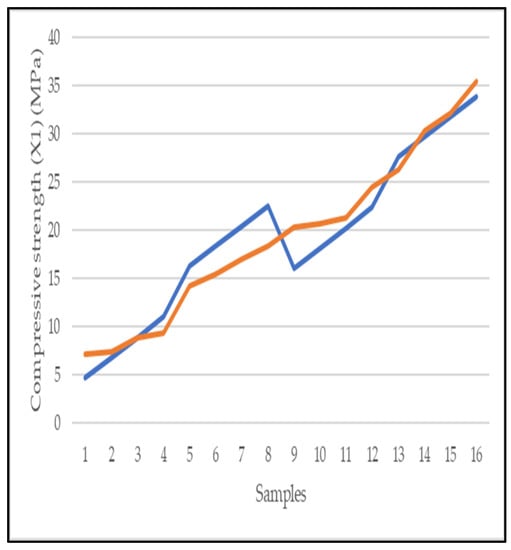
Figure 9.
Probability and predicted output of compressive strength.
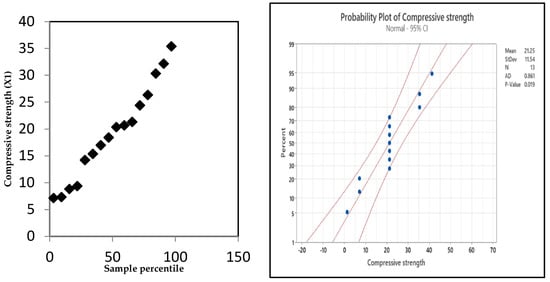
Figure 10.
Normal probability plot of compressive strength (X1).

Table 12.
Optimal points between compressive and tensile strength.
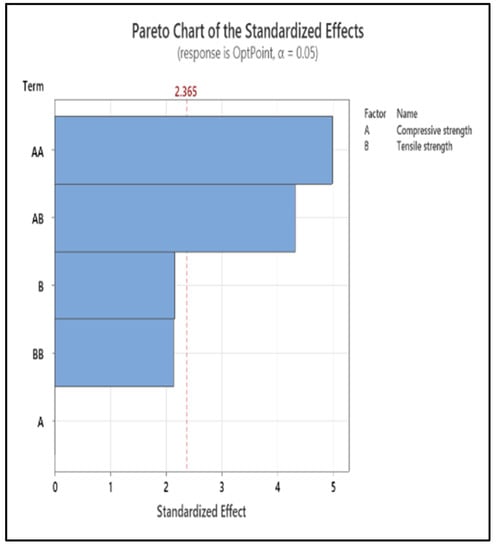
Figure 11.
Pareto chart of optimal points for compressive (A) and tensile (B) strength.
4. Testing Methods
The dimensionality test was performed conforming to IS 1077:1992 [42]. Twenty bricks were randomly selected to perform this test. The average deviation of the total length of the individual specimen was at most 5 mm. The entire width and height deviation was at most 3 mm. The conventional water absorption test was performed confirming to IS 3495:2019 (part 2) [44]. The average of five specimens resulted in the percentage of water absorption. The efflorescence test was performed conforming to IS 3495:2019 (part 3) [45]. No soluble salt deposit was found, confirming no efflorescence in the bricks. The compression test was performed as per IS 3495:2019 (part 1) [43]. The brick was placed between the two plywood sheets in an automatic hydraulic compression testing machine. The load was gradually applied to the specimen at the uniform rate of 14 N/mm2 per minute. The compressive strength was taken from the average of five brick specimens. The flexure test was performed on the SRMBs conforming to IS 4860:1968 [46]. The load was applied at a uniform rate of 300 N/min from the top of the middle bearer, which was supported in the centre of the brick as shown in following figure. The splitting tensile strength test was performed as per ASTM C 1006-7 [47]. The load was gradually applied to the specimen at a constant rate of 14 N/mm2/minute. The brick was split into two halves exactly in the middle and the image is shown in the following figure. As part of the durability studies, the initial water absorption of the brick was measured conforming to ASTM C 67 [48]. The difference between the initial and final weights were calculated, and the percentage was not more than ±2.5% as per code. The alternate wet and dry process was performed using the procedure mentioned in the same code and continued for at least seven cycles. The weight was measured at the final cycle. The processed bricks were subjected to a compressive load, and thus, the compressive strength of the specimen was recorded.
5. Results and Discussion
The results of the mechanical strength and water absorption analyses of the samples that were cured for 28 and 90 days for all the mix proportions, as mentioned in Table 7, are summarized in Table 13 and Table 14, respectively. The streamlined values are graphically represented.

Table 13.
Mechanical strength and water absorption of red mud bricks after 28 days.

Table 14.
Mechanical strength and water absorption of red mud bricks after 90 days.
The dimensionality test was performed conforming to IS 1077:1992 [42]; twenty bricks were randomly selected to perform this test. The measurements of the total length, breadth and height for twenty specimens, ten specimens and individual specimens are indicated in Figure 12. The variation in a small-scale fraction, shown in the graph, demonstrates that the bricks were uniformly cast and will be aligned with the bonding of mortar between the bricks.
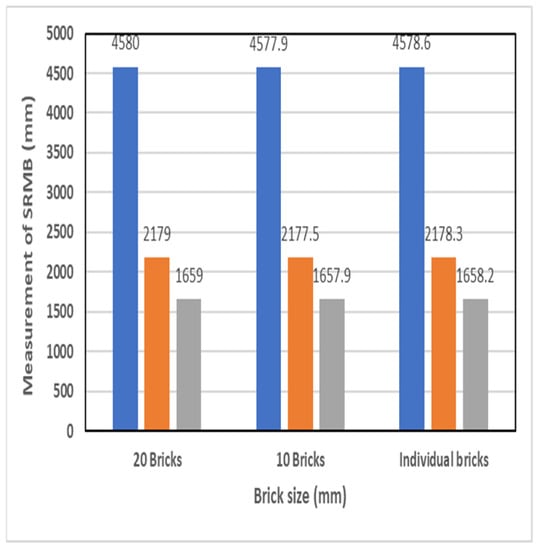
Figure 12.
Variation in dimension results of sustainable red mud bricks.
The water absorption capacity of the SRMBs was performed as in Figure 13. A minimum of five specimens were immersed in water, and the average weight difference was calculated as the percentage of water absorption. The average percentage water absorption value of the optimized mix after 28 days and 90 days was less than 6%, represented in Figure 14. Thus, the bricks can be considered heavy-duty bricks as per IS 2180:1988 [49]. The water absorption for the SRMBs after 28 days and 90 days of curing was measured and the results are presented in Figure 14. From the results, it is obvious that the SRMBs had good durability and were considered to be suitable for heavy duty applications as the percentage of water absorption was much less than the prescribed value (10%) as per clause 6.2 of IS 2180:1988 [49].
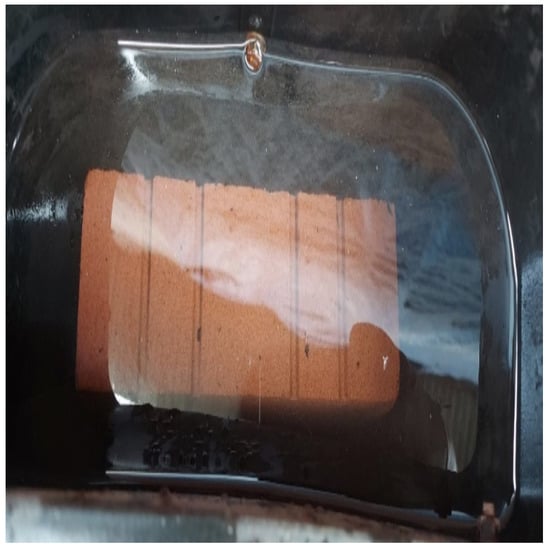
Figure 13.
SRMB immersed in water.
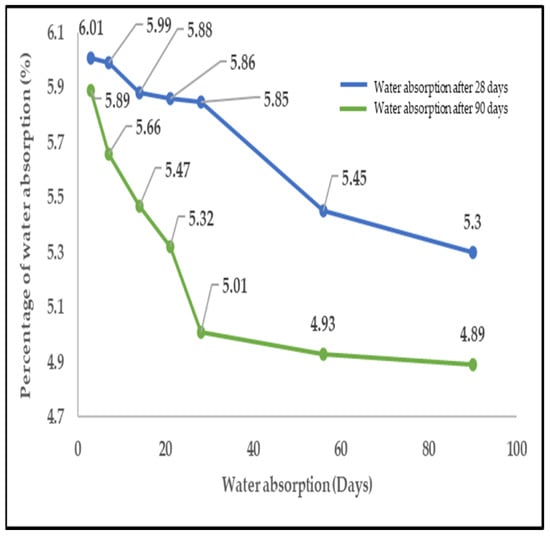
Figure 14.
Variation in water absorption of SRMBs after 28 and 90 days of curing.
The efflorescence test was conducted as per IS 3495:2019 (part 3) [45]. There were no soluble deposits in the bricks. The bricks resembled transparent specimens which are free from efflorescence.
The compression test was performed for the various design mix proportions. The optimized result for the combination of R45F40G10A05, is indicated in Figure 15. The Figure shows the compressive strength from the 3rd day of curing to the 90th day, where 40 to 50% of strength was achieved on the third day. Thus, compressive strength was calculated for different curing durations, and the results are presented in Figure 15 as the average results from five bricks. The failure of the SRMBs is shown in Figure 16, where the bricks failed at the edges but the central portion remained intact. The compressive strength increased with the increase of the curing period. A rapid strength was gained up to 28 days of curing and there was a gradual increase up to 90 days. A high compressive strength of 35.38 MPa on the 28th day and 44.38 MPa on the 90th day of SRMB was produced as per Indian code specifications [IS 3495:2019 (part I)] [43] where the results also indicate the SRMBs be considered as heavy-duty bricks, as per Indian standard code specifications (IS 2180:1988) [49]. In addition, the compression strength increased with the decrease in the filler ratio and was optimal at a 1:2 ratio of fines to filler.
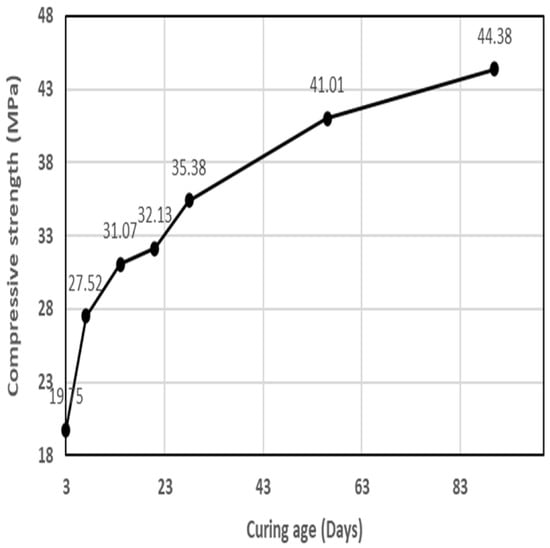
Figure 15.
Variation in compressive strength over curing period of SRMBs.
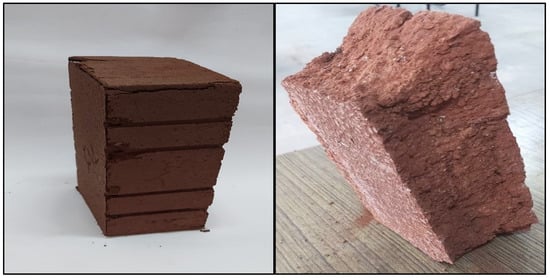
Figure 16.
Failure of SRMB after compressive strength.
The flexural strength of the brick specimen was measured and calculated according to IS 4860:1968 [46], and the results are represented graphically in Figure 17. The graph depicts the flexural strength of the optimized mix for the specimen from the 3rd to the 90th day. The average flexural strength was determined from a minimum of five samples, and the results showed an increase in flexural strength with increasing curing age. The flexural strength was achieved on the third day of specimen curing. The flexural test set-up and the failure of flexural strength is shown in Figure 18. The image depicts the common type of failure seen in all the samples. The SRMBs had an excellent flexural strength of 6.07 MPa on the 28th day and 6.38 MPa on the 90th day, conforming to the Indian code specifications (IS 4860:1968) [46]. In addition, the compressive strength and the flexural strength had similar rapid increases up to 28 days and a gradual decrease until 90 days into the curing period.
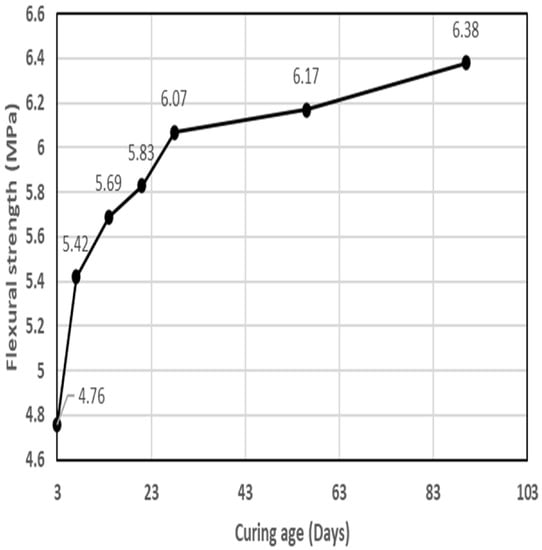
Figure 17.
Variation in flexural strength with curing period of SRMB.
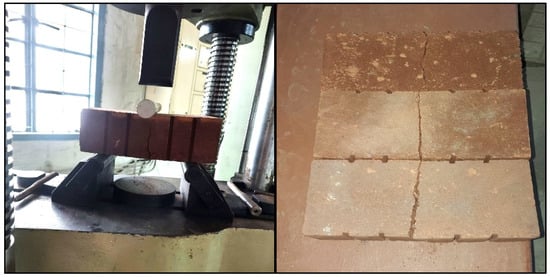
Figure 18.
Flexural strength test set-up and failure after flexural test.
The splitting tensile strength test was performed based on the ASTM C 1006-7 code [47]; the results are given in Figure 19. The load was gradually applied to the specimen at a uniform rate of 14 N/mm2. The average of five brick specimens was computed. The load was thus increased with increasing compression load. Figure 20 shows the splitting of an SRMB in two halves. The splitting tensile strength using the method ASTM C 1006-7 [47] was 1.67 MPa on the 28th day and 1.96 MPa on the 90th day.
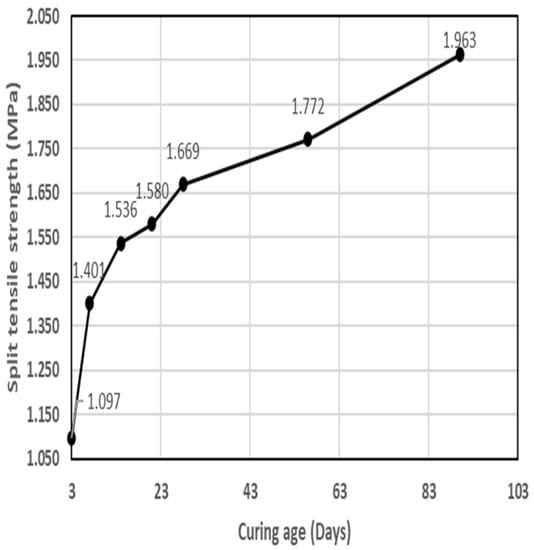
Figure 19.
Variation of split tensile strength.
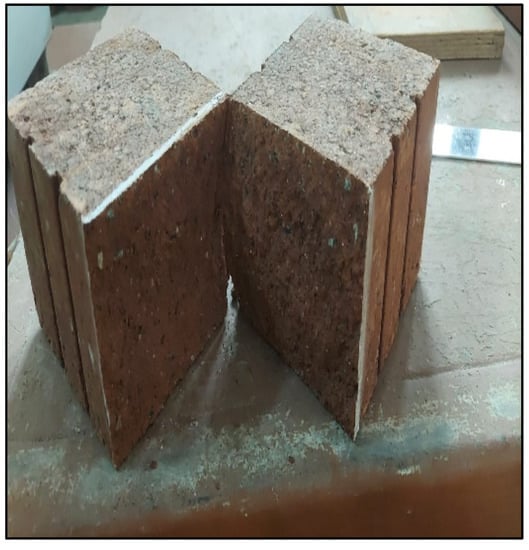
Figure 20.
Failure of brick after split tensile strength test.
The initial water absorption of the brick was performed conforming to ASTM C67-1299) [48]. The average difference between the initial weight after oven drying up to 110 °C and the final weight was calculated by immersing the brick in water for one minute as per clause 10.4.1 from the mentioned code. The average percentage of initial water absorption was recorded at 3, 7, 14, 21, 28, 56 and 90 days during the curing period viz is given in Figure 21. The initial rate of the water absorption method conformed to ASTM C67-1299 [48]. The results of the initial water absorption on the 28th and 90th days of the casted specimen were 1.95 percent and 1.78 percent, respectively.
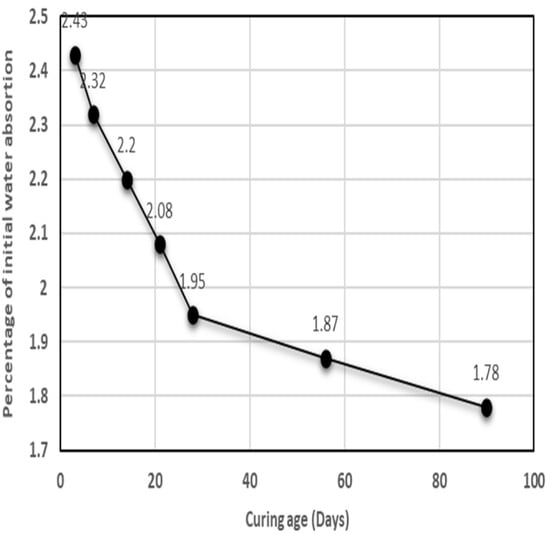
Figure 21.
Variation of initial water absorption of SRMB over curing period.
The alternate wetting and drying test were performed based on the ASTM C67 [48] code provisions for seven cycles of alternate wetting and drying with prior processing. The samples were cured for 28 days under ambient conditions before being subjected to the wetting drying test. An average of five samples were used for each cycle. The bricks were subjected to a compressive load. Figure 22 shows the cyclic graphical representation of the variation in weight after each cycle. The average result of compressive strength after seven cycles of wetting and drying of the samples was decreased by 16.62% (29.4 MPa) with respect to the compressive strength of a standard specimen.
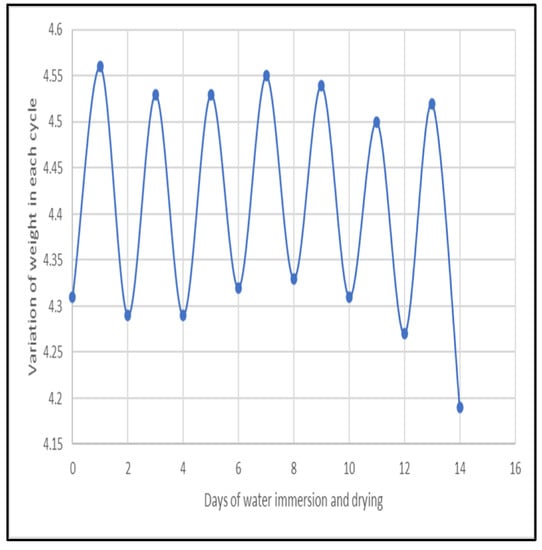
Figure 22.
Alternate wetting and drying test of sustainable red mud bricks.
6. Micro Characterization of SRMB Composition
The FESEM analysis results are shown in Figure 23a. This image shows the complex variations of the combined chemicals and the homogeneous mixture of all the materials. The iron element combined with the aluminium and silica present in the mix plays a significant role. The energy-dispersive X-ray analysis measured the chemical composition, and is shown as a percentage in Figure 23b,c. The peak shows the iron combined with titanium, aluminium and silica at a particular elevation.
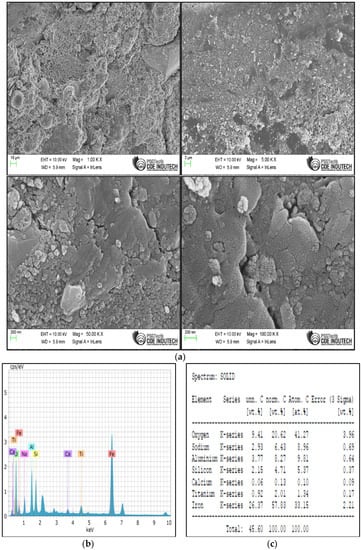
Figure 23.
(a) Field emission scanning electron microscopy images of sustainable red mud brick. (b,c) Energy dispersive X-ray analysis of sustainable red mud brick.
The XRD pattern in Figure 24 shows that the structure of the SRMBs are amorphous. The position of 02θ was from 5.47 to 33.71. Calcium europium manganese oxide and aluminium phosphate hydrate were given a pattern list score in the analysis. The wide hump clearly shows that the mineral phases were completely dissolved in the binding solution forming the geopolymerisation. The mass residue of the SRMBs was measured using TGA and the solid mass residue at 548 °C was 92.65%, i.e., it tended to have less loss in the SRMBs even at high temperatures. Thus, the thermal stability of the SRMBs was very high. The volatile components present in the SRMBs showed a small weight change even at a high temperature of more than 500 °C as shown in Figure 25. Figure 26 shows the graphical representation of the FTIR spectroscopy results, where the x-axis shows the intensity of the infrared spectrum and the y-axis represents the analysed material transmitted, i.e., the infrared light absorbed [50]. There were no peaks between 4000 and 750 cm−1, showing that there were no aromatic structures. A sharp peak was determined between 750 and 400 cm−1. As the peaks were very small, small organic materials may present in the material.

Figure 24.
XRD pattern of SRMB.
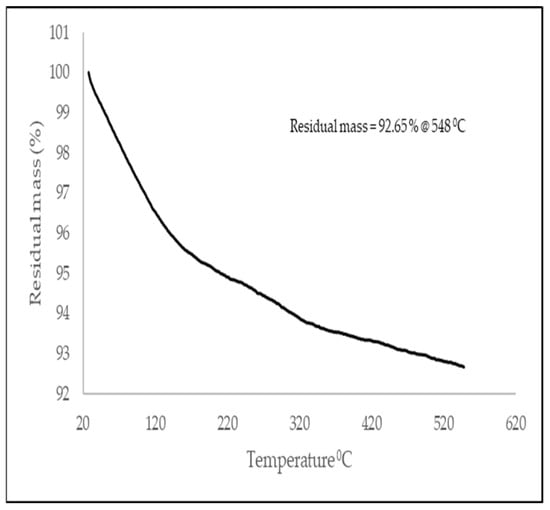
Figure 25.
Thermogravimetric results of SRMB.
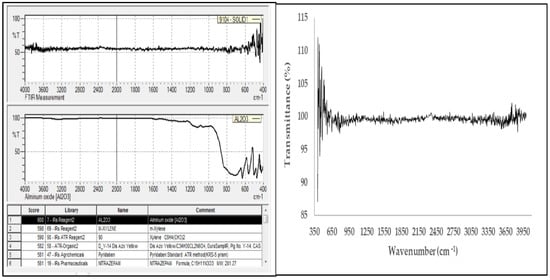
Figure 26.
Fourier-transform infrared spectroscopy of sustainable red mud bricks.
7. Model Preparation Using Analysis of Systems (ANSYS)
A rectangular SRMB, 228 × 108 × 80 mm in size, was used as a model in the ANSYS workbench. For the finite element model, the element type used was SOLID 185 with an element size of 10 mm. The shape of the element mesh used was hexahedron which is suitable for computational work. The material chosen for the SRMB analysis was isotropic elasticity. The brick was analysed in the vertical and horizontal axes, employing experimental and validated data using finite element method ANSYS.
The load was applied to the SRMB differently in both the horizontal and vertical axes around the boundary condition for all possible failures. A uniform load was applied from the free end of the brick. The model and the total deformation of the SRMB is represented in Figure 27, Figure 28, Figure 29, Figure 30, Figure 31 and Figure 32. The load that was experimentally applied to the SRMB deviated 0.2 MPa in its equivalent stress and 0.025 mm in total deformation from the elemental analysis in the horizontal axis. The equivalent stress was 0.98 MPa and total deformation was 0.028 mm in the vertical axis deviation from the elemental analysis to practical evaluation. The following Figures illustrates the model, total deformation and stress–strain distribution of the SRMB when a load was applied in the horizontal and vertical axes.
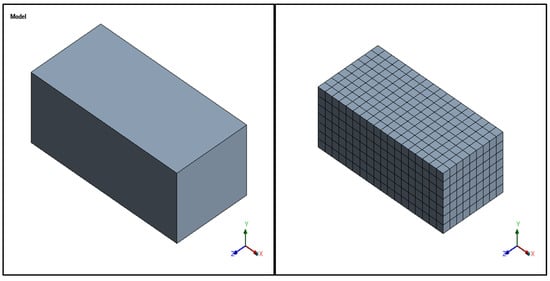
Figure 27.
Model specimen of sustainable red mud bricks using ANSYS–Horizontal axis (HA).
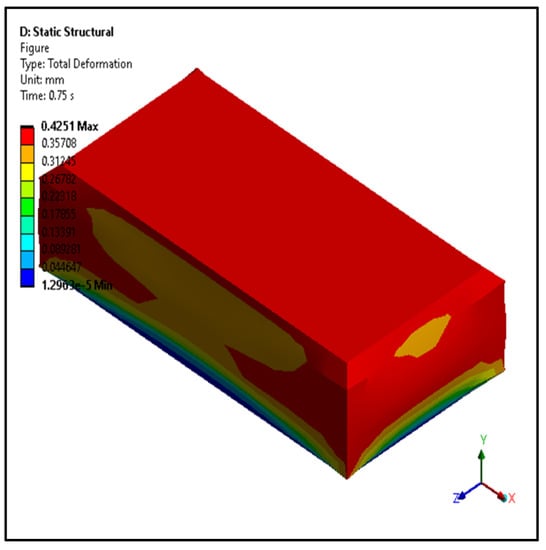
Figure 28.
Total deformation of sustainable red mud bricks using ANSYS–HA.
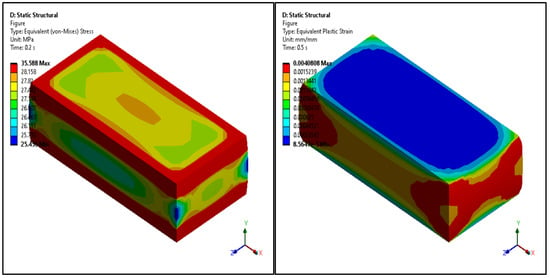
Figure 29.
Stress (left) and strain (right) distribution of sustainable red mud bricks using ANSYS–HA.
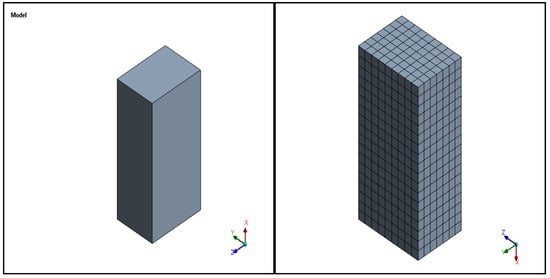
Figure 30.
Model specimen of sustainable red mud bricks using ANSYS–Vertical axis (VA).
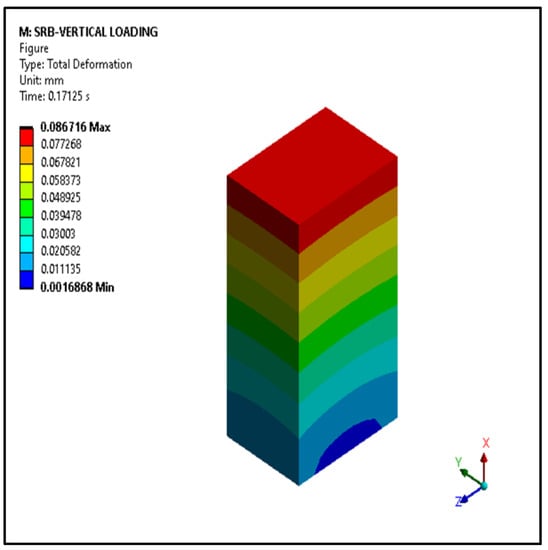
Figure 31.
Total deformation of sustainable red mud bricks using ANSYS.
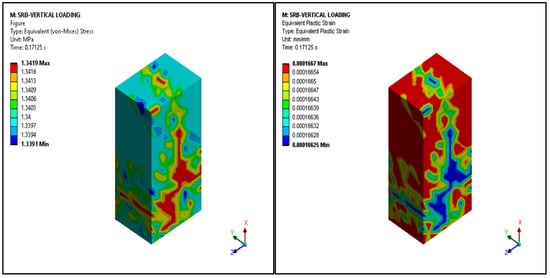
Figure 32.
Stress (left) and strain (right) distribution of sustainable red mud bricks using ANSYS.
8. Stress and Strain Distribution
The stress distribution of the SRMB acted on the midpoint of the brick. The Von mises stress is given in the Figure below. As the brick is brittle, the plastic strain distribution was gradually applied until failure. The stress–strain distribution for the horizontal and vertical load brick is graphically represented in Figure 33. The graph illustrates that the load was gradually applied and failed at the peak point, as shown in the chart. The material properties of the SRMB in both the horizontal and vertical axes are given in Table 15.
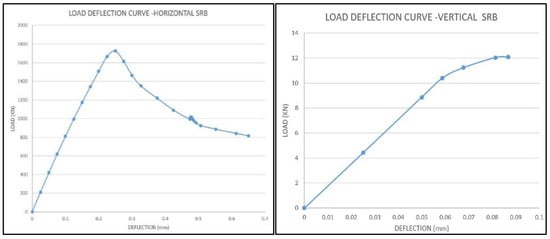
Figure 33.
Load deflection curve for horizontally and vertically loaded sustainable red mud bricks.

Table 15.
The material properties of the SRMB.
9. Limitations and Future Work
In the current study, various mix proportions were determined using red mud. According to the central pollution control board (CPCB), India reports, red mud is defined as a high volume and low effect waste, which does fall under hazardous waste as per hazardous waste management (HOWM) rules, 2016 [14]. As per our observations, red mud can be incorporated along with fly ash, ground granulated blast furnace slag and alccofine from 40 to 45%. Adding more than this amount will lead to increased density and reduced compressive strength. The leaching assessment of red mud [14] procured from Utkal alumina limited, was processes by two methods: soluble threshold limit concentration (STLC) and toxicity characteristics leaching procedure (TCLP). It contains 0.01 mg/L carbon monoxide (Co), 0.04 mg/L nickel (Ni), 1.4 mg/L vanadium (V) and 0.13 mg/L zinc (Zn) as determined through the STLC method. By the TCLP method, it contains 0.8 mg/L chromium, and arsenic (Ar), lead (Pb) and selenium(Se) are below the detection level. Even though the heavy metals present in the red mud were low, the leaching characteristics of SRMBs need to be analysed as they contain red mud as the one of main fines ingredients.
10. Conclusions
Sustainable red bricks are eco-friendly bricks where the ingredients used are industrial waste by-products. Neither the ingredients nor for the product are incinerated and thereby reducing CO2 emissions.
SRMBs have a high compressive strength with low water absorption, and can be considered as heavy-duty bricks suitable for applying in non-structural elements such as load-bearing structures, foundations, heavy engineering works, bridges, and dam constructions.
SRMBs are efflorescence-free products which show good durability performance along with a very low percentage of water absorption. SRMBs only require ambient curing which is an effortless curing method deriving benefits from the natural resources.
Although the fly ash improved mechanical properties, the percentage of fly ash was optimized to 40–45% when combined with red mud. The increase in red mud decreased the mechanical strength and also increased the density. The use of GGBS and AL enhanced the mechanical properties of the SRMBs and were used at a very low percentage: at most 10% for GGBS and 5% for AL. As binders, using alkali activators such as sodium silicate solutions and sodium hydroxide pellets with low molarity, the use of cement and the emission of CO2 are avoided. By achieving the required strength by the third day after casting, SRMBs are ready for application and continued strength improvement after 28 days.
In contrast to the soils used in conventional clay bricks, the SRMBs are made from industrial by-products encapsulating in the form of bricks/blocks.
Author Contributions
Conceptualization, V.G. and S.S.; methodology, V.G.; software, S.S. validation, S.S. and V.G.; formal analysis, S.S.; investigation, S.S.; resources, V.G.; data curation, S.S.; writing—original draft preparation, S.S.; writing—review and editing, V.G.; visualization, V.G.; supervision, V.G.; project administration, S.S. and V.G.; funding acquisition, S.S. and V.G. All authors have read and agreed to the published version of the manuscript.
Funding
This research received no external funding.
Data Availability Statement
The detailed data presented in this study are available on request from the corresponding author. The data are not publicly available due to ethical restrictions.
Acknowledgments
We gratefully acknowledge the contributions in terms of providing research materials from Indian industries for our research. Red mud from HINDALCO, Odisha; Fly ash from Mettur; Ground granulated blast furnace slag from JSW industry, Salem; Alccofine from Counto microfine product, Pvt Limited, Goa and Sodium silicate from Sri Varahi Chemicals, Erode. The authors would like to thank ASR bricks, Coimbatore for their support in making SRMBs.
Conflicts of Interest
The authors declare no conflict of interest.
References
- Omer, S.A.; Demirboga, R.; Khushefati, W.H. Relationship between compressive strength and UPV of GGBFS based geopolymer mortars exposed to elevated temperatures. Constr. Build. Mater. 2015, 94, 189–195. [Google Scholar] [CrossRef]
- Balczár, I.; Korim, T.; Dobrádi, A. Correlation of strength to apparent porosity of geopolymers—Understanding through variations of setting time. Constr. Build. Mater. 2015, 93, 983–988. [Google Scholar] [CrossRef]
- Gunasekara, C.; Law, D.W.; Setunge, S.; Sanjayan, J.G. Zeta potential, gel formation and compressive strength of low calcium fly ash geopolymers. Constr. Build. Mater. 2015, 95, 592–599. [Google Scholar] [CrossRef]
- Un, C.; Sanjayan, J.; Nicolas, R.S.; van Deventer, J. Predictions of long-term deflection of geopolymer concrete beams. Constr. Build. Mater. 2015, 94, 10–19. [Google Scholar] [CrossRef]
- Sarker, P.K.; Haque, R.; Ramgolam, K.V. Fracture behaviour of heat cured fly ash based geopolymer concrete. Mater. Des. 2013, 44, 580–586. [Google Scholar] [CrossRef]
- Kozhukhova, N.I.; Chizhov, R.V.; Zhernovsky, I.V.; Strokova, V.V. Structure formation of geopolymer perlite binder vs. type of alkali activating agent. Int. J. Pharm. Technol. 2016, 8, 15338–15348. [Google Scholar]
- Davidovits, J.; Davidovits, R. Ferro-sialate Geopolymers (-Fe-O-Si-O-Al-O-); Technical papers #27; Geopolymer Institute Library: Saint-Quentin, France, 2020. [Google Scholar]
- Ganesh, A.C.; Muthukannan, M.; Aakassh, S.; Subramanaian, B. Energy efficient production of geopolymer bricks using industrial waste. IOP Conf. Ser. Mater. Sci. Eng. 2020, 872, 012154. [Google Scholar] [CrossRef]
- Madani, H.; Ramezanianpour, A.; Shahbazinia, M.; Ahmadi, E. Geopolymer bricks made from less active waste materials. Construct. Build. Mater. 2020, 247, 118441. [Google Scholar] [CrossRef]
- Petrillo, A.; Cioffi, R.; Ferone, C.; Colangelo, F.; Borrelli, C. Eco-sustainable Geopolymer Concrete Blocks Production Process. Agric. Agric. Sci. Procedia 2016, 8, 408–418. [Google Scholar] [CrossRef]
- Xiao, R.; Jiang, X.; Zhang, M.; Polaczyk, P.; Huang, B. Analytical investigation of phase assemblages of alkali-activated materials in CaO-SiO2-Al2O3 systems: The management of reaction products and designing of precursors. Mater. Des. 2020, 194, 108975. [Google Scholar] [CrossRef]
- International Institute Aluminium. 2015. Available online: www.world-aluminium.org (accessed on 27 December 2014).
- International Institute Aluminium. 2022. Available online: www.international-aluminiuminstitute.org (accessed on 9 August 2022).
- Central Pollution Control Board (CPCB). India Reports. 2021. Available online: https://cpcb.nic.in/openpdffile.php?id=TmV3c0ZpbGVzLzg5XzE2Mjg3NTEwNDhfbWVkaWFwaG90bzIzMDk2LnBkZg== (accessed on 11 August 2021).
- Fly Ash for Highway Engineers. Chapter 1, Fly Ash—An Engineering Material; Government of India, 27 June 2017, India. Available online: https://www.fhwa.dot.gov/pavement/recycling/fach01.cfm (accessed on 11 August 2021).
- Central Electricity Authority Board (CEA). Government of India; 2020–2021, New Delhi, India. Available online: https://cea.nic.in/wp-content/uploads/notification/2021/12/CEAAnnualReport_final.pdf (accessed on 11 August 2021).
- GGBS Production by the Ministry of Mines, Government of India; 2021–2022. New Delhi, India. Available online: https://mines.gov.in/writereaddata/UploadFile/Mines_AR_2021-22_English.pdf (accessed on 11 August 2021).
- Zhuang, X.Y.; Chen, L.; Komarneni, S.; Zhou, C.H.; Tong, D.S.; Yang, H.M.; Yu, W.H.; Wang, H. Fly ash-based geopolymer: Clean production, properties and applications. J. Clean. Prod. 2016, 125, 253–267. [Google Scholar] [CrossRef]
- Davidovits, J. Properties of geopolymer cement. In Proceedings of the First International Conference on Alkaline Cements and Concretes, Scientific Research Institute on Binders and Materials, Kiev, Ukraine, 11–14 October 1994; Kiev State Technical University: Kiev, Ukraine; pp. 131–149. [Google Scholar]
- Mohsen, Q.; Mostafa, N.Y. Investigating the possibility of utilising low kaolinitic clays in production of geopolymer bricks. Ceramics-Silikaty 2010, 54, 160–168. [Google Scholar]
- Ferone, C.; Colangelo, F.; Cioffi, R.; Montagnaro, F.; Santoro, L. Mechanical Performances of Weathered Coal Fly Ash Based Geopolymer Bricks. Procedia Eng. 2011, 21, 745–752. [Google Scholar] [CrossRef]
- Jeyasehar, C.A.; Saravanan, G.; Ramakrishnan, A.K.; Kandasamy, S. Strength and durability studies on fly ash based geopolymer bricks. Asian J. Civ. Eng. 2013, 14, 797–808. [Google Scholar]
- Hodhod, O.A.; Alharthy, S.E.; Bakr, S.M. Physical and mechanical properties for metakaolin geopolymer bricks. Constr. Build. Mater. 2020, 265, 120217. [Google Scholar] [CrossRef]
- Mahmoodi, O.; Siad, H.; Lachemi, M.; Sahmaran, M. Synthesis and optimization of binary systems of brick and concrete wastes geopolymers at ambient environment. Constr. Build. Mater. 2021, 276, 122217. [Google Scholar] [CrossRef]
- Zheng, D.; Li, W. A High Compressive Strength Brick Composition Containing Red Mud, a High Compressive Strength Brick Manufacturing Method and a High Compressive Strength Brick. Chinese Patent CN108996988, 14 December 2018. [Google Scholar]
- Jiang, S.; Li, Y. Non-Burning Permeable Bricks and Preparation Method Thereof. Chinese Patent CN110304870, 12 August 2019. [Google Scholar]
- Hu, S.; Zhong, L.; Yang, X.; Bai, H.; Ren, B.; Zhao, Y.; Zhang, W.; Ju, X.; Wen, H.; Mao, S.; et al. Synthesis of rare earth tailing-based geopolymer for efficiently immobilizing heavy metals. Constr. Build. Mater. 2020, 254, 119273. [Google Scholar] [CrossRef]
- El-Naggar KA, M.; Amin, S.K.; El-Sherbiny, S.A.; Abadir, M.F. Preparation of geopolymer insulating bricks from waste raw materials. Constr. Build. Mater. 2019, 222, 699–705. [Google Scholar] [CrossRef]
- Manikandan, P.; Shanthakumar, K.; Vijayakumar, C.; Ajithsukumar, K.; Kishore Prakash, N.; Yousuf, I.M.; Nagaraj, G. Fly Ash-Based Geopolymer Bricks. Indian Patent IN202141047880, 21 October 2021. [Google Scholar]
- Shahul Hameed, M.; Vishnuram, B.G.; Dhanalakshmi, A.; Karthik Ragunath, S.; Arun Raja, L.; Dhanalakshmi, A.; Baskar Singh, G.; Nagamani, S.; Manoj Guru, R.; Dhivakar, M.; et al. Eco-Efficient Geopolymer Bricks. Indian Patent IN202141004597, 3 February 2021. [Google Scholar]
- IS 12089; Specification for Granulated Slag Manufacturing Portland Slag Cement. Bureau of Indian standards: New Delhi, India, 1987.
- Riski, O.; Prasetyoko, D.; Febrianti, D.K.; Ni’mah, Y.L.; Iftitahiyah, V.N.; Qoni’ah, I.; Santoso, E. The effect of crystallization time and H2o/CTAB ratio in the synthesis of mesoporous alumina from bauxite residue (red mud). Malays. J. Fundam. Appl. Sci. 2019, 15, 193–198. [Google Scholar]
- Panwar, N.; Chauhan, A.; Pali, H.S.; Sharma, M.D. Fabrication of aluminum 6061 red-mud composite using stir casting and micro structure observation. Mater. Today Proc. 2020, 21, 2014–2023. [Google Scholar] [CrossRef]
- Nordin, N.; Abdullah, M.M.A.B.; Tahir, M.F.M.; Sandu, A.V.; Hussin, K. Utilization of fly ash waste as construction material. Int. J. Conserv. Sci. 2016, 7, 161–166. [Google Scholar]
- Rafieizonooz, M.; Khankhaje, E.; Rezania, S. Assessment of environmental and chemical properties of coal ashes including fly ash and bottom ash, and coal ash concrete. J. Build. Eng. 2022, 49, 104040. [Google Scholar] [CrossRef]
- Pfingsten, J.; Rickert, J.; Lipus, K. Estimation of the content of ground granulated blast furnace slag and different pozzolanas in hardened concrete. Constr. Build. Mater. 2018, 165, 931–938. [Google Scholar] [CrossRef]
- Hammad, N.; El-Nemr, A.; Hasan, H.E.-D. The performance of fiber GGBS based alkali-activated concrete. J. Build. Eng. 2021, 42, 102464. [Google Scholar] [CrossRef]
- Sagar, B.; Sivakumar, M.V.N. Mechanical and microstructure characterization of alccofine based high strength concrete. Silicon 2020, 14, 795–813. [Google Scholar] [CrossRef]
- Sagarika, P.; Abhishek, S.; Niharika, P. Mechanical properties of green high-performance concrete using fly ash and alccofine. J. Xi’an Univ. Archit. Technol. 2020, XII, 1835–1842. [Google Scholar]
- Zawrah, M.; Sawan, S.A.; Khattab, R.; Abdel-Shafi, A. Effect of nano sand on the properties of metakaolin-based geopolymer: Study on its low rate sintering, Construct. Build. Mater. 2020, 246, 118486. [Google Scholar] [CrossRef]
- IS 3812:2013; Indian Standard, Pulverized Fuel Ash- Specification, Part 1, for Use as Pozzolana in Cement, Cement Mortar and Concrete. Bureau of Indian Standards: New Delhi, India, 2013.
- IS 1077:1992; Indian Standard, Common Burnt Clay Building Bricks, Specification, Fifth Revision. Bureau of Indian Standards: New Delhi, India, 1992.
- IS 3495:2019; Indian Standard, Burnt Clay Building Bricks, Method of Tests, Part 1, Determination of Compressive Strength, Fourth Revision. Bureau of Indian standards: New Delhi, India, 2019.
- IS 3495:2019; Indian Standard, Burnt Clay Building Bricks, Method of Tests, Part 2, Determination of Water Absorption, Fourth Revision. Bureau of Indian Standards: New Delhi, India, 2019.
- IS 3495:2019; Indian Standard, Burnt Clay Building Bricks, Method of Tests, Part 3, Determination of Efflorescence, Fourth Revision. Bureau of Indian Standards: New Delhi, India, 2019.
- IS 4860:1968; Indian Standard, Acid Resistance Bricks, Flooring, Wall Finishing and Roofing. Bureau of Indian Standards: New Delhi, India, 1968; 6th Reprint, September 1994.
- ASTM C (1006)-7; Standard Test Method for Splitting Tensile Strength of Masonry Units. American Society for Testing and Materials: West Conshohocken, PA, USA, 2007.
- ASTM C67-1299; Standard Test Methods for Sampling and Testing Brick and Structural Clay Tile. American Society for Testing and Materials: West Conshohocken, PA, USA, 2005.
- IS 2180:1988; Indian Standard, Specification of Heavy-Duty Burnt Clay Building Bricks. Bureau of Indian Standards: New Delhi, India, 1988.
- Nandiyanto, A.B.D.; Oktiani, R.; Ragadhita, R. How to read and interpret FTIR spectroscope of organic material. Indones. J. Sci. Technol. 2019, 4, 97–118. [Google Scholar] [CrossRef]
Disclaimer/Publisher’s Note: The statements, opinions and data contained in all publications are solely those of the individual author(s) and contributor(s) and not of MDPI and/or the editor(s). MDPI and/or the editor(s) disclaim responsibility for any injury to people or property resulting from any ideas, methods, instructions or products referred to in the content. |
© 2023 by the authors. Licensee MDPI, Basel, Switzerland. This article is an open access article distributed under the terms and conditions of the Creative Commons Attribution (CC BY) license (https://creativecommons.org/licenses/by/4.0/).