Abstract
Chile’s reinforced concrete (RC) design is based on ACI 318-08, where high-strength reinforcement is not allowed in seismic force-resistant members. In 2019, new requirements adopted by ACI 318 permitted the incorporation of high-strength reinforcement in walls. This study compared the seismic performance of two Chilean 20-story residential buildings on soft soil, one designed with traditional Grade 60 and the other with high-strength Grade 80 reinforcement. The performance was assessed in terms of the probability of exceeding the ASCE 41 limit states during a 50-year lifecycle. Analyses showed that both buildings had similar seismic performance. However, the reduction in reinforcement in the Grade 80 building was close to 18%. It is concluded that using high-strength reinforcement in a typical wall building implies a significant reduction in the reinforcement used without affecting the seismic performance.
1. Introduction
In Chile, the design of RC buildings follows the requirements of the local standards NCh 430 [1] and NCh 433 [2], and the supreme decrees DS60 [3] and DS61 [4]. The design of RC buildings in Chile follows ACI 318-08 [5], with some minor modifications. ACI 318-08 does not allow the use of high-strength reinforcement (Grade 80 or higher) in seismic members. The ACI (American Concrete Institute) published a new version of the code in 2019, ACI 318-19 [6], which presented several modifications compared with the abovementioned version. ACI 318-19 now allows the design of RC structural walls using up to Grade 100 high-strength reinforcing bars [7]. Compared with traditional Grade 60 reinforcement, high-strength reinforcement has larger yield and ultimate strengths but less ductility [8]. Therefore, there are some questions about the effects of high-strength reinforcement on RC buildings’ global seismic performance, questions still not answered by the extensive laboratory testing of individual elements. Although current regulations in Chile do not allow the design of RC structures using high-strength reinforcement (however, the concrete design committee is evaluating this), there are countries such as Japan where Grade 100 reinforcement is already used in some buildings to resist the effects of earthquakes [8]. Moreover, Australia and New Zealand produce reinforcement with yielding strength of 73 ksi, which is explicitly made to be used in elements designed to resist seismic forces [8].
This research study evaluated the seismic structural performance of two 20-story RC wall buildings for residential use. Both structures are located in Concepción, Chile, a region of high seismicity (NCh 433 zone Type 3). The soil type is C (soft soil), according to DS61 [4]. The buildings were designed according to ACI 318-19 and the applicable local standards. The first building was designed using A630-420H (nominal tensile strength = 630 MPa, nominal yielding strength = 420 MPa) reinforcement (equivalent to ASTM A706 Grade 60), while the second building used A690-550H (nominal tensile strength = 690 MPa, nominal yielding strength = 550 MPa) reinforcement (equivalent to ASTM A706 Grade 80). The assessment of their seismic performance was carried out following four steps: (i) defining the design of the two studied buildings, (ii) evaluating the nonlinear behavior of both buildings through pushover analysis in OpenSees, (iii) estimating the fragility curves of both structures for three ASCE 41 limit states (collapse prevention (CP), life safety (LS) and immediate occupancy (IO)) and [9] from the pushover curves using SPO2FRAG v1.1 [10], and (iv) estimating the probability of reaching these limit states in a lifecycle of 50 years, combining the seismic fragilities with the hazard curve obtained from PSHA.
The software SPO2FRAG allows the estimation of the seismic fragilities directly from the pushover curve without conducting computationally expensive incremental dynamic analyses (IDA). However, pushover curves are a simplified method and do not necessarily account for the varying dynamic effects of nonlinear response history analysis (NRHA) or realistic earthquake loads, which was a limitation of this study. Therefore, SPO2FRAG must be considered an alternative to estimating seismic fragility at a low computational cost.
Nevertheless, Ugalde et al. [11] conducted a study to assess the capabilities of SPO2FRAG for estimating seismic fragilities in wall buildings, showing that the estimated values compared reasonably well with those obtained from traditional IDAs.
For this, a building archetype was defined and designed using traditional reinforcement (Gr 60) and high-strength reinforcement (Gr 80). The probabilities of exceeding the limit states CP, LS and IO in 50 years were estimated from the seismic fragilities and a probabilistic seismic hazard analysis (PSHA) study conducted at the building site. To the best of the authors’ knowledge, no prior analytical studies have been developed to evaluate the impact on the seismic performance of using high-strength reinforcement in the design of tall RC shear wall buildings with the wall configuration typically found in Chilean buildings, this being the novelty of this research.
The nonlinear beam–column element with fibers available in OpenSees was adopted for the nonlinear modeling of the studied buildings. Cao et al. [12] provided an overview of some of the currently available approaches for the nonlinear modeling of structures, including two categories: beam–column frame elements (OpenSees [13], DRAIN-2DX [14]) and three-dimensional solid finite elements (ABAQUS [15], DIANA [16]). According to Cao et al., the beam–column frame element omits constructional details, and it is simplified in a sense, making it more convenient and computationally efficient. On the other hand, the three-dimensional finite element models are more elaborate and computationally expensive.
Therefore, complex three-dimensional finite element models could be more suitable for detailed analyses of individual structural elements. However, this project aimed to assess the seismic performance of whole buildings in terms of their global response parameters. For this reason, OpenSees was selected as the analytical platform, considering a balance between modeling accuracy and computing time.
2. Design of the Studied Buildings
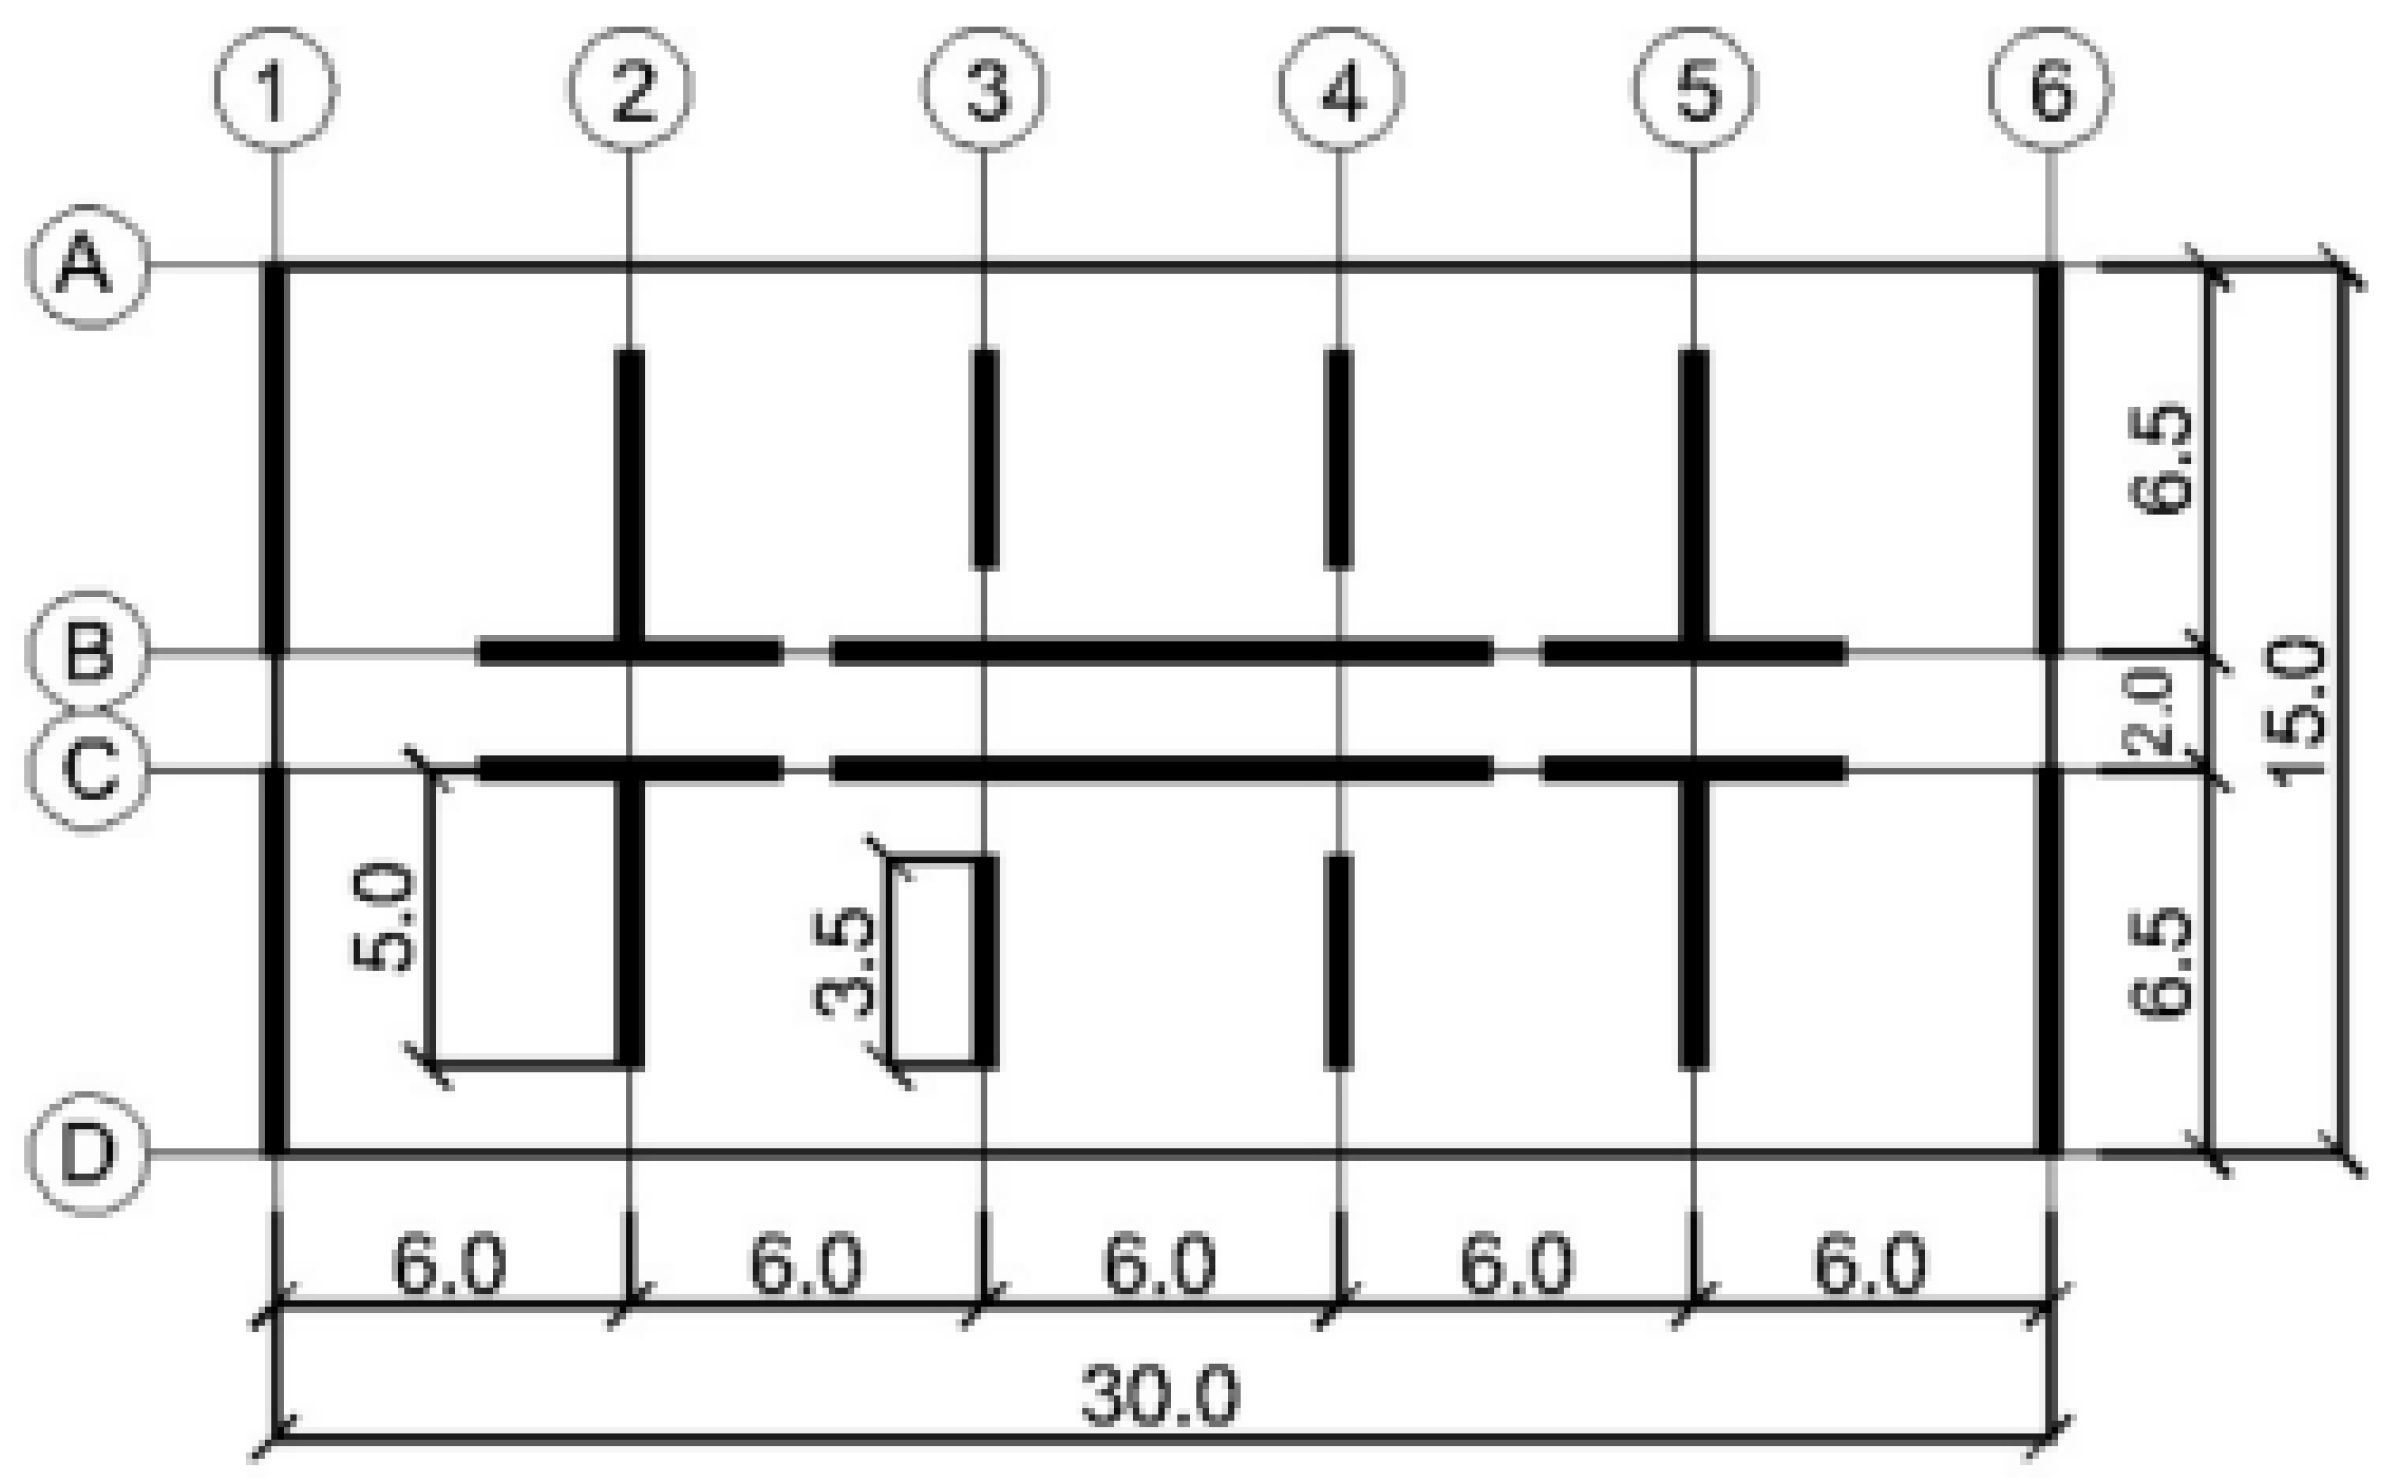
The study considered a plan configuration representative of a typical Chilean residential building, with a plan with two axes of symmetry. Figure 1 depicts this plan view, obtained from a previous study by Cando et al. [17].
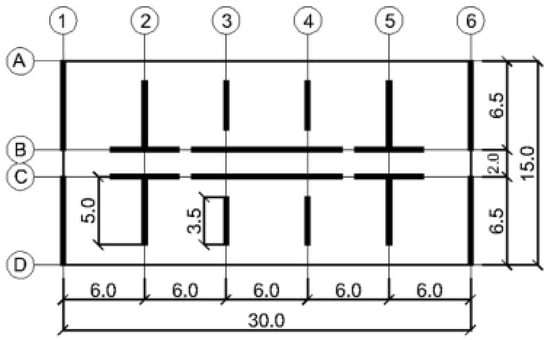
Figure 1.
Plan view of the structure (dimensions in meters), adapted from Cando et al. [17].
The analyzed cases were two 20-story residential buildings located in Concepción on a soil of Type C. The structures had a consistent story height of 2.6 m; the thickness of the walls and slab was 300 mm and 160 mm, respectively. The material properties were concrete with a nominal compressive strength of f′c = 25 MPa and rebar with a nominal yielding strength of fy = 420 MPa (Grade 60) and fy = 550 MPa (Grade 80). The design gravity loads were 2.9 kPa (superimposed dead load) and 2 kPa (live load), according to NCh 1537 [18]. Load combinations were obtained from NCh 3171 [19]. The commercial software ETABS v16 [20] was considered for the linear analysis and design of the buildings. Seismic design forces for the buildings were obtained from the spectral modal analysis carried out according to applicable local standards [2,4]. The seismic design forces were calculated from an elastic spectrum reduced by an effective response modification factor Reff, where the value of the base shear had to be within certain limits. The minimum base shear criterium controls the design of the transverse (short) building direction. Table 1 presents the structural properties in each direction.

Table 1.
Properties of the buildings’ seismic design.
Table 2 and Table 3 summarize the design of both buildings (Grade 60 and Grade 80). M1 indicates the rectangular walls in Axes 1 and 6, M2 indicates the rectangular walls in Axes 3 and 4, M3 indicates the rectangular walls in Axes B and C, and MT indicates the T-shaped walls. Shear reinforcement is distributed in two horizontal and vertical layers.
Table 2.
Summary of the design with Grade 60 reinforcement.
Table 3.
Summary of the design with Grade 80 reinforcement.
3. Nonlinear Modeling of the Studied Buildings
Nonlinear static analyses (pushover) were performed in OpenSees [13] for both analyzed buildings in the transverse (short) direction only, using a 2D model due to the plan symmetry. The parameters selected for the nonlinear modeling of the buildings were first calibrated using the experimental results obtained from a wall specimen tested by Thomsen and Wallace [21]. Thomsen and Wallace [21] tested six quarter-scale wall specimens, including three rectangular walls, two T-shaped walls and one barbell wall with an opening. The specimens were subjected to incremental cyclic lateral loading until failure.
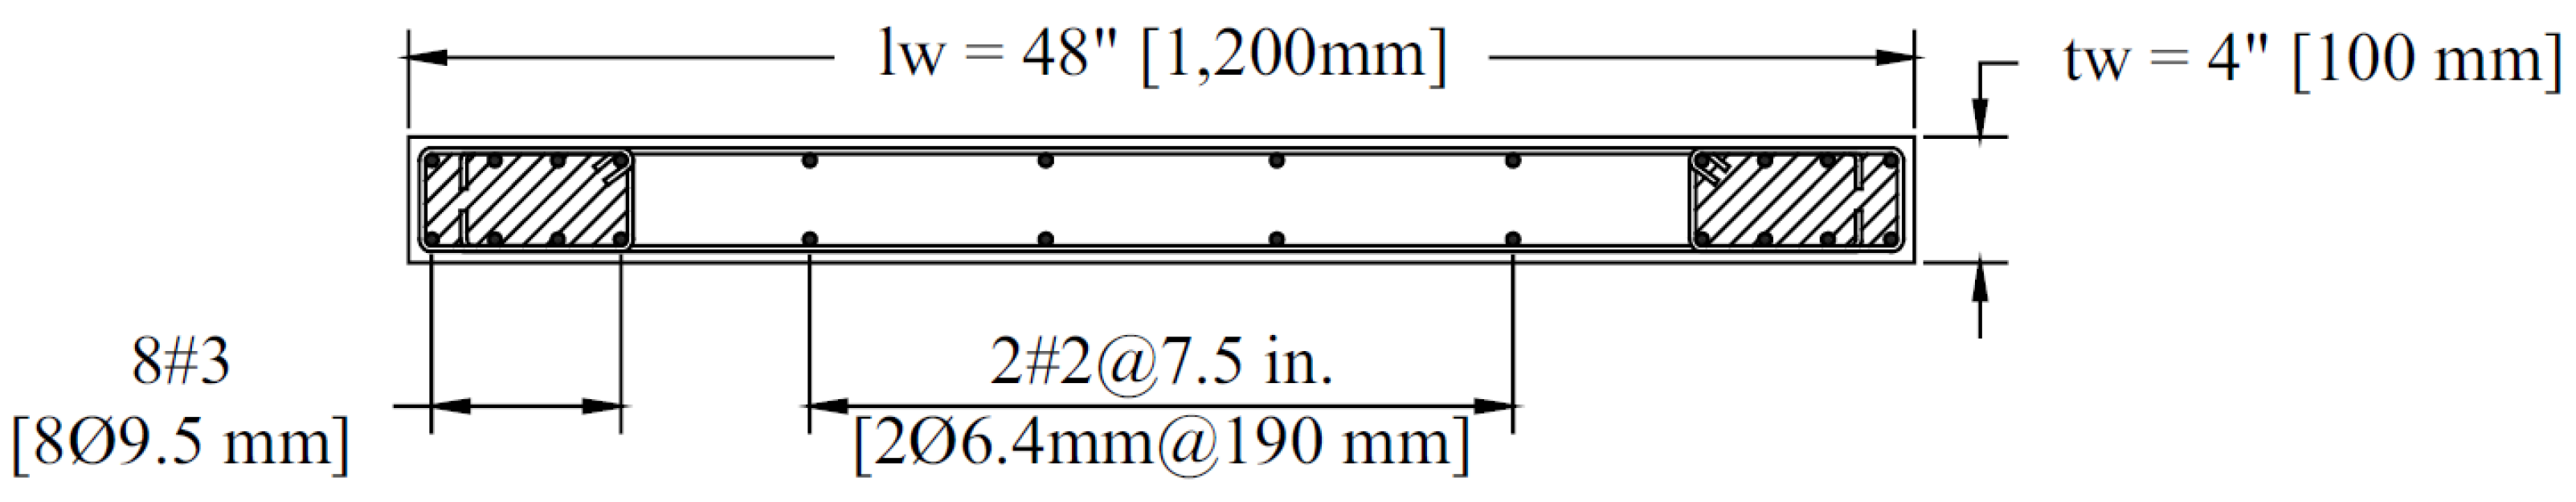
This research project used Specimen RW2 to calibrate the nonlinear modeling parameters. Specimen RW2 had a rectangular cross-section with a width of 102 mm, a length of 122 cm and a height of 366 cm, with Gr. 60 reinforcement at the web and wall boundaries, with an actual yielding stress (fy) of 424 MPa. At the time of testing, the concrete compressive strength at the wall’s base was f′c = 34 MPa. A constant axial load of 0.1 f′cAg was applied during the test. Figure 2 presents the reinforcing details of Specimen RW2.
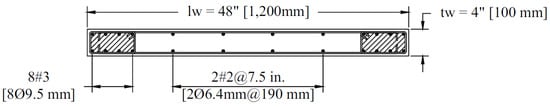
Figure 2.
Reinforcing details of Specimen RW2 [21].
The OpenSees material Concrete01 [13] was used to model concrete, considering the actual compressive strength instead of the nominal value. The strain at the peak stress was considered to be 0.002, the concrete’s crushing strength was taken to be 20% of the actual compressive strength, and the ultimate strain was taken to be 0.008, as recommended by Pugh et al. [22]. The confined concrete parameters were obtained from the constitutive law of Saatcioglu and Razvi [23]. The OpenSees material Steel02 [13] was used to model the reinforcing steel, considering the actual mechanical properties. Steel02 had a strain-hardening ratio of 0.02, while the values selected for the parameters R0, CR1 and CR2 were 18, 0.965 and 0.15, respectively. The strain at the rebar fracture was taken to be 0.05, as recommended by Gogus and Wallace [24], for considering low-cycle fatigue. For bar buckling failure, the criteria used by Cando et al. [17] were applied, determining that bar buckling and concrete crushing coincided.
The specimen was modeled with a fiber model, using a force-based formulation in a nonlinear beam–column frame element. The model considered a corotational geometric transformation to include second-order effects and three Gauss Lobatto integration points per element. The wall was discretized in three elements over the height.
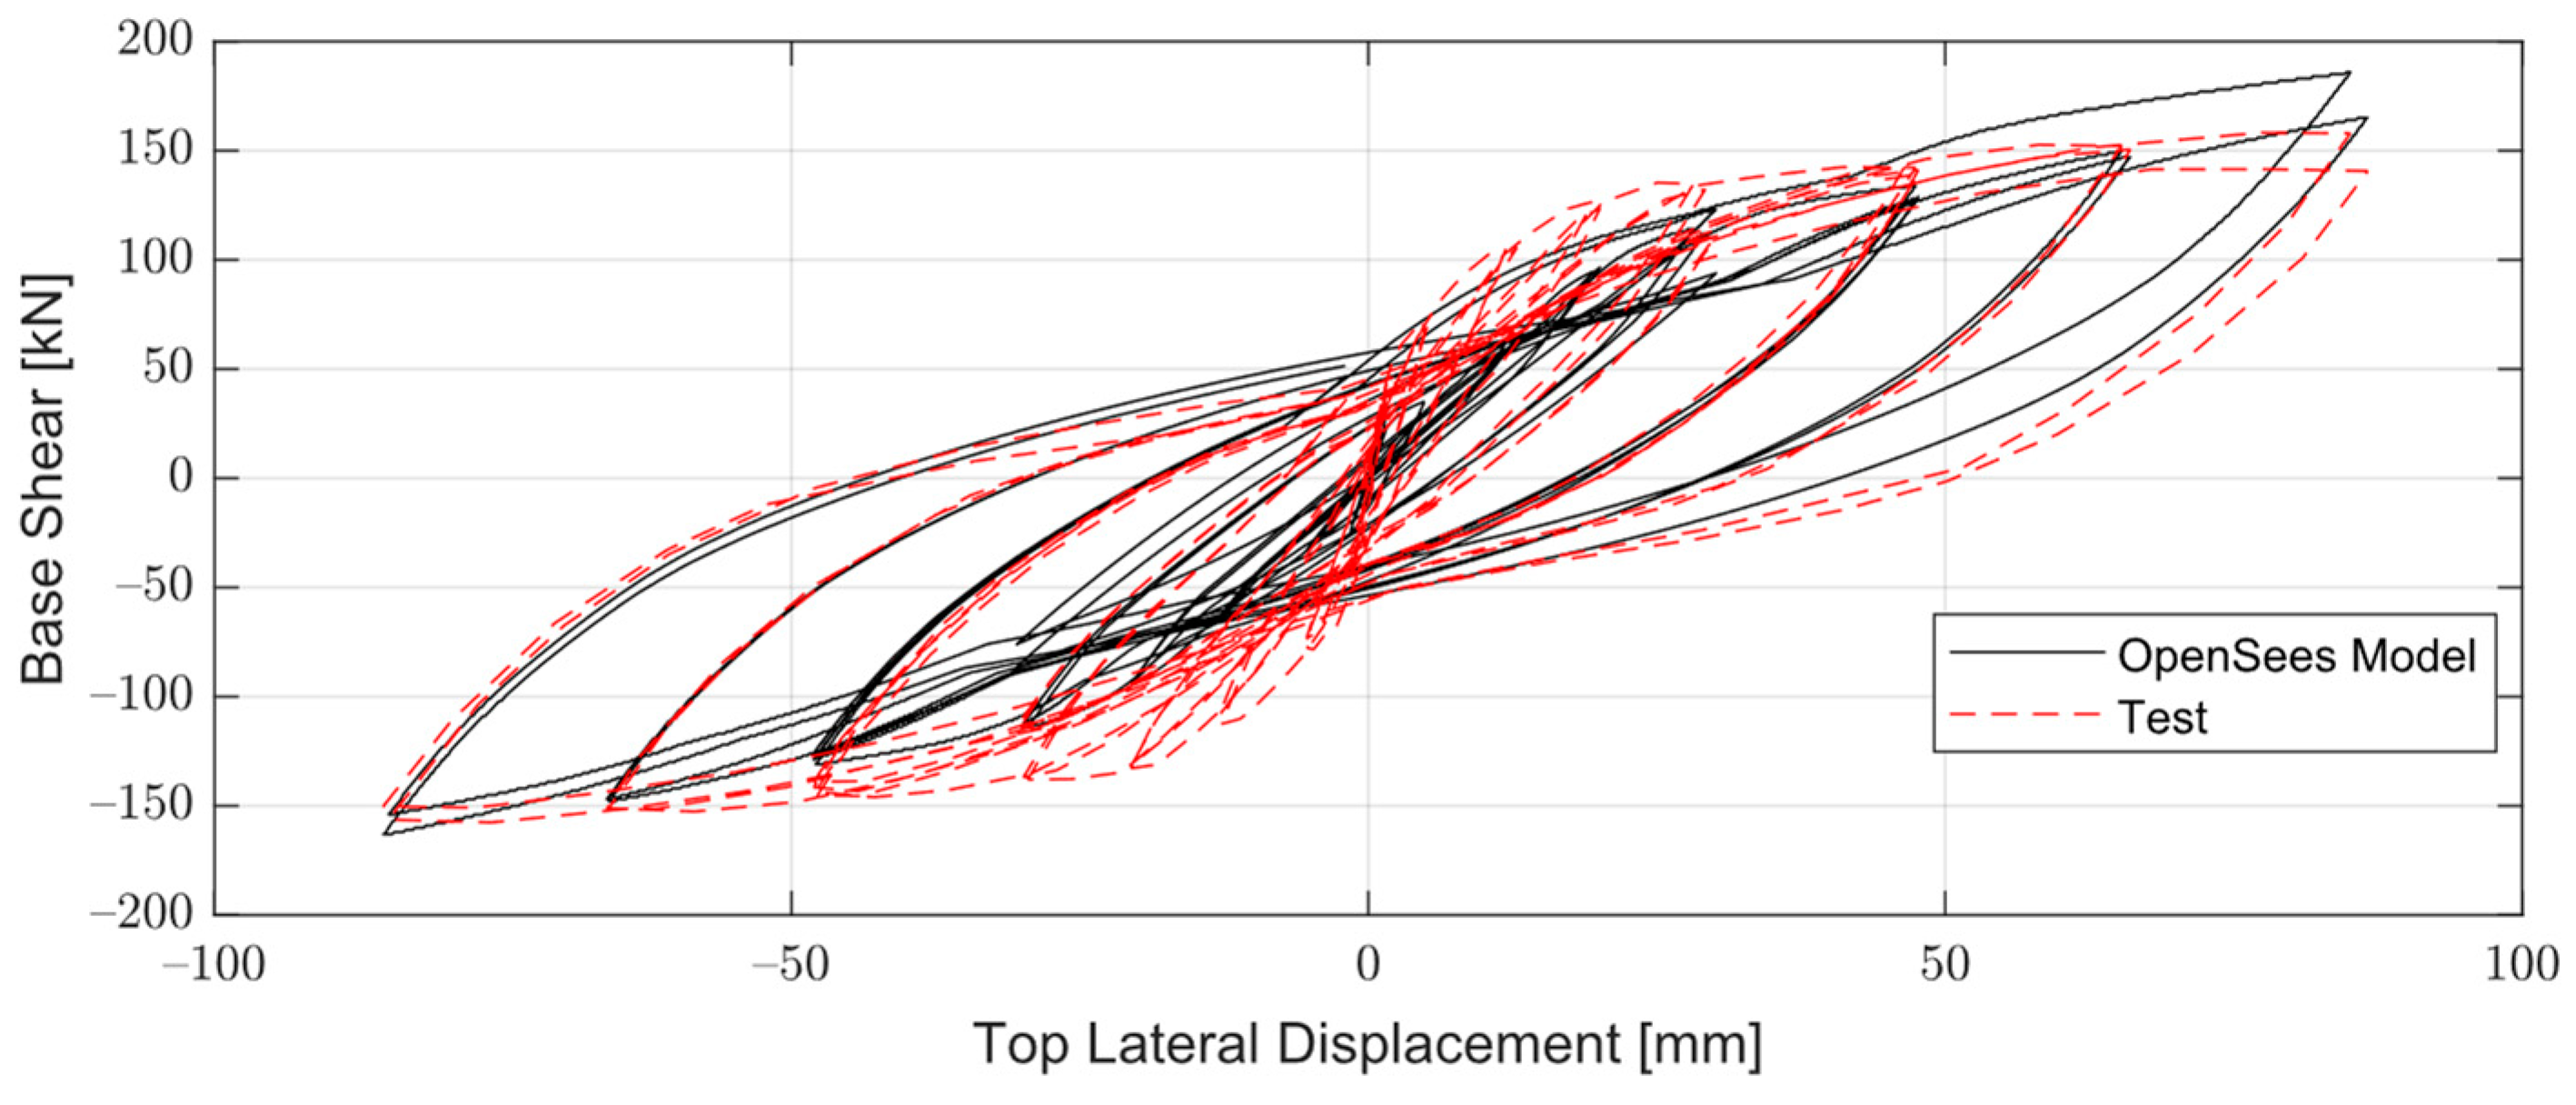
The model accuracy was assessed regarding the global response parameters (base shear and roof displacement), considering that the buildings’ performance was also assessed using those parameters. Figure 3 compares the base shear versus the lateral roof displacement using data from the experimental test and the nonlinear model. It can be observed that the model reproduced the data obtained from the laboratory test reasonably well.
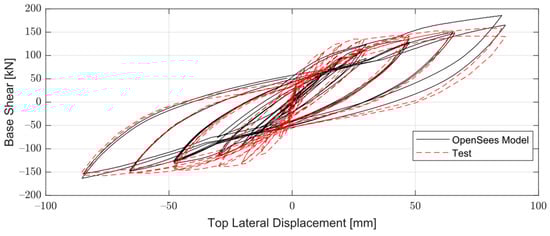
Figure 3.
Base shear versus top lateral displacement in Specimen RW2 [21].
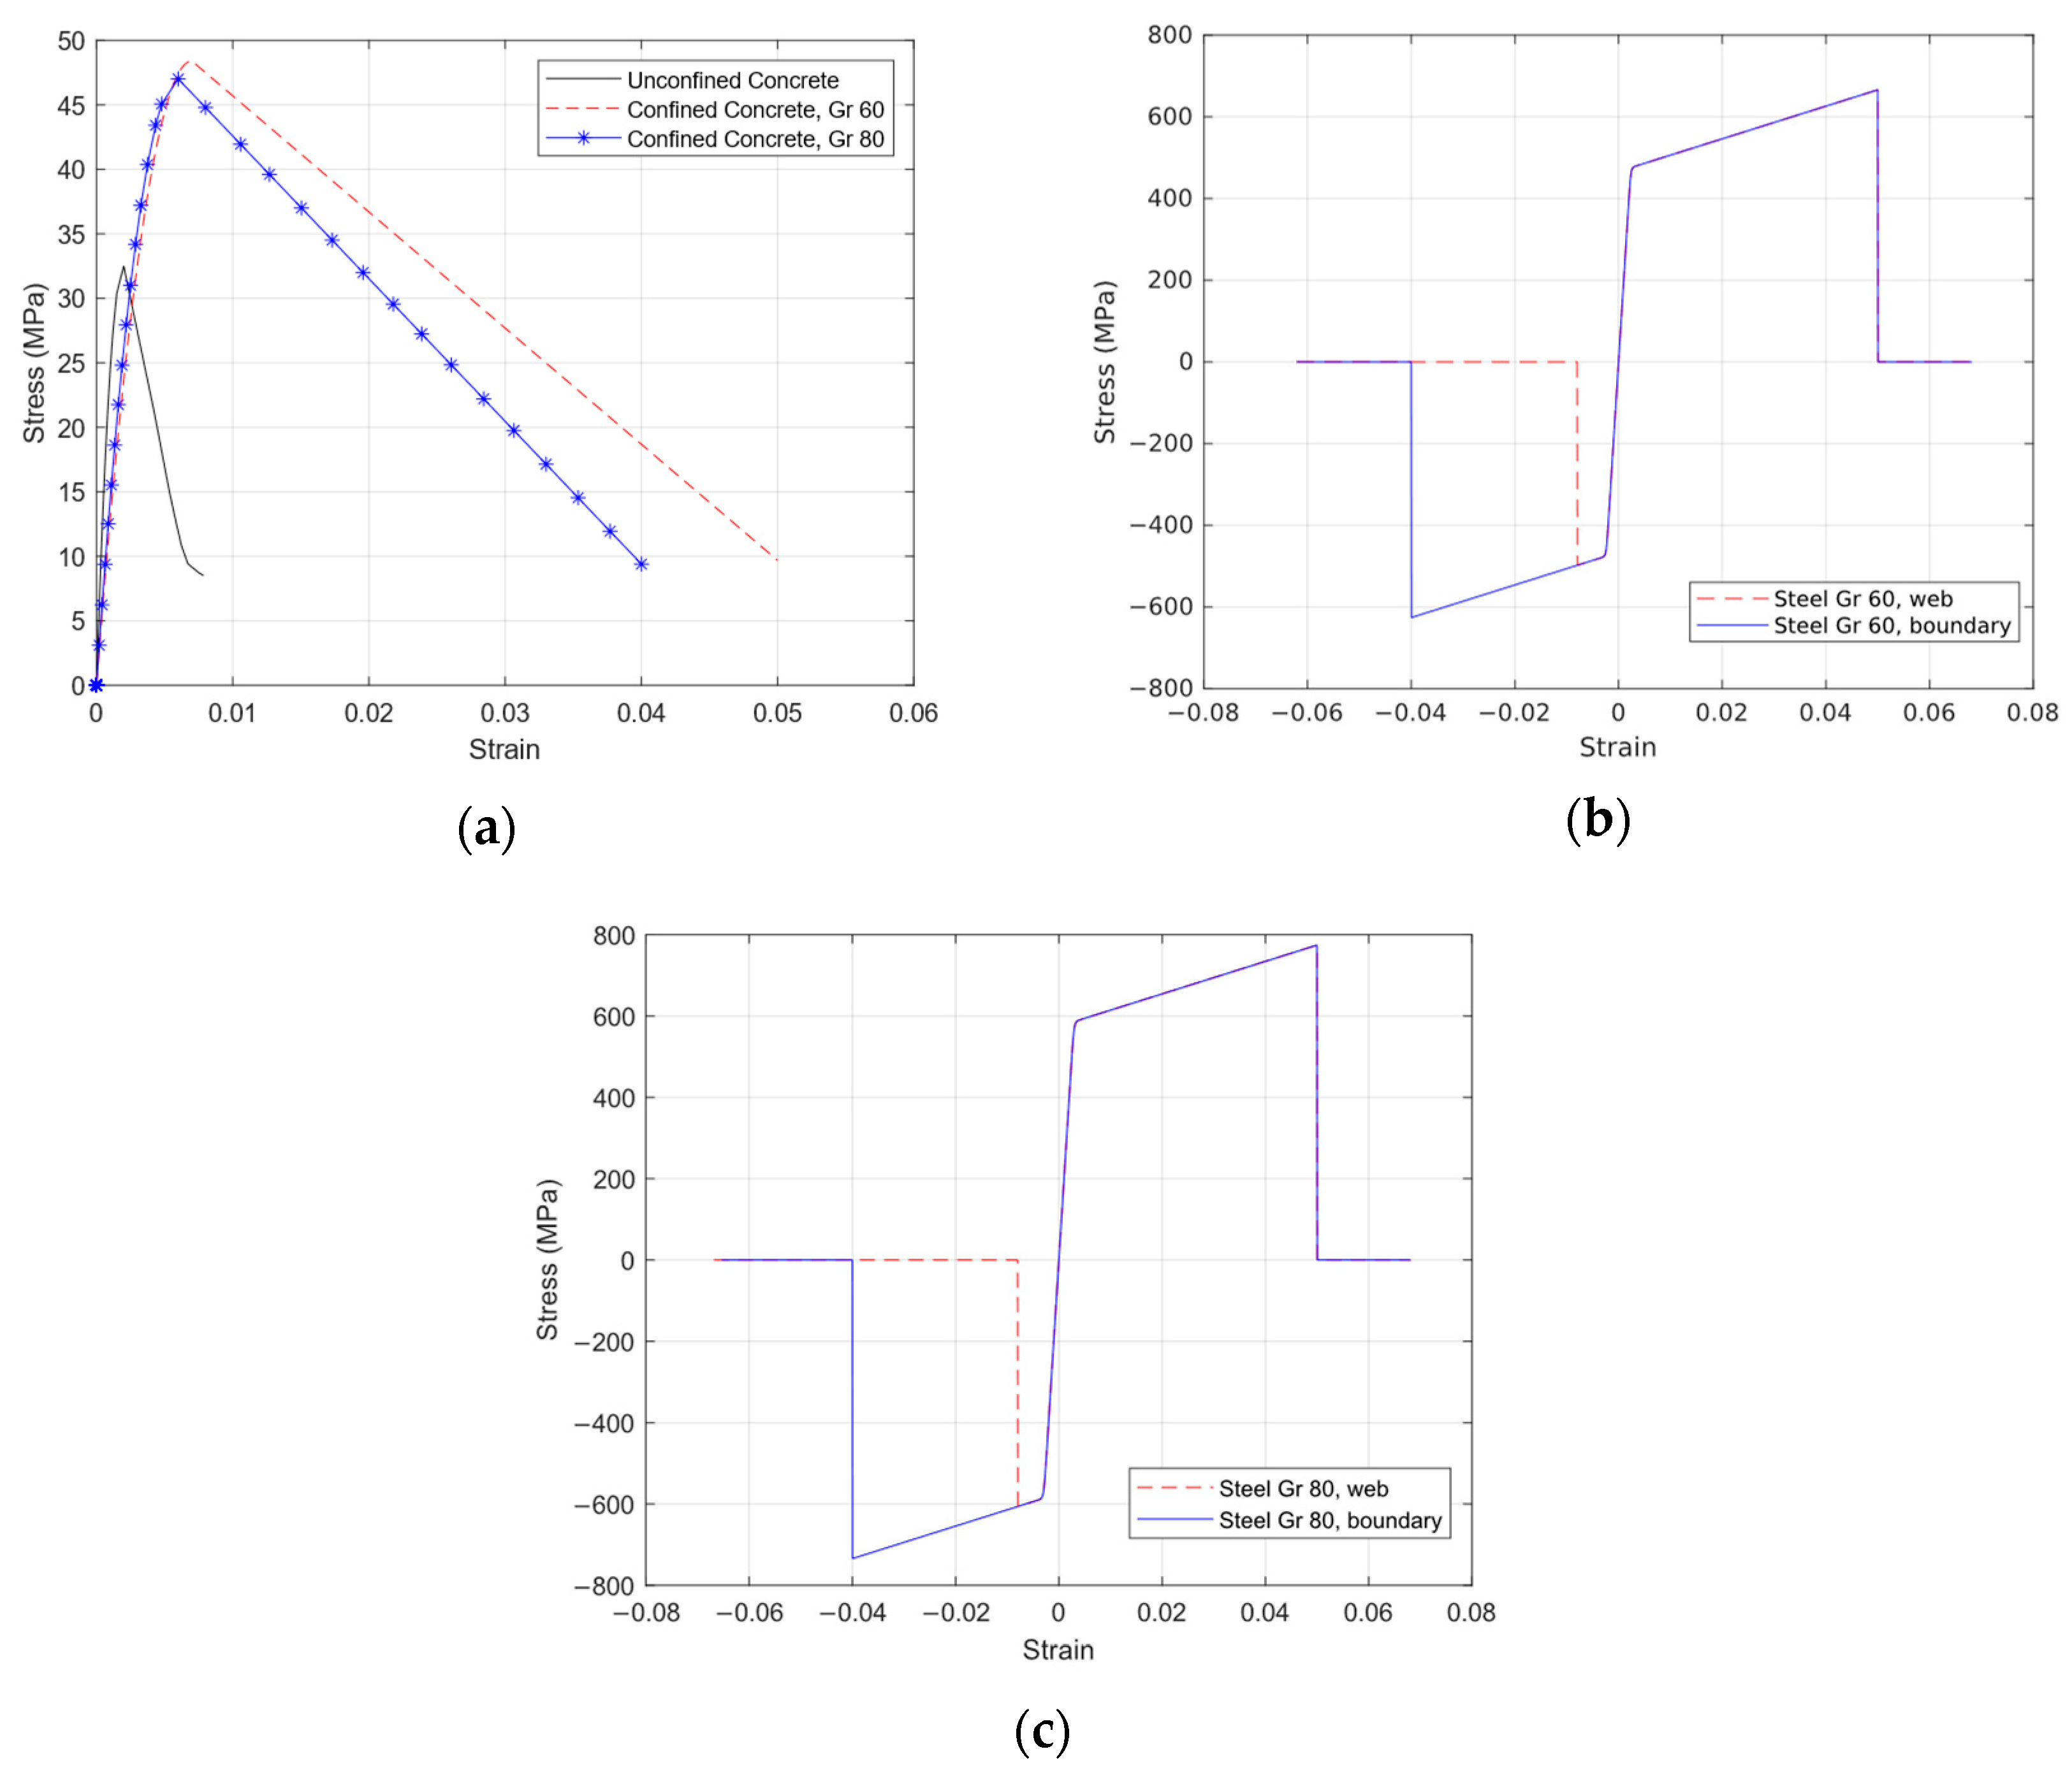
The study buildings were then analyzed using the material models and parameters previously calibrated. For the buildings, nodes at the same floor level had an equal DOF kinematic constraint [13] that connected them by a rigid diaphragm and imposed equal horizontal displacements. Moreover, the basal nodes were fixed to restrict displacements and rotations. For the unconfined concrete, an actual compressive strength of 33 MPa, which was higher than the specified value, was considered, following the recommendations of TBI [25]. Figure 4a shows the constitutive law of the unconfined and confined concrete for M1 walls at Stories 1 to 4 for Grade 60 and Grade 80 buildings. Figure 4b,c shows the stress–strain relationships of Grade 60 and 80 steel for bars at the web and boundary of M1 walls.
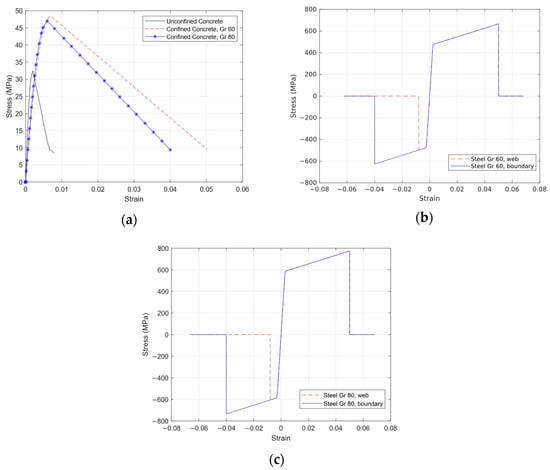
Figure 4.
Constitutive laws in M1 walls: (a) concrete under compression; (b) Gr 60 steel; (c) Grade 80 steel.
Regarding the steel material, the nominal values of yielding and ultimate strengths were increased to consider the actual values as required by TBI [25].
Walls M1, M2 and MT were modeled with the OpenSees nonlinear BeamColumn elements with fiber sections. On the other hand, walls M3, oriented in the longitudinal direction, were modeled using the OpenSees elastic BeamColumn element with a reduced stiffness of 0.7EcIg following ACI 318-19 [6], where Ec is the modulus elasticity of the concrete and Ig is the gross moment of inertia of the walls oriented in the transverse direction. The slabs were also modeled with the elastic BeamColumn element with a reduced stiffness of 0.25EcIg, following ACI 318-19 [6]. The effective gravity loading considered in the analyses included the dead load and 25% of the live load.
4. Nonlinear Static Analyses (Pushover)
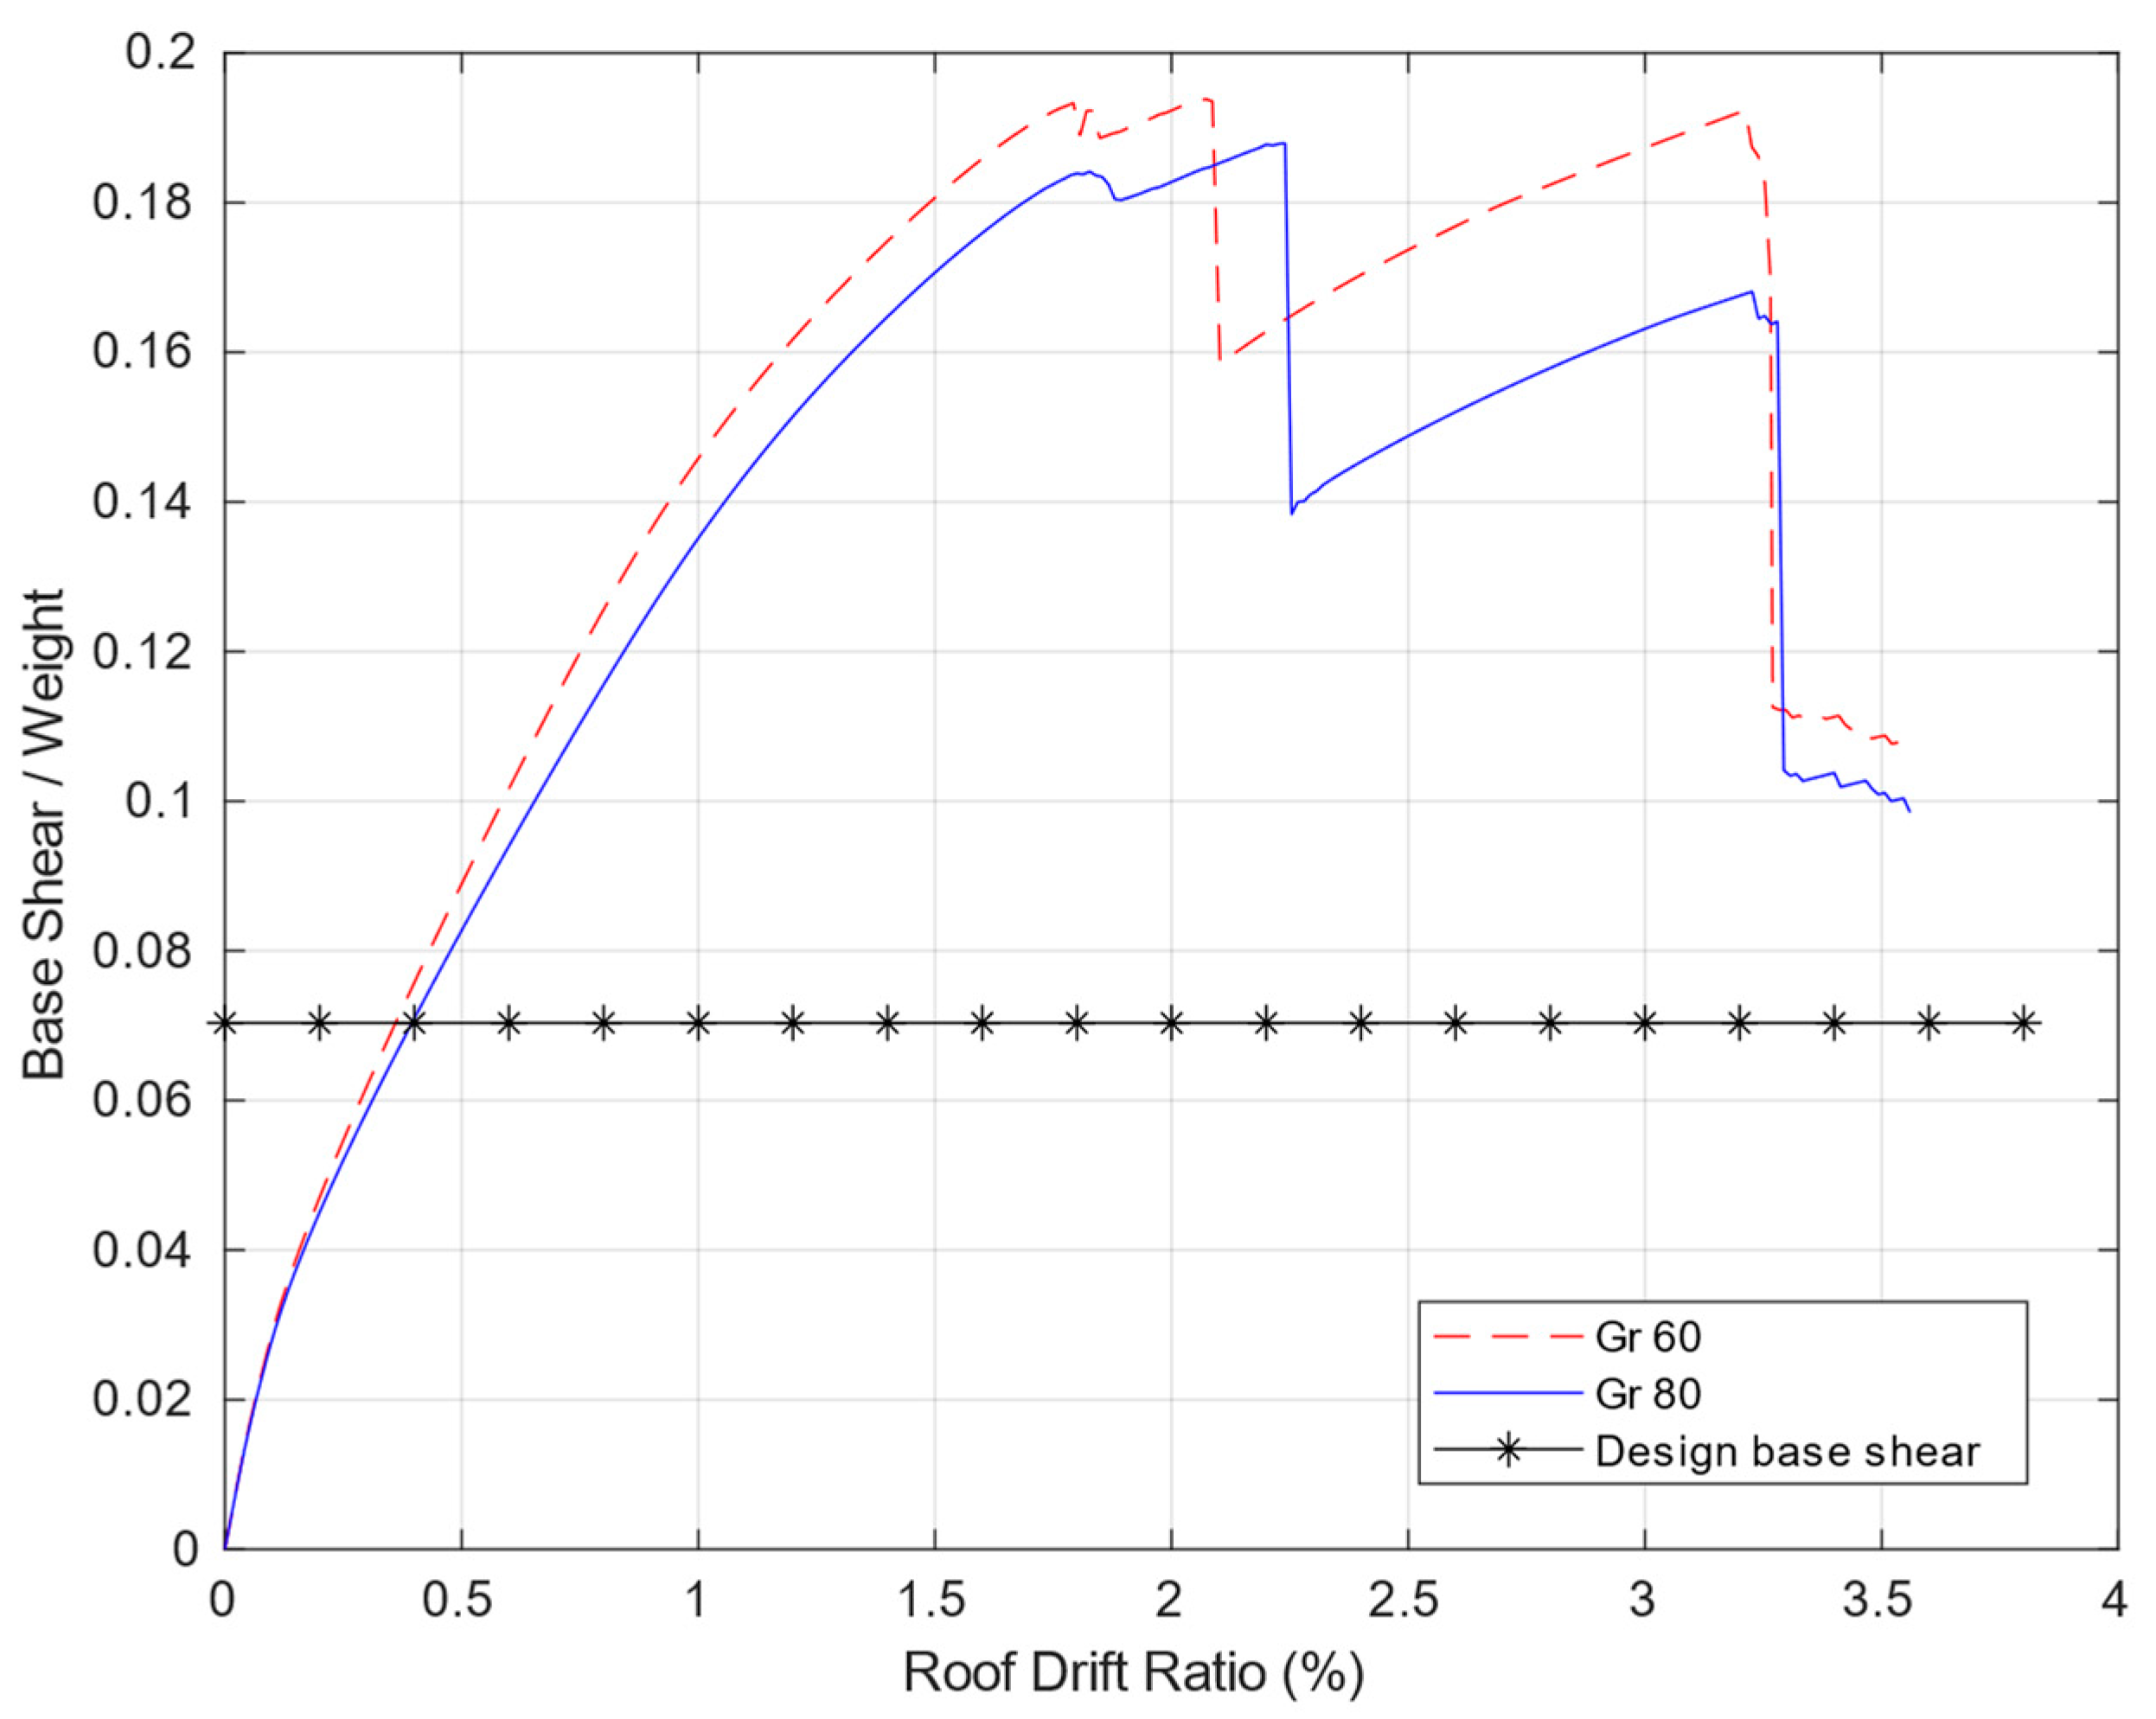
Grade 60 and Grade 80 buildings were subjected to nonlinear static (pushover) analysis under an inverted triangle lateral force pattern in the transverse direction. First, the models were pushed until they reached a target roof drift ratio (RDR) of 5%. Then the structure’s collapse was defined when the pushover curve showed a strength loss of 40% or more. Figure 5 depicts the pushover curves obtained for both buildings.
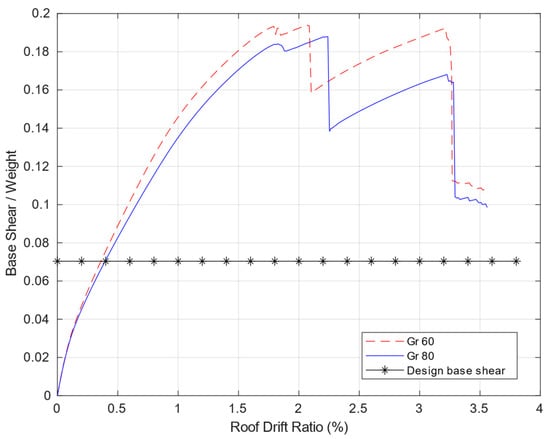
Figure 5.
Pushover curves for the analyzed buildings.
Figure 5 shows that the maximum base shear (Vmax) normalized by the seismic weight of the structure (W) was close to 0.19 for both buildings, marginally higher for the Grade 60 building, corresponding to an overstrength of 2.7. The pushover was applied in the buildings’ transverse direction, going upwards in Figure 1. The analyses showed, in both buildings, that the first significant drop in the base shear, at a roof drift ratio near 2%, was caused by flexural failure of the shorter rectangular walls. The second drop at a roof drift ratio near 3.3% was triggered by a flexural failure of the walls in Axes 1, 2, 5 and 6 between Axes C and D.
Similar overstrength values for Chilean RC shear wall buildings have been reported by others [11,17]. The collapse in both buildings followed the second criterium (strength loss of 40% or more) at a RDR slightly larger than 3%. These results showed that both structures had similar behavior but with 18% less steel in the case of the Grade 80 reinforcement.
5. Estimation of the Fragility Curves from SPO2FRAG
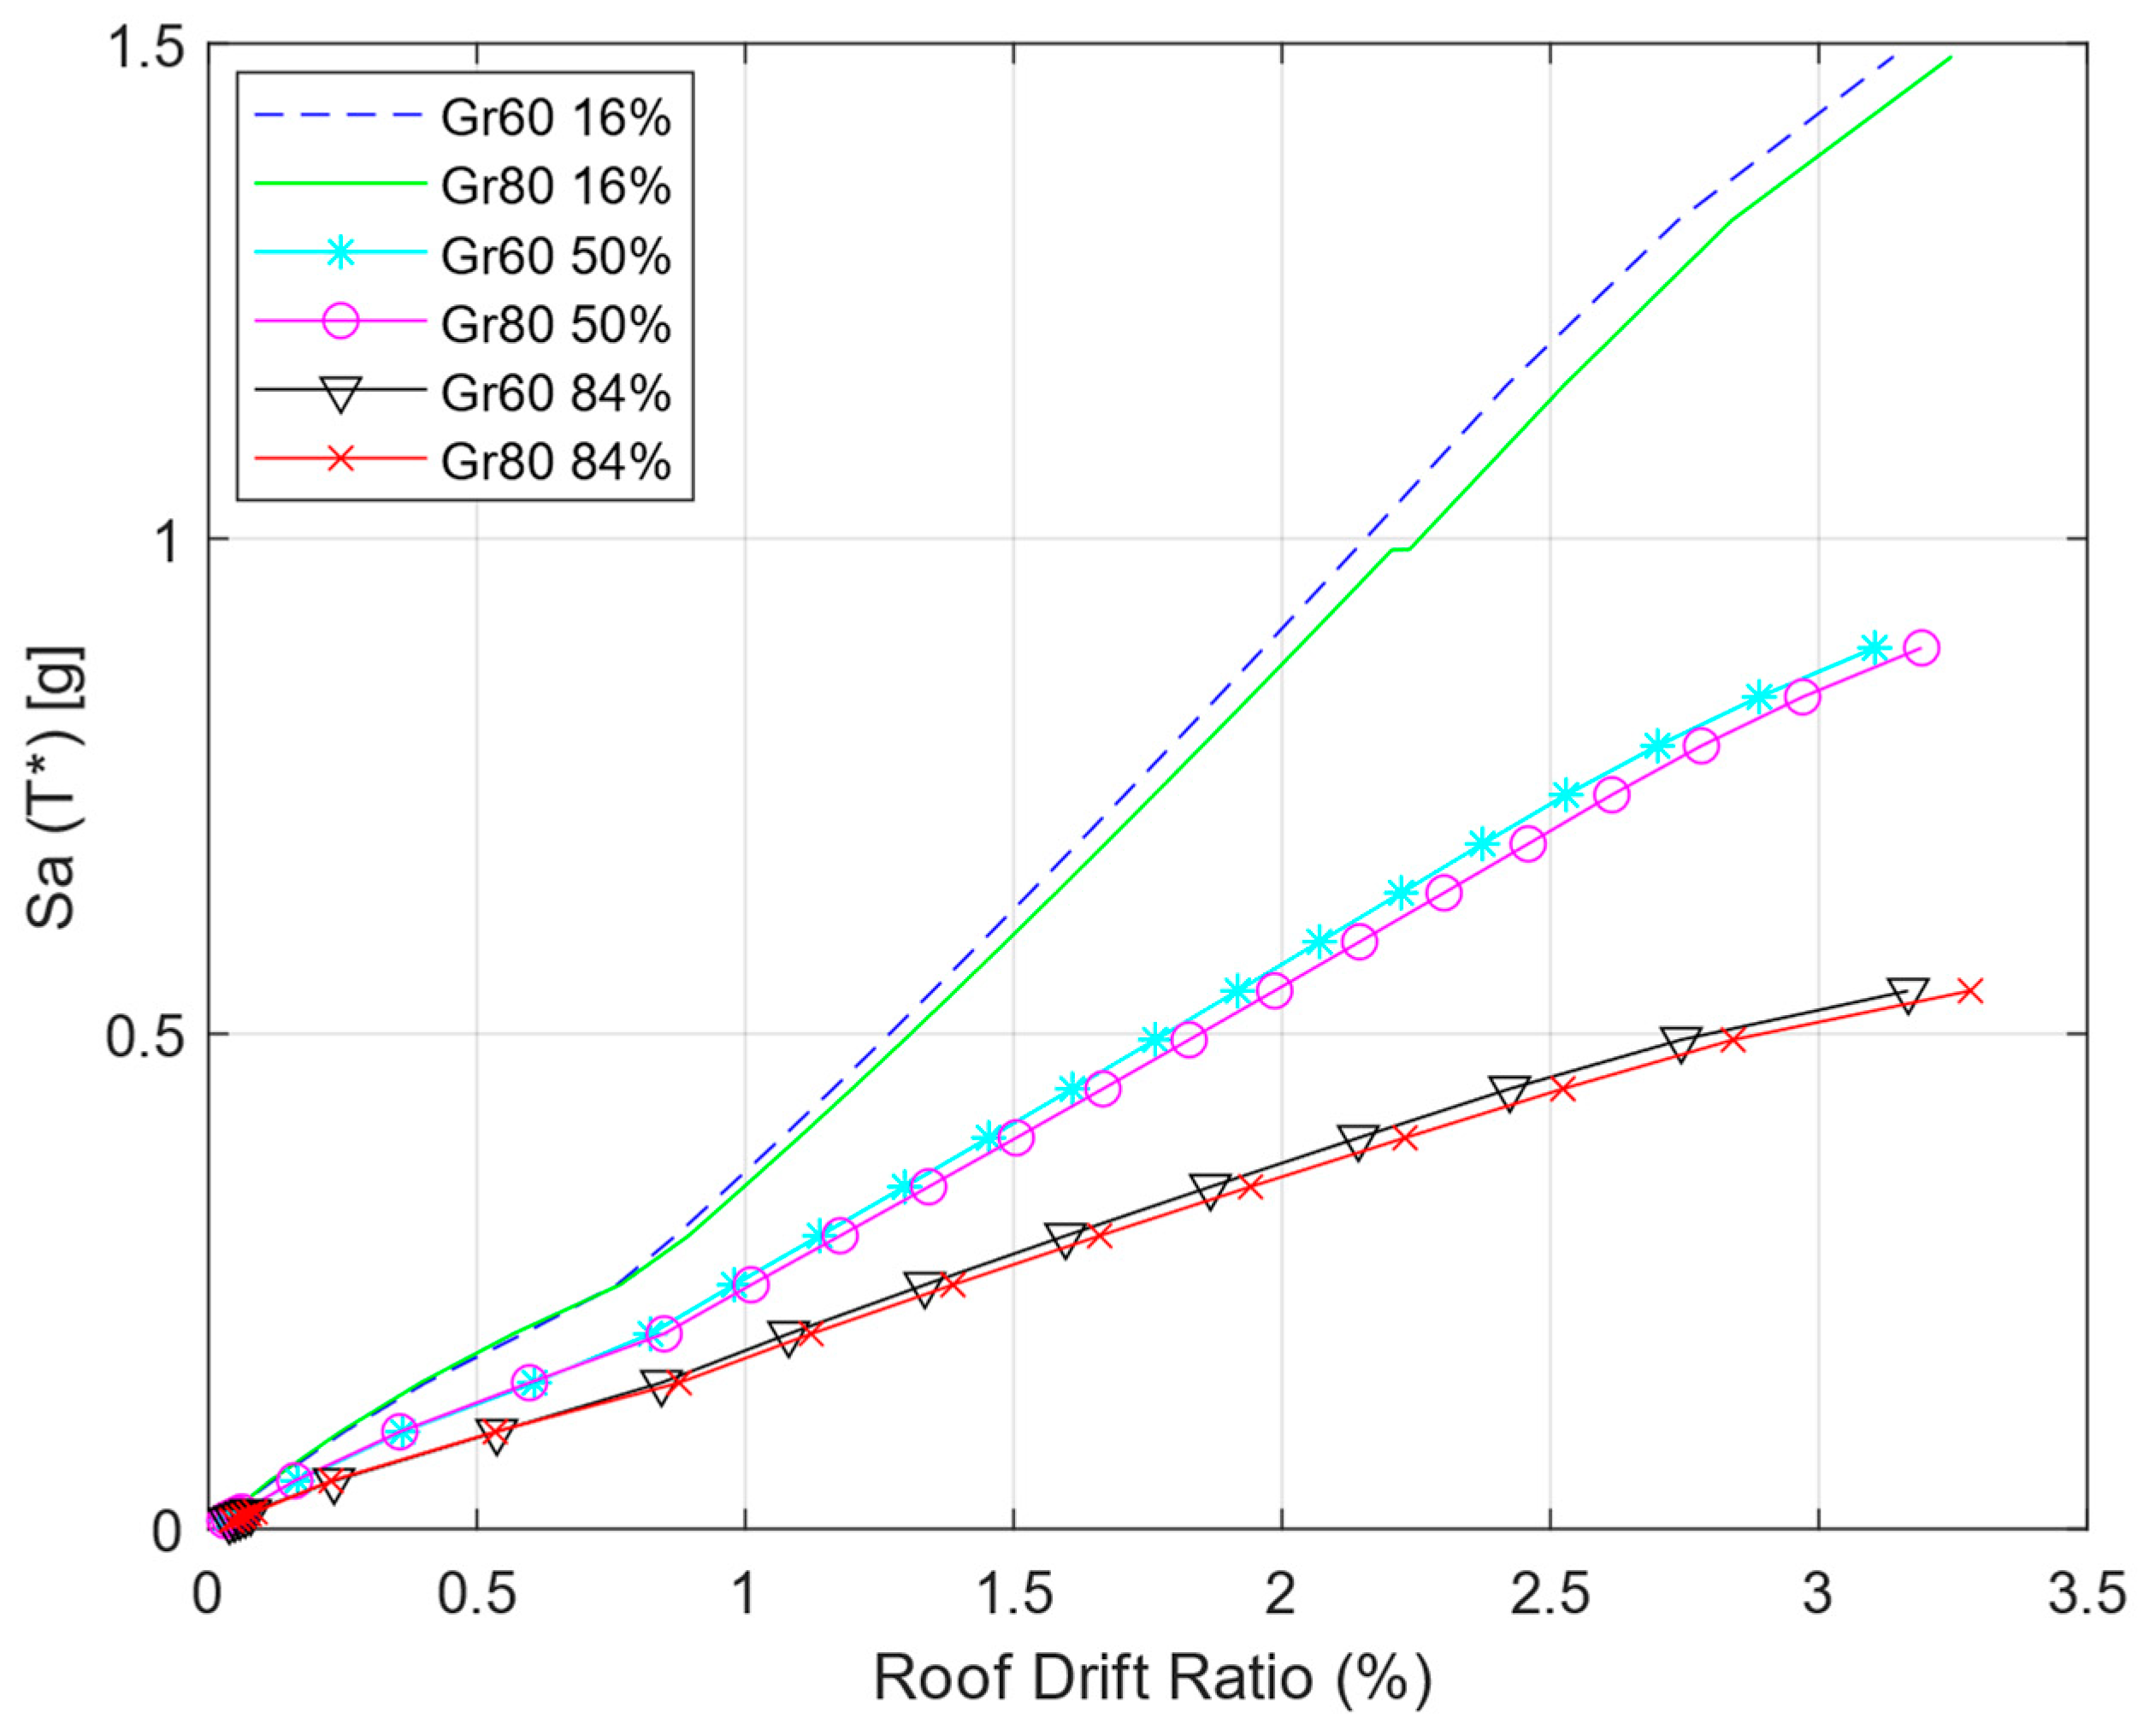
Fragility curves were estimated for the ASCE41 [9] limit states of immediate occupancy (IO), life safety (LS) and collapse prevention (CP). The first limit state (IO) is exceeded when small cracks (approximately 1.6 mm wide) appear in the walls. The second limit state (LS) is exceeded when buckling of the bars at the boundary elements, slippage in joints or some crushing cracks are observed. Finally, the third limit state (CP) occurs when the structure presents severe damage in its structural members. Fragility curves show the probability of exceeding some limit state as a function of an intensity measure corresponding to the pseudo-acceleration at the fundamental vibration period of the structure. These curves are typically obtained through incremental dynamic analyses (IDA) [26]. However, performing IDA in RC buildings with a tall shear wall requires a high computational cost. Alternatively, fragility curves can be reasonably estimated from pushover analysis using the software SPO2FRAG [10,11]. The methodology of SPO2FRAG uses simplified backbone curves defined with a quadrilinear adjustment scheme and parameters according to the original shape of the pushover curves. The input data also included the masses and heights of each story, from which the software calculated the dynamic characteristics of a new equivalent inelastic single degree of freedom system (SDoF) through the equations defined by Baltzopoulos et al. [10]. With this information, SPO2FRAG estimated the value of the participation factor of the first mode, the participating mass factor and the equivalent period (T*) of the SDoF [10]. In addition, SPO2FRAG estimated the 16%, 50% and 84% fractile IDA curves, which corresponded to the mean plus/minus one standard deviation of the maximum seismic response of the SDoF oscillators, assuming a Gaussian distribution [10]. Figure 6 shows the IDA curves for both buildings.
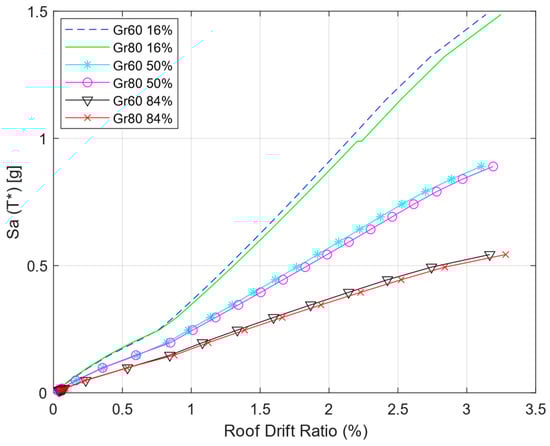
Figure 6.
Fractile IDA curves for the buildings.
As the walls of the buildings had a height-to-length aspect ratio greater than 2.0 and thus had a flexure-controlled response, the RDR values for each limit state were defined according to Tables 10–19 in ASCE 41 [9]. The corresponding RDR thresholds were 0.5% for IO, 1.5% for LS and 2.0% for CP. Moreover, additional variability was included in the model according to the methodology used by Ugalde et al. [11], defining the factor βU with a value of 0.2 for the side-sway collapse limit state.
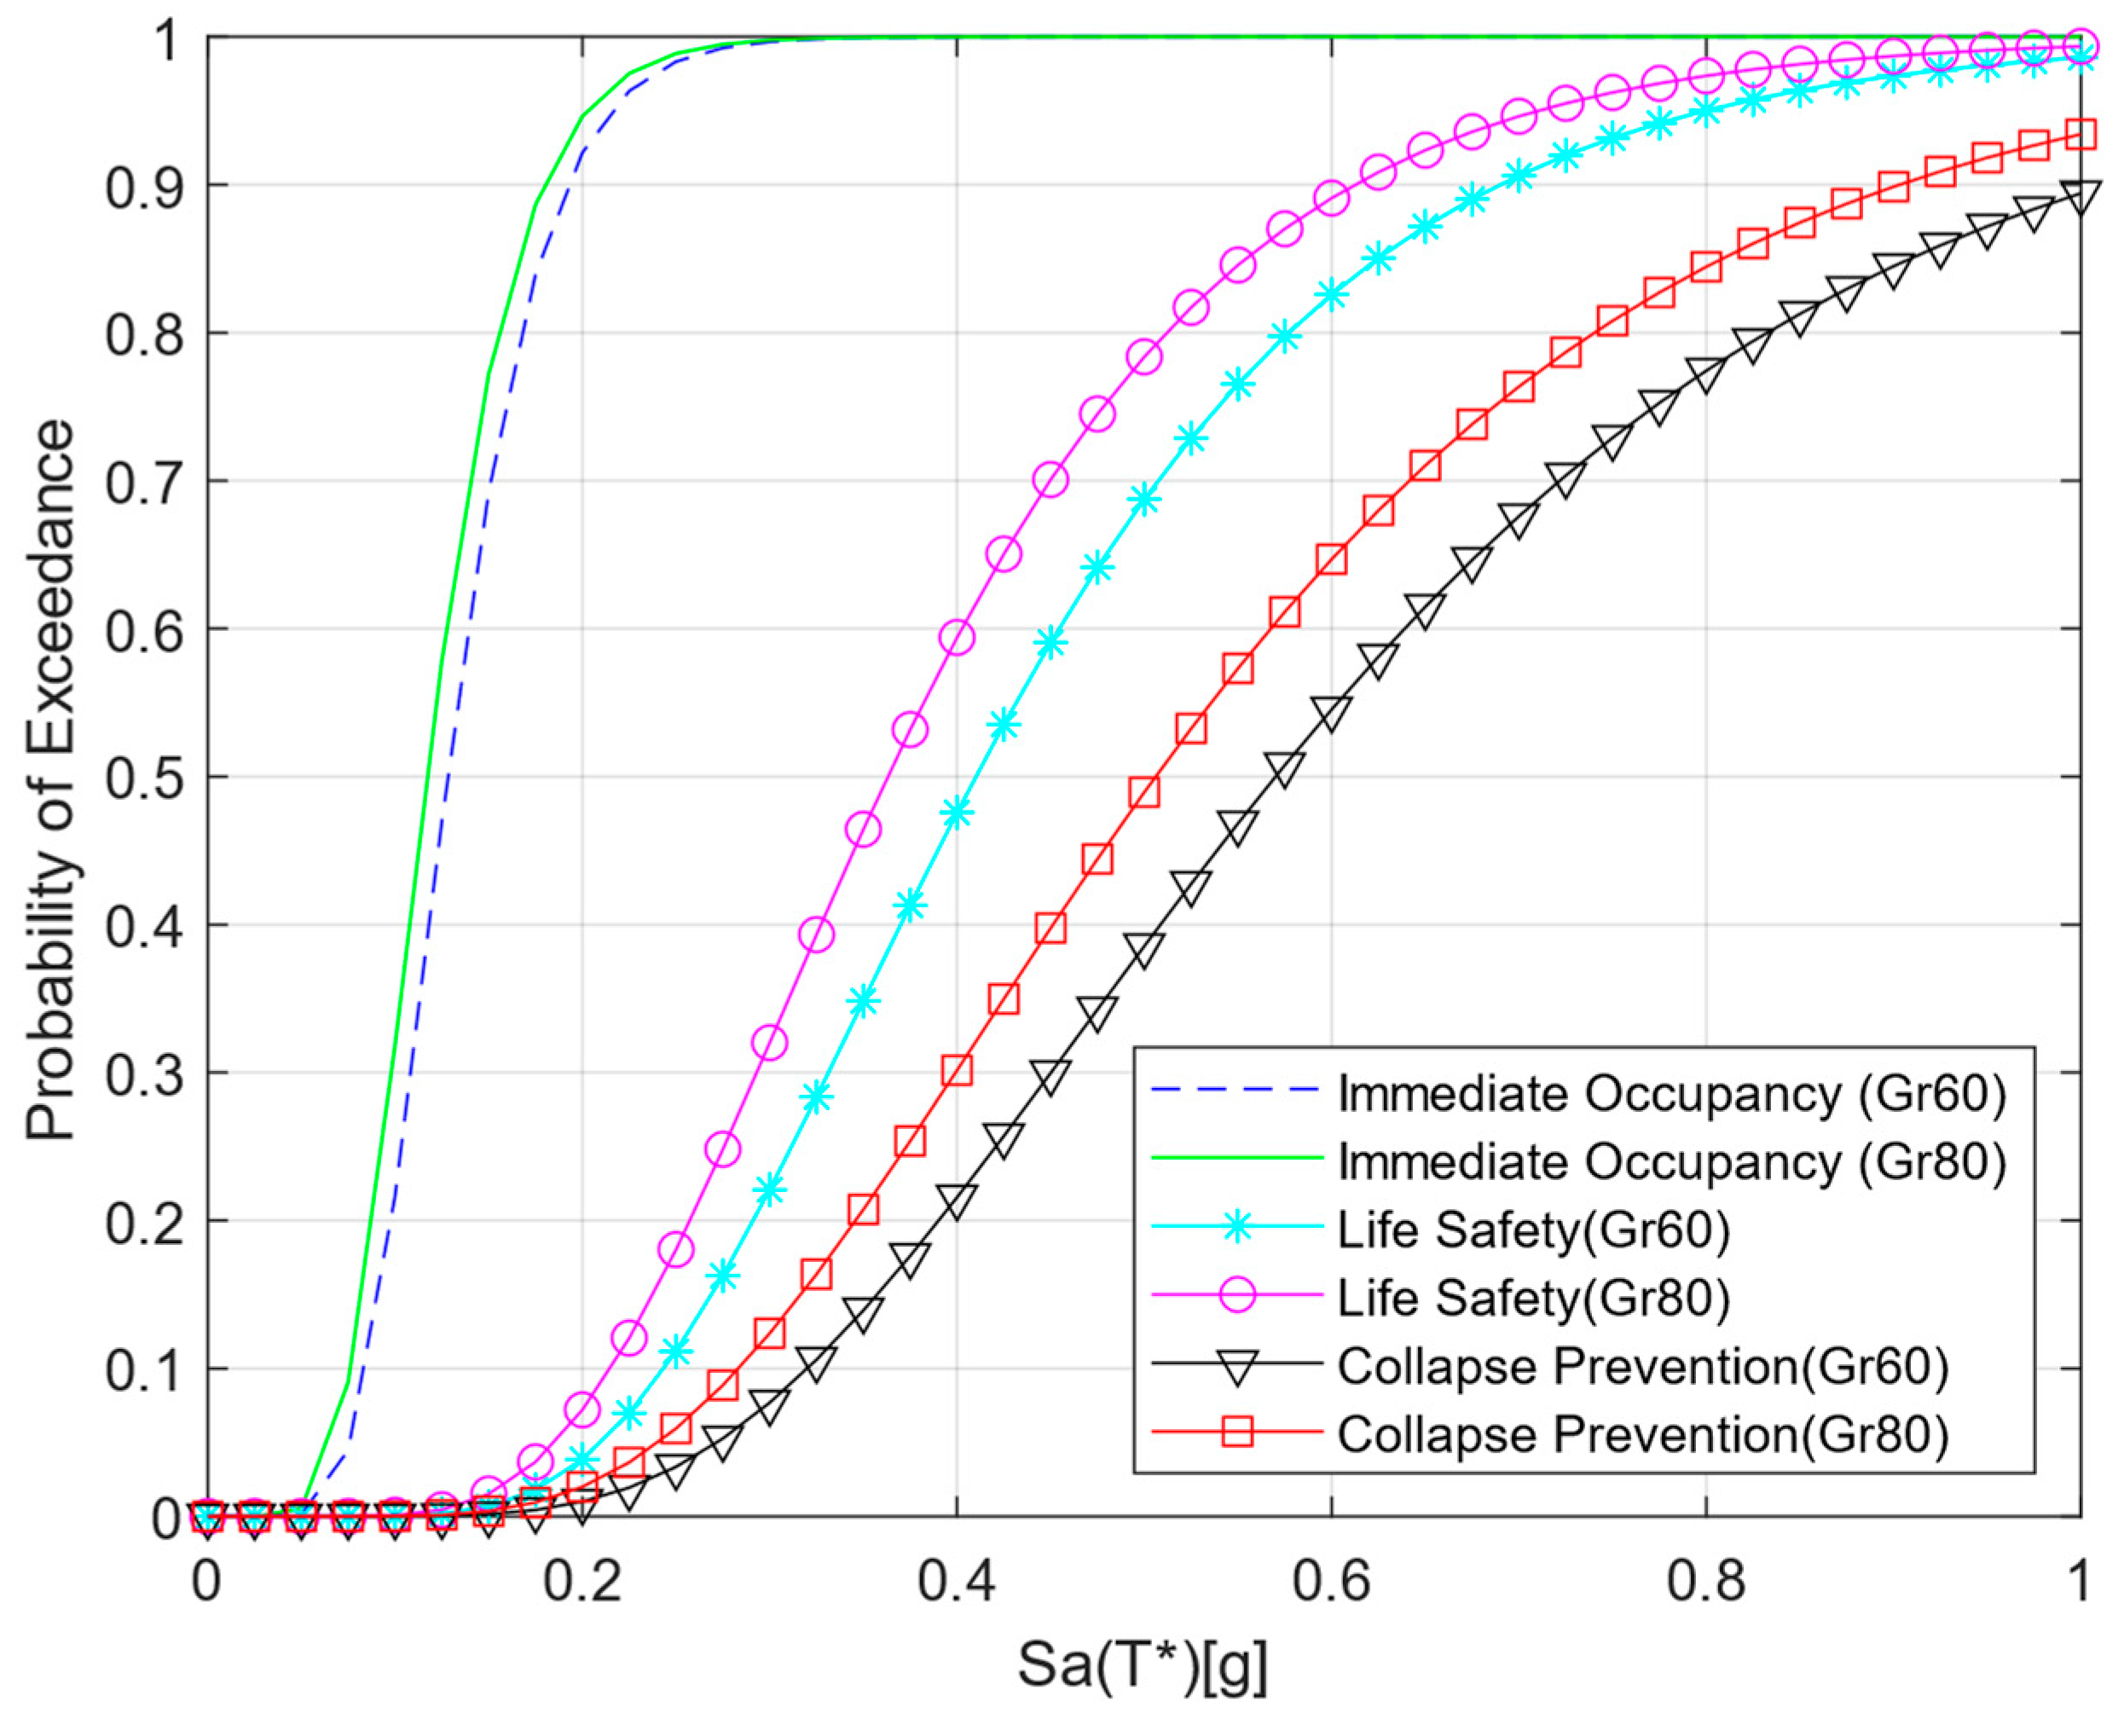
Figure 7 shows the estimated fragility curves for the two buildings. Regarding the seismic fragilities, the performance of the two buildings was quite similar, with a slightly better performance shown by the Grade 60 building for all limit states.
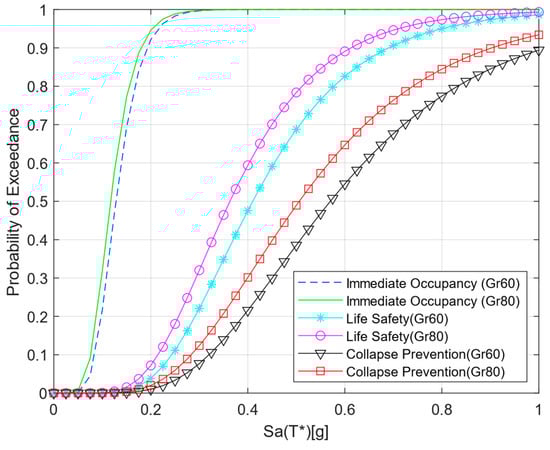
Figure 7.
Fragility curves for the two buildings.
6. Seismic Hazard Analysis and Lifecycle Assessment
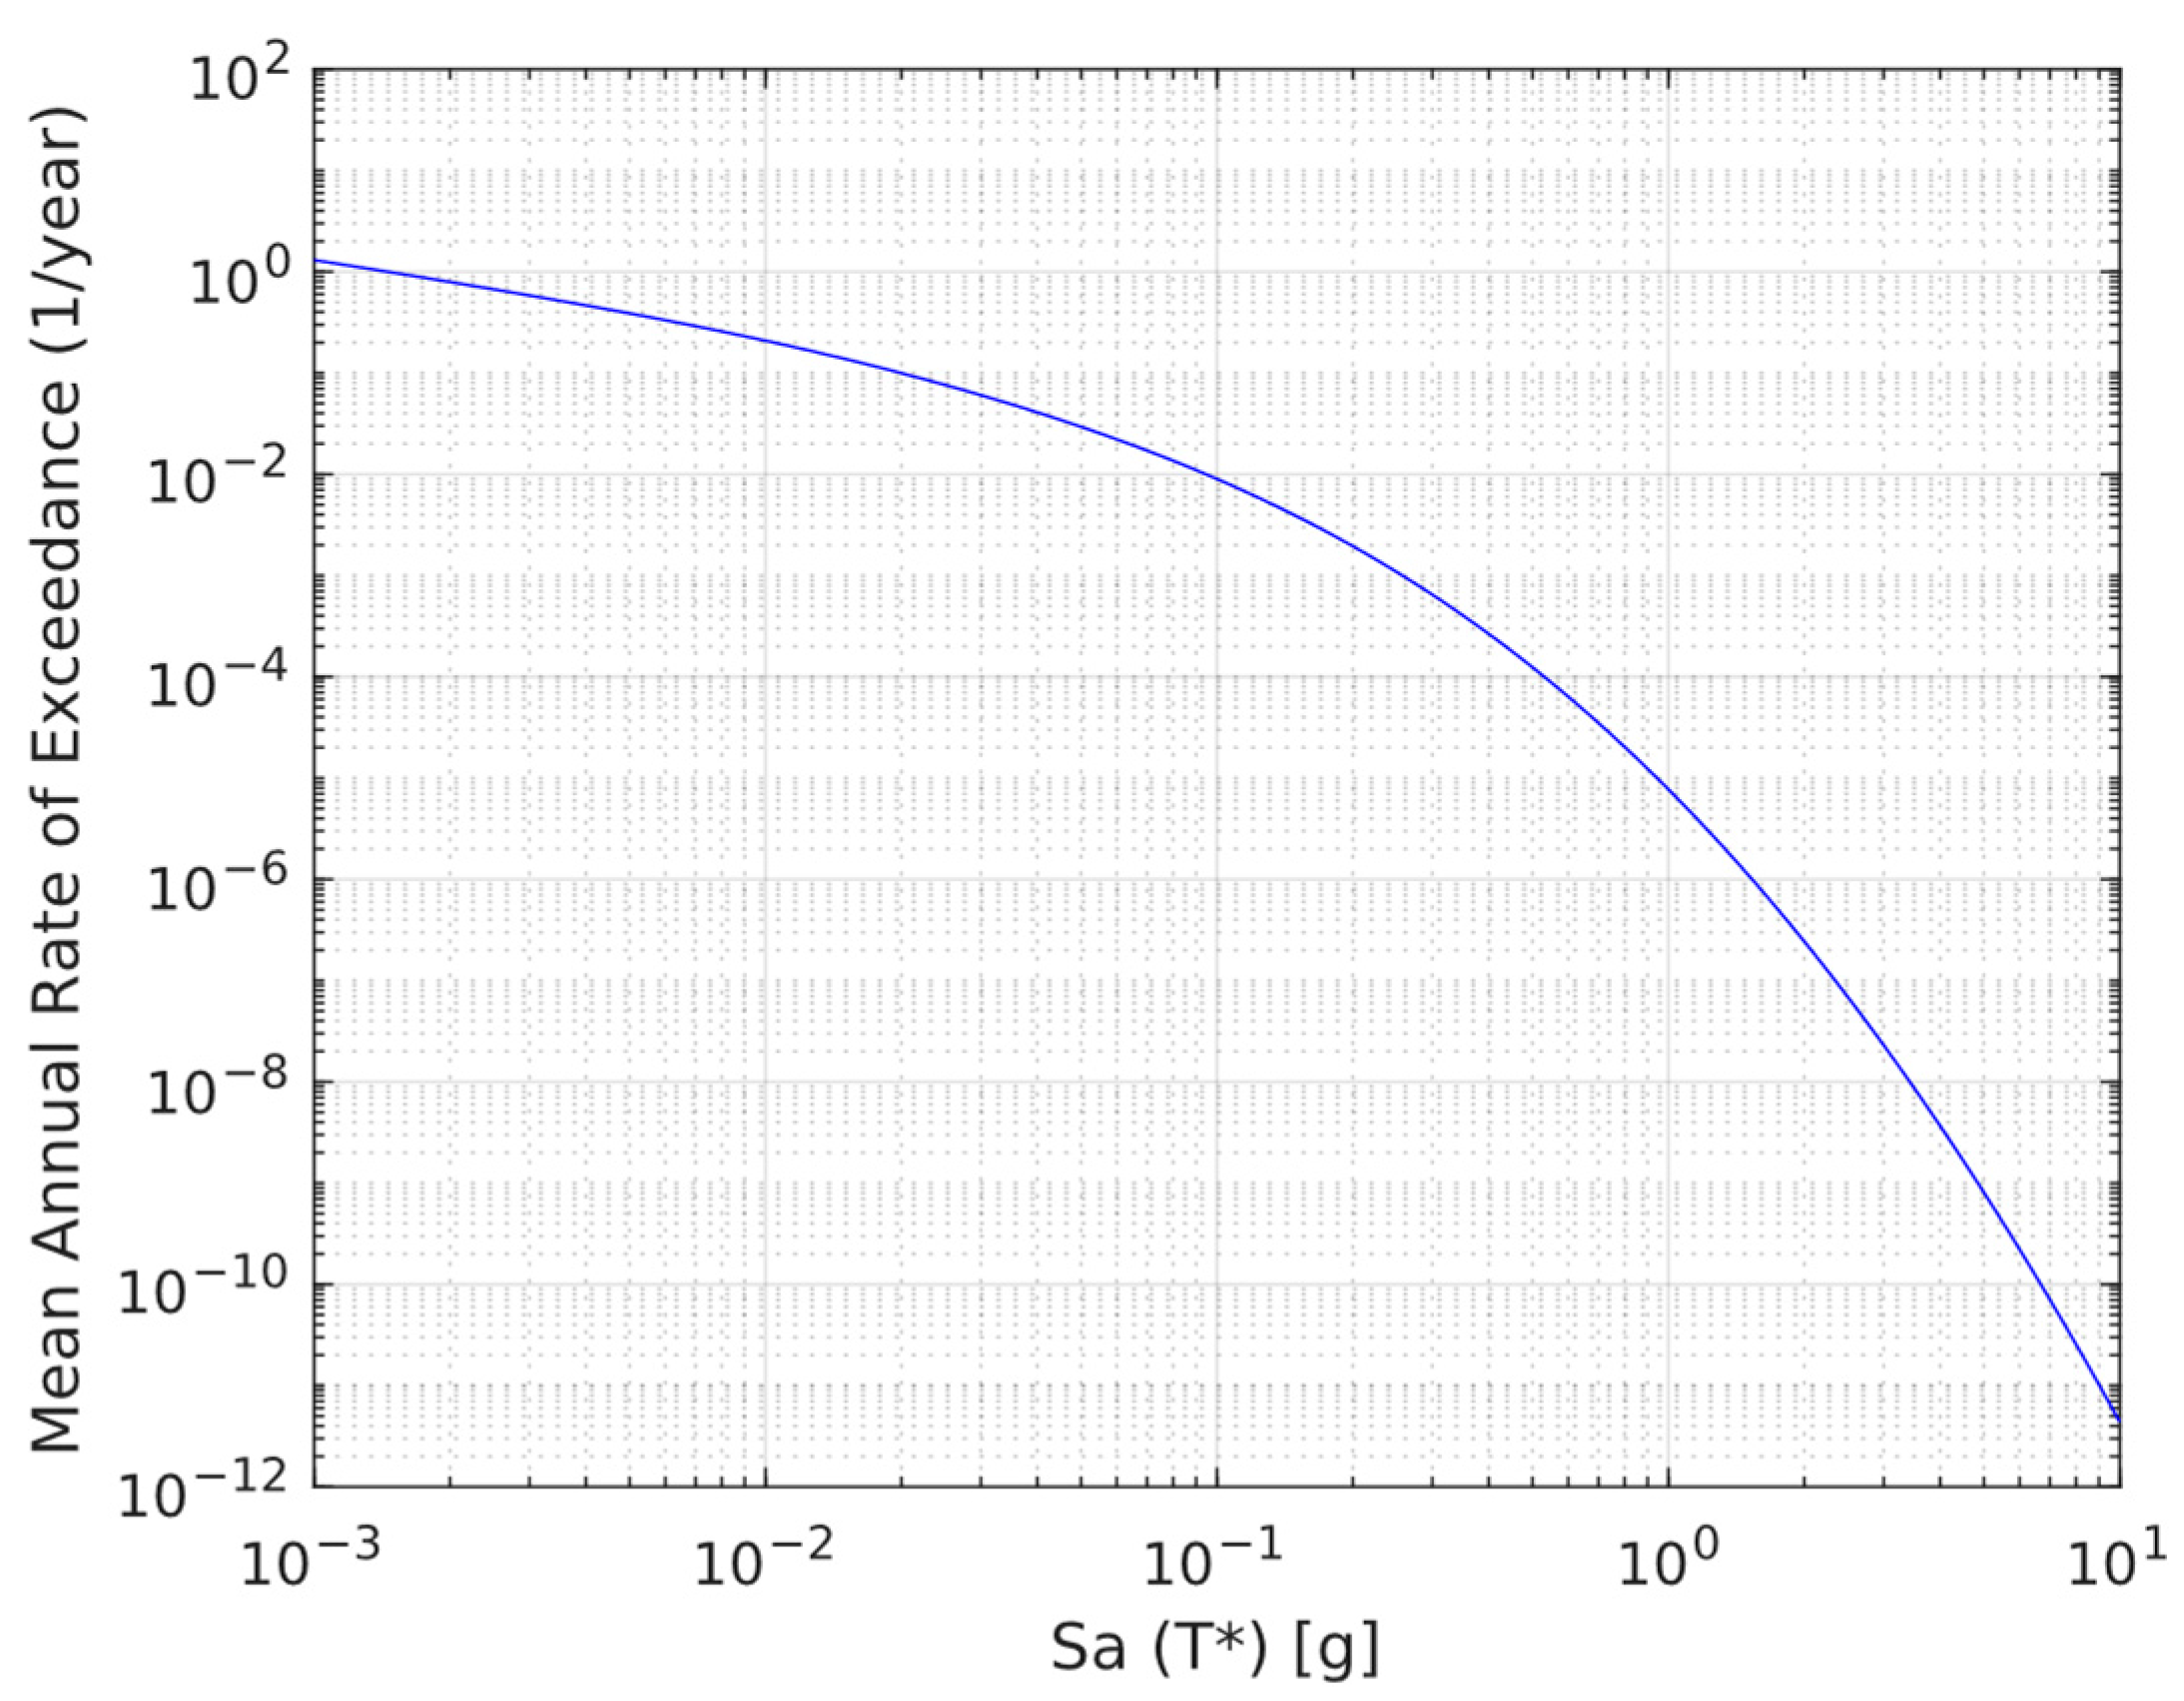
The hazard curve, which represents an estimate of the mean annual frequency of exceedance for each value of Sa(T*), was determined by a probabilistic seismic hazard analysis carried out for the central zone of Chile using the software R-CRISIS v20.0 [27]. It was taken into consideration that most of the large earthquakes in Chile originate from subduction between the Nazca plate and the South American plate [28] and present a tectonic setting defined by a series of earthquakes with magnitudes of Mw ~8.0–8.5, where the Nazca plate subducts northeastward at 68–80 mm/year every approximately 80 years [29]. The source parameters were obtained from Martin [30], and the study used the Ground Motion Prediction Equations (GMPE) proposed by Montalva et al. [31] and Abrahamson et al. [32]. Both GMPEs were weighted with a value of 0.5 each. Figure 8 shows the seismic hazard curve of the studied buildings.
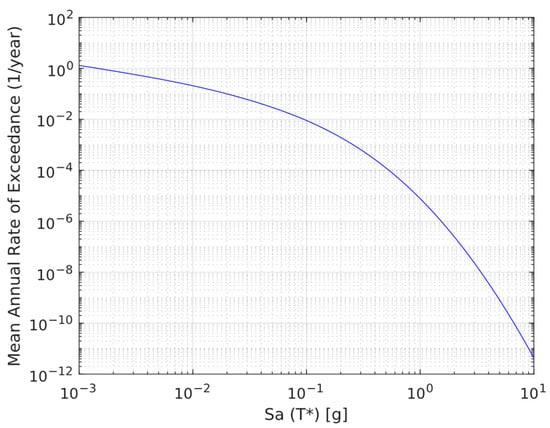
Figure 8.
Seismic hazard curve for the studied buildings.
The mean annual frequency for the limit state LS (λLS) was determined as follows [33]
where P(LS|im) is the probability that the structure under study exceeds the limit state LS when subjected to an earthquake of intensity im, and λim is the mean annual rate of exceeding the intensity of ground motion im. Thus, assuming that the occurrence of earthquakes over time follows a Poisson process, the probability of exceeding the limit state LS in t years is obtained via the following equation [33]:
This approach was used to obtain the probabilities of exceeding the thresholds of the three limit states considered in this study. Table 4 summarizes the results, showing the mean annual frequencies of each limit state being exceeded and their probabilities of being exceeded over 50 years for both buildings.
Table 4.
Mean annual frequencies and probabilities ove 50 years for the buildings at the IO, LS and CP limit states.
Table 4 shows that the building designed with Gr 60 reinforcement exhibited a slightly better seismic performance in terms of the probability of exceeding these three limit states over a lifecycle of 50 years. Moreover, both buildings performed similarly to building B2 introduced by Cando et al. [17]. This building was also located in Chile, with the same wall density and soil type, but in Santiago, where seismic requirements are lower (NCh 433 zone 2). Chile has the highest seismic requirements for locations near the coastal line and the subduction border. Concepción is a coastal city, while Santiago is 100 km from the coast. Building B2 reported a PLS of 9.3% and PCP of 2.3% in 50 years, close to the values reported in Table 4.
7. Conclusions and Closing Remarks
Before 2019, ACI 318 did not permit high-strength reinforcement in the seismic design of RC walls. This requirement changed in the 2019 version of the code, allowing the use of up to Grade 100 reinforcement in shear walls. The current Chilean standard NCh 430-08 adopted ACI 318-08 with minor modifications. However, a new version of this standard is expected, based on ACI 318-19, which will allow high-strength reinforcement in residential buildings. During the last decade, several experimental programs were conducted to evaluate the monotonic and cyclic behavior of RC members constructed with high-strength reinforcement. Considering that Chile, by tradition, adopts ACI 318 design, it is imperative to assess the impact on the seismic performance of the use of high-strength reinforcement in the structural typologies typically found in a residential building in Chile; these include fishbone-type structural plans with high wall densities, and very stiff and redundant structures.
In this study, pushover analyses were performed in two 20-story residential shear wall buildings located in Concepción, which is in the seismic zone with the highest seismicity in Chile, and over soft soil deposits. One was designed using traditional reinforcement (Grade 60), and the other with high-strength reinforcement (Grade 80). Grade 80 reinforcement was chosen due to its availability in the local market when developing this project. The purpose of the study was to compare the seismic performance of the two buildings in terms of the probability of exceeding the ASCE41 limit states during a lifecycle of 50 years. This is relevant, considering that the behavior measured in laboratory tests at the element level cannot necessarily be extrapolated to a whole building. Moreover, the structural behavior of a typical Chilean RC building is very complex, with intricate wall sections and interactions between walls and cracked slabs. Thus, this study provides valuable information about the expected structural performance of such buildings.
The seismic fragilities were estimated from the pushover analysis using SPO2FRAG. It is well known that pushover analyses have limitations in capturing all the complexities of nonlinear dynamic behavior. Nevertheless, the ability of SPO2FRAG to estimate seismic fragilities has been successfully assessed in a previous study. Later, the probabilities of exceeding the limit states within 50 years were calculated by combining the fragilities with the hazard curve obtained from a PSHA study performed for this project. The design showed that the building with Grade 80 high-strength reinforcement used 18% less steel than the structure designed using traditional Grade 60 reinforcement. The pushover analyses did not show a significant difference in the behavior of each building. Both structures collapsed almost at the same RDR, close to 3.3%, although the building designed with traditional reinforcement had a slightly higher peak strength.
The probabilities of exceeding the limit states within 50 years, using Grade 60 and Grade 80 steel, respectively, were 29.9% and 34.9% for IO, 2.7% and 3.7% for LS, and 1.2% and 1.7% for CP. In the authors’ opinion, this also indicated the slightly better performance of the Grade 60 building, which is irrelevant to deciding which steel to use in an actual design. Both buildings performed similarly to other RC shear wall buildings reported by others. Therefore, it can be concluded that the decision to include Grade 80 reinforcement in actual RC shear wall buildings should be based on the reduction in steel and the benefits of pouring concrete over less congested members in the construction process. In future research, it is recommended to include different structural typologies (wall density, number of stories), soil types and seismic zones to provide a more comprehensive database of cases to assess the impact of using high-strength reinforcement in a variety of initial conditions.
Author Contributions
Conceptualization, J.P. and P.F.P.; methodology, J.P. and P.F.P.; software, J.P.; validation, P.F.P., C.E.M.-V., P.C. and S.A.; formal analysis, J.P. and P.F.P.; investigation, J.P. and P.F.P.; resources, P.F.P.; data curation, J.P. and P.F.P..; writing—original draft preparation, J.P.; writing—review and editing, P.F.P., C.E.M.-V., P.C. and S.A.; visualization, P.F.P., C.E.M.-V., P.C. and S.A.; supervision, P.F.P.; project administration, P.F.P. All authors have read and agreed to the published version of the manuscript.
Funding
This research received no external funding.
Data Availability Statement
All data related to this research will be shared as required. Please contact the corresponding author at pablo.parra@uai.cl.
Conflicts of Interest
The authors declare no conflict of interest.
References
- Instituto Nacional de Normalización. Hormigón Armado—Requisitos de diseño y cálculo (NCh 430.Of2008); INN: Santiago, Chile, 2008. [Google Scholar]
- Instituto Nacional de Normalización. Diseño Sísmico de Edificios (NCh 433.Of1996m2009); INN: Santiago, Chile, 2009. [Google Scholar]
- Ministerio de Vivienda y Urbanismo. Diseño y Cálculo Hormigón Armado (DS60); MINVU: Santiago, Chile, 2011. [Google Scholar]
- Ministerio de Vivienda y Urbanismo. Diseño Sísmico de Edificios (DS61); MINVU: Santiago, Chile, 2011. [Google Scholar]
- American Concrete Institute. Building Code Requirements for Structural Concrete (ACI 318-08) and Commentary; American Concrete Institute: Farmington Hills, MI, USA, 2008. [Google Scholar]
- American Concrete Institute. Building Code Requirements for Structural Concrete (ACI 318-19) Commentary on Building Code Requirements for Structural Concrete (ACI 318R-19); American Concrete Institute: Farmington Hills, MI, USA, 2019. [Google Scholar]
- Moehle, J.P. Key Changes in the 2019 Edition of the ACI Building Code (ACI 318-19). 2019. Available online: www.concreteinternational.com (accessed on 16 October 2022).
- National Institute of Standards and Technology. Use of High-Strength Reinforcement in Earthquake-Resistant Concrete Structures; National Institute of Standards and Technology: Gaithersburg, MD, USA, 2014.
- American Society of Civil Engineers (ASCE). Seismic Evaluation and Retrofit of Existing Buildings. ASCE 41-13; American Society of Civil Engineers: Reston, VA, USA, 2014. [Google Scholar] [CrossRef]
- Baltzopoulos, G.; Baraschino, R.; Iervolino, I.; Vamvatsikos, D. SPO2FRAG: Software for seismic fragility assessment based on static pushover. Bull. Earthq. Eng. 2017, 15, 4399–4425. [Google Scholar] [CrossRef]
- Ugalde, D.; Lopez-Garcia, D.; Parra, P.F. Fragility-based analysis of the influence of effective stiffness of reinforced concrete members in shear wall buildings. Bull. Earthq. Eng. 2020, 18, 2061–2082. [Google Scholar] [CrossRef]
- Cao, X.-Y.; Shen, D.; Feng, D.-C.; Wang, C.-L.; Qu, Z.; Wu, G. Seismic retrofitting of existing frame buildings through externally attached sub-structures: State of the art review and future perspectives. J. Build. Eng. 2022, 57, 104904. [Google Scholar] [CrossRef]
- Mazzoni, S.; Mckenna, F.; Scott, M.H.; Fenves, G.L.; Ii, A. Open System for Earthquake Engineering Simulation (OpenSees) OpenSees Command Language Manual. 2009. Available online: https://opensees.berkeley.edu/OpenSees/manuals/usermanual/index.html (accessed on 21 March 2023).
- Weldon, B.D.; Kurama, Y.C. Nonlinear Behavior of Precast Concrete Coupling Beams under Lateral Loads. J. Struct. Eng. 2007, 133, 1571–1581. [Google Scholar] [CrossRef]
- Abaqus, G. Abaqus 6.11; Dassault Systemes Simulia Corporation: Providence, RI, USA, 2011. [Google Scholar]
- Kulkarni, S.A.; Li, B.; Yip, W.K. Finite element analysis of precast hybrid-steel concrete connections under cyclic loading. J. Constr. Steel. Res. 2008, 64, 190–201. [Google Scholar] [CrossRef]
- Cando, M.A.; Hube, M.A.; Parra, P.F.; Arteta, C.A. Effect of stiffness on the seismic performance of code-conforming reinforced concrete shear wall buildings. Eng. Struct. 2020, 219, 110724. [Google Scholar] [CrossRef]
- Instituto Nacional de Normalización. Diseño Estructural—Cargas Permanentes y Cargas de Uso (NCh 1537.Of2009); INN: Santiago, Chile, 2009. [Google Scholar]
- Instituto Nacional de Normalización. Diseño Estructural—Disposiciones Generales y Combinaciones de Cargas (NCh 3171.Of2010); INN: Santiago, Chile, 2010. [Google Scholar]
- CSI. ETABS v16 User’s Guide Manual; Computers & Structures: Berkeley, CA, USA, 2016. [Google Scholar]
- Thomsen, J.H.; Wallace, J.W. Displacement-Based Design of Slender Reinforced Concrete Structural Walls—Experimental Verification. J. Struct. Eng. 2004, 130, 618–630. [Google Scholar] [CrossRef]
- Pugh, J.S.; Lowes, L.N.; Lehman, D.E. Nonlinear line-element modeling of flexural reinforced concrete walls. Eng. Struct. 2015, 104, 174–192. [Google Scholar] [CrossRef]
- Saatcioglu, M.; Razvi, S.R. Strength and Ductility of Confined Concrete. J. Struct. Eng. 1992, 118, 1590–1607. [Google Scholar] [CrossRef]
- Gogus, A.; Wallace, J.W. Seismic Safety Evaluation of Reinforced Concrete Walls through FEMA P695 Methodology. J. Struct. Eng. 2015, 141, 04015002. [Google Scholar] [CrossRef]
- Pacific Earthquake Engineering Research Center (PEER). Tall Buildings Initiative (TBI). In Guidelines for Performance-Based Seismic Design of Tall Buildings; Pacific Earthquake Engineering Research Center (PEER): Berkeley, CA, USA, 2017. [Google Scholar]
- Vamvatsikos, D.; Cornell, C.A. Incremental dynamic analysis. Earthq. Eng. Struct. Dyn. 2002, 31, 491–514. [Google Scholar] [CrossRef]
- Ordaz, M.; Salgado-Gálvez, M.A. R-CRISIS Validation and Verification Document; Instituto de Ingeniería—Universidad Nacional Autónoma de México & Evaluación de Riesgos Naturales: Mexico City, Mexico, 2017. [Google Scholar]
- Beck, S.; Barrientos, S.; Kausel, E.; Reyes, M. Source characteristics of historic earthquakes along the central Chile subduction Askew et alzone. J. S. Am. Earth Sci. 1998, 11, 115–129. [Google Scholar] [CrossRef]
- Dura, T.; Cisternas, M.; Horton, B.P.; Ely, L.L.; Nelson, A.R.; Wesson, R.L.; Pilarczyk, J.E. Coastal evidence for Holocene subduction-zone earthquakes and tsunamis in central Chile. Quat. Sci. Rev. 2015, 113, 93–111. [Google Scholar] [CrossRef]
- Martin, A. Hacia una Nueva Regionalización y Cálculo del Peligro Sísmico en Chile; Memoria de Título, Universidad de Chile: Santiago, Chile, 1990. [Google Scholar]
- Montalva, G.A.; Bastías, N.; Rodriguez-Marek, A. Ground-Motion Prediction Equation for the Chilean Subduction Zone. Bull. Seismol. Soc. Am. 2017, 107, 901–911. [Google Scholar] [CrossRef]
- Abrahamson, N.; Gregor, N.; Addo, K. BC Hydro Ground Motion Prediction Equations for Subduction Earthquakes. Earthq. Spectra 2016, 32, 23–44. [Google Scholar] [CrossRef]
- Eads, L.; Miranda, E.; Krawinkler, H.; Lignos, D.G. An efficient method for estimating the collapse risk of structures in seismic regions. Earthq. Eng. Struct. Dyn. 2013, 42, 25–41. [Google Scholar] [CrossRef]
Disclaimer/Publisher’s Note: The statements, opinions and data contained in all publications are solely those of the individual author(s) and contributor(s) and not of MDPI and/or the editor(s). MDPI and/or the editor(s) disclaim responsibility for any injury to people or property resulting from any ideas, methods, instructions or products referred to in the content. |
© 2023 by the authors. Licensee MDPI, Basel, Switzerland. This article is an open access article distributed under the terms and conditions of the Creative Commons Attribution (CC BY) license (https://creativecommons.org/licenses/by/4.0/).