Article

Quantitative Evaluation Method and Process of BIM Data for Generating BIM-Based 2D Deliverables

1
Department of Convergence Engineering for Future City, Sungkyunkwan University, Suwon 16419, Republic of Korea
2
School of Civil, Architectural Engineering & Landscape Architecture, Sungkyunkwan University, Suwon 16419, Republic of Korea
3
School of Architecture, Kyungpook National University, Daegu 41566, Republic of Korea
*
Author to whom correspondence should be addressed.
Buildings 2023, 13(12), 3124; https://doi.org/10.3390/buildings13123124
Submission received: 10 November 2023 / Revised: 2 December 2023 / Accepted: 12 December 2023 / Published: 16 December 2023
(This article belongs to the Special Issue Advanced Technologies for Urban and Architectural Design)

Abstract

:
Views, drawings, and data extracted from building information modeling (BIM) constitute essential deliverables throughout the lifecycle of an architecture, engineering, and construction project, offering crucial insights for comprehending the design. Nevertheless, many employers evaluating BIM deliverables lack standardized criteria for the specific intended use of each BIM outcome, which hampers the practical utility of BIM results. This study introduces a quantitative evaluation method for the management of BIM-based two-dimensional (2D) deliverables. The BIM outcome measurement index for 2D deliverables (BOMI-2D) is formulated to provide a quantitative assessment of BIM data, focusing on their composition, structure, data readiness, and consistency. Pilot tests validated the efficacy of BOMI-2D, revealing an impressive 88.3% reduction in additional work required for 2D deliverables when data readiness increased by 25% and consistency improved by 32%. BOMI-2D is poised to play a pivotal role as an evaluation index for BIM data and outcomes, ultimately enhancing their utilization and productivity.

1. Introduction

1.1. Background and Purpose of Research

In the field of architecture, engineering, and construction (AEC) industries, building information modeling (BIM) serves as a fundamental paradigm, enabling the comprehensive management, analysis, and visualization of building- and construction-related data. BIM supports various project objectives and performance goals by facilitating the collection and organization of pertinent data [1,2,3]. As the specific information and management processes associated with BIM usage can vary significantly based on the intended application [1,2,3], the effective construction and management of data within the BIM framework become paramount [2,3,4,5]. Furthermore, the most substantial value can be realized through BIM adoption during the design phase, which is a pivotal stage for decision-making and information generation in the AEC sector [1]. Consequently, the introduction and implementation of BIM have been mandated at the governmental level on an international scale [3,5].
Nevertheless, 2D drawings continue to maintain their importance within the AEC industry [6]. Certain types of documents and drawings are essential to adhere to regulatory requirements for construction projects, permits, and approvals throughout the project life cycle. They serve as the means for comprehending the design and facilitating communication among project stakeholders. Consequently, traditional 2D drawings have not been entirely replaced by 3D BIM models; instead, they are evolving into BIM-based 2D deliverables, incorporating 3D BIM-based views and drawings [3]. These drawings created through BIM retain their connection with 3D BIM while enhancing the information and functionalities they provide through the comprehensive data contained within BIM and the infinite views derived from them [6]. To create 2D deliverables from BIM, researchers have previously identified specific BIM data requirements aimed at improving user productivity and enhancing the usability of BIM model data while ensuring consistency with 2D deliverables [7].
Additionally, international standards have been established to optimize the creation and utilization of BIM data [8,9,10]. Data within the BIM model, customized to match the project’s objectives and utilization level, are managed and exchanged using Industry Foundation Classes (IFC), an internationally recognized standard for data representation and exchange [10]. ISO 19650 [9], an international standard, governs the management of construction- and building-related information, offering guidance on information requirements and project management within the BIM context. The details and information levels are defined based on the employer’s information requirements (EIRs), which are integral components of the project’s contractual documentation, serving as the criteria for deliverable creation.
Nonetheless, many employers evaluating BIM deliverables lack standardized criteria or procedures tailored to the specific intended use of each BIM outcome, which hampers the practical utility of BIM results [3]. Employers, often possessing less expertise compared to subcontractors, are responsible for BIM application projects that heavily rely on subcontractors [4]. This factor impedes data-driven construction management, a primary objective of BIM implementation, leading to reduced efficiency and usability in subsequent stages [5]. Furthermore, compared to internationally established BIM standards and requirements, few studies on standards or methods for evaluating the quality of BIM models and deliverables extracted from BIM have been conducted [2,3,11,12]. Even ISO 19650 does not present evaluation methods or criteria for BIM deliverables, merely stating that procedures and responsibilities for data verification should be clearly defined and performed in agreement with project stakeholders. Therefore, project participants should establish evaluation methods and criteria to evaluate BIM deliverables quantitatively and enable continuous improvements in BIM outcomes [3,13].
The requirements for BIM data vary significantly based on the level of information and modeling techniques used, aligning with the specific objectives of a given project. Therefore, a critical review of BIM data quality is essential [2,3]. Given that the purpose of BIM utilization and associated responsibilities differ across different project phases, the simple submission of an overly detailed BIM model may not be conducive to the collaborative BIM process and can lead to inefficient workflows [2,3]. Conversely, a lack of essential information for BIM utilization can impede the effectiveness of BIM, resulting in substantial rework and added costs [4]. BIM-based 2D deliverables are one of the most important outcomes among BIM outputs because they are used as a new means of communication in the AEC industry [3,7]. Previous research has verified that the level of BIM-data creation that meets the requirements directly affects the productivity of 2D deliverable generation and the consistency of the model and outcome [7]. Therefore, evaluating the extraction process and results of BIM data and 2D deliverables is essential to secure the quality of BIM-based 2D deliverables [3].
This study’s primary objective is to develop a quantitative evaluation method for generating BIM-based 2D deliverables. To this end, this study introduces the BIM outcome measurement index for 2D deliverables (BOMI-2D), designed to quantitatively assess the level of BIM data necessary to meet the requirements for generating 2D deliverables while enhancing work productivity. This approach aims to ensure successful project execution and elevate the productivity of the AEC industry by securing the data quality of BIM achievements and enhancing their utilization.

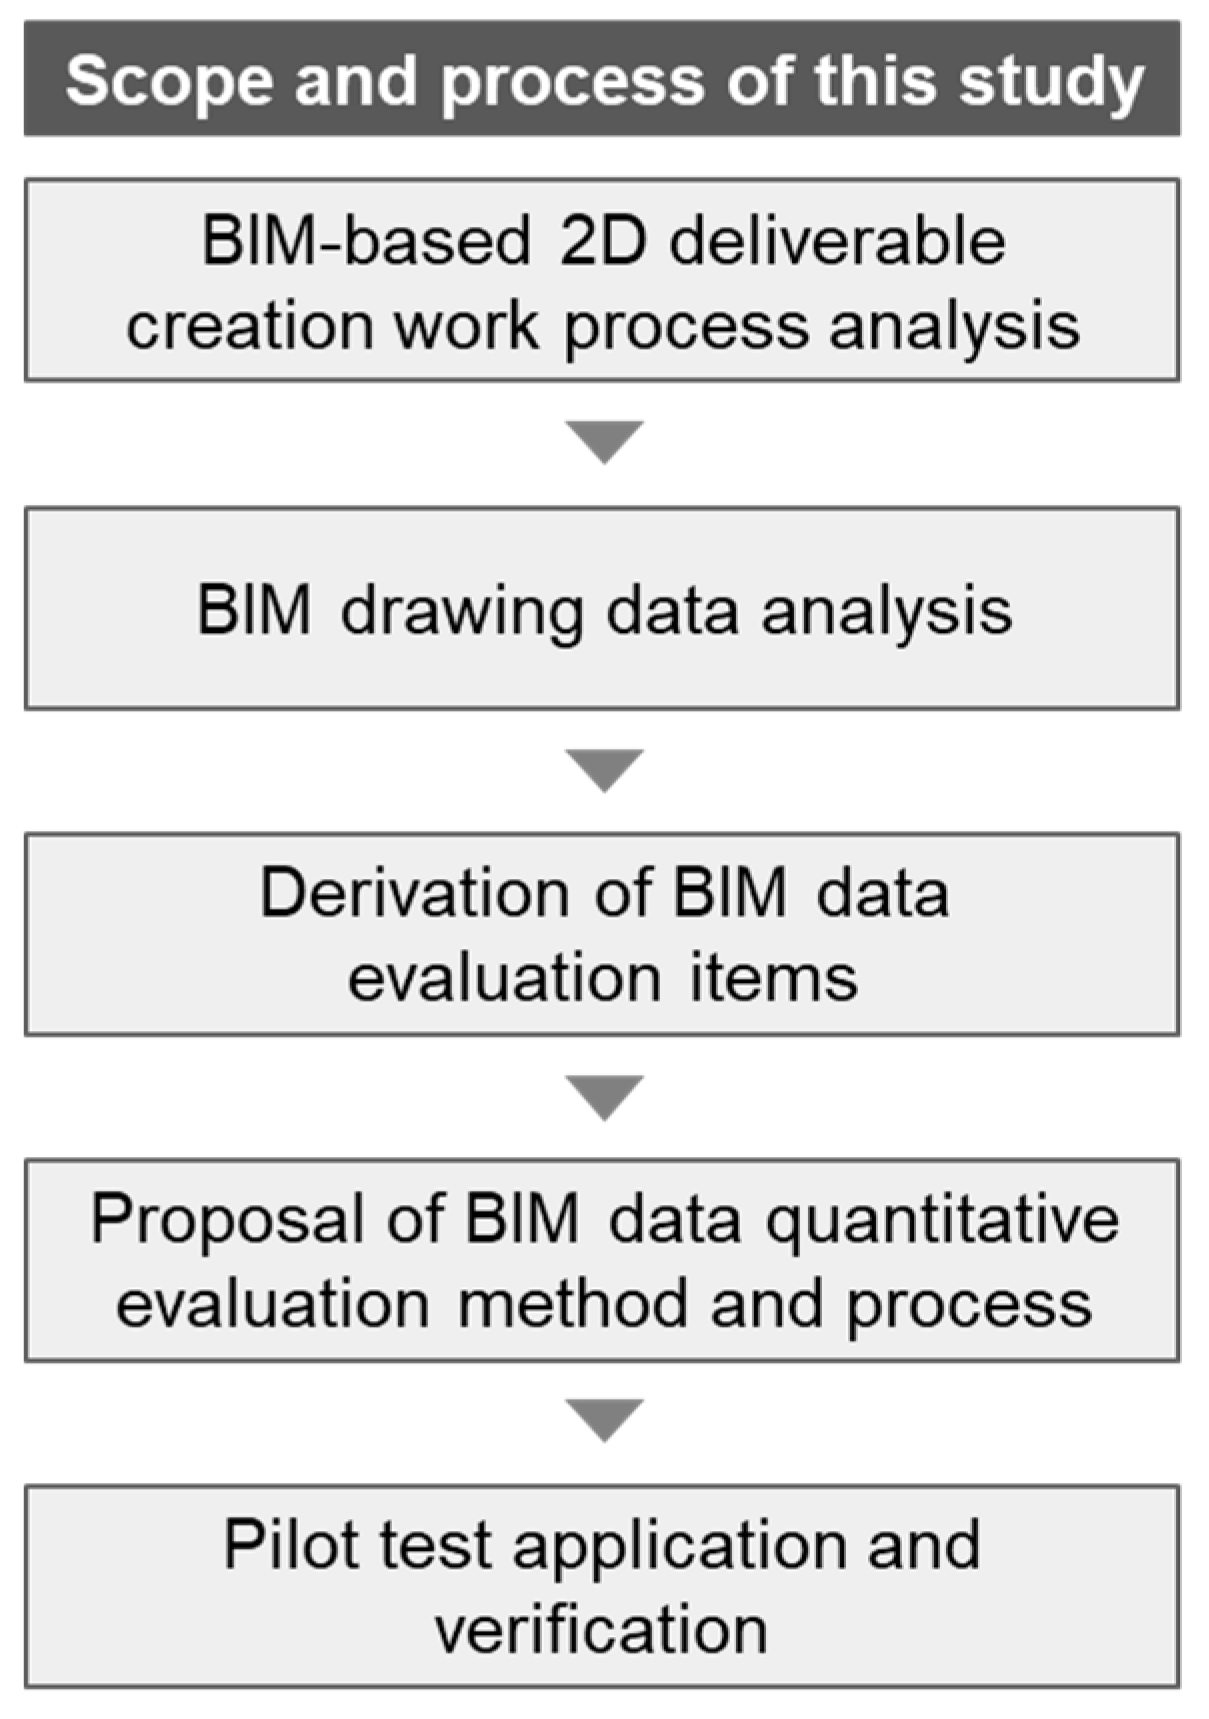
1.2. Research Scope and Method

The criteria and requirements for creating BIM data differ depending on the purpose of the BIM utilization and project characteristics [2,3,14]. Therefore, managing and evaluating the outcomes based on the requirements for a specific purpose of BIM utilization is necessary as a BIM data-creation standard [2,3]. In this study, a BIM outcome measurement index was derived to manage and evaluate the quality of 2D deliverables, which is one of the most important outcomes among BIM deliverables.
This study presents a method and process for evaluating BIM data based on the BIM data requirements for 2D deliverables (BDR-2D) previously developed in research targeting the architecture and structural fields (Figure 1) [7]. This evaluation encompasses an analysis of the BIM-based 2D deliverable creation process and the elements involved in expressing 2D deliverables derived from BIM. Based on the BIM data employed in the 2D deliverable creation process and user workflow, this study establishes evaluation criteria to enhance the utilization of BIM data and bolster work productivity. BOMI-2D encompasses two types of evaluation indexes. The first type is the BIM data readiness index (BDRI), which assesses the preparedness of data for object composition and object attribute information necessary for calculating BIM-based 2D deliverables. The second is the BIM data consistency index (BDCI), which evaluates the cohesion between drawing elements depicted in 2D deliverables and BIM data. To facilitate quantitative evaluation, this study presents IFC-based evaluation criteria and procedures tailored to the characteristics of the evaluation indexes. Finally, the BOMI-2D evaluation method is applied to a pilot project to validate the evaluation process, and the work productivity is analyzed in accordance with the evaluation indexes. The pilot project was obtained from a residential facility construction project in the Republic of Korea, focusing on architectural and structural aspects during the construction documentation (CD) stage, and created using ArchiCAD 23TM [15]. To utilize the pilot test model, the core functions for evaluating BOMI-2D are implemented using the API provided by ArchiCADTM.

2. Relevant Research

2.1. Evaluation of BIM Maturity

A substantial body of research has been dedicated to the assessment of BIM quality in order to establish criteria for evaluating BIM maturity. This is especially crucial as the quality of BIM deliverables significantly influences project quality, cost, and overall success [1,11,12,13,16,17,18,19,20,21,22]. Consequently, this literature review centers its attention on scrutinizing existing evaluation models and studies that pertain to the assessment criteria for BIM maturity, with a particular focus on the evaluation of BIM deliverables and the criteria impacting 2D deliverables.
Kam et al. [18] introduced the virtual design and construction scorecard, a framework that delineates BIM maturity across four key domains: planning, adoption, technology, and performance. It employs a five-level percentage scale for performance assessment. From a technological perspective, the evaluation index emphasizes the importance of BIM software usage in ensuring BIM performance. It also incorporates inquiries about data loss or format issues during model exchange or collaboration processes as part of the BIM deliverables evaluation. In NBIMS Ver. 3 [21], an interactive Capability Maturity Model, inspired by Paulk et al.’s Capability Maturity Model [22], was proposed. It assesses modeling deliverables, organizational aspects, and process-related components of BIM maturity. The evaluation criteria and maturity levels are further subdivided into ten levels for each criterion, allowing evaluators to tailor their assessments to specific projects. Minimum maturity levels are stipulated for each criterion to ensure the quality of BIM deliverables during the evaluation process. It should be noted that this evaluation model primarily focuses on the BIM implementation process rather than evaluating BIM based on its data structures or configurations. Liang et al. [20] presented the multifunctional BIM maturity model (MBMM), which classifies BIM maturity into three evaluation areas: technology, process, and protocol. Each area is assessed at four stages (stage 0 to stage 3), and the process evaluation area evaluates the integration of working documents in an AEC industry-compliant CAD/BIM workflow for drawings and document deliverables. Shin et al. [1] proposed the BIM balanced score chart, a five-point measurement index comprising 26 key success factors for BIM, aimed at diagnosing the level and status of BIM utilization at the organizational level. The objective is to enhance the competitive advantage of design firms by diagnosing current BIM utilization and forecasting future performance. Lu et al. [16] employed the MBMM to evaluate BIM maturity in the context of Hong Kong’s construction industry, focusing on project, organization, and industry-level evaluations. This evaluation considered technology, process, and protocol aspects, and it employed an expert-based Delphi method with four stages.
Nevertheless, these evaluation models inherently rely on evaluators’ subjective judgments, which can lead to quantifiable but potentially unreliable evaluation outcomes. In pursuit of more objective results compared to subjective evaluation methods, Du et al. [19] developed a cloud-based BIM performance benchmarking application called building information modeling cloud score (BIMCS). BIMCS evaluates 19 quantitative measurement indexes across six major evaluation categories. To gauge BIM’s accuracy, BIMCS measures discrepancies between BIM-based quantity take-offs and actual quantities, as well as the consistency between 2D deliverables and 3D models. It has been suggested that errors in reference to 2D deliverables should be measured to ensure consistency with the 3D model. However, a specific evaluation process and method have not been established. Yilmaz et al. [13] introduced the BIM capability assessment reference model (CAREM) to assess BIM capabilities systematically and formally in facility life-cycle processes. CAREM adheres to the meta-model of the ISO/IEC 33001 [23] family of standards and evaluates AEC/facility management (FM) processes using BIM capability levels, associated BIM attributes, and a four-point rating scale. To bolster the reliability of results, Chen et al. [11] formulated a model for evaluating BIM project performance. This model assesses project-based BIM performance in terms of technology, organization, and policy during the design and construction stages. It integrates a probability distribution function aggregation paradigm with a large-scale group decision-making framework to establish an expert-based evaluation system, ensuring objectivity in assessing project-based BIM performance.
Numerous studies have been conducted on quantitative BIM maturity evaluation models, and complementary models have been proposed by comparing and analyzing existing evaluation models. Wu et al. [12] compared and analyzed the strengths and weaknesses of nine existing measurement tools for evaluating BIM maturity. This analysis helps users to select an appropriate tool for project evaluation based on their specific needs. Edirisinghe et al. [17] developed the life-cycle BIM maturity model (LCBMM) to address the shortcomings of existing BIM maturity evaluation models. The LCBMM is based on the actor-network theory; it analyzes success and failure factors at each stage of the project execution and proposes five key lessons to achieve whole-of-life BIM maturity.
In summary, research in the field has witnessed the development of evaluation models that aim to enhance BIM’s effective implementation by evaluating the level of BIM project execution from the company’s perspective and measuring BIM’s performance and utilization within the construction industry and among BIM stakeholders. These evaluations have predominantly focused on the overall BIM implementation process, organizational considerations, and industry-level perspectives, rather than relying on criteria or methods rooted in BIM data systems or composition. Consequently, the evaluation solutions for BIM outcomes have been somewhat limited. In the case of the evaluation models presented in prior studies, scores were assigned based on the subjective judgment of evaluators [1,16,18,20,21,22]. As a result, endeavors to enhance the reliability of evaluation results through more objective assessments [11,13,19] and to suggest more reasonable evaluation ranges and targets through comparative analyses of existing performance models [12,17] have gained traction.

2.2. Evaluation of BIM Outcomes

The need for evaluation standards of BIM outcomes arises from the fact that BIM necessitates varying data-creation standards and information contingent on the project, type of work, or purpose of utilization [2,3,5]. Kwon et al. [14] proposed a BIM data-quality management method for columns, doors, and spaces. They used five review types of the data quality index as test indexes to manage the quality of BIM performance in open BIM information. Song and Ju [2] developed evaluation criteria for BIM achievements based on the BIM-related guidelines of the Republic of Korea. The quality review items required by the guidelines were classified and structured into five categories: interference review, space review, BIM model-creation criteria, design criteria, and BIM utilization purpose. A total of 27 quality review items were derived based on these classification criteria, and a rule set was partially implemented for evaluation items that could be automated.
Zadeh et al. [4] proposed a BIM information quality assessment (IQA) framework designed for facility maintenance. This framework, based on interviews with FM personnel, identifies information requirements and formulates five evaluation areas. IQA evaluation targets are defined for each area, considering FM users’ perspectives. The evaluation of consistency in the framework emphasizes the clarity and uniqueness of information related to objects. The evaluation is conducted at the object level, assessing the redundancy and uniqueness of object unit data in the BIM rather than consistency between BIM data and BIM-based outcomes. Romain et al. [5] devised a quality-management framework for FM-BIM. Their framework introduces a BIM achievement checklist that addresses usability requirements during operation and maintenance stages, serving as a standard for crafting the BIM execution plan (BEP) and conducting quality assessments. Vincenzo et al. [3] proposed a process for verifying whether BIM adheres to the required LOD consistent with the design process by considering parameters and object LOD levels. They measure the efficiency and effectiveness of the modeling process on a five-point scale (−2 to 2) and visually express the results. Kim et al. [24] analyzed the value of BIM implementation based on a construction stage case, creating a method for quantitatively estimating value through BIM utilization and contribution.
Research pertaining to the evaluation of BIM outcomes has developed a process for assessing satisfaction with data-creation criteria and necessary information in alignment with the specific BIM application project, type of work, and purpose of use [2,3,4,5,14,25]. These models evaluate BIM data based on the BEP or BIM data-creation standards and requirements in correspondence with the purpose of BIM-outcome usage. However, there remains a scarcity of studies on BIM data evaluation checklists [5] or evaluation processes [4], particularly those focused on BIM outcomes and data assessment.

2.3. Summary

Research endeavors in BIM quality evaluation have aimed to assess both maturity, which gauges BIM’s performance capability, and the outcomes of BIM implementation. Although evaluation models for assessing BIM maturity or outcomes have yet to be established as international or widely recognized standards, the field of BIM quality management remains actively engaged in research.
However, there exists limited research specifically dedicated to evaluation models and processes designed to assess BIM data related to 2D deliverables, which constitute essential outcomes of BIM projects. Furthermore, existing evaluation models have not incorporated quantitative methods for evaluating BIM data; instead, they emphasize assessing the level of each evaluation step based on the specific model’s purpose and characteristics. Thus, the objective evaluation of BIM data has been deemed insufficient. Consequently, BIM data-consistency evaluation has emerged as a prominent assessment criterion in various studies [2,3,4,5,14,19,20]. Notably, existing evaluation studies have primarily concentrated on the consistency and redundancy of object unit data within the BIM model itself, rather than the direct assessment of consistency between BIM data and final BIM-based outcomes or deliverables. While evaluating BIM data consistency at the object unit level is pivotal for maintaining data integrity within a model, it is equally important to formulate evaluation models and processes that account for the consistency between BIM data and ultimate BIM-based outcomes or deliverables. Therefore, it is imperative to establish a BIM data-evaluation model for creating and utilizing 2D deliverables, with the aim of rendering these evaluation items quantitative, thus enabling objective assessment and continuous enhancement of 2D deliverables within the BIM process.

3. Derivation of Evaluation Items for BIM Data Assessment

3.1. Analysis of the Work Process to Create 2D Deliverables in BIM

The process of generating 2D deliverables in BIM was dissected to derive BIM data evaluation criteria for 2D deliverable creation within the BIM context (Figure 2). Regardless of the specific BIM authoring tool in use, the creation of drawings in BIM follows a standardized workflow. Initially, a view appropriate for the drawing’s characteristics is extracted from the BIM model data. Subsequently, the necessary information for each drawing is expressed within the corresponding view and arranged on a drawing sheet. The flow of BIM data at each work stage and its composition were examined.
The objects constituting the BIM model data form a specific room, and the rooms are gathered by floor to form a building. The room unit design, which composes a building, is one of the most important processes in BIM design. When the basic purpose and function of a building are determined in accordance with the owner’s or user’s requirements, the designer defines the fundamental composition, layout, and shape of the building to meet these specifications. The planning of the overall building space is achieved through the unit design of each room in the building. Each room is meticulously designed to align with the building’s purpose and function, incorporating details such as the size, shape, location, function, materials, doors, and windows. This meticulous approach enables the efficient organization of building space, maximizing its functionality and usability. In the realm of BIM design, the unit design for rooms is managed via the room unit space model (ifcSpace). This model allows for the visual planning of the spatial structure of the building in three dimensions from the earliest stages of BIM design. It specifies the spatial unit for the building based on the primary uses of each room and the relationship between its components and information. Furthermore, the space model becomes invaluable during construction, where it aids in zoning planning, material management, and calculating room unit areas. It also contributes to post-construction building operation and maintenance by utilizing the information contained within the room unit space model [3].
Consequently, in the BIM design process, BIM data are structured at various hierarchical levels, ranging from individual objects, rooms, and floors to entire buildings, all contributing to spatial unit design. Objects within BIM possess shape and property information, falling into three categories, as established in a previous study [7]. The first category encompasses building objects utilized to represent facility components. The second category pertains to spatial objects, which convey spatial information such as floors, zones, and rooms within a facility. Lastly, the third category comprises auxiliary objects, serving to express additional information in the BIM data beyond the building and spatial objects. Among the auxiliary objects crucial in the process of generating 2D deliverables, three types emerge: reference elements, dimensional elements, and notation elements. Reference elements include criteria for BIM design, like grids, section lines, and elevation lines. Dimensional elements depict the dimensions of objects and specific components, while notation elements convey object information through labels or symbols. These auxiliary elements are created as either 2D or 3D objects, their form depending on the specific project and modeling methodology in use. Consequently, the objects’ creation stages may differ based on the auxiliary objects’ nature and BIM data construction method. Furthermore, the objects’ creation stages may vary according to the intended purpose and level of BIM utilization.
BIM view data represent the shape information of the objects within the BIM model, specific to the view designated by the designer. In particular, object property information adheres to user-defined specifications. Shape information is a subset of the geometric data associated with the object and is represented as-is within the view if the object exists within the BIM data. Other attributes, such as property or parametric information visible in the drawing, are expressed in accordance with the user’s definitions. The user takes charge of defining the shape and property information for BIM data visible in both 3D and 2D, forming the view data employed in drawing creation, often using libraries or templates.
The view data thus generated are placed on specific drawing sheets, allowing the user to incorporate supplementary information within the view data and drawing, matching the drawing’s characteristics and purpose. In this context, auxiliary objects, like dimensions or tags, are linked and represented based on the shape and attribute information retrieved from the building or spatial objects in the BIM data. Nevertheless, should the user intend to create auxiliary objects not linked to BIM data or need to represent information not contained within the BIM data, they may opt to utilize separate auxiliary objects that are not connected to the BIM model.
In this process, the presence or absence of BIM data and the approach to representing drawing elements exert a substantial influence on the user’s workload and the consistency between the drawing and model data. This showed that while the values of the data may vary based on design information, the fidelity based on the existence of the necessary data for generating 2D deliverables from the BIM data is a key factor in determining work productivity and data consistency.

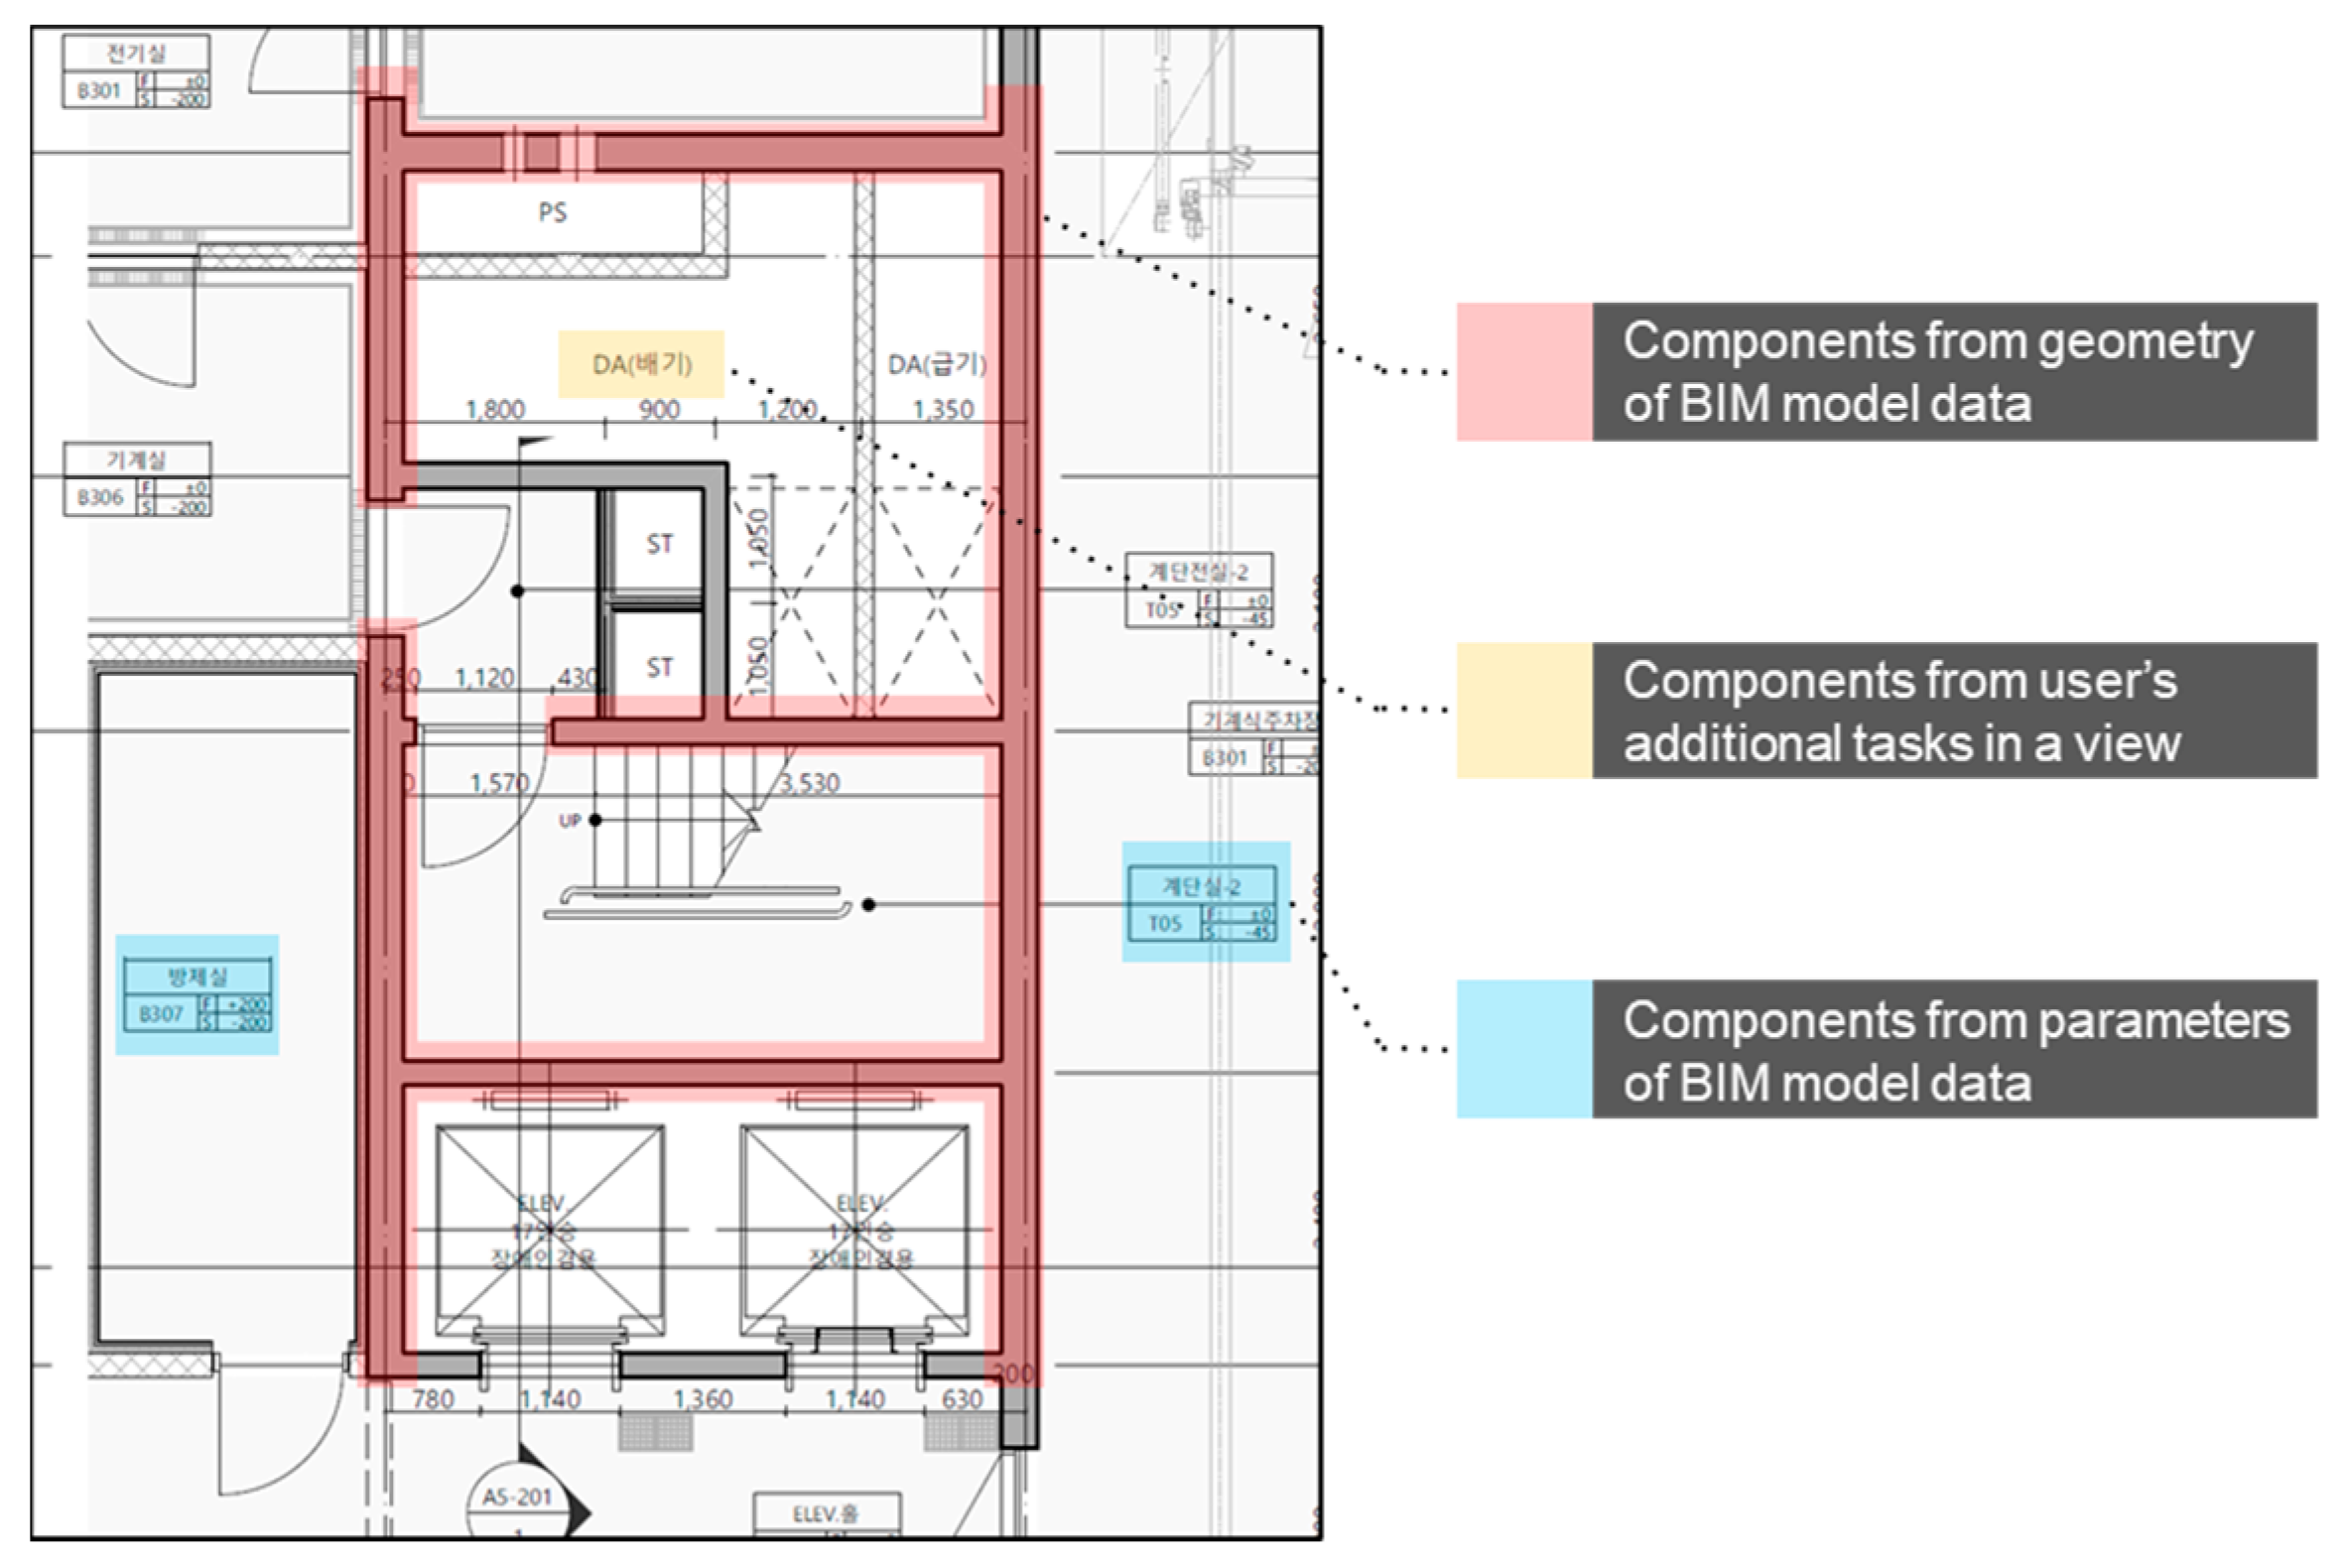
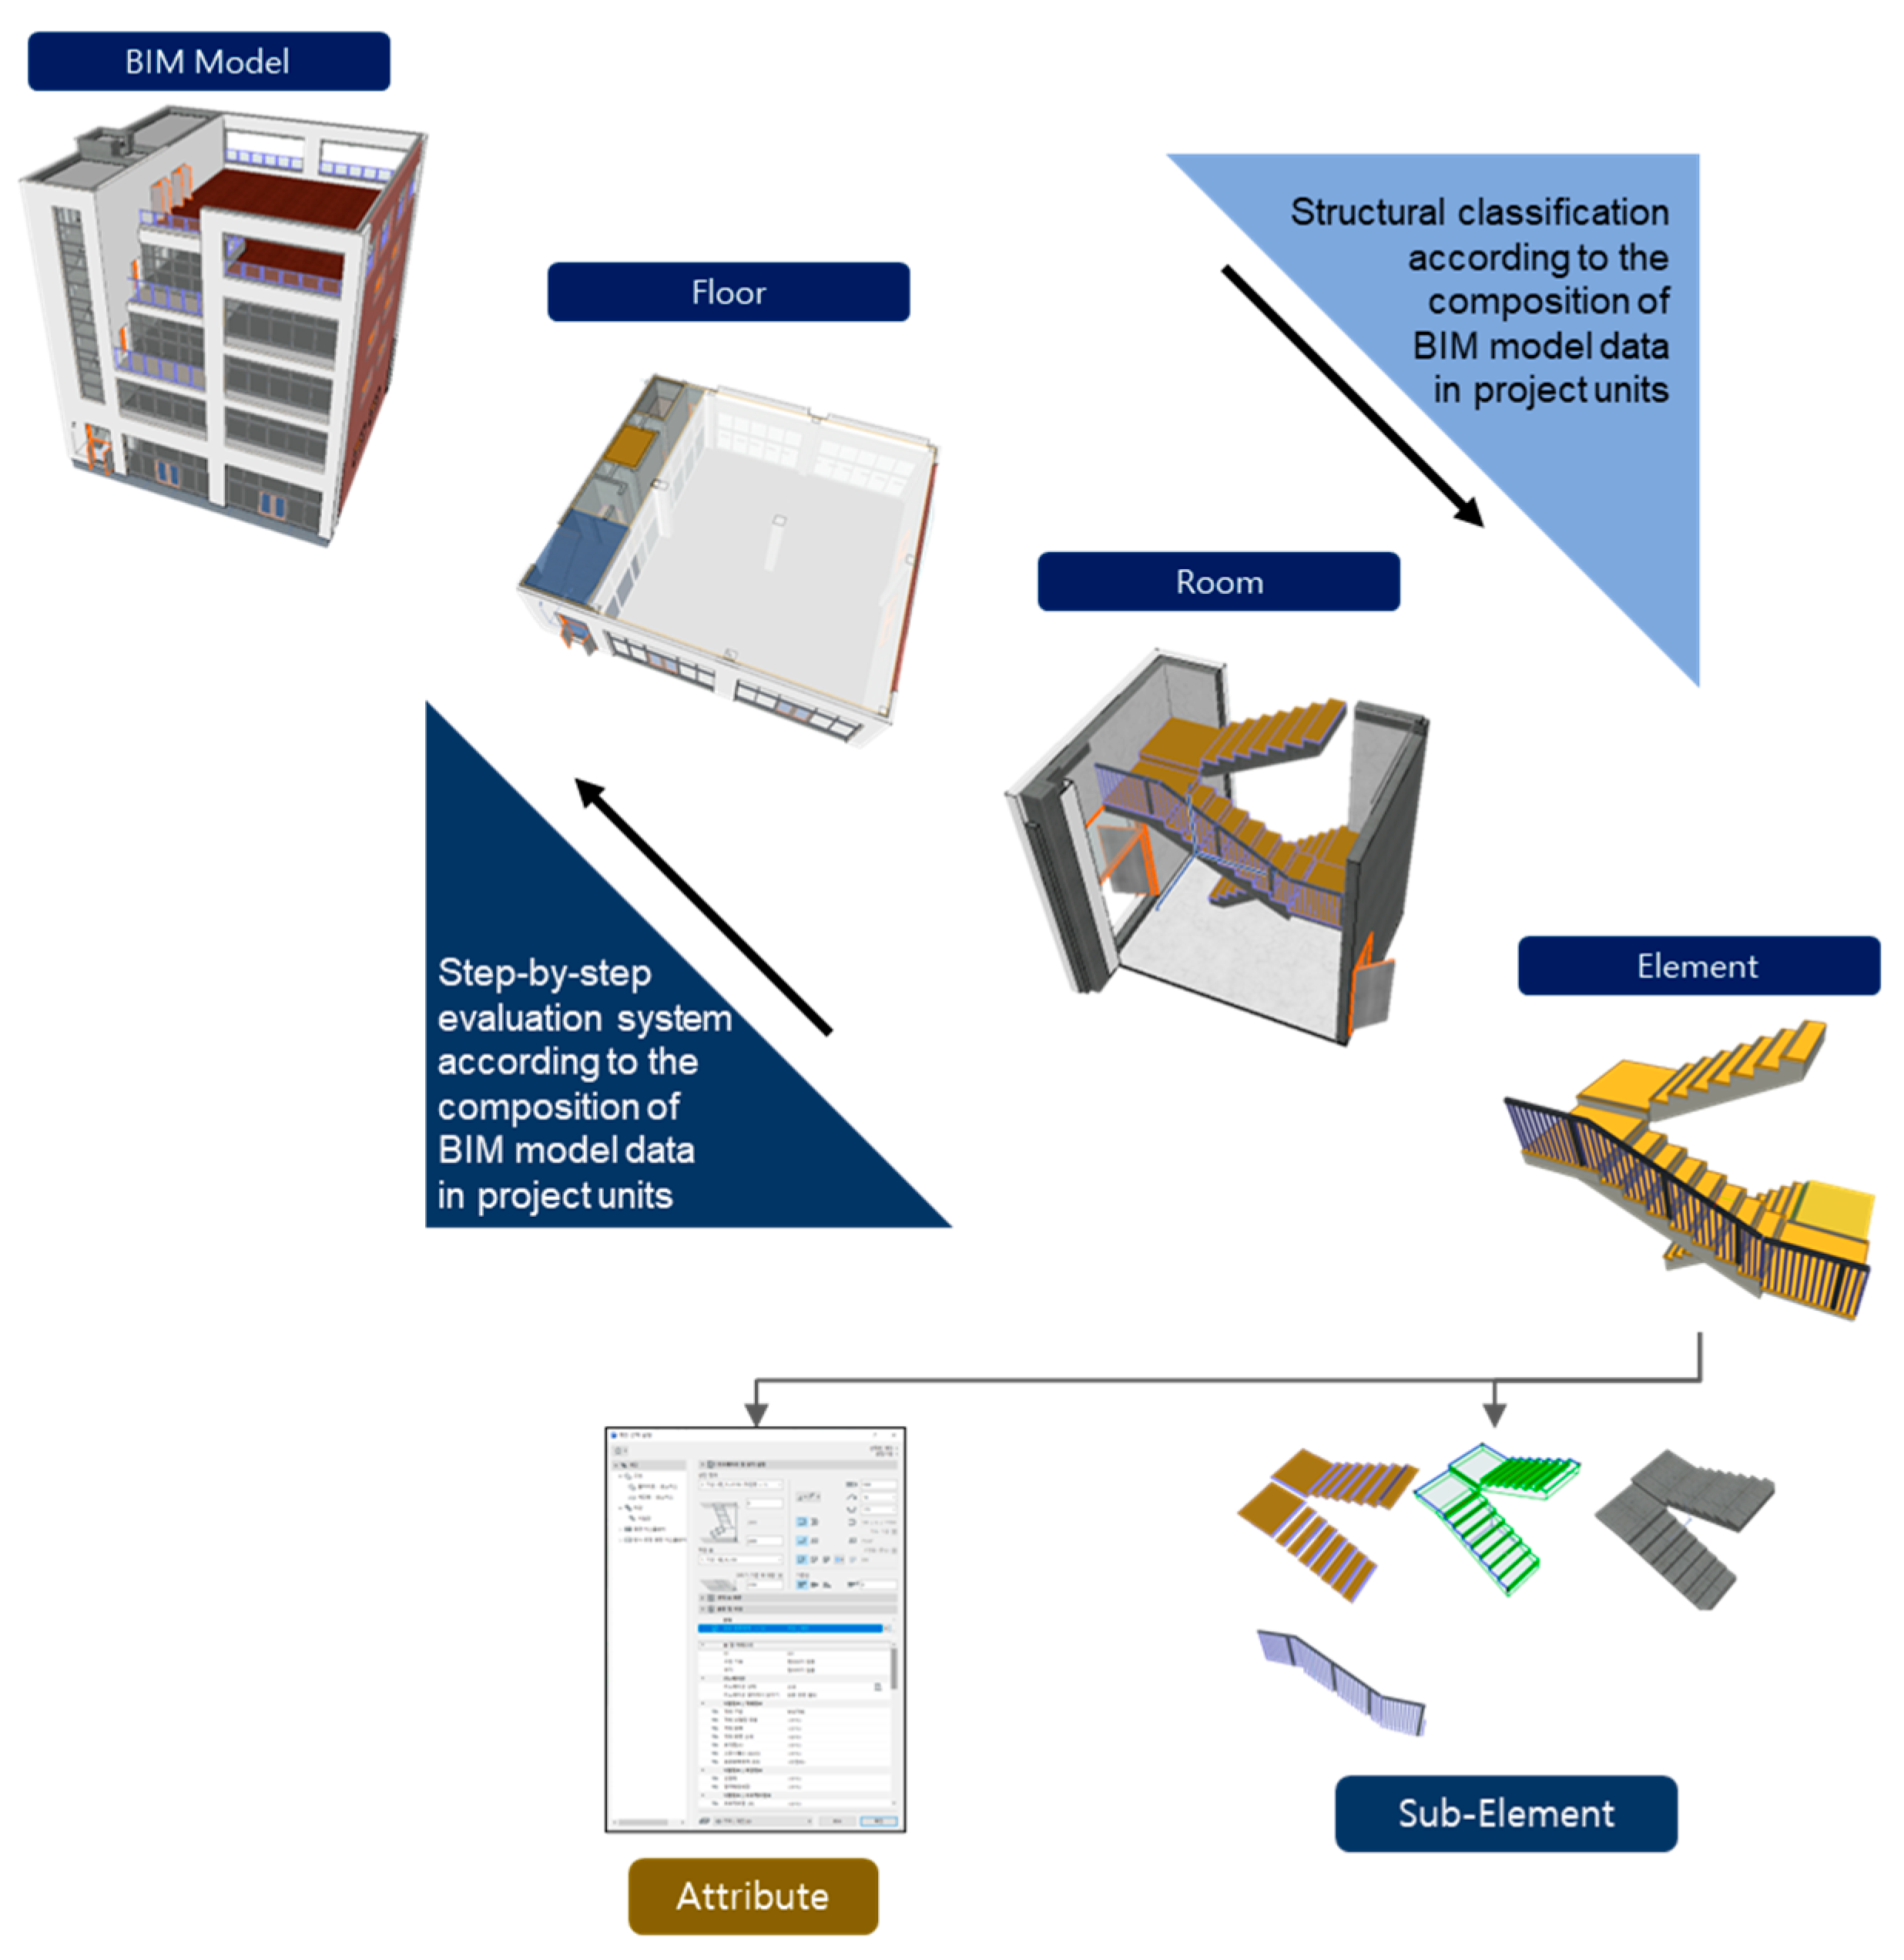
3.2. Analysis of BIM Drawing Data

The components of the BIM drawing data generated according to the process of creating BIM-based 2D deliverables can be categorized into three characteristics (Figure 3). Firstly, certain elements are predicated on the geometry of BIM model data. Secondly, some elements rely on parameters that communicate the attribute information of the BIM model data. Finally, additional work elements emerge that are not directly inherent within the BIM model data.
  • Components derived from the geometry of BIM model data:
These elements are shaped by the geometric data associated with objects comprising the BIM model data. They serve as drawing components that mirror the shape information of building or spatial objects within the designated view. These elements, created by users for drawing purposes, maintain geometric data generated during the modeling phase and are represented within the view data, interconnected with the drawings. Thus, when objects that need to be represented in the drawing already exist within the BIM model data, the drawing data maintain consistency without necessitating additional user work.
2.
Components based on the parameter information of BIM model data:
This category includes elements defined by the attributes of objects in the BIM model data. These elements encapsulate the parametric or property information attributed to building or spatial objects. The representation of these components aligns with the nature of the drawing and with the type of information they intend to convey. By aggregating the parametric information from the BIM data for building or spatial objects, users create these elements within the views generated for drawing purposes. They are typically expressed through auxiliary objects like dimensions and labels. As a result, the attributes of the building and spatial objects to be represented in the drawing form the parametric information for the creation of these auxiliary objects. Therefore, should the pertinent attribute information already exist in the BIM model data, it ensures the alignment of auxiliary objects with the information conveyed in the drawing.
3.
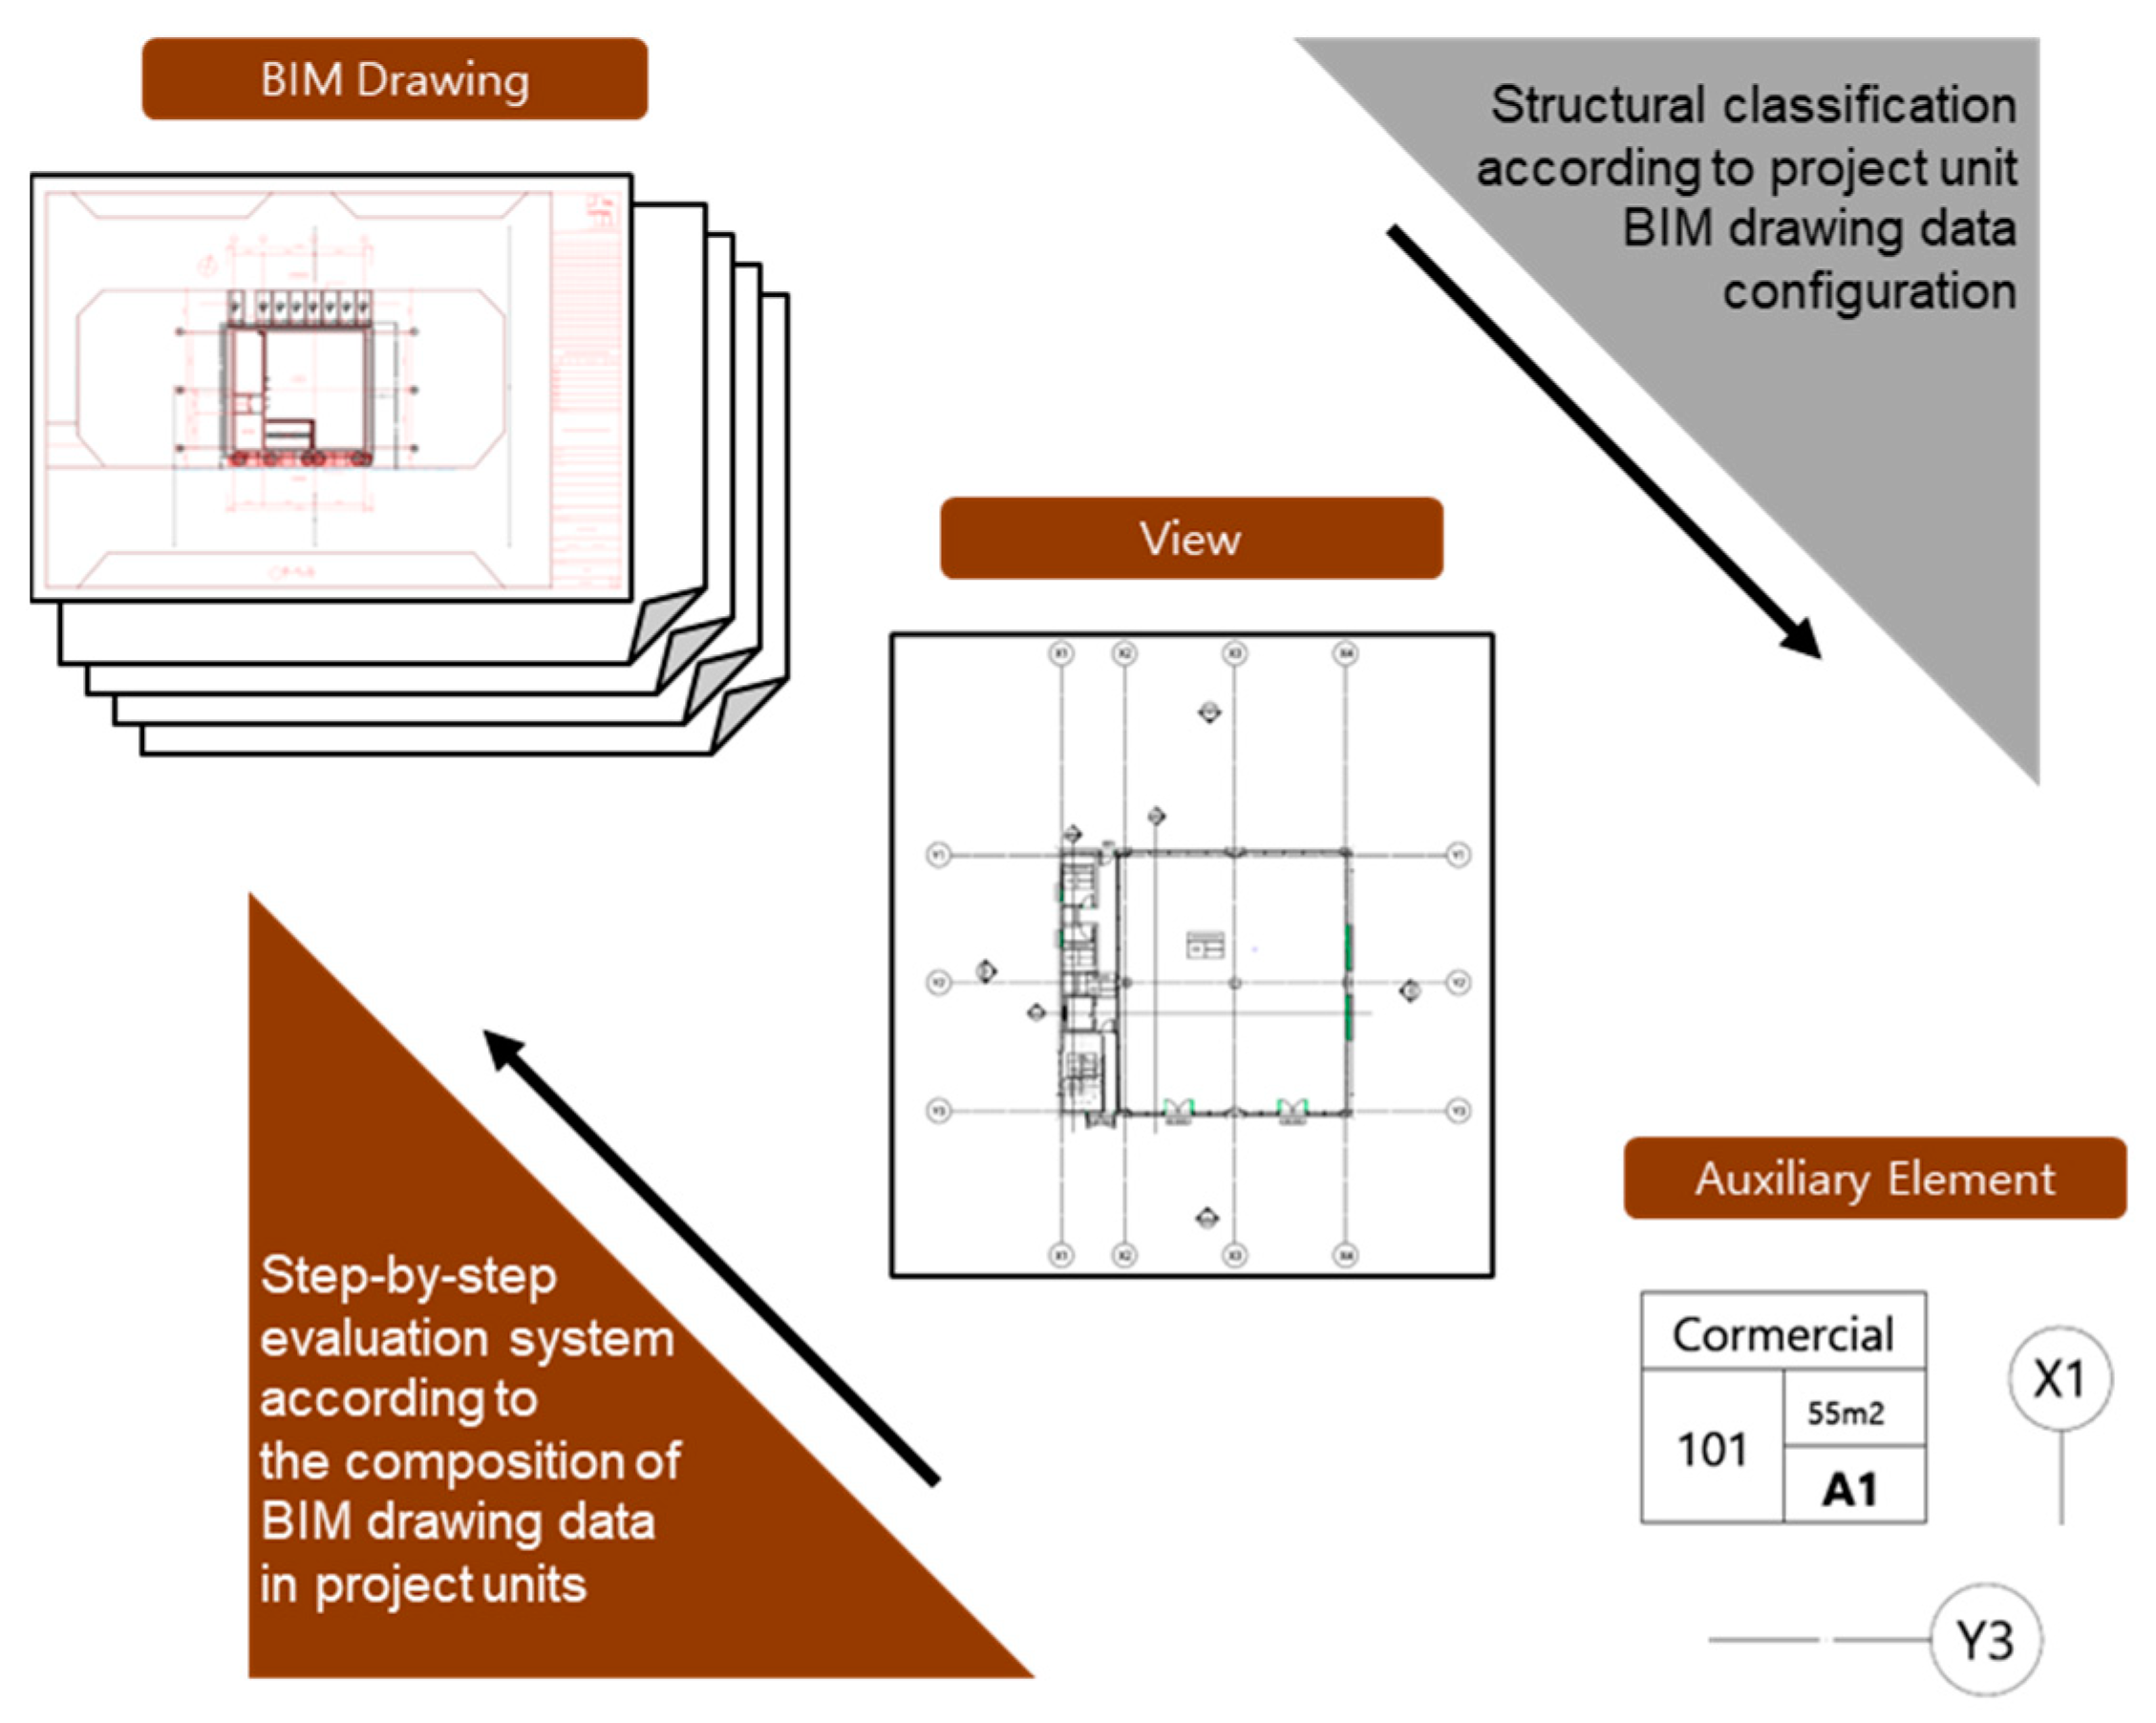
Additional components not inherent in BIM model data:
These drawing elements do not originate from the data of objects within the BIM model. Instead, they represent elements that must be manually introduced by the user, catering to the nature and type of information intended for the drawing. These elements come into play when the objects intended for representation in the drawing are absent within the BIM model data, or when the attributes needed for drawing representation are not present. Furthermore, they encompass elements created by users as separate auxiliary objects, even when the object’s attribute information exists within the BIM data. Since these elements lack direct links to BIM data, they pose a challenge to the consistency between the drawing and model, necessitating additional input from the user.
The analysis of BIM-based 2D deliverables revealed that the composition of drawing data is contingent on several factors, including the construction approach applied to the BIM model data, the presence of required data for drawing creation, and the method employed for constructing 2D deliverables. In cases where the BIM model data incorporate both geometric and attribute information about objects, the resultant drawing data can be updated automatically should any changes occur in the model data, thereby preserving consistency between the drawing and the model. Consequently, the presence of geometric and attribute information for objects within the BIM model data, coupled with the methodology employed for representing them as drawing elements (data interoperability), plays a pivotal role in determining the user’s workload and the alignment of the BIM model with drawing data throughout the process of generating 2D deliverables.

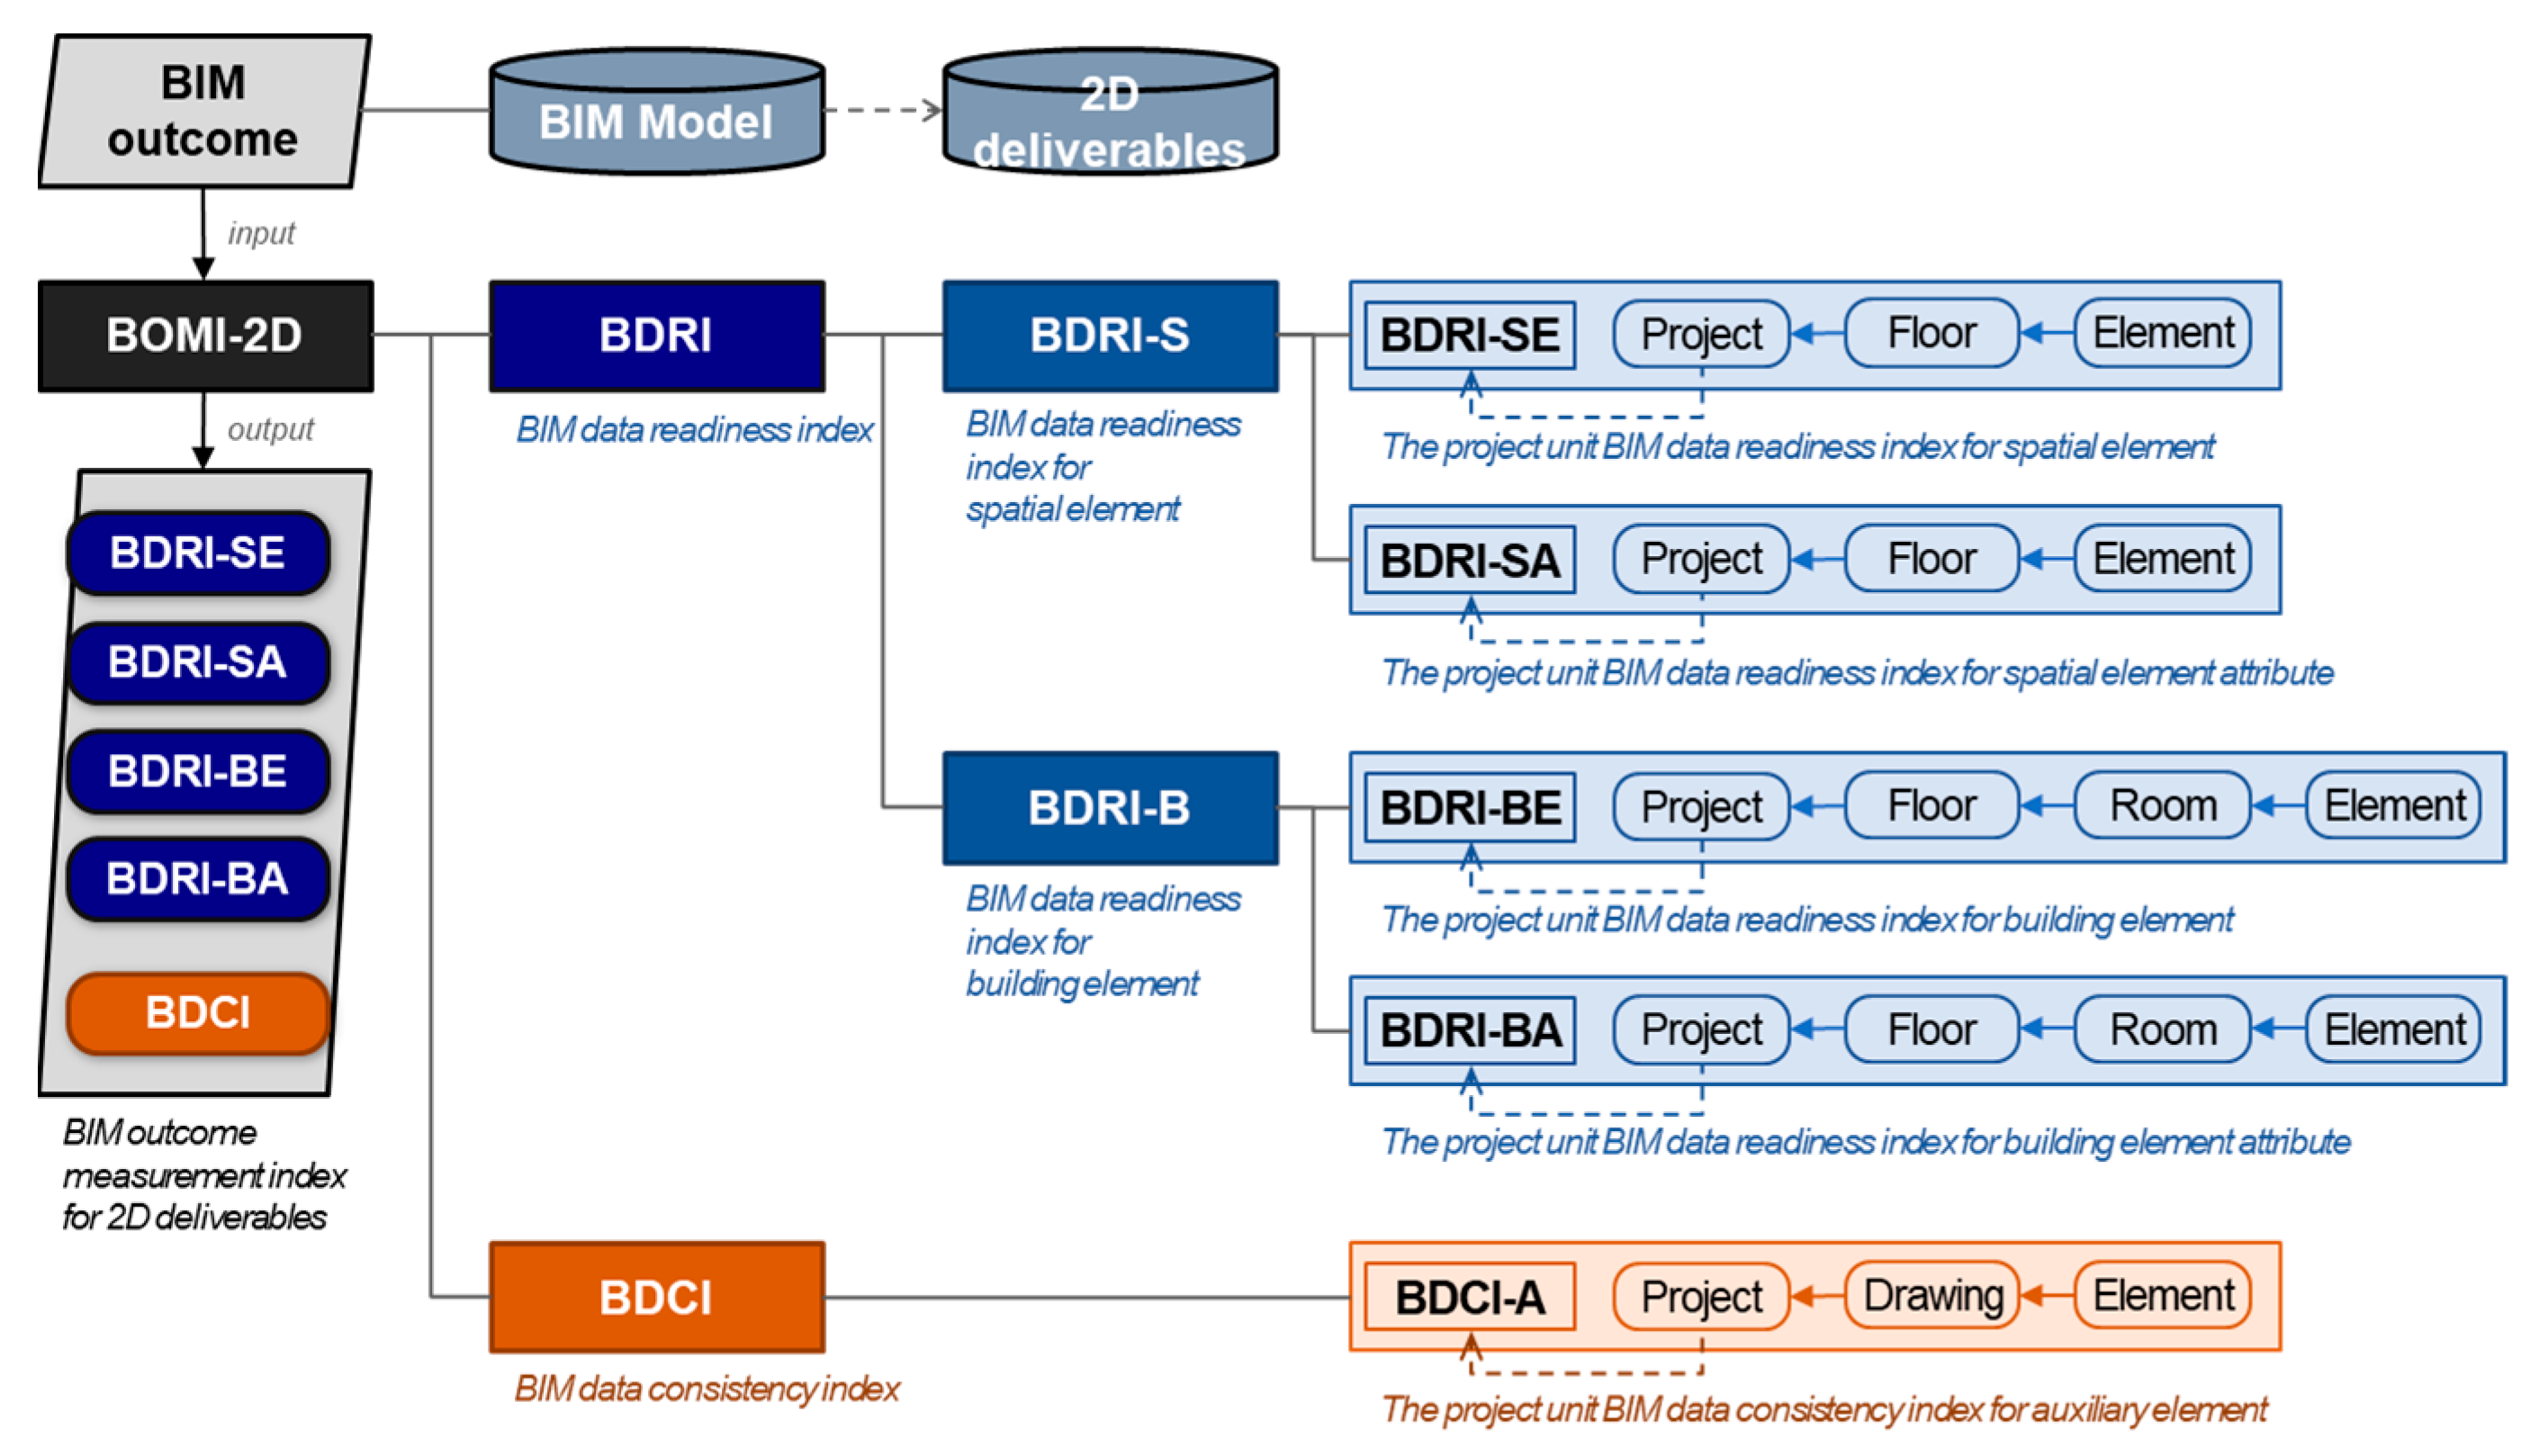
3.3. Derivation of Evaluation Indexes

In this section, building upon the process of generating BIM-based 2D deliverables (Section 3.1) and the examination of BIM drawing data (Section 3.2), the BOMI-2D is formulated. The BOMI-2D aims to enhance the utilization of BIM data and guarantee productivity throughout the 2D deliverable generation process (Figure 4).
This index is designed to assess the readiness of the data elements required for generating 2D deliverables based on BIM and to evaluate the consistency between BIM and 2D deliverables. It is not geared toward evaluating data values derived from design information but rather focuses on gauging the fidelity and readiness of data essential for the creation of 2D deliverables. Each index within BOMI-2D can be applied based on the purpose of BIM implementation. In this study, its definition aligns with the objective of ensuring efficient BIM work in the context of 2D deliverable creation. Ultimately, the goal is to propose a paradigm for the BIM design process by proposing a new way to manage outcomes from BIM models.

3.3.1. BIM Data Readiness Index

The BDRI evaluates the level of data preparation for objects and the attribute information required to generate drawings from BIM data. Its focus centers on assessing the fidelity and readiness of data, influenced by the purpose of BIM implementation. BDRI examines building and spatial objects within the BIM data and distinguishes between the element BDRI (BDRI-E) for assessing object creation and the attribute BDRI (BDRI-A) for appraising the input status of object-specific attributes. Additionally, BDRI-BE and BDRI-BA are established for building objects, while BDRI-SE and BDRI-SA serve spatial objects. BDRI-E evaluates drawing elements based on the geometry derived from BIM data, whereas BDRI-A assesses drawing elements based on parametric and property information derived from BIM data. These indexes allow evaluation at the individual element, space, floor, and building levels, enabling a comprehensive assessment of whether the necessary object information for drawing representation has been appropriately incorporated into the BIM data.

3.3.2. BIM Data Consistency Index

The BDCI measures the degree to which the drawing elements represented in BIM drawing data are interconnected and synchronized with the data retrieved from BIM. Its primary aim is to evaluate the consistency of the BIM data. BDCI focuses on auxiliary objects corresponding to the specified drawing representation elements and assesses the presence of linked BIM data to gauge the alignment between BIM and drawing data at the project level. When the geometry of building and spatial objects forming the BIM data is mirrored in the drawings, the view data and geometric data of the objects harmonize, resulting in data consistency. For instance, when 3D objects exist in the model data, they are automatically portrayed in the BIM view. However, if the geometric or parametric data of objects necessary for drawing representation is manually entered into the view data using auxiliary objects like dimensions, tags, and labels, through distinct user settings and actions, the outcome may either be linked to the BIM data and mirrored or independently created through supplementary work, contingent on the user’s work methodology. Consequently, the usability and interoperability of BIM data are subject to variation depending on the user’s approach to representing objects, thereby forming the basis for assessing data consistency between BIM and 2D deliverables.

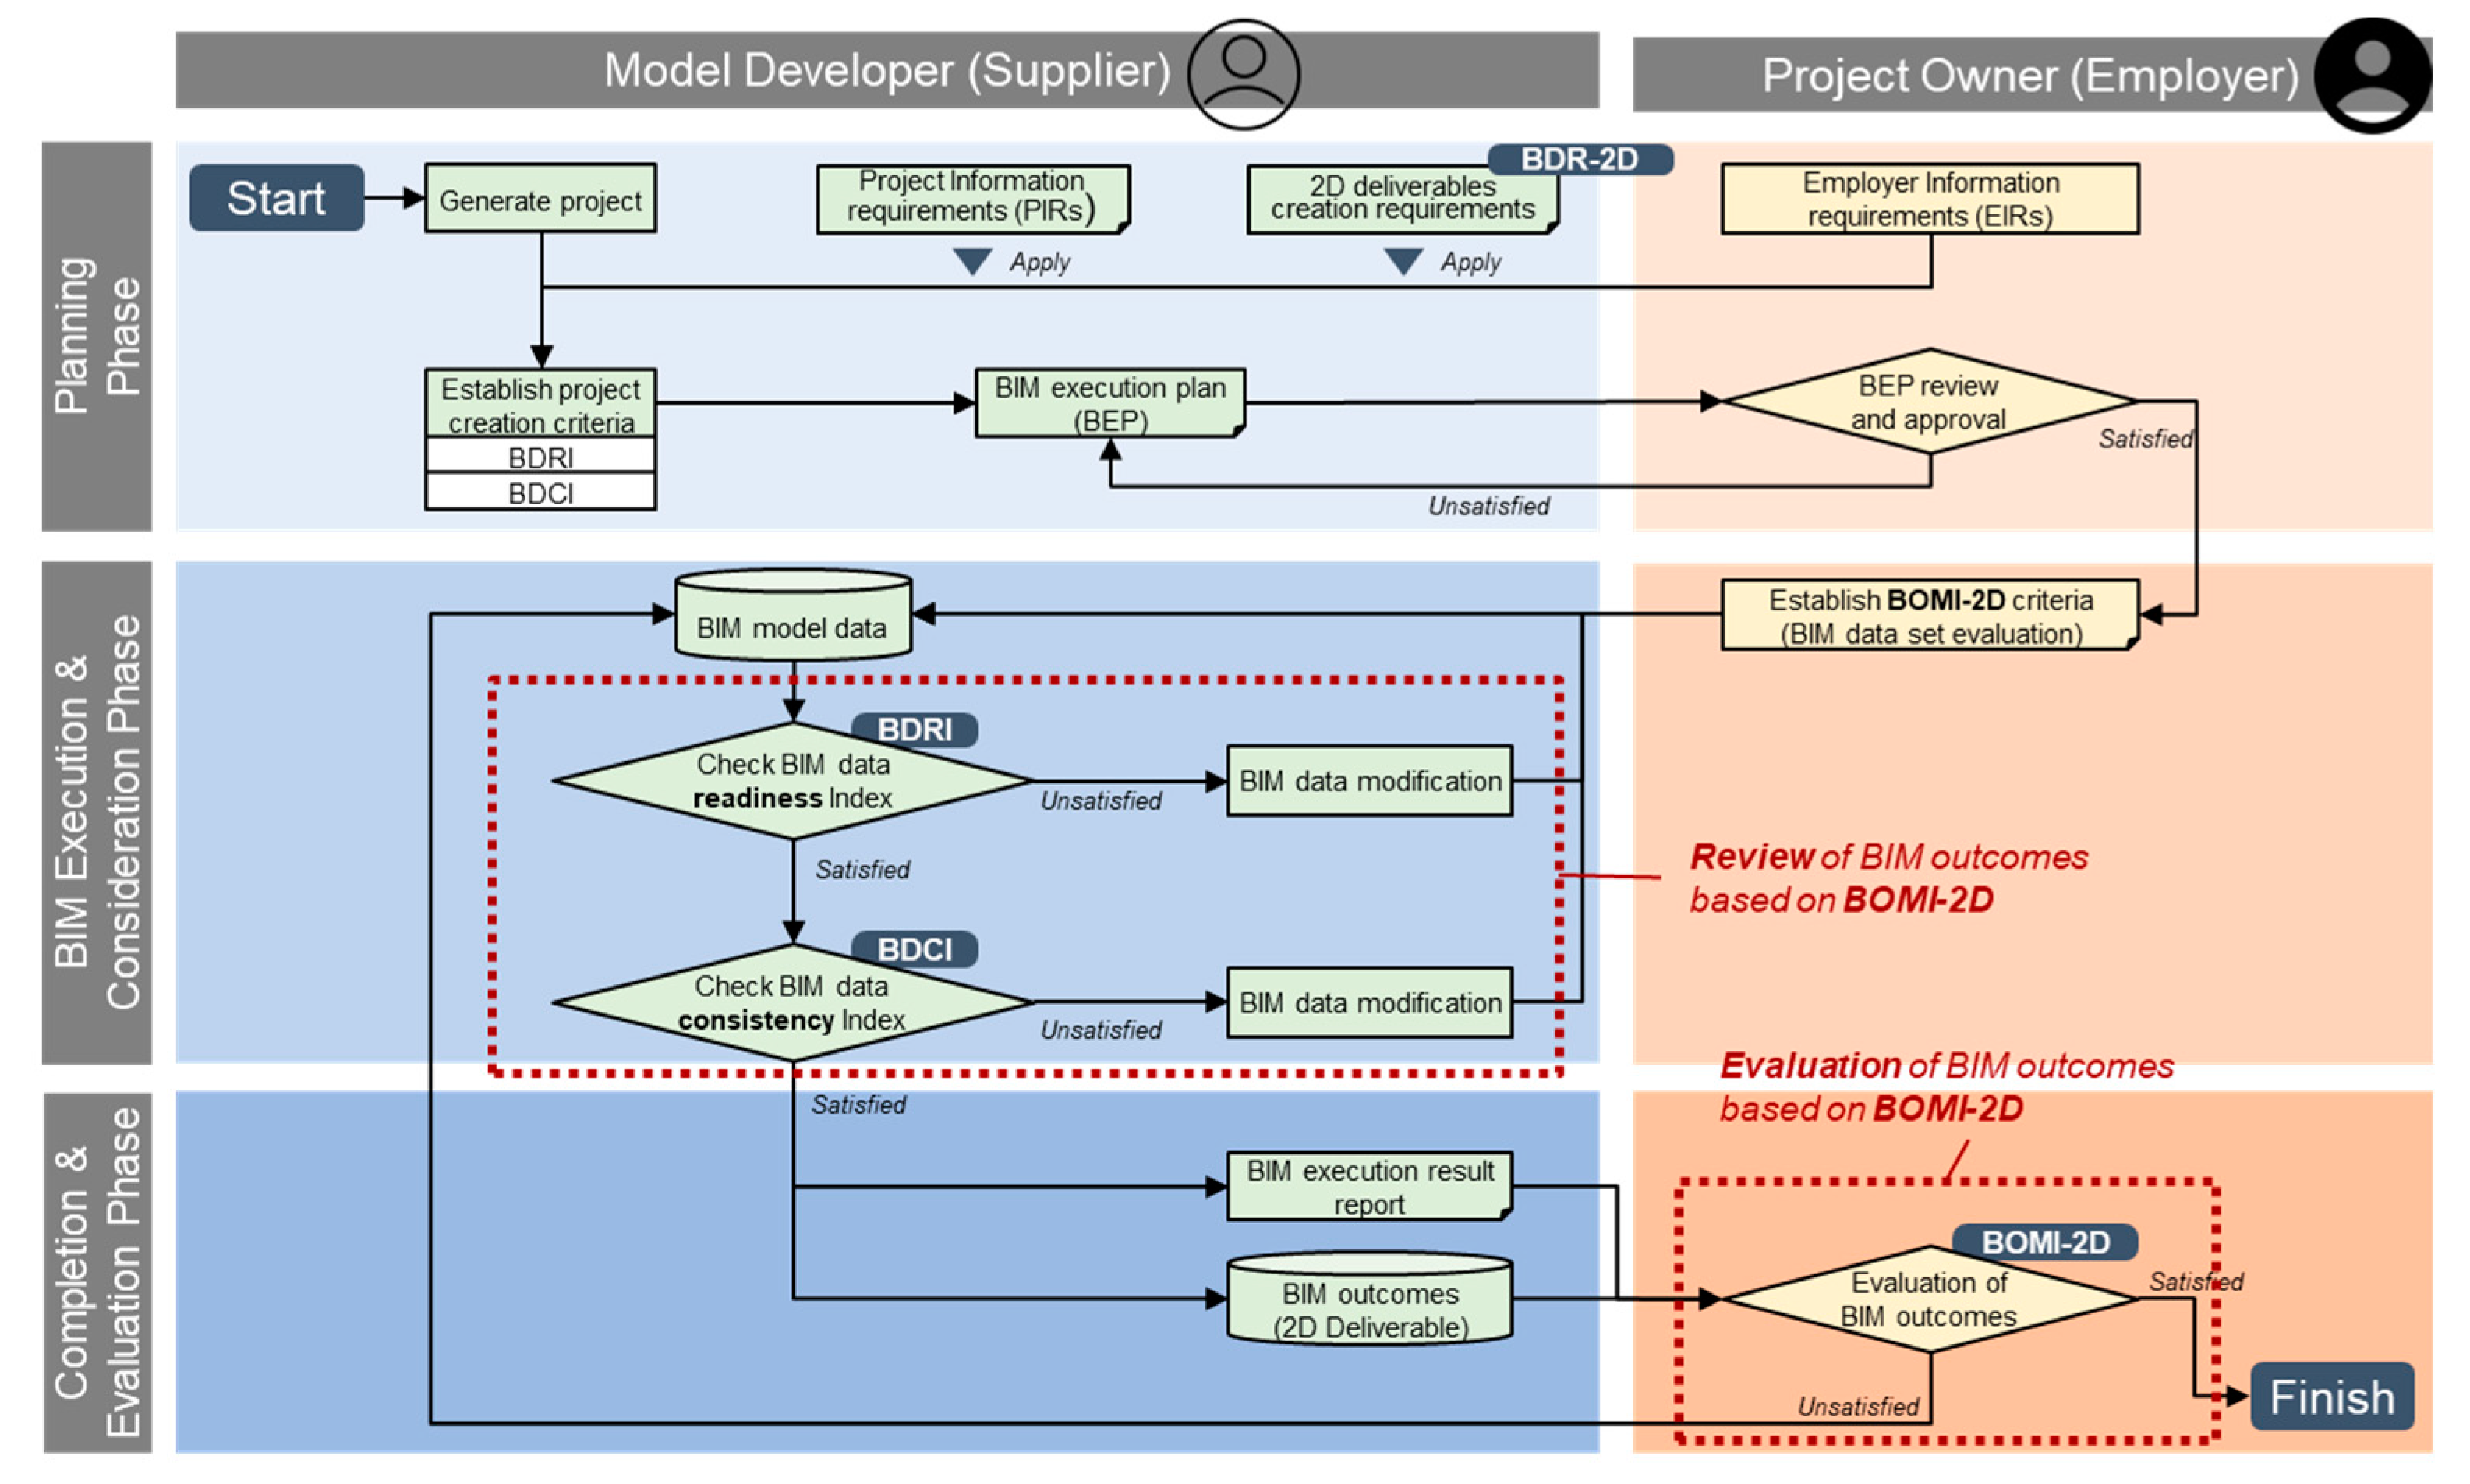
4. Quantitative Evaluation Method for BIM Data and 2D Deliverables

4.1. Establishment of BIM Data Evaluation Criteria

In a BIM project, the owner formulates EIRs based on the project’s unique characteristics and the objectives of BIM utilization. EIRs in BIM projects refer to a document outlining the client’s specific needs and expectations regarding information and deliverables when utilizing BIM. In response, the supplier creates a BEP tailored to these requirements. The approved EIRs and BEP serve as the basis for evaluating the quality of project-level BIM deliverables. Because the specifics of information requirements and data standards in BIM models vary based on their utilization objectives, the compliance of the project-level BEP must undergo quality assurance according to the intended purpose of BIM utilization [3]. As such, it is crucial to establish evaluation criteria for quantitatively assessing two key indexes: BDRI and BDCI, which were derived in Section 3. These criteria are developed during the project planning phase, aligning with the specific BIM data requirements for 2D deliverable generation, EIRs, and the owner’s defined mandatory object list. Furthermore, they are closely linked to BIM implementation criteria and data levels as the BEP is established. At this time, the essential objects specified in the BEP for each project become the evaluation criteria of BOMI-2D. The evaluation criteria and processes, based on IFC for BDR-2D, are presented in this study, as illustrated in Figure 5.

4.1.1. Establishment Process of BDRI Evaluation Criteria

The BDRI serves as an index to evaluate the presence of objects and attributes necessary for producing drawings within the BIM data. To create evaluation criteria for this index, we target building and spatial objects, as depicted in Figure 6.
Initially, the evaluation focuses on the composition of evaluation target model floors and the specification of the essential spaces within each floor. This establishes the evaluation criteria for BDRI-SE. During this process, the list of essential spaces identifies the spatial objects that are subject to evaluation on each floor, as shown in Table 1. The names of these spatial objects correspond to attributes mapped to IfcLongName, ensuring data compatibility and validating the existence of spatial elements.
Furthermore, the evaluation criteria for BDRI-BE, which targets the required building elements that form part of the evaluation targets on each floor, are defined. The evaluation of BDRI occurs on a room-by-room basis, which means the criteria for evaluating individual rooms may vary depending on space characteristics and project specifics. The spaces to be evaluated are determined based on the floor-level essential space list established following the BDRI-SE evaluation criteria. In Table 2, we can observe the compilation of a necessary list of building elements, specifying the spaces on each floor where each building element must be created, categorized by element class. Moreover, for building elements with sub-elements, such as stairs, curtain walls, and railings, the criteria for necessary elements are derived from the classifications of these sub-elements, as indicated in Table 3. The essential list for building elements is determined in conjunction with IfcType, facilitating the criteria for identifying objects based on the IFC format. This approach ensures precise identification and categorization of necessary building elements and their sub-elements according to IFC-based object-recognition criteria.
Third, BDRI-SA evaluation criteria are established for the essential spatial attributes that must be provided for each space within the evaluation target. As displayed in Table 4, the essential spatial attribute list defines the spatial attributes that should be input for each spatial element in every space. This study sets standards for fundamental properties and parameters, encompassing the identification, location, shape, and finishing information of spatial objects based on the BDR-2D.
Finally, BDRI-BA evaluation criteria are formulated for the necessary building attributes that need to be provided for each building object in the evaluation target. During this process, the essential building attribute list outlines the evaluation criteria by choosing the attributes of the building elements that must be entered as essential, considering the space to which the building element belongs, as demonstrated in Table 5. Building objects can be classified into identification, location, resource, and shape information in alignment with BDR-2D.

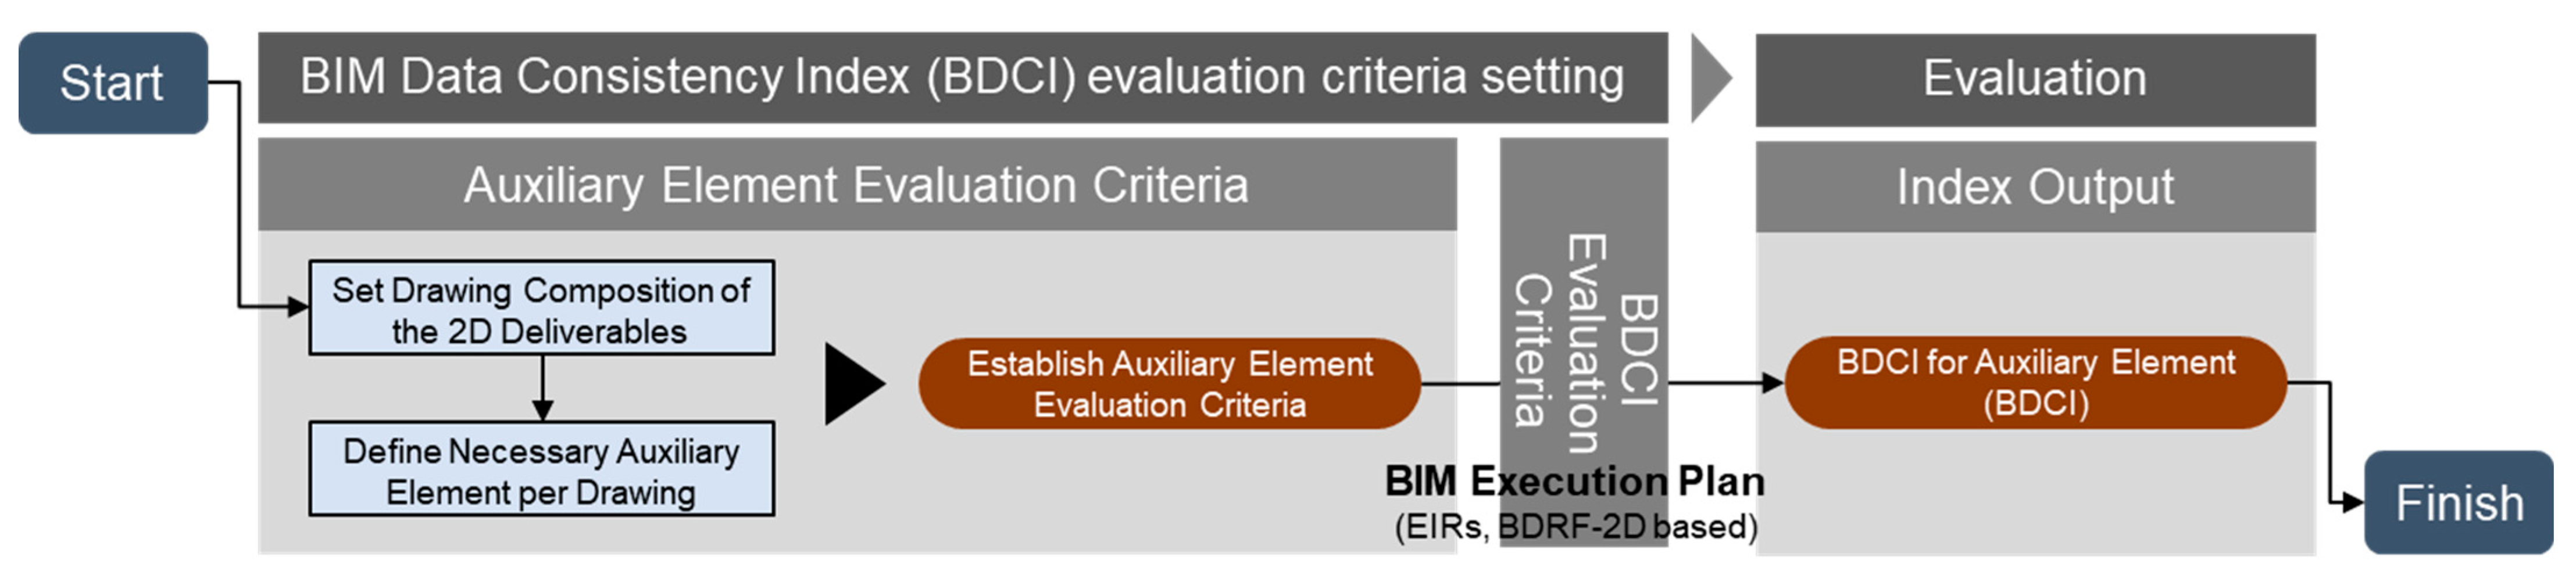
4.1.2. Establishment Process of BDCI Evaluation Criteria

The BDCI assesses the consistency of BIM data with the drawings, determining whether the elements needed for drawing creation are present in the BIM view data and interlinked with the model data. The evaluation criteria for this target are developed through the process outlined in Figure 7.
These BDCI evaluation criteria guide the creation of drawings that are subject to 2D deliverable evaluation and define the auxiliary elements depicted in each drawing. An essential auxiliary element, subject to BDCI evaluation, must be established based on the specific project and EIR characteristics. The necessary auxiliary element list, as presented in this study, addresses reference, dimension, and notation elements based on BDR-2D derived from prior research, and categorizes the required objects for each drawing. Furthermore, the auxiliary element, which acts as the BDCI evaluation criterion, is defined based on IfcObjectType and IfcPreDefinedType, enabling the establishment of recognition criteria for the evaluation target, as demonstrated in Table 6.

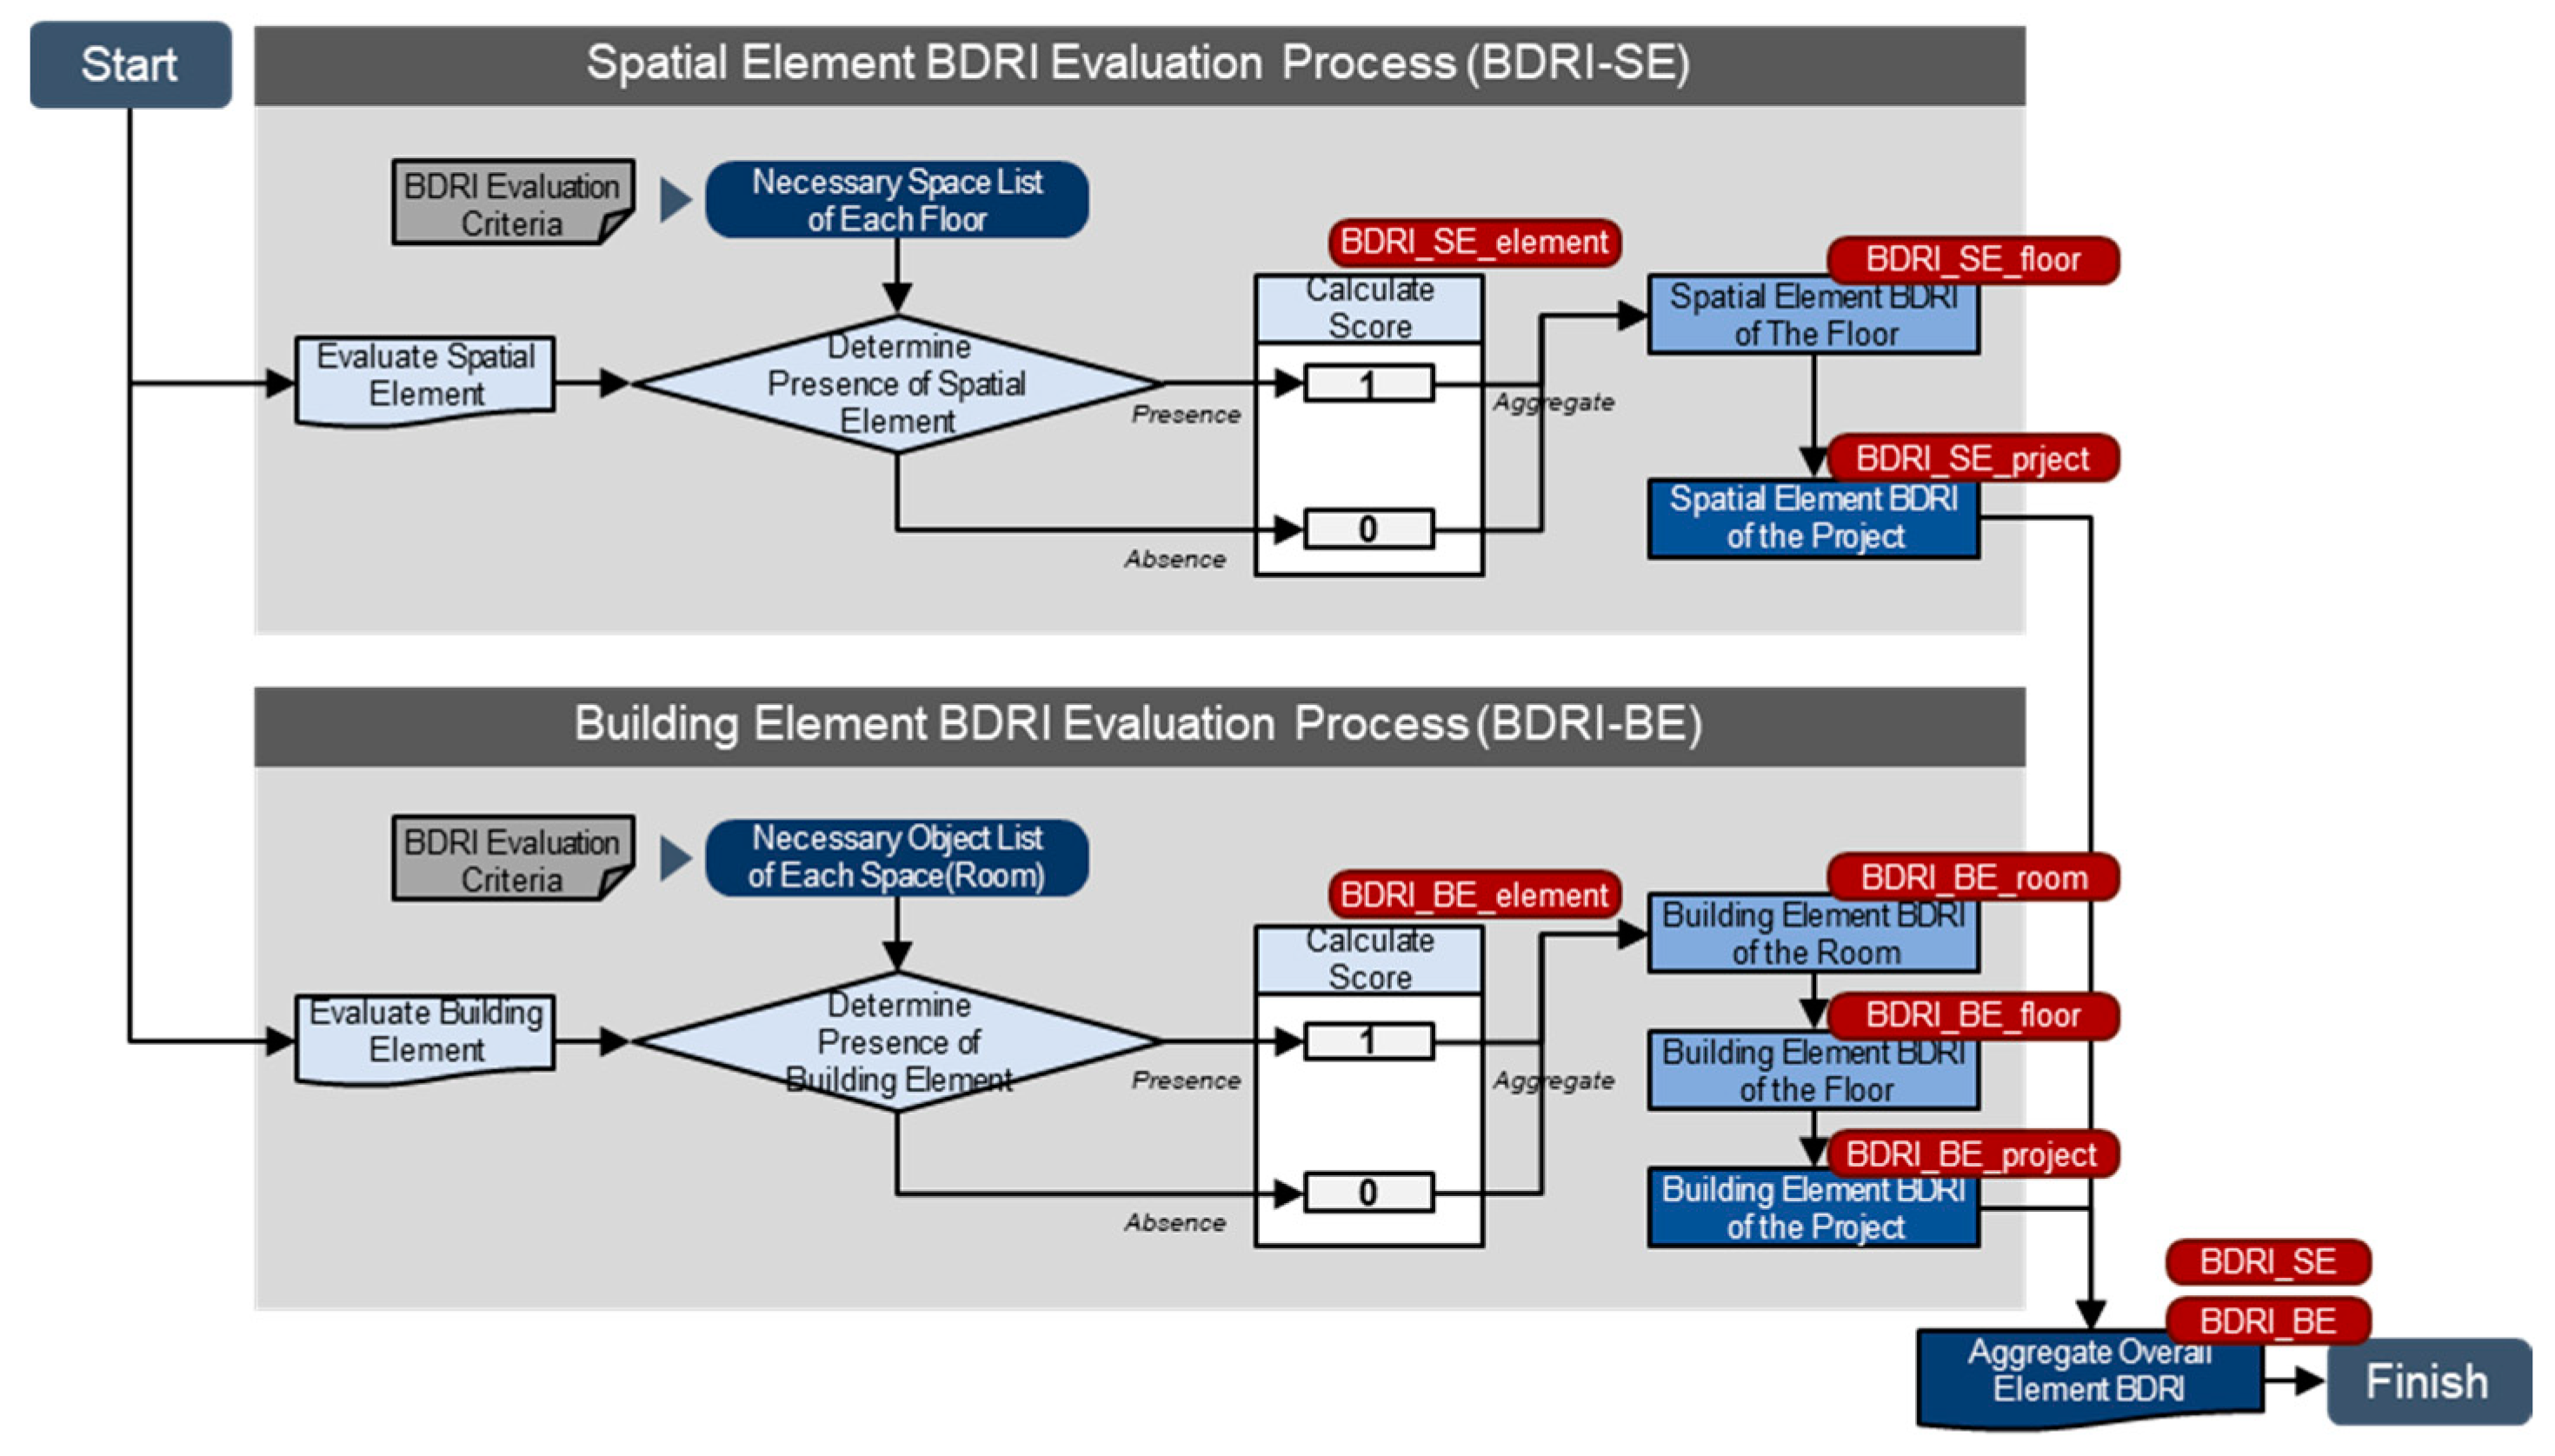
4.2. BDRI Composition and Evaluation Process

The BDRI consists of evaluation indexes for elements and attributes, focusing on building and spatial elements. These evaluation criteria are defined based on the BIM data requirements and EIR specific to each project for 2D deliverable generation, as outlined in Section 4.1.1.
The BDRI is evaluated based on the presence or absence of necessary elements and attributes. As depicted in Figure 8, the BDRI evaluation process adheres to the hierarchy of BIM data, encompassing elements that constitute spaces, floors, and the entire model. The index value calculated in the lower hierarchy is then applied to the higher hierarchy scores. Therefore, the evaluation and scoring consider the relationship and interdependency between the different levels of BIM data, ensuring a comprehensive assessment of the consistency and completeness of the model.
In this study, the criteria for recognizing the elements and attributes to be evaluated were defined according to the IFC data schema. By utilizing the IFC data schema, the evaluation criteria were consistently standardized, thereby allowing for flexible applications based on specific project requirements and data-creation methods. This approach ensured that the evaluation method can be adapted to various projects while maintaining a consistent and interoperable framework for assessing the elements and attributes of BIM.

4.2.1. Element BDRI Evaluation Method

The BDRI-E was used to assess whether a building or spatial object represented in a drawing existed as a corresponding BIM model. As shown in Figure 9, the evaluation is based on determining the presence of essential objects that were established according to Section 4.1.1 and assigning points accordingly. In this context, the term “essential object” refers to a building element that must be created for each space being assessed and a spatial element that must be created for each floor being assessed, as classified within the necessary object list based on IfcObjectType. The BDRI-E score is calculated based on the identification and presence of these necessary objects.
The BDRI-SE is evaluated by calculating the ratio of modeled spatial objects to the essential spatial objects that constitute a floor. Each essential spatial element on the floor is assessed, and one point is awarded for its presence and zero points if it is absent (Equation (1)). The BDRI-SE score for each floor unit is calculated by dividing the total BDRI-SE scores of essential spatial objects on that floor by the number of essential spatial objects present on the floor (Equation (2)). Finally, the overall BDRI-SE score for the project, representing the building unit, is calculated by dividing the sum of the BDRI-SE scores for all floor units in the building by the total number of floors (Equation (3)).
B D R I _ S E e l e m e n t = { 1 , i f   r e q u i r e d   s p a t i a l   e l e m e n t s   e x i s t s ; 0 , o t h e r w i s e }
B D R I _ S E f l o o r = 1 N R i = 1 N R B D R I _ S E e l e m e n t i ,
B D R I _ S E p r o j e c t = 1 N F i = 1 N F B D R I _ S E f l o o r i ,
where NR is the number of rooms on the floor to be evaluated and NF is the number of floors of the building to be evaluated.
The BDRI-BE is assessed by calculating the ratio of actual modeled building objects to essential building objects in a real unit. If the building object being evaluated lacks sub-objects or a hierarchical relationship, it receives one point if the required building element in the space is present and zero points if it is not (Equation (4a)). However, if the object under evaluation is a parent object with sub-elements, scores are assigned based on the proportion of modeled sub-elements to the essential sub-elements that make up the parent object (Equation (4b)). Determining whether an object has a hierarchy relies on the composition relationship defined in Ifc, which entails a parent object with a hierarchy including “IsDecomposedBy” among IfcElement instances and being connected to lower objects in accordance with IfcRelAggregation rules.
Furthermore, within the evaluation process of the object units comprising a room, objects such as walls, doors, or columns that come into contact with multiple rooms are assessed individually within each room. This approach ensures the accurate calculation of the room-unit BDRI-BE, comprising objects that undergo mandatory evaluation.
The BDRI-BE per room unit is computed by dividing the sum of the BDRI-BE values for each room-by-object unit by the number of necessary element types required for the room (Equation (5)). Subsequently, the BDRI-BE per floor unit is calculated by dividing the sum of the BDRI-BEs per room on a specific floor by the number of rooms that constitute that floor (Equation (6)). Finally, the overall BDRI-BE score for the project, representing the building unit, is determined by dividing the sum of the BDRI-BE scores for all floor units within the building by the total number of floors (Equation (7)).
B D R I _ B E e l e m e n t = { 1 ,   i f   r e q u i r e d   b u i l d i n g   e l e m e n t s   e x i s t s ;   0 ,   o t h e r w i s e }  
B D R I _ B E e l e m e n t =   1 N S E i = 1 N S E B D R I _ B E s u b e l e m e n t i
where NSE is the number of sub-elements constituting the object to be evaluated.
B D R I _ B E r o o m = 1 N E i = 1 N E B D R I _ B E e l e m e n t i  
where NE is the number of building elements constituting the room to be evaluated.
B D R I _ B E f l o o r = 1 N R i = 1 N R B D R I _ B E r o o m i  
where NR is the number of rooms on the floor to be evaluated.
B D R I _ B E p r o j e c = 1 N F i = 1 N F B D R I _ B E f l o o r i  
where NF is the number of floors of the building to be evaluated.

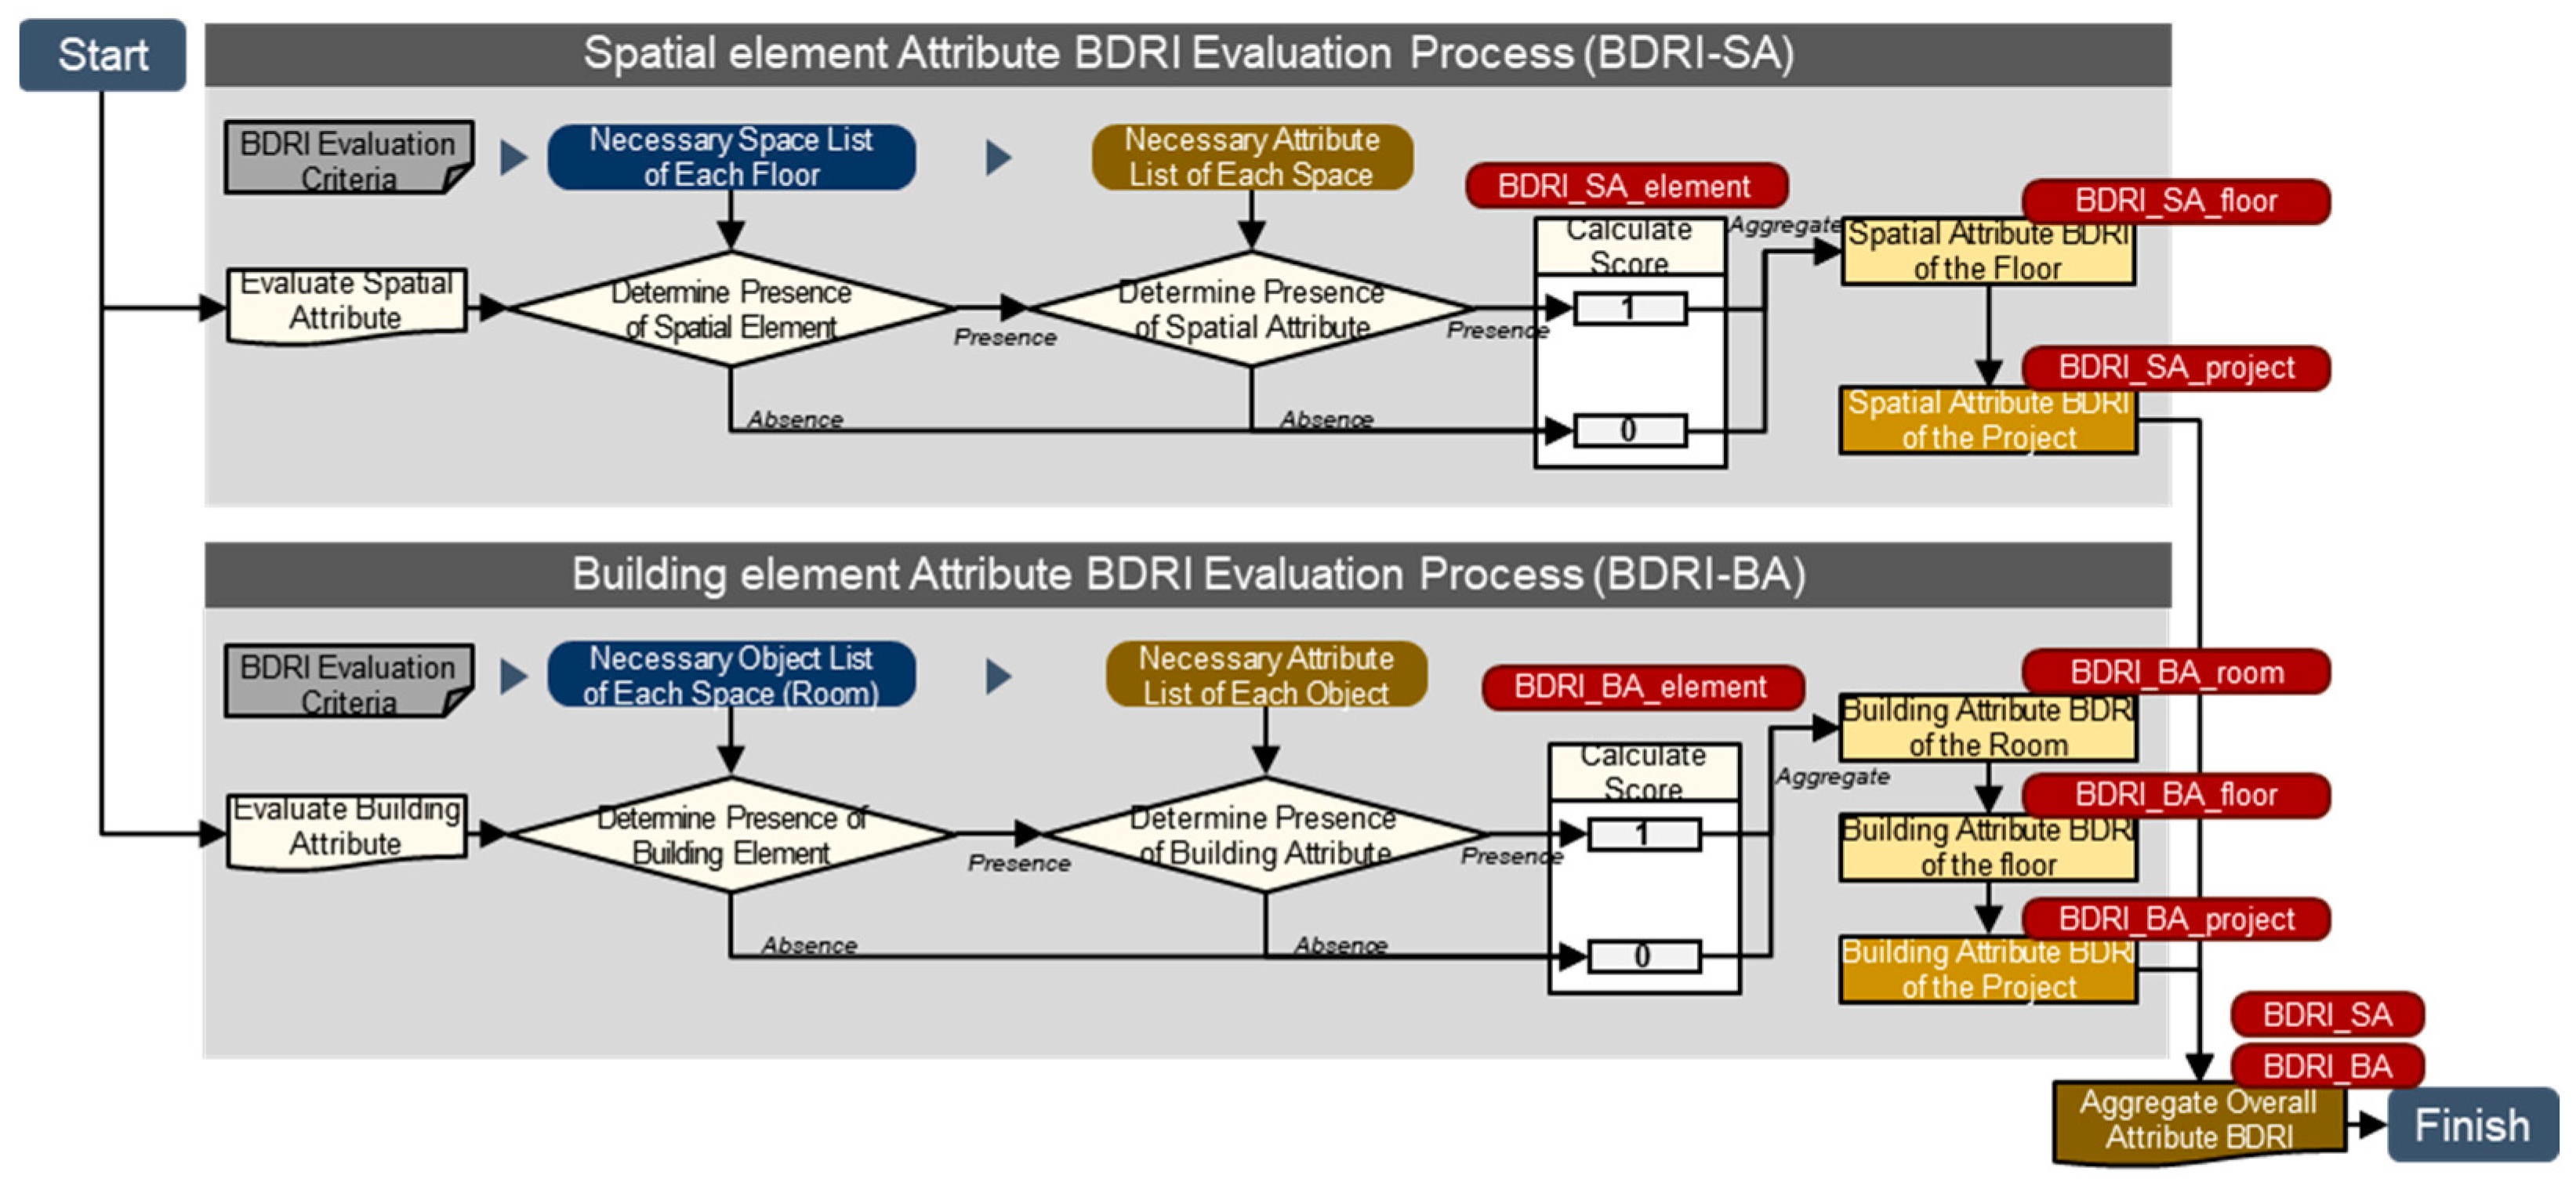
4.2.2. Attribute BDRI Evaluation Method

The BDRI-A serves as an index to evaluate whether the information of a building or spatial object represented in a drawing corresponds to an attribute of a BIM object. The relevant attribute can be object-attribute information or parameter information, and it pertains to the information necessary to meet the requirements for drawing creation. As depicted in Figure 10, BDRI-A’s evaluation involves determining the existence of essential attributes for the evaluation target, established in accordance with Section 4.1.1, and assigning scores accordingly. Essential attributes (necessary attributes) refer to attribute information required as input for each space being evaluated, based on the attribute list for each object created using IfcPropertySet or IfcPredefinedPropertySet.
The BDRI-SA evaluates essential spatial objects on each floor by calculating values according to the creation ratio of essential attributes that exist to the essential attributes subject to evaluation for each spatial object. One point is given if a specific value is entered for the essential attribute required by the spatial object being evaluated, and zero if no value is entered. The sum of the acquired points is divided by the number of necessary attributes required for the spatial element to calculate the BDRI-SA per object (Equation (8)). The BDRI-SA for each spatial object unit is calculated, and the BDRI-SA for each floor unit is calculated by dividing the sum of the BDRI-SA scores in each object unit for the essential spatial objects constituting the floor by the number of essential spatial objects on the corresponding floor (Equation (9)). The final BDRI-SA of the project, which is the building unit, is calculated by dividing the sum of the BDRI-SA scores of all floor units constituting the building by the total number of floors (Equation (10)).
B D R I _ S A e l e m e n t = 1 N A i = 1 N A S A i ,    
where NA is the number of attributes in the spatial object to be evaluated and SA = {1, if required spatial element attribute exists, otherwise 0}.
B D R I _ S A f l o o r = 1 N R i = 1 N R B D R I _ S A e l e m e n t i
where NR is the number of rooms on the floor to be evaluated.
B D R I _ S A p r o j e c t = 1 N F i = 1 N F B D R I _ S A f l o o r i ,  
where NF is the number of floors of the building to be evaluated.
The BDRI-BA is evaluated by calculating index values based on the ratio of attributes for which attribute values are entered to the essential attributes for each building object in the space being evaluated. One point is given if a value is entered for the essential attribute being evaluated, and zero if no value is entered (Equation (11)). During the object-unit evaluation process within a room, objects (walls, doors, columns, etc.) in the areas where the rooms are in contact with each other are evaluated individually, and a room-unit BDRI-BA is calculated for objects subject to mandatory evaluation. The room-unit BDRI-BA is calculated by dividing the sum of the calculated BDRI-BA values for each object unit within the room by the number of necessary attributes required for the room (Equation (12)). Subsequently, the BDRI-BA score for each floor is calculated by dividing the sum of the BDRI-BA scores for the room units belonging to a specific floor by the number of rooms on the floor (Equation (13)). Finally, the overall BDRI-BA score for the project, representing the building unit, is calculated by dividing the sum of the BDRI-BA scores for all floor units within the building by the total number of floors (Equation (14)).
                                B D R I _ B A e l e m e n t = 1 N A i = 1 N A B A i ,
where NA is the number of attributes in the building object to be evaluated and BA = {1, if required building element attribute exists, otherwise 0}.
              B D R I _ B A r o o m = 1 N E i = 1 N E B D R I _ B A e l e m e n t i ,  
where NE is the number of building elements constituting the room to be evaluated.
B D R I _ B A f l o o r = 1 N R i = 1 N R B D R I _ B A r o o m i  
where NR is the number of rooms on the floor to be evaluated.
B D R I _ B A p r o j e c t = 1 N F i = 1 N F B D R I _ B A f l o o r i ,
where NF is the number of floors of the building to be evaluated.

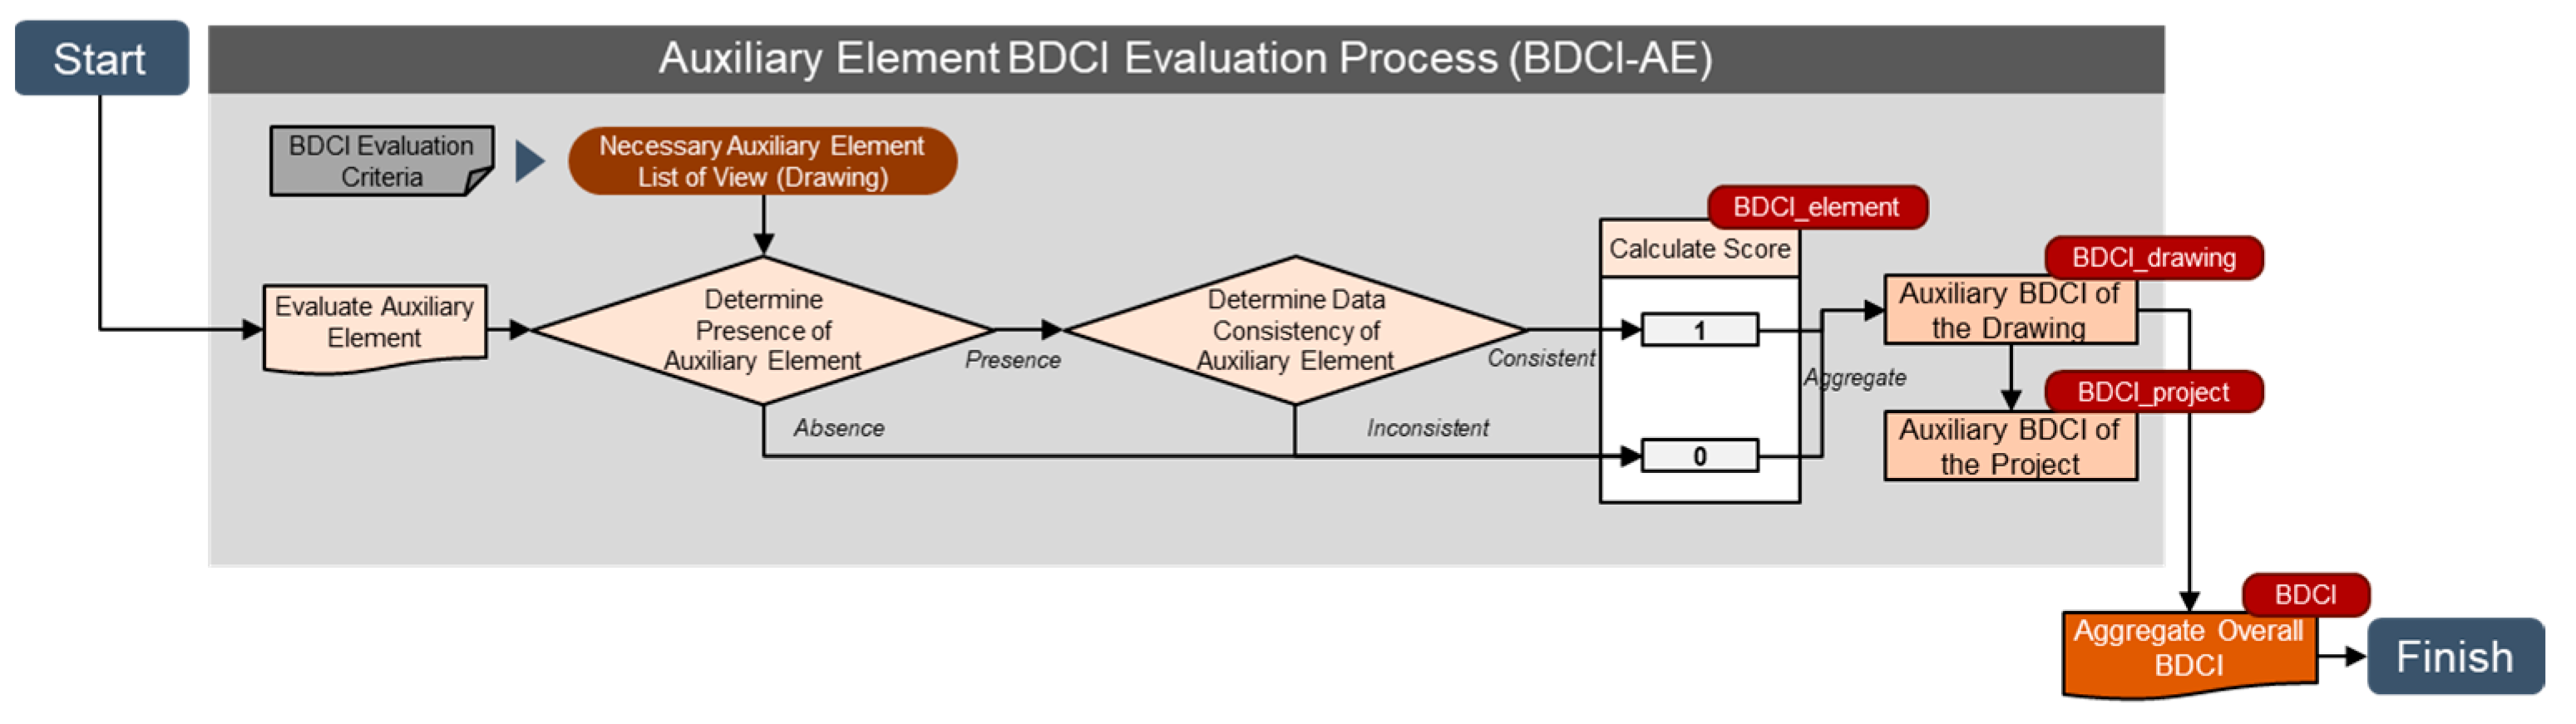
4.3. BDCI Composition and Evaluation Process

The BDCI is used to evaluate the consistency between the BIM drawings and model. It functions as a single evaluation index for elements represented in drawing-unit drawings, with a specific focus on the evaluation of auxiliary elements based on the BIM drawing data requirements for each project, as established in Section 4.1.2.
As illustrated in Figure 11, the BDCI evaluation process involves assessing the presence or absence of BIM data linkages for auxiliary objects associated with essential drawing representation elements within the BIM view data that make up the BIM drawing data. The BDCI for the drawing unit is then calculated based on this evaluation process, providing a method to calculate the BDCI for each project.

BDCI Evaluation Method

The BDCI evaluation method, depicted in Figure 12, aims to determine the consistency between drawings extracted from the BIM and BIM data. Among the essential auxiliary objects (necessary auxiliary elements) created within the view data of the drawing being evaluated, scores are calculated based on the proportion of auxiliary elements linked to the BIM data. BIM data refer to the attributes of objects within the model data, which are used as attributes, or the parameter information of objects represented in the drawing data. If an auxiliary element to be verified exists, and its information is linked to the BIM data, a score of one point is assigned. If either condition is not satisfied, a score of zero is assigned (Equation (15)).
When calculating the BDCI for auxiliary object units, the drawing unit BDCI is determined by dividing the sum of the BDCI scores for the essential auxiliary object units within the drawing by the number of essential auxiliary objects constituting the drawing (Equation (16)). Finally, the BDCI of each project unit is calculated by dividing the sum of the BDCI scores of all drawing units subjected to the 2D deliverable evaluation by the number of BIM drawings subjected to evaluation (Equation (17)).
B D C I e l e m e n t = { 1 ,   i f   a u x i l l a r y   e l e m e n t s   l i n k e d   t o   B I M   m o d e l   d a t a ;   0 ,   o t h e r w i s e }  
B D C I d r a w i n g = 1 N E i = 1 N E B D C I e l e m e n t i ,  
where NE is the number of auxiliary elements constituting the drawing to be evaluated.
B D C I p r o j e c t = 1 N D i = 1 N D B D C I d r a w i n g i
where ND is the number of BIM drawings to be evaluated.

5. Pilot Test and Verification

5.1. Overview of Pilot Test

This section applies the BOMI-2D evaluation method, as proposed in Section 4, to the pilot project and computes the BDRI and BDCI. The BIM model and BIM-based 2D deliverables used in the pilot project were obtained from a recent residential facility construction project in the Republic of Korea, focusing on architectural and structural aspects during the construction documentation (CD) stage, and created using ArchiCAD 23TM [15].
The key functions necessary for BOMI-2D evaluation were implemented using ArchiCAD’s API. The verification process of the BOMI-2D evaluation methodology involved applying it to the pilot test model, ensuring that it aligns with the defined requirements, criteria, and objectives.
An overview of the pilot project used for verification and the evaluated 2D deliverables is as follows:
Project name: A new neighborhood residential facility construction;
Land area: 928.00 m2;
Construction scale: Three stories below ground, nine stories above ground;
Building structure: Reinforced concrete structure;
Height: 39.3 m;
Building area: 731.32 m2;
Total floor area: 6653.12 m2;
2D deliverables: Fourteen floor plans, two elevations, two cross sections, one layout drawing, two core enlarged floor plans, two core enlarged cross sections, 14 structural plans, and two structural cross sections.

5.2. Analysis of Work Productivity Based on BOMI-2D

5.2.1. Overview of Productivity Analysis

In this section, the work productivity of users is compared and analyzed based on the BOMI-2D evaluation score using a pilot test model that was delivered up to the detailed design stage, as discussed in Section 5.1.
A pilot test BIM model and 2D deliverables, which were used to verify the BOMI-2D evaluation process, were employed in case A. In case B, the BIM data were created to meet the data creation requirements corresponding to the BOMI-2D evaluation criteria in the same project, and the 2D deliverables generated from this model were considered (Figure 13).
During the analysis, the additional workload required by the users to create drawings that adhered to the required level of the construction documentation stage was compared between the BIM data for the two cases. A total of 39 drawing sheets categorized into eight types were selected for the analysis to investigate the impact of the BOMI-2D evaluation index on the work productivity of users and verify the effectiveness of its reflection on the maturity of the model for drawing purposes.

5.2.2. Analysis of User Tasks According to BOMI-2D

The BDRI evaluation results for the pilot test model in case A, as discussed in Section 5.2, indicate that the project unit BDRI-SE scored 0.90, BDRI-BE scored 0.68, BDRI-SA scored 0.72, and BDRI-BA scored 0.70. Additionally, the core enlarged floor plan unit BDCI scored 0.64, and the project unit BDCI scored 0.68.
The additional work required by users for drawing purposes was analyzed during the process of creating 2D deliverables from the corresponding model. In case A, 14 instances of additional work were required to prepare the core enlargement floor plan. These instances of additional work resulted from missing objects and property information in the model data that should have been expressed in the drawings. Specifically, there were three instances of missing drawing information display elements for expressing specification information, two instances of missing building objects, and nine instances of missing room ID elements in the spatial object, all of which were in relation to the BIM data (Figure 14). The work of moving objects or adjusting views using BIM authoring tool software functions was excluded from the analysis of additional work. This analysis determined that 618 instances of additional work were required by users to create the eight types of drawings in case A (Table 7).
The pilot test model in case B was created as a BIM model and 2D deliverables meeting the requirements of the BOMI-2D evaluation criteria based on the original BIM data from case A. Consequently, the project unit scores for BDRI-SE, BDRI-BE, BDRI-SA, BDRI-BA, and BDCI in case B, corresponding to the BOMI-2D evaluation index, were all 1.00.
When creating an enlarged floor plan for the core from the BIM model in case B, three additional tasks were performed by the user. These tasks included creating drawing information notation elements for specifying information on the drawings (Figure 14). Furthermore, 72 additional user tasks were required to create the eight types of drawings in case B (Table 7).

5.2.3. Comparative Analysis of Evaluation Results

The BOMI-2D evaluation scores were analyzed for case A, an existing pilot test model, and the case B model was built to meet the BOMI-2D evaluation criteria (Table 8). The BDRI-BE exhibited the highest difference, with a 32% variation. Similarly, the BDCI, a measure of the consistency between BIM and drawing data, also exhibited a 32% difference. Furthermore, when the overall average BDRI improved by 33.3%, the BDCI improved by 32%. This suggests a proportional correlation between the BDRI and BDCI; however, the correlation may vary depending on the project characteristics and BOMI-2D evaluation criteria.
To compare and analyze work productivity, this study assessed the additional work users had to perform when generating the same level of 2D deliverables from the pilot test models in both cases. We assumed that the time required for element, dimension, annotation, and description tasks associated with additional work would be consistent per task. Moreover, we assumed that the difficulty, complexity, and user skill level for each task type were uniform. This approach allowed us to assess productivity by comparing the number of additional tasks in each case, resulting in a calculation of the work productivity improvement rate based on the reduction in additional work.
The analysis of additional work performed by users during the generation of 2D deliverables from the model, based on the BOMI-2D evaluation score, showed that approximately 88.3% of the additional user work was reduced compared to the original BIM data (case A). Drawing representation elements that required additional work from the user were categorized into building elements, dimensions, annotations, and description elements. These were non-matching elements that were not interconnected with the BIM data. Among these, the annotation elements showed a 98.7% reduction in additional user work compared to the original BIM data, while the description elements had the smallest reduction rate (55.1%). Annotation elements, such as room names or member IDs generated from the property information of an object, could be fully linked to drawing data when BIM data were used. Building elements, when accompanied by BIM data that adhered to the required BIM data level and project level of detail, could be used as data linked to 2D deliverables. However, in some cases, certain building elements, like a ceiling hanger or an elevator for each floor, were not created as 3D BIM data but were separately created as 2D objects in the drawing-creation stage to convey information in the drawing. Similarly, some of the dimensional elements required additional work by the user, independent of the BIM data, when expressing the dimensions of objects created separately in the 2D element drawing-creation stage. Lastly, if description elements were included in a drawing to provide additional information, such as specifications or construction details specific to each project and drawing, they were manually written by the user rather than relying on BIM data and had little effect on the BDRI and BDCI scores.
This analysis showed that with BDRI increasing by approximately 25% and BDCI improving by around 32%, user workload decreased by approximately 88.3%, indicating an 88.3% improvement in user work productivity. It is important to note that the degree of work productivity improvement may vary based on factors such as project size, complexity, worker skill levels, and others that influence work productivity. Nevertheless, this study confirmed that the BOMI-2D evaluation criteria and process directly impact the efficiency of creating 2D deliverables according to the BOMI-2D evaluation criteria. Furthermore, since BOMI-2D evaluation is based on BIM data creation requirements and the project level of detail established at the project’s outset, the results of BOMI-2D evaluation and user workload analysis may vary depending on the BDR-2D or project-specific BIM data, even with the same BIM outcomes. Therefore, the verification of this study is meaningful in proving the academic and industrial usability of BOMI-2D, an evaluation indicator, by confirming whether it is possible to implement it in the BIM authoring tool when the evaluation items are applied to the pilot test.

6. Conclusions

This study presents a method for the quantitative evaluation of BIM data and its effectiveness in generating and utilizing 2D deliverables in BIM.
To achieve this, the BIM-based drawing-generation process and 2D deliverables were analyzed based on the BDR-2D derived from previous research [7] to establish evaluation criteria for the BIM data used in 2D deliverable generation. The analysis revealed that the user’s workload in creating 2D deliverables and the consistency between BIM model and drawing data depend on the presence of the geometric and attribute information of the objects in the model as well as the method of expressing them as drawing elements.
To increase the utilization of BIM data and enhance work productivity, an objective and quantitative quality-evaluation index called BOMI-2D was derived. BOMI-2D comprises two indexes: BDRI, an index evaluating the readiness of the BIM data required for BIM-based 2D deliverable creation, and BDCI, an index evaluating and managing the consistency between BIM and 2D deliverables.
The evaluation of BOMI-2D was conducted based on the EIRs and the BEP, both of which fulfill the prerequisites for effective BIM data utilization. Therefore, the quantitative evaluation and management of BIM data-based 2D deliverables were performed during the execution and evaluation phases, adhering to the BOMI-2D evaluation criteria established in the project planning phase. This quantitative evaluation of BIM outcomes covered building, spatial, and auxiliary objects, which constituted the data components employed in constructing BIM data and generating 2D deliverables. The quantitative assessment of BOMI-2D was categorized into BDRI, evaluated based on a space-unit assessment according to the logical structure underlying the BIM design and BIM data, and BDCI, assessed based on the views that constituted 2D deliverables.
Finally, a pilot test was conducted to verify the BOMI-2D evaluation method, which is derived in this study for BIM outcomes of a neighborhood residential facility. The verification process involved calculating the evaluation scores in line with the BOMI-2D evaluation index, using the ArchiCAD API. In addition, user work productivity was analyzed and compared between the existing BIM outcome (case A) and the BIM outcome (case B) modified to meet the BOMI-2D requirements. The results showed a substantial reduction of approximately 88.3% in the additional user workload during the creation of 2D deliverables when using BIM achievements. BDRI demonstrated a 25% increase, and BDCI showed a 32% improvement compared to the BOMI-2D evaluation index of the existing BIM outcomes. This substantiates the direct influence of the BOMI-2D evaluation index on the productivity of 2D deliverable generation work. However, it is important to note that even for the same BIM outcomes, the BOMI-2D evaluation results may vary depending on the data creation standards and requirements defined at the project execution planning stage. Therefore, by establishing BOMI-2D criteria in alignment with the BIM data requirements specific to project characteristics and the intended purpose of BIM utilization, we can analyze the quality and work productivity of BIM achievements in accordance with the BOMI-2D evaluation results for each project.
At present, BOMI-2D primarily focuses on assessing the presence and interoperability of data but faces limitations in verifying the accuracy of data values themselves. While data values may fluctuate based on design information, the absence of data meeting the requisite criteria renders effective BIM utilization unattainable. Ensuring the availability of relevant data is pivotal for fully realizing the potential of BIM. Hence, this study aims to evaluate if the criteria for generating 2D deliverables from BIM are met and to gauge the quality of BIM data that can enhance work productivity. Notably, the project client can evaluate and utilize the BIM outcomes submitted by the contractor, thereby augmenting the productivity of BIM projects. Subsequent studies may explore the accuracy of data values based on design information through data analysis and artificial intelligence learning. This would facilitate a quality assessment based on BOMI-2D evaluation, ultimately elevating the productivity of the AEC industry by increasing the utility of BIM data and enhancing the quality of outcomes.

Author Contributions

Conceptualization, Y.K. and S.C. (Sangyoon Chin); Methodology, Y.K.; Formal analysis, Y.K.; Data curation, Y.K.; Writing—original draft, Y.K.; Writing—review & editing, Y.K. and S.C. (Sangyoon Chin); Supervision, S.C. (Sangyoon Chin); Project administration, S.C. (Sangyoon Chin); Funding acquisition, S.C. (Seungyeon Choo); Writing—review & editing: S.C. (Seungyeon Choo). All authors have read and agreed to the published version of the manuscript.

Funding

This work was supported in 2023 by the Korea Agency for Infrastructure Technology Advancement (KAIA) grant funded by the Ministry of Land, Infrastructure and Transport (Grant RS-2021-KA163269).

Data Availability Statement

Data are contained within the article.

Conflicts of Interest

The authors declare no conflict of interest.

References

  1. Shin, J.H.; Choi, J.S.; Kim, I.H. Development of IT BSC-Based Assessment System to Measure BIM Performance for Architectural Design Firms. J. Archit. Inst. Korea Plan. Des. 2016, 32, 3–12. [Google Scholar] [CrossRef]
  2. Song, J.K.; Ju, K.B. Development of Rule for Quality Checking Items to Raise Quality of BIM Model-Focusing on the Domestic BIM Guidelines-. Korean J. Constr. Eng. Manag. 2013, 14, 131–143. [Google Scholar] [CrossRef]
  3. Donato, V.; Lo Turco, M.; Bocconcino, M.M. BIM-QA/QC in the Architectural Design Process. Archit. Eng. Des. Manag. 2018, 14, 239–254. [Google Scholar] [CrossRef]
  4. Zadeh, P.A.; Wang, G.; Cavka, H.B.; Staub-French, S.; Pottinger, R. Information Quality Assessment for Facility Management. Adv. Eng. Inform. 2017, 33, 181–205. [Google Scholar] [CrossRef]
  5. Leygonie, R.; Motamedi, A.; Iordanova, I. Development of Quality Improvement Procedures and Tools for Facility Management BIM. Dev. Built Environ. 2022, 11, 100075. [Google Scholar] [CrossRef]
  6. Becerik-Gerber, B.; Rice, S. The Perceived Value of Building Information Modeling in the US Building Industry. J. Inf. Technol. Constr. 2010, 15, 185–201. [Google Scholar]
  7. Kim, Y.; Chin, S.; Choo, S. BIM Data Requirements for 2D Deliverables in Construction Documentation. Autom. Constr. 2022, 140, 104340. [Google Scholar] [CrossRef]
  8. Level of Development Specification. 2022. Available online: https://bimforum.org/wp-content/uploads/2022/06/BIMForum_LOD-Spec-2020.zip (accessed on 29 June 2023).
  9. BS EN ISO 19650-1:2018 Organization and Digitization of Information about Buildings and Civil Engineering Works, Including Building Information Modelling (BIM). Information Management Using Building Information Modelling—Concepts and Principles. Available online: https://knowledge.bsigroup.com/products/organization-and-digitization-of-information-about-buildings-and-civil-engineering-works-including-building-information-modelling-bim-information-management-using-building-information-modelling-concepts-and-principles/standard (accessed on 29 June 2023).
  10. Version 4.2 bSI Candidate Standard IFC Bridge Extension. Now Part IFC. p 4.3.x Release Cycle. Available online: https://standards.buildingsmart.org/IFC/DEV/IFC4_2/FINAL/HTML/ (accessed on 29 June 2023).
  11. Chen, Z.S.; Zhou, M.D.; Chin, K.S.; Darko, A.; Wang, X.J.; Pedrycz, W. Optimized Decision Support for BIM Maturity Assessment. Autom. Constr. 2023, 149, 104808. [Google Scholar] [CrossRef]
  12. Wu, C.; Xu, B.; Mao, C.; Li, X. Overview of BIM Maturity Measurement Tools. J. Inf. Technol. Constr. Itcon 2017, 22, 34–62. Available online: https://www.itcon.org/papers/2017_03-ITcon-Wu.pdf (accessed on 29 June 2023).
  13. Yilmaz, G.; Akcamete, A.; Demirors, O. A Reference Model for BIM Capability Assessments. Autom. Constr. 2019, 101, 245–263. [Google Scholar] [CrossRef]
  14. Kwon, O.; Jo, C.W.; Cho, J.W. A Study on the Systematization of Open BIM Data Quality Management. J. Archit. Inst. Korea Struct. Constr. 2012, 28, 105–112. [Google Scholar] [CrossRef]
  15. Getting Help on Archicad. Volume 26. Available online: https://help.graphisoft.com/AC/26/INT/index.htm?#t=_AC26_Help%2F001_ACHelpIntro%2F001_ACHelpIntro-1.htm (accessed on 29 June 2023).
  16. Lu, W.; Chen, K.; Zetkulic, A.; Liang, C. Measuring Building Information Modeling Maturity: A Hong Kong Case Study. Int. J. Constr. Manag. 2021, 21, 299–311. [Google Scholar] [CrossRef]
  17. Edirisinghe, R.; Pablo, Z.; Anumba, C.; Tereno, S. An Actor–Network Approach to Developing a Life Cycle Bim Maturity Model (Lcbmm). Sustainability 2021, 13, 13273. [Google Scholar] [CrossRef]
  18. Kam, C.; Senaratna, D.; Xiao, Y.; McKinney, B. The VDC Scorecard: Evaluation of AEC Projects and Industry Trends; Center for Integrated Facility Engineering: Maharashtra, India, 2013. [Google Scholar]
  19. Du, J.; Liu, R.; Issa, R.R. BIM Cloud Score: Benchmarking BIM Performance. J. Constr. Eng. Manag. 2014, 140, 04014054. [Google Scholar] [CrossRef]
  20. Liang, C.; Lu, W.; Rowlinson, S.; Zhang, X. Development of a Multifunctional BIM Maturity Model. J. Constr. Eng. Manag. 2016, 142, 06016003. [Google Scholar] [CrossRef]
  21. NBIMS. ver.3. 2015 National BIM Standard (NBIMS)–United States, Annex A: COBie Mapping Rules. Volume 2015. Available online: https://www.nationalbimstandard.org/files/NBIMS-US_V3_4.2_COBie_Annex_A.pdf (accessed on 29 June 2023).
  22. Paulk, M.C.; Curtis, B.; Chrissis, M.B.; Weber, C.V. Capability Maturity Model, version 1.1. IEEE Softw. 1993, 10, 18–27. [Google Scholar] [CrossRef]
  23. ISO/IEC, 2015a. ISO/IEC 33001 Information Technology — Process Assessment — Concepts and Terminology. Available online: https://www.iso.org/obp/ui/#iso:std:iso-iec:33001:ed-1:v1:en (accessed on 9 November 2023).
  24. Kim, S.; Chin, S.; Han, J.; Choi, C.H. Measurement of construction BIM value based on a case study of a large-scale building project. J. Manag. Eng. 2017, 33, 05017005. [Google Scholar] [CrossRef]
  25. Kwon, O.; Jo, C.W. Proposal of BIM Quality Management Standard by Analyzing Domestic and International BIM Guides. J. Korea Inst. Build. Constr. 2011, 11, 265–275. [Google Scholar] [CrossRef]
Figure 1. Conceptual diagram of the research process.
Buildings 13 03124 g001
Figure 2. Building information modeling (BIM)-based drawing creation process.
Buildings 13 03124 g002
Figure 3. Components of the building information modeling (BIM) drawing data.
Buildings 13 03124 g003
Figure 4. The configuration of the BIM outcome measurement index for 2D deliverable (BOMI-2D) evaluation.
Buildings 13 03124 g004
Figure 5. The process of establishing criteria for the BIM outcome measurement index for 2D deliverables (BOMI-2D) for quantitative evaluation in the context of BIM (building information modeling) projects.
Buildings 13 03124 g005
Figure 6. BIM data readiness index (BDRI) evaluation criteria definition process.
Buildings 13 03124 g006
Figure 7. BIM data consistency index (BDCI) evaluation criteria definition process.
Buildings 13 03124 g007
Figure 8. BIM data readiness index (BDRI) composition according to BIM data structure.
Buildings 13 03124 g008
Figure 9. BIM data readiness index for element (BDRI-E) evaluation process.
Buildings 13 03124 g009
Figure 10. BIM data readiness index for attribute (BDRI-A) evaluation process.
Buildings 13 03124 g010
Figure 11. BIM data consistency index (BDCI) composition according to BIM drawing data structure.
Buildings 13 03124 g011
Figure 12. BIM data consistency index (BDCI) evaluation process.
Buildings 13 03124 g012
Figure 13. Building a modified model for productivity analysis.
Buildings 13 03124 g013
Figure 14. Analysis of drawing representation elements that are not linked to the BIM model in the core enlarged floor plan.
Buildings 13 03124 g014
Table 1. Example of the establishment of essential room criteria for each floor. ✓: essential object.
FloorRoom Configuration
(IfcLongName)
Necessary Room List
B1Mechanical service
Elevator pit
Core pit
Electrical pipe shaft
Telecommunication pipe shaft
Stair hall-
Parking lot
Table 2. Example of a list of essential building objects in room units constituting a specific floor (case without sub-elements). ✓: essential object.
Building Element ListNecessary Building Element per Space
Object TypeIFC Object TypeIFC Predefined TypeIFC User Defined TypeLobbyStair Hall···
Structural wallIfcWallBy type ···
Architectural wallIfcWallBy type -···
Wall coveringIfcCoveringUSERDEFINEDWALL_FINISHING···
SlabIfcSlabBy type ···
Slab finishingIfcCoveringUSERDEFINEDSLAB_FINISHING···
RC columnIfcCloumnUSERDEFINEDCOLUMN_RC···
Steel column (H)IfcCloumnUSERDEFINEDCOLUMN_HSTEEL-···
RC beamIfcBeamUSERDEFINEDBEAM_RC···
Table 3. Example of a list of essential building objects in room units constituting a specific floor (case with sub-elements). ✓: essential object.
Building Element ListNecessary Building Element per Space
Parent-ElementSub-ElementLobbyStair Hall···
Object TypeIFCObject TypeIFC Object TypeIFC Predefined TypeIFC User Defined Type
StairIfcStairStairFlightIfcStairFlightBy type--···
Stair landingIfcSlabUSERDEFINEDSTAIR_LANDING-···
TreadIfcMemberUSERDEFINEDSTAIR_TREAD-···
TreadnoseIfcCoveringUSERDEFINEDSTAIR_TREAD_TREADNOSE-···
Nonslip IfcCoveringUSERDEFINEDSTAIR_TREAD_NONSLIP-···
Riser IfcMemberUSERDEFINEDSTAIR_RISER-···
Stair railingIfcRailingUSERDEFINEDSTAIR_RAILING-···
Handrail IfcRailingUSERDEFINEDSTAIR_RAILING_HANDRAIL-
Balustrade IfcRailingUSERDEFINEDSTAIR_RAILING_BALUSTRADE-
Stair finishingIfcCoveringUSERDEFINEDSTAIR_FINISHING-···
Table 4. Example of establishing essential attribute criteria for spatial elements. ✓: essential attribute.
Element ClassAttribute ListNecessary Attribute per Space
Level 1Level 2Elevator HallStair Hall
Spatial elementIdentificationGUID
Member name (ID)
Project name (ID)
LocationFacility name-
Zone name-
Floor name
ShapeRoom height
Room area
FinishingFloor finishing
Wall finishing
Ceiling finishing-
Table 5. Example of establishing essential attribute criteria for building elements. ✓: essential attribute.
Element ClassLevel of Building ParameterNecessary Attribute per Space
Level 1Level 2LobbyStair Hall
StairIdentificationGUID
Member name (ID)
Project name (ID)
BIM data version
LocationFloor name
ResourceConcrete strength--
Rebar strength--
Evacuation stairs
Rebar detail--
ShapeStair width
Step height
Step width
Number of steps
Table 6. Example of the establishment of essential auxiliary object (drawing representation element) standard in view unit. ✓: essential element.
Auxiliary ElementIFC InformationNecessary Auxiliary Element List per Drawings
IFC Object TypeIFC Predefined TypeIFC User Defined TypeCross-SectionCore Enlarged
Floor Plan
···
Reference
element
Grid markerIfcAnnotationUSERDEFINEDGRID_MARKER···
Story markerIfcAnnotationUSERDEFINEDSTORYLEVEL_MARKER···
·····················
Dimension
element
Building planar dimensionIfcAnnotationUSERDEFINEDPLANAR_BUILDING_DIMENSION-···
Planar dimension of spaceIfcAnnotationUSERDEFINEDPLANAR_SPATIAL_DIMENSION-···
Planar dimension of elementIfcAnnotationUSERDEFINEDPLANAR_ELEMENT_DIMENSION-···
Floor step levelIfcAnnotationUSERDEFINEDSECTIONAL_LEVEL_FLOORSTEP-···
·····················
Notation
element
LegendIfcAnnotationUSERDEFINEDLEGEND···
Drawing information labelIfcAnnotationUSERDEFINEDDWGINFORMATION···
Opening symbolIfcAnnotationUSERDEFINEDSYMBOLTYPE_OEPNING···
Space name labelIfcAnnotationUSERDEFINEDLABELTYPE_SPACEID···
·····················
Table 7. Analysis results of drawing elements not linked with the BIM model according to BOMI-2D.
Drawing TypeNumber of DrawingsCase A—Drawing Elements Not Linked with BIM ModelCase B—Drawing Elements Not Linked with BIM Model
ElementDimensionAnnotationDescriptionSumElementDimensionAnnotationDescriptionSum
Architectural238859285955277443853
Floor plan14357135272044222028
Core enlarged floor plan2402153000055
Core enlarged cross-section2122931148600055
Elevation2403824400022
Cross-section22419483812900044
Layout1941293432229
Structural1610292032910001919
Structural plan1410291628830001717
Structural cross-section20044800022
Total3998883051276187445772
Table 8. Analysis of work productivity based on BOMI-2D. ▲: increased rate; ▼: reduced rate.
Comparative Analysis ResultOriginal BIM Data
(Case A)
Modified BIM Data
(Case B)
Difference Ratio (%)
BOMI-2D
output
BDRI-SE0.901.00▲ 10.0%
BDRI-BE0.681.00▲ 32.0%
BDRI-SA0.721.00▲ 28.0%
BDRI-BA0.701.00▲ 30.0%
BDCI0.681.00▲ 32.0%
Additional
tasks
Building element987▼ 92.9%
Dimension884▼ 95.5%
Annotation3054▼ 98.7%
Description12757▼ 55.1%
Total61872▼ 88.3%
Disclaimer/Publisher’s Note: The statements, opinions and data contained in all publications are solely those of the individual author(s) and contributor(s) and not of MDPI and/or the editor(s). MDPI and/or the editor(s) disclaim responsibility for any injury to people or property resulting from any ideas, methods, instructions or products referred to in the content.

