

Dynamic Assessment of the Structural Behavior of a Pedestrian Bridge Aiming to Characterize and Evaluate Its Comfort Level

Abstract
:1. Introduction
2. Comfort Level of Pedestrian Bridges
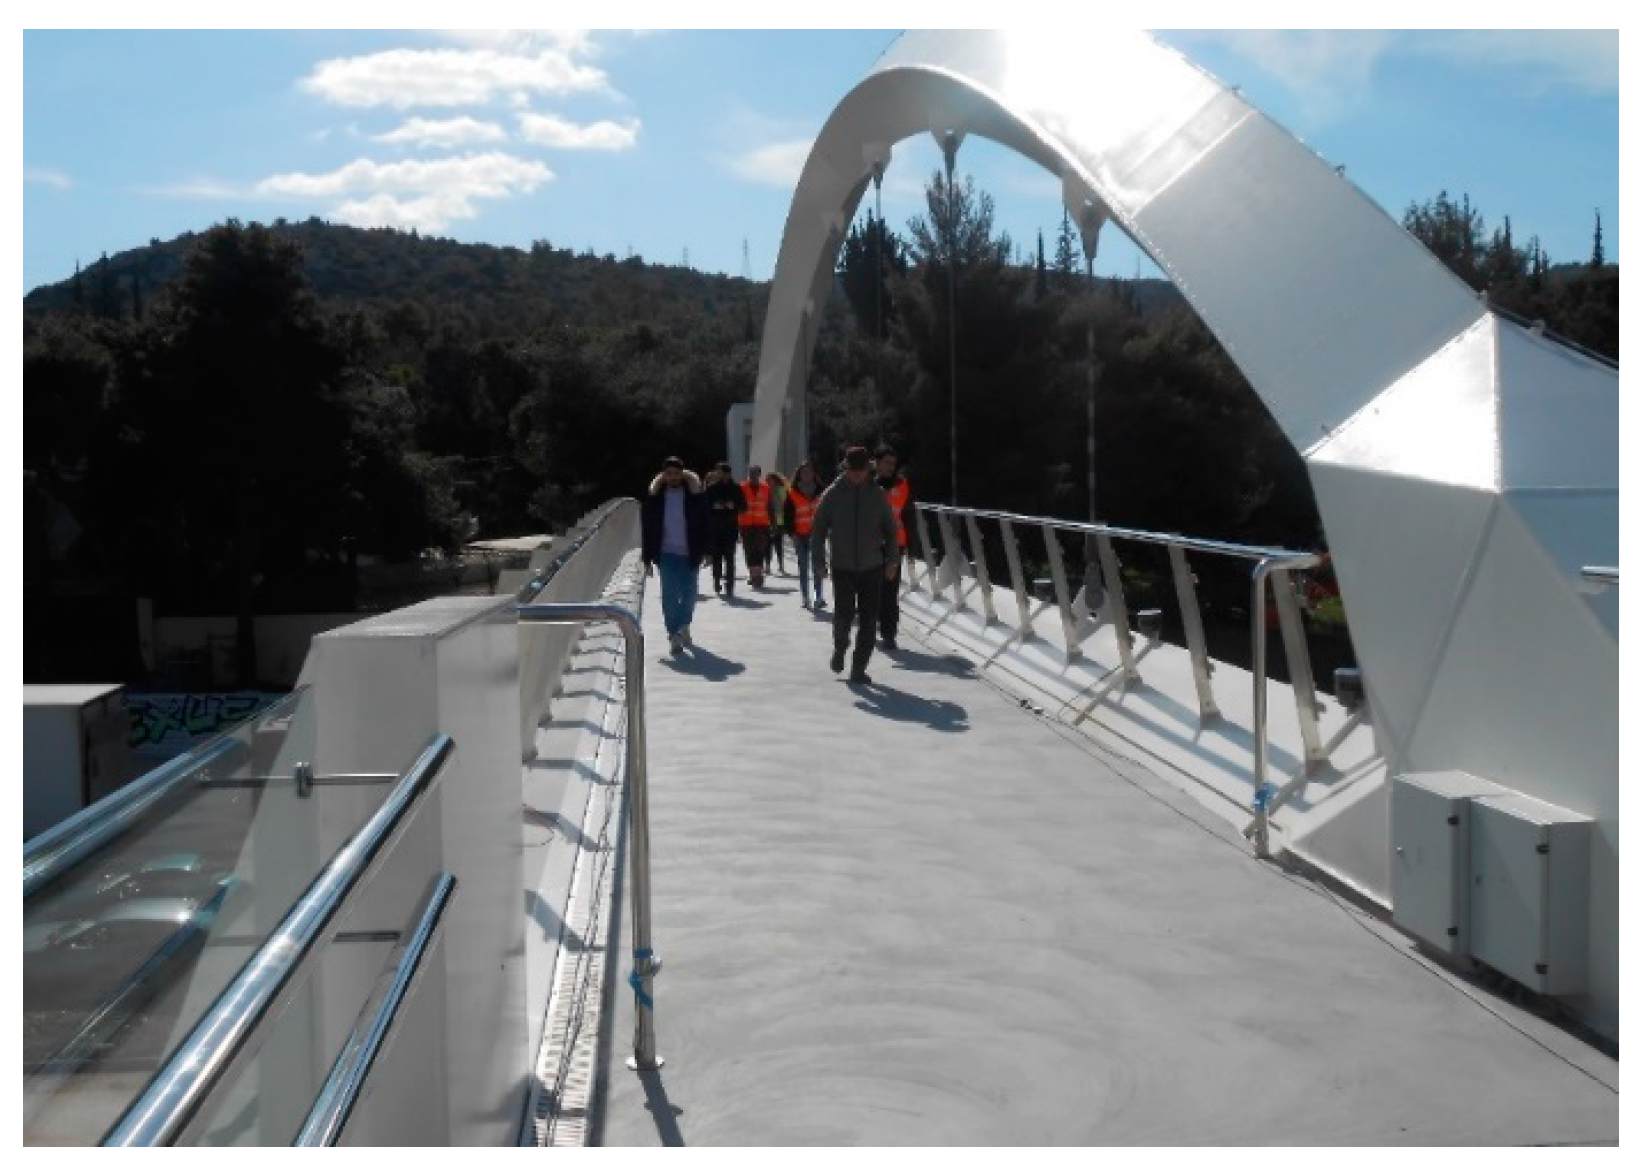
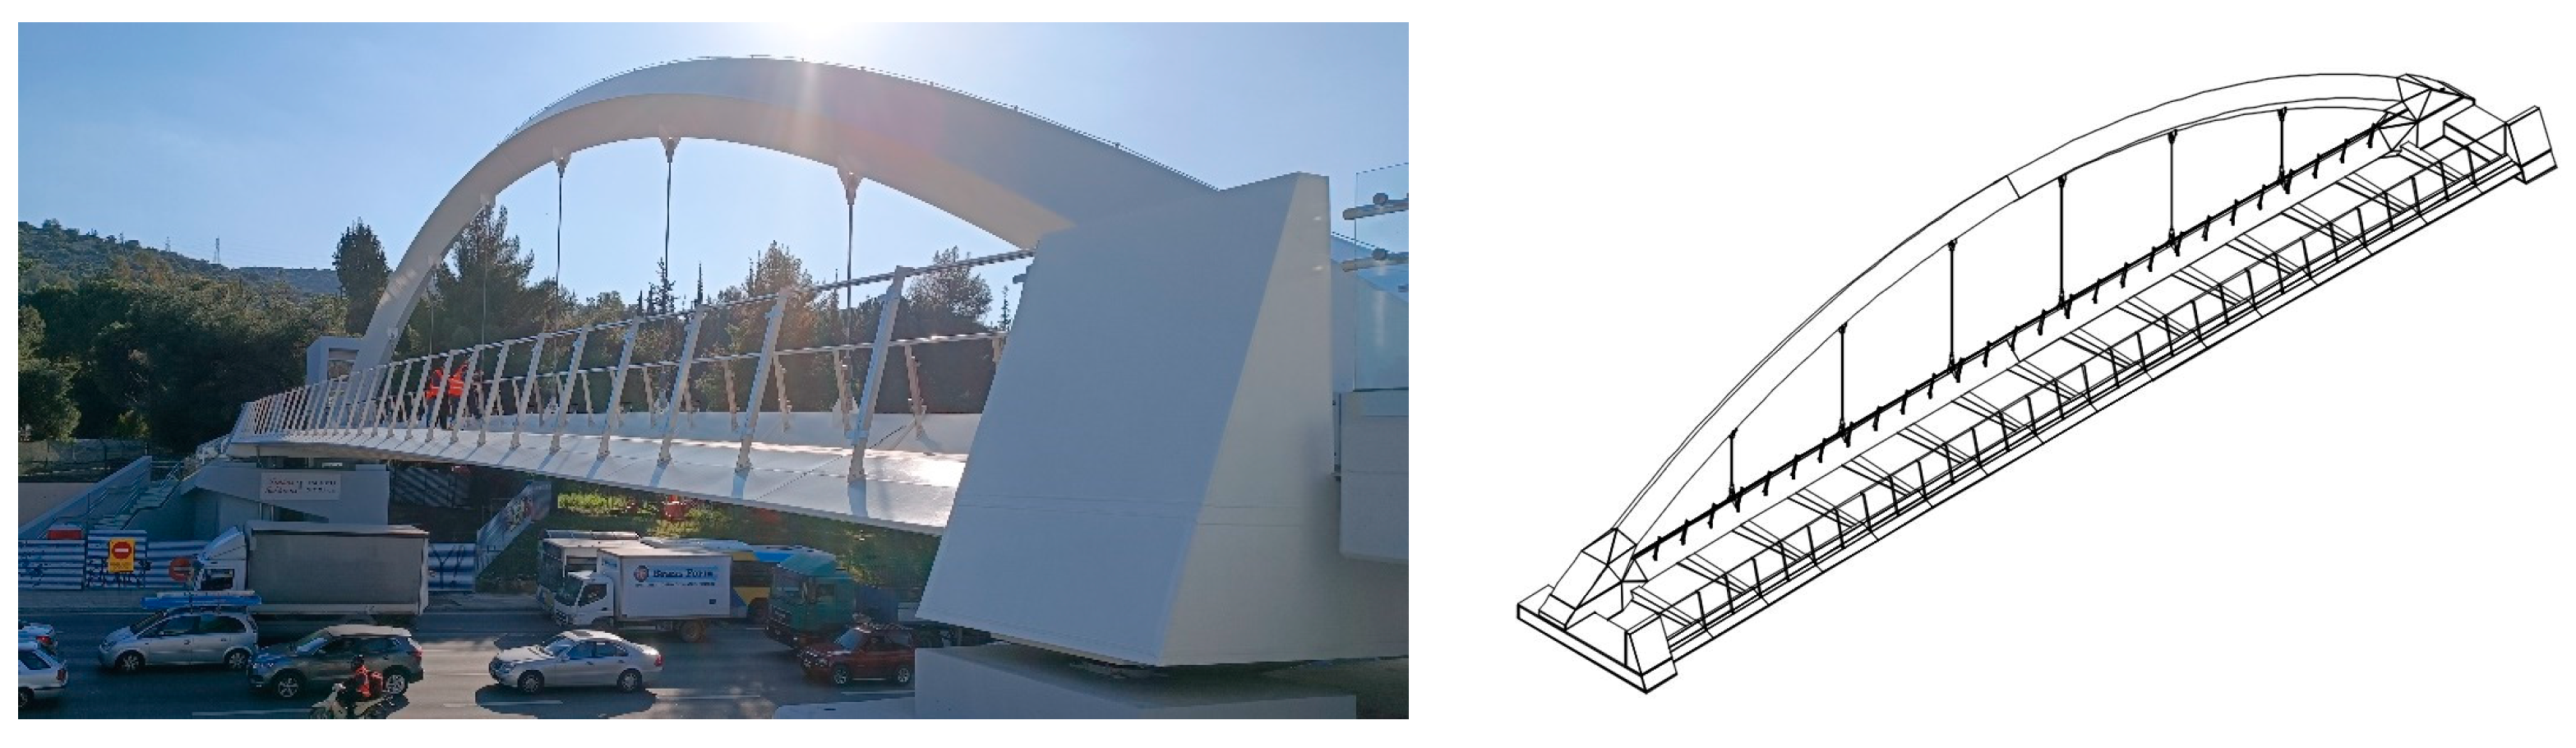
3. Case Study
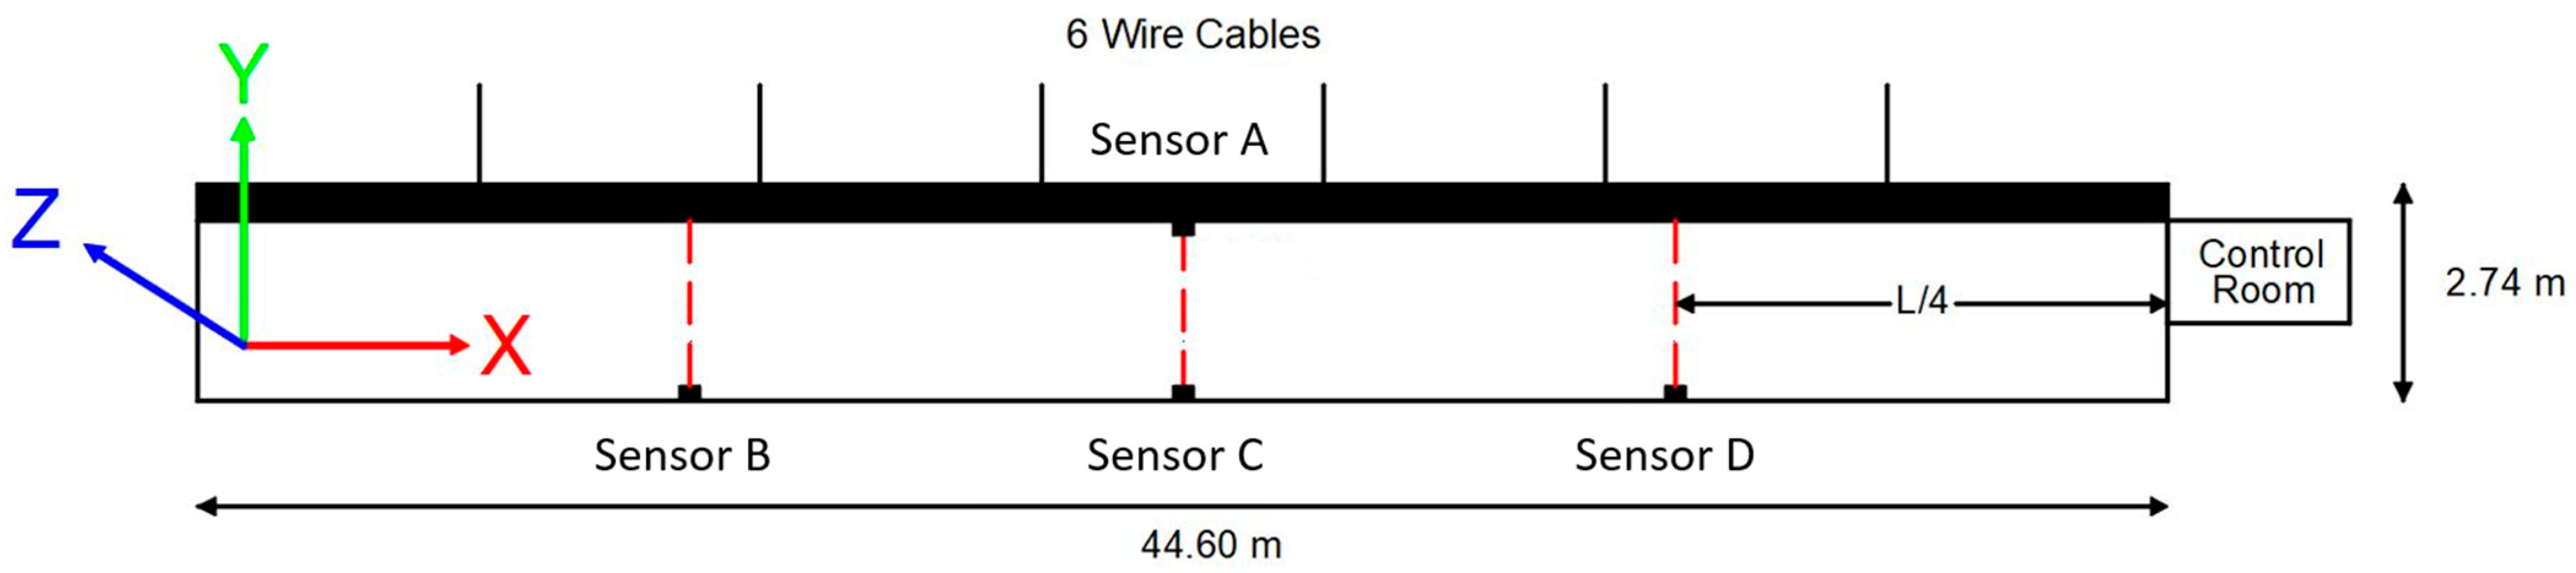
4. Experimental Procedure
5. Results and Interpretation
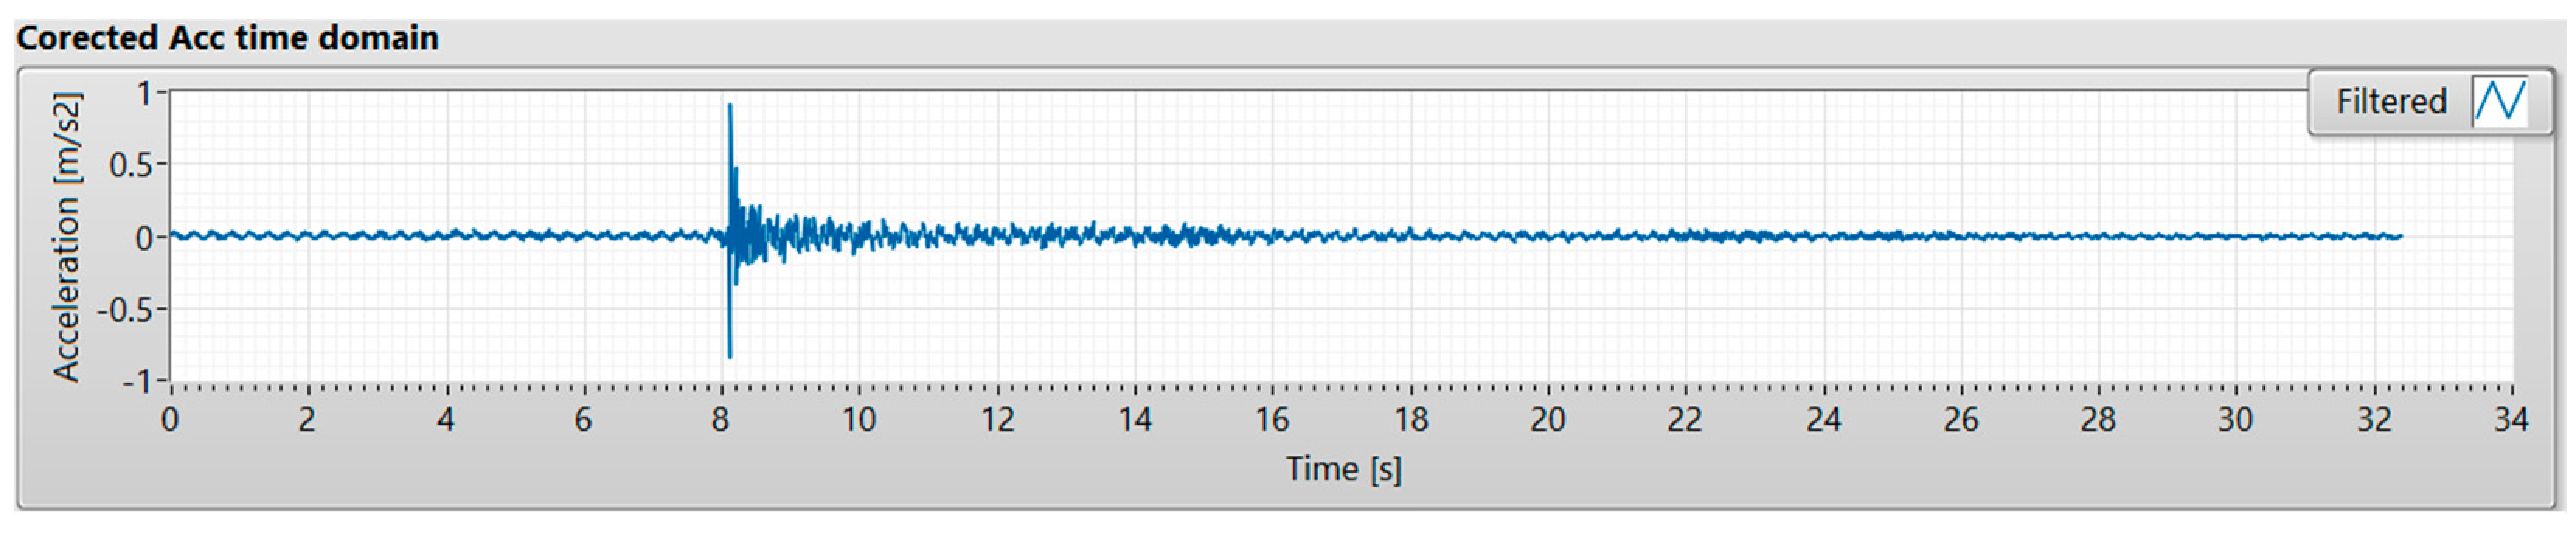
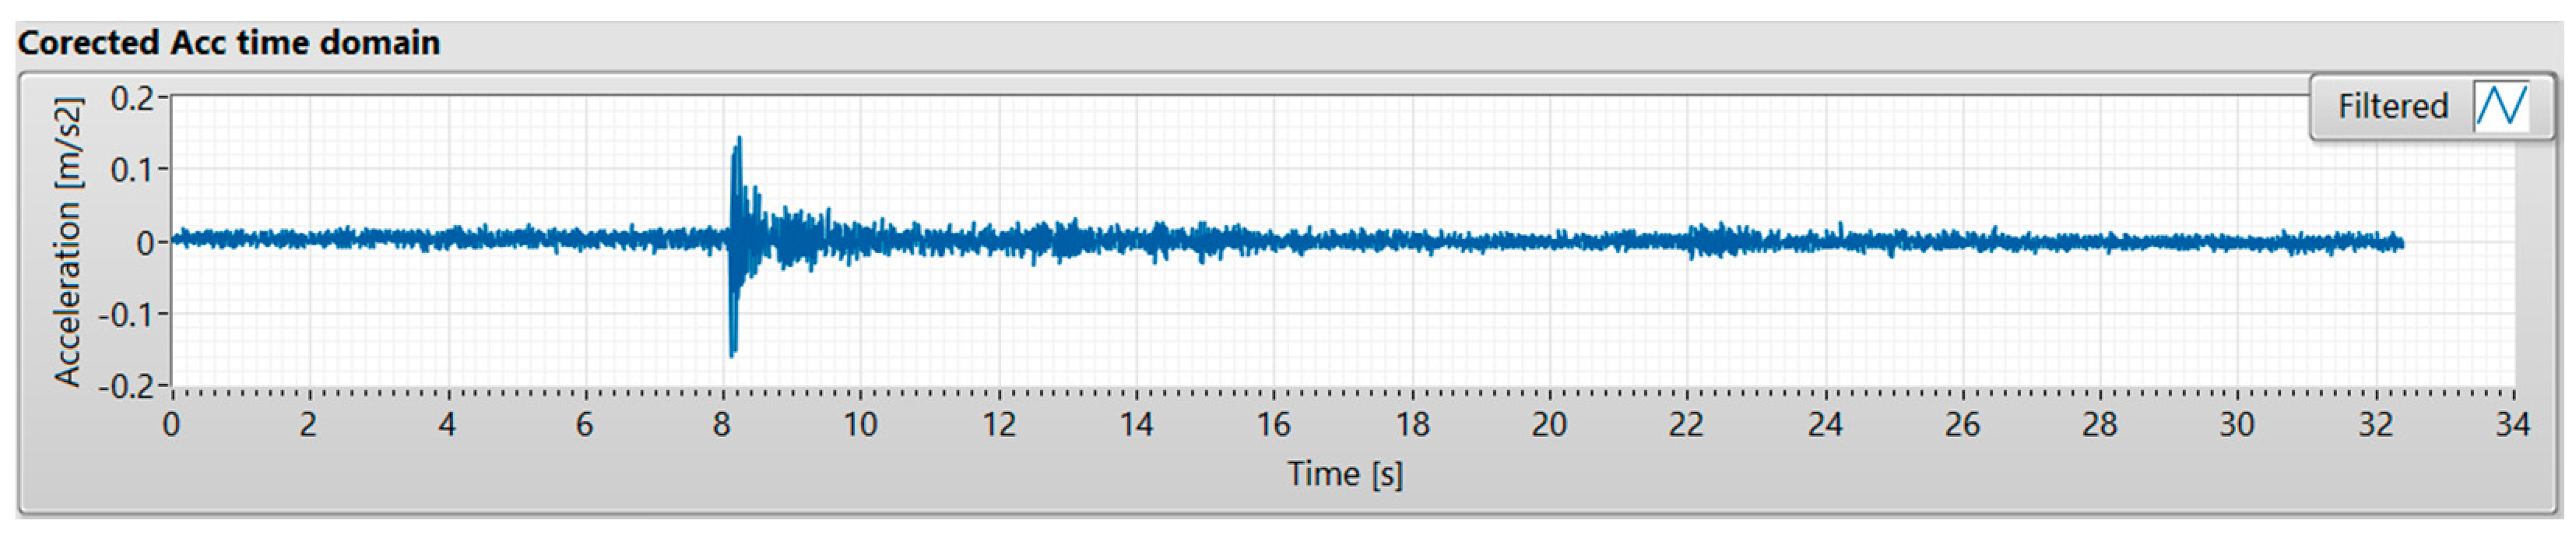
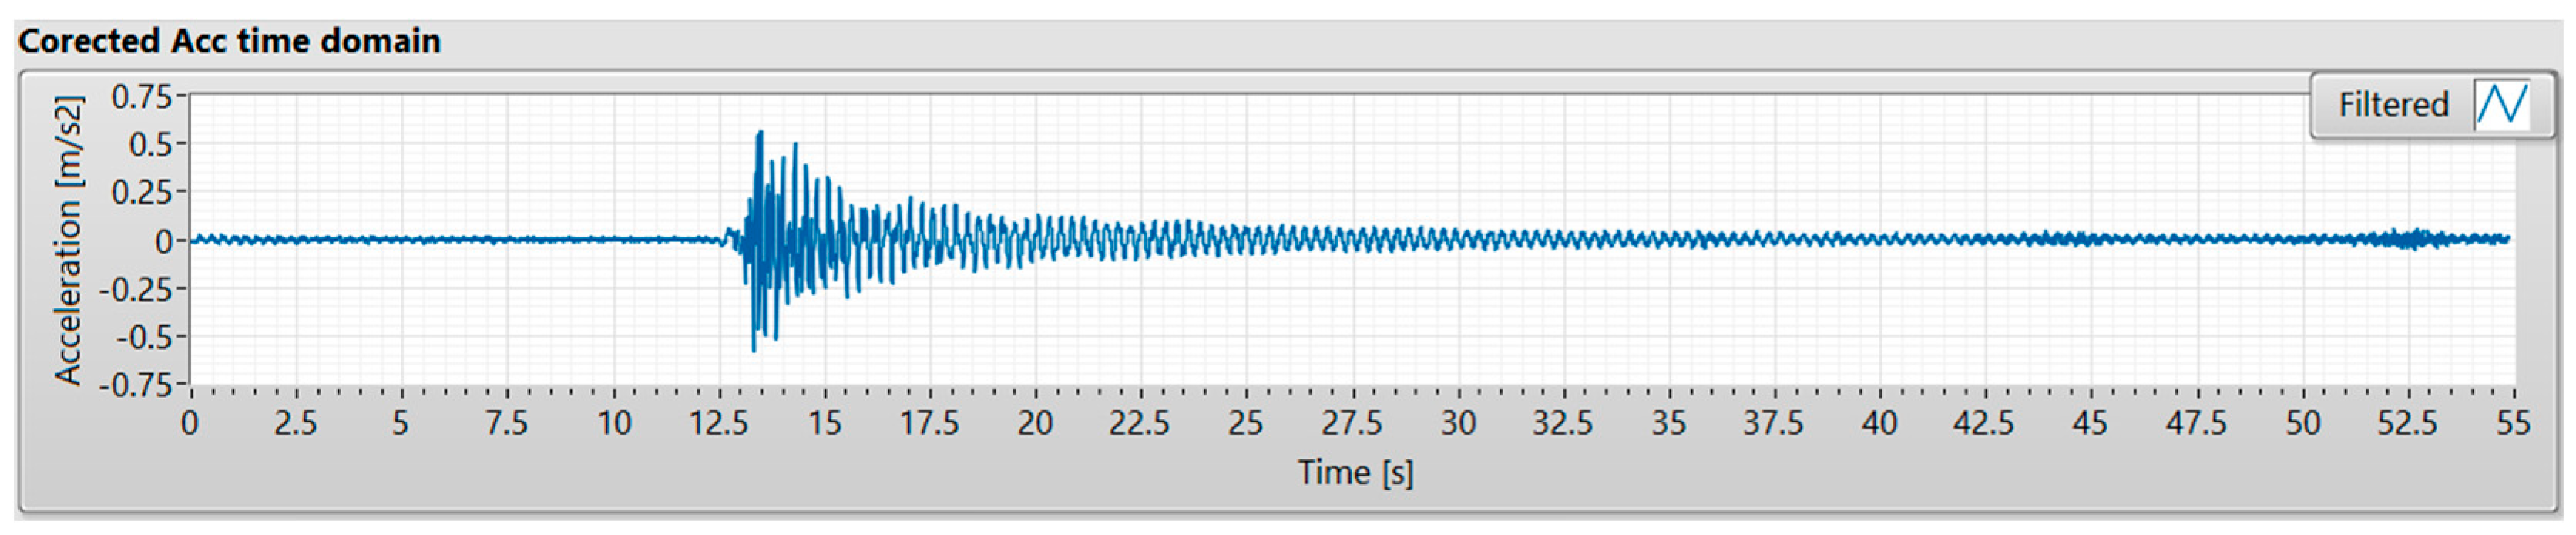
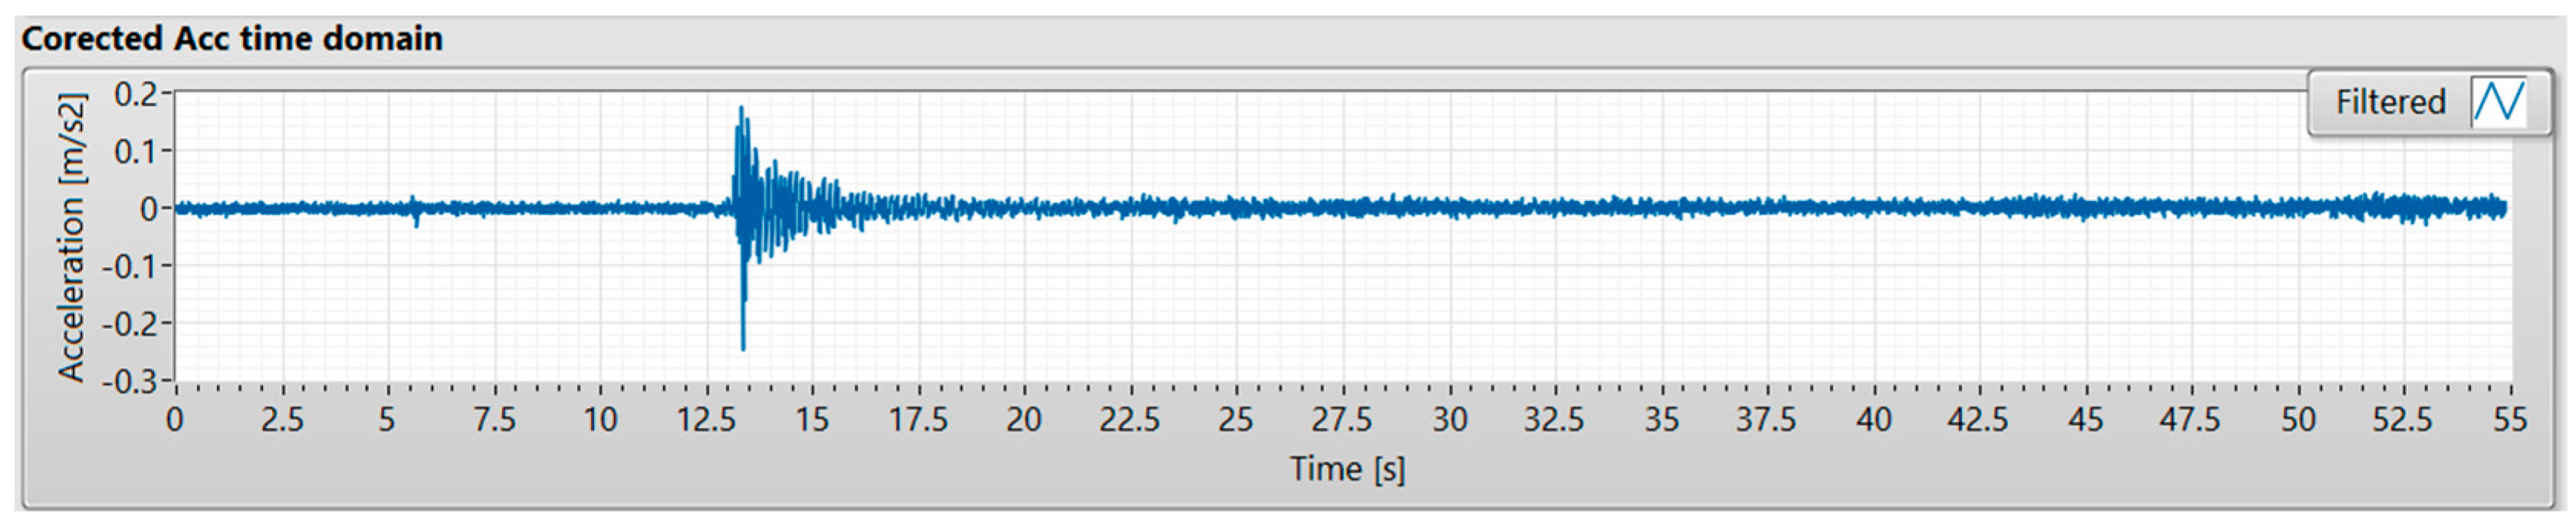
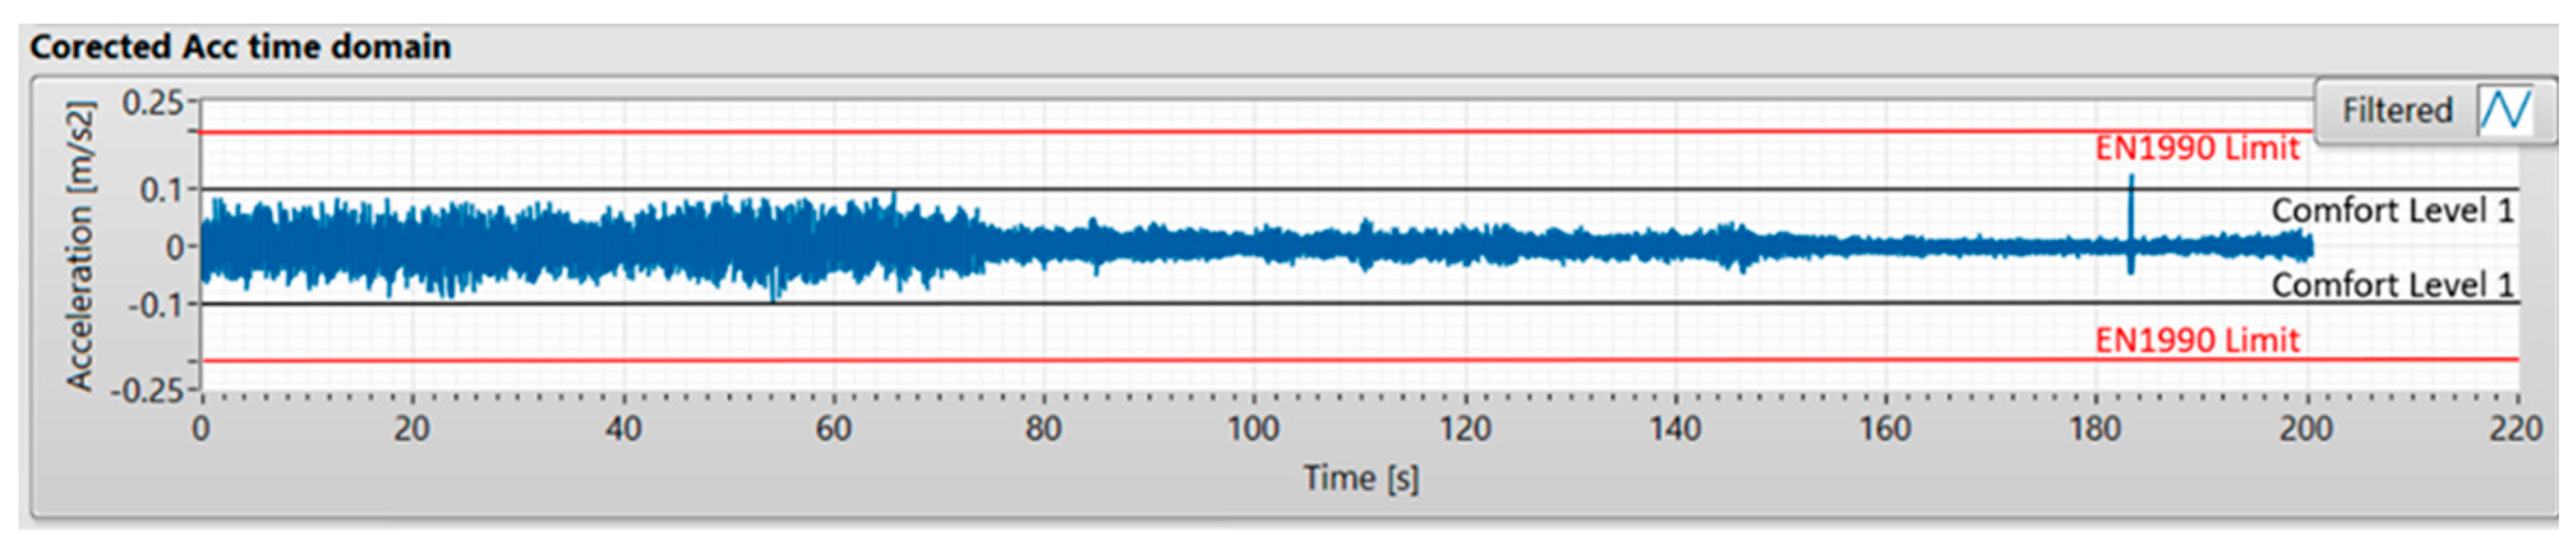
5.1. Acceleration Calculation
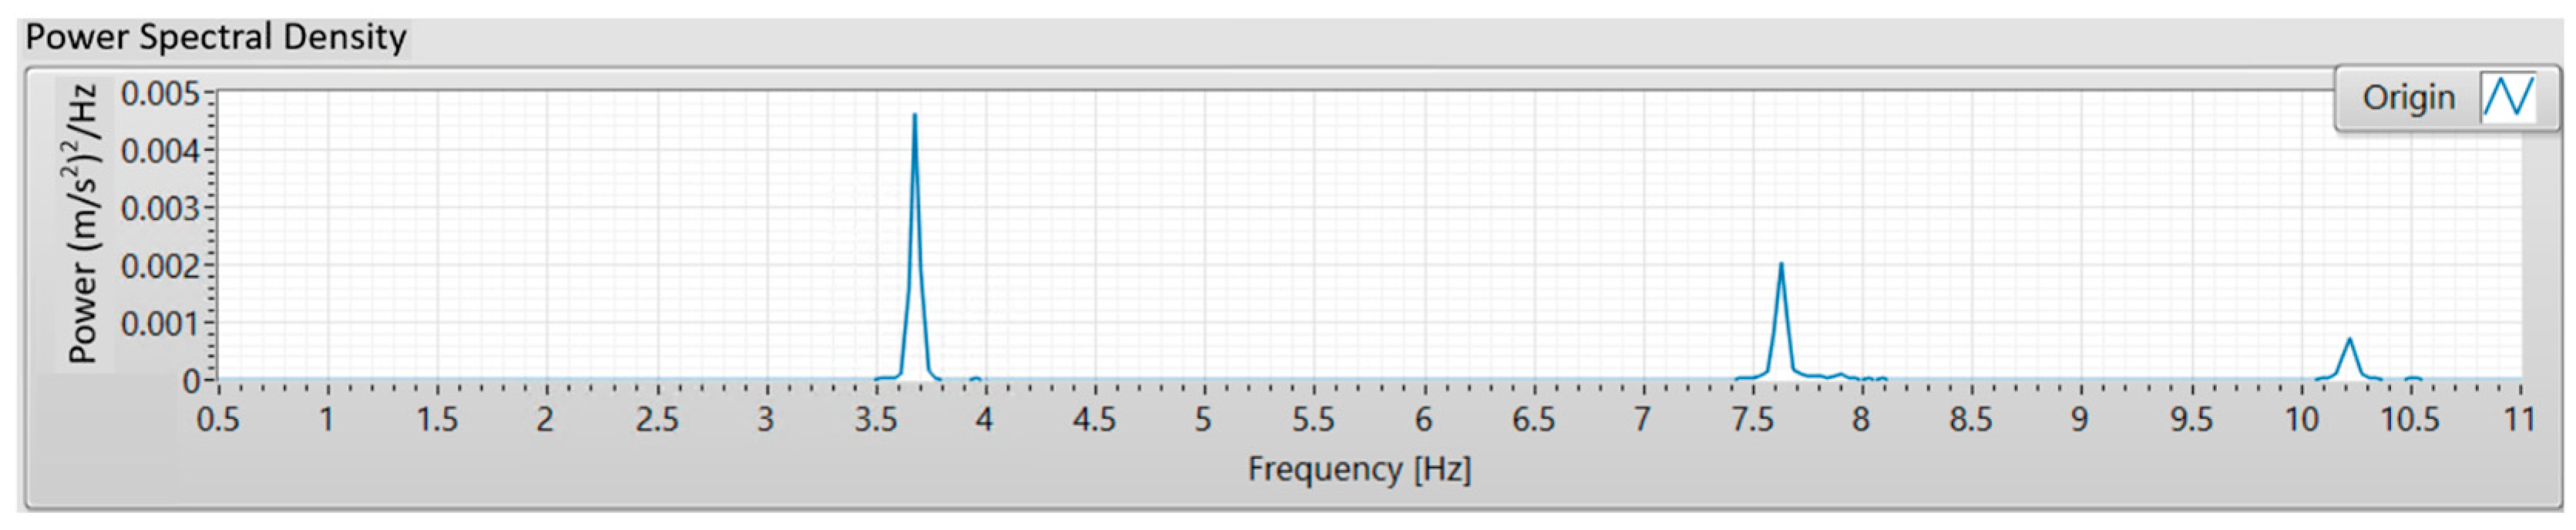
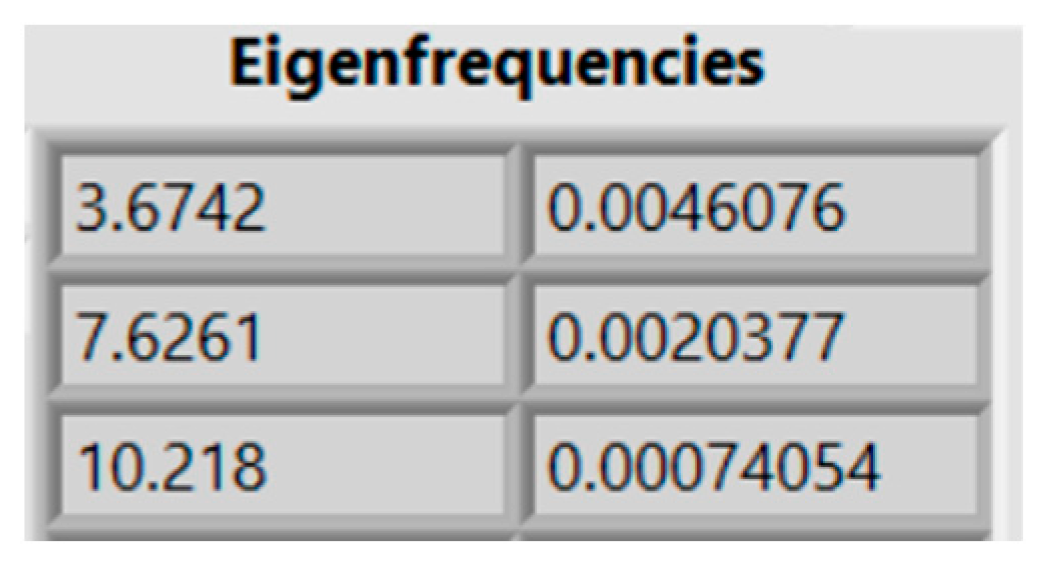
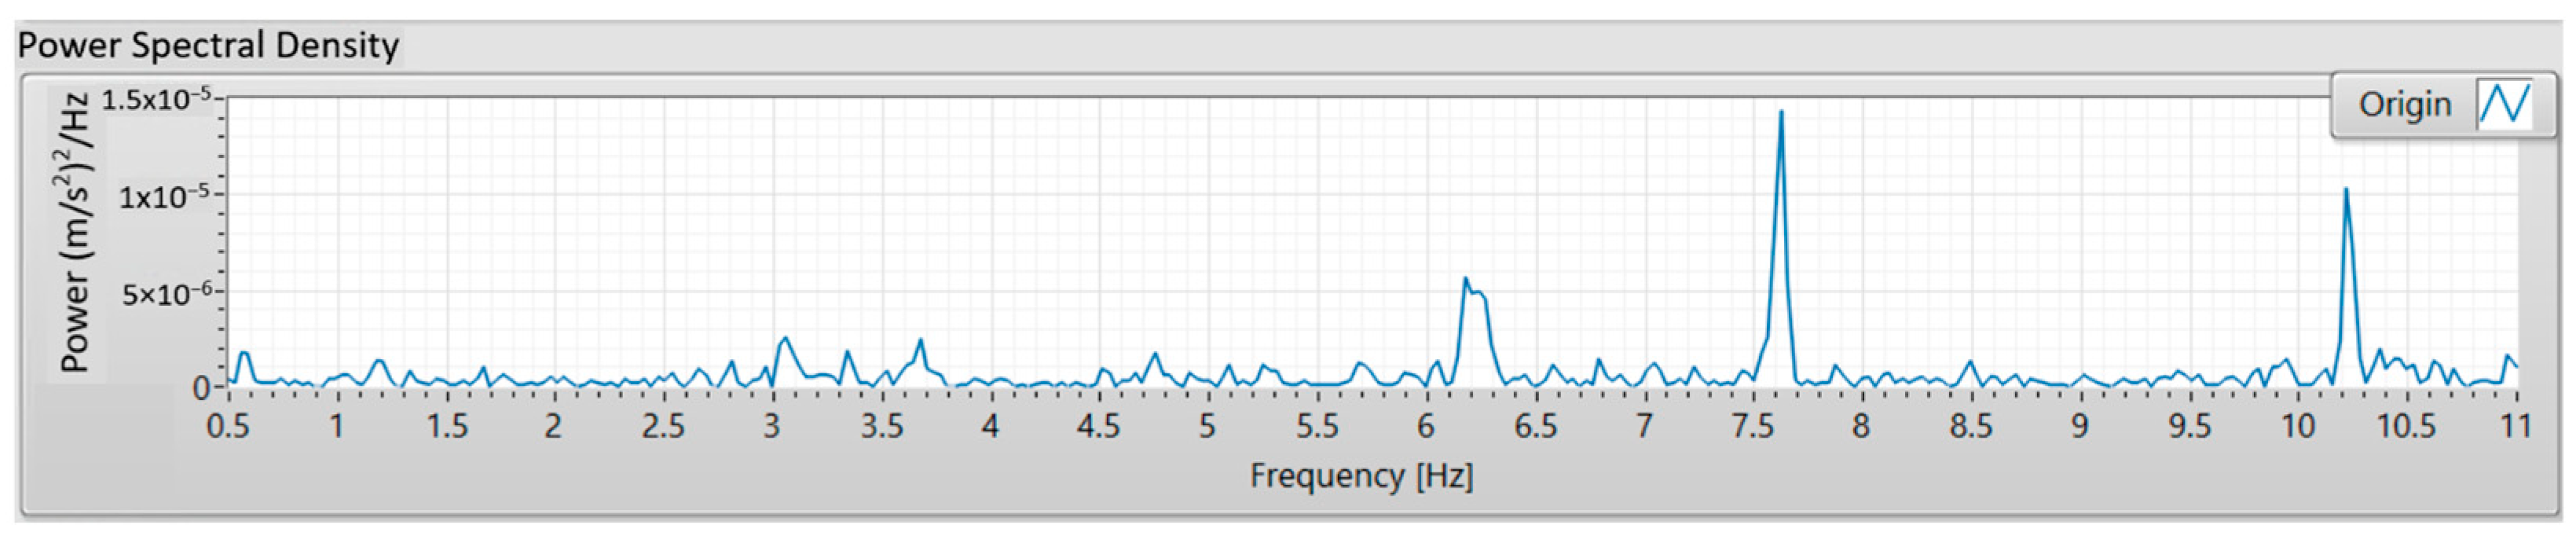
5.2. Natural Frequencies
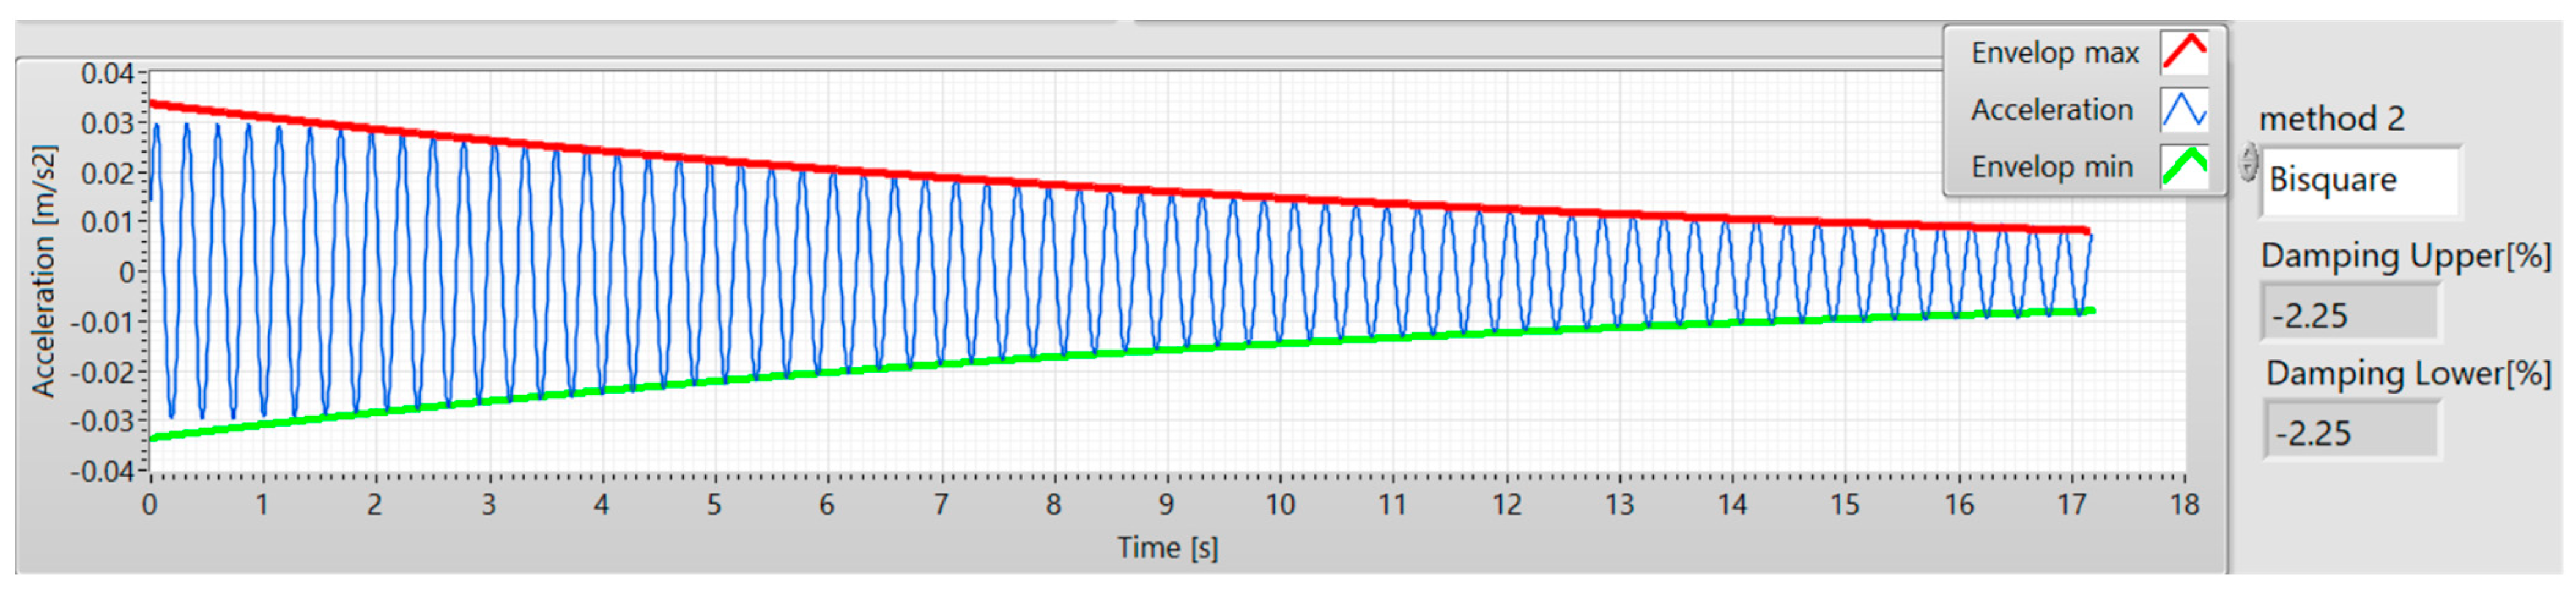
5.3. Damping
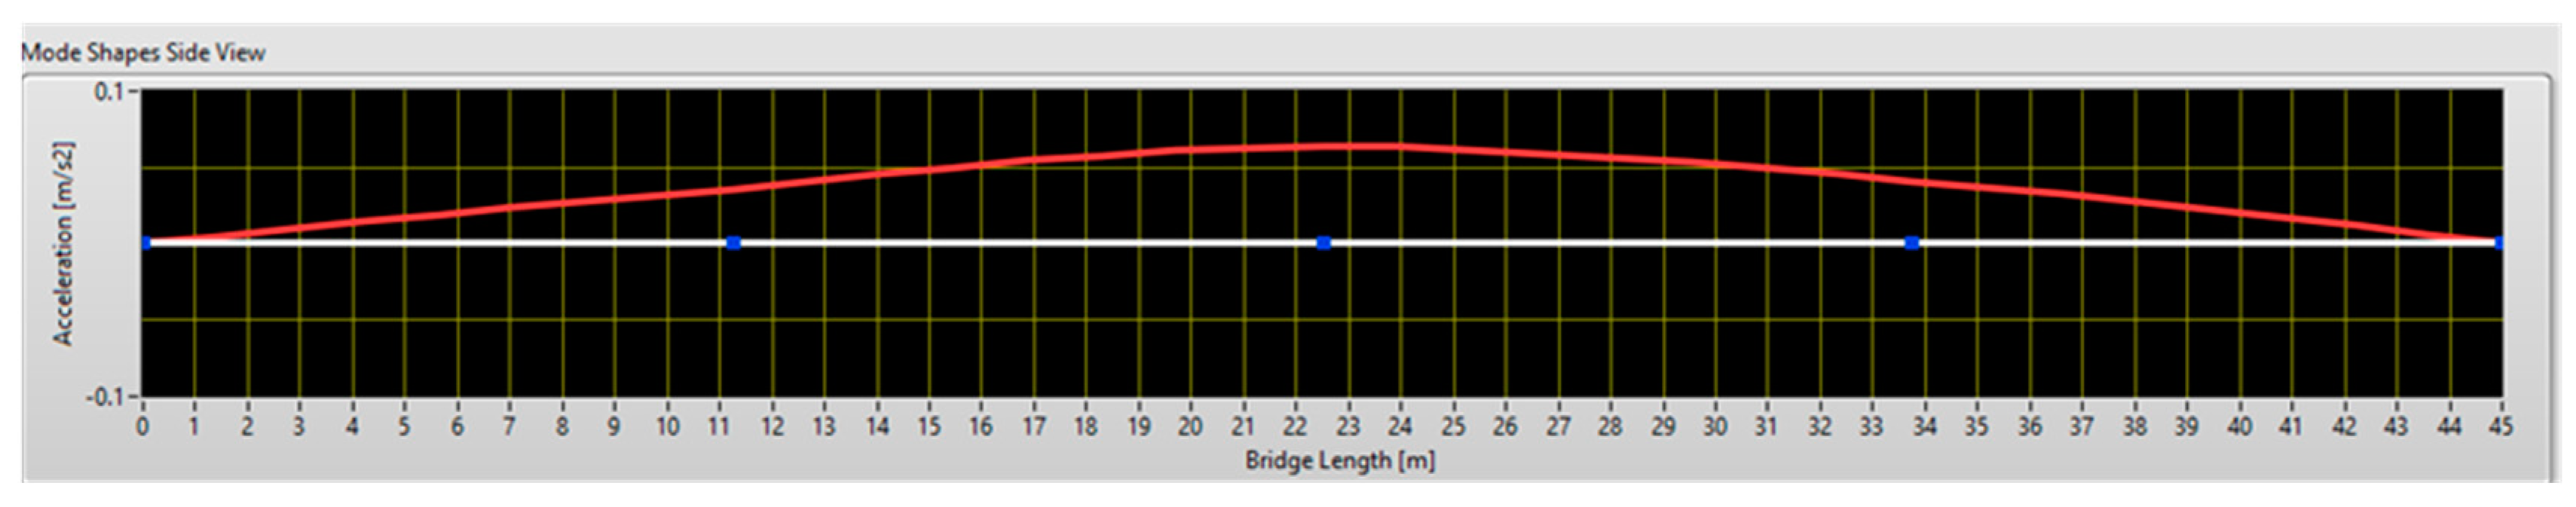
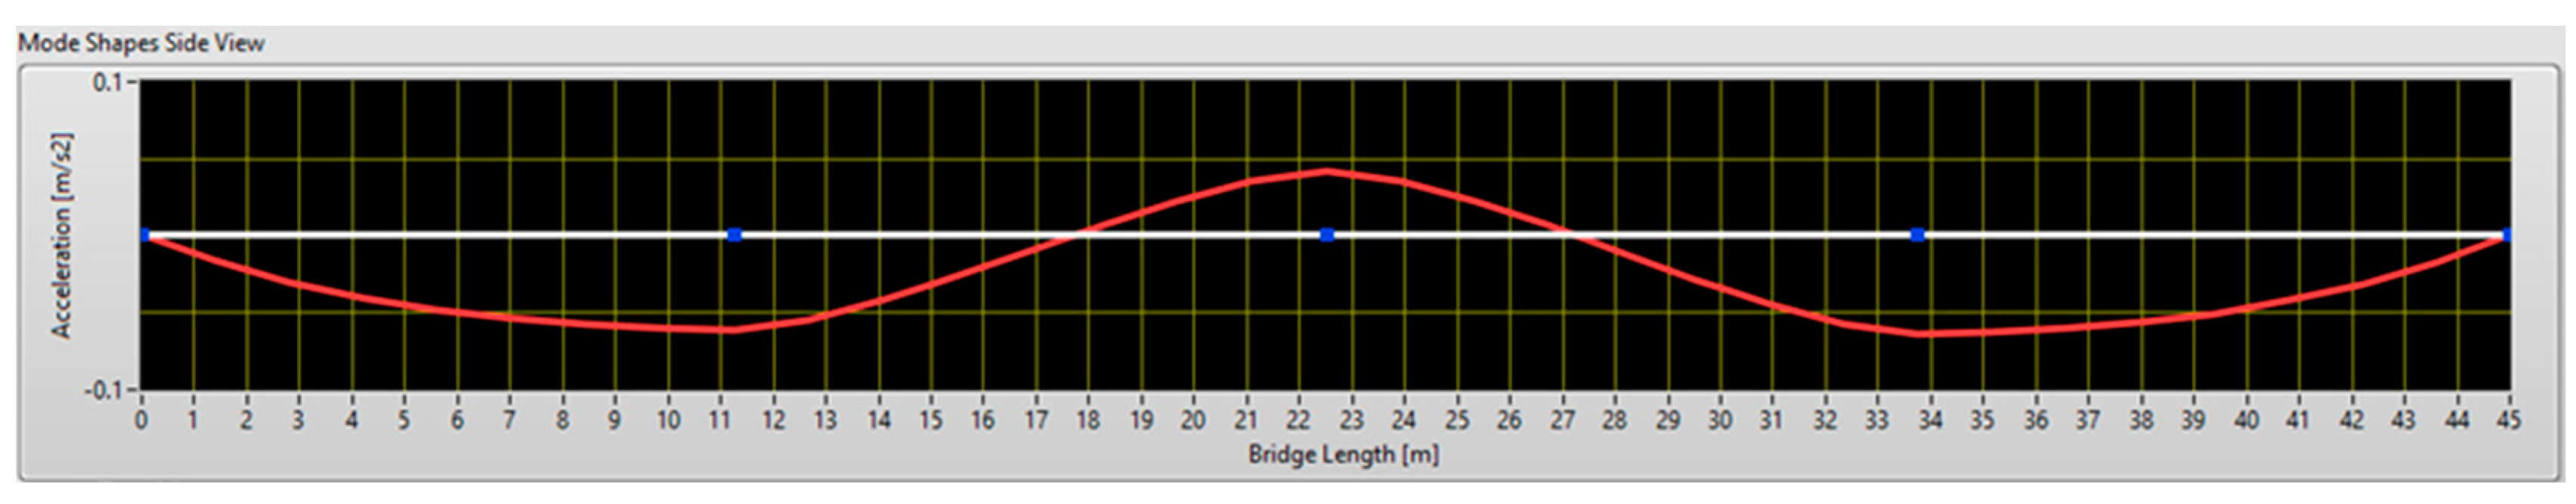
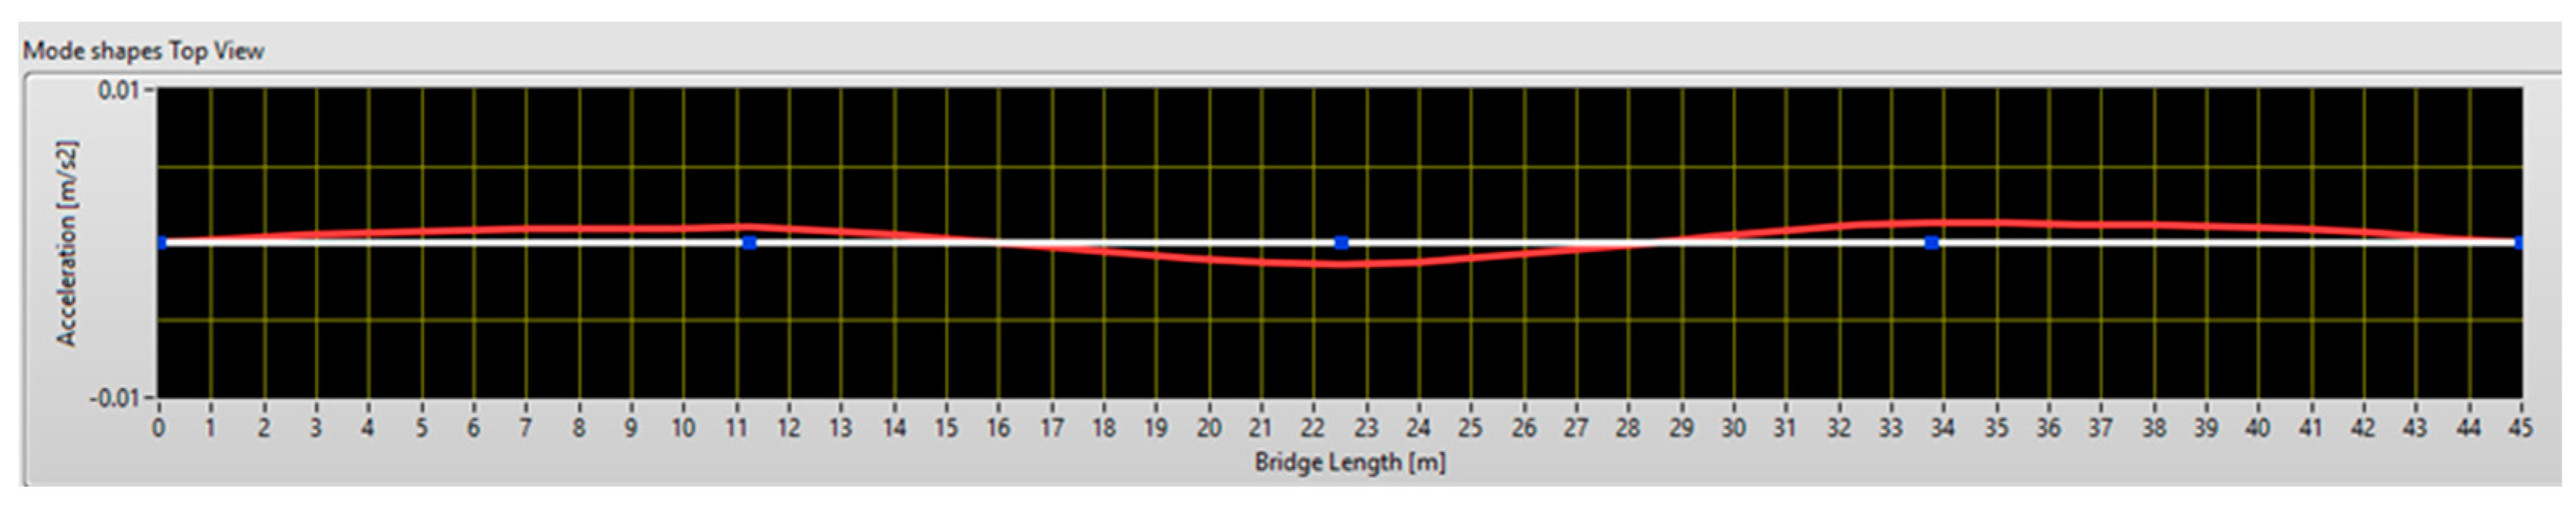
5.4. Eigenmodes
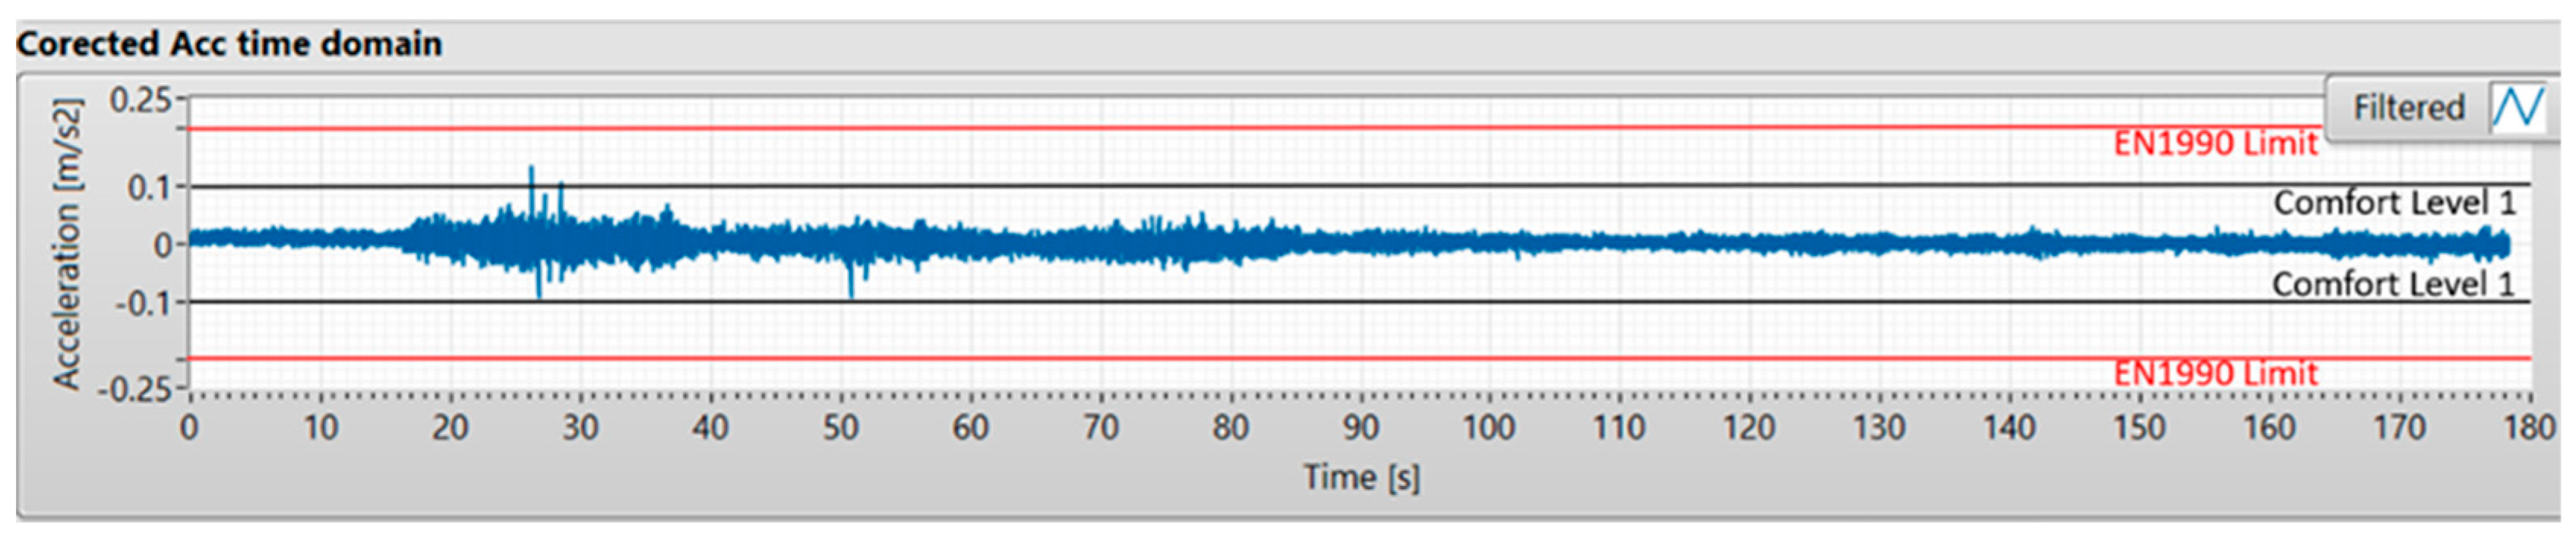
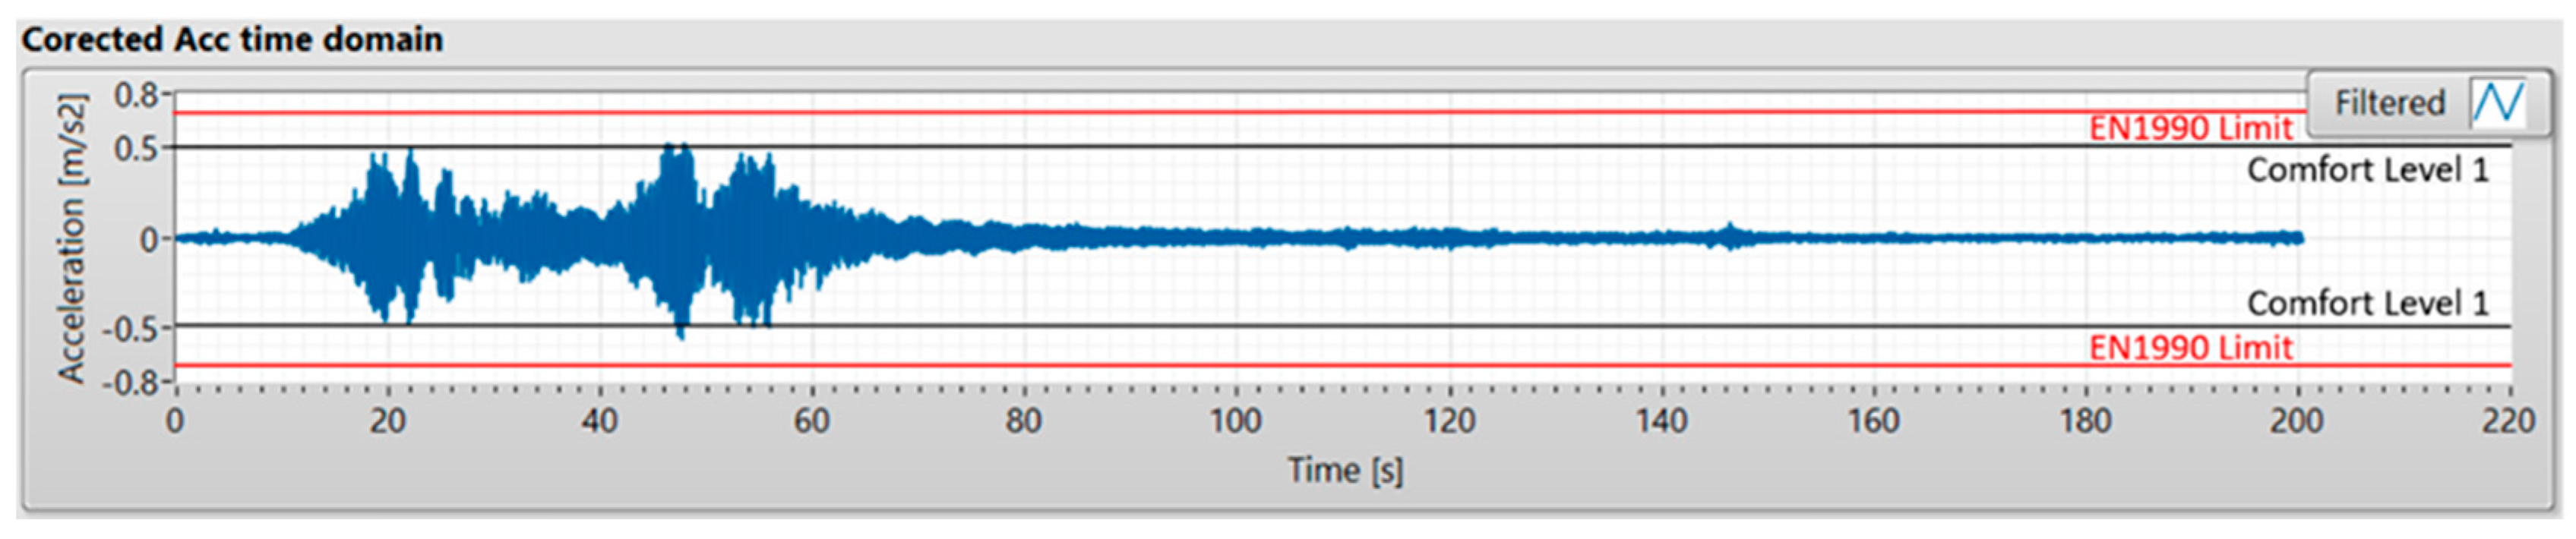
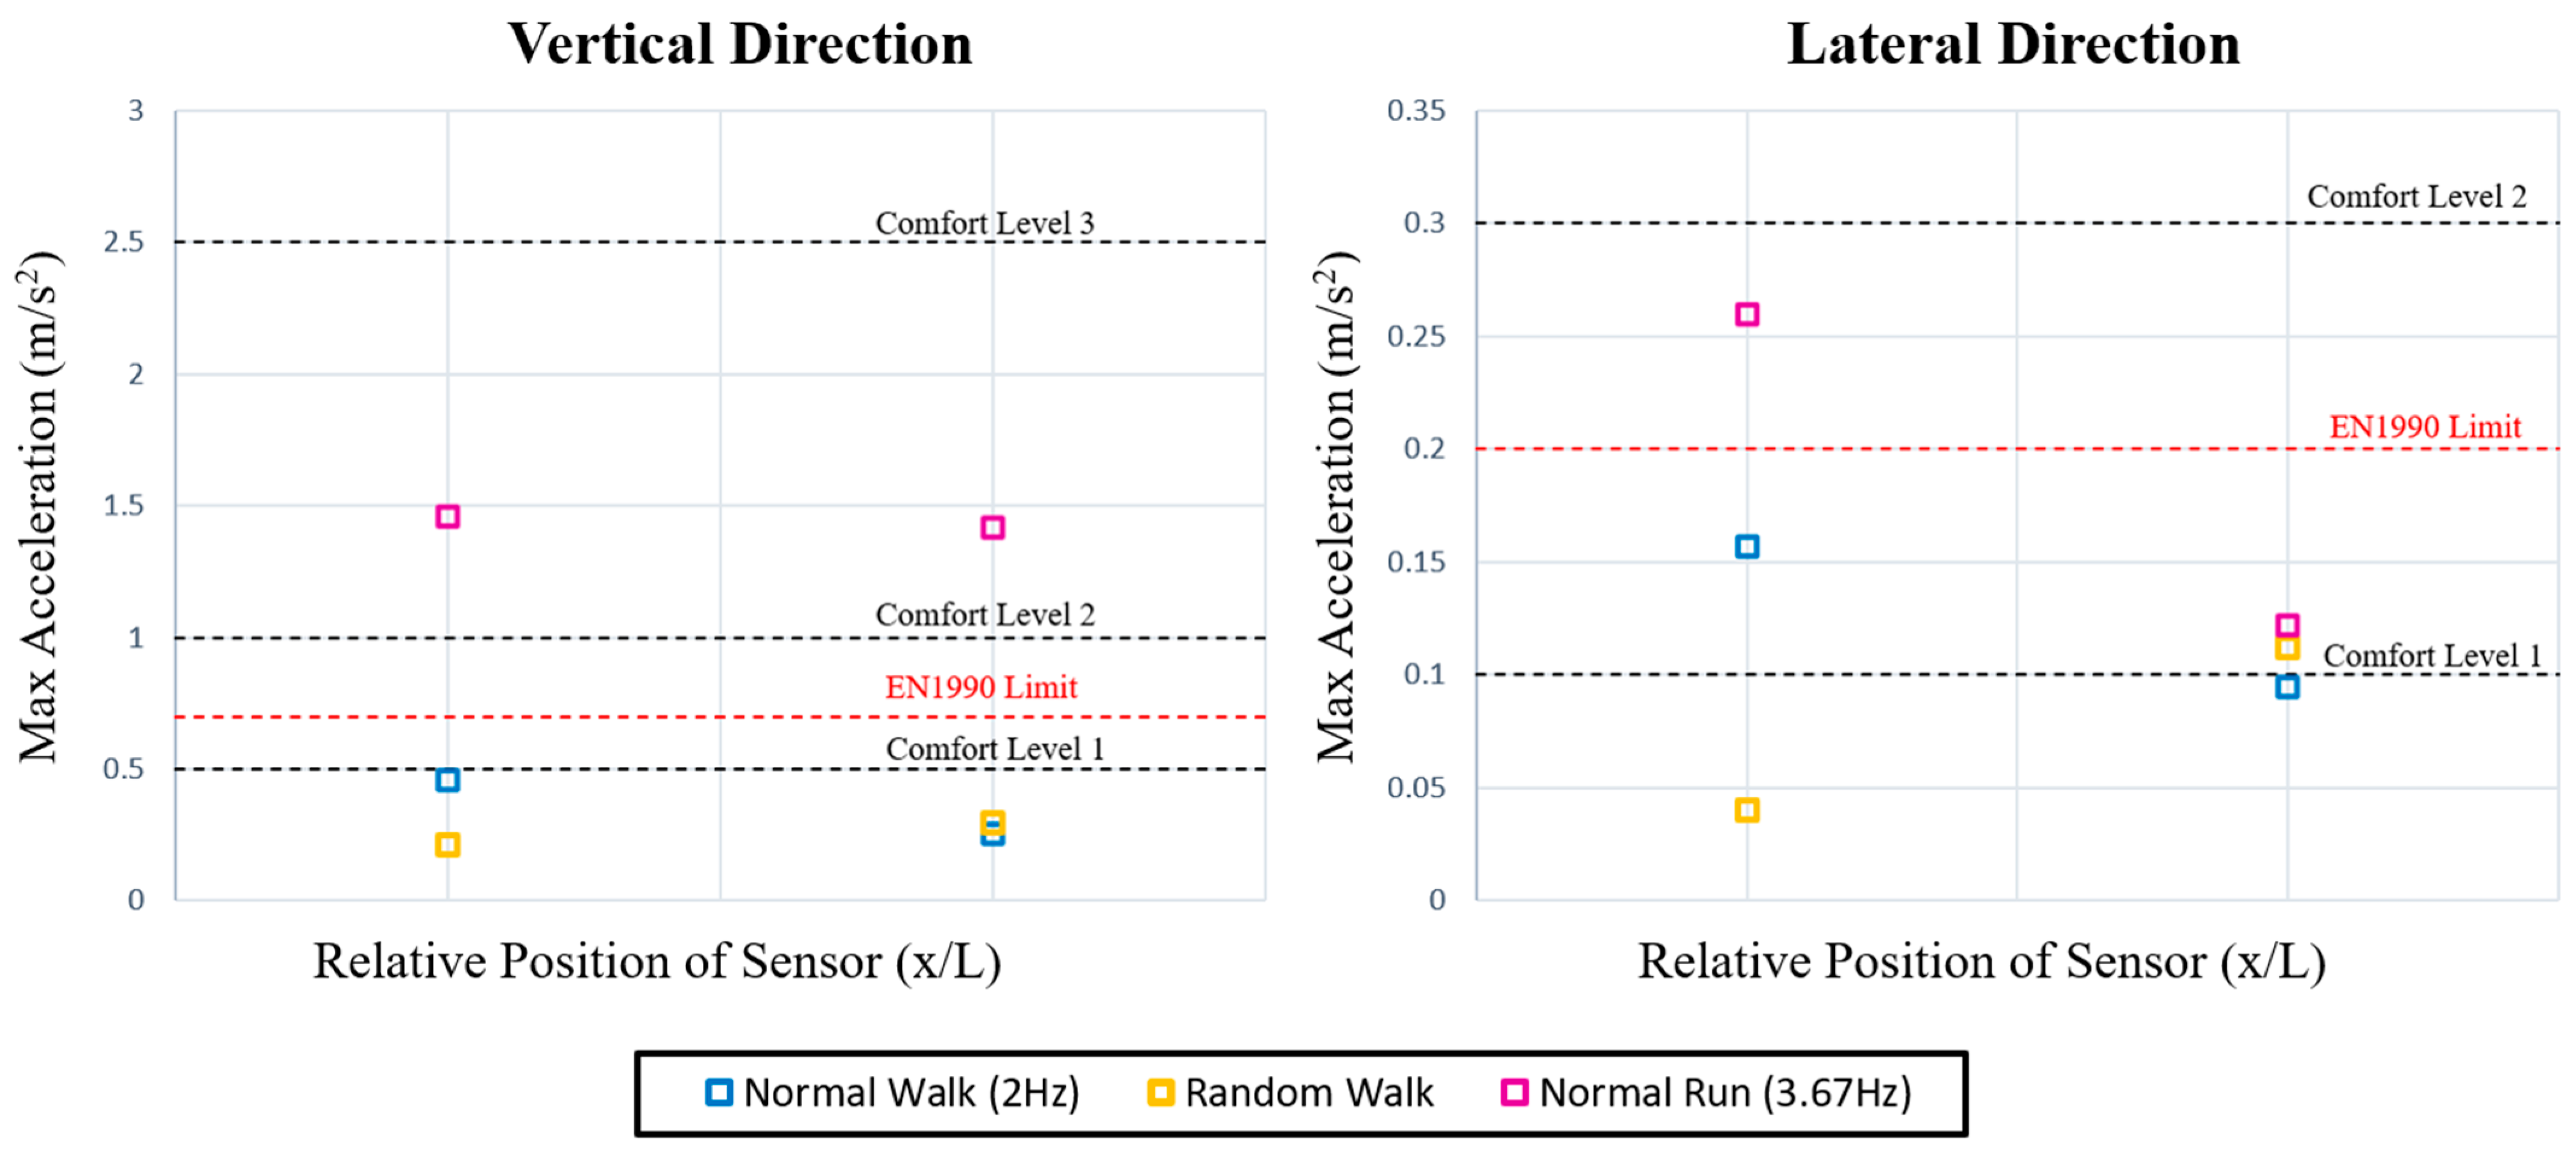
5.5. Comfort Level
- For vertical vibrations, 0.7 m/s2.
- For horizontal vibrations resulting from typical use, 0.2 m/s2.
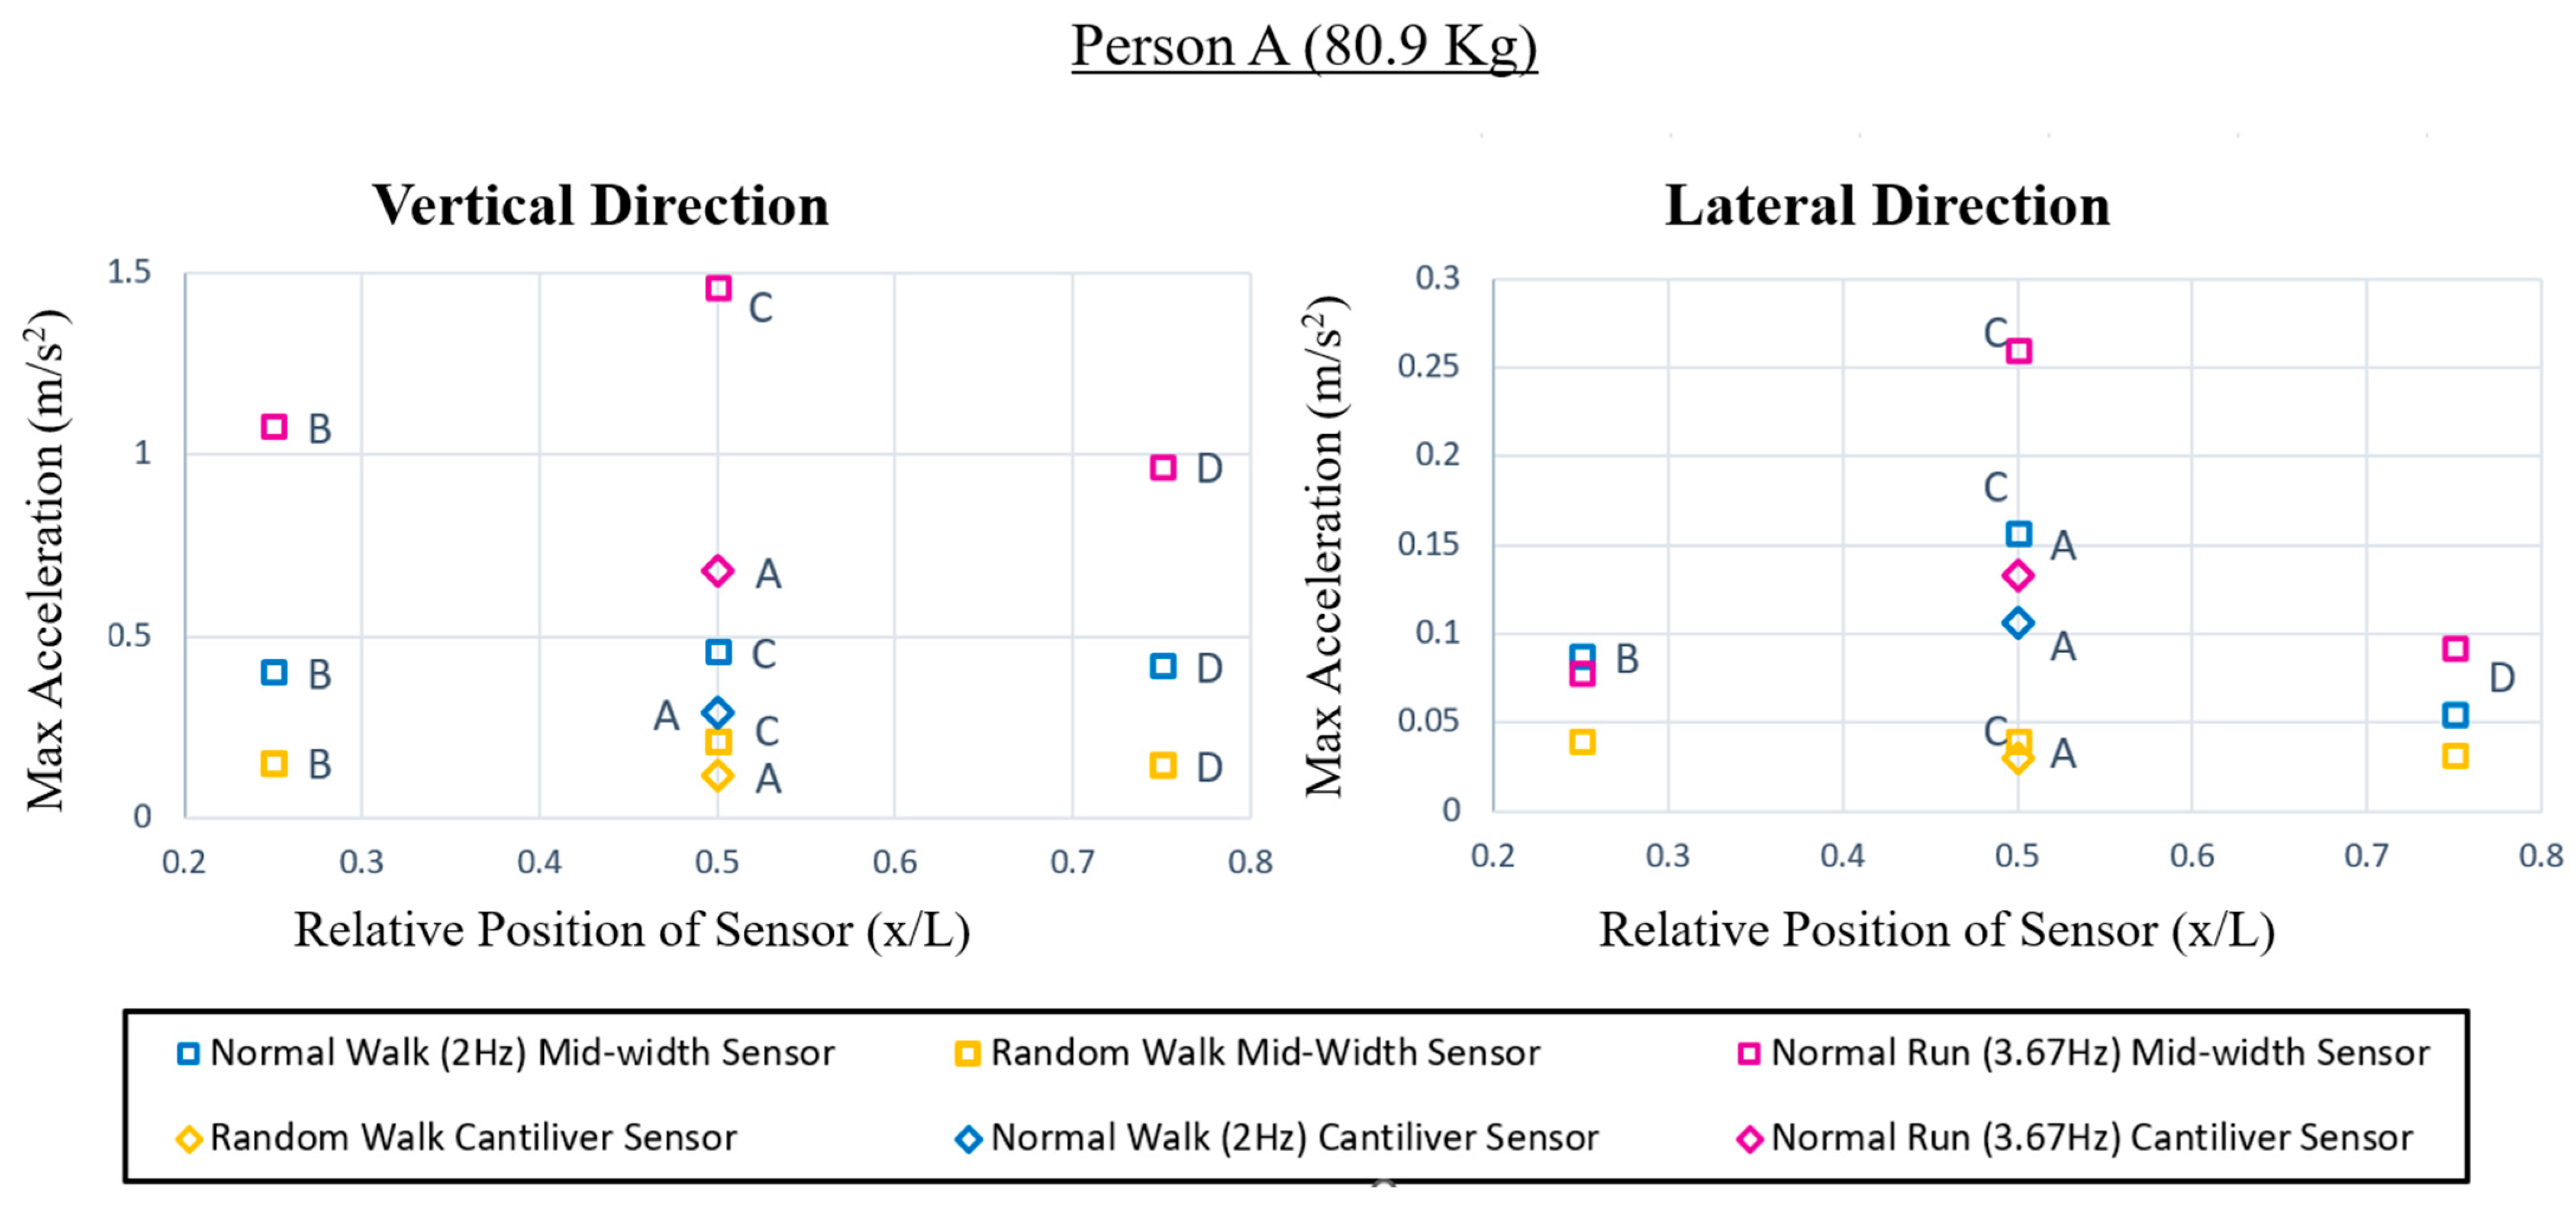
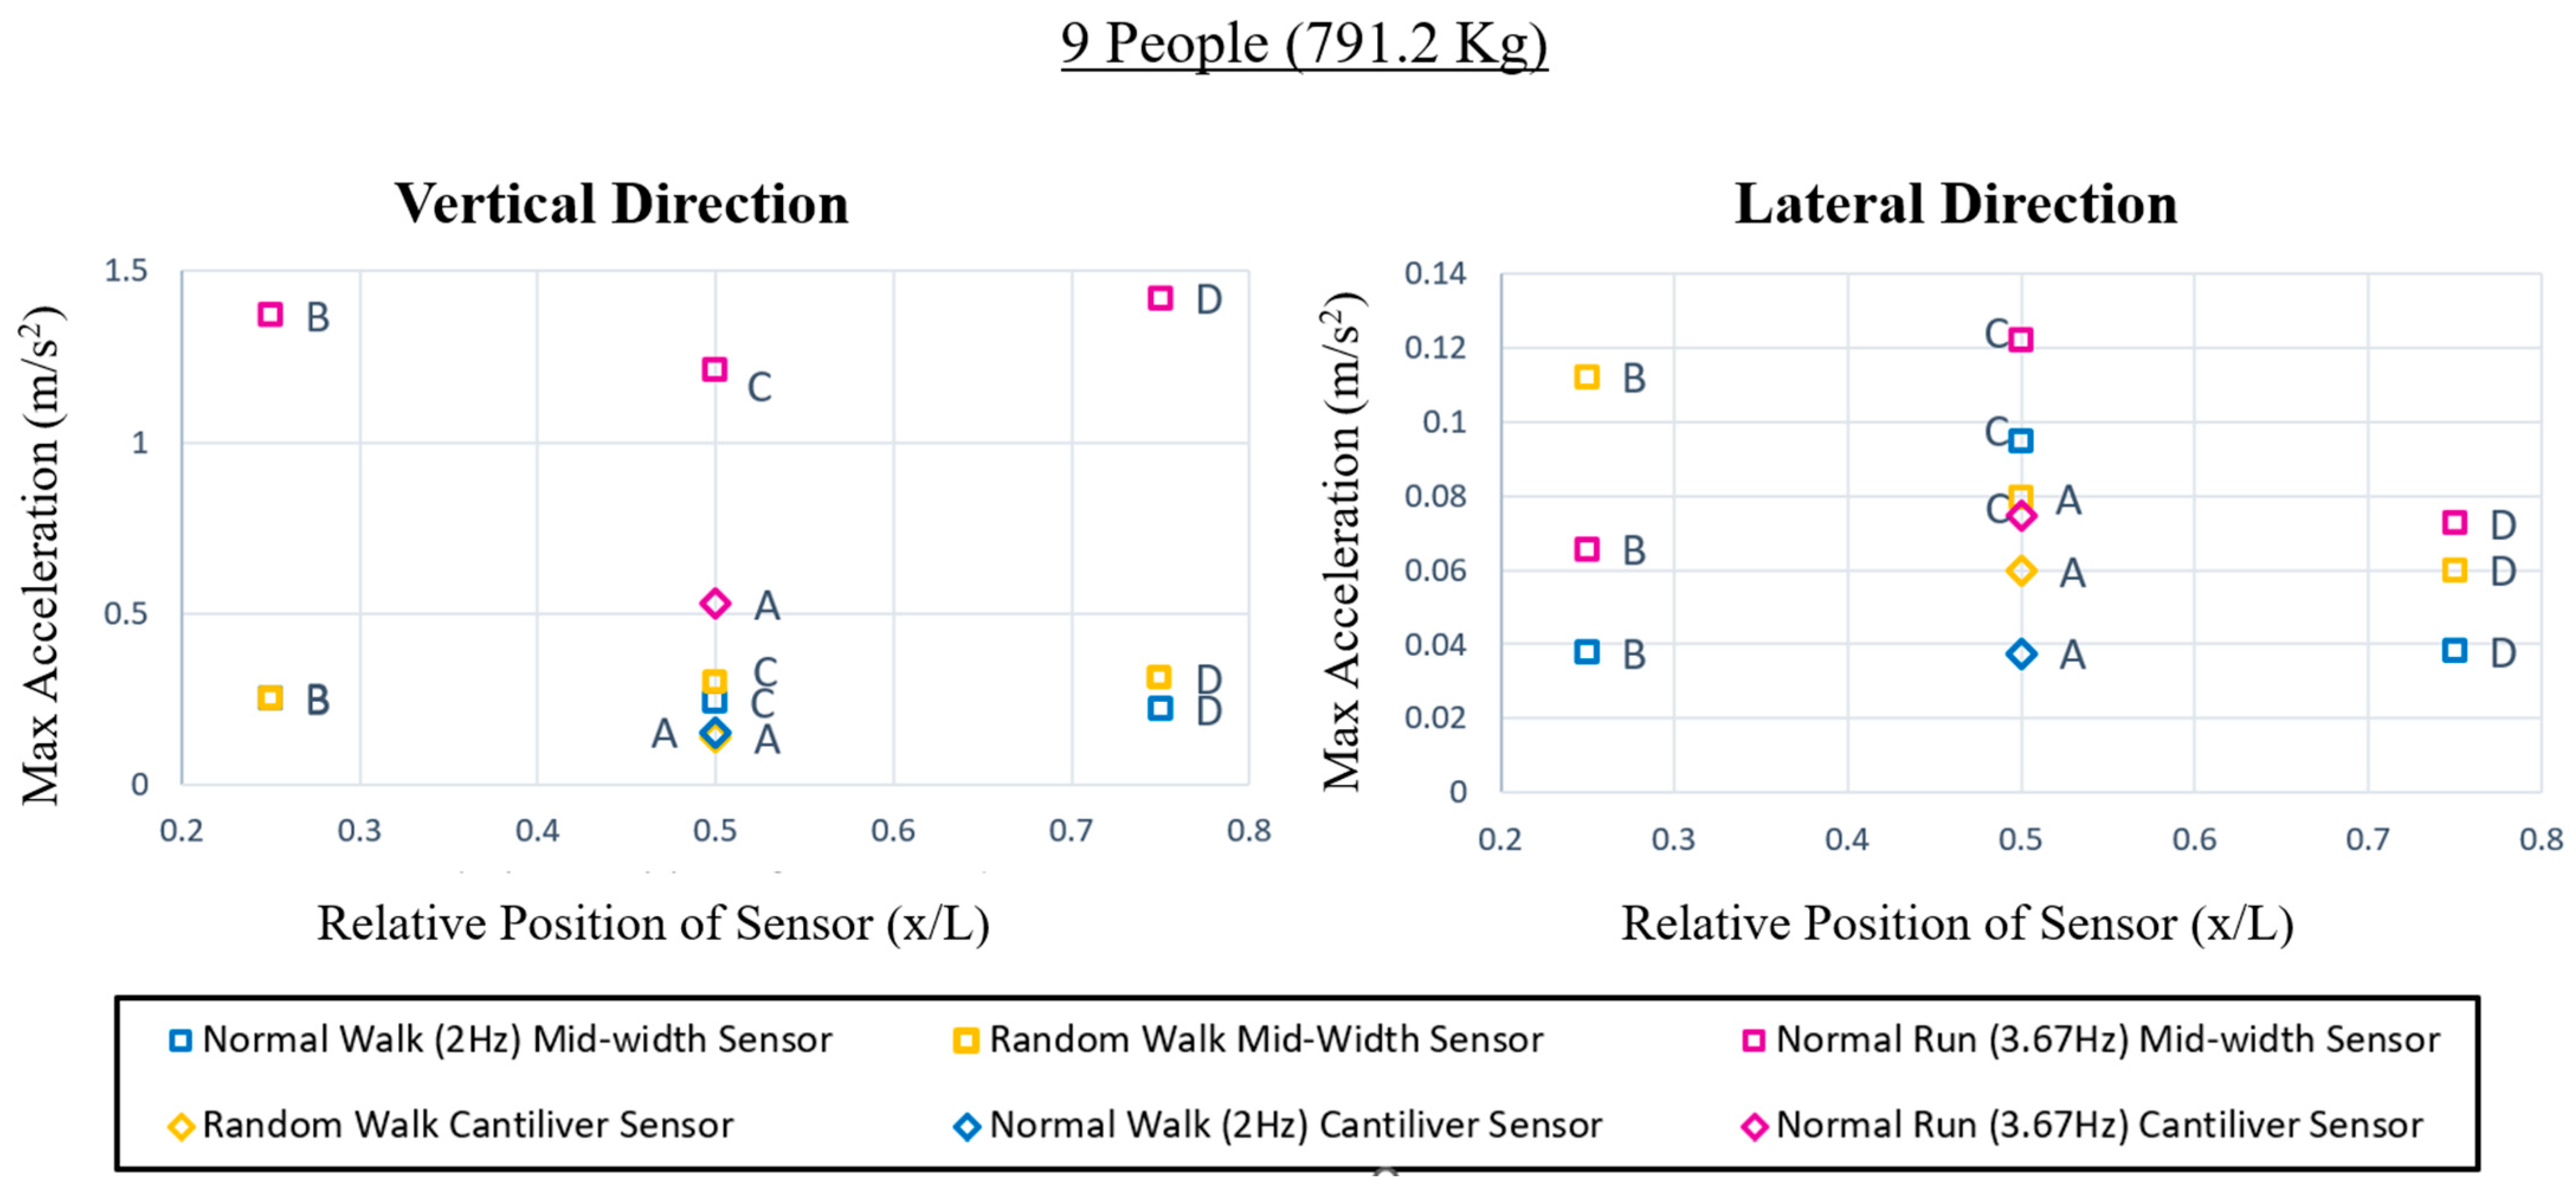
5.6. Spatial Distribution of Maximum Accelerations
5.7. Comfort Level Control
6. Conclusions
Supplementary Materials
Author Contributions
Funding
Data Availability Statement
Conflicts of Interest
References
- Lu, P.; Zhou, Y.; Wu, Y.; Li, D.; Zhou, C. Vibration reduction using tuned mass dampers in composite steel box girder footbridge with self-anchored suspension. Int. J. Struct. Stab. Dyn. 2021, 21, 2150110. [Google Scholar] [CrossRef]
- Caprani, C.C.; Ahmadi, E. Formulation of human–structure interaction system models for vertical vibration. J. Sound Vib. 2016, 377, 346–367. [Google Scholar] [CrossRef]
- Morichika, S.; Sekiya, H.; Zhu, Y.; Hirano, S.; Maruyama, O. Estimation of displacement response in steel plate girder bridge using a single MEMS accelerometer. IEEE Sens. J. 2021, 21, 8204–8208. [Google Scholar] [CrossRef]
- Liu, Y.; Bao, Y. Review of electromagnetic waves-based distance measurement technologies for remote monitoring of civil engineering structures. Measurement 2021, 176, 109193. [Google Scholar] [CrossRef]
- Gao, J.; Li, D.; Feng, Y.; Wan, L.; Wu, G. Application and Research of Health Monitoring System of Xiangshan Port Bridge. In Proceedings of the IOP Conference Series: Earth and Environmental Science, Nanchang, China, 12 April 2021; IOP Publishing: Bristol, UK; Volume 719, p. 032098. [Google Scholar]
- Ko, J.M.; Ni, Y.Q. Technology developments in structural health monitoring of large-scale bridges. Eng. Struct. 2005, 27, 1715–1725. [Google Scholar] [CrossRef]
- Li, H.N.; Li, D.S.; Song, G.B. Recent applications of fiber optic sensors to health monitoring in civil engineering. Eng. Struct. 2004, 26, 1647–1657. [Google Scholar] [CrossRef]
- Caicedo, J.M.; Marulanda, J.; Thomson, P.; Dyke, S.J. Monitoring of bridges to detect changes in structural health. In Proceedings of the 2001 American Control Conference, Arlington, VA, USA, 25–27 June 2001; IEEE: Piscataway, NJ, USA; Volume 1 (Cat. No. 01CH37148), pp. 453–458. [Google Scholar] [CrossRef]
- Li, Z.X.; Chan, T.H.; Ko, J.M. Fatigue analysis and life prediction of bridges with structural health monitoring data—Part I: Methodology and strategy. Int. J. Fatigue 2001, 23, 45–53. [Google Scholar] [CrossRef]
- Basharat, A.; Catbas, N.; Shah, M. A framework for intelligent sensor network with video camera for structural health monitoring of bridges. In Proceedings of the Third IEEE International Conference on Pervasive Computing and Communications Workshops, Kauai, HI, USA, 8–12 March 2005; IEEE: Piscataway, NJ, USA; pp. 385–389. [Google Scholar] [CrossRef]
- Park, K.T.; Kim, S.H.; Park, H.S.; Lee, K.W. The determination of bridge displacement using measured acceleration. Eng. Struct. 2005, 27, 371–378. [Google Scholar] [CrossRef]
- Peeters, B.; Maeck, J.; De Roeck, G. Vibration-based damage detection in civil engineering: Excitation sources and temperature effects. Smart Mater. Struct. 2001, 10, 518. [Google Scholar] [CrossRef]
- Matsuoka, K.; Collina, A.; Somaschini, C.; Sogabe, M. Influence of local deck vibrations on the evaluation of the maximum acceleration of a steel-concrete composite bridge for a high-speed railway. Eng. Struct. 2019, 200, 109736. [Google Scholar] [CrossRef]
- Bačinskas, D.; Kamaitis, Z.; Kilikevičius, A. A sensor instrumentation method for dynamic monitoring of railway bridges. J. Vibroengineering 2013, 15, 176–184. [Google Scholar]
- Brownjohn, J.M.W.; De Stefano, A.; Xu, Y.L.; Wenzel, H.; Aktan, A.E. Vibration-based monitoring of civil infrastructure: Challenges and successes. J. Civil. Struct. Health Monit. 2011, 1, 79–95. [Google Scholar] [CrossRef]
- Xia, H.; Zhang, N.; Gao, R. Experimental analysis of railway bridge under high-speed trains. J. Sound Vib. 2005, 282, 517–528. [Google Scholar] [CrossRef]
- Chaudhari, P.K.; Patel, D.; Patel, V. Theoretical and software-based comparison of cantilever beam: Modal analysis. Int. J. Innov. Res. Adv. Eng. 2014, 1, 75–79. [Google Scholar]
- Xia, Y.; Li, H.; Fan, Z.; Xiao, J. Modal parameter identification based on hilbert vibration decomposition in vibration stability of bridge structures. Adv. Civ. Eng. 2021, 2021, 6688686. [Google Scholar] [CrossRef]
- Pirskawetz, S.M.; Schmidt, S. Detection of wire breaks in prestressed concrete bridges by Acoustic Emission analysis. Dev. Built Environ. 2023, 14, 100151. [Google Scholar] [CrossRef]
- Doebling, S.W.; Farrar, C.R.; Prime, M.B.; Shevitz, D.W. Damage Identification and Health Monitoring of Structural and Mechanical Systems from Changes in Their Vibration Characteristics: A Literature Review; USDOE: Washington, DC, USA, 1996. [CrossRef]
- Gentile, C.; Saisi, A. Ambient vibration testing of historic masonry towers for structural identification and damage assessment. Constr. Build. Mater. 2007, 21, 1311–1321. [Google Scholar] [CrossRef]
- Gentile, C.; Saisi, A.; Cabboi, A. Structural identification of a masonry tower based on operational modal analysis. Int. J. Archit. Herit. 2015, 9, 98–110. [Google Scholar] [CrossRef]
- Foti, D. Non-destructive techniques and monitoring for the evolutive damage detection of an ancient masonry structure. Key Eng. Mater. 2015, 628, 168–177. [Google Scholar] [CrossRef]
- Lacanna, G.; Ripepe, M.; Coli, M.; Genco, R.; Marchetti, E. Full structural dynamic response from ambient vibration of Giotto’s bell tower in Firenze (Italy), using modal analysis and seismic interferometry. NDT E Int. 2019, 102, 9–15. [Google Scholar] [CrossRef]
- Bayraktar, A.; Türker, T.; Altunişik, A.C. Experimental frequencies and damping ratios for historical masonry arch bridges. Constr. Build. Mater. 2015, 75, 234–241. [Google Scholar] [CrossRef]
- González, A.; Feng, K.; Casero, M. Effective separation of vehicle, road and bridge information from drive-by acceleration data via the power spectral density resulting from crossings at various speeds. Dev. Built Environ. 2023, 14, 100162. [Google Scholar] [CrossRef]
- Zäll, E.; Andersson, A.; Ülker-Kaustell, M.; Karoumi, R. An efficient approach for considering the effect of human-structure interaction on footbridges. Procedia Eng. 2017, 199, 2913–2918. [Google Scholar] [CrossRef]
- Živanović, S. Modelling human actions on lightweight structures: Experimental and numerical developments. In Proceedings of the MATEC Web of Conferences, Dübendorf (Zürich), Switzerland, 19–21 October 2015; EDP Sciences: Les Ulis, France; Volume 24. [Google Scholar] [CrossRef]
- Dallard, P.; Fitzpatrick, T.; Flint, A.; Low, A.; Smith, R.R.; Willford, M.; Roche, M. London Millennium Bridge: Pedestrian-induced lateral vibration. J. Bridge Eng. 2001, 6, 412–417. [Google Scholar] [CrossRef]
- Willford, M. Solving the vibration problems of the London Millennium footbridge. In Schwingungen in der Baupraxis: 12; Dresdner Baustatik-Seminar: Dresden, Germany, 2008; pp. 157–179. [Google Scholar]
- Wieczorek, N.; Gerasch, W.J.; Rolfes, R.; Kammerer, H. Semiactive friction damper for lightweight pedestrian bridges. J. Struct. Eng. 2014, 140, 04013102. [Google Scholar] [CrossRef]
- Jones, R.T.; Pretlove, A.J. Two case studies in the use of tuned vibration absorbers on foot bridges. Struct. Engineer. Part B 1981, 59, 27–32. Available online: http://worldcat.org/issn/00392553 (accessed on 16 September 2023).
- Caetano, E.; Cunha, Á.; Magalhães, F.; Moutinho, C. Studies for controlling human-induced vibration of the Pedro e Inês footbridge, Portugal. Part 1: Assessment of dynamic behaviour. Eng. Struct. 2010, 32, 1069–1081. [Google Scholar] [CrossRef]
- Caetano, E.; Cunha, Á.; Moutinho, C.; Magalhães, F. Studies for controlling human-induced vibration of the Pedro e Inês footbridge, Portugal. Part 2: Implementation of tuned mass dampers. Eng. Struct. 2010, 32, 1082–1091. [Google Scholar] [CrossRef]
- Tubino, F.; Carassale, L.; Piccardo, G. Human-induced vibrations on two lively footbridges in Milan. J. Bridge Eng. 2016, 21, C4015002. [Google Scholar] [CrossRef]
- Feng, P.; Wang, Z.; Jin, F.; Zhu, S. Vibration serviceability assessment of pedestrian bridges based on comfort level. J. Perform. Constr. Facil. 2019, 33, 04019046. [Google Scholar] [CrossRef]
- Wright, D.T.; Green, R. Human Sensitivity to Vibration; No. 7; Queen’s University: Kingston, ON, Canada, 1959. [Google Scholar]
- Smith, J.W. Vibration of Structures: Applications in Civil Engineering Design; Chapman & Hall: New York, NY, USA, 1988. [Google Scholar]
- Wheeler, J.E. Prediction and control of pedestrian-induced vibration in footbridges. J. Struct. Div. 1982, 108, 2045–2065. [Google Scholar] [CrossRef]
- Dey, P.; Narasimhan, S.; Walbridge, S. Evaluation of design guidelines for the serviceability assessment of aluminum pedestrian bridges. J. Bridge Eng. 2017, 22, 04016109. [Google Scholar] [CrossRef]
- Anon, B. SS ISO 2631(1); Mechanical Vibration and Shock-Evaluation of HUMAN Exposure to Whole-Body Vibration. International Organization for Standardization: Geneva, Switzerland, 1997.
- Wang, W.; Yan, W.; Deng, L.; Kang, H. Dynamic analysis of a cable-stayed concrete-filled steel tube arch bridge under vehicle loading. J. Bridge Eng. 2015, 20, 04014082. [Google Scholar] [CrossRef]
- Feldman, M. HiVOSS—Human-Induced Vibrations of Steel Structures-Design of Footbridges: Guideline; Office for Official Publications of the European Communities: Luxembourg, 2008. Available online: http://www.stb.rwth-aachen.de/projekte/2007/HIVOSS/download.php.ISO (accessed on 20 April 2023).
- Sétra—Service D’études sur les Transports, les Routes et Leurs Aménagements; Assessment of Vibrational Behaviour of Footbridges under Pedestrian Loading; Technical Guide; Sétra: Paris, France, 2006; Available online: https://www.academia.edu/40689257/S%C3%A9tra_Footbridges_Assessment_of_vibrational_behaviour_of_footbridges_under_pedestrian_loading (accessed on 20 April 2023).
- Van Nimmen, K.; Lombaert, G.; De Roeck, G.; Van den Broeck, P. Vibration serviceability of footbridges: Evaluation of the current codes of practice. Eng. Struct. 2014, 59, 448–461. [Google Scholar] [CrossRef]
- El Dahr, R.; Lignos, X.; Papavieros, S.; Vayas, I. Design and Validation of an Accurate Low-Cost Data Acquisition System for Structural Health Monitoring of a Pedestrian Bridge. J. Civ. Eng. Constr. 2022, 11, 113–126. [Google Scholar] [CrossRef]
- El Dahr, R.; Lignos, X.; Papavieros, S.; Vayas, I. Development and Validation of a LabVIEW Automated Software System for Displacement and Dynamic Modal Parameters Analysis Purposes. Modelling 2023, 4, 189–210. [Google Scholar] [CrossRef]
- EN 1990 (English): Eurocode—Basis of Structural Design; Authority: The European Union Per Regulation 305/2011, Directive 98/34/EC, Directive 2004/18/EC. 2002. Available online: https://www.phd.eng.br/wp-content/uploads/2015/12/en.1990.2002.pdf (accessed on 20 April 2023).
- Hinrichsen, P.F. Acceleration, velocity, and displacement for magnetically damped oscillations. Phys. Teach. 2019, 57, 250–253. [Google Scholar] [CrossRef]


| Pedestrian: Mass [Kg] | Position | Type/Frequency |
|---|---|---|
| A: 80.9 Kg B: 94.8 Kg C: 103.6 Kg | 0.5 L | Impact Jump |
| 0.5 L | 3.67 Hz foot to foot | |
| 0.5 L | 2 Hz foot to foot | |
| 0.25 L | Impact Jump | |
| 0.25 L | 3.67 Hz foot to foot | |
| 0.25 L | 2 Hz foot to foot | |
| Six Pedestrians: 543.1 Kg | 0.5 L | Impact Jump |
| 0.5 L | 3.67 Hz foot to foot | |
| 0.25 L | Impact Jump | |
| 0.25 L | 3.67 Hz foot to foot |
| Pedestrian: Mass [Kg] | Type/Frequency | Path |
|---|---|---|
| A: 80.9 Kg | 2.0 Hz Walk |  |
| B: 94.8 Kg | 3.67 Hz Walk | |
| C: 103.6 Kg | Random Walk | |
| Nine Pedestrians: 791.2 Kg | 2.0 Hz Walk | |
| 3.67 Hz Walk | ||
| Random Walk |
| Frequency [Hz] | ||||||
|---|---|---|---|---|---|---|
| Vertical Oscillations | Lateral Oscillations | |||||
| Coordination Risk | EN 1990 | HIVOSS | SETRA | EN 1990 | HIVOSS | SETRA |
| Negligible | >5 | <1.25 >4.6 | <1.0 >5.0 | >2.5 | <0.5 >1.2 | <0.3 >2.5 |
| Small | <5 | 1.25–4.6 | 2.6–5.0 | <2.5 | 0.5–1.2 | 1.3–2.5 |
| Medium | 1.0–1.7 2.1–2.6 | 0.3–0.5 1.1–1.3 | ||||
| Big | 1.7–2.1 | 0.5–1.1 | ||||
| Eigen Frequency | Frequency [Hz] | Coordination Risk | ||||||
|---|---|---|---|---|---|---|---|---|
| Vertical | Lateral | Vertical | Lateral | |||||
| EN 1990 | HIVOSS | SETRA | EN 1990 | HIVOSS | SETRA | |||
| 1st | 3.67 | 6.18 | Intermediate | Intermediate | Small | Negligible | Negligible | Negligible |
| 2nd | 7.62 | 7.62 | Negligible | Negligible | Negligible | Negligible | Negligible | Negligible |
| 3rd | 10.22 | 10.22 | Negligible | Negligible | Negligible | Negligible | Negligible | Negligible |
| Eigenfrequency | Damping Ratio [%] | |
|---|---|---|
| Vertical Direction | Lateral Direction | |
| 1st | 2.25 | 1.93 |
| 2nd | 1.45 | 1.14 |
| Comfort Level | Degree of Comfort | Acceleration [m/s2] | |||
|---|---|---|---|---|---|
| Vertical Direction | Lateral Direction | ||||
| EN 1990 | SETRA | EN 1990 | SETRA | ||
| 1 | Maximum | 0.7 | <0.5 | 0.2 | <0.1 |
| 2 | Medium | 0.5–1.0 | 0.1–0.3 | ||
| 3 | Minimum | 1.0–2.5 | 0.3–0.8 | ||
| 4 | Not acceptable | >2.5 | >0.8 | ||
Disclaimer/Publisher’s Note: The statements, opinions and data contained in all publications are solely those of the individual author(s) and contributor(s) and not of MDPI and/or the editor(s). MDPI and/or the editor(s) disclaim responsibility for any injury to people or property resulting from any ideas, methods, instructions or products referred to in the content. |
© 2023 by the authors. Licensee MDPI, Basel, Switzerland. This article is an open access article distributed under the terms and conditions of the Creative Commons Attribution (CC BY) license (https://creativecommons.org/licenses/by/4.0/).
Share and Cite
El Dahr, R.; Lignos, X.; Papavieros, S.; Vayas, I. Dynamic Assessment of the Structural Behavior of a Pedestrian Bridge Aiming to Characterize and Evaluate Its Comfort Level. Buildings 2023, 13, 3053. https://doi.org/10.3390/buildings13123053
El Dahr R, Lignos X, Papavieros S, Vayas I. Dynamic Assessment of the Structural Behavior of a Pedestrian Bridge Aiming to Characterize and Evaluate Its Comfort Level. Buildings. 2023; 13(12):3053. https://doi.org/10.3390/buildings13123053
Chicago/Turabian StyleEl Dahr, Reina, Xenofon Lignos, Spyridon Papavieros, and Ioannis Vayas. 2023. "Dynamic Assessment of the Structural Behavior of a Pedestrian Bridge Aiming to Characterize and Evaluate Its Comfort Level" Buildings 13, no. 12: 3053. https://doi.org/10.3390/buildings13123053
APA StyleEl Dahr, R., Lignos, X., Papavieros, S., & Vayas, I. (2023). Dynamic Assessment of the Structural Behavior of a Pedestrian Bridge Aiming to Characterize and Evaluate Its Comfort Level. Buildings, 13(12), 3053. https://doi.org/10.3390/buildings13123053