Article

Temporary Structural Health Monitoring of Historical Széchenyi Chain Bridge

Department of Structural Engineering, Faculty of Civil Engineering, Budapest University of Technology and Economics, Műegyetem rkp. 3, 1111 Budapest, Hungary
*
Author to whom correspondence should be addressed.
Buildings 2024, 14(2), 535; https://doi.org/10.3390/buildings14020535
Submission received: 8 January 2024 / Revised: 2 February 2024 / Accepted: 5 February 2024 / Published: 17 February 2024
(This article belongs to the Special Issue Advances in Research on Structural Dynamics and Health Monitoring)

Abstract

:
A temporary monitoring system was installed on the 175-year-old historical Széchenyi Chain Bridge during its reconstruction. The bridge is in the downtown area in the capital city of Hungary and plays a significant role in the city life of Budapest. Six-month-long measurements were conducted during the reconstruction process of the bridge, yielding crucial insights into the structural behaviour of the historical structure. The measurement results were evaluated; the findings encompass the rotation capacity of the pins between the chain elements and the structural response to temperature changes. This information helped the decision-making between 2021 and 2023 by the designers and construction company during the reconstruction. For instance, daily temperature fluctuations resulted in increased bending moments in the chain elements, rising up to 158% compared to the values observed during a proof load test in 2018. Furthermore, the measurements reveal an approximate 42% increase in normal forces compared to the proof load test, which highlights the high sensitivity of chain bridges to temperature fluctuations, where geometric stiffness plays a crucial role. Reconstruction, namely reducing self-weight, notably intensifies the impact on normal forces and bending moments. These outcomes strongly emphasize the dominance of the dead load and self-weight in the case of chain bridges.

1. Introduction

The historical Széchenyi Chain Bridge is a 175-year-old structure in Budapest, Hungary, which has a vital role in the life of the city. The road bridge spanning the Danube River sees substantial daily vehicular traffic, serving as a major link between Buda and Pest. Its construction began in 1839 and was finished in 1849. It was renowned as the most extensive chain bridge of its era, featuring a maximum mid-span of 202.60 m (Figure 1). Currently, only the Hercílio Luz Bridge in Brazil (339 m) and the Clifton Suspension Bridge in England (214 m) surpass it in terms of span.
Subsequently, the bridge has undergone several renovations. The original bridge was the first permanent bridge in the capital city of Hungary; it operated until 1913. The original structure lacked a stiffening girder, and a lightweight timber deck system was used, resulting in noticeable bridge deck vibrations. Therefore, a new supporting structure was designed, incorporating twenty-five carbon steel chain bars between each node. It resulted in doubling the length of the chain bars and an increased load-bearing capacity compared to the previous structure; thus, the distance between the pins and the suspension bars increased from 1.8 m to 3.6 m. The total mass of the ironwork increased to 5200 tonnes following the introduction of a new truss stiffening girder made of carbon steel, with the ultimate strength ranging between 480 and 560 MPa. Additionally, a reinforced concrete deck was also installed on the superstructure (Figure 2a). The bridge was destroyed in 1945 during World War II. Nevertheless, it was rebuilt without any significant changes to the structural system, and it was re-opened for traffic in 1949.
The Budapest University of Technology and Economics, Department of Structural Engineering, conducted extensive investigations focused on the Széchenyi Chain Bridge. Proof load tests of the bridge were performed in 2002 and 2018 to analyse the rotational capacity of the pins of the chain elements. Fixed or partly stuck pins, due to corrosion, cause bending moments within the chain system and, thus, alter the structural behaviour of the bridge. From 1949 to 2021, no significant maintenance or reconstruction work was made on the structure (except for small forms of corrosion protection), despite the chain elements reaching a lifetime of 100 years and the deck system being more than 70 years old. Historical failures of similar bridges underscored the need for a comprehensive assessment. A significant chain bridge failure occurred in the USA in 1967, claiming the lives of 46 individuals [1]. The collapse of the Silver Bridge stemmed from the failure of a single chain element due to a stress corrosion crack resulting in fatigue and eventually a fracture, leading to the complete breakdown of the entire chain system. Consequently, assessing the structural condition of structural elements became a crucial aspect of the historical bridge since it is essential for determining its load-bearing capacity and remaining lifetime. In 2019, noticeable corrosion problems were detected within the deck system, prompting the execution of an in-depth reliability analysis [2] to evaluate the risk of failure of the deck system until reconstruction commenced. On-site corrosion measurements were conducted, leading to the development of a Monte Carlo simulation-based stochastic reliability assessment method with a confidence level corresponding to a 1-year lifetime. The approach employed an advanced finite element model-based resistance calculation (GMNI analysis) alongside a state-of-the-art corrosion model. Based on the numerical simulation results, the bridge deck could have been verified only by a reduction in loading to keep the bridge in operation for one additional year. It was also concluded that the renovation of the historical structure could not be avoided and delayed any longer. During the latest reconstruction phase between 2021 and 2023, the bridge underwent substantial renewal. The aging deck system was substituted with an orthotropic steel deck (Figure 2b). However, the chain elements, steel stiffening girder, and cross-girder system remained unaltered, solely receiving corrosion protection enhancements. Simultaneously, the material loss of the chain bars due to corrosion was estimated by measurements during the reconstruction since it can cause reduced tensile resistance, leading to inappropriate ultimate resistance. Coupled with decreased pin rotational capability, deteriorating chain bars can reduce structural integrity.
The current paper primarily showcases findings from a six-month-long temporary monitoring measurement conducted during the reconstruction process. The evaluated data provide a pivotal understanding of the structural behaviour of the historical structure, including the pin rotational capacity and structural response due to temperature differences. These insights significantly influenced the decisions made by designers and the construction company during the bridge reconstruction. On the other hand, the importance of temporary structural health monitoring is highlighted in the paper as well. The strategy for analysing the structural behaviour of the Széchenyi Chain Bridge and predicting its structural integrity and the performance of the chain elements is the following:
  • Evaluating the measurement results of a proof load test, which was carried out in 2018, to conclude whether fixed or partly fixed pins would start rotating due to a live load on the bridge;
  • Assessing the temporary measurement results during reconstruction to conclude whether pins would start rotating due to reducing self-weight (dead load), which is mostly dominant for chain bridges.

2. Literature Review

The literature review introduces previously published results regarding structural health monitoring (SHM) systems related to bridges. Therefore, the findings presented in this paper can be readily introduced and differentiated.
SHM has been extensively applied across engineering sectors and remains a focal point in structural engineering research. The processing of periodically sampled real-time data in SHM facilitates early defect detection to support decision making on repairs, retrofitting, maintenance strategies, and accurate remaining-life predictions by integrating diverse sensing technologies. Overall, the operational safety of the monitored structures can be upheld. The cost of monitoring and repairs typically outweighs the expenses of a new construction, pressuring authorities to prolong structures’ lifespans while ensuring public safety. SHM potentially reduces costs by replacing scheduled maintenance with as-needed maintenance. Integrating SHM even during the design phase of new structures offers opportunities for reduced life-cycle expenses [3,4].
Long-term monitoring systems are currently in operation on bridges; the structural health monitoring of bridges has developed since the early 1990s. Utilizing in situ field experimental techniques aids in comprehending the behaviour and performance of actual, full-scale bridges subject to real loading and environmental conditions. It serves to verify the safety, serviceability, durability, and sustainability of bridges. For instance, Li and Ou [5] and Hovhanessian [6] have already recommended design approaches for SHM systems for bridges.
The characteristics of structures (e.g., modal parameters [7,8]) are influenced by the natural environment (wind, temperature, etc.). Wind is one of the critical loads for long-span cable-stayed bridges and can cause vortex-induced vibrations of decks and cables and rain-wind-induced vibrations of cables. Anemoscopes are widely applied to measure wind velocity. Thermocouples or optical fibre Bragg grating (FBG) temperature sensors are frequently used to measure the temperature of bridges. Degrauwe et al. [9] examined the influence of temperature and its measurement error on natural vibration frequencies. Furthermore, Li et al. [10] applied a nonlinear principle component analysis (NPCA) to remove the influence of temperature and wind. Strain is one of the most important variables for the safety evaluation, fatigue assessment, and validation of models. Strain can be measured using, e.g., a traditional strain gauge, a vibrating-wire strain gauge, or FBG strain sensors [11,12,13]. Okasha and Frangopol [14] presented a performance-based life-cycle bridge management framework with the integration of SHM, which can be used for the safety evaluation of different types of bridges. Li et al. [15,16,17,18] presented a framework for the safety evaluation of bridges based on load-induced or environment-induced strains and deformations. Various new sensing technologies have been developed in the last two decades. Optical fibre and wireless sensing technologies have shown great potential and have been widely used in many SHM systems for bridges [19]. Nevertheless, the application of artificial intelligence is also emerging for evaluating measurement results [3,20].
SHM systems are not only installed on relatively new structures; historical, aging bridges are also involved [21,22]. However, the application of an SHM system during the reconstruction of a historical bridge has not been published yet, according to the authors’ knowledge. This is a new application for evaluating structural behaviour using a temporary system and assessing continuous six-month-long measurement data.

3. Proof Load Test

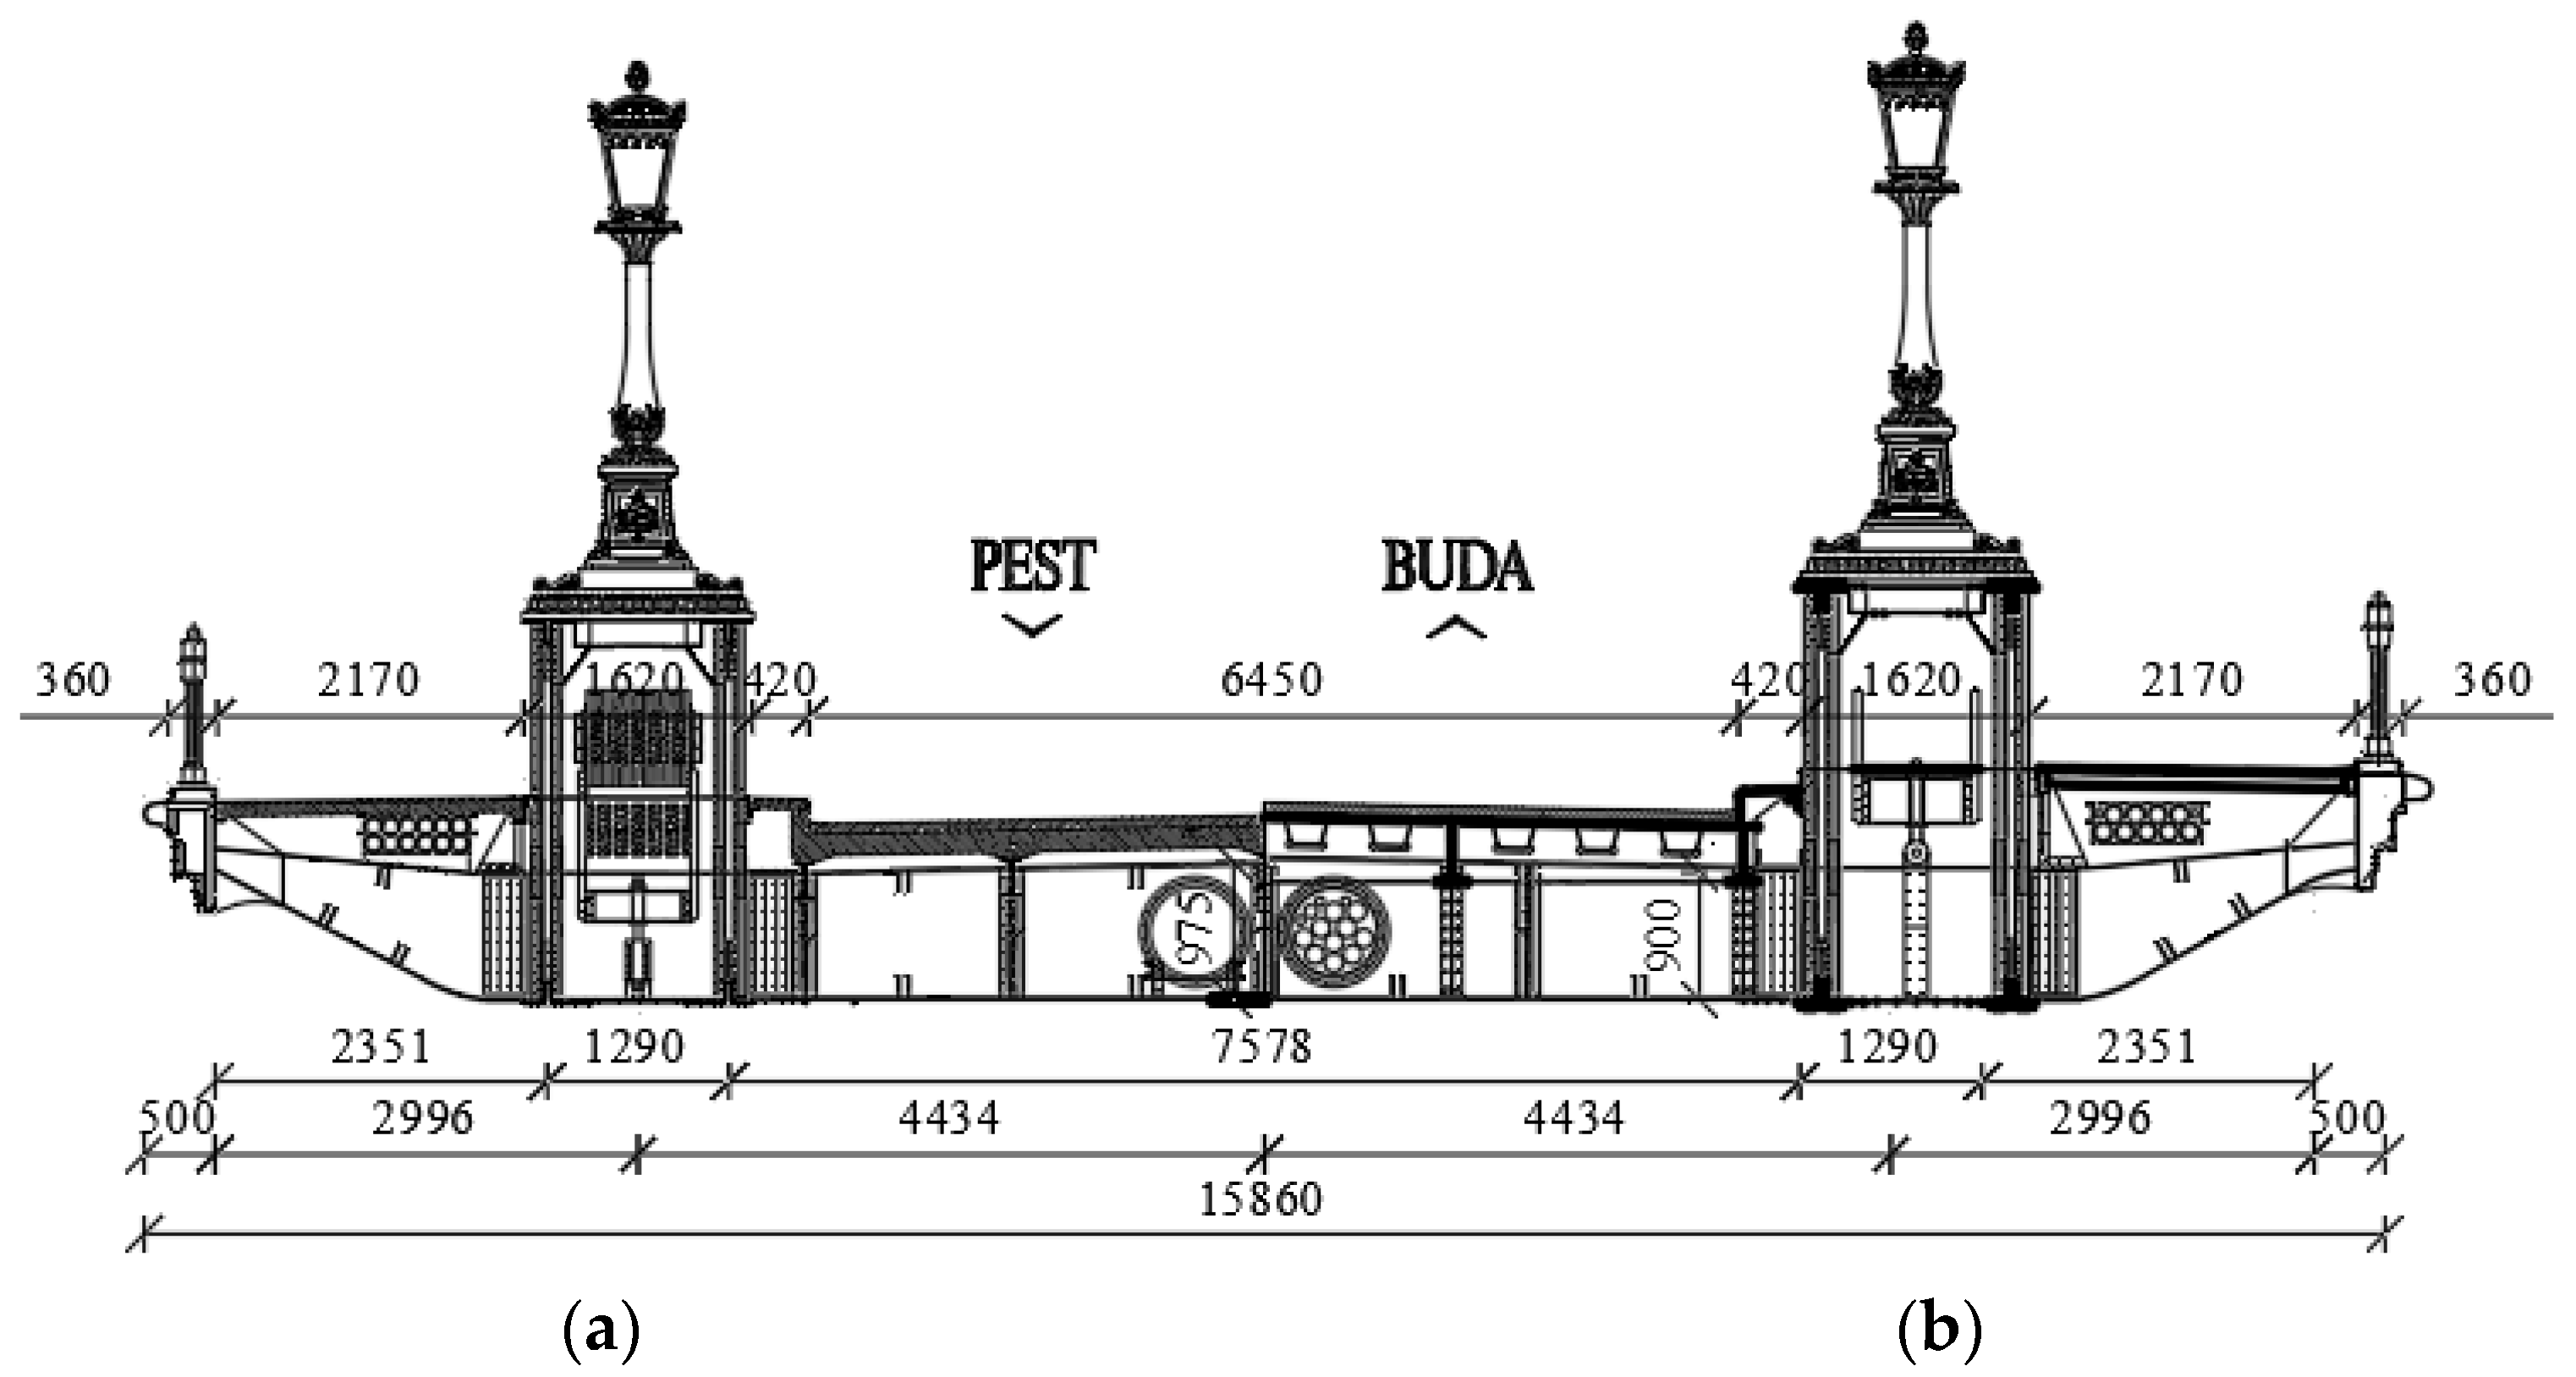
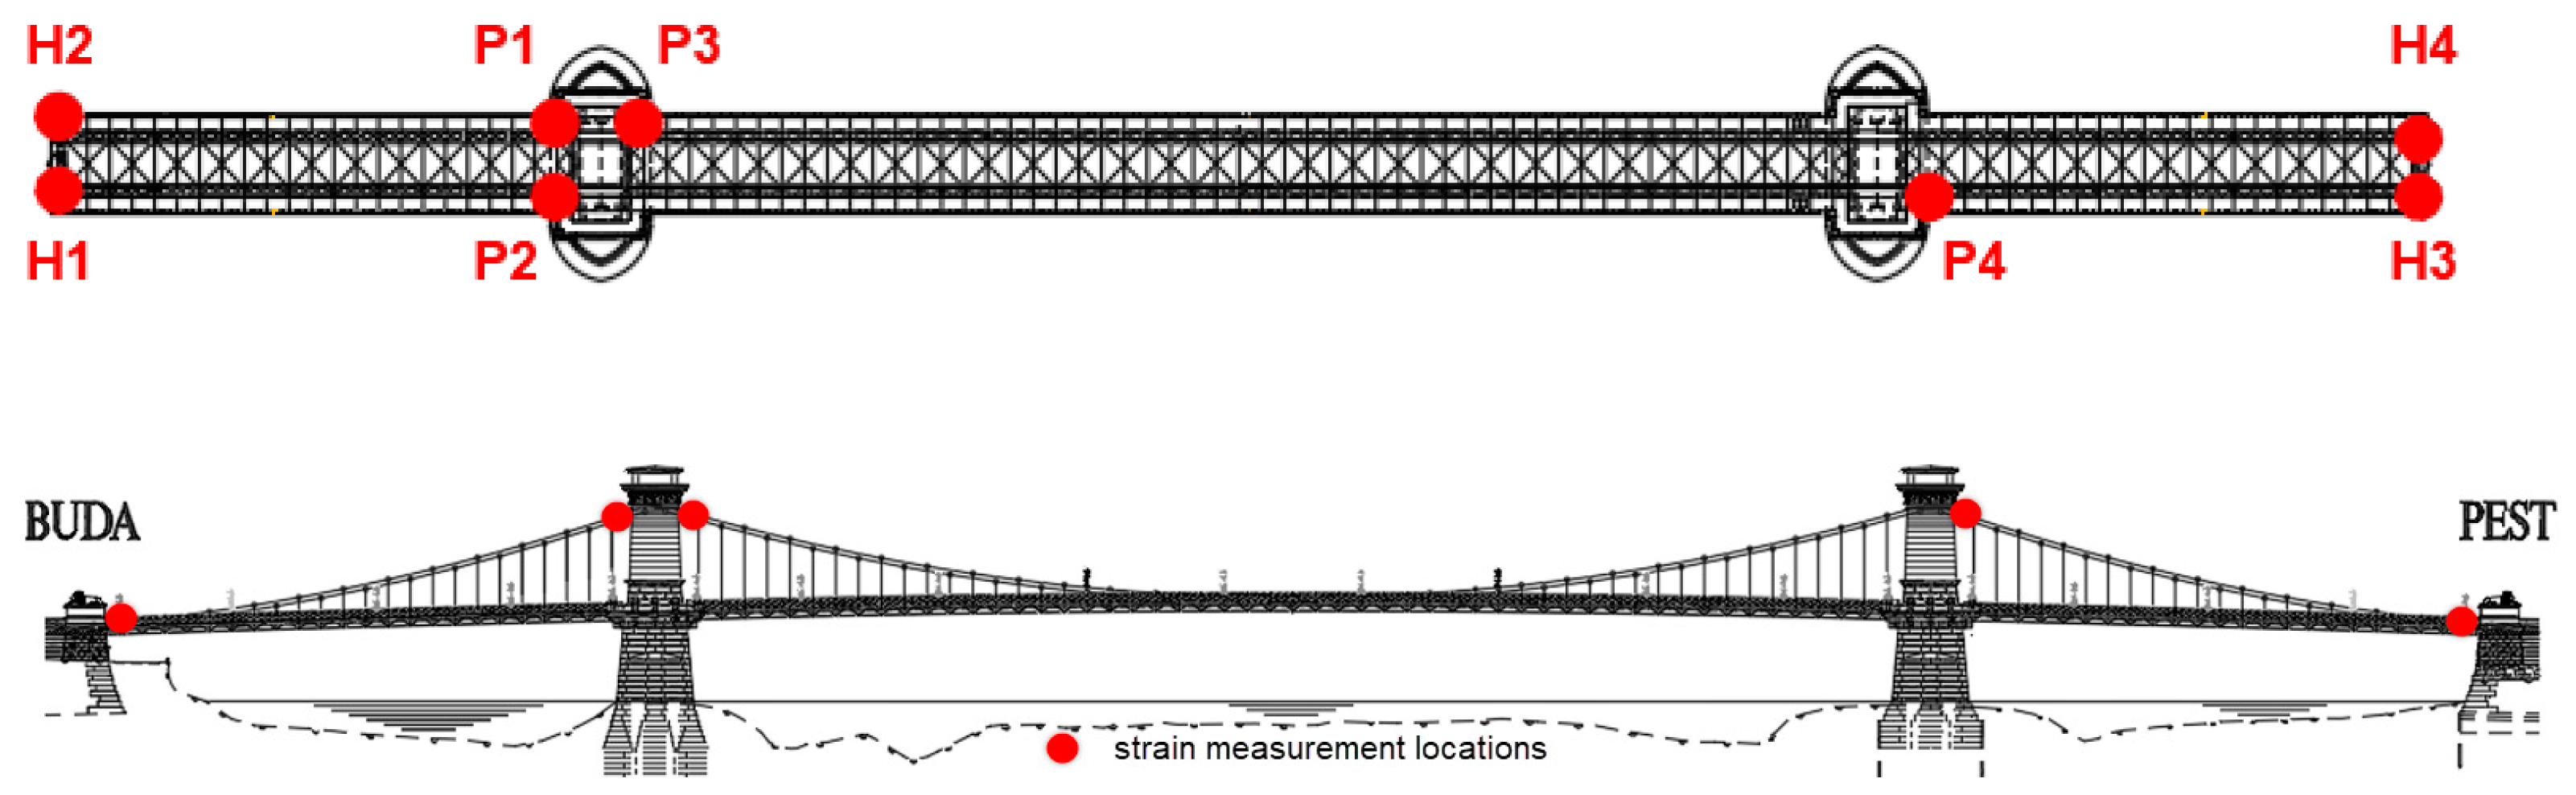
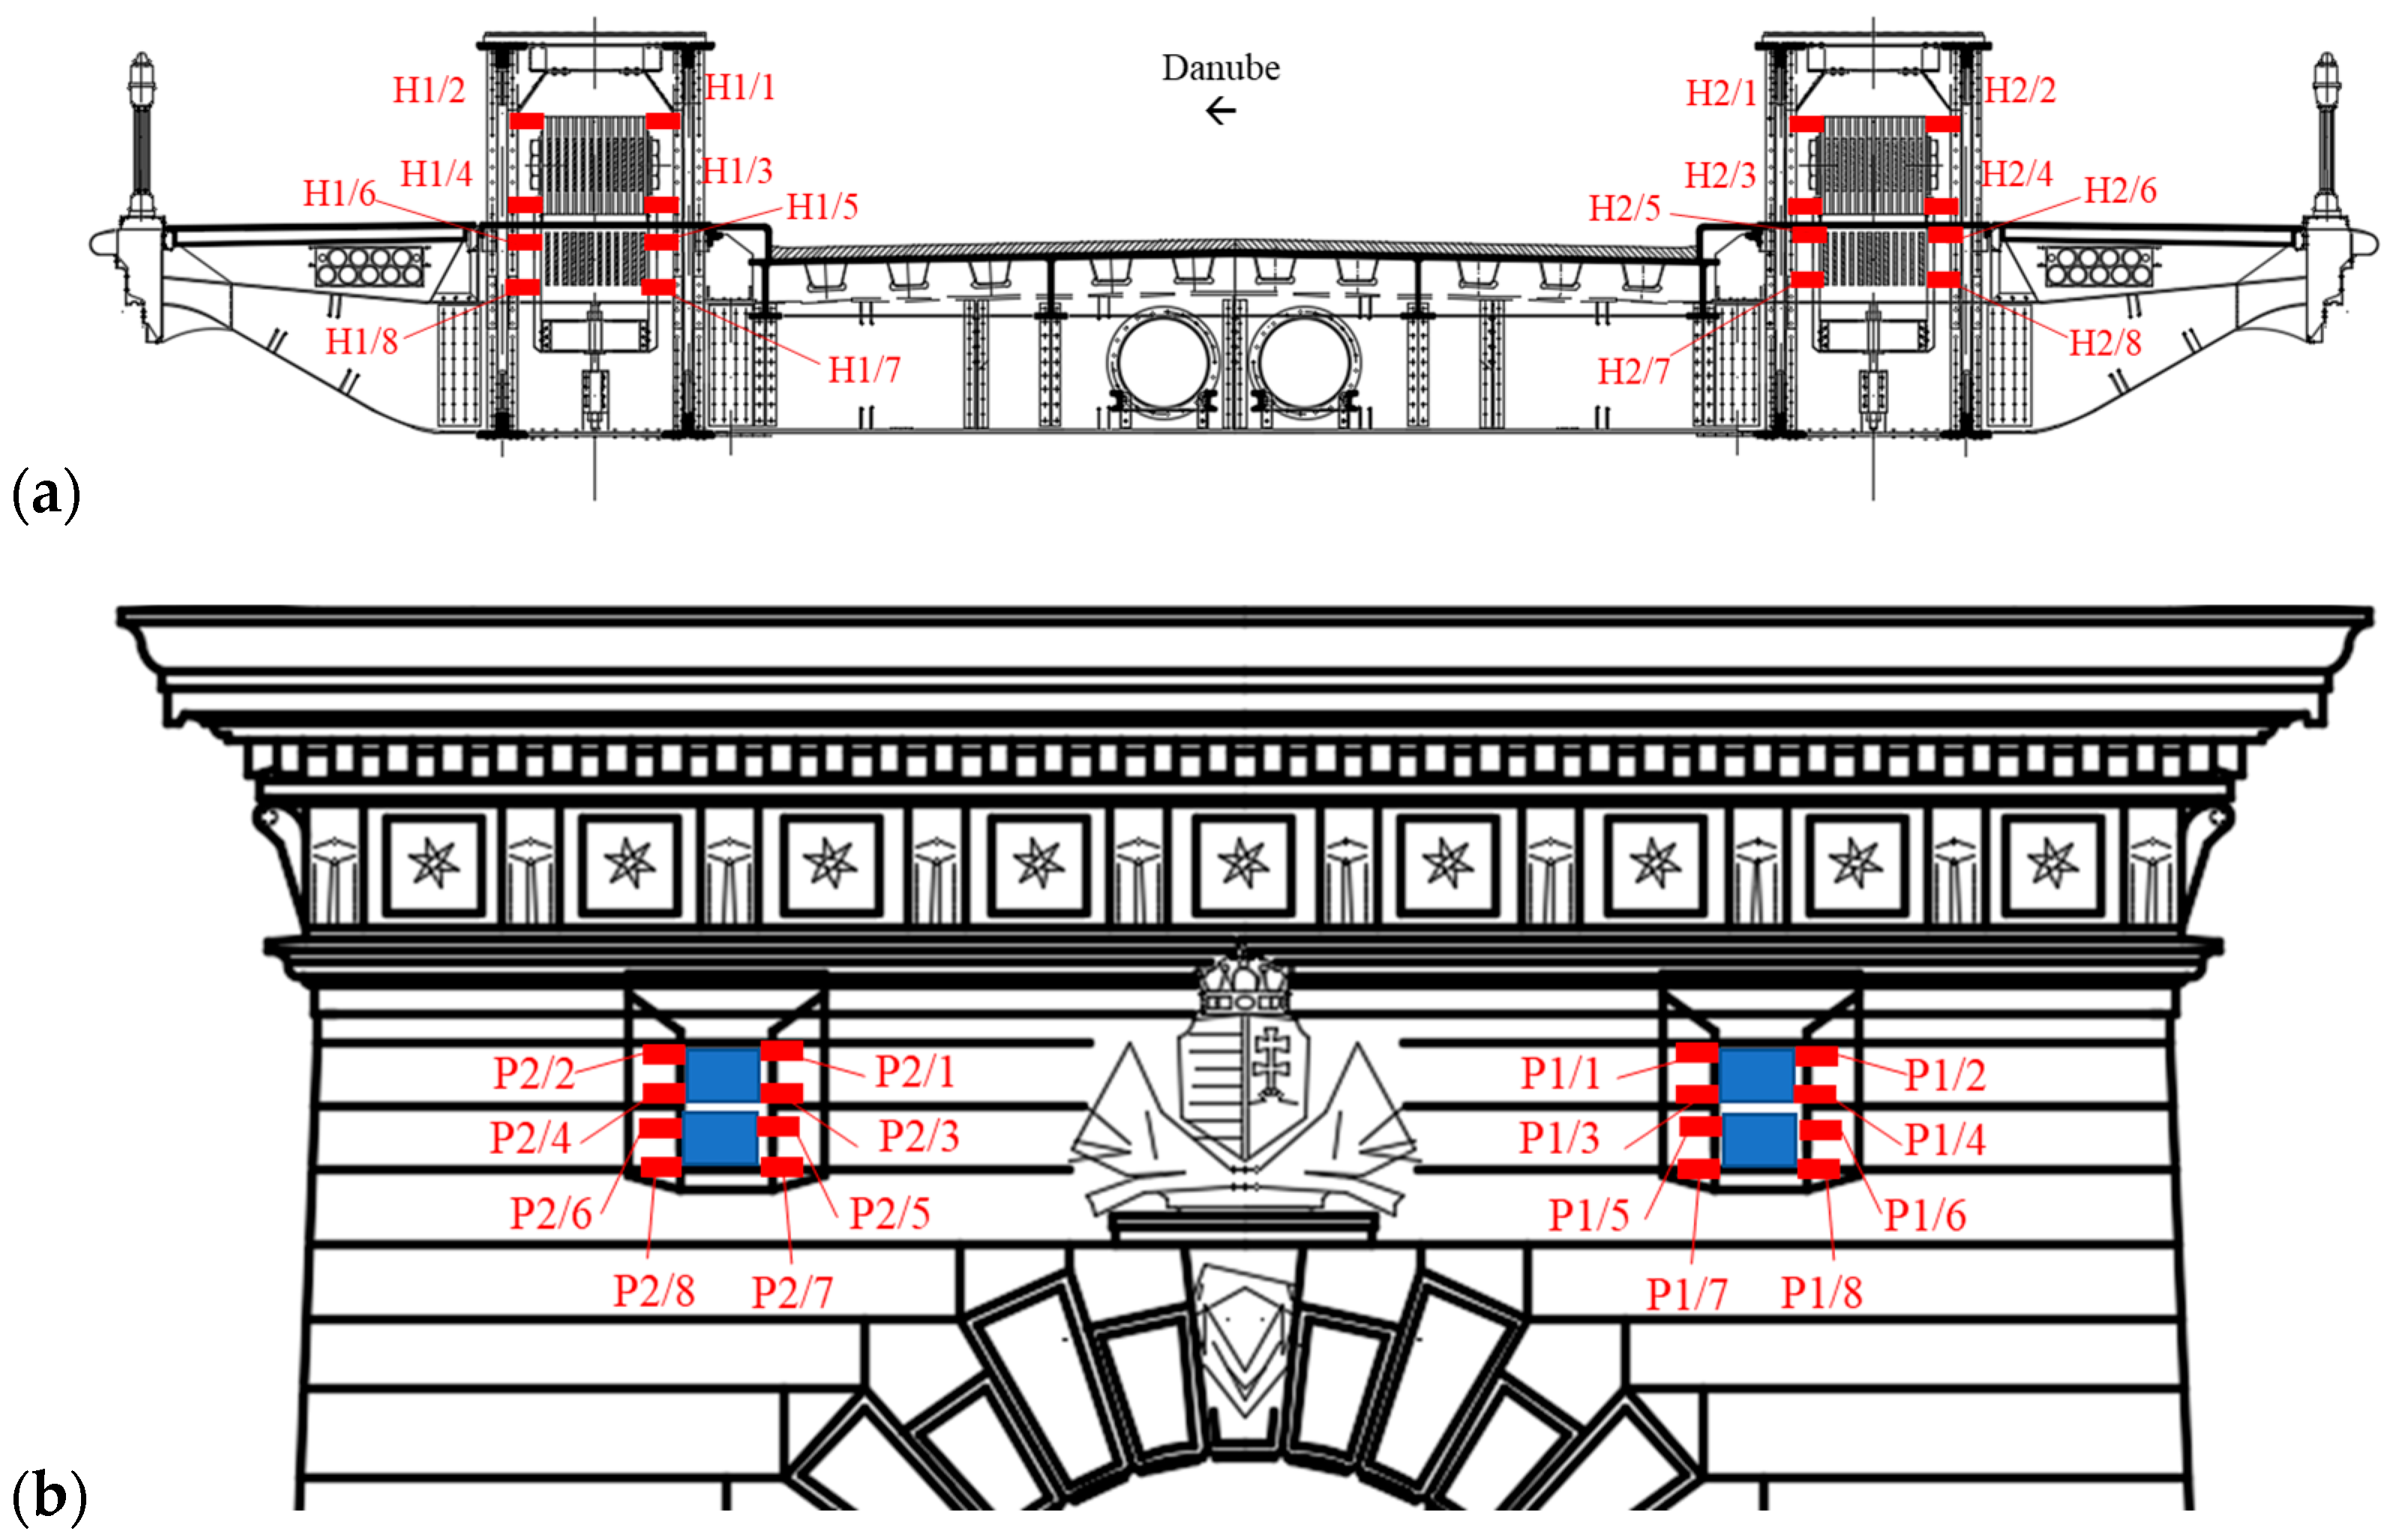
3.1. Configuration and Measurement Locations
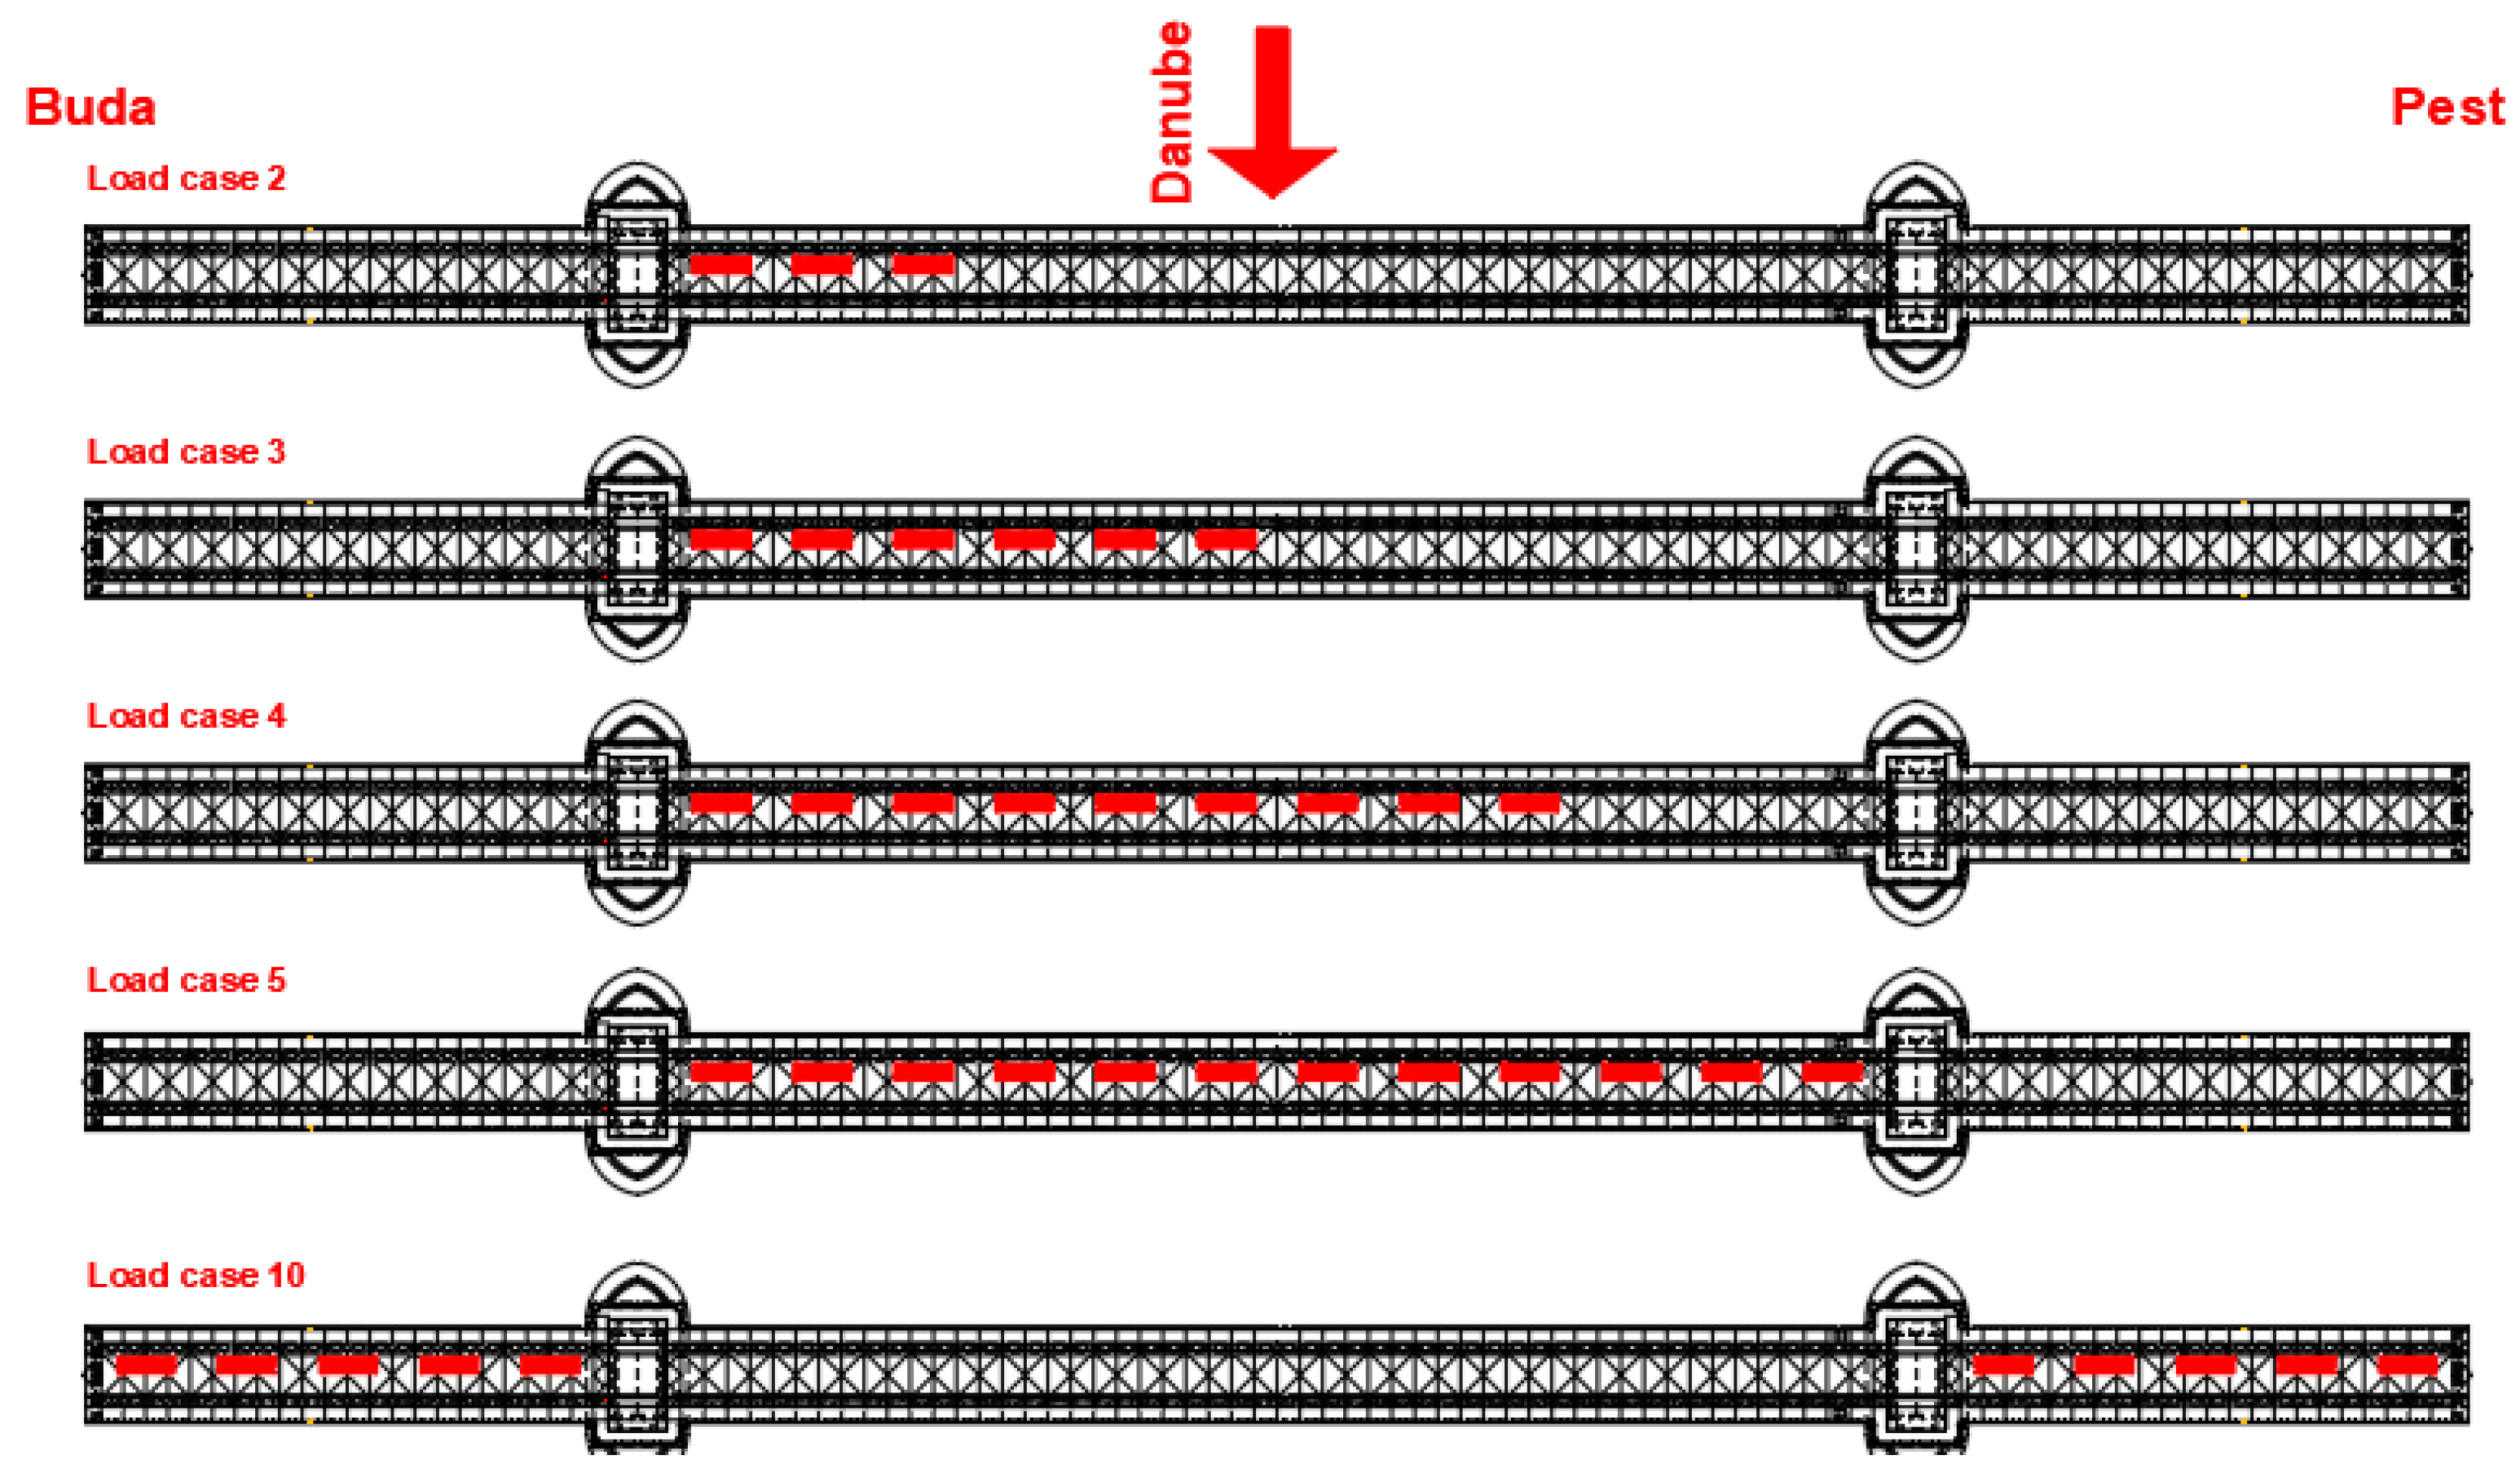
The purpose of the proof load test is to determine the rotation capacity of the pins connecting the chain links based on the determination of the normal stresses resulting from the normal forces and bending moments in the chains by using strain gauges. Based on static calculations using the finite element method, it was found that significant bending in the chain elements can only be generated in the first elements near the pylons (P1–P4) and in the structural bearings at the abutments (H1–H4). Therefore, these areas near the directional changes of the chain system are the focus of the current measurements. For the left pylon, three measurement locations are installed for a detailed analysis, while for the right pylon, only one location is used as a reference. A total of eight different measurement locations are selected, and the global layout is shown in Figure 3. The selection of the measurement locations followed the conditions of the bridge, taking into account the limitations (max. possible channel number) of the measurement system. A total of eight strain gauges are placed on chain elements at each measurement point (notations are shown in Figure 4). Four strain gauges are placed at each measurement location on the extreme fibres of the chain elements. The strain gauges denoted by Hx/1–Hx/8 are placed on the eyebars around the abutment, where the chains have knickpoints. The strain gauges marked by Px/1–Px/8 are placed on the eyebars around the pylons near the breaking point of the chain system (x = 1…4 for the pylon and the abutment). In each analysed cross-section, two strain gauges are placed at the upper and two at the lower extreme fibres to be able to determine the normal force and the in-plane bending moment changes during loading.
Strain measurement is performed using a laptop-controlled HBM MGCplus data acquisition system and HBM CANhead amplifiers. The CANhead amplifiers are connected by high-performance CanBus cables, which transmit the measurement signals via the data acquisition system to a laptop. Uniaxial strain gauges with a nominal resistance of 350 Ω are applied for the short-term measurements. During the static proof load test, continuous measurements are taken for each load case at a sampling rate of 2 Hz. The strain gauges are placed on the structure loaded by self-weight so that the monitoring measurements show the strain changes during the measurement period. The applied strain gauges were temperature-compensated strain gauges made to be installed in steel structures.

3.2. Load Cases

The bridge was loaded with 12 four-axle trucks with an average weight of ~20 t. A total of 13 load cases were examined (load cases with trucks on the inflow side are shown in Figure 5), including unloaded load cases, to determine the effect of temperature change, ΔT, in a several-hour-long proof load test and the possible deterioration of the structure between different loading situations (i.e., to detect plastic strain, if any). The applied load cases were the following:
  • Unloaded bridge;
  • Three trucks in one lane in the middle span of the inflow side;
  • Six trucks in one lane in the middle span of the inflow side;
  • Nine trucks in one lane in the middle span of the inflow side;
  • Twelve trucks in one lane in the middle span of the inflow side;
  • Unloaded bridge (evaluating the effect of ΔT);
  • Six trucks in the middle span of the outflow side;
  • Twelve trucks in the middle span of the outflow side.
  • Unloaded bridge (evaluating the effect of ΔT);
  • Ten trucks, five in each side span, on the inflow side;
  • Unloaded bridge (evaluating the effect of ΔT);
  • Ten trucks, five on each side span, on the outflow side;
  • Unloaded bridge (evaluating the effect of ΔT).

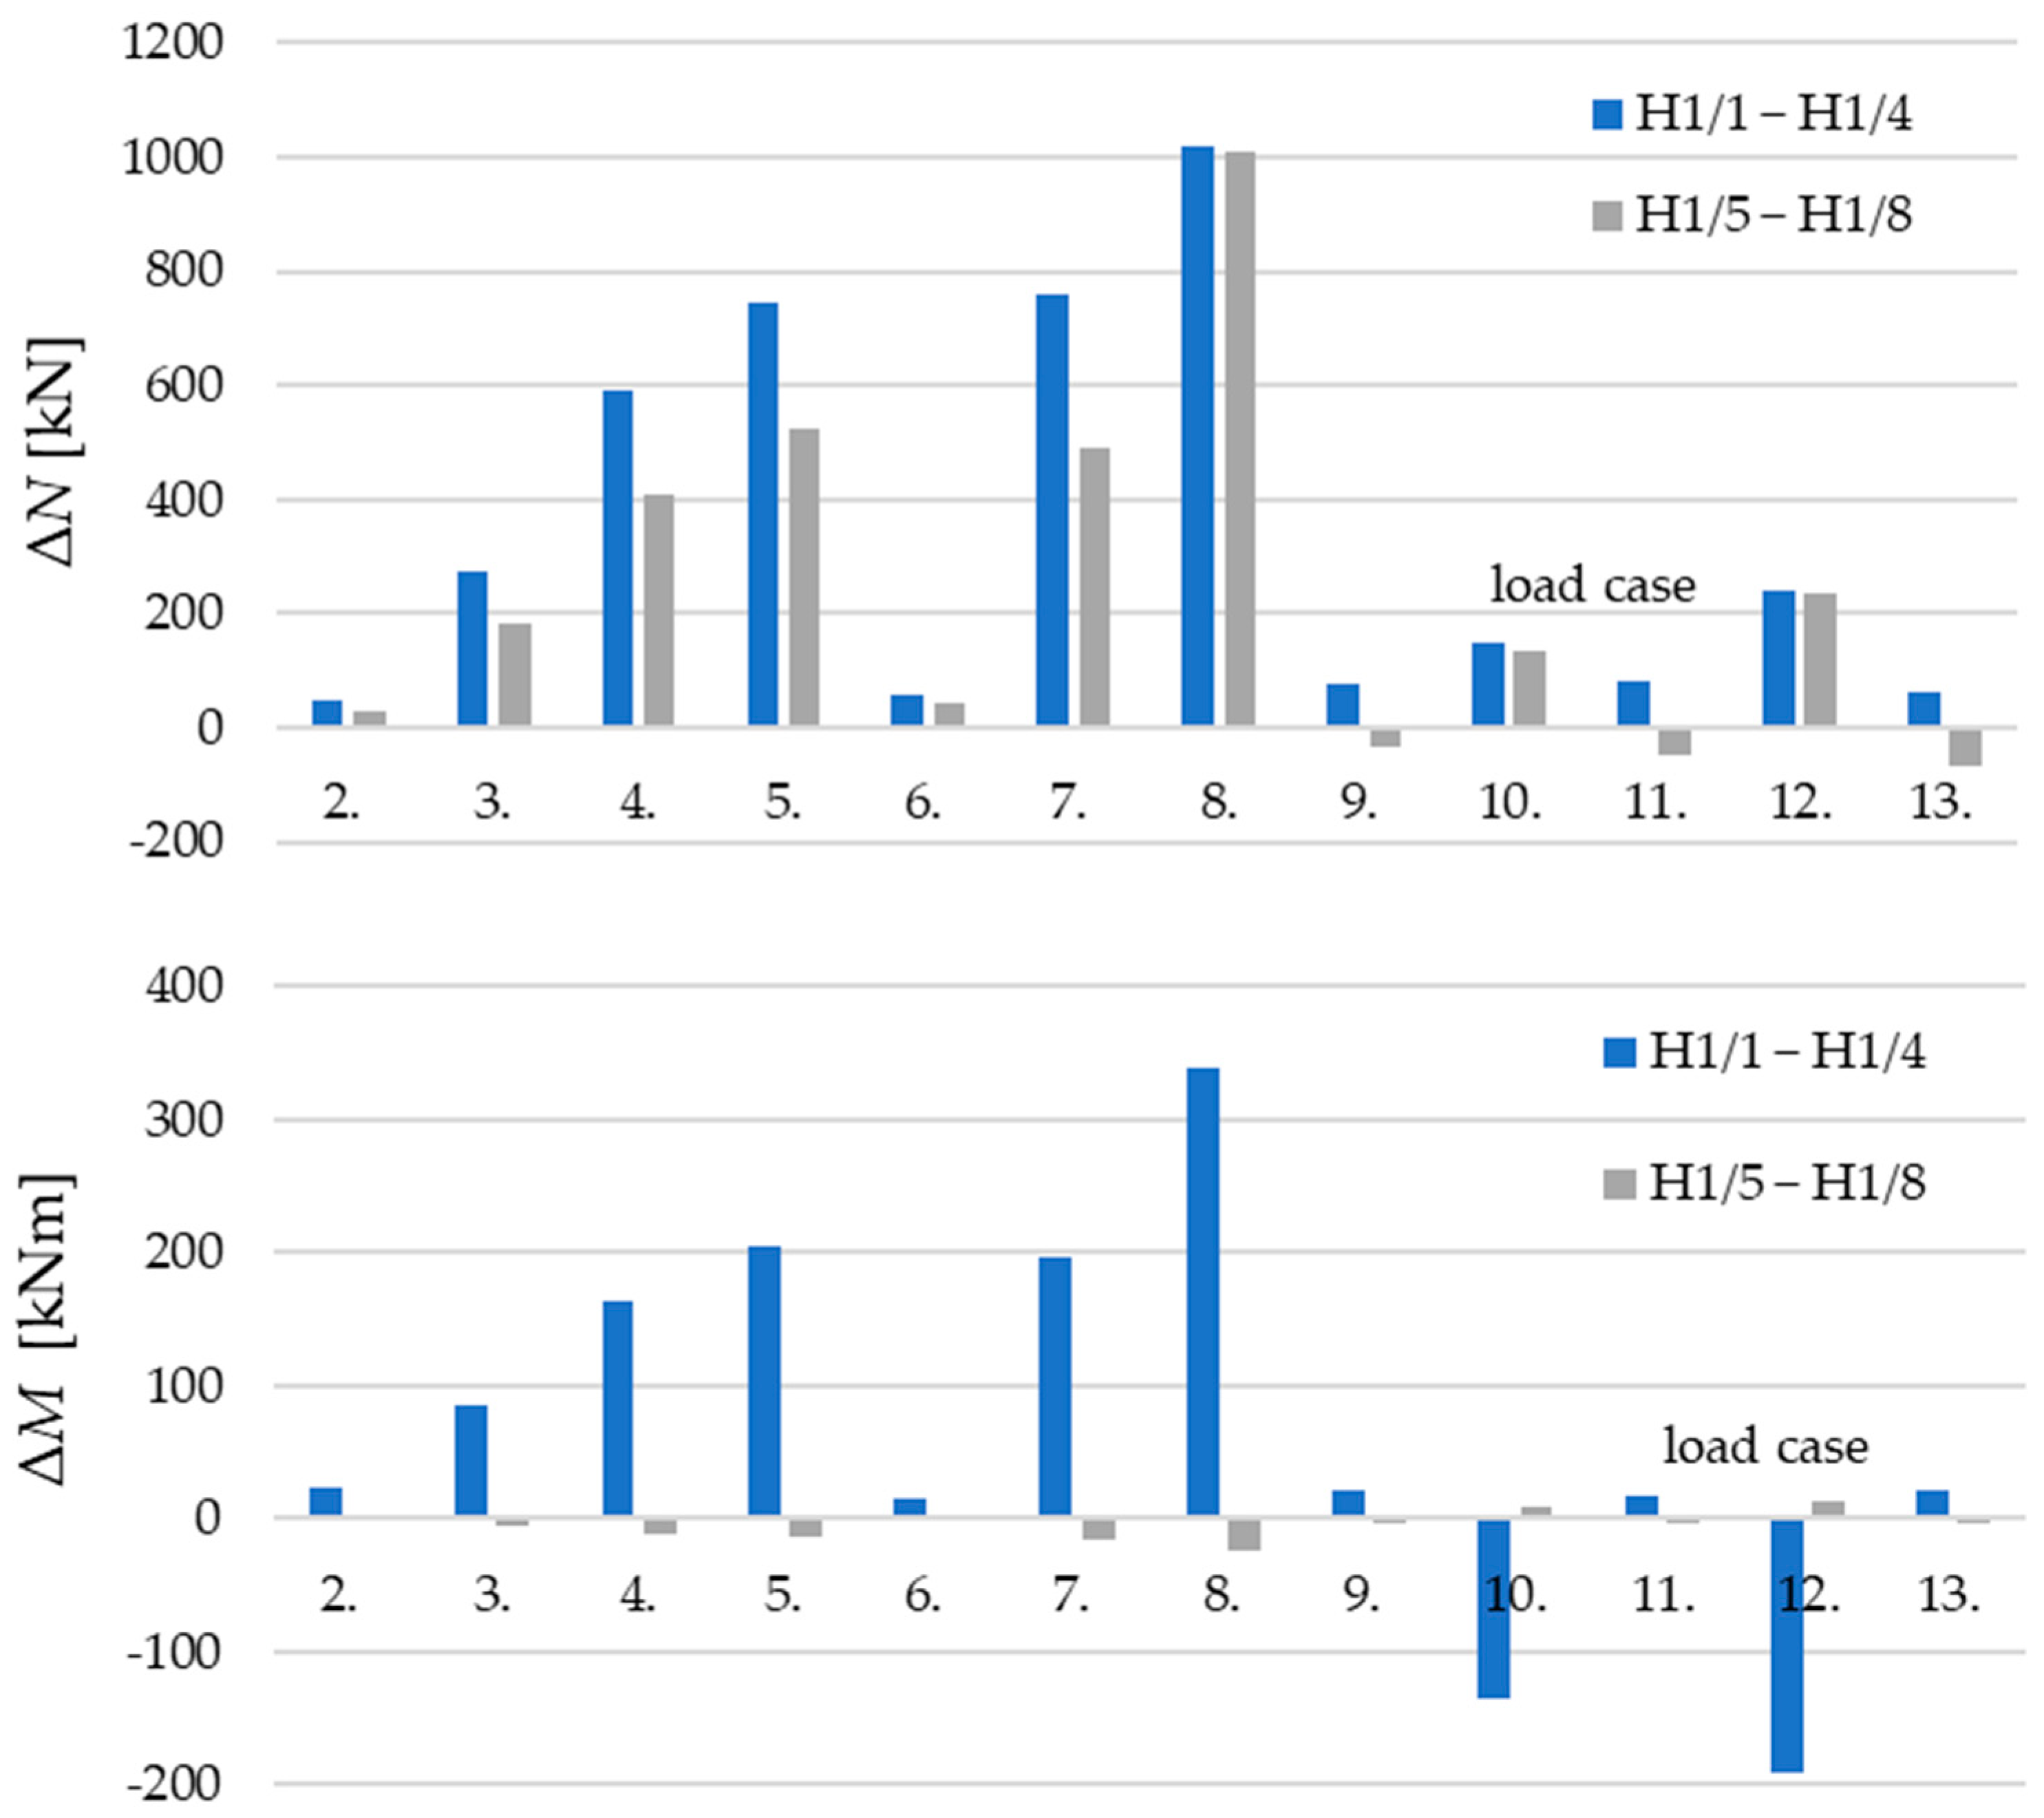
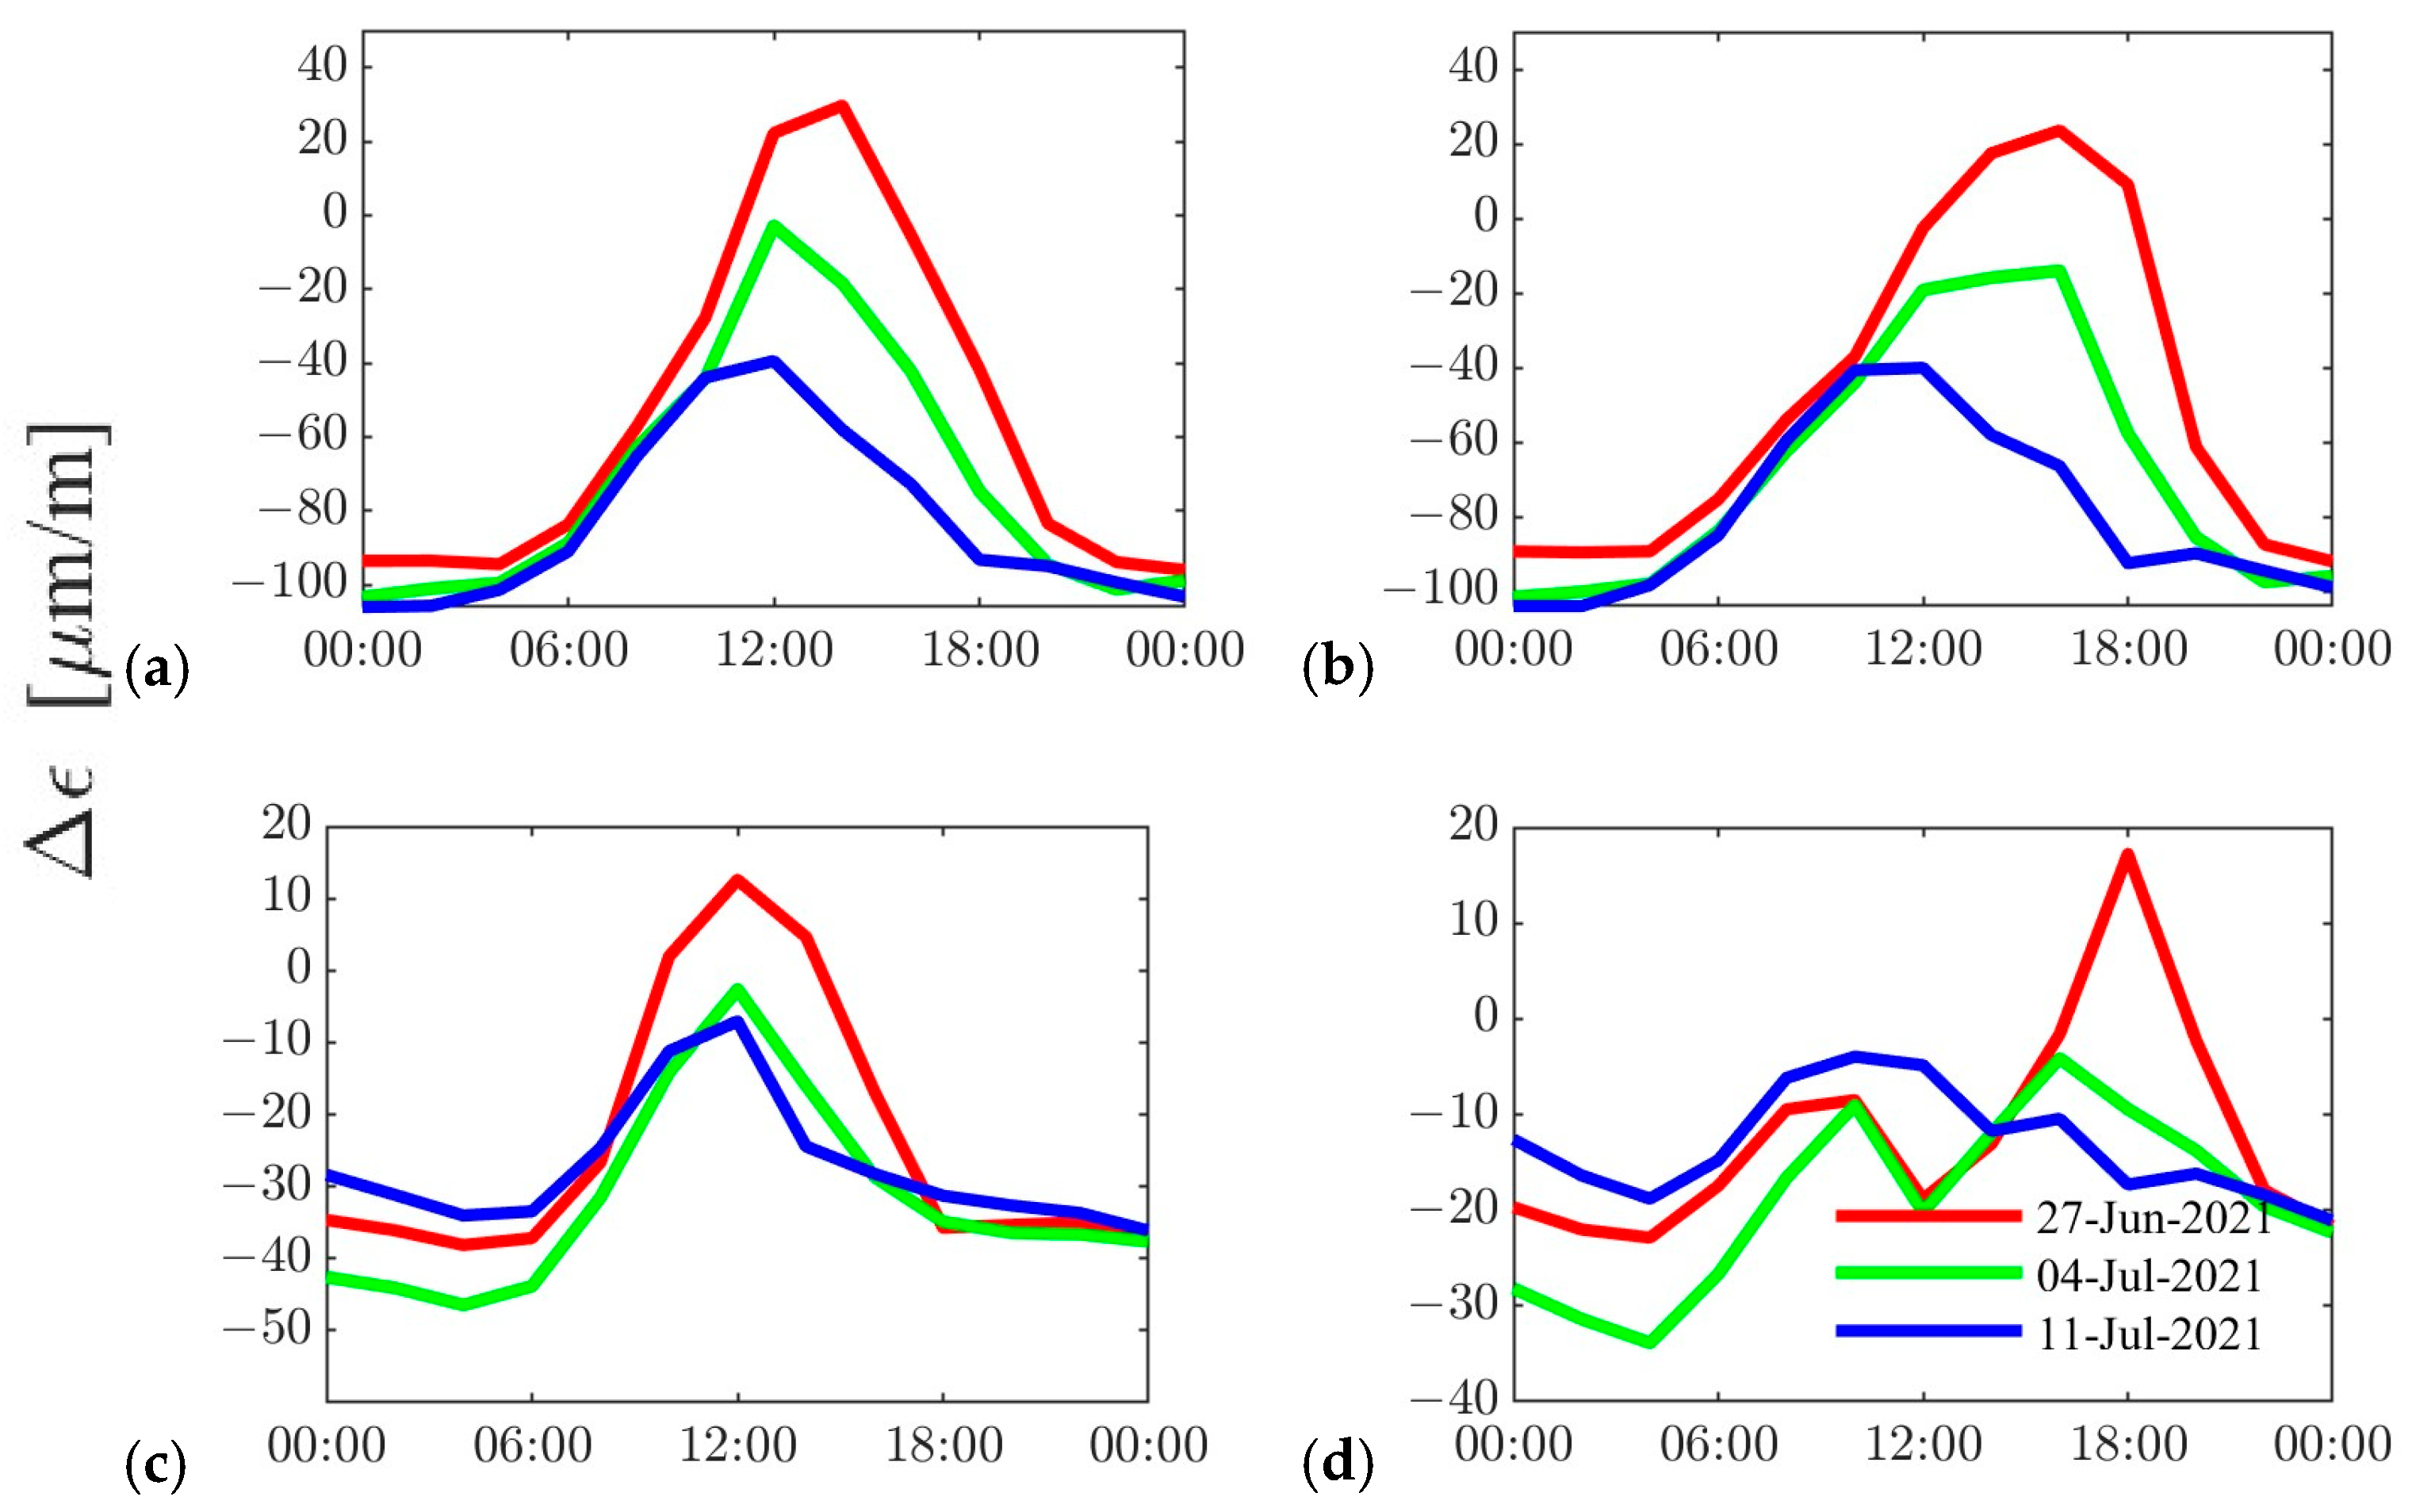
3.3. Measurement Results

The axial strains due to the vehicle load are determined for all the load cases. Since the strain gauges are installed on the extreme fibres, normal forces and bending moments could be determined and separated by averaging (εmean) and deriving the average difference between the top and bottom fibres (Δε), respectively. The normal forces are then determined by using N = εmean × EA, where E = 210 MPa is the Young’s modulus and A = 1274 cm2 is the cross-sectional area. The bending moments are calculated by M = 0.5Δε × EW, where W = 7749 cm3 is the elastic cross-sectional modulus. The derived changes in normal forces, ΔN, and bending moments, ΔM, are plotted in Figure 6, Figure 7 and Figure 8 for the measurement locations at the abutment and pylon.
The peak normal forces at the Pest abutment (Figure 6) ranged between 907 and 972 kN, while on the Buda side, they varied between 927 and 1019 kN. In the side span (Figure 7), the normal force in the chain elements at the pylons varied from 1040 to 1200 kN, with a maximum of 1482 kN (Figure 8) in the mid-span (for comparison purposes, the maximum normal force in the chain elements coming from self-weight is ~11,300 kN). The measurements reveal a significant disparity between the variation in normal forces recorded in the side spans and mid-span, surpassing the variation expected from the change in the chain element direction alone. Consequently, these findings suggest that the structural bearings at the top of the pylons can withstand a portion of the horizontal forces exerted by the applied load.
The measurements reveal significant variations in the maximum bending moment at the abutments, ranging from 248 to 320 kNm for load cases 5 and 8, respectively, and from −142 to −198 kNm for load cases 10 and 12. Similarly, the maximum bending moment variation in the chain elements near the pylon, specifically at measurement points P1, P2, and P4, oscillated between 107 and 141 kNm for load cases 5 and 8 and −141 to −147 kNm for load positions 10 and 12. Notably, at the measurement location P3, the pin connection shifted following an approximate 230 kNm bending moment change, resulting in decreased bending. Hence, the measurements indicate that among the eight tested pins, only one displayed the ability to rotate under the applied live load. This observation suggests that the applied live load was insufficient to surpass the friction between the chain elements for the remaining pins, which might be notably increased due to corrosion.
Consequently, further measurements were planned to be made during the reconstruction process of the bridge, anticipating larger internal force changes attributed to the alteration in the self-weight of the bridge. These measurements were executed by using a temporary monitoring system.

4. Temporary Monitoring System

4.1. Configuration and Measurement Locations

The temporary measurement system consists of 80 strain gauges, which were installed on chain elements on both the inflow and outflow sides in order to measure the elongation variation and track the structural behaviour during reconstruction. The data obtained from the measurement system also provide information on the changes in the elongation of the structure due to non-reconstruction loads (e.g., due to temperature changes or other meteorological effects), which can be used to better understand the behaviour of the structure. In addition, the temperatures of the air and the steel structure are recorded as well. Continuously processed data, i.e., 24/7 data acquisition, made it possible to determine intra-day, weekly, and monthly measurement trends and changes between individual reconstruction stages.
The purpose of the measurement is to assess the stress induced on the chain elements under varying loads to infer the rotational capacity of the pins. Eight different locations along the chains are measured. Four measurement sites (H1–H4) are positioned at the bridge abutments on both the inflow and outflow sides, while four other sites (P1–P4) are established at the pylon on the Buda side, similarly to the proof load test, as shown in Figure 3 and Figure 4. Each location undergoes measurements on both the lower and upper chain elements. At the abutments (measurement sites H1–H4), strain gauges are placed at the end of the parallel part of the chain elements (located at 100 mm from the rounding of the pin head in the axial direction, near the directional change at the structural bearing). Strain gauges are installed on both sides of the chain bars, 20 mm from the lower and upper edges. Accordingly, a total of four strain gauges are used per measurement location at the abutments. This approach allows for the independent determination and comparison of changes in bending moments and normal forces within the chains. The same considerations are made for the strain gauges at the pylon (measurement sites P1–P4), except that additional sensors are installed at the neutral axis of the chain elements. Thus, six sensors are used per measurement location at the pylon, as shown in Figure 9.
HBM PMX data acquisition systems are used for accurate, reliable, and flexible measurements, which are ideally suited to processing large data volumes for long-term multi-channel applications. Temperature-compensated biaxial strain gauges with a nominal resistance of 350 Ω were installed. Measurement and data logging are controlled using CatmanEasy v4.5, the software by HBM. A sampling rate of 1 Hz is applied during data acquisition.

4.2. Reconstruction Stages

A detailed organisation plan for the current reconstruction was drawn up. This paper does not describe the entire construction process, but only the stages that are relevant for the measurement evaluation, which are the following:
  • The crane runway is built on the superstructure (15 July 2021);
  • Suspended scaffolding is installed, while the reinforced concrete slab is demolished in the main span (1 August 2021);
  • Old steel stingers are dismantled in the main span, a new orthotropic deck is installed on half of the main span, and suspended scaffolding is installed in the side spans (3 November 2021);
  • The old concrete slab and steel stringers are dismantled from the entire bridge, the new orthotropic deck is installed between the pylons, the sidewalks in the main span are dismantled, and the suspended scaffolding is dismantled (3 January 2022).
For illustration purposes, Figure 10 shows the superstructure of the bridge between Phases 3 and 4. The suspended scaffolding was installed in the side spans, and the old deck system (concrete slab and steel stringers) had already been demolished. From a static point of view, this erection phase gave rise to a dominant loading situation. Thus, the maximum load was applied in the middle span, and the minimum in the side spans. It was expected that this erection phase could make the hinges rotate.

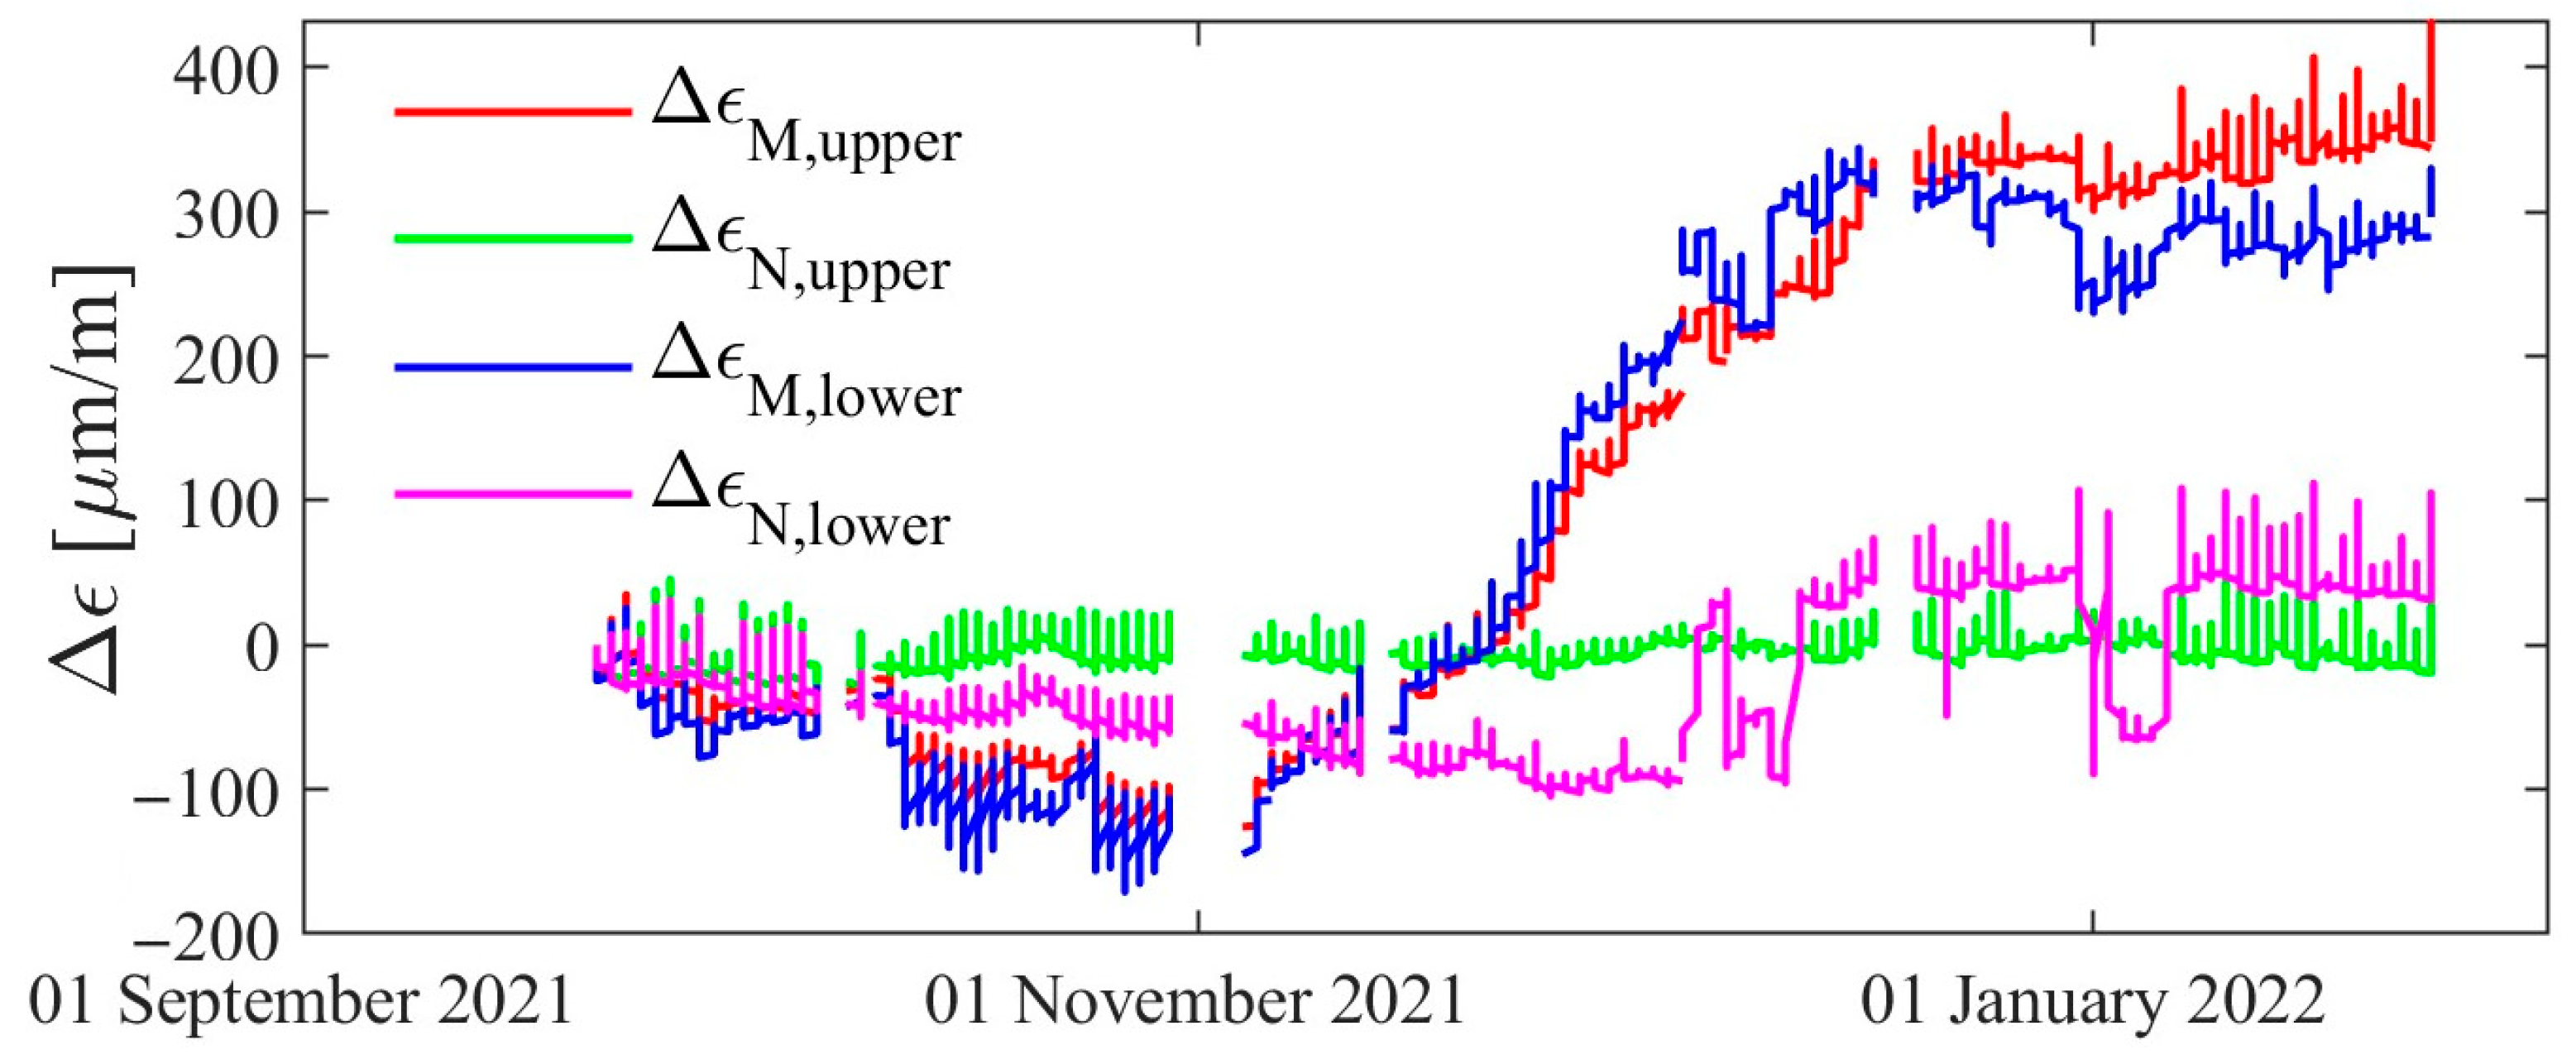
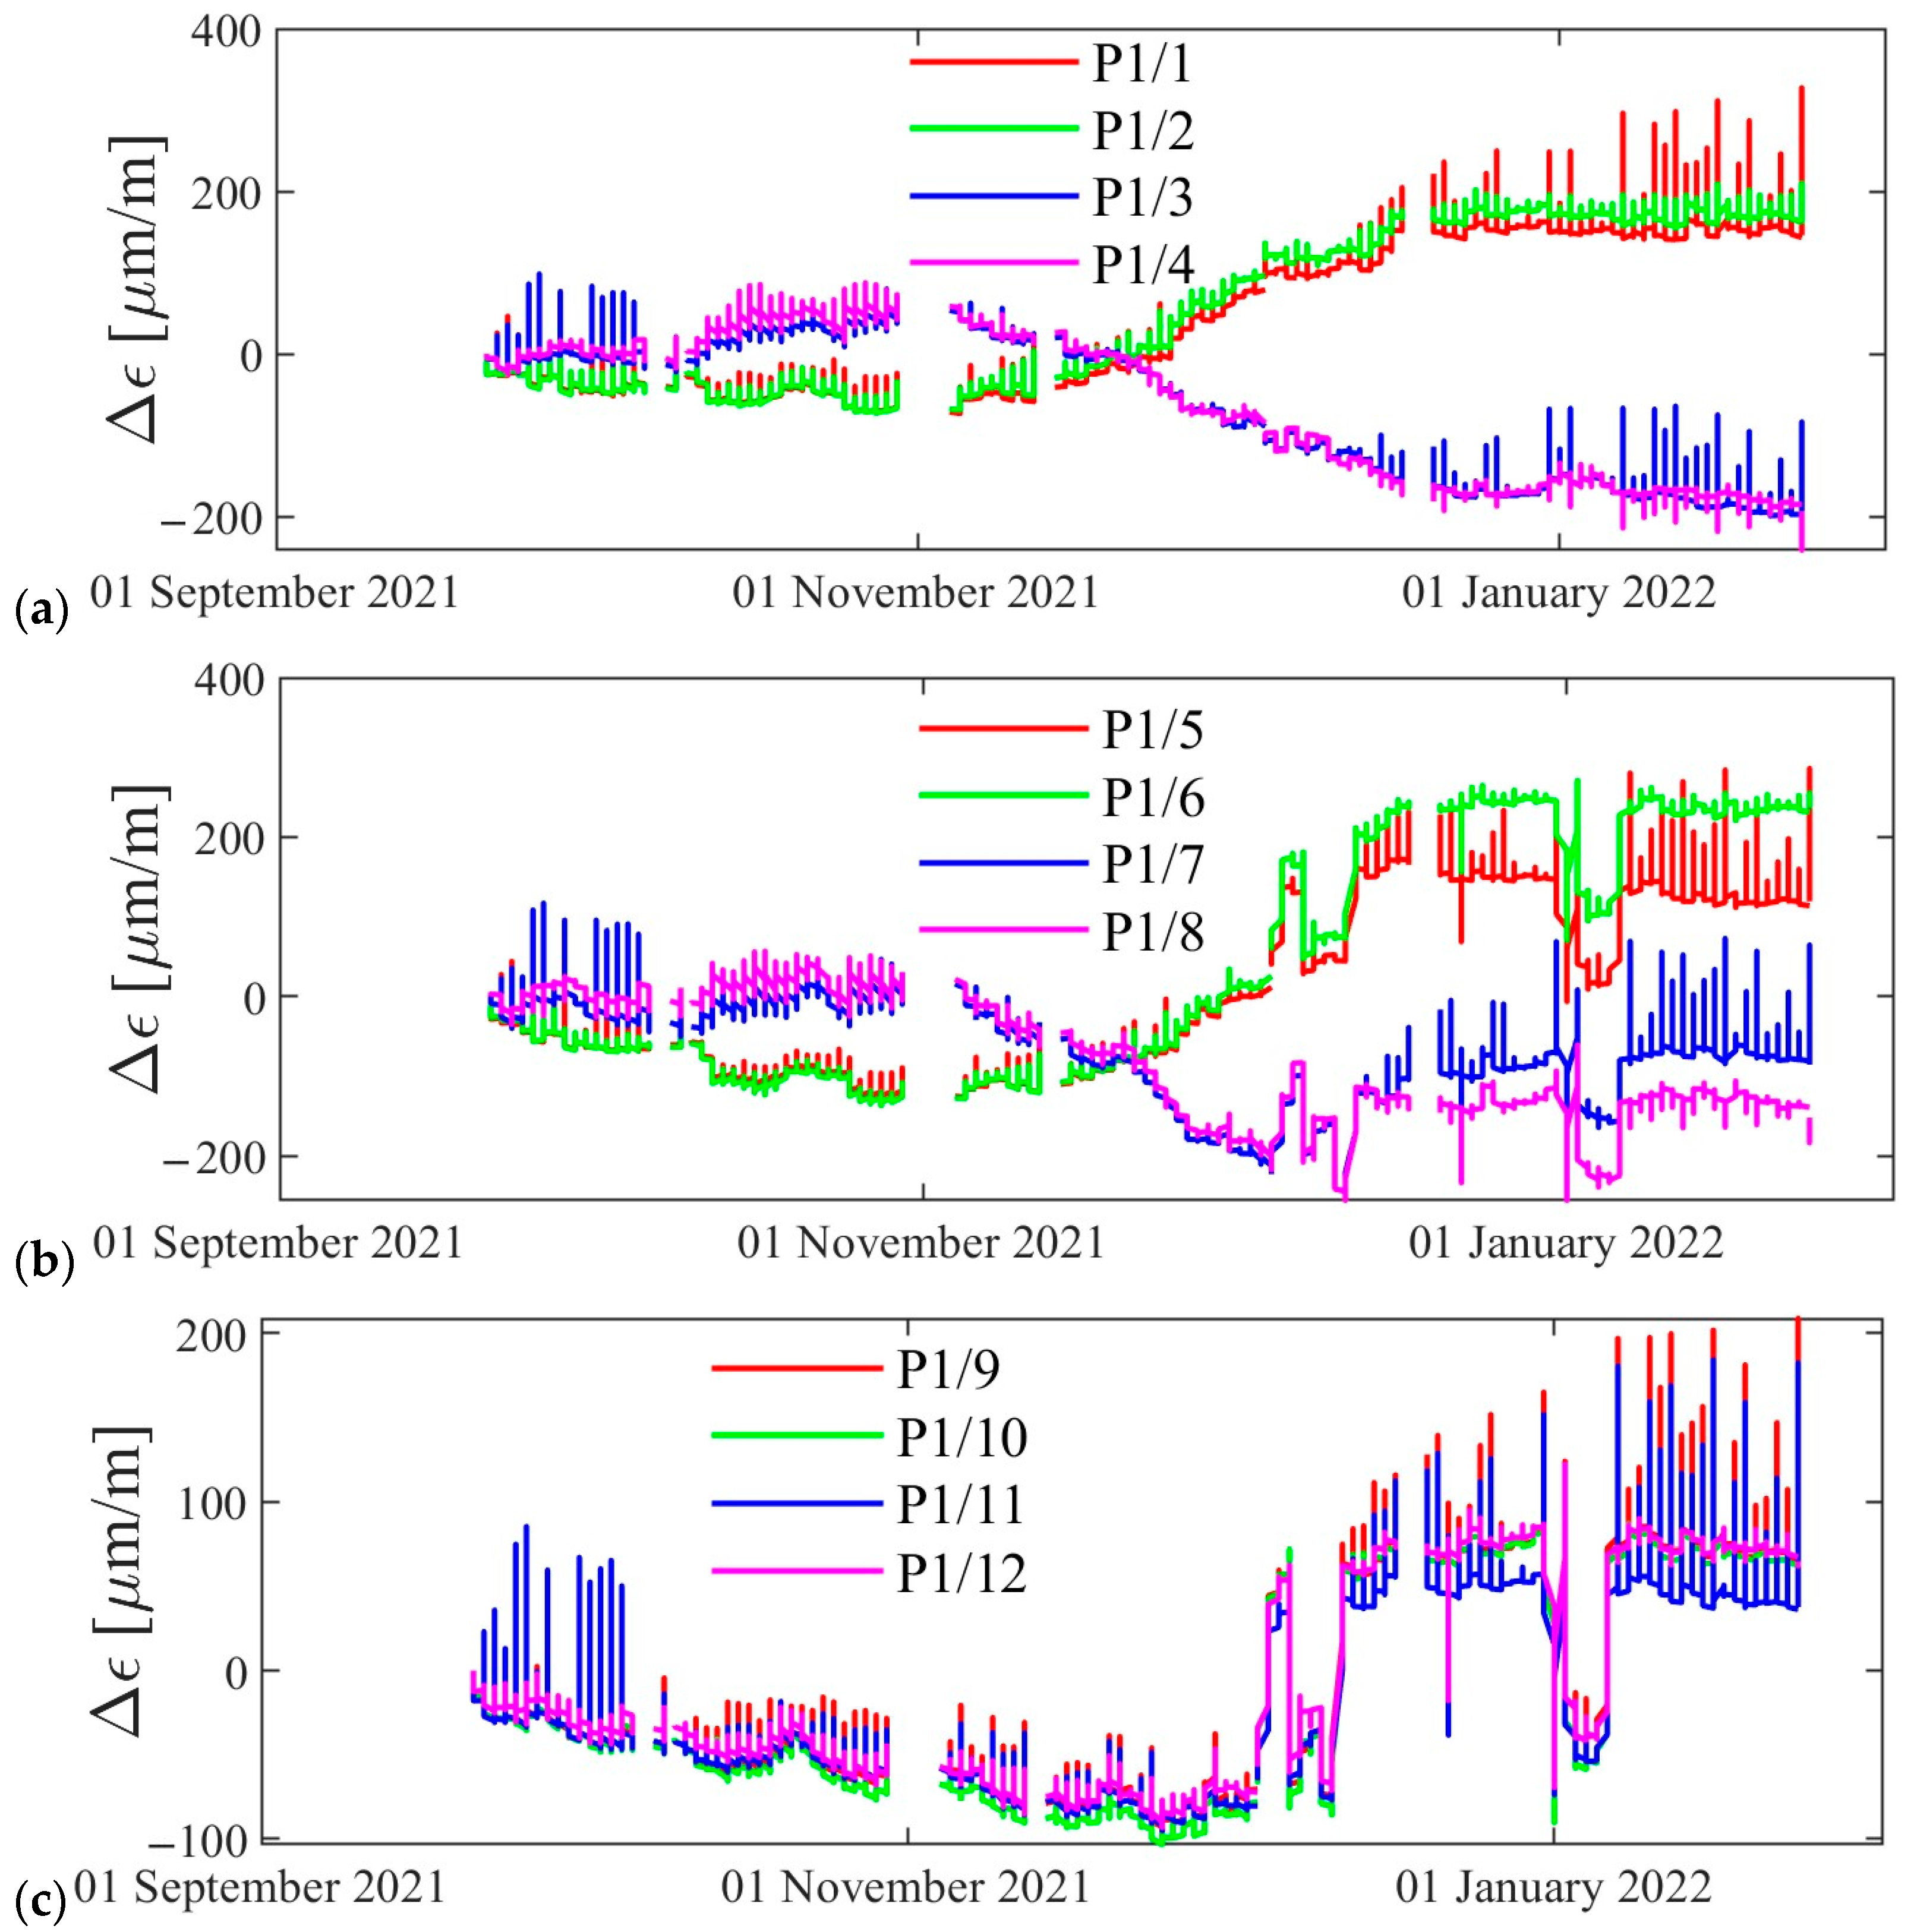
4.3. Measurement Results

The strain gauge results are presented in a segmented manner. Firstly, longer-term data series are presented, which aim to offer an overview of the daily cyclical elongation variations triggered by temperature changes and the major construction phases. Initially, observations from measurement site P1, at the pylon, are synthesized. Figure 11a,b showcase the results from strain gauges P1/1–P1/4 (upper chain) and P1/5–P1/8 (lower chain). These graphs highlight substantial intra-day temperature-induced fluctuations, recording a difference of 100–120 μm/m (21–25.2 MPa) between the lower and upper extreme fibres due to temperature shifts, resulting in additional stress on the structure. Meanwhile, Figure 11c illustrates the strain changes of sensors P1/9–P1/12 along the neutral axis. A more notable change is noted from late November to early December 2021, primarily attributable to construction activities involving the construction stages of the deck plate between the pylons and the demolition of the reinforced concrete deck plate and steel stringers in the side spans. The strain gauges located near the upper extreme fibres (P1/1–P1/2 and P1/5–P1/6) experience increased tension, while those near the lower extreme fibres (P1/3–P1/4 and P1/7–P1/8) undergo higher compression. Along the neutral axis (Figure 11c), all sensors indicate a slight increase in tension starting in early December 2021.
By averaging and subtracting the measured values from the respective strain gauges, the strain change curves are derived, depicting the effect of normal force, ΔεN, and bending moment changes, ΔεM (Figure 12). It is evident that the normal forces undergo minimal change, while the bending moment increases significantly in both the upper and lower chains. The measurement charts display continuity, apart from minor fluctuations within a day, suggesting no movement in the chain links during this timeframe.
The evaluation of the measurement results at the test sites also includes separate Sundays (Figure 13), when no construction work occurred, enabling the analysis of solely meteorological influences, primarily temperature changes. On 27 June 2021, variations of 110–125 μm/m were observed in the daily strain near the upper extreme fibre of P1/1 and P1/2 (inflow side, upper chain, Buda side). Correspondingly, lower values, in the range of 80–100 μm/m and 60–65 μm/m, were recorded on 4 July and 11 July 2021, respectively, mainly at P1/2 (south side of the chain). The recorded air temperatures in Budapest ranged from 19 to 31 °C on these days, with a temperature fluctuation of 11–12 °C, although no significant changes in the structural behaviour occurred during this period. The effect of daily temperature fluctuations (heating and cooling) is clearly visible in the measurement results. The variations caused by daily temperature changes are comparable to the strains observed during the proof load test. The maximum measured daily variation in the strain, normal force, and bending moment for the pylon sites are shown in Table 1. In the upper chain elements, the maximum change is 125 μm/m, while it is 140 μm/m for the lower ones in the extreme fibres. In the neutral fibre, the magnitude of the maximum strain variation is 80 μm/m. The results show a quasi-linear strain pattern within the sections. Notably, for sensor sets P1 and P3, larger strains (tension) are observed in the upper fibres compared to the lower ones. Conversely, an inverse pattern is observed for sensor sets P2 and P4. This trend illustrates a linear increase towards the top extreme fibres, influenced by additional moments in the chain links.
The maximum normal force and bending moment variations at the pylons (P1–P4) due to the proof load test, reconstruction, and daily temperature fluctuations are derived according to the methodology described in Section 4.3, and the results are summarized in Table 2. The analysis of the data suggests that daily temperature variations could result in additional bending moments of up to 102% (P4, upper chain—141 kNm vs. 285 kNm) compared to the values observed during the proof load test (~80% of the design live load of the bridge)). Furthermore, the normal force measurements even show a 58% higher value (P1, upper chain—1206 kN vs. 1904 kN) than those registered during the load testing. This highlights the high sensitivity of chain bridges to temperature fluctuations, where geometric stiffness plays an important role. The mechanical background of this is that the chain system has a special shape under the self-weight of the structure (causing approximately 12,000 kN tensile normal force), which can change significantly with temperature change. Unlike beam-type bridges, where temperature change does not cause a significant normal force, in chain bridges, the interaction between the chains and the deck system can change because of temperature change. When the temperature increases, the chain will be longer, increasing the clear height of the structure. This effect can lead to a reduction in the normal force in the chain elements, causing a reduction in the geometric stiffness of the system, leading to internal force transfer between the chain and stiffening girders of the deck system. In this case, a larger part of the internal forces are absorbed by the stiffening girders of the bridge deck system. The same effect can also occur in the opposite direction, where a drop in temperature increases the normal force in the chain system, which can be observed between summer and winter.
The results also show that if the bending moment applied by the live load would cause the pins to rotate, a daily temperature change would also cause them to rotate on a daily basis. However, most of the pins did not rotate during the proof test load, even under the internal forces caused by the temperature change. Both prove that the pins of this historical bridge are stuck and that the static skeleton of the structure can be considered fixed within the static calculations under the live load and meteorological loads.
Furthermore, reconstruction significantly increases the effect on normal forces and bending moments due to reduced self-weight. For instance, the bending moment variation in the upper chain at location P1 increased by approximately 380% (147 kNm vs. 702 kNm). Although the lower chains had relatively small bending moments (<30 kNm) during the proof load test, the normal forces experienced a significant increase, measuring 267% higher at location P2 (801 kN vs. 2943 kN). These results emphasise the dominance of dead load and self-weight in the case of chain bridges. The measurement results also showed that even the most significant bending moment change during the construction could not initiate a rotation of the pins, showing that they are badly corroded and completely stuck.
For easier interpretation and presentation of the results, the cross-sectional resistances of the chains with nominal geometric dimensions are also evaluated for comparison purposes with the measured internal forces. In 2015, at the BME Department of Structural Engineering, a statistical evaluation of previous tensile tests from 1913 and 1948 was carried out, and the characteristic yield strength, fyk, was determined. Based on the measured values, the design resistances are calculated by Eurocode 3 formulae, as follows: the pure tensile resistance of a chain using nominal cross-section properties is NRd = A × fykM0 = 1274 cm2 × 28.1 kN/cm2/1.0 = 35,799 kN, and the bending moment resistance of a cross section is MRd = W × fykM0 = 7749 cm3 × 28.1 kN/cm2/1.0 = 2177.5 kNm. It can be seen that the largest change in the normal force and bending moment within the chain system resulting from the proof load test, reconstruction, or temperature change reaches only 13% of the tensile resistance and 33% of the bending resistance, respectively.
It is crucial to highlight that chains with fixed pins are subjected to a combination of axial tension and bending moments, compounded by the effects of corrosion on their cross-sectional properties, thereby reducing their overall resistance.

5. Summary and Conclusions

This paper presents the results of two temporary measurements carried out on the 175-year-old historic Széchenyi Chain Bridge during its reconstruction process. The major objective of the measurements was to investigate the rotational capacity of the pins between the chain elements (eyebars). This can significantly affect the structural integrity of the bridge, depending on the corrosion state of the chains, and has a clear impact on the further lifetime of the structure, which had to be assessed by the designers.
The first measurement was a proof load test, which aimed to check whether the live load (traffic load) could cause the pins of the bridge to rotate. The second measurement was taken by a six-month temporary monitoring system operating during the reconstruction process, aiming to check the structural behaviour of the bridge over a longer period of time while monitoring the rotation of the pins under temperature changes and during the removal of the old concrete deck, which was replaced by a new orthotropic steel deck system. Based on the on-site measurements, the following conclusions about the bridge behaviour could be drawn:
  • All the measured pins are stuck, so no rotations were expected due to the live load (proof test load), temperature change, or the removal of the concrete deck during the bridge reconstruction.
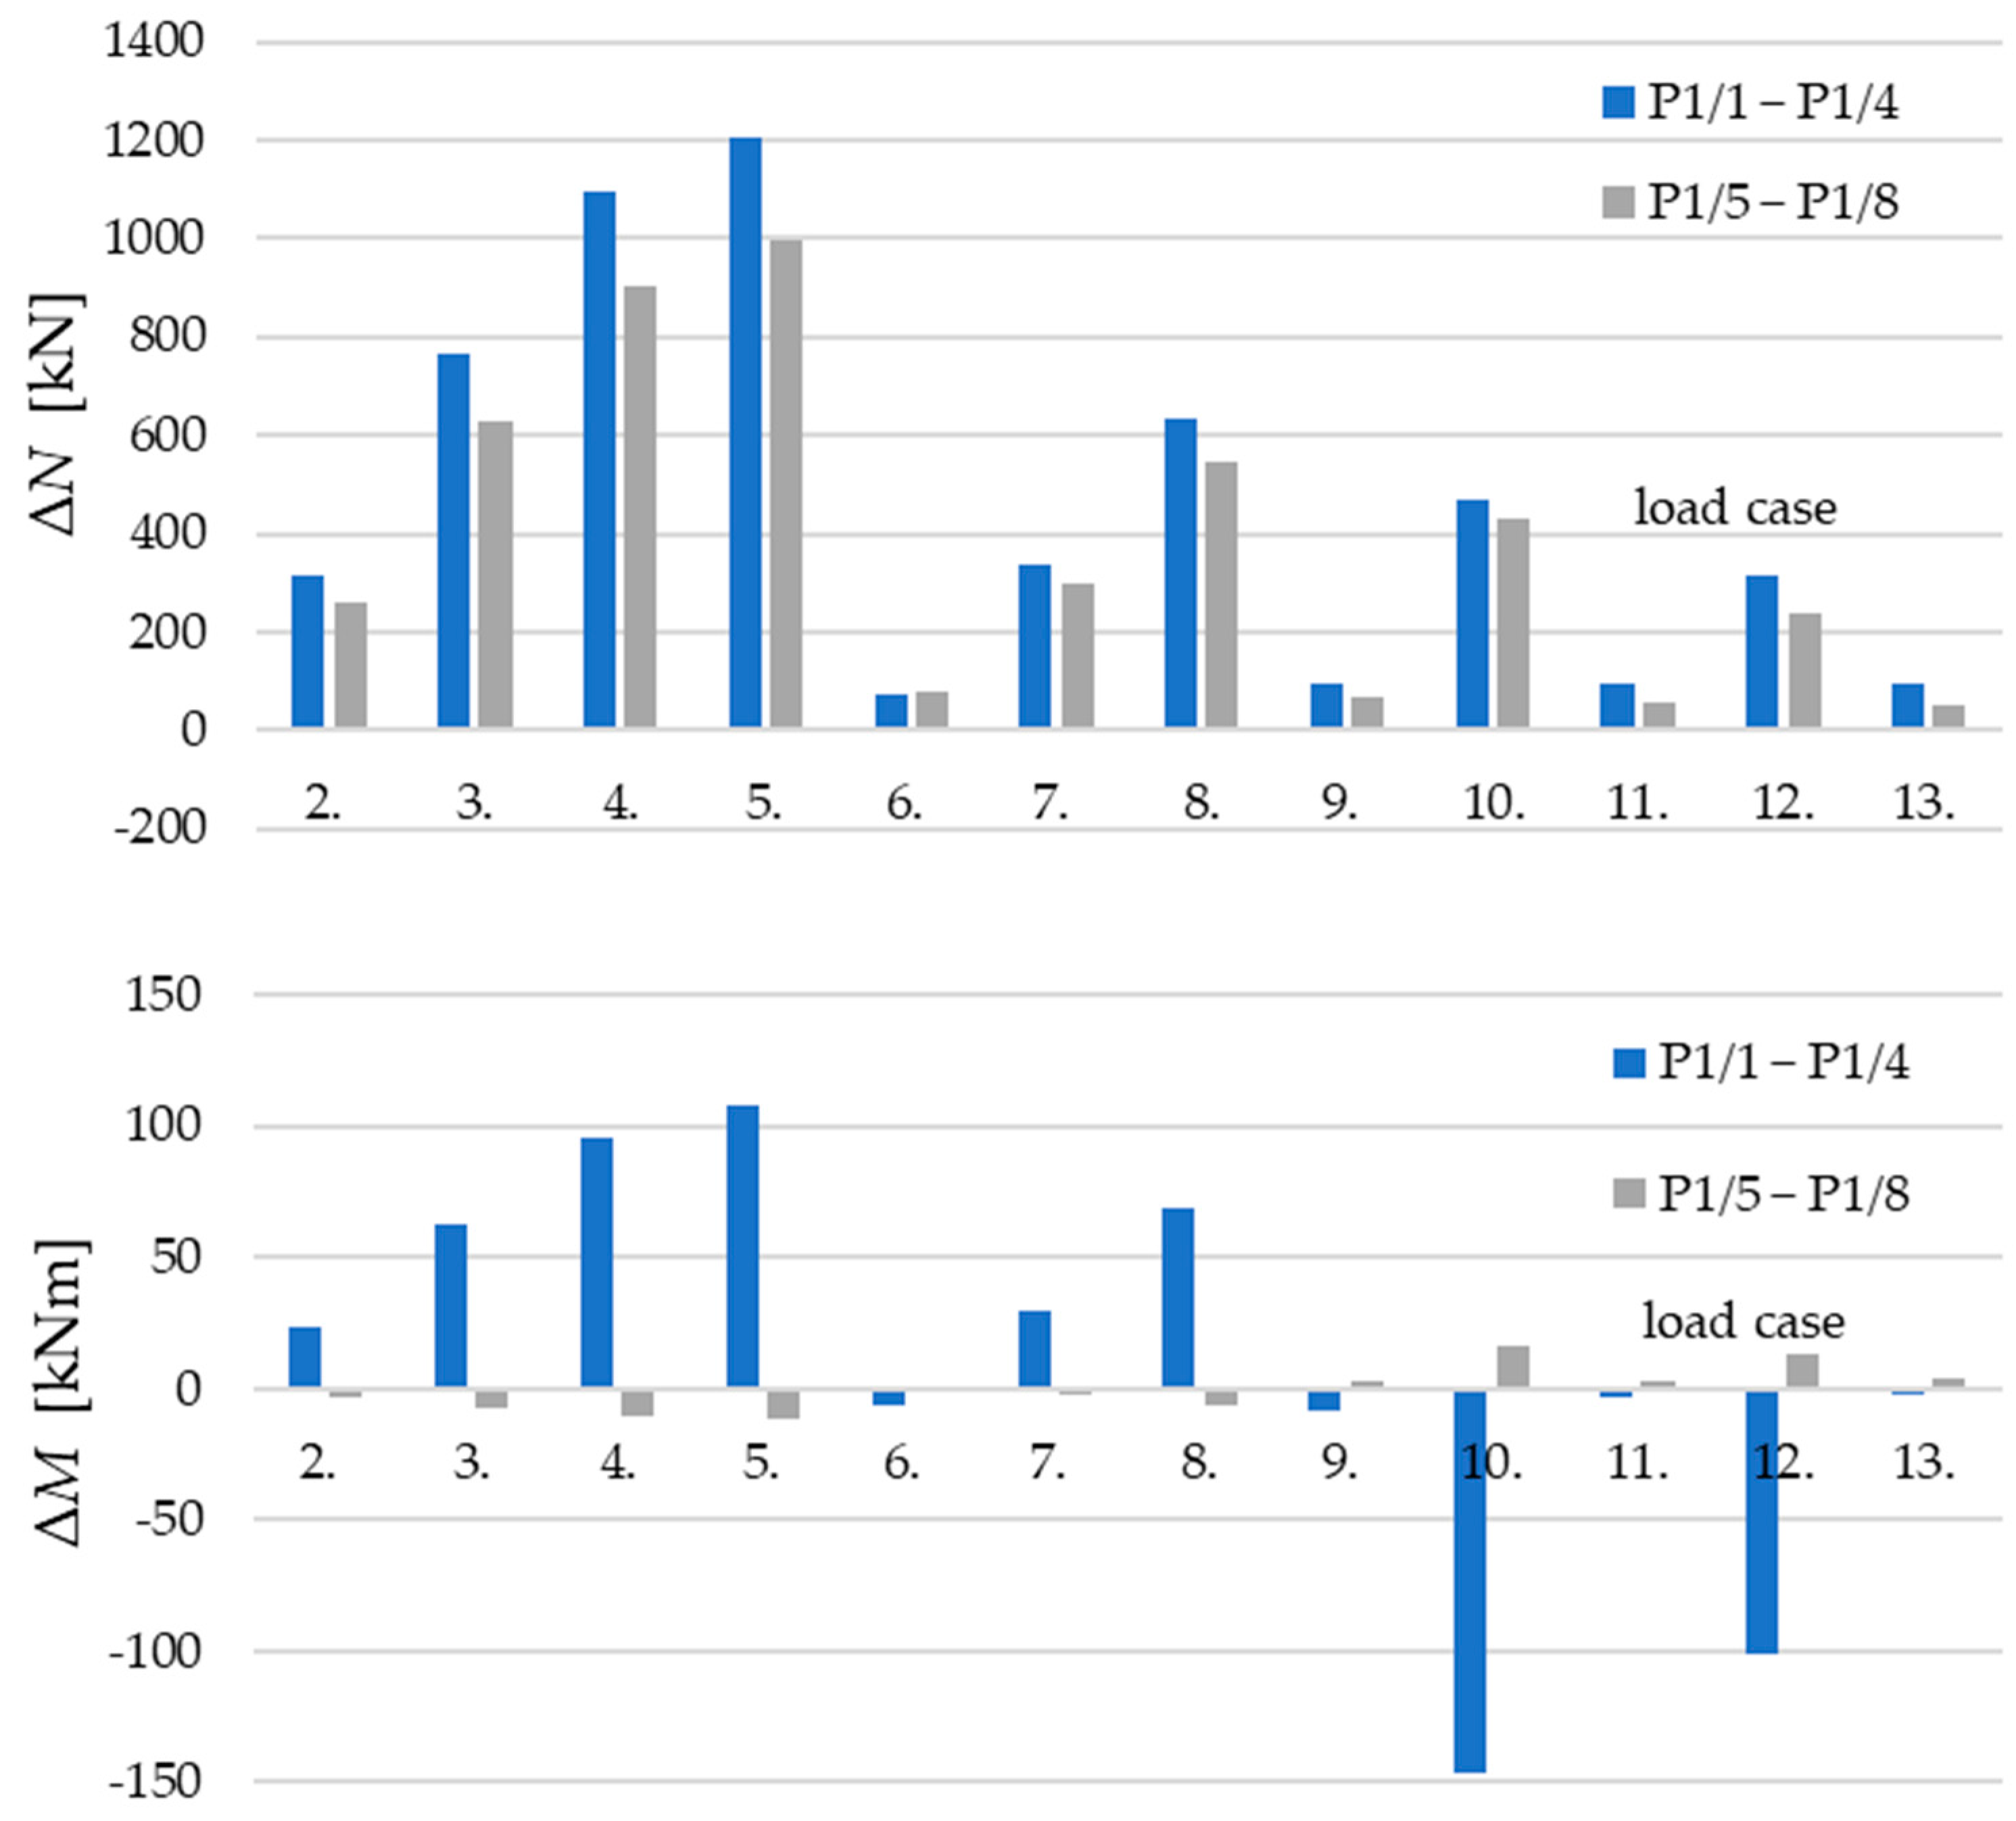
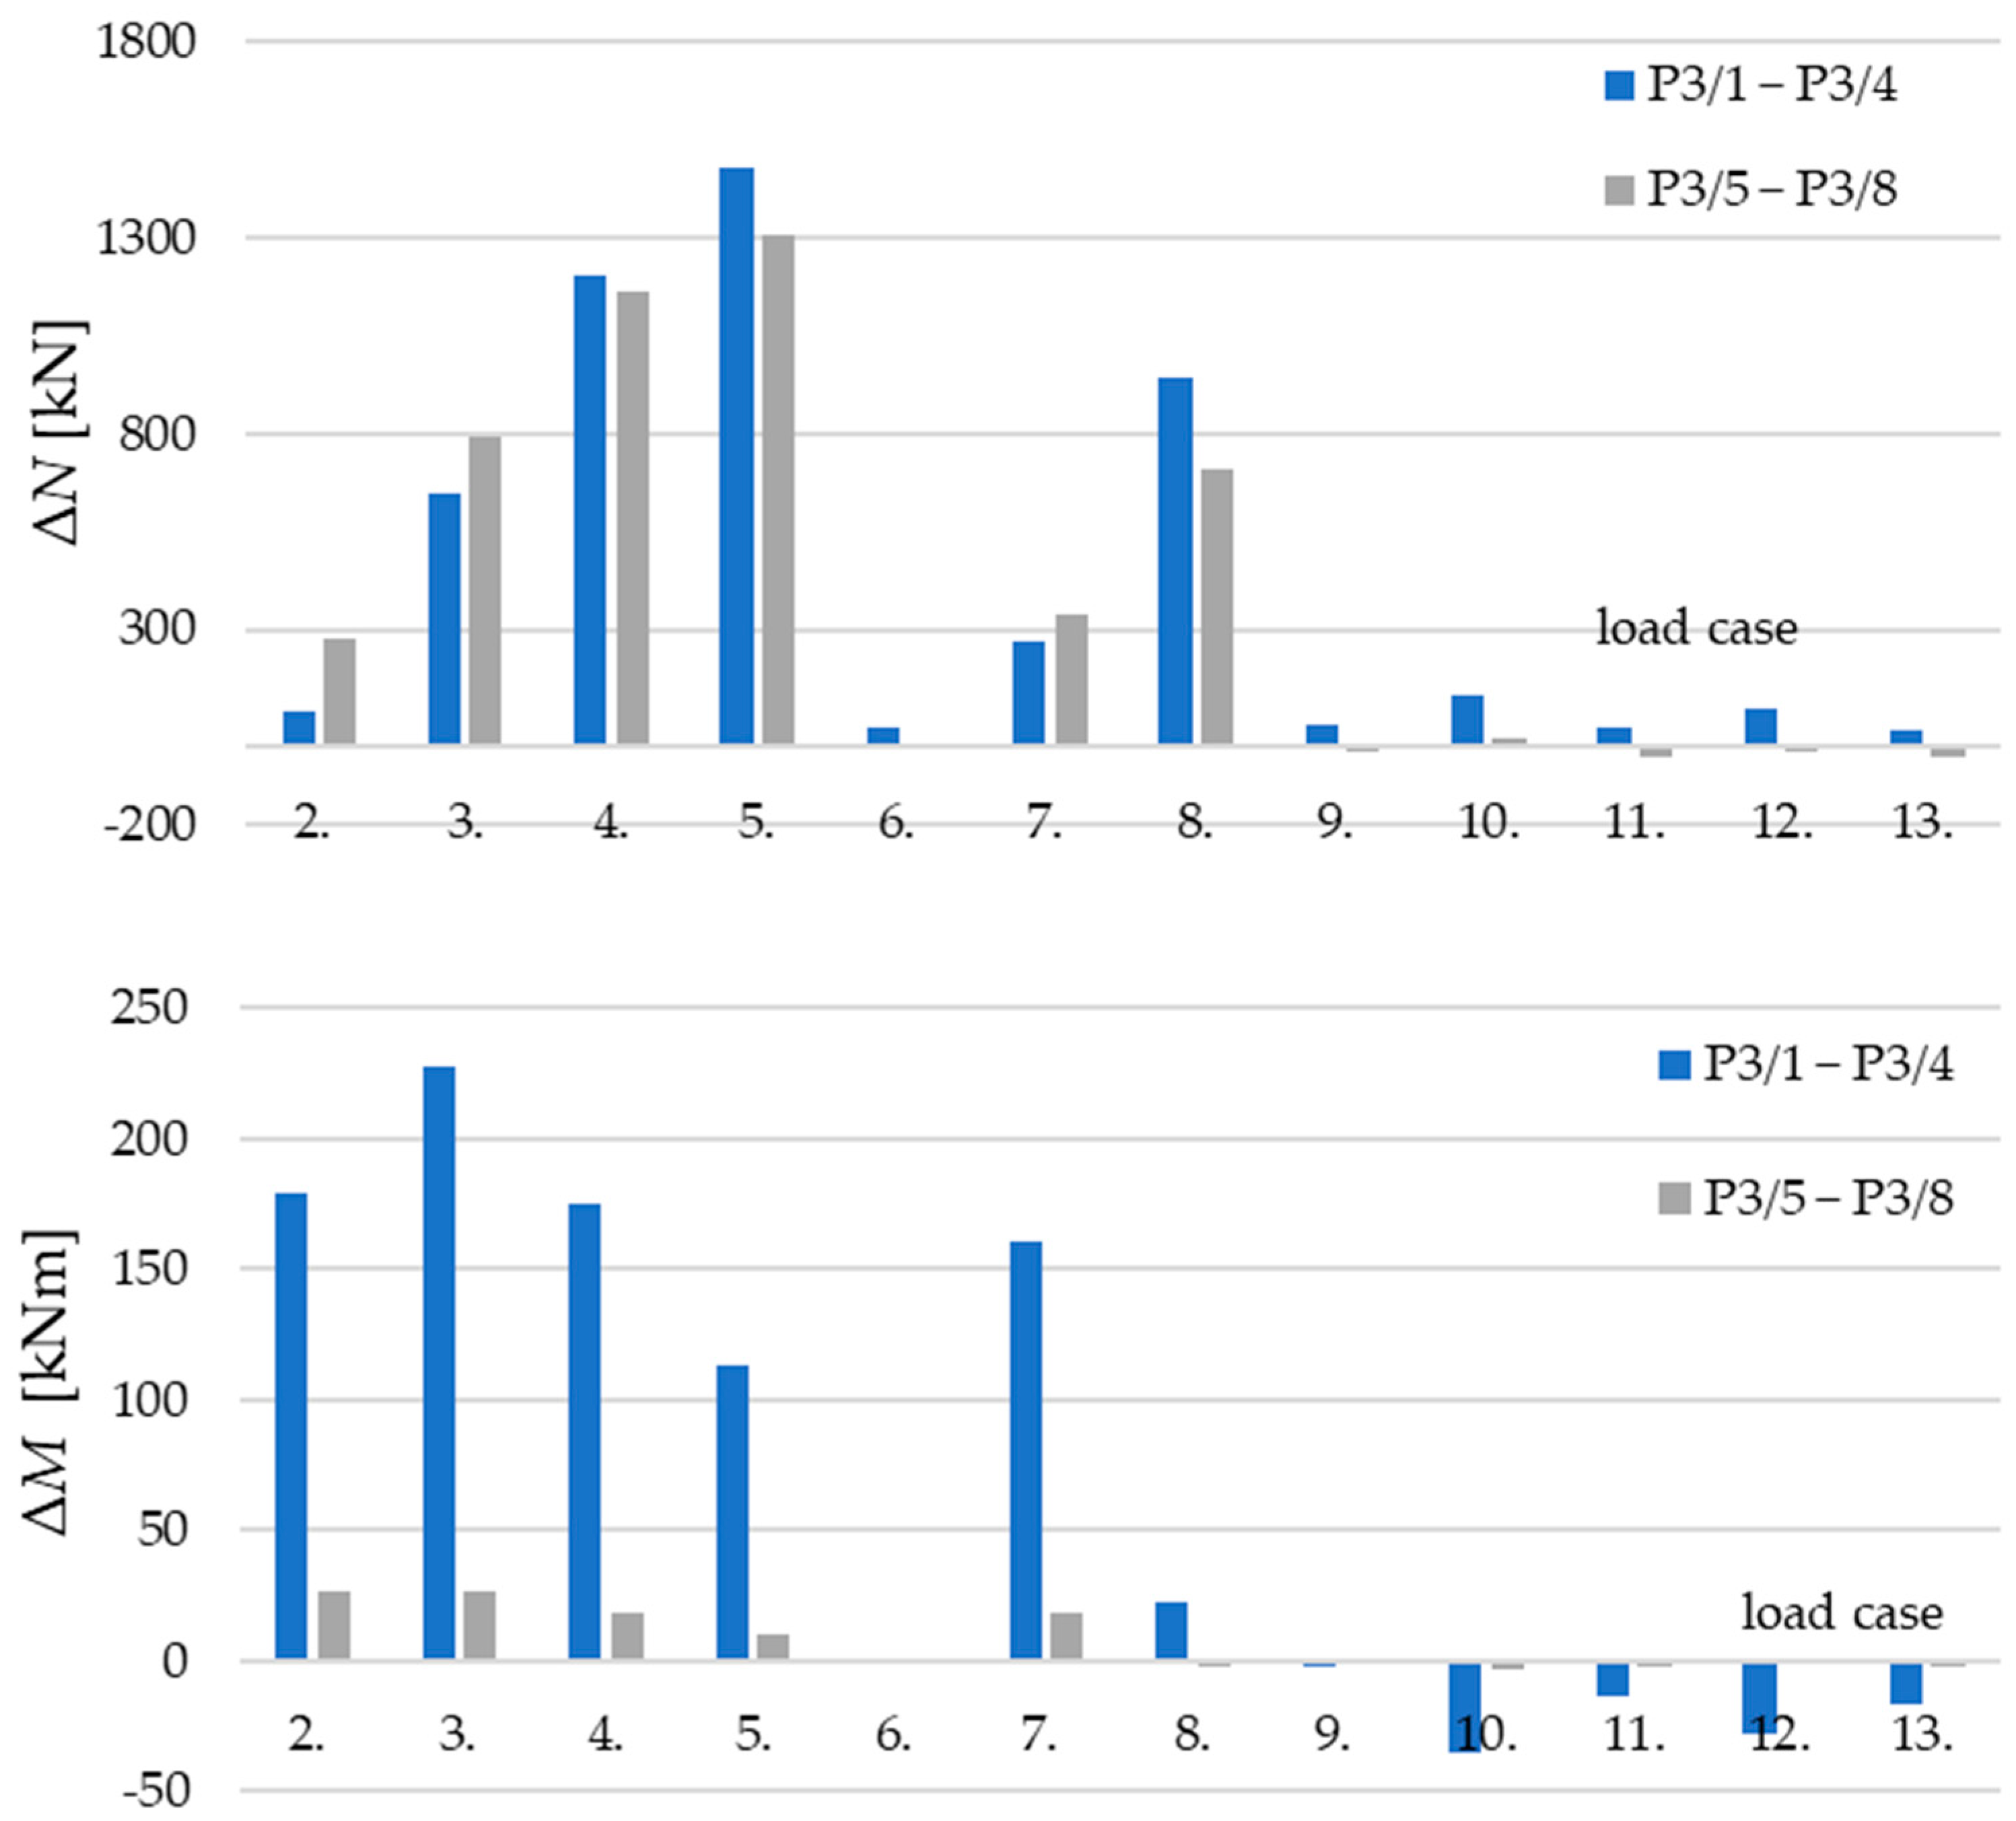
  • The internal forces resulting from daily and/or seasonal temperature changes can equal or exceed the magnitude of the internal forces resulting from the design traffic load; the largest normal force and bending moment changes compared to the characteristic resistances from the proof load test are 3% and 10%, respectively, whereas they are 5% and 15%, respectively, for temperature changes.
  • The effect of reconstruction was dominant, with the largest normal force and bending moment changes reaching 13% of the tensile resistance and 33% of the bending resistance, respectively, but these significant internal force changes could not cause the pins to rotate.
  • Normal stresses due to bending within the chain elements are significant, and therefore, the bending component should always be considered in the static verification of the chain elements.
  • Half-a-year-long monitoring of data could significantly contribute to the understanding of the structural behaviour of the Széchenyi Chain Bridge and its specialties, including (i) the error in the pin rotation capacity and (ii) significant internal forces due to temperature change, which were not previously considered significant issues during the design process.
  • The change in normal force has a significant effect on the geometric stiffness of the chain system, as shown by the analysis of the monitoring system data. This effect can also be caused by temperature change, which warrants attention from the designers.

Author Contributions

Conceptualization, B.K. and L.D.; methodology, B.K. and L.D.; software, D.K..; investigation, B.K. and D.K.; resources, B.K. and L.D.; data curation, D.K.; writing—original draft preparation, D.K.; writing—review and editing, B.K. and L.D.; visualization, D.K.; supervision, B.K. and L.D.; funding acquisition, B.K. All authors have read and agreed to the published version of the manuscript.

Funding

This research was funded by the Hungarian Academy of Sciences, grant number MTA-BME Lendület LP2021-06/2021 “Theory of new generation steel bridges”.

Data Availability Statement

The raw data supporting the conclusions of this article will be made available by the authors on request.

Acknowledgments

The authors would like to express special thanks to the designers (Főmterv Co. and MSC Ltd. design offices) of the bridge reconstruction for their cooperation in the expertizing tasks and evaluation of the on-site measurements. Special thanks are also given to Hídépítő Co., who executed the reconstruction work of the bridge, provided the opportunity to execute the on-site measurements, and always offered strong technical support.

Conflicts of Interest

The authors declare no conflicts of interest.

References

  1. Åesson, B. Understanding Bridge Collapses, 1st ed.; CRC Press: London, UK, 2008. [Google Scholar]
  2. Kövesdi, B.; Kollár, D.; Dunai, L.; Horváth, A. Reliability analysis-based investigation of the historical Széchenyi Chain Bridge deck system. Results Eng. 2022, 15, 100555. [Google Scholar] [CrossRef]
  3. Neves, A.C.; González, I.; Leander, J.; Karoumi, R. Structural health monitoring of bridges: A model-free ANN-based approach to damage detection. J. Civ. Struct. Health Monit. 2017, 7, 689–702. [Google Scholar] [CrossRef]
  4. Neves, A.C.; Leander, J.; González, I.; Karoumi, R. An approach to decision-making analysis for implementation of structural health monitoring in bridges. Struct Control Health Monit. 2019, 26, 1. [Google Scholar] [CrossRef]
  5. Li, H.; Ou, J.P. Design approach of health monitoring system for cable-stayed bridges. In Proceedings of the 2nd International Conference of Structural Health Monitoring for Intelligent Infrastructure, Shenzhen, China, 16–18 November 2005. [Google Scholar]
  6. Hovhanessian, G. Health monitoring of cable stayed structures experience and implementation. In Proceedings of the 24th Conference and Exposition on Structural Dynamics, St. Louis, MO, USA, 30 January–2 February 2006. [Google Scholar]
  7. Dacol, V.; Caetano, E.; Correia, J.R. Modal identification and damping performance of a full-scale GFRP-SFRSCC hybrid footbridge. Struct. Control Health Monit. 2022, 29, e3137. [Google Scholar] [CrossRef]
  8. Nicoletti, V.; Quarchioni, S.; Tentella, L.; Martini, R.; Gara, F. Experimental Tests and Numerical Analyses for the Dynamic Characterization of a Steel and Wooden Cable-Stayed Footbridge. Infrastructures 2023, 8, 100. [Google Scholar] [CrossRef]
  9. Degrauwe, D.; De Roeck, G.; Lombaert, G. Uncertainty quantification in the damage assessment of a cable-stayed bridge by means of fuzzy numbers. Comput. Struct. 2009, 87, 1077–1084. [Google Scholar] [CrossRef]
  10. Li, H.; Li, S.; Ou, J.; Li, H. Modal identification of bridges under varying environmental conditions: Temperature and wind effects. Struct. Control Health Monit. 2010, 17, 495–512. [Google Scholar] [CrossRef]
  11. Xiao, F.; Hulsey, J.L.; Balasubramanian, R. Fiber optic health monitoring and temperature behavior of bridge in cold region. Struct. Control Health Monit. 2017, 24, e2020. [Google Scholar] [CrossRef]
  12. Ding, Y.; Xiao, F.; Zhu, W.; Xia, T. Structural health monitoring of the scaffolding dismantling process of a long-span steel box girder viaduct based on BOTDA technology. Adv. Civ. Eng. 2019, 2019, 5942717. [Google Scholar] [CrossRef]
  13. Xiao, F.; Hulsey, J.L.; Chen, G.S.; Xiang, Y. Optimal static strain sensor placement for truss bridges. Int. J. Distrib. Sens. Netw. 2017, 13, 1550147717707929. [Google Scholar] [CrossRef]
  14. Okasha, N.M.; Frangopol, D.M. Integration of structural health monitoring in a system performance based life-cycle bridge management framework. Struct. Infrastruct. Eng. 2012, 18, 316–333. [Google Scholar] [CrossRef]
  15. Li, D.; Hu, Q.; Ou, J. Fatigue damage evolution and monitoring of carbon fiber reinforced polymer bridge cable by acoustic emission technique. Int. J. Distrib. Sens. Netw. 2012, 8, 282139. [Google Scholar] [CrossRef]
  16. Li, D.; Ou, J.; Lan, C.; Li, H. Monitoring and failure analysis of corroded bridge cables under fatigue loading using acoustic emission sensors. Sensors 2012, 12, 3901–3915. [Google Scholar] [CrossRef] [PubMed]
  17. Li, H.; Lan, C.M.; Ju, Y.; Li, D.S. Experimental and Numerical Study of the Fatigue Properties of Corroded Parallel Wire Cables. J. Bridg. Eng. 2011, 17, 211–220. [Google Scholar] [CrossRef]
  18. Li, H.; Li, S.; Ou, J.; Li, H. Reliability assessment of cable-stayed bridges based on structural health monitoring techniques. Struct. Infrastruct. Eng. 2012, 8, 829–845. [Google Scholar] [CrossRef]
  19. Li, H.; Ou, J. The state of the art in structural health monitoring of cable-stayed bridges. J. Civ. Struct. Health Monit. 2016, 6, 43–67. [Google Scholar] [CrossRef]
  20. Al-Hijazeen, A.Z.O.; Fawad, M.; Gerges, M.; Koris, K.; Salamak, M. Implementation of digital twin and support vector machine in structural health monitoring of bridges. Arch. Civ. Eng. 2023, 69, 31–47. [Google Scholar] [CrossRef]
  21. Barros, B.; Conde, B.; Cabaleiro, M.; Riveiro, B. Deterministic and probabilistic-based model updating of aging steel bridges. Structures 2023, 54, 89–105. [Google Scholar] [CrossRef]
  22. Borlenghi, P.; Gentile, C.; Pirrò, M. Vibration-Based Structural Health Monitoring of a Historic Arch Bridge. In Proceedings of the Experimental Vibration Analysis for Civil Engineering Structures, EVACES 2023, Milan, Italy, 30 August–1 September 2023; Lecture Notes in Civil Engineering; Limongelli, M.P., Giordano, P.F., Quqa, S., Gentile, C., Cigada, A., Eds.; Springer: Berlin/Heidelberg, Germany, 2023; Volume 432. [Google Scholar]
Figure 1. Széchenyi Chain Bridge located in Budapest, Hungary. (a) Side view of Széchenyi Chain Bridge with the main dimensions (m). (b) Original bridge built between 1839 and 1849. (c) Novel structure built between 1913 and 1915.
Buildings 14 00535 g001
Figure 2. Cross section of the bridge (a) before and (b) after its renewal in 2021–2023, with the main dimensions (mm).
Buildings 14 00535 g002
Figure 3. Measurement locations for proof load test executed in 2018.
Buildings 14 00535 g003
Figure 4. Notation of strain gauges (i = 1…8) for proof load test in 2018: (a) Hx/i: strain gauges at abutment and (b) Px/i: strain gauges at pylon (x = 1…4).
Buildings 14 00535 g004
Figure 5. Examples of analysed load cases for proof load test in 2018 (trucks are denoted by red rectangles, while flow direction is shown by a red arrow).
Buildings 14 00535 g005
Figure 6. Derived measurement results at the abutment for proof load test in 2018.
Buildings 14 00535 g006
Figure 7. Derived measurement results at the pylon (side span) for proof load test in 2018.
Buildings 14 00535 g007
Figure 8. Derived measurement results at the pylon (main span) for proof load test in 2018.
Buildings 14 00535 g008
Figure 9. Position of strain gauges at the pylon—temporary monitoring system.
Buildings 14 00535 g009
Figure 10. Superstructure with suspended scaffolding after demolishing old concrete deck.
Buildings 14 00535 g010
Figure 11. Changes in strains in the pylon: (a) upper chain, (b) lower chain, and (c) neutral axis.
Buildings 14 00535 g011
Figure 12. Derived strain changes concerning normal force (ΔεN) and bending moment (ΔεM) on the upper and lower chains at measurement location P1.
Buildings 14 00535 g012
Figure 13. Strain changes within a day without construction works on the bridge: (ad) P1/1 – P1/4.
Buildings 14 00535 g013
Table 1. Measured maximum daily strain variations [μm/m].
FibreChainP1P2P3P4
TopUpper110–12585–110105–12080–105
Lower100–125110–135100–14095–140
NeutralUpper60–8035–8060–8040–80
Lower55–70
40–50
35–8065–8525–80
BottomUpper85–12045–50115–125
Lower40–110115–11545–11095–140
Table 2. Derived maximum normal force (ΔN) and bending moment (ΔM) variations due to proof load test (PLT), reconstruction (REC), and daily temperature fluctuations (ΔT).
ChainQuantityP1P2P3P4
PLTRECΔTPLTRECΔTPLTRECΔTPLTRECΔT
UpperΔN [kN]120615171904103616821439148245681768104223791426
ΔM [kNm]147702151146359268228457142141366285
LowerΔN [kN]99829961215801294311341305-131695925651132
ΔM [kNm]175601972326327027-22021347326
Disclaimer/Publisher’s Note: The statements, opinions and data contained in all publications are solely those of the individual author(s) and contributor(s) and not of MDPI and/or the editor(s). MDPI and/or the editor(s) disclaim responsibility for any injury to people or property resulting from any ideas, methods, instructions or products referred to in the content.

