Article

Analysis of Geometric Characteristics of Cracks and Delamination in Aerated Concrete Products Using Convolutional Neural Networks

by
Irina Razveeva
1,
Alexey Kozhakin
1,2,
Alexey N. Beskopylny
3,*,
Sergey A. Stel’makh
1,
Evgenii M. Shcherban’
4,
Sergey Artamonov
5,
Anton Pembek
6 and
Himanshu Dingrodiya
7
1
Department of Unique Buildings and Constructions Engineering, Don State Technical University, 344003 Rostov-on-Don, Russia
2
OOO VDK, SKOLKOVO, Boulevard, 42, 121205 Moscow, Russia
3
Department of Transport Systems, Faculty of Roads and Transport Systems, Don State Technical University, 344003 Rostov-on-Don, Russia
4
Department of Engineering Geology, Bases, and Foundations, Don State Technical University, 344003 Rostov-on-Don, Russia
5
Department of Elasticity Theory, Faculty of Mechanics and Mathematics, Lomonosov Moscow State University, Leninskiye Gory, 1, 119991 Moscow, Russia
6
Department of Quantum Statistics and Field Theory, Faculty of Physics, Lomonosov Moscow State University, Leninskiye Gory, 1, 119991 Moscow, Russia
7
Department of Chemical Engineering, Ujjain Engineering College, Ujjain 456010, MP, India
*
Author to whom correspondence should be addressed.
Buildings 2023, 13(12), 3014; https://doi.org/10.3390/buildings13123014
Submission received: 27 October 2023 / Revised: 22 November 2023 / Accepted: 29 November 2023 / Published: 2 December 2023
(This article belongs to the Section Building Materials, and Repair & Renovation)

Abstract

:
Currently, artificial intelligence (AI) technologies are becoming a strategic vector for the development of companies in the construction sector. The introduction of “smart solutions” at all stages of the life cycle of building materials, products and structures is observed everywhere. Among the variety of applications of AI methods, a special place is occupied by the development of the theory and technology of creating artificial systems that process information from images obtained during construction monitoring of the structural state of objects. This paper discusses the process of developing an innovative method for analyzing the presence of cracks that arose after applying a load and delamination as a result of the technological process, followed by estimating the length of cracks and delamination using convolutional neural networks (CNN) when assessing the condition of aerated concrete products. The application of four models of convolutional neural networks in solving a problem in the field of construction flaw detection using computer vision is shown; the models are based on the U-Net and LinkNet architecture. These solutions are able to detect changes in the structure of the material, which may indicate the presence of a defect. The developed intelligent models make it possible to segment cracks and delamination and calculate their lengths using the author’s SCALE technique. It was found that the best segmentation quality was shown by a model based on the LinkNet architecture with static augmentation: precision = 0.73, recall = 0.80, F1 = 0.73 and IoU = 0.84. The use of the considered algorithms for segmentation and analysis of cracks and delamination in aerated concrete products using various convolutional neural network architectures makes it possible to improve the quality management process in the production of building materials, products and structures.

1. Introduction

The relevance of this research is due to the need to reduce the risks associated with the human factor in the production of construction products as well as in the construction of buildings and structures. The introduction of information technology is the key to solving problems that arise as a result of improper use of construction methods and production technologies that ultimately lead to emergency situations in construction or a decrease in the operational reliability of buildings and structures. Information technologies introduced into construction and production must undergo preliminary testing because of the scientific research, laboratory experiments and computational analysis obtained and carried out in connection with the processing of a large amount of experimental data.
At the same time, one of the most relevant building materials is cellular concrete, which allows us to solve several key problems in the construction of buildings and structures in a global sense: good energy efficiency, high-performance characteristics and environmental friendliness in many respects, thereby ensuring reliability during operation and throughout the life cycle of buildings and structures. At the same time, the production of cellular concrete products is accompanied by great risk due to the complexity of the structure and a large number of factors influencing the formation of the final quality of the resulting building compositions. In this regard, production technologies for producing cellular concrete and, first of all, aerated concrete products must be accompanied by and developed through the introduction of new smart, intelligent production technologies. Artificial intelligence methods are one of the key directions in the development of cellular concrete production.
Artificial intelligence is widely used in various fields, and the construction field is no exception, since the digitalization of construction sites is the most discussed and promising topic at the intersection of construction and information technology [1]. Conducting the construction process using intelligent technologies allows one to automatically receive in real time the entire set of accompanying documents; design documentation and reports; inspect the construction of a facility and track progress; monitor compliance with safety rules; identify inconsistencies at all stages of the life cycle of construction projects; and keep records of indicators and target dates for the completion of work, as well as monitor the quality of building materials, products and structures [2,3,4].
The introduction of “smart” algorithms for quality control of building materials is a key branch of development of computer vision (CV) technologies in the construction industry. There is an increase in the number of studies in this subject area everywhere. The study [5] considers a method for analyzing the structure of concrete using microscopy of hardened cement paste and crack segmentation using convolutional neural networks of the U-Net architecture. The proposed methods make it possible to segment areas containing a defect with the accuracy of 60% required by the researcher. In ref. [6], researchers note that convolutional neural networks, designed to classify images at individual pixels, are useful in detecting and classifying damage with high detail. The applied artificial neural networks and decision trees to predict the compressive strength of concrete with blast furnace slag and fly ash in [7] showed high accuracy between the predicted and actual strength of concrete, which makes these models applicable for testing the compressive strength of high-performance concrete in the long term. In ref. [8], the authors compared ensemble models of deep neural networks in order to develop the most accurate approach to predicting the strength of concrete. Research on the development of neural networks for quality control and predicting the properties of various building materials is presented in [9,10,11,12,13,14,15,16] and covers concrete containing recycled coarse aggregate [9,10], roller-compacted concrete pavement [11], bricks [12], fiber-reinforced concrete [13] and ultra-high-performance concrete [14].
Currently, it is also popular to introduce computer vision methods into the process of monitoring construction work on construction sites. Regular supervision of construction work and assessment of its quality are an important condition and guarantee of the completion of this work on time. Carrying out this type of control requires frequent physical observations. However, the use of computer vision for these purposes will automate and speed up these processes. For example, in ref. [17], an automated method was developed for measuring the geometric parameters of various building structures, while ref. [18] shows how computer vision can revolutionize the construction inspection process. The performance of three object-detection algorithms was compared based on average accuracy and inference time for bolt detection in a steel structure. Also, research on the development of neural networks designed to monitor the quality of construction work on a construction site is presented in [19,20,21,22] and covers image processing methods for detecting loosening of bolts and their defects in steel connections [19,22]; placement of reinforcement [20]; productivity of excavation processes in tunnels [21]; and recognition of the type of building material in general [23].
In addition to monitoring the quality of the construction process, it is also important to monitor compliance with safety regulations by workers during construction work. The use of intelligent monitoring systems based on computer vision in the field of security is one of the most popular methods today [24]. In the study [25], the authors developed methods for detecting safety violations among workers. As a result, a decision-making algorithm was defined that takes into account the interaction between the human, machine and material. In the study [26], the authors developed an algorithm for monitoring labor safety and health at a construction site using unmanned aerial systems and deep learning. Research on the development of safety monitoring systems on construction sites using computer vision methods is also presented in [27,28,29,30,31,32], covering monitoring of safety compliance at various stages of construction [28]; justification of hazards and measures to reduce them [29]; monitoring of the safety of builders [30]; management of health and safety on construction sites [31]; and prediction of unsafe behavior on construction sites [32].
The use of computer vision methods for regular periodic monitoring of various building structures and buildings is popular. The study in [33] developed a method for detecting cracks in concrete structures using a low-cost depth sensor. In ref. [34], a deep convolutional neural network was used to detect cracks in concrete. The application of convolutional neural networks is demonstrated in [35] based on a data set obtained from bridge inspection records recording concrete delamination and reinforcement exposure. In ref. [36], the authors developed and tested convolutional neural networks to search for cracks on a concrete road using unmanned aerial vehicles. Research on monitoring and finding various types of defects using computer vision is also presented in [37,38,39,40,41,42], covering methods for detecting cracks in concrete based on images [37]; detecting defects in brick and cellular concrete samples to prevent the spread of defective products [38,40]; and detecting and segmenting cracks on the surface of concrete [41].
Convolutional neural networks are designed specifically to work with data that have a spatial or raster structure, such as images. These intelligent solutions are aimed at effectively solving computer vision problems, such as detection, segmentation, etc., and are part of deep learning technologies. Currently, CNN are advanced solutions for automating human activities in all areas that require visual control and fast processing of a stream of photo and video data.
An analysis of the literature revealed a lack of research related to the detection of defects in cellular concrete and aerated concrete in particular. Aerated concrete is cellular concrete used for the construction of various types of walls (load-bearing and non-load-bearing), including complex shapes. This type of cellular concrete is quite easy to use and process, has good soundproofing and thermal insulation characteristics, fire safety and environmental friendliness. Laying aerated concrete blocks is a simple and fairly quick process, and the roughness of the surface of the products makes them easier to process [39].
Therefore, the scientific novelty of this study lies in the following:
-
Creating one’s own set of images of aerated concrete products [43,44];
-
Increasing the number of images to improve the generalizing ability of the model by applying our own augmentation algorithm [45];
-
Creating models based on the convolutional neural network of the U-Net architecture;
-
Creating models based on the convolutional neural network of the LinkNet architecture;
-
Implementing the authors’ SCALE algorithm for calculating the length of a detected defect [44].
The purpose of this study was to develop an innovative method for detecting cracks that appeared after applying a load and delamination as a result of the technological process, followed by estimating their length using convolutional neural networks (CNN) when assessing the condition of aerated concrete products.
To achieve this goal, the following tasks must be solved:
-
Preparation of a database of images of aerated concrete products, in which defects in the form of cracks and delamination of various lengths and widths are detected during visual inspection;
-
Justification and description of the selected architectures of convolutional neural networks U-Net and LinkNet;
-
Carrying out of the augmentation process to expand the training data set using the authors’ algorithm;
-
Implementation, debugging, optimization of parameters and testing of the resulting algorithms on a test sample;
-
Determination of quality metrics for developed intelligent models based on CNN;
-
Implementation of the authors’ algorithm for calculating the length of the detected defect in segmented images;
-
Evaluation of the obtained result and determination of recommendations for the use of intelligent models of semantic segmentation of cracks and delamination with their subsequent analysis.
-
The theoretical significance of this study is as follows:
-
Expansion of the theory about the possibilities of using computer vision in the construction industry, in particular when detecting defects in building materials, products and structures;
-
Description of the features of the technical and software implementation of computer vision algorithms, which should be taken into account when implementing them into practice.
-
The practical significance of the work lies in the following:
-
Implementation of technology for creating artificial systems capable of processing (including in real time) information from images obtained during construction monitoring of the structural state of materials, products and structures;
-
Practical implementation of the algorithm for determining the length of a cracks and delamination detected using an intelligent algorithm.

2. Materials and Methods

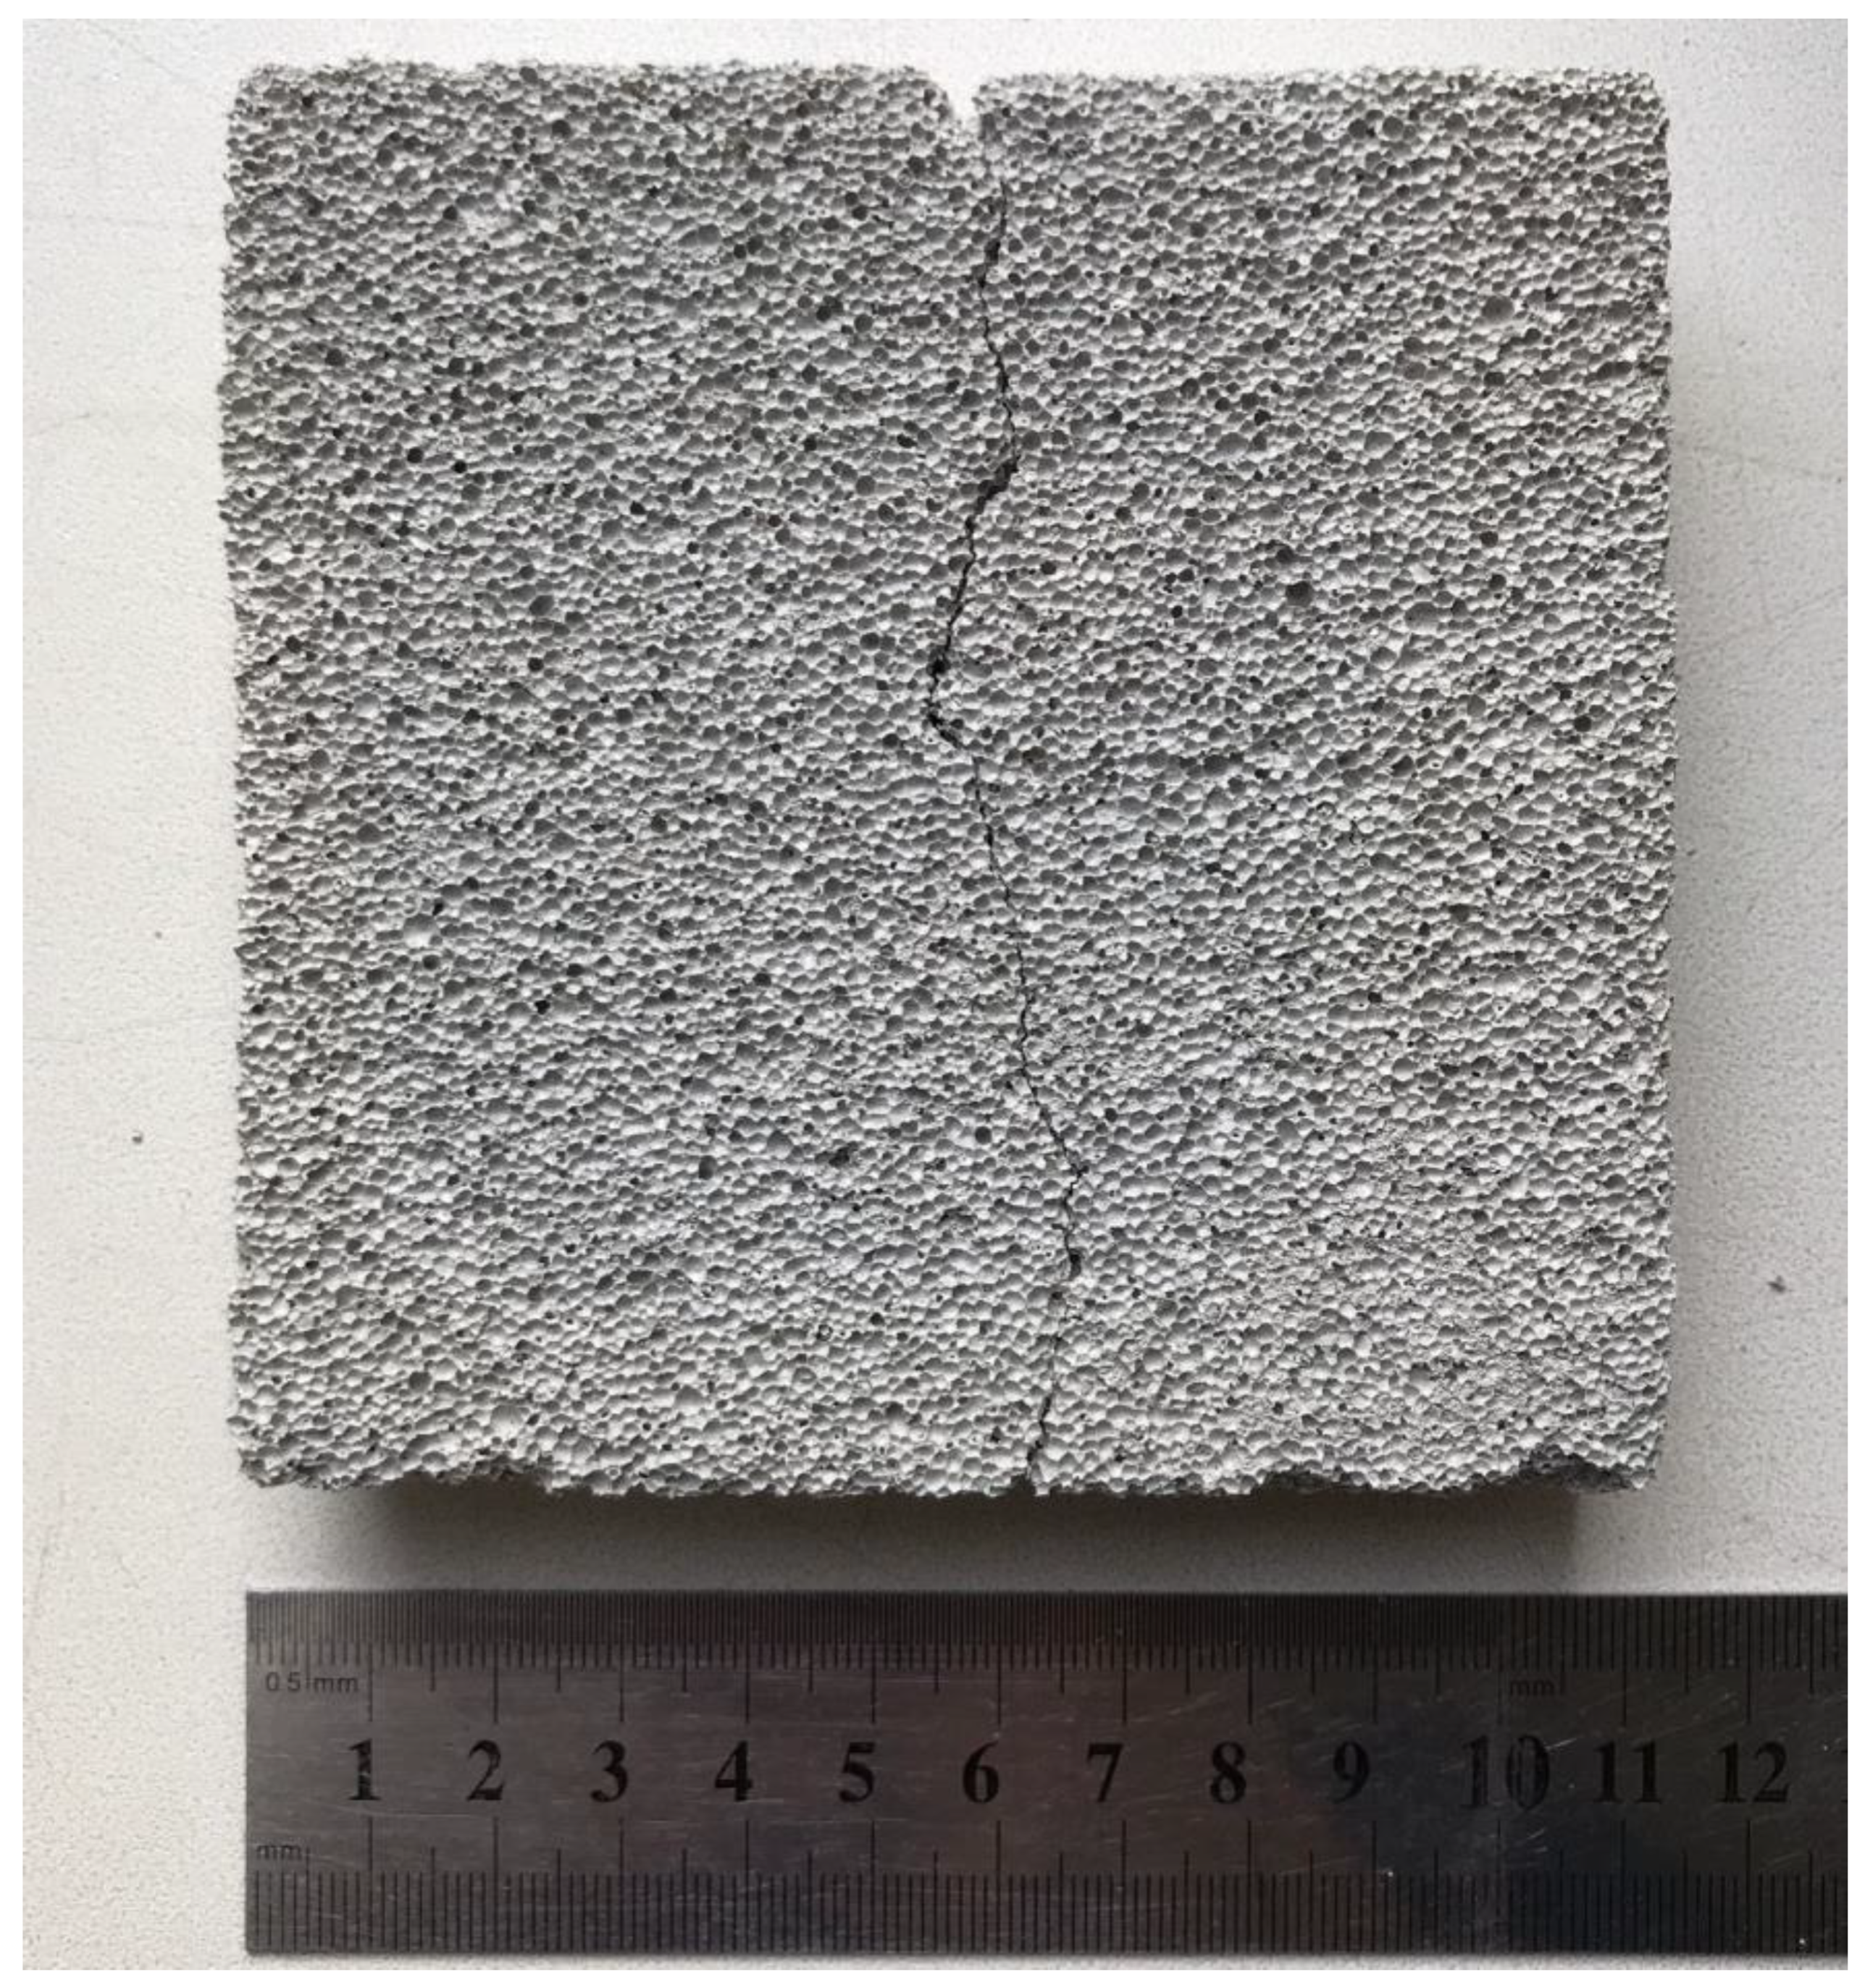
2.1. Characteristics of the Material

Aerated concrete is a lightweight porous material obtained by mixing a binder component, fine aggregate, water and a pore-forming additive. This material has low density and good thermal insulation properties and is also fire resistant. Thanks to all these qualities, aerated concrete is in wide demand in the building materials market [46].
Aerated concrete blocks, depending on physical and mechanical properties, can be used for the construction of load-bearing walls and front walls for thermal insulation of reinforced concrete and brick walls and for filling the frame. The aerated concrete investigated in this study has the following physical and mechanical characteristics, which are presented in Table 1.
As is known, defects in aerated concrete mainly arise during the process of molding, strength building, cutting and autoclave processing. Accordingly, quality directly depends on the quality of raw materials and the accuracy of technological conditions. Thus, a violation of technological parameters can lead to the appearance of various types of defects in the structure of an aerated concrete product. The most common types of defect in aerated concrete products are cracks and delamination. An example of a crack in aerated concrete is shown in Figure 1. We also note the fact that cracks in aerated concrete can also occur during its transportation, installation of products and operation (mechanical, climatic, anthropogenic influences) [47]. As is known from the scientific and technical literature and construction practice, the process of the appearance of cracks in aerated concrete has a versatile nature and is varied depending on the factors that influenced this occurrence. Production and technological factors include incorrectly selected manufacturing modes, errors in the recipe and incompatibility of some aerated concrete components with each other. This is due to the fact that aerated concrete has a complex production and technological nature, and a number of factors significantly affect its final quality and structure. As for the logistics processes of transporting aerated concrete products, an unreasonable mode of transportation may arise here, which entails additional mechanical stress that is harmful to aerated concrete, contributing to the appearance and spread of cracks in the material. Issues related to the operation of aerated concrete include unevenly distributed loads or incorrectly selected conditions for using products and structures made of aerated concrete, for example, in matters of mechanical influences, both static and dynamic, as well as various cyclic climatic influences. The combination of such factors, or each factor separately, can ultimately and often does lead to the appearance of micro- and macrocracks in aerated concrete.
Timely identification of defective aerated concrete products during mass production will make it possible, first of all, to ensure a consistently high level of quality of these products as well as significantly increase their level of safety.

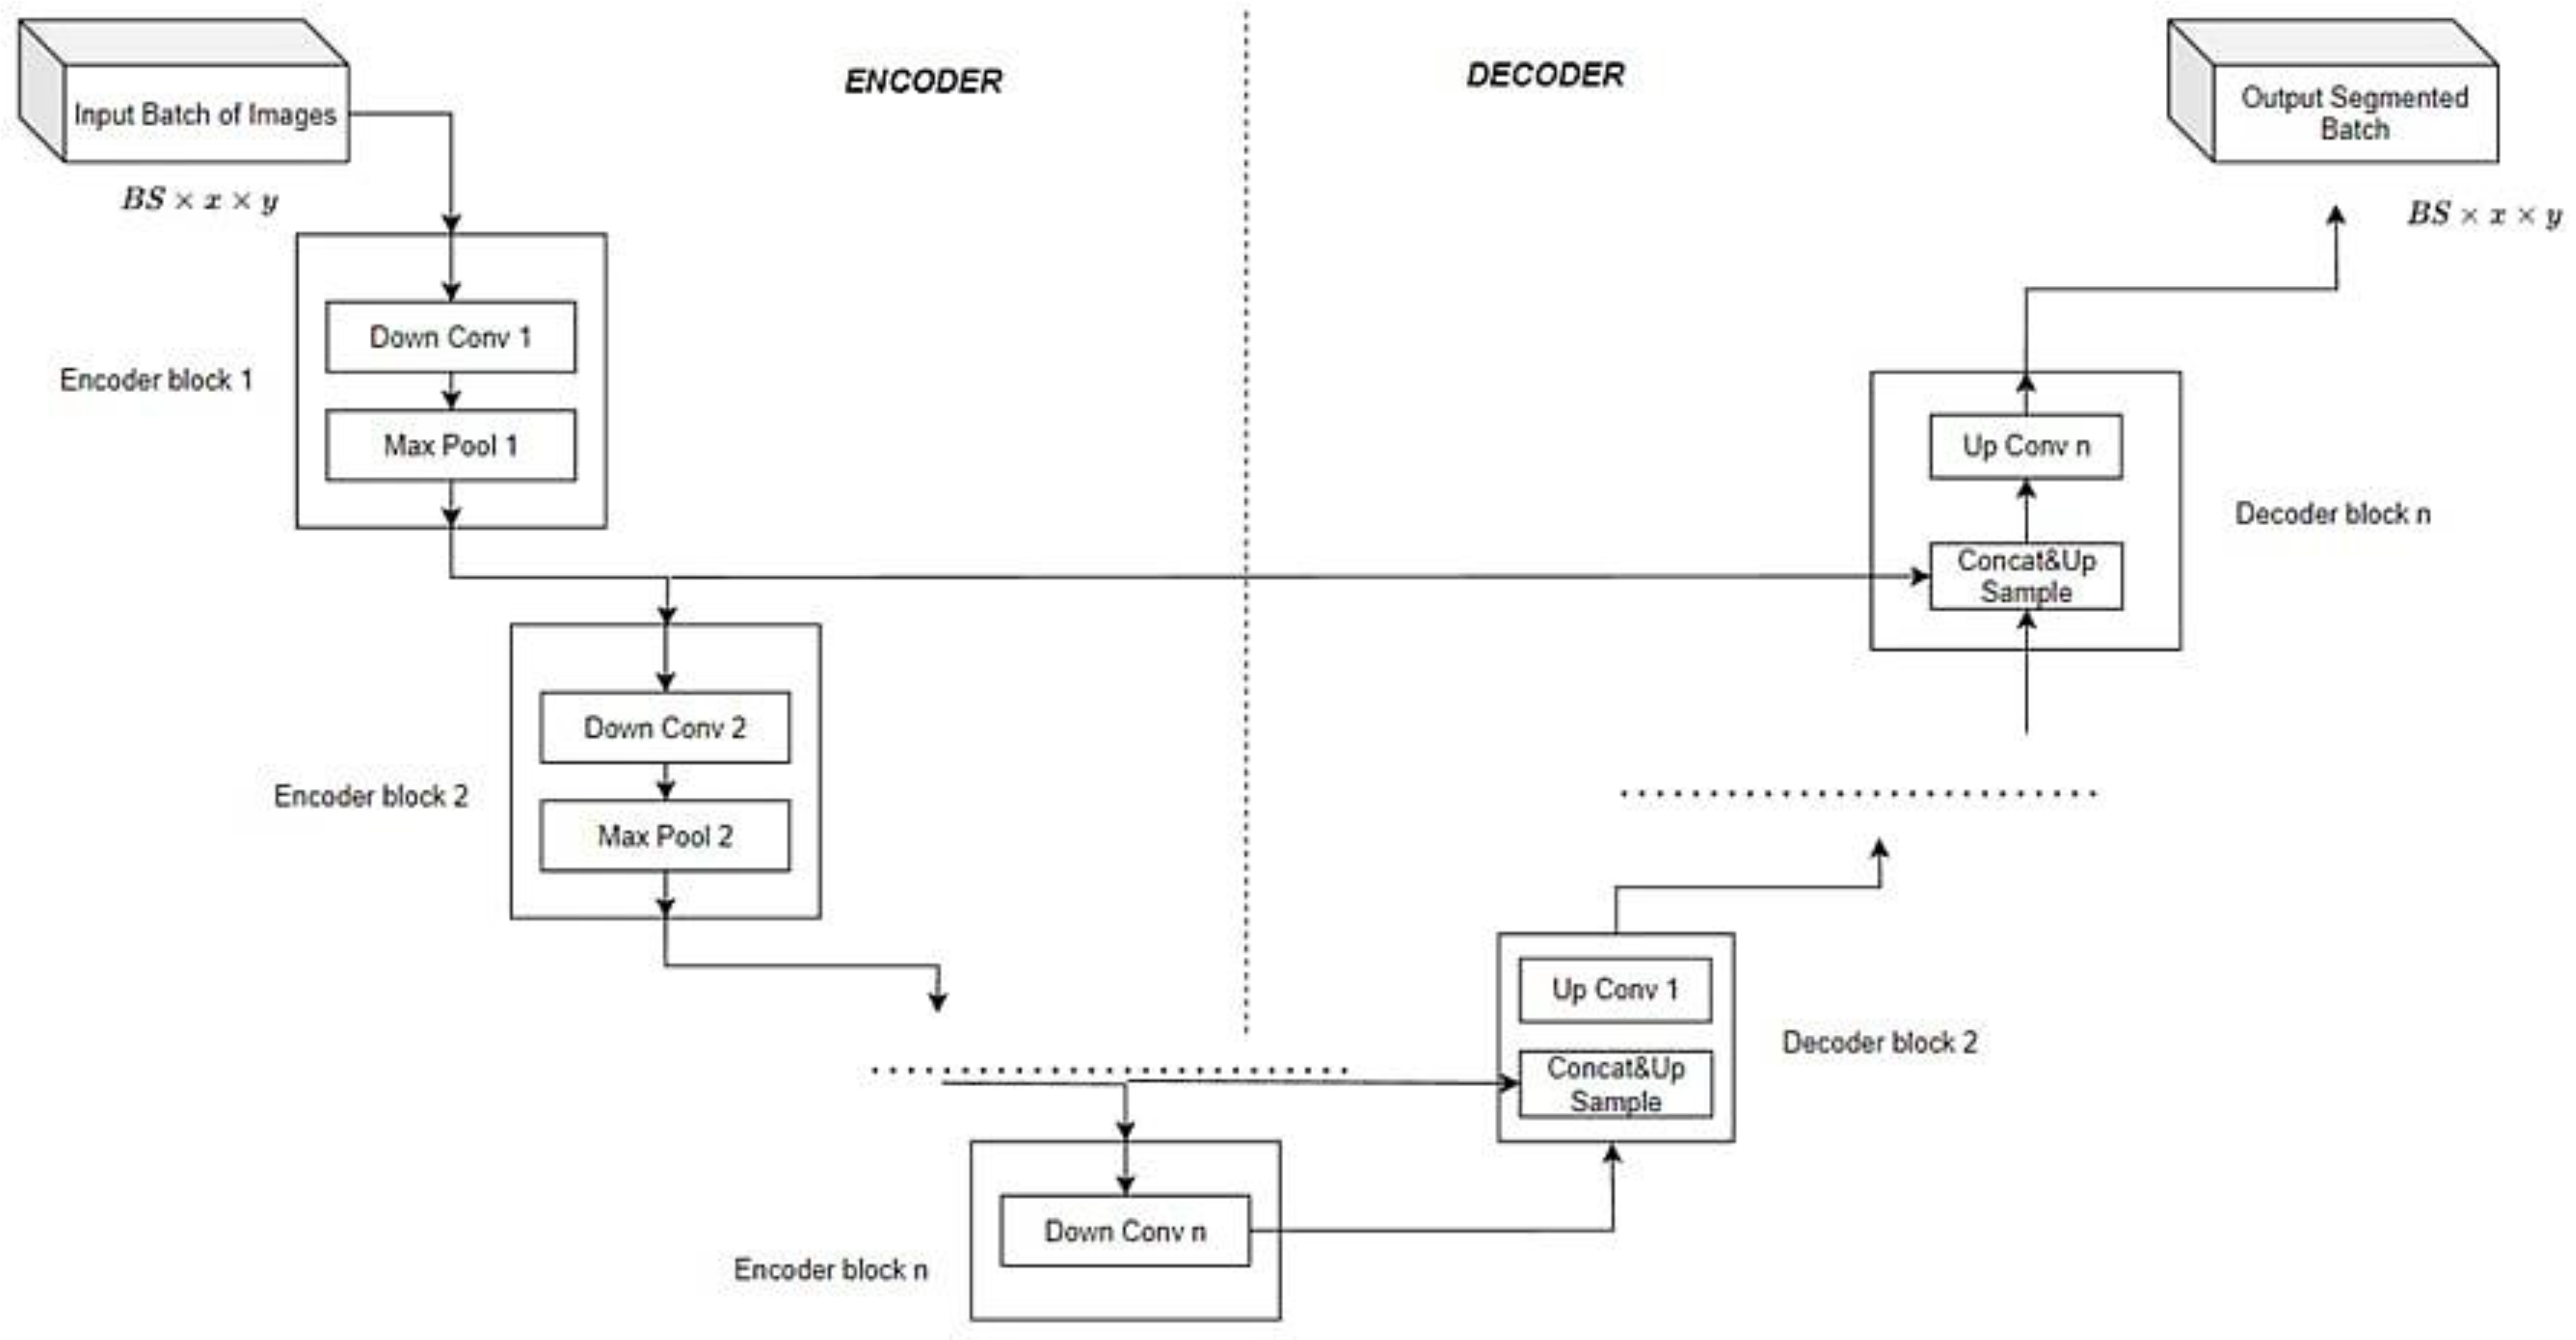
2.2. Development of an Intelligent Algorithm Based on Various Convolutional Neural Network Architectures

This study examines the use of four convolutional neural network models.
Models based on U-Net architecture are as follows:
Model 1.1 is based on the U-Net architecture, implemented on the PyTorch machine learning framework, modified at the training stage by applying dynamic (probabilistic) augmentation at each iteration.
Model 1.2 is based on the U-Net architecture using PyTorch, where at the training stage a data set created using an augmentation proprietary algorithm (static augmentation) is used.
Models based on LinkNet architecture are as follows:
Model 1.3 is based on the LinkNet architecture implemented in PyTorch, modified during the training phase by applying dynamic (probabilistic) augmentation at each iteration.
Model 1.4 is based on the LinkNet architecture using PyTorch, where at the training stage a data set created using an augmentation proprietary algorithm (static augmentation) is used.
These models were chosen as the basis for this study due to the fact that, with proper training and optimization of parameters, they can detect minor changes in the structure of such a difficult-to-visually-inspect material as aerated concrete, which may indicate the presence of a defect.

2.2.1. Image Annotation and Preprocessing

Preparing data for input into models involves image marking (image annotation), which is one of the most important components of an effective segmentation system based on a computer vision algorithm. Marking is carried out using the VGG Image Annotator tool (https://www.robots.ox.ac.uk/~vgg/software/via/via.html, accessed on 1 December 2023). Figure 2 shows the marking of delamination no. 1 and no. 2 manually using the poly line tool.
The original images are 16 images with a resolution of 1600 × 1600. Training on images of this format is computationally expensive since there is not enough RAM in the computing device for processing; as well, there is a highly unbalanced ratio of the surface area occupied by classes of cracks and/or delamination (further—crack or cracks) and background, which does not allow for moving to image compression.
To create an adequate data set for models 1.1 and 1.3 with dynamic augmentation, the following steps were taken:
-
A total of 16 images were divided in a ratio of 9/4/3 into training, validation and test samples;
-
Images from each sample were divided into 16 fragments with a dimension of 400 × 400, so the total number of images at this stage was 256;
-
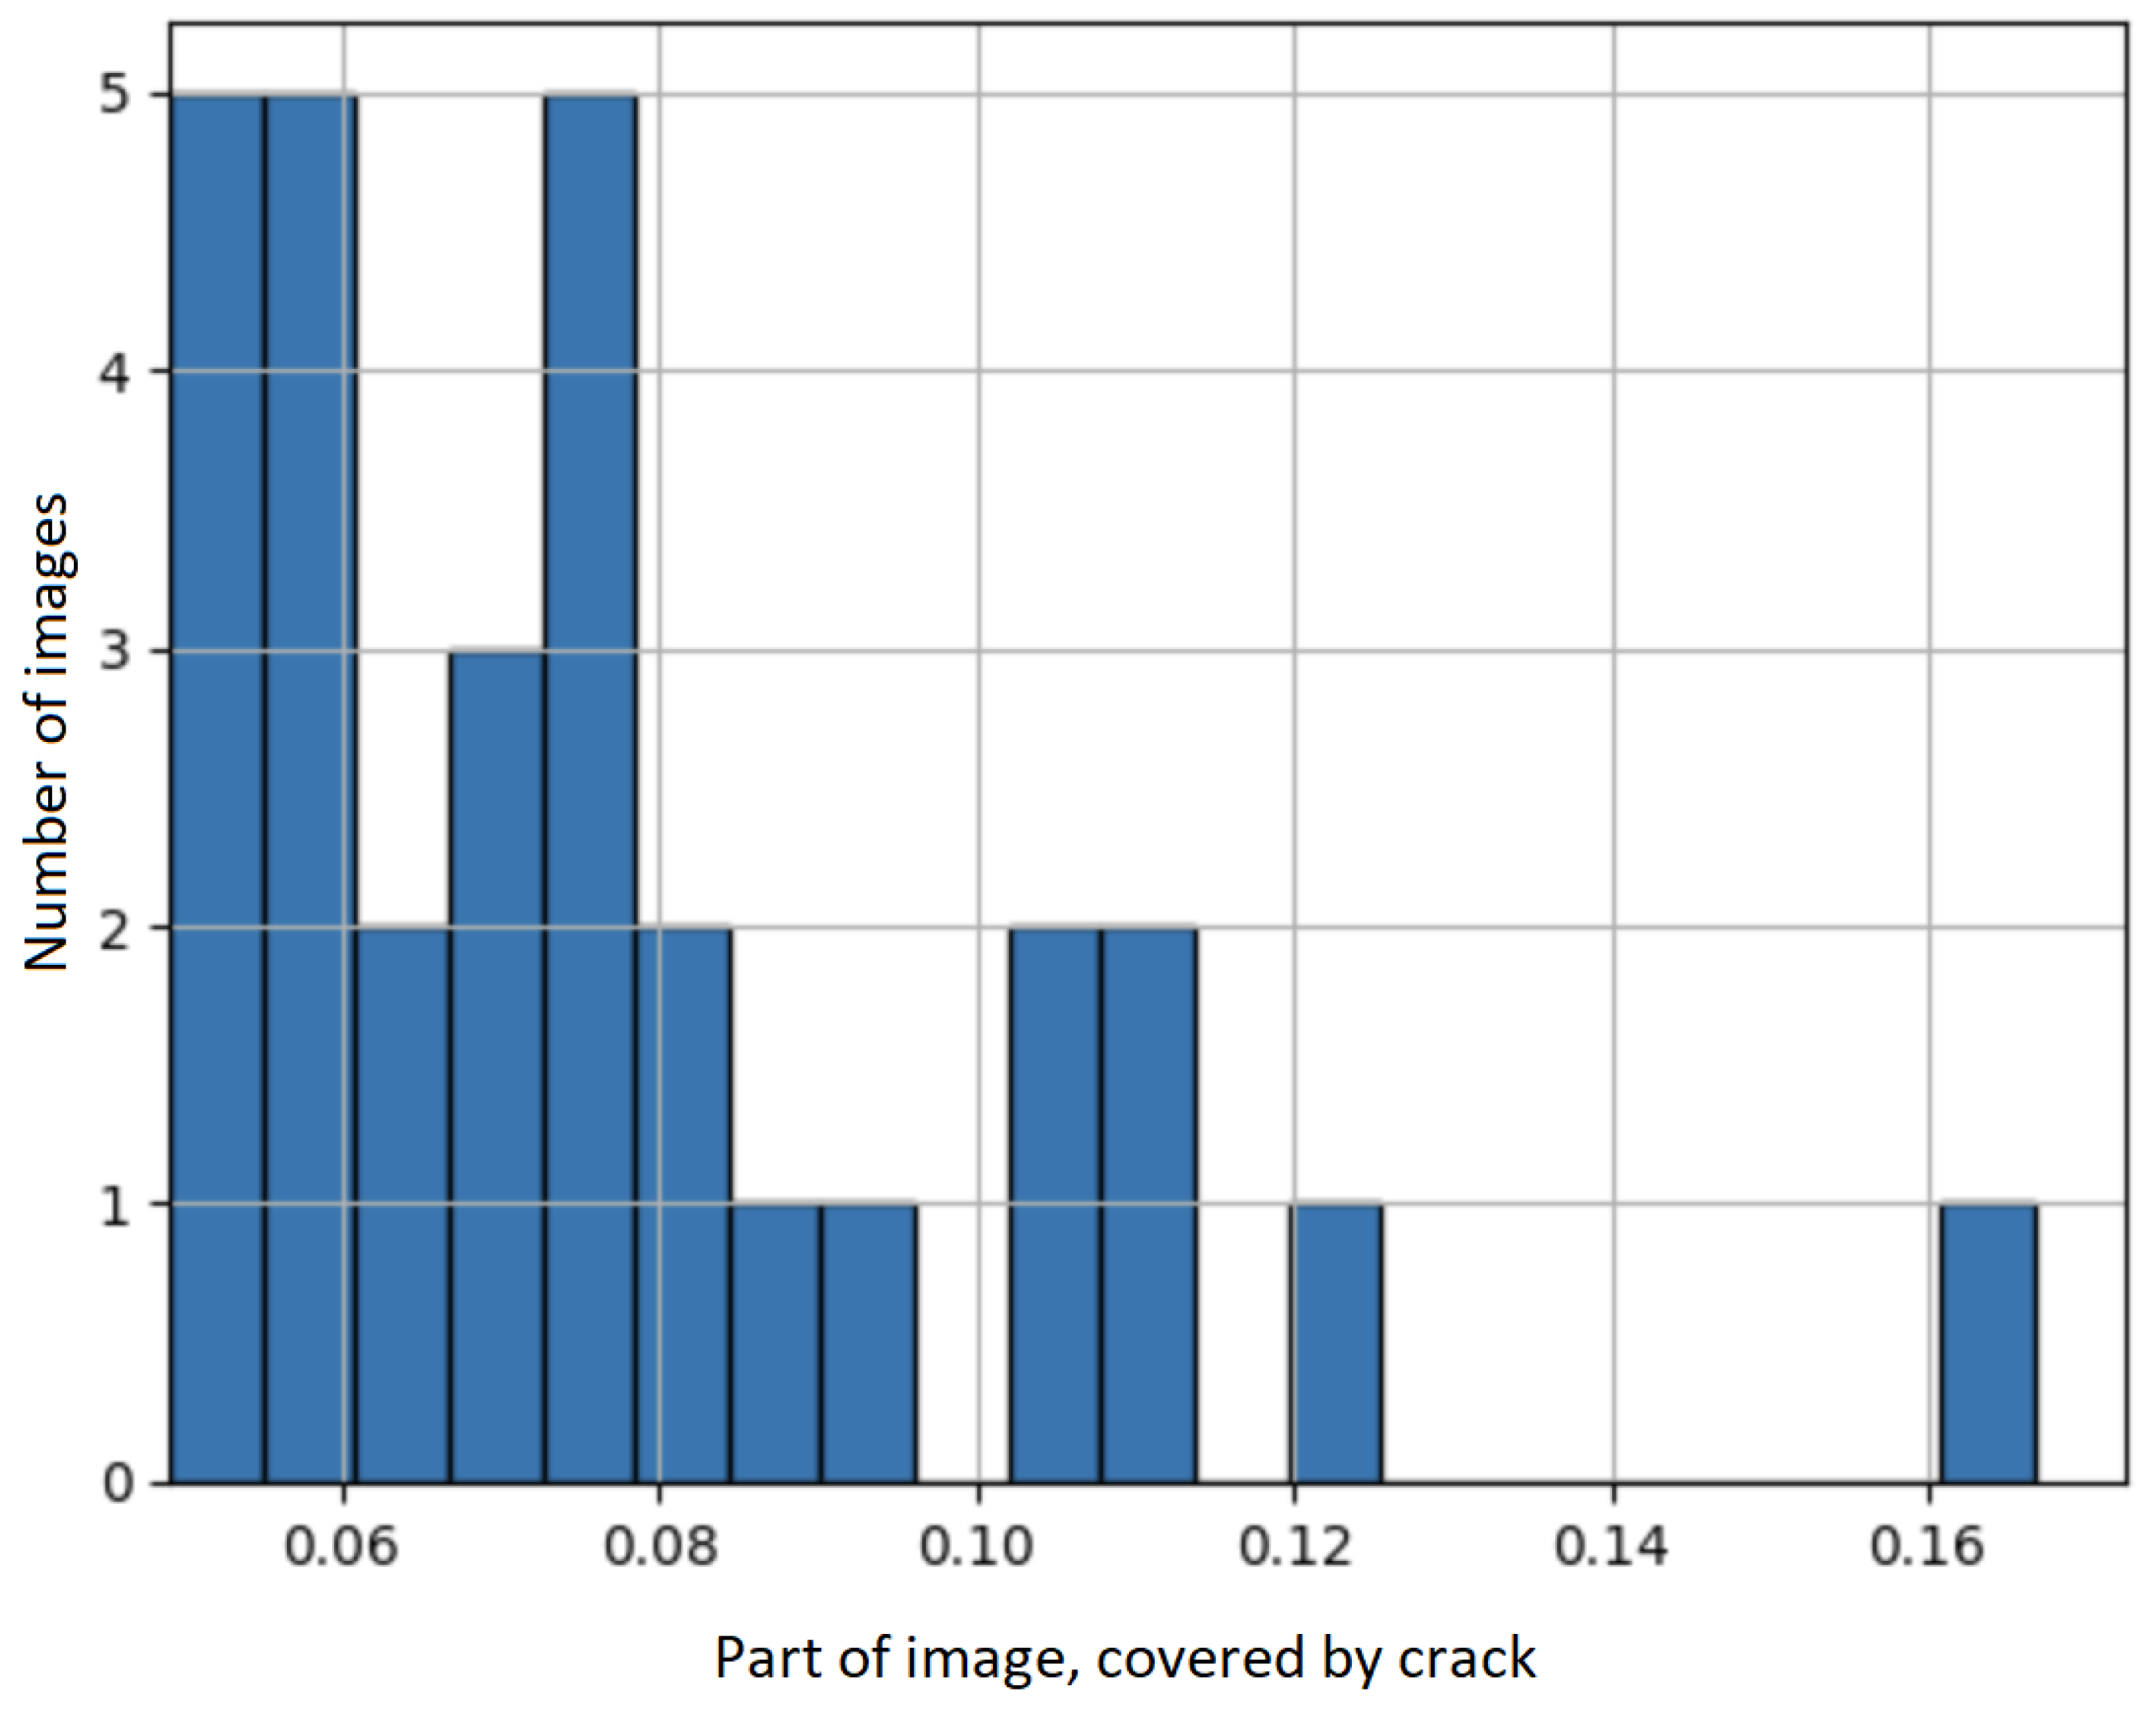
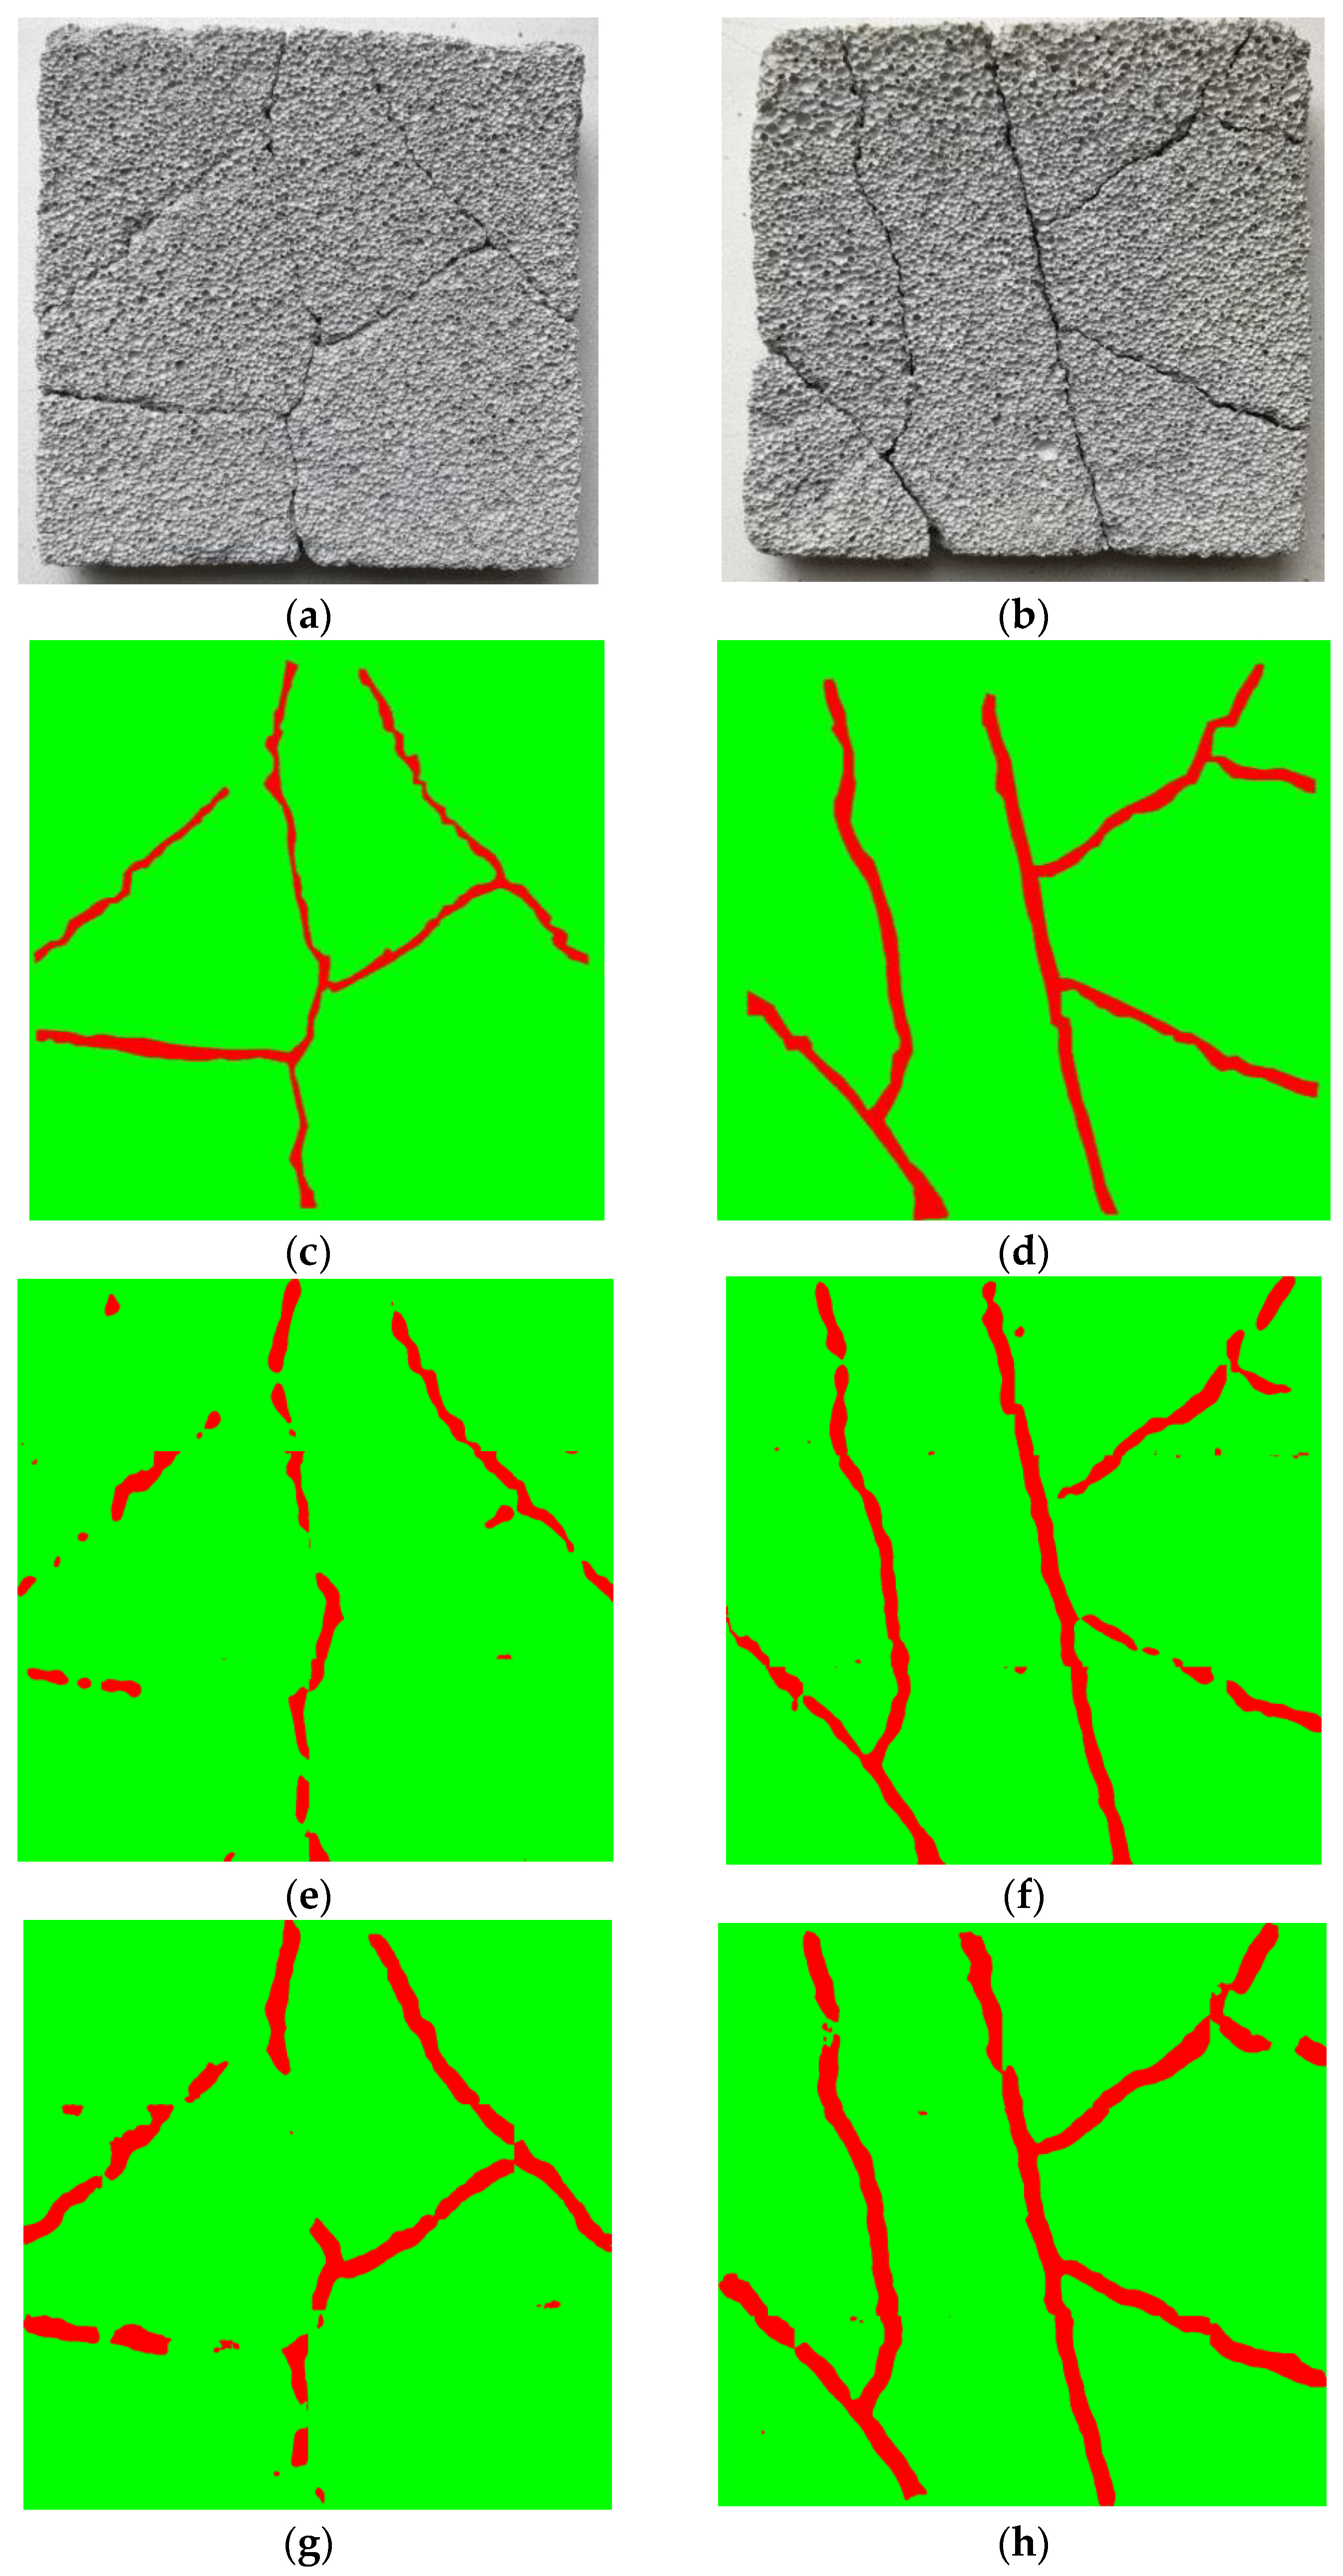
The most balanced images were selected for each sample. For example, for the training set, 30 images were selected that contained a class of cracks with an area of 5% of the total image area. Figure 3 shows the number of images in the new training set after selecting the most suitable ones based on the percentage of content of the desired class.
Thus, a set of 30 pictures was created in the training set, 15 in the validation set and 15 in the test set.
Models 1.1 and 1.3 were trained on a data set whose characteristics are presented in Figure 3.
To create an adequate data set for models 1.2 and 1.4, the following steps were taken:
-
A total of 16 images were divided into a ratio of 9/4/3 into training, validation and test samples;
-
Augmentation was performed using the authors’ algorithm [45] of up to 200/100/50 images in each of the samples, respectively.
When the augmentation algorithm operates, the following changes occur: display (vertical/horizontal); random image shift along the OX and OY axes; rotate the image at a random angle (from 0 to 360°); change brightness, contrast and saturation, as follows:
-
Images from each sample were divided into 16 fragments with a dimension of 400 × 400, so the total number of images at this stage is 5600;
-
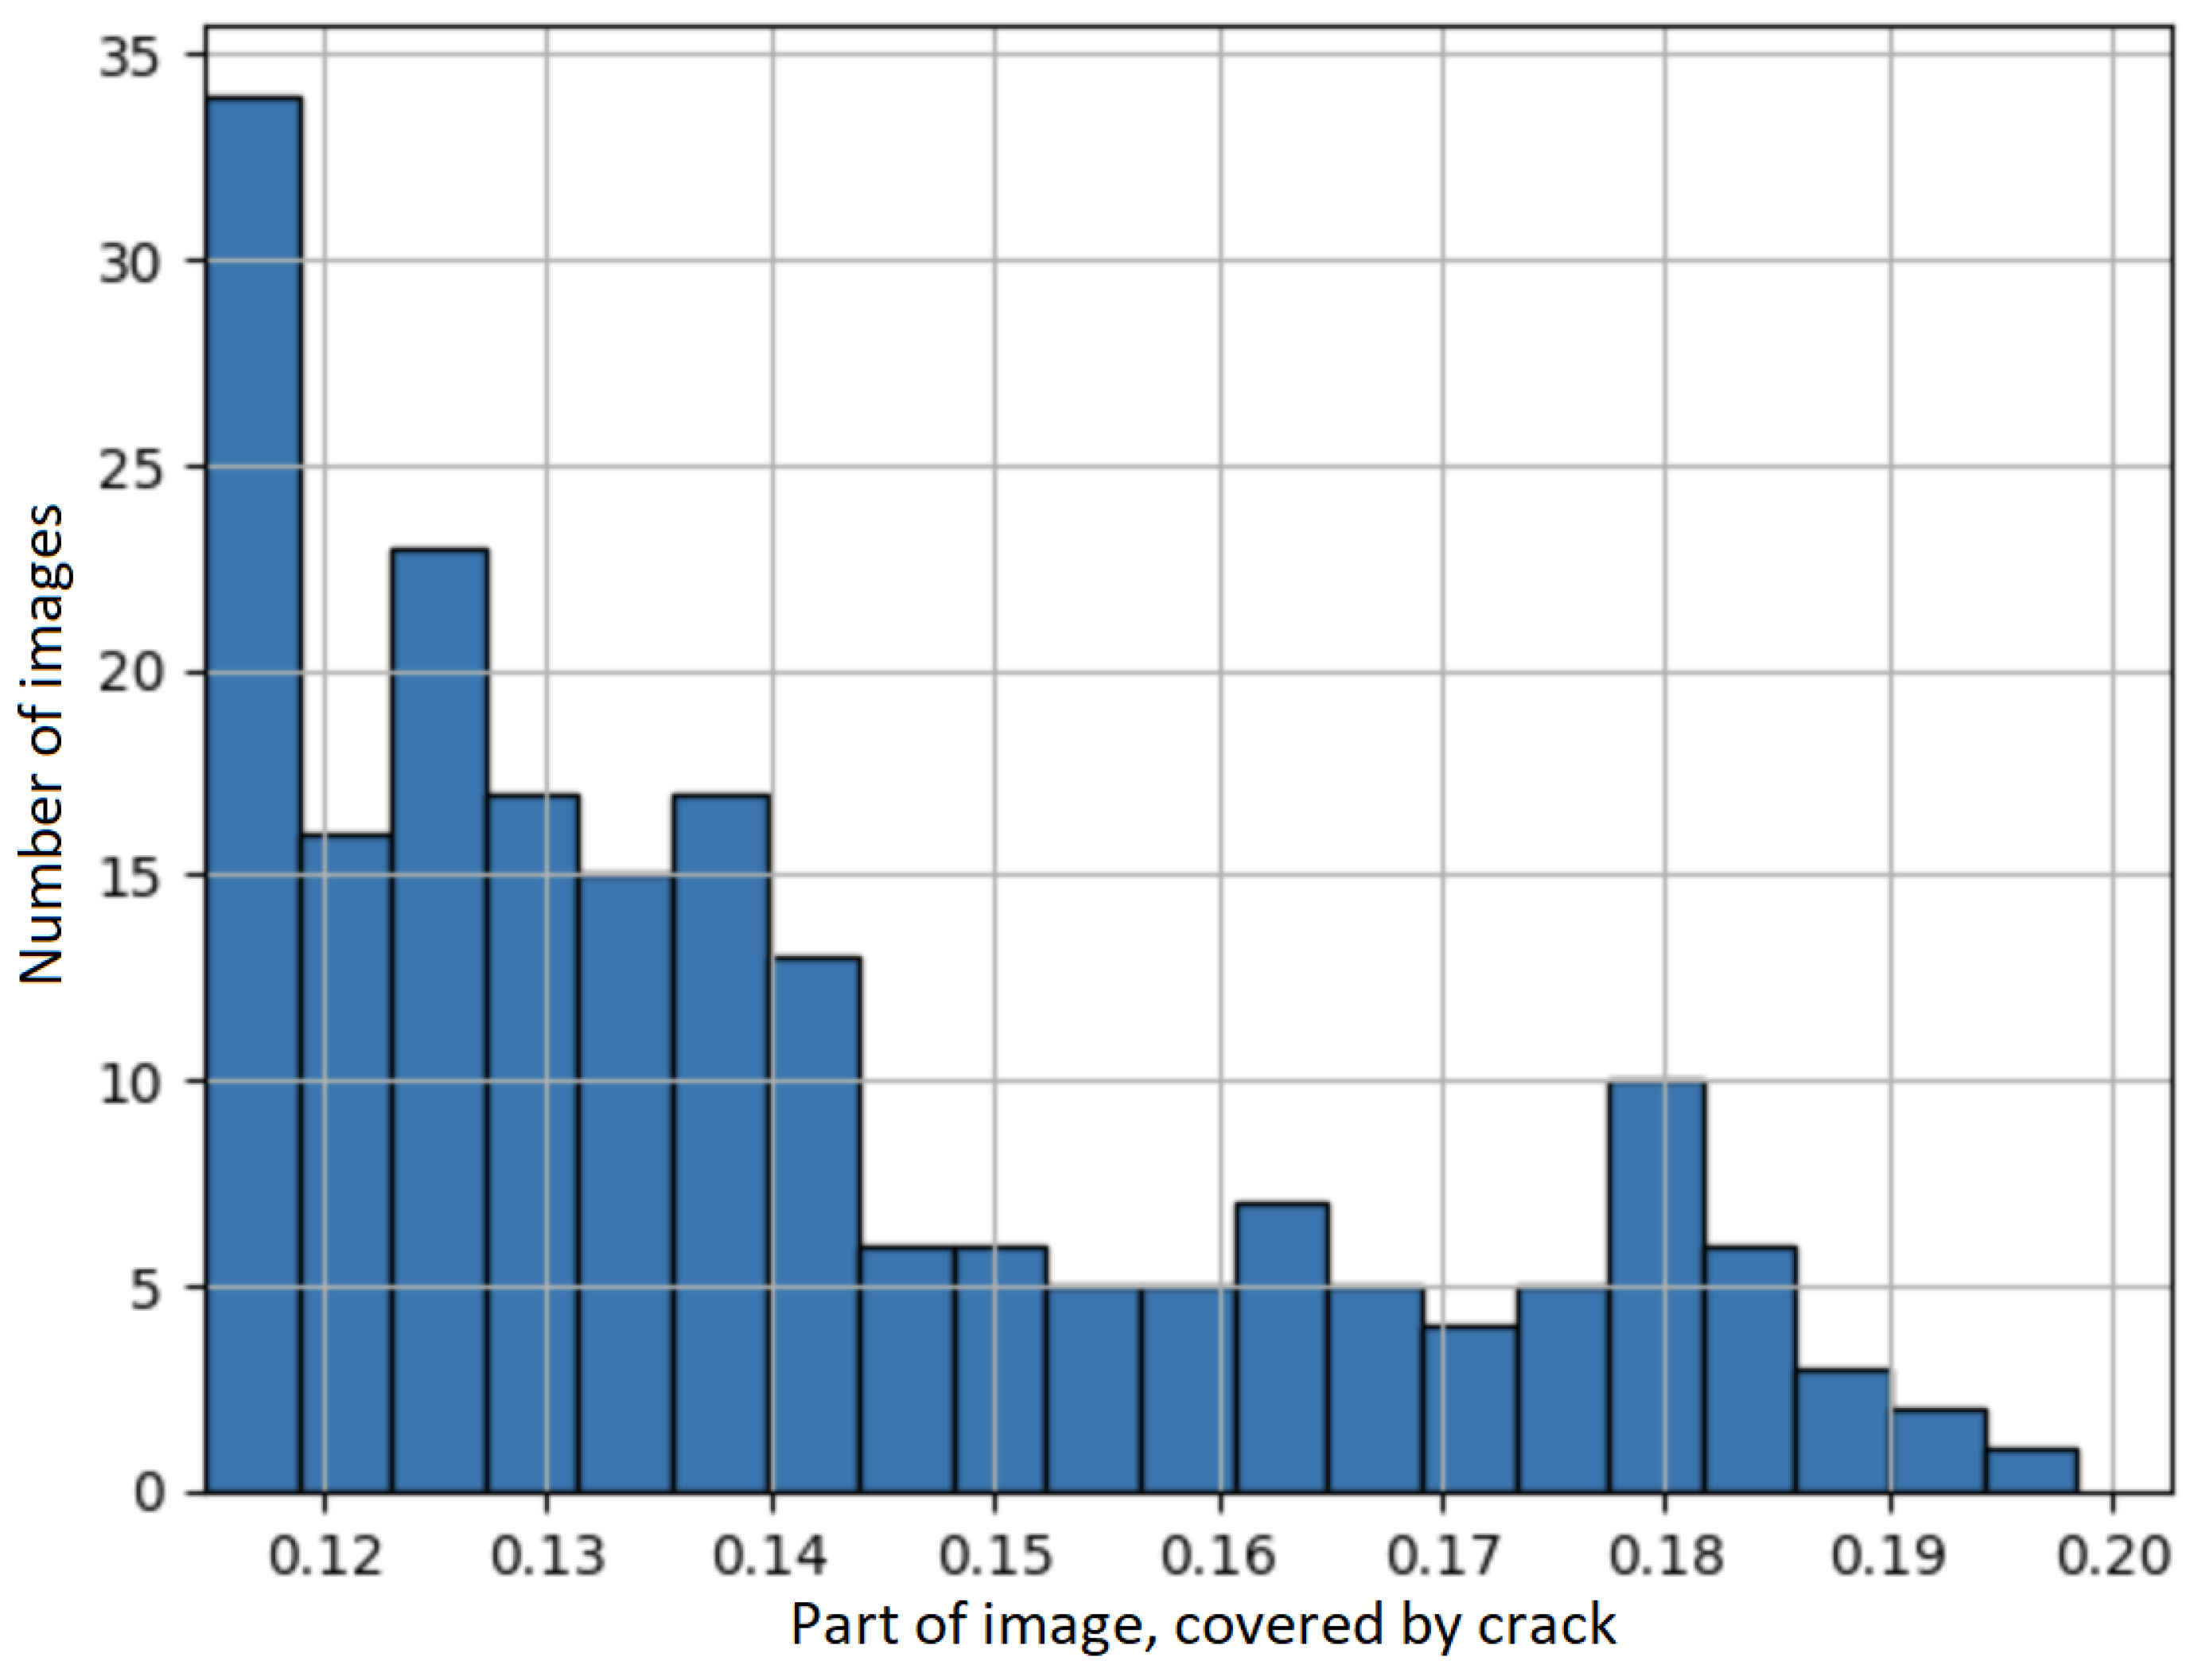
The most balanced images were selected for each sample. For example, for the training set, 200 were selected, in which a class of cracks with an area of 11% of the total image area was detected (Figure 4). To improve the quality of segmentation, image fragments without cracks in the amount of 150 pictures were added to the training. Thus, a set of 350 pictures was created in the training set, 100 in the validation set and 50 in the test set.
Figure 4 shows the characteristics of the images from the data set for models 1.2 and 1.4.

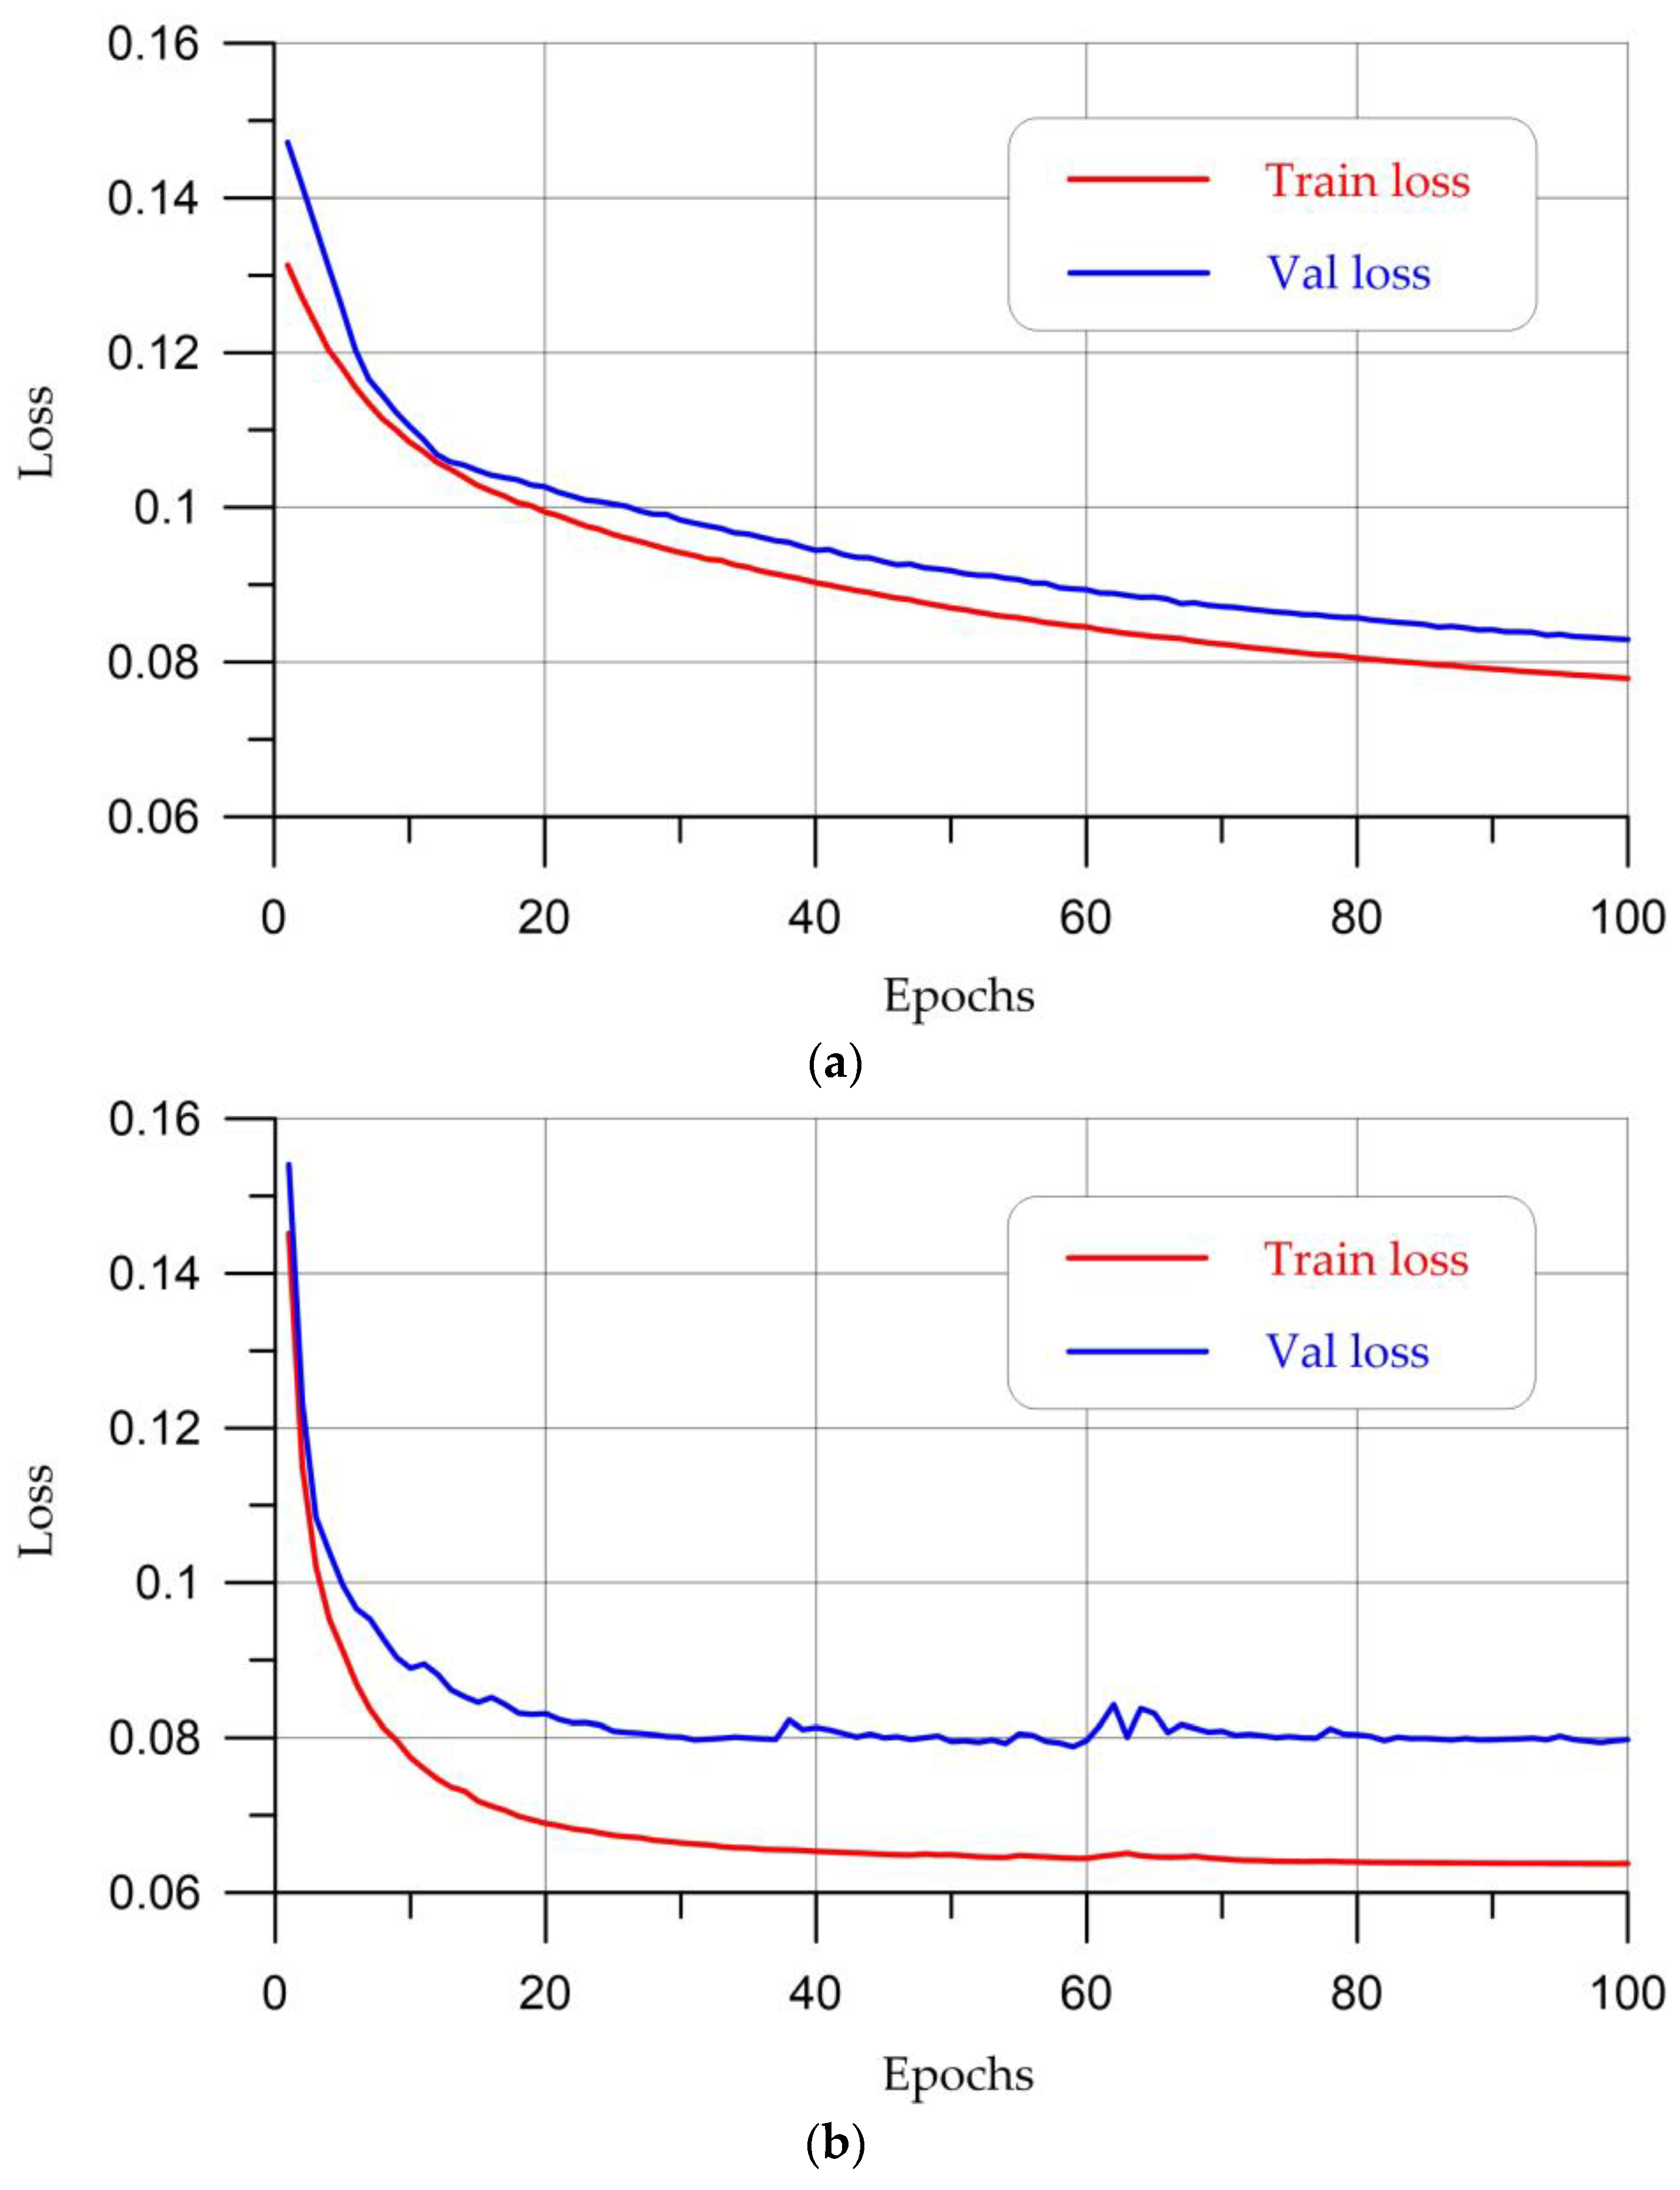
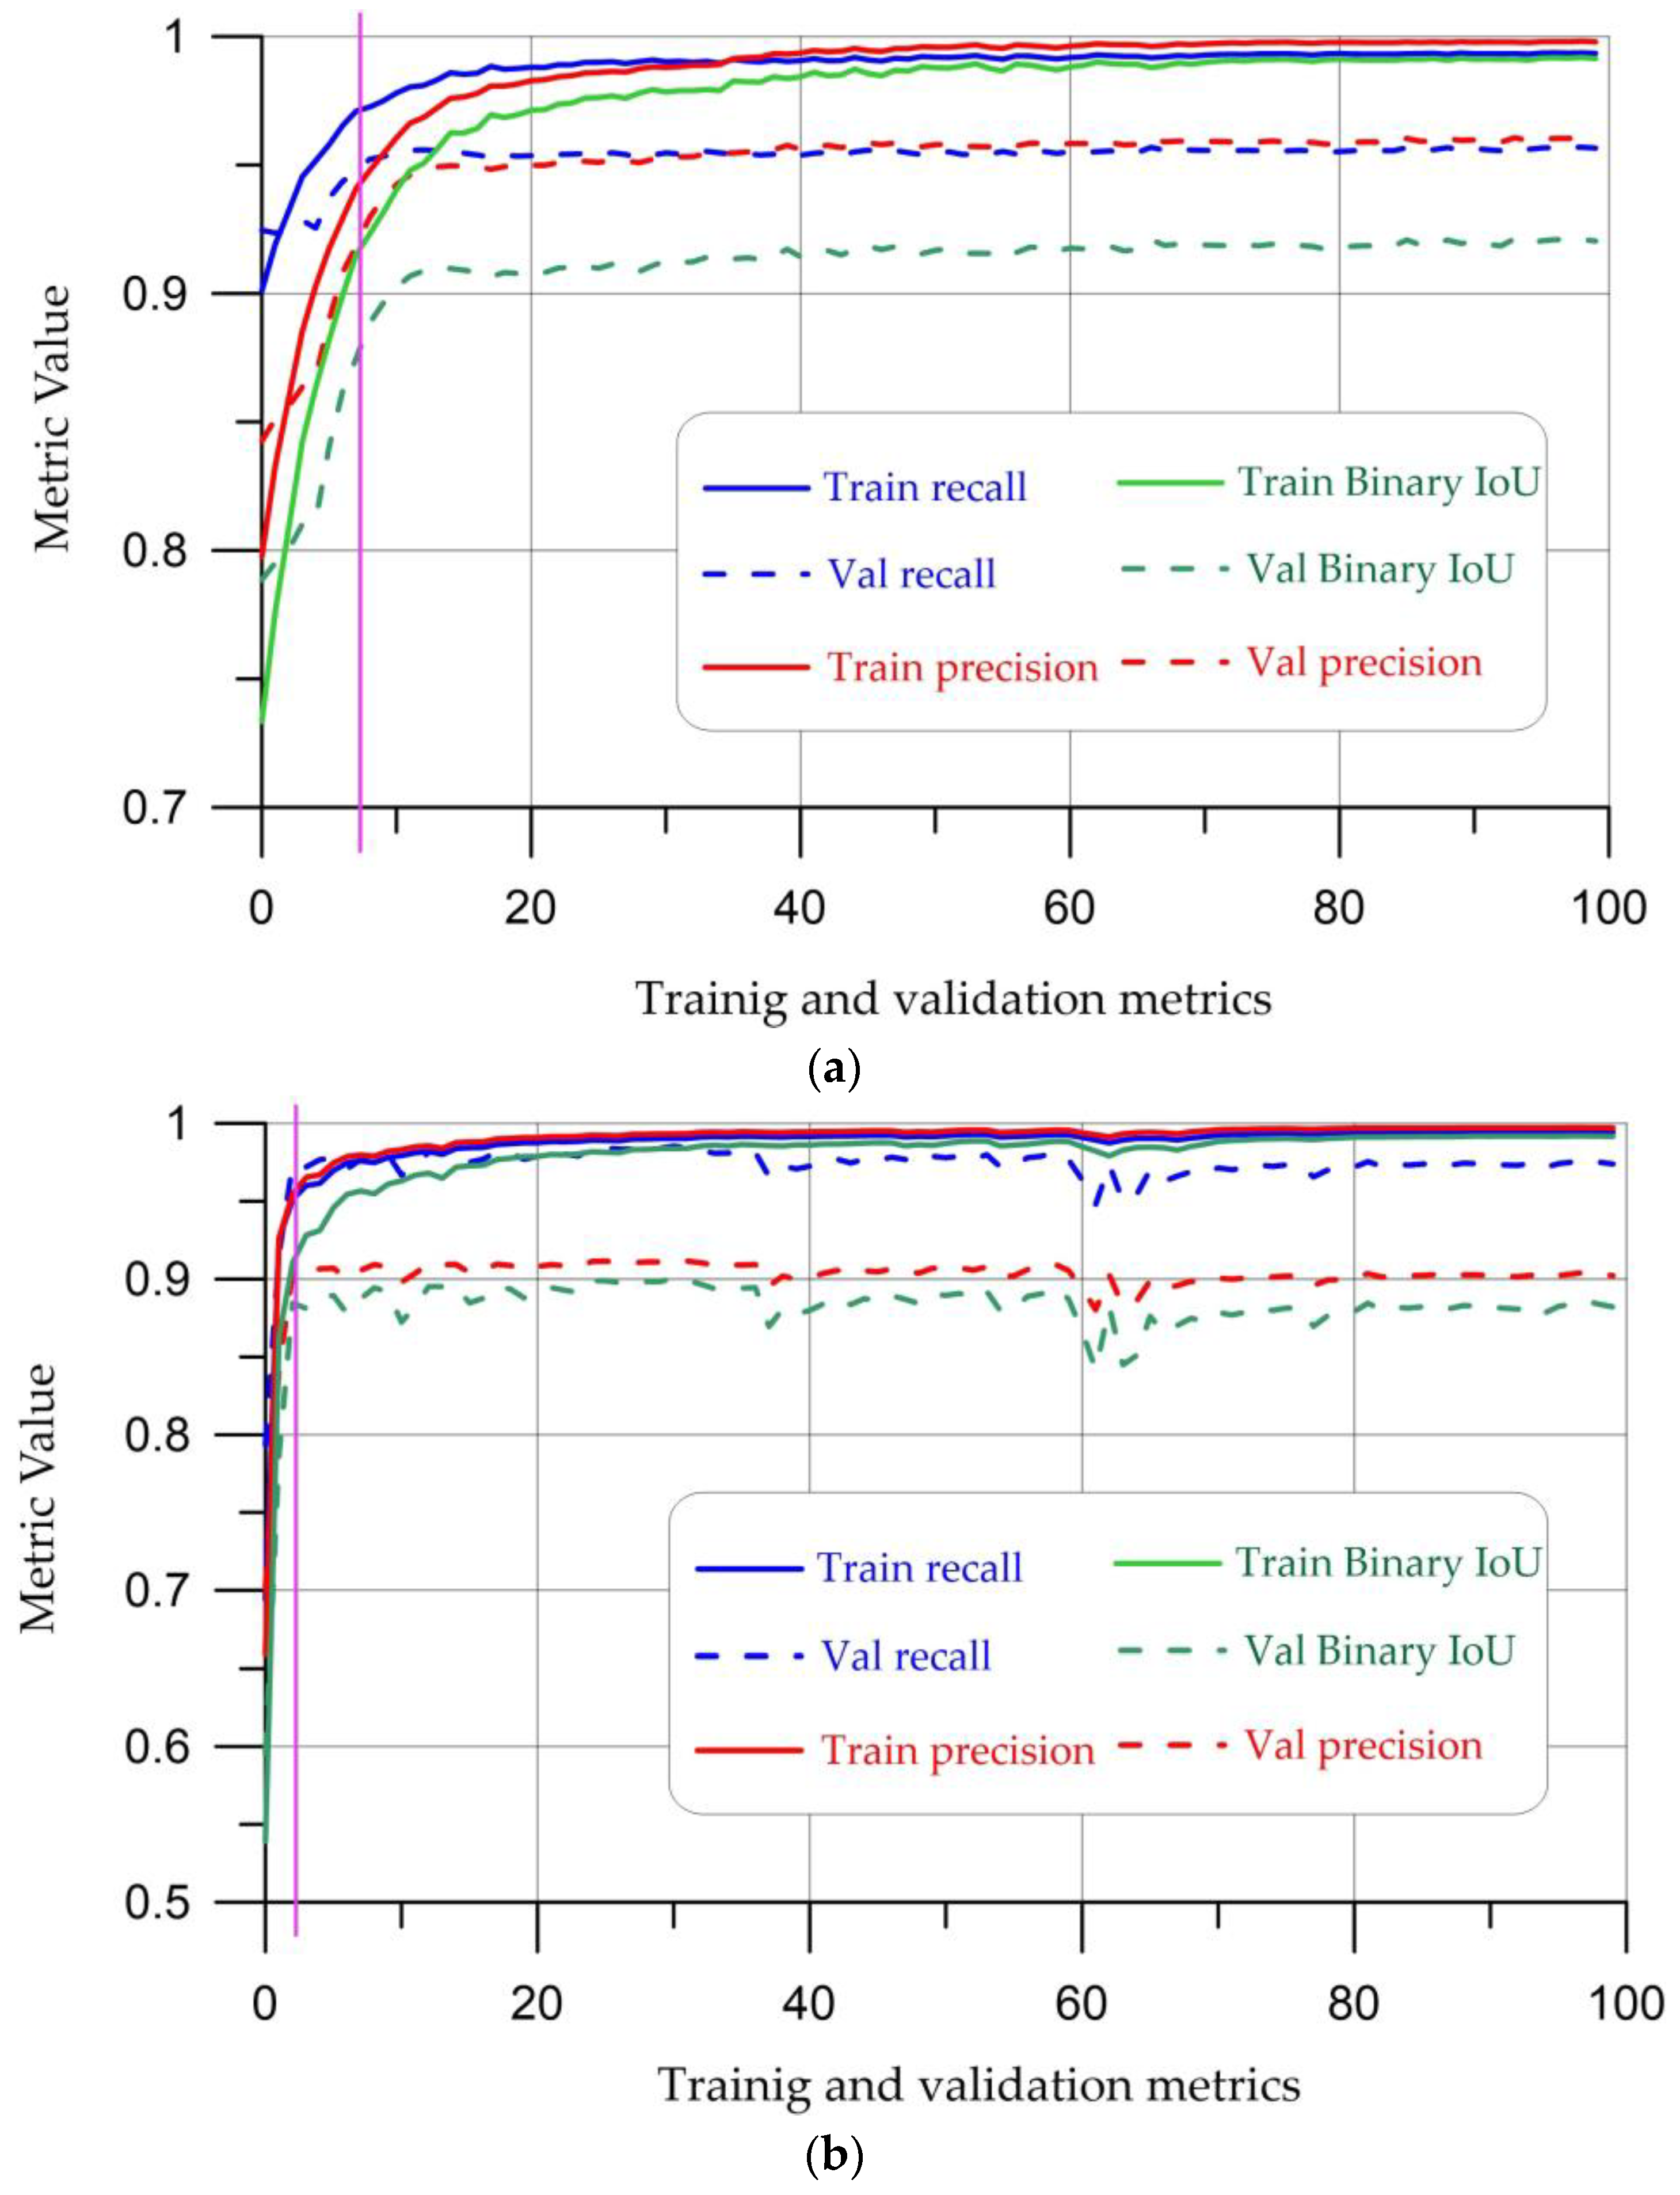
2.2.2. U-Net Architecture and Creation of Model 1.1 and Model 1.2

U-Net is a convolutional neural network architecture that was specifically designed for image segmentation tasks in 2015. The U-Net architecture can be divided into two main parts: the contracting path (encoder) and the expansive path (decoder). The encoder captures the context and extracts high-level features from the input image, and the decoder reconstructs the segmented output image using the features provided by the encoder.
The encoder part of the U-Net architecture consists of several convolutional layers followed by downsampling operations such as max-pooling. Each convolutional layer extracts increasingly abstract features by applying filters to the input image. As the encoder develops, the spatial dimensions of object maps decrease, and the number of channels (object maps) increases. This process allows the network to collect both local and global information about the input image. The decoder part of the U-Net architecture mirrors the encoder and is responsible for upsampling feature maps to reconstruct the segmented image. It consists of several upsampling layers that increase the spatial dimensions while reducing the number of channels.
The U-Net architecture has proven to be highly effective, especially in biomedical image segmentation tasks where precise region localization is critical. The combination of encoder–decoder structure and pass-through connections allows U-Net to efficiently capture both local and global information and produce accurate segmentation. Figure 5 shows the architecture of the U-Net model.
This study examines two models based on the architecture of the U-Net neural network, with:
(1)
Model 1.1 is a U-Net CNN on the PyTorch machine learning framework, where the augmentation will be dynamic in nature; a set of 60 images, divided into a ratio of 30/15/15 into training, validation and test samples, is fed to the input of the CNN.
Dynamic augmentation is implemented as on-the-fly augmentation and is a method of applying augmentation transformations that have an irregular probabilistic nature to a sample. Each time a batch is formed, one or more transformations from a predetermined set of possible augmentations are applied to its elements. Probabilistic augmentation is used precisely at the batch formation stage.
The objects of the training set from which the batch is selected are initially unaugmented. After a batch is formed, augmentation transformations and their parameters are randomly selected for each image. This approach allows one to “show” new data to the neural network at each iteration of the optimization method without increasing the actual occupied disk space as well as without the need for additional training stages associated with increasing the actual size of the training sample when using standard augmentation. Another advantage of using probabilistic augmentation is a significant increase in diversity in the data: during the entire training period, the network will be able to see a variety of implementations and combinations of given augmentation transformations. Moreover, probabilistic augmentation is more resistant to the not entirely successful choice of initial transformation parameters, since it regularly changes and updates them. If in classical augmentation the transformation parameters were not chosen quite successfully, this can lead to loss of time and quality, because changing them while the algorithm is running will no longer be possible. In the case of probabilistic augmentation, it is necessary to set in advance the probabilistic parameters for choosing a particular transformation during the batch generation process. In our work, we considered the following transformations, selected with appropriate probabilities:
  • Random crop of a fragment of an image. All possible continuous fragments in this case are equally probable.
  • Equally probable application of one of four transformations:
    (a)
    Reflection along the horizontal axis;
    (b)
    Reflection along the vertical axis;
    (c)
    Turn 90 degrees in a random direction;
    (d)
    Constant conversion.
We also carried out actions with the addition of Gaussian noise and rotating the image by a random angle as part of probabilistic augmentation, but this led to a noticeable deterioration in the quality of segmentation in the test sample, so the above series of transformations was chosen for the final experiments. These transformations are applied synchronously to both images and masks.
(2)
Model 1.2 is a U-Net CNN based on the PyTorch machine learning framework, the input of which is a set of 500 images in a ratio of 350/100/50 for the training, validation and test set (static augmentation).
The selection of parameters when training a convolutional neural network of the U-Net architecture determines its implementation. The main parameters for training models based on U-Net CNN are presented in Table 2.
To train the models, the Adam stochastic optimization method was used [48], the effectiveness of which has been demonstrated in solving computer vision problems: “The peculiarity of this method is that it simultaneously uses the adaptation of the gradient descent step taking into account the accumulated gradients and the idea of accumulating moments” [48]. The value 1 × 10⁻⁴ was used as the learning rate parameter. The training process took 100 epochs. The choice of loss function is extremely important in deep learning problems because the weights are adjusted based on the values of the loss function. It cannot be said that there is a universal loss function for the segmentation problem. This study considered dice loss, focal loss and binary cross-entropy. The best results were obtained when focal loss was selected as the loss function [49]. This loss function was developed for multiclass classification problems where the classes are not balanced. It is suitable for any type of classification, including segmentation, and is a generalization of the binary cross-entropy function.
Figure 6a,b show training graphs for models 1.1–1.2 on the training and validation samples, where the OX axis shows the training epochs and the OU axis shows the value of the loss function on the training and validation samples, respectively.
The training plots show that the optimization algorithm has converged. This can be seen from the slight changes in the loss function from epoch to epoch at the end of training on the training set. The absence of overfitting is evidenced by unincreased values of the loss function.
Figure 7a,b present the metric values for models 1.1–1.2 during the training process. In the graphs, the OX axis shows the training epochs, and the OU axis shows the values of the precision, recall and binary IoU metrics on the training and validation sets.
The precision (P) metric is a measure of the quality of forecasts made by researchers, determined by the formula
P = TP/(TP + FP)
where true positive (TP) is the correct detection of a pixel of the corresponding class made by the model and false positive (FP) is incorrect pixel detection.
The recall (R) metric shows the proportion of correctly identified positive objects among all objects of the positive class:
R = TP/(TP + FN)
where false negative (FN) is a true result missed (not detected) by the algorithm.
Intersection over union (IoU) in the case of segmentation evaluates the overlap of the ground truth and prediction regions. IoU is calculated using the following formula:
I o U A , B = A B A B = T P T P + F P + F N
where A and B are the mask pixels: A is the ground truth and B is the predicted mask.
Starting from the epoch marked with the magenta line in Figure 7a,b, the model can be expected to perform well on the test set.
Analysis of the graphs allows us to conclude that the model is trained stably and achieves acceptable values for the metrics under consideration. Stability of learning means a smooth change in metrics without sudden jumps.

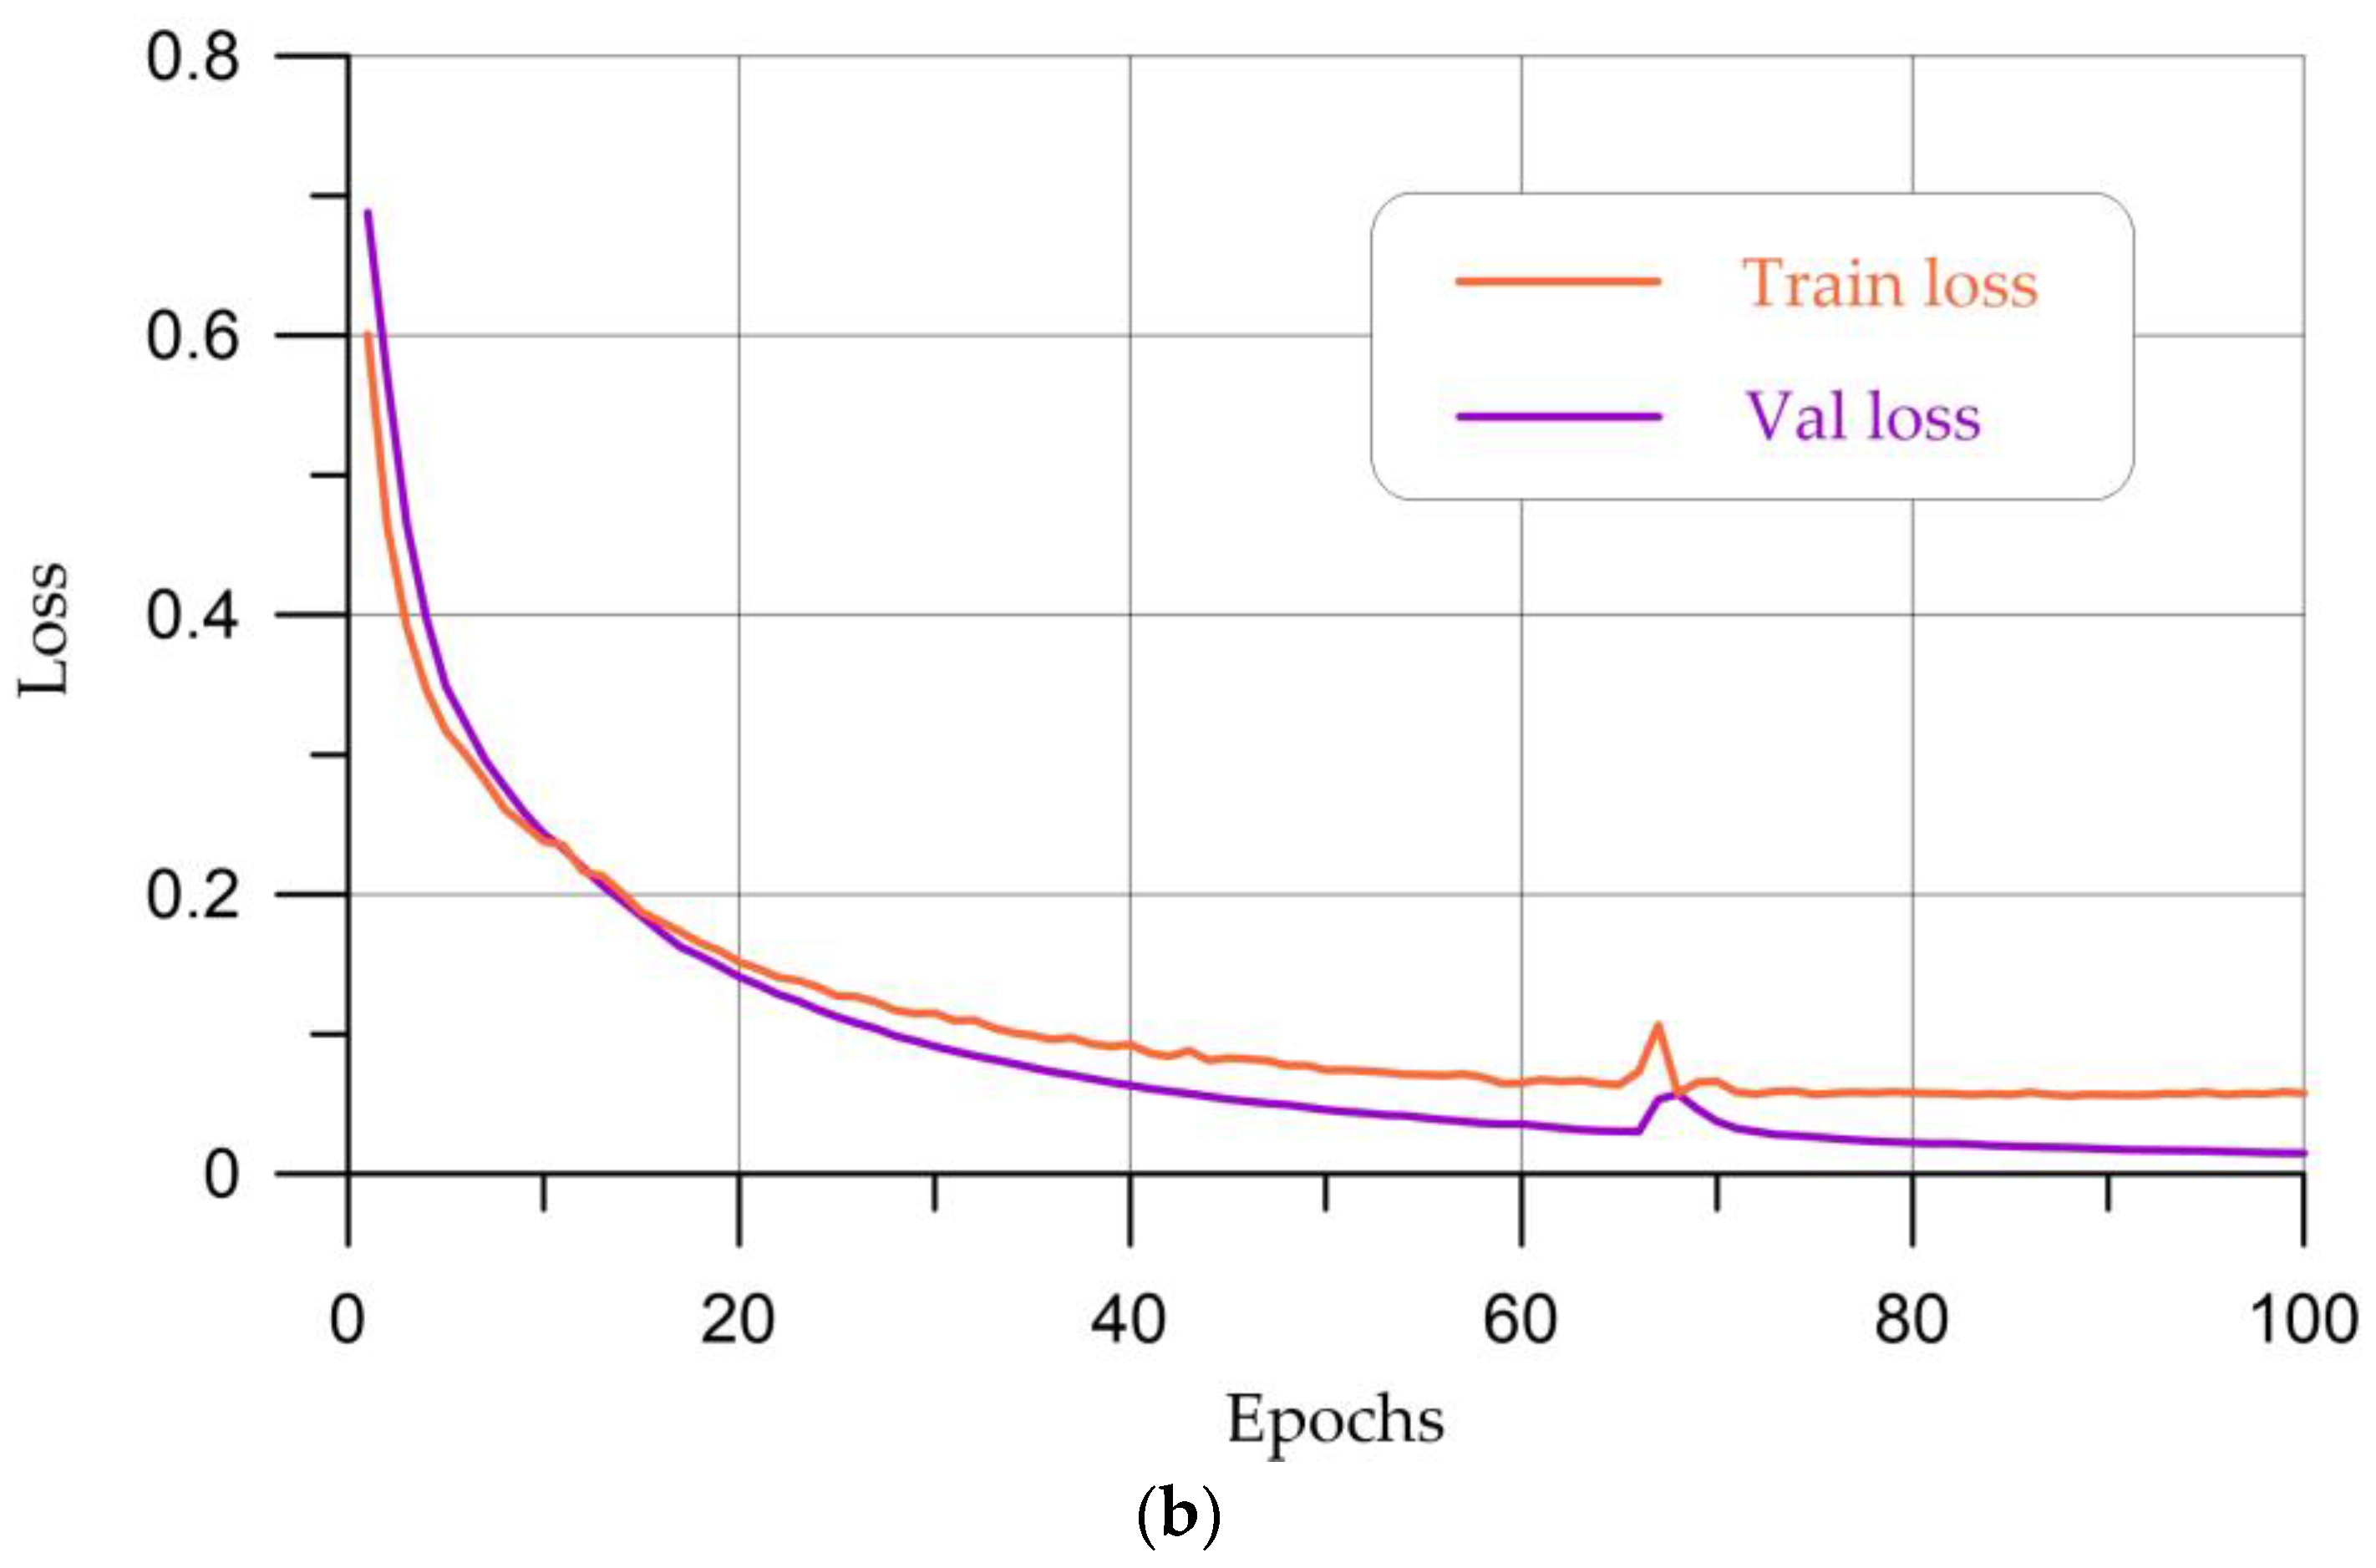
2.2.3. LinkNet Architecture and Creation of Model 1.3 and Model 1.4

The most commonly used encoder–decoder architecture besides U-Net is LinkNet CNN: “Input of each encoder layer is also bypassed to the output of its corresponding decoder. By doing this we aim at recovering lost spatial information that can be used by the decoder and its upsampling operations. In addition, since the decoder is sharing knowledge learned by the encoder at every layer, the decoder can use fewer parameters. This results in an overall more efficient network when compared to the existing state-of-the-art segmentation networks, and thus real-time operation” [50].
LinkNet is focused on the efficient use of computing resources within resource-constrained platforms. When using LinkNet, low memory consumption of computing devices is observed at low powers, which makes it optimal for practical use in field conditions, including the use of mobile devices. LinkNet, due to its smaller number of parameters, trains significantly faster than U-Net, with an overall similarity of architectures. Also, due to the smaller number of parameters, LinkNet is less susceptible to overfitting (Figure 8).
This study examines two models based on the LinkNet neural network architecture, as follows:
(1)
Model 1.3—based on the LinkNet architecture, implemented on the PyTorch machine learning framework, modified at the training stage by applying dynamic augmentation at each iteration. The input of the CNN is a set of 60 images, divided in the ratio 30/15/15 into training, validation and test samples. The probabilistic process of dynamic augmentation is similar to what occurs during the implementation of model 1.1.
(2)
Model 1.4—based on the LinkNet architecture using PyTorch, where at the training stage a data set of 500 images is used, created using an augmentation proprietary algorithm (static augmentation).
The main parameters of the learning process for the models are presented in Table 3. Unlike models based on the U-Net architecture, for models based on LinkNet, the binary cross-entropy loss function turned out to be the most optimal as it demonstrated the smallest errors.
Figure 9a,b show training graphs for models 1.3 and 1.4 on the training and validation sets.
Analysis of training graphs as well as assessment of the quality of the model on the test sample showed that overfitting was not observed.
Figure 10a,b present the metric values for models 1.3 and 1.4 during the training process. Starting from the epoch marked with the magenta line in Figure 10a,b, the model can be expected to perform well on the test set.
In Figure 9a, one can see a rather serious gap between the validation and training loss and in Figure 10a a similar gap between the quality metrics. It is worth noting that a closer look at these metrics will reveal that the gap between training and test recall is not as strong as between other metrics. This suggests that the model in this configuration tends to overidentify image pixels as belonging to the crack class. That is, the model finds more cracks than necessary. This effect may be associated both with a certain bias in the training sample, which implies overtraining of this model, and with the shortcomings of this model itself. In this case, we see that a similar problem is not observed in the case of training exactly the same model on static augmentation, which suggests that this model does not fit well with dynamic data augmentation.

3. Results and Discussion

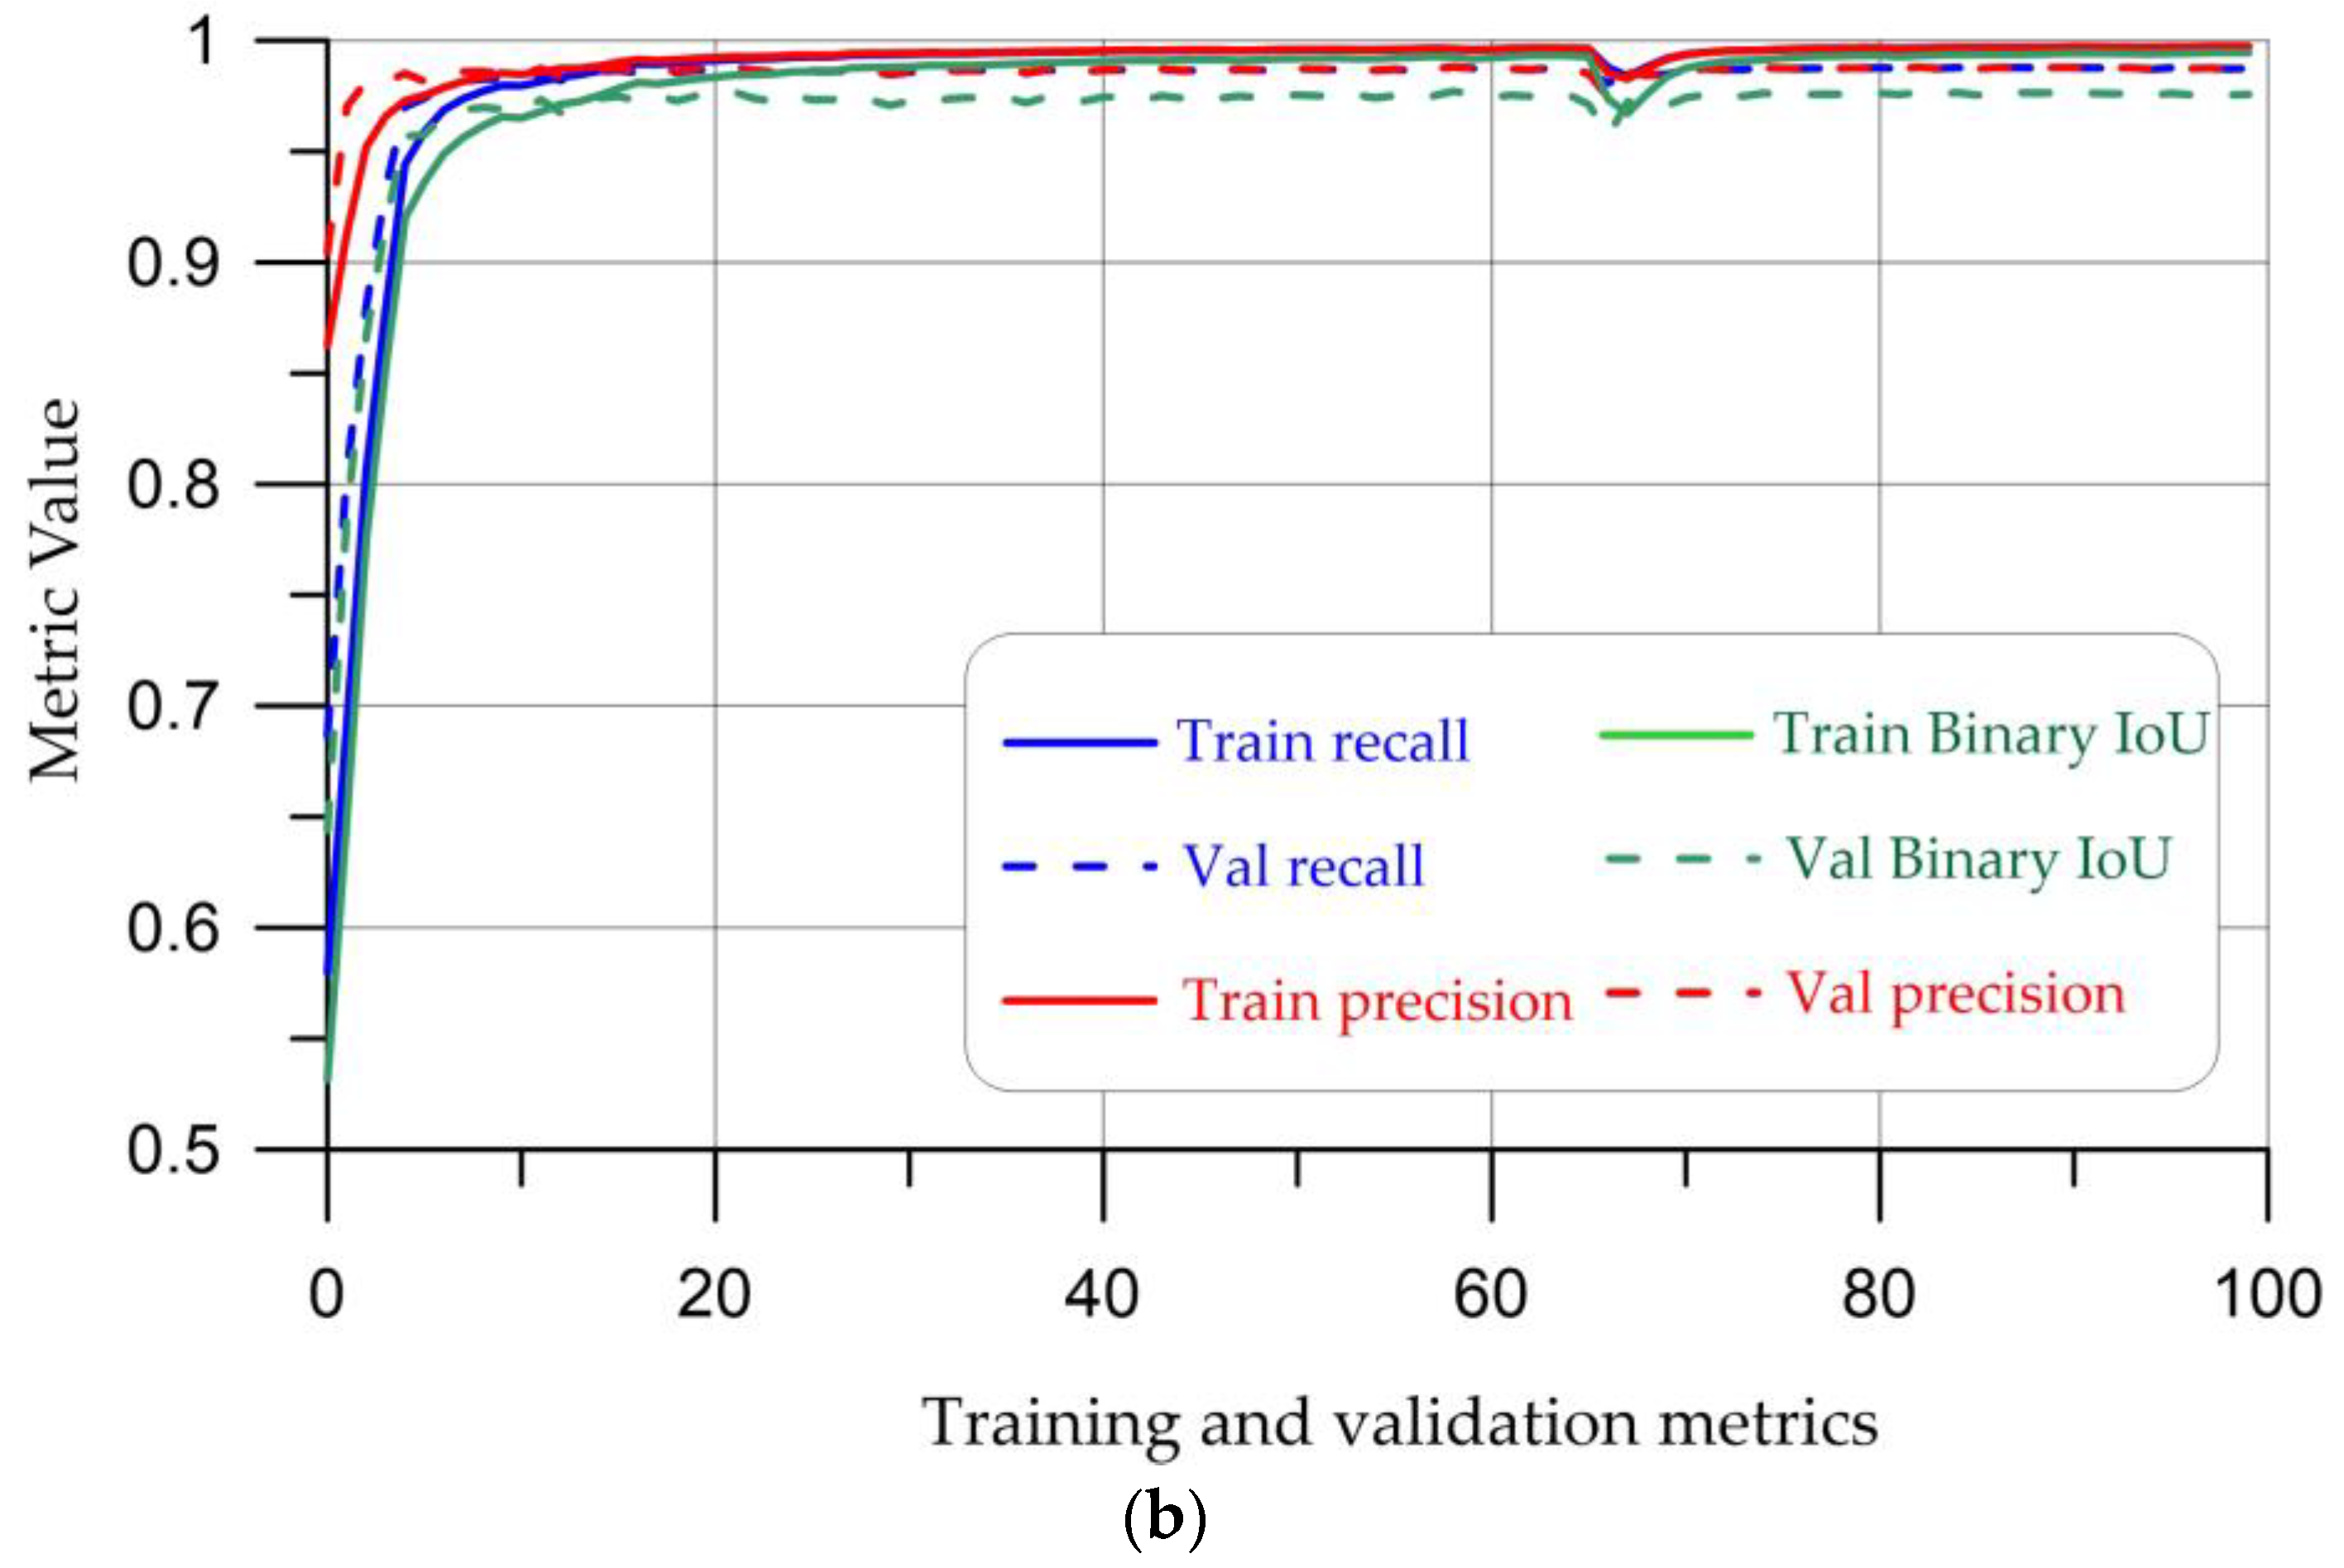
3.1. Quality Metrics for Segmenting Cracks in Aerated Concrete

To assess the quality of the models, the following metrics were used: precision and recall, F1, IoU. There is a balance between precision and recall, expressed in the F1 metric. F1 score is the harmonic average of precision and recall, where the F1 score reaches its best value at 1 and its worst value at 0.
F1 = 2 × (P × R)/(P + R)
Table 4 presents the results of crack segmentation using a hold-out set.
Figure 11 shows the results of the developed algorithms. The models show segmented areas containing a defect—a crack.
Interpreting the results of Table 4 and the images obtained from the output of each model, we can conclude that the most promising model for searching for cracks on the surface of aerated concrete products from the point of view of metrics and visual analysis is model 1.4 (LinkNet + conventional augmentation). The segmentation of the crack in Figure 11k by this model is carried out quite accurately and the model captures the main branches of the crack; while it is observed that this model does not capture the central part of the crack, which is barely visible even during visual inspection by a technologist, this is due to the complex structure of aerated concrete. In Figure 11l, it is also worth noting that the boundaries and direction of the crack are quite clearly defined.
LinkNet is considered to be a more efficient network compared to existing state-of-the-art slicing networks and hence will be applicable to real-time operations in the future.

3.2. Calculating the Length of a Segmented Crack

To demonstrate the calculation of crack length, image 11b was selected along with its best segmentation (Figure 11l) using model 1.4—LinkNet with static augmentation.
The crack length in the segmented area is calculated using the proprietary SCALE algorithm [51]. The calculation algorithm is as follows:
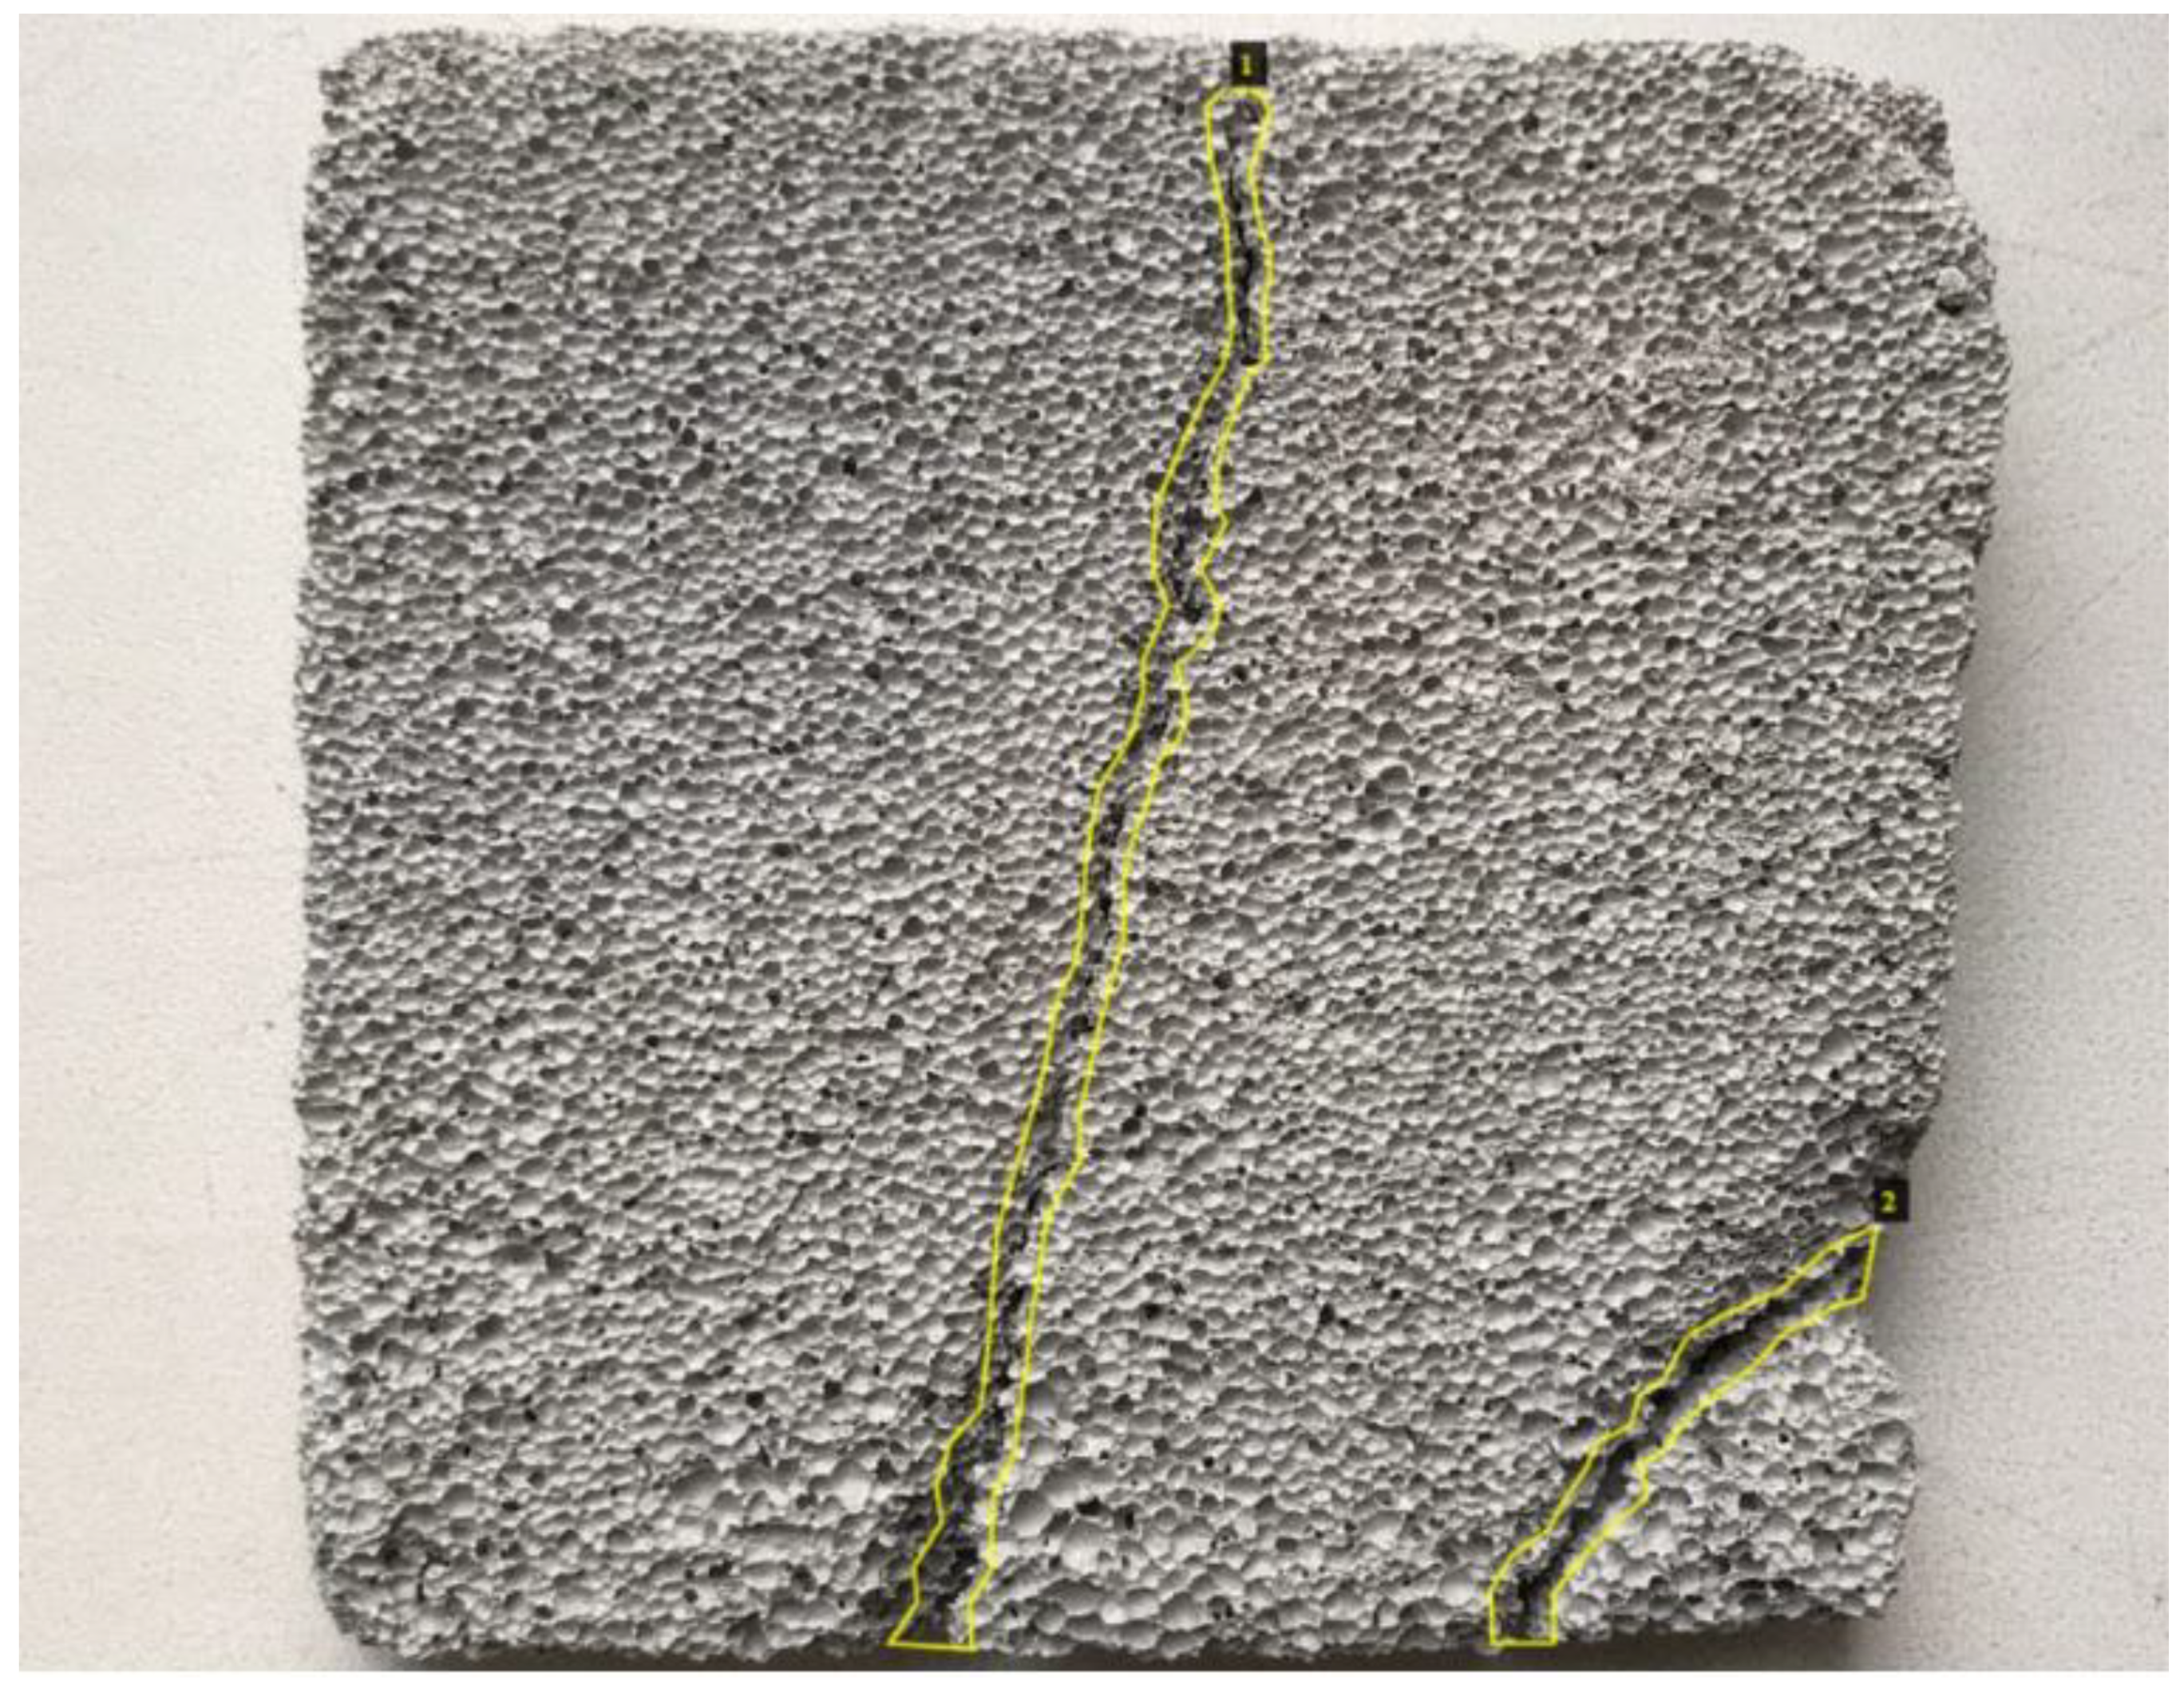
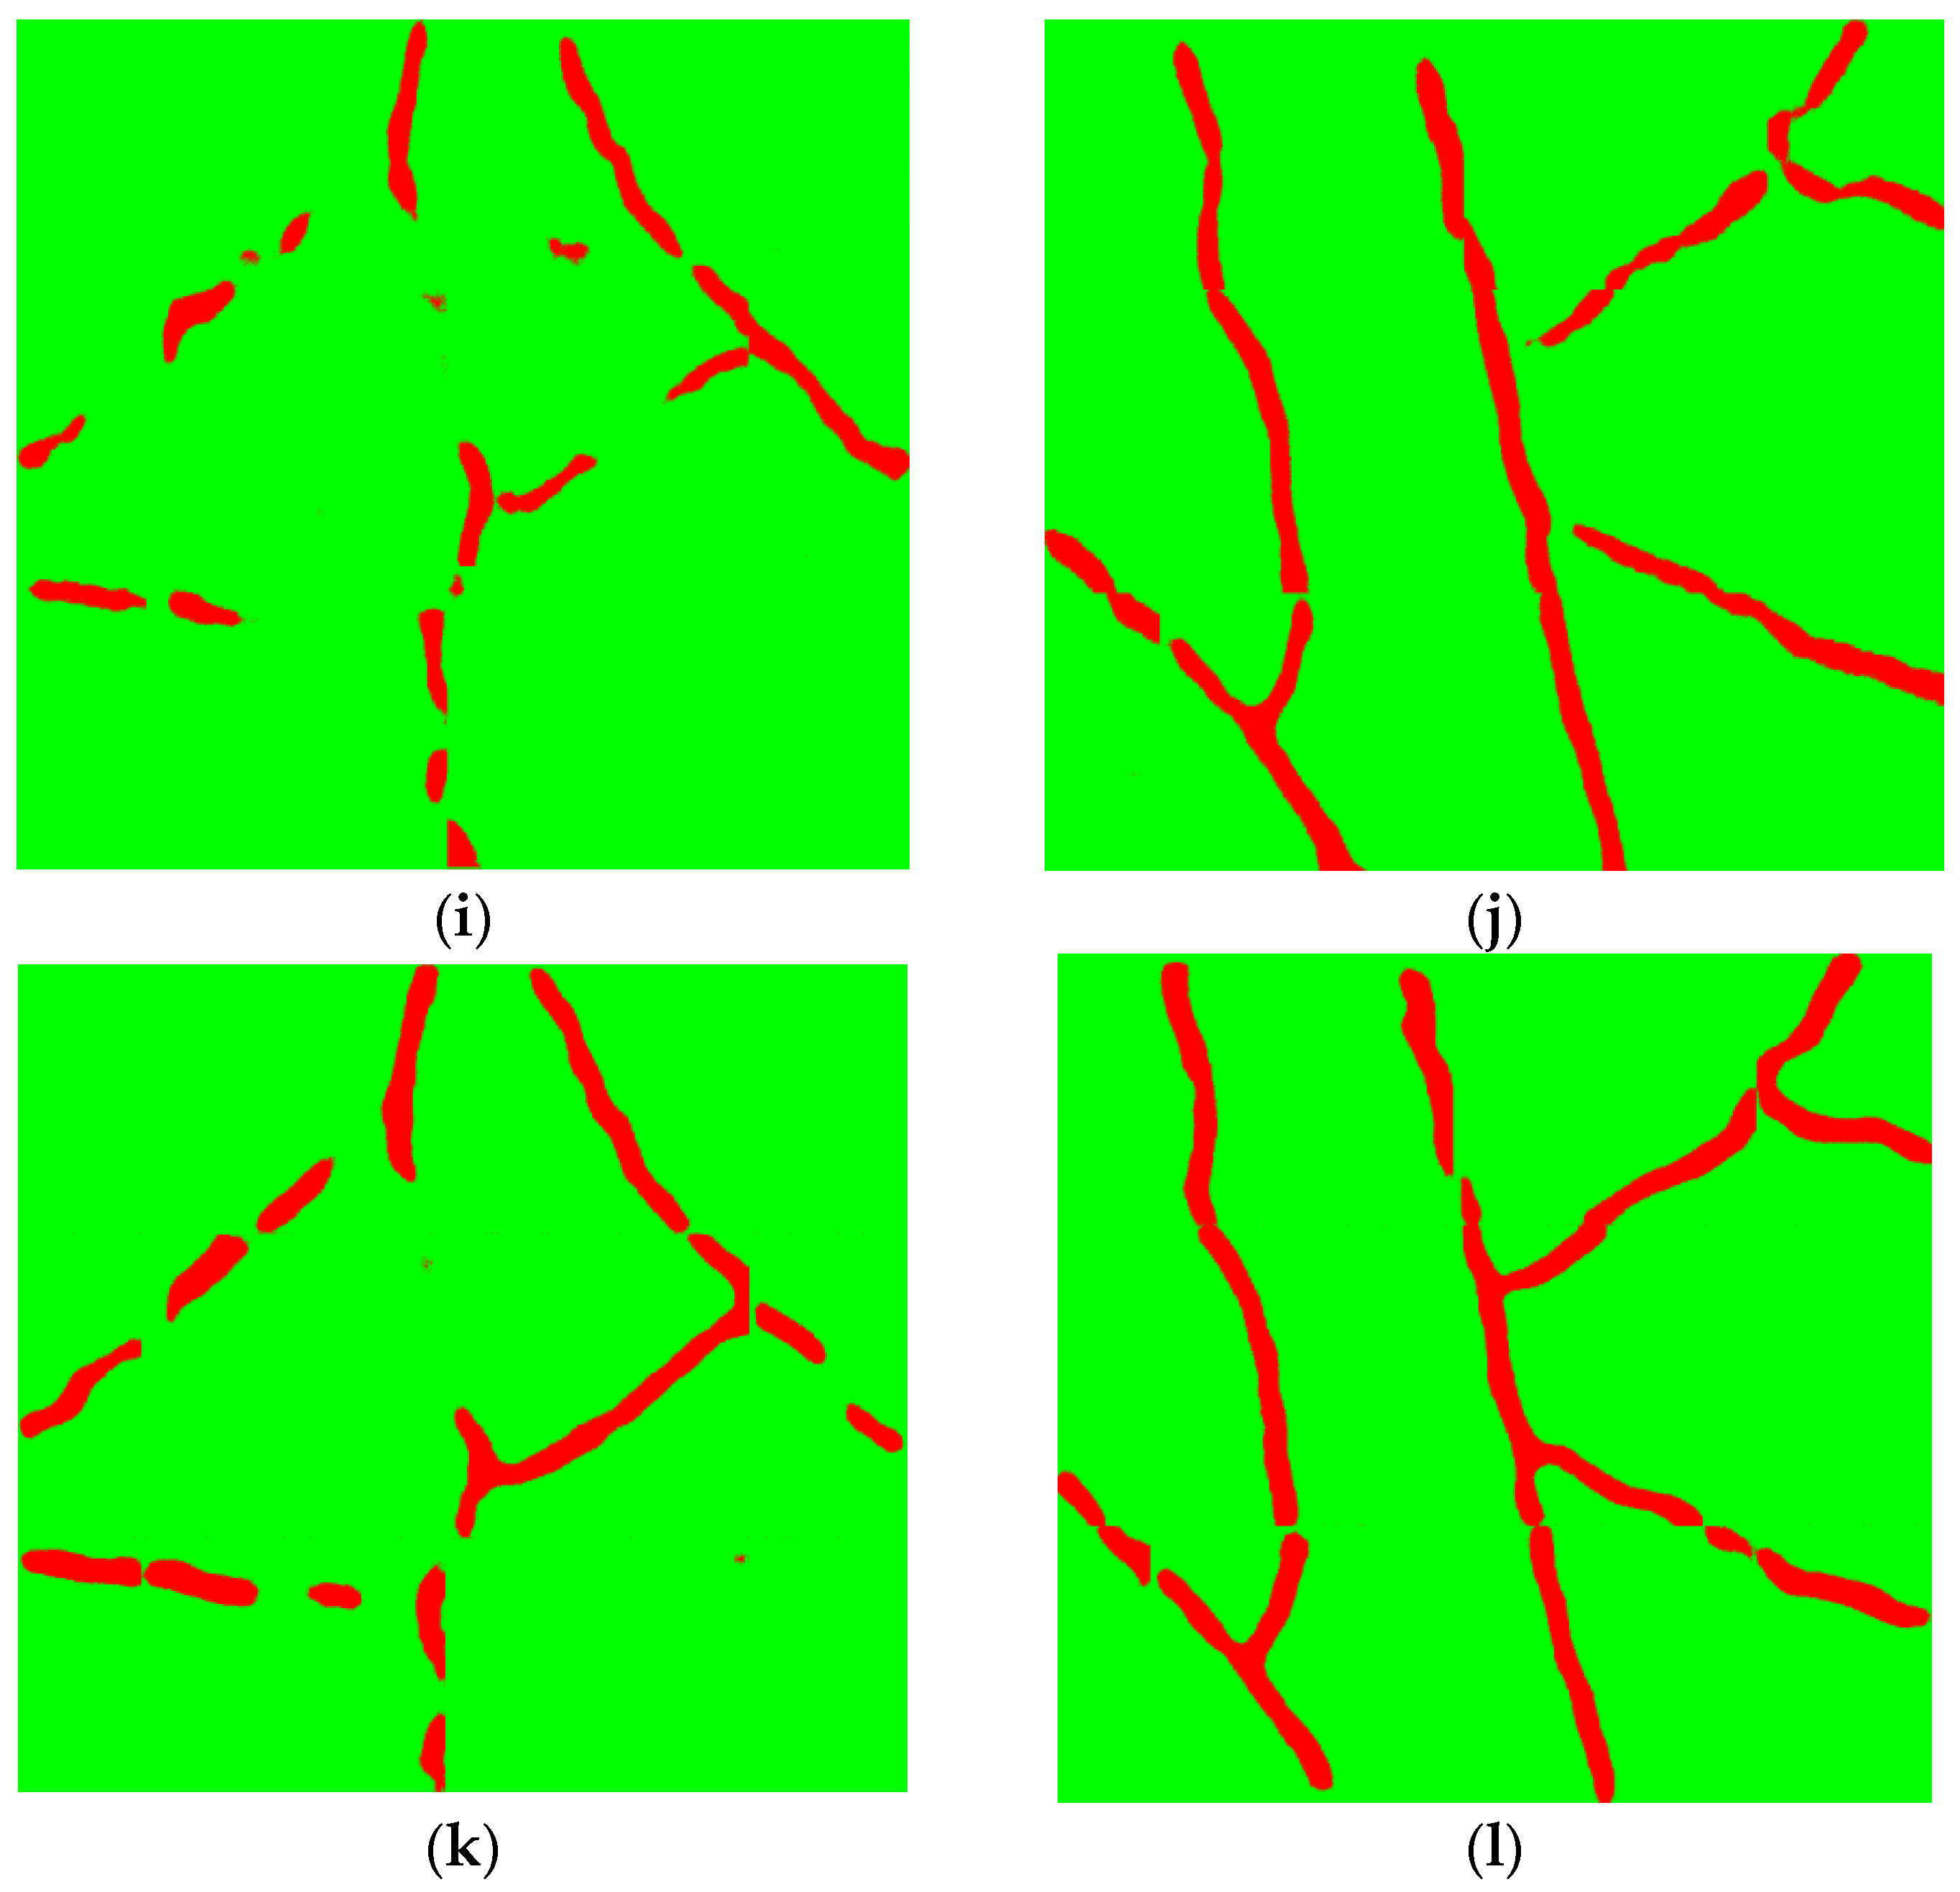
  • Dividing the mask into fragments, within each there is only one connected crack. In Figure 12, the DBSCAN clustering algorithm identified two clusters of pixels segmented by the neural network as cracks; respectively, each of these clusters (blue and red) corresponds to one of the two connected cracks detected in this image. In the future, each of these cracks will be processed independently.
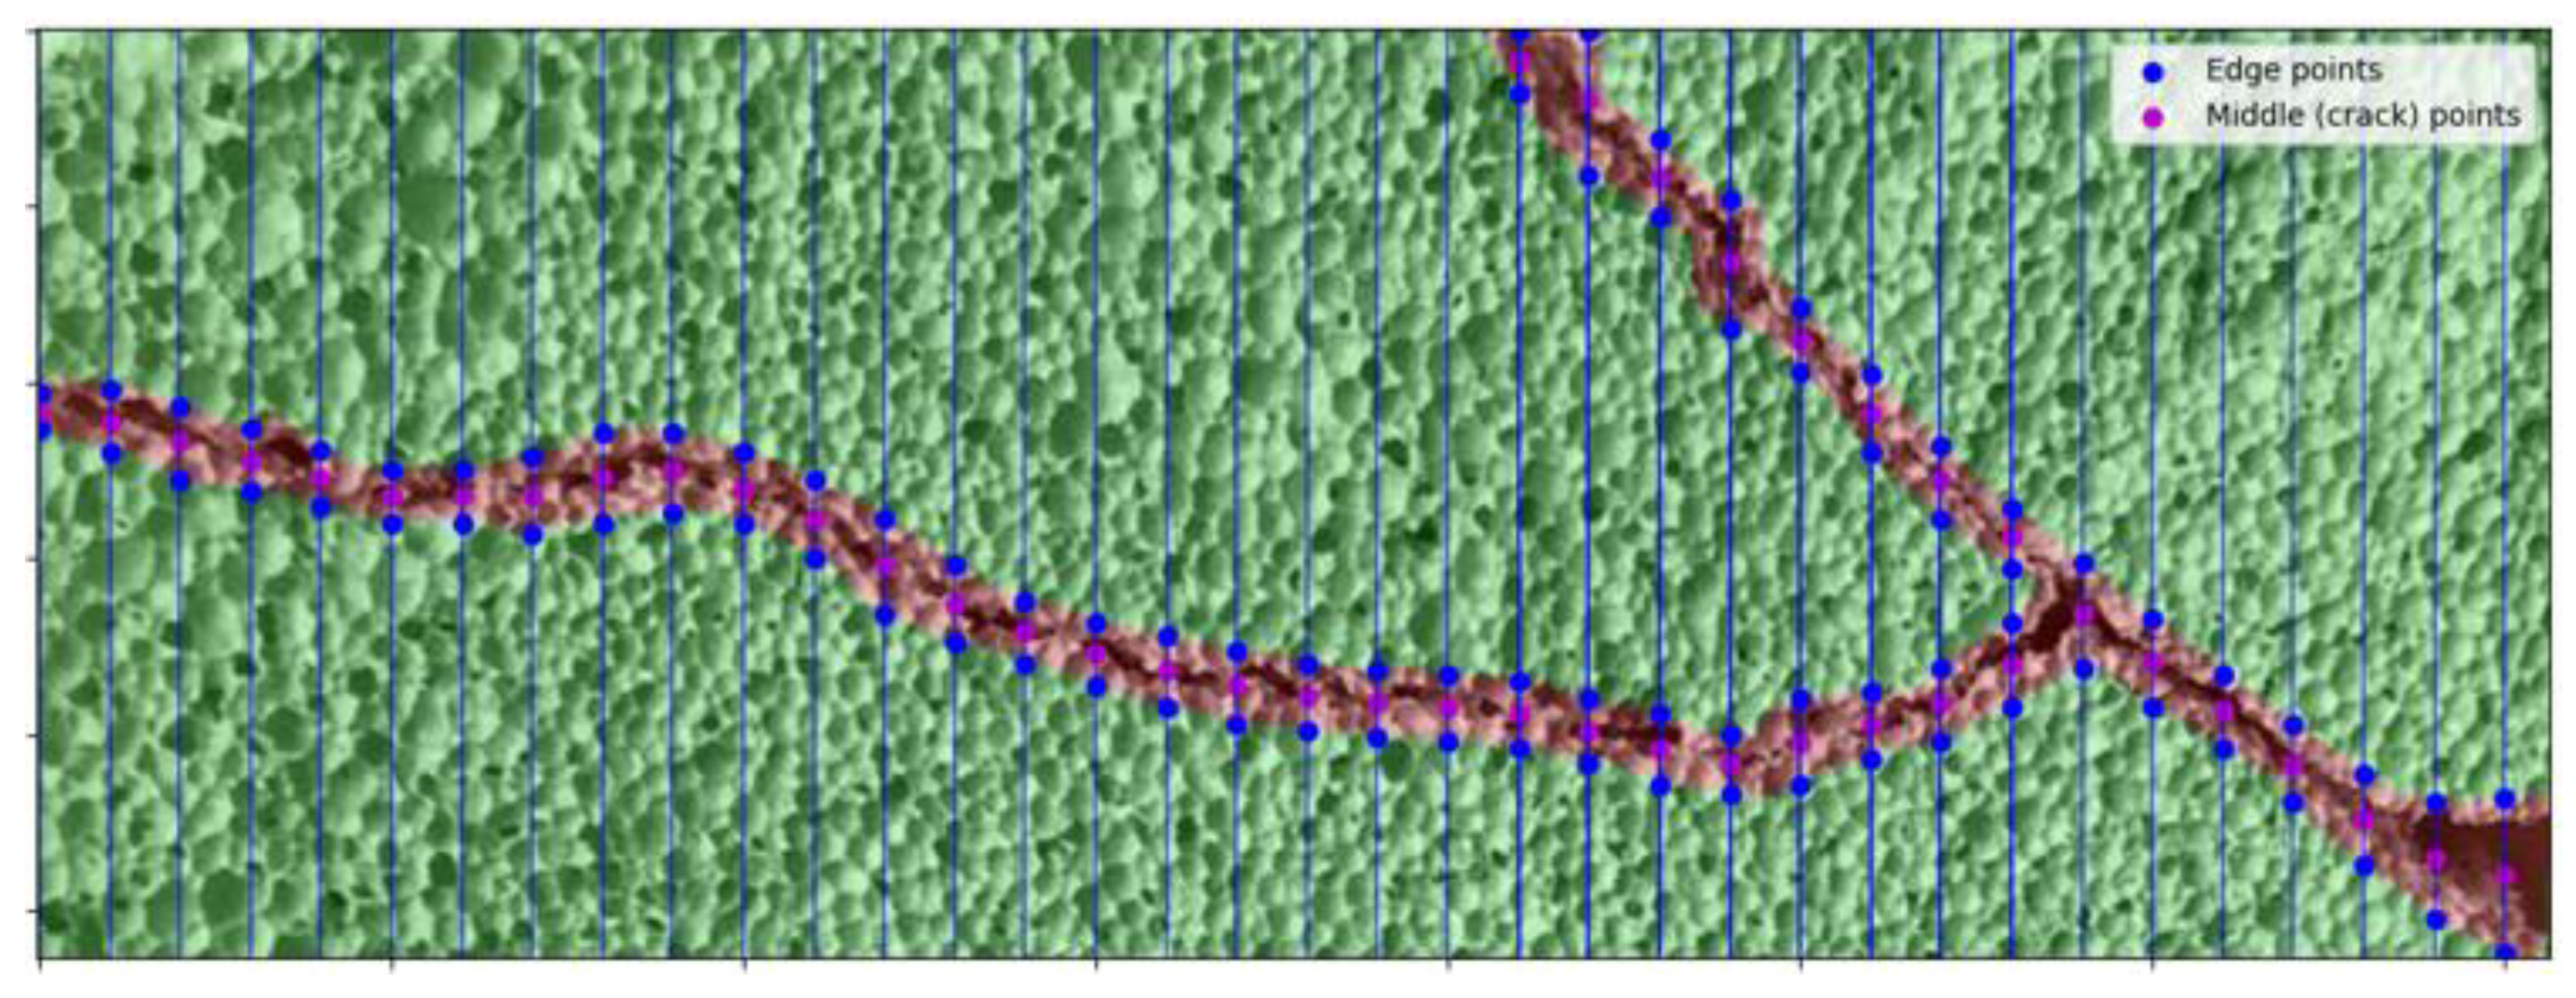
  • For each fragment, the orientation of the crack (vertical or horizontal) is determined by comparing the length of the corresponding fragment along the X axis and Y axis and comparing them.
  • In the case of horizontal orientation: for each vertical pixel-by-pixel slice of the image, the pixels corresponding to the beginning and end of the crack in this section are determined. The pixel lying in the middle between each pair of the beginning–end of the crack in this section is defined as the pixel lying in the middle of the crack and is added to some array.
So, for example, in Figure 13, for a horizontally oriented crack, a set of vertical slices is selected (indicated by blue vertical lines), for each of which the boundary points of intersection with a fragment of the crack (blue dots) are determined. A pixel lying exactly halfway between these two points is defined as a pixel belonging to a crack (purple dots). In the future, it is from these points that the length of the crack will be determined.
In the case of vertical orientation: the same is performed but for each horizontal slice. The result of this step is a list of pixels lying in the middle of the marked crack.
4.
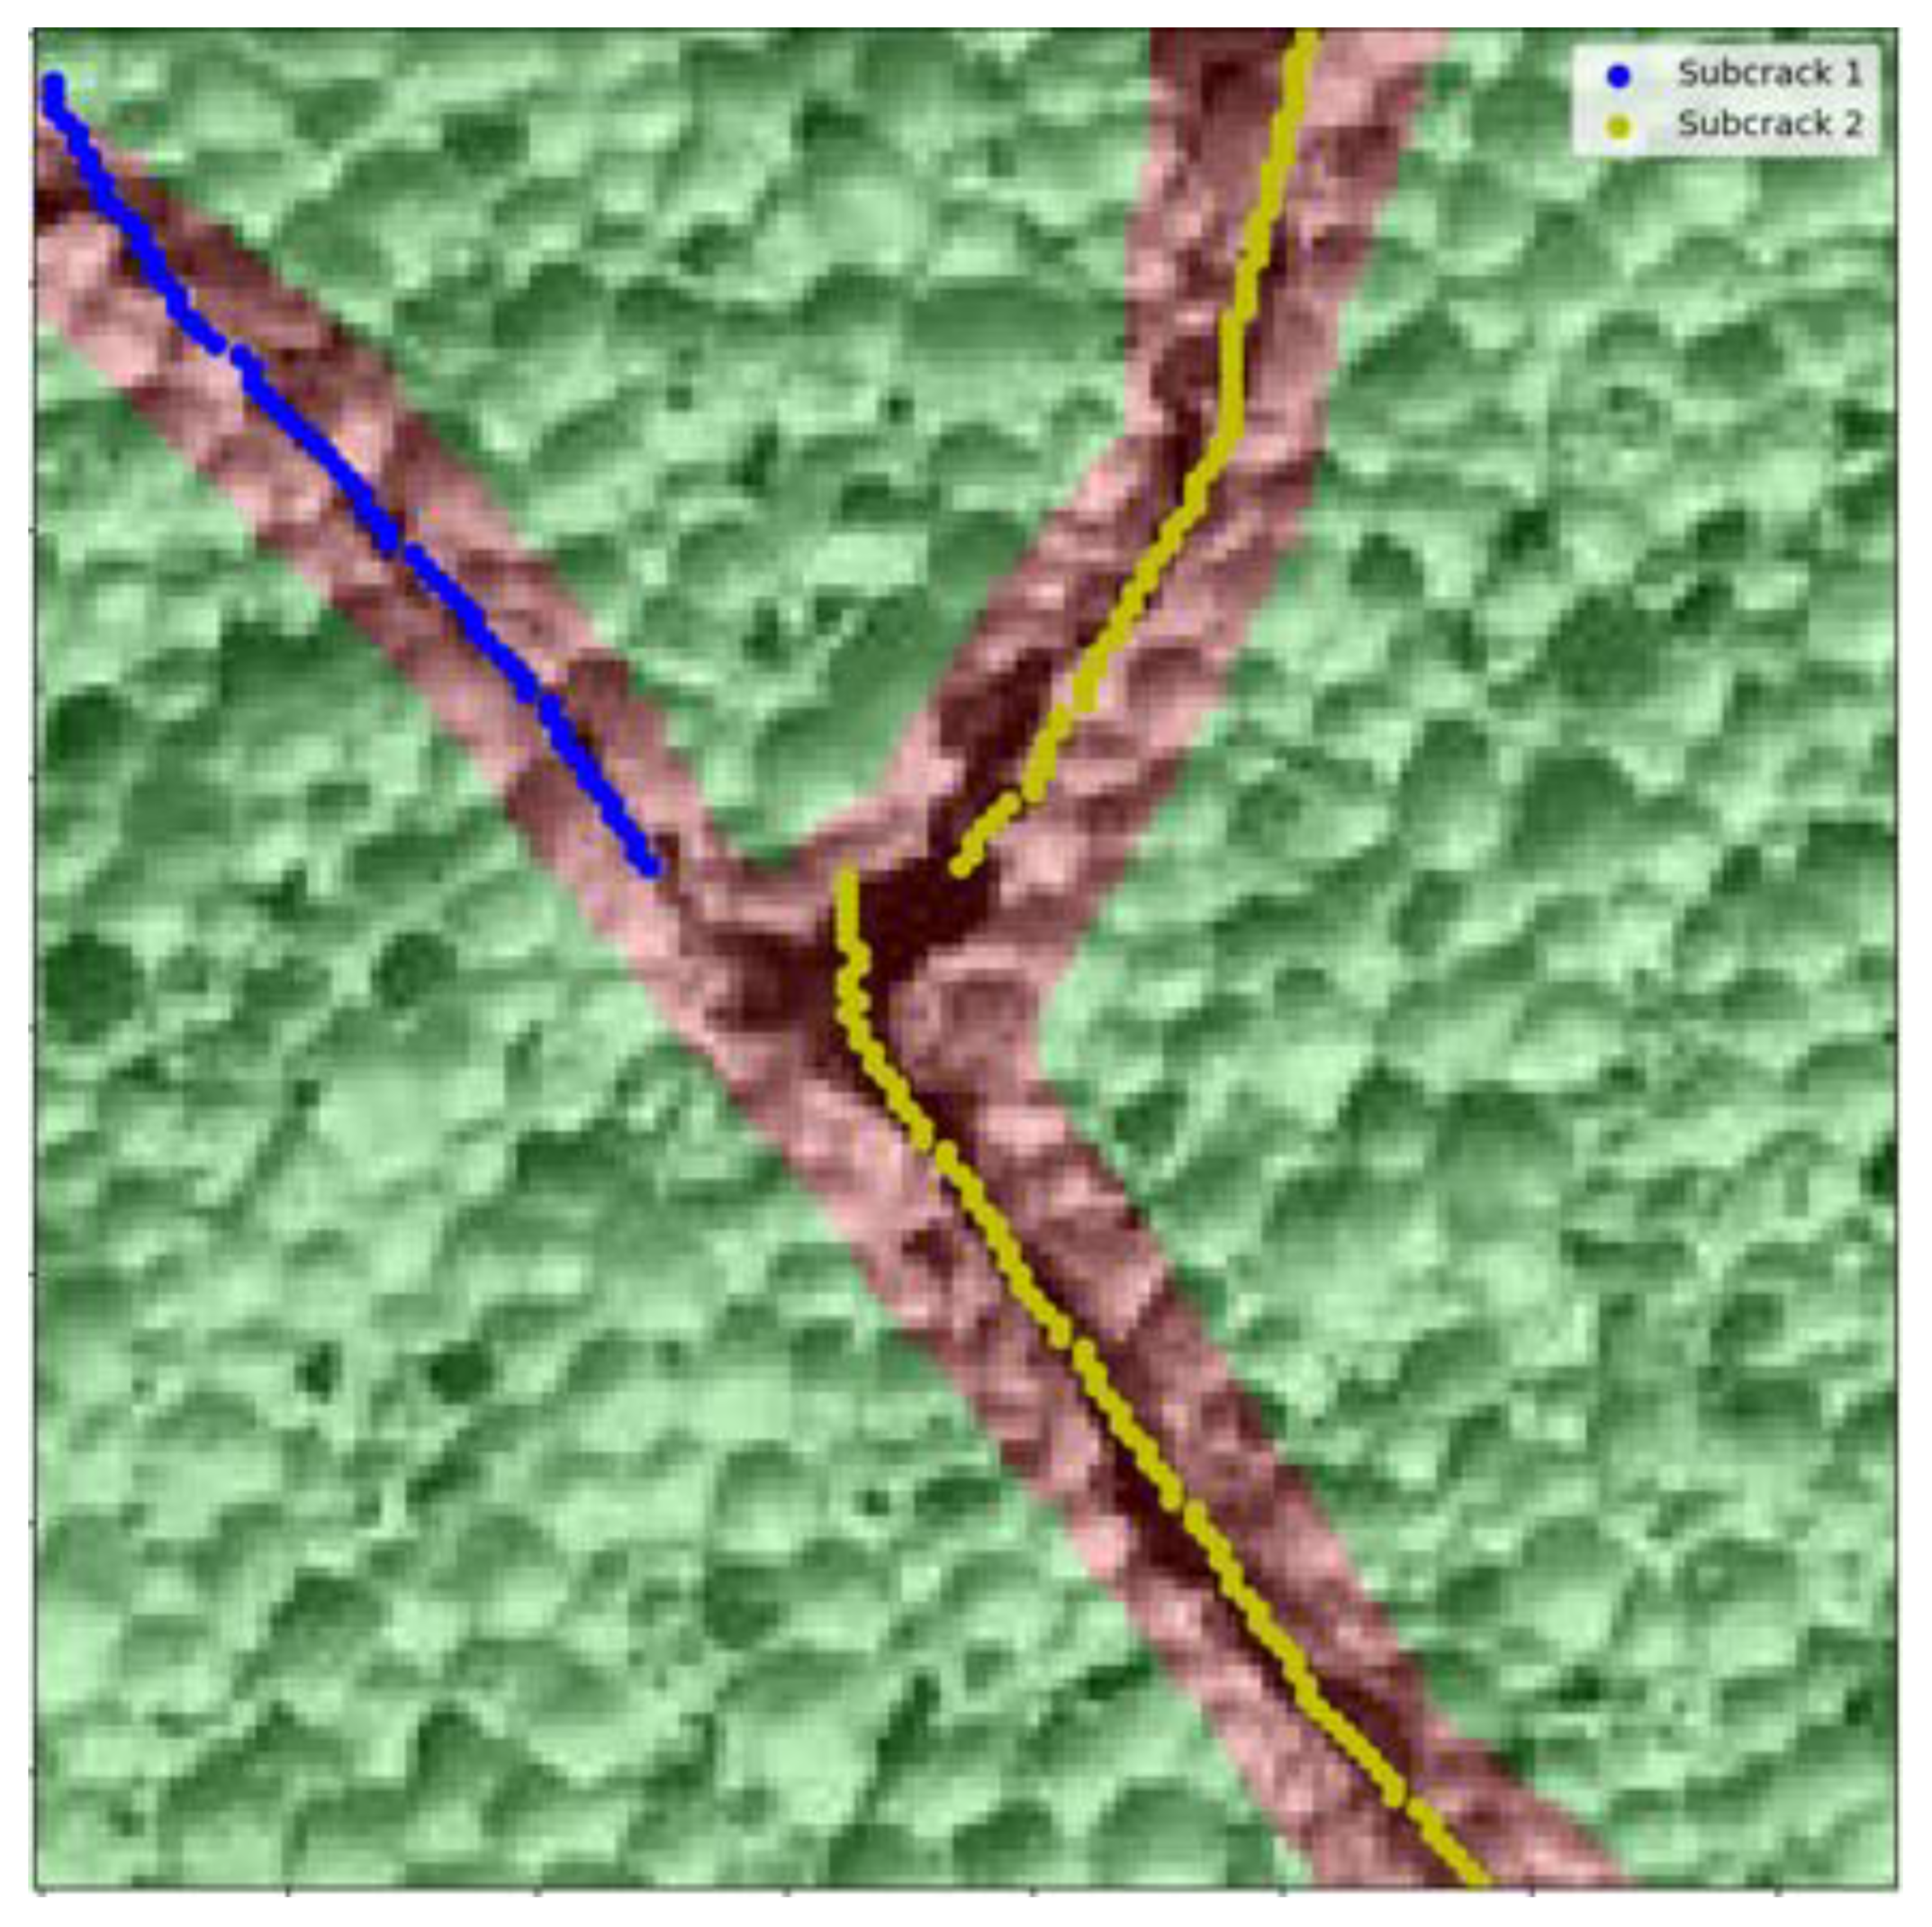
The DBSCAN algorithm is applied to the resulting set of pixels to detect different crack branches. Figure 14 shows that the crack is divided into two branches. By repeatedly applying the DBSCAN algorithm, it is possible to fragment the crack, breaking it into two subcracks (yellow and blue), the lengths of which are calculated independently and then summed up.
5.
For each branch, the length of the crack in pixels is calculated as the length of the broken line built on the corresponding pixels.
In total, for the crack in Figure 12, the total length of the segmented cracks was determined, and it amounted to 382 mm.
The error plot (Figure 15) shows the actual crack lengths on the test sample (OX axis) compared to the values determined by our algorithm (OU axis). This visualization method allows us to see how accurate the developed method is. Most of the points are located near the line located at an angle of 45°, which indicates a slight deviation when searching for crack lengths. The outliers are due to the fact that some areas of the crack that are difficult to distinguish visually are not captured by the algorithm; therefore, their length turns out to be shorter.
Comparing the segmentation results of the best 1.4 LinkNet model with static augmentation with other results of researchers, it is worth noting the acceptable values of the results obtained: precision = 0.73, recall = 0.80, F1 = 0.73, IoU = 0.84.
Thus, in ref. [52], the performance of various models trained using the researchers’ own data set was examined; the metrics are as follows: for BC-DUnet, precision = 0.69, recall = 0.81, F1 = 0.74, IoU = 0.60; for FCN-4s, precision = 0.59, recall = 0.64, F1 = 0.63, IoU = 0.50; for CrackSegNet, precision = 0.67, recall = 0.77, F1 = 0.74, IoU = 0.59; for HU-ResNet, precision = 0.66, recall = 0.78, F1 = 0.69, IoU = 0.61. The model we developed is generally not inferior to the above models in terms of the analyzed indicators [53], which suggests that crack inspection software for construction and facility managers using state-of-the-art segmentation will demonstrate an IoU level greater than 0.80 when detecting building façade cracks. The level of IoU = 0.84 for the best model in our study is not inferior to the technology under consideration and is also higher than this indicator in the model of pavement crack segmentation based on deep learning in [54,55], where IoU of 0.6235 for the Crack500 data set and 0.5278 for MCD data set is noted.
This study yielded a number of important results that are useful for scientific research and will be carried out in the future, as well as for the manufacturing and construction industry. The scientific result of the research is to obtain and process a number of new data, which made it possible to identify and consolidate in a technological sense and translating into production language those factors that were previously difficult to take into account in the production of aerated concrete products and reduced the efficiency of timely detection of defects in aerated concrete products. The dependencies are determined and their qualitative and quantitative interpretations are given to compare risk factors with the timely detection of defects in aerated concrete products.
The practical significance of the obtained result for the applied production and construction industry lies in the potential technological and economic effects, which will reduce the percentage of defects and provide the opportunity to reduce failures of buildings and structures due to the timely recognition of defects due to new smart technology, which, among other things, eliminates risks related to the human factor.

4. Conclusions

The results of this study led to the following conclusions:
(1)
The LinkNet model with static augmentation was the best, with results precision = 0.73, recall = 0.80, F1 = 0.73 and IoU = 0.84, along with models based on the U-Net architecture with static and dynamic augmentation as well as the LinkNet architecture with dynamic augmentation.
(2)
The proprietary SCALE algorithm reduces manual labor time when determining the length of cracks and delamination.
(3)
The obtained crack segmentation results are comparable to the results obtained by other researchers and allow us to solve the problem of detecting defects in building materials.
Prospects for the development of computer vision models for construction monitoring based on convolutional neural networks can be seen in the following:
  • Introduction of intelligent technologies for extracting visual features from images (including in real time) to reduce the time of specialists’ participation. The influence of specialists cannot be completely excluded, since the final decision making remains with the individual.
  • Expanding the range of building materials, products and structures in which defects can be detected.
  • Expanding areas of interest by analyzing new types of defects, such as chips, foreign inclusions, broken corners, etc. The development of computer vision in this direction will make it possible to scale the algorithm and make it universal at all stages of the life cycle of building materials, products and structures.
  • Increased resistance of CV models to various shooting conditions. This will make it possible to use computer vision models to assess the quality of building materials in the field and ensure reliable control.
  • Combining computer vision models based on CNN with other technologies, such as UAVs and robotics, will make it possible to use the developed algorithms when analyzing building structures in hard-to-reach places, increasing the level of safety of construction control.
With the constant development of technology and the growth of computing power, the improvement of the practical and theoretical base of research in the field of application of computer vision in the construction industry for detecting defects in building materials allows the development of effective and widely used construction monitoring systems.
Currently, work is already underway to create a neural network model for measuring other parameters of aerated concrete defects, such as width, depth and uniformity of distribution throughout the entire thickness.

Author Contributions

Conceptualization, I.R., S.A.S., E.M.S., A.N.B., A.K., S.A., A.P. and D.H; methodology, A.K. and I.R.; software, A.P., H.D., I.R. and A.K.; validation, I.R., A.K., A.P., S.A.S., E.M.S. and A.N.B.; formal analysis, A.K., I.R.; investigation, A.P., S.A.S., E.M.S., A.N.B., S.A., A.K., H.D. and I.R.; resources, I.R, S.A.S. and E.M.S.; data curation, S.A.S., E.M.S., A.K., A.N.B. and I.R.; writing—original draft preparation, I.R., S.A.S., E.M.S. and A.N.B.; writing—review and editing, I.R., S.A.S., E.M.S. and A.N.B.; visualization, I.R., S.A.S., E.M.S. and A.N.B.; supervision, A.N.B.; project administration, A.N.B.; funding acquisition, A.N.B. All authors have read and agreed to the published version of the manuscript.

Funding

This research received no external funding.

Data Availability Statement

Data are contained within the article.

Acknowledgments

The authors would like to acknowledge the administration of Don State Technical University for their resources and financial support.

Conflicts of Interest

Author Alexey Kozhakin was employed by the company OOO VDK. The remaining authors declare that the research was conducted in the absence of any commercial or financial relationships that could be construed as a potential conflict of interest.

References

  1. Jayaram, M.A. Computer vision applications in construction material and structural health monitoring: A scoping review. Mater. Today Proc. In Press. 2023. [Google Scholar] [CrossRef]
  2. Alsakka, F.; Assaf, S.; El-Chami, I.; Al-Hussein, M. Computer vision applications in offsite construction. Autom. Constr. 2023, 154, 104980. [Google Scholar] [CrossRef]
  3. Reja, V.K.; Varghese, K.; Ha, Q.P. Computer vision-based construction progress monitoring. Autom. Constr. 2022, 138, 104245. [Google Scholar] [CrossRef]
  4. Ekanayake, B.; Wong, J.K.W.; Fini, A.A.F.; Smith, P. Computer vision-based interior construction progress monitoring: A literature review and future research directions. Autom. Constr. 2021, 127, 103705. [Google Scholar] [CrossRef]
  5. Beskopylny, A.N.; Shcherban’, E.M.; Stel’makh, S.A.; Mailyan, L.R.; Meskhi, B.; Razveeva, I.; Kozhakin, A.; Beskopylny, N.; El’shaeva, D.; Artamonov, S. Method for Concrete Structure Analysis by Microscopy of Hardened Cement Paste and Crack Segmentation Using a Convolutional Neural Network. J. Compos. Sci. 2023, 7, 327. [Google Scholar] [CrossRef]
  6. Hadinata, P.N.; Simanta, D.; Eddy, L.; Nagai, K. Multiclass Segmentation of Concrete Surface Damages Using U-Net and DeepLabV3+. Appl. Sci. 2023, 13, 2398. [Google Scholar] [CrossRef]
  7. Shah, S.A.R.; Azab, M.; Seif ElDin, H.M.; Barakat, O.; Anwar, M.K.; Bashir, Y. Predicting Compressive Strength of Blast Furnace Slag and Fly Ash Based Sustainable Concrete Using Machine Learning Techniques: An Application of Advanced Decision-Making Approaches. Buildings 2022, 12, 914. [Google Scholar] [CrossRef]
  8. Barkhordari, M.S.; Armaghani, D.J.; Mohammed, A.S.; Ulrikh, D.V. Data-Driven Compressive Strength Prediction of Fly Ash Concrete Using Ensemble Learner Algorithms. Buildings 2022, 12, 132. [Google Scholar] [CrossRef]
  9. Ahmad, A.; Chaiyasarn, K.; Farooq, F.; Ahmad, W.; Suparp, S.; Aslam, F. Compressive Strength Prediction via Gene Expression Programming (GEP) and Artificial Neural Network (ANN) for Concrete Containing RCA. Buildings 2021, 11, 324. [Google Scholar] [CrossRef]
  10. Ashrafian, A.; Taheri Amiri, M.J.; Masoumi, P.; Asadi-Shiadeh, M.; Yaghoubi-Chenari, M.; Mosavi, A.; Nabipour, N. Classification-Based Regression Models for Prediction of the Mechanical Properties of Roller-Compacted Concrete Pavement. Appl. Sci. 2020, 10, 3707. [Google Scholar] [CrossRef]
  11. Naderpour, H.; Rafiean, A.H.; Fakharian, P. Compressive strength prediction of environmentally friendly concrete using artificial neural networks. J. Build. Eng. 2018, 16, 213–219. [Google Scholar] [CrossRef]
  12. Anton, C.; Curteanu, S.; Lisa, C.; Leon, F. Machine Learning Methods Applied for Modeling the Process of Obtaining Bricks Using Silicon-Based Materials. Materials 2021, 14, 7232. [Google Scholar] [CrossRef] [PubMed]
  13. Abbas, Y.M.; Khan, M.I. Robust Machine Learning Framework for Modeling the Compressive Strength of SFRC: Database Compilation, Predictive Analysis, and Empirical Verification. Materials 2023, 16, 7178. [Google Scholar] [CrossRef] [PubMed]
  14. Sun, C.; Wang, K.; Liu, Q.; Wang, P.; Pan, F. Machine-Learning-Based Comprehensive Properties Prediction and Mixture Design Optimization of Ultra-High-Performance Concrete. Sustainability 2023, 15, 15338. [Google Scholar] [CrossRef]
  15. Cakiroglu, C. Explainable Data-Driven Ensemble Learning Models for the Mechanical Properties Prediction of Concrete Confined by Aramid Fiber-Reinforced Polymer Wraps Using Generative Adversarial Networks. Appl. Sci. 2023, 13, 11991. [Google Scholar] [CrossRef]
  16. Liu, M.-Y.; Li, Z.; Zhang, H. Probabilistic Shear Strength Prediction for Deep Beams Based on Bayesian-Optimized Data-Driven Approach. Buildings 2023, 13, 2471. [Google Scholar] [CrossRef]
  17. Perez, H.; Tah, J.H.M. Towards Automated Measurement of As-Built Components Using Computer Vision. Sensors 2023, 23, 7110. [Google Scholar] [CrossRef]
  18. Choi, J.; Ha, M.; Lee, J.G. Transfer Learning-Based Object Detection Model for Steel Structure Bolt Fastening Inspection. Appl. Sci. 2023, 13, 9499. [Google Scholar] [CrossRef]
  19. Lee, S.Y.; Huynh, T.C.; Park, J.H.; Kim, J.T. Bolt-Loosening Detection using Vision-Based Deep Learning Algorithm and Image Processing Method. J. Comput. Struct. Eng. Inst. Korea 2019, 1, 265–272. Available online: https://www.jcoseik.or.kr/articles/xml/NR0x/ (accessed on 28 November 2023). [CrossRef]
  20. Park, J.H.; Kim, T.H.; Choo, S.Y. A Development on Deep Learning-based Detecting Technology of Rebar Placement for Improving Building Supervision Efficiency. J. Archit. Inst. Korea Plan. Des. 2020, 36, 93–103. Available online: https://koreascience.kr/article/JAKO202016151583816.page (accessed on 28 November 2023).
  21. Kim, H.; Bang, S.; Jeong, H.; Ham, Y.; Kim, H. Analyzing context and productivity of tunnel earthmoving processes using imaging and simulation. Autom. Constr. 2018, 92, 188–198. [Google Scholar] [CrossRef]
  22. Rajan, A.J.; Jayakrishna, K.; Vignesh, T.; Chandradass, J.; Kannan, T.T.M. Development of computer vision for inspection of bolt using convolutional neural network. Mater. Today Proc. 2021, 45, 6931–6935. [Google Scholar] [CrossRef]
  23. Sun, Y.; Gu, Z. Using computer vision to recognize construction material: A Trustworthy Dataset Perspective. Resour. Conserv. Recycl. 2022, 183, 106362. [Google Scholar] [CrossRef]
  24. Fang, W.; Ding, L.; Love, P.E.D.; Luo, H.; Li, H.; Peña-Mora, F.; Zhong, B.; Zhou, C. Computer vision applications in construction safety assurance. Autom. Constr. 2020, 110, 103013. [Google Scholar] [CrossRef]
  25. Li, P.; Wu, F.; Xue, S.; Guo, L. Study on the Interaction Behaviors Identification of Construction Workers Based on ST-GCN and YOLO. Sensors 2023, 23, 6318. [Google Scholar] [CrossRef] [PubMed]
  26. Akinsemoyin, A.; Awolusi, I.; Chakraborty, D.; Al-Bayati, A.J.; Akanmu, A. Unmanned Aerial Systems and Deep Learning for Safety and Health Activity Monitoring on Construction Sites. Sensors 2023, 23, 6690. [Google Scholar] [CrossRef]
  27. Jin, X.; Ahn, C.R.; Kim, J.; Park, M. Welding Spark Detection on Construction Sites Using Contour Detection with Automatic Parameter Tuning and Deep-Learning-Based Filters. Sensors 2023, 23, 6826. [Google Scholar] [CrossRef] [PubMed]
  28. Khan, N.; Zaidi, S.F.A.; Yang, J.; Park, C.; Lee, D. Construction Work-Stage-Based Rule Compliance Monitoring Framework Using Computer Vision (CV) Technology. Buildings 2023, 13, 2093. [Google Scholar] [CrossRef]
  29. Wu, H.; Zhong, B.; Li, H.; Love, P.; Pan, X.; Zhao, N. Combining computer vision with semantic reasoning for on-site safety management in construction. J. Build. Eng. 2021, 42, 103036. [Google Scholar] [CrossRef]
  30. Lee, H.; Jeon, J.; Lee, D.; Park, C.; Kim, J.; Lee, D. Game engine-driven synthetic data generation for computer vision-based safety monitoring of construction workers. Autom. Constr. 2023, 155, 105060. [Google Scholar] [CrossRef]
  31. Arshad, S.; Akinade, O.; Bello, S.; Bilal, M. Computer vision and IoT research landscape for health and safety management on construction sites. J. Build. Eng. 2023, 76, 107049. [Google Scholar] [CrossRef]
  32. Kong, T.; Fang, W.; Love, P.E.D.; Luo, H.; Xu, S.; Li, H. Computer vision and long short-term memory: Learning to predict unsafe behaviour in construction. Adv. Eng. Inform. 2021, 50, 101400. [Google Scholar] [CrossRef]
  33. Beckman, G.H.; Polyzois, D.; Cha, Y.J. Deep learning-based automatic volumetric damage quantification using depth camera. Autom. Constr. 2019, 99, 114–124. [Google Scholar] [CrossRef]
  34. Dung, C.V.; Anh, L.D. Autonomous concrete crack detection using deep fully convolutional neural network. Autom. Constr. 2019, 99, 52–58. [Google Scholar] [CrossRef]
  35. Rubio, J.J.; Kashiwa, T.; Laiteerapong, T.; Deng, W.; Nagai, K.; Escalera, S.; Nakayama, K.; Matsuo, Y.; Prendinger, H. Multi-class structural damage segmentation using fully convolutional networks. Comput. Ind. 2019, 112, 103121. [Google Scholar] [CrossRef]
  36. Fu, R.; Cao, M.; Novák, D.; Qian, X.; Alkayem, N.F. Extended efficient convolutional neural network for concrete crack detection with illustrated merits. Autom. Constr. 2023, 156, 105098. [Google Scholar] [CrossRef]
  37. Dorafshan, S.; Thomas, R.J.; Maguire, M. Comparison of deep convolutional neural networks and edge detectors for image-based crack detection in concrete. Constr. Build. Mater. 2018, 186, 1031–1045. [Google Scholar] [CrossRef]
  38. Beskopylny, A.N.; Shcherban’, E.M.; Stel’makh, S.A.; Mailyan, L.R.; Meskhi, B.; Razveeva, I.; Kozhakin, A.; El’shaeva, D.; Beskopylny, N.; Onore, G. Discovery and Classification of Defects on Facing Brick Specimens Using a Convolutional Neural Network. Appl. Sci. 2023, 13, 5413. [Google Scholar] [CrossRef]
  39. Beskopylny, A.N.; Shcherban’, E.M.; Stel’makh, S.A.; Mailyan, L.R.; Meskhi, B.; Razveeva, I.; Kozhakin, A.; El’shaeva, D.; Beskopylny, N.; Onore, G. Detecting Cracks in Aerated Concrete Samples Using a Convolutional Neural Network. Appl. Sci. 2023, 13, 1904. [Google Scholar] [CrossRef]
  40. Iraniparast, M.; Ranjbar, S.; Rahai, M.; Nejad, F.M. Surface concrete cracks detection and segmentation using transfer learning and multi-resolution image processing. Structures 2023, 54, 386–398. [Google Scholar] [CrossRef]
  41. Ding, W.; Yang, H.; Yu, K.; Shu, J. Crack detection and quantification for concrete structures using UAV and transformer. Autom. Constr. 2023, 152, 104929. [Google Scholar] [CrossRef]
  42. Beskopylny, A.N.; Chepurnenko, A.; Meskhi, B.; Stel’makh, S.A.; Shcherban’, E.M.; Razveeva, I.; Kozhakin, A.; Zavolokin, K.; Krasnov, A.A. Detection and Dispersion Analysis of Water Globules in Oil Samples Using Artificial Intelligence Algorithms. Biomimetics 2023, 8, 309. [Google Scholar] [CrossRef]
  43. Beskopylny, A.N.; Mailyan, L.R.; Stel’makh, S.A.; Shcherban’, E.M.; Razveeva, I.F.; Kozhakin, A.N.; Beskopylny, N.A.; El’shaeva, D.M.; Tyutina, A.D.; Onore, G.S. Photographic Images of the Structure of Aerated Concrete. Russian Federation Database 2022623622, 22 December 2022. Available online: https://www.fips.ru/registers-doc-view/fips_servlet?DB=DB&DocNumber=2022623622&TypeFile=html (accessed on 13 October 2023).
  44. Shcherban’, E.M.; Razveeva, I.F.; Kozhakin, A.N.; Artamonov, S.A. Segmented Images of Aerated Concrete Products. Russian Federation Database 2023623354, 5 October 2023. Available online: https://www.fips.ru/iiss/document.xhtml?faces-redirect=true&id=6e7ca08848aea4e51b2fa56243af377e (accessed on 13 October 2023).
  45. Beskopylny, A.N.; Stel’makh, S.A.; Shcherban’, E.M.; Razveeva, I.F.; Kozhakin, A.N.; Beskopylny, N.A.; Onore, G.S. Image Augmentation Program. Russian Federation Computer Program 2022685192, 21 December 2022. Available online: https://www.fips.ru/registers-doc-view/fips_servlet?DB=EVM&DocNumber=2022685192&TypeFile=html (accessed on 13 October 2023).
  46. Ma, X.; Li, H.; Wang, D.; Li, C.; Wei, Y. Simulation and Experimental Substantiation of the Thermal Properties of Non-Autoclaved Aerated Concrete with Recycled Concrete Powder. Materials 2022, 15, 8341. [Google Scholar] [CrossRef] [PubMed]
  47. Legostaeva, N.V. Analysis of the causes of defects in aerated concrete during formation. Proc. Univ. Investig. Construct. 2018, 8, 91–97. [Google Scholar] [CrossRef]
  48. Kingma, D.P.; Ba, J. Adam: A Method for Stochastic Optimization. arXiv 2017, arXiv:1412.6980. [Google Scholar] [CrossRef]
  49. Lin, T.-Y.; Goyal, P.; Girshick, R.; He, K.; Dollár, P. Focal Loss for Dense Object Detection. arXiv 2018, arXiv:1708.02002. [Google Scholar] [CrossRef]
  50. Chaurasia, A.; Culurciello, E. LinkNet: Exploiting Encoder Representations for Efficient Semantic Segmentation. arXiv 2017, arXiv:1707.03718. Available online: https://arxiv.org/abs/1707.03718 (accessed on 25 October 2023).
  51. Shcherban’, E.M.; Razveeva, I.F.; Kozhakin, A.N.; Artamonov, S.A. Program for Calculating Crack Lengths in Building Materials and Structures (SCALE: Segmented Crack Analysis & Length Estimation). Russian Federation Computer Program 2023680498, 2 October 2023. Available online: https://www.fips.ru/iiss/document.xhtml?faces-redirect=true&id=0b5c601a617868cbdcea8b4e88cebf47 (accessed on 13 October 2023).
  52. Liu, T.; Zhang, L.; Zhou, G.; Cai, W.; Cai, C.; Li, L. BC-DUnet-based segmentation of fine cracks in bridges under a complex background. PLoS ONE 2022, 17, e0265258. [Google Scholar] [CrossRef]
  53. Ko, P.; Prieto, S.A.; García de Soto, B. Developing a Free and Open-source Automated Building Exterior Crack Inspection Software for Construction and Facility Managers. arXiv 2022, arXiv:2206.09742. [Google Scholar] [CrossRef]
  54. Wang, W.; Su, C. Convolutional Neural Network-Based Pavement Crack Segmentation Using Pyramid Attention Network. IEEE Access 2020, 8, 206548–206558. [Google Scholar] [CrossRef]
  55. Anysz, H. Machine Learning and data mining tools applied for databases of low number of records. Adv. Eng. Res. 2021, 21, 346–363. [Google Scholar] [CrossRef]
Figure 1. Crack in aerated concrete sample.
Buildings 13 03014 g001
Figure 2. Annotated image of the aerated concrete product.
Buildings 13 03014 g002
Figure 3. Percentage of “crack” class content in images for models 1.1 and 1.3.
Buildings 13 03014 g003
Figure 4. Percentage of “crack” class content in images for models 1.2 and 1.4.
Buildings 13 03014 g004
Figure 5. U-Net architecture.
Buildings 13 03014 g005
Figure 6. Model training: (a) model 1.1; (b) model 1.2.
Buildings 13 03014 g006
Figure 7. Changes in metrics in the training and validation sets: (a) for model 1.1; (b) for model 1.2.
Buildings 13 03014 g007
Figure 8. LinkNet architecture.
Buildings 13 03014 g008
Figure 9. Model training: (a) model 1.3; (b) model 1.4.
Buildings 13 03014 g009aBuildings 13 03014 g009b
Figure 10. Changes in metrics in the training and validation sets: (a) for model 1.3; (b) for model 1.4.
Buildings 13 03014 g010aBuildings 13 03014 g010b
Figure 11. Detector results: (a,b) original image; (c,d) original mask; (e,f) the result of model 1.1; (g,h) the result of model 1.2; (i,j) the result of model 1.3; (k,l) result of model 1.4.
Buildings 13 03014 g011aBuildings 13 03014 g011b
Figure 12. Identification of cracks using the DBSCAN clustering algorithm.
Buildings 13 03014 g012
Figure 13. Determination of crack points (blue line—vertical stepwise slicing).
Buildings 13 03014 g013
Figure 14. Detection of crack branches.
Buildings 13 03014 g014
Figure 15. Error graph for calculating crack length using the SCALE method.
Buildings 13 03014 g015
Table 1. Characteristics of aerated concrete.
Characteristics TitleActual Value
Density, kg/m3614
Compressive strength, MPa6.4
Thermal conductivity coefficient, W/(m × K)0.172
Specific heat capacity, kJ/(kg × K)0.841
Modulus of elasticity, MPa2.43 × 103
Table 2. Parameters for training models based on U-Net CNN.
NumParameterValue
Model 1.1Model 1.2
1Number of images in training set30350
2Number of images in the validation set15100
3Number of images in the test set1550
4AugmentationDynamicStatic
5BatchSize1010
6Number of epochs100100
7Number of iterations3003500
8Learning rate1 × 10−41 × 10−4
9SolverAdamAdam
10Loss functionFocal lossFocal loss
Table 3. Parameters for training models based on LinkNet CNN.
NumParameterValue
Model 1.3Model 1.4
1Number of images in training set30350
2Number of images in the validation set15100
3Number of images in the test set1550
4AugmentationDynamicStatic
5BatchSize1010
6Number of epochs100100
7Number of iterations3003500
8Learning rate1 × 10−41 × 10−4
9SolverAdamAdam
10Loss functionBinary cross-entropyBinary cross-entropy
Table 4. Quality metrics of developed models.
ModelPrecisionRecallF1IoU
Average value for the test set for Model 1.1 (U-Net + dynamic augmentation)0.860.560.650.77
Average value for the test set for Model 1.2 (U-Net + static augmentation)0.600.610.640.83
Average value for the test set for Model 1.3 (LinkNet + dynamic augmentation)0.600.860.660.63
Average value for the test set for Model 1.4 (LinkNet + static augmentation)0.730.800.730.84
Disclaimer/Publisher’s Note: The statements, opinions and data contained in all publications are solely those of the individual author(s) and contributor(s) and not of MDPI and/or the editor(s). MDPI and/or the editor(s) disclaim responsibility for any injury to people or property resulting from any ideas, methods, instructions or products referred to in the content.

