1. Introduction
Accurate safety risk assessment in building construction projects is always an important topic in the construction field. The performance of building construction safety in China is still poorer than those in other developed countries [
1]. Numerous teams and stakeholders are involved in a single construction project. In China’s construction industry, migrant laborers constitute the majority of numerous construction crews, and notably, individuals aged 50 and above account for 24.6% of this workforce, as reported by the National Bureau of Statistics in 2021 [
2]. The aging of construction workers presents a significant challenge. This demographic shift underscores the need for immediate, targeted interventions in safety protocols and a strategic re-evaluation of current practices to ensure the well-being of this older segment of the labor force. In 2019, there were 773 construction safety accidents and 904 deaths [
3]. Consequently, construction safety management demands accelerated focus and reinforced strategies to adapt to the current situation. Accurate safety risk assessment can reduce worker casualties and avoid substantial economic losses.
Currently, most of the research focuses on risk analysis and accident reasoning. However, it rarely proposes a practical and targeted solution for the management authorities to implement improved safety management strategies.
Table 1 shows the comparative study of the popular management method on the safety and risk prediction and management models. Bayesian Network (BN) and Analytic Hierarchy Process (AHP) are proposed in this paper for use as an integrated solution for risk analysis in the construction industry. BN is defined as a probabilistic graphic model representing a series of variables consisting of nodes and edges via a directed acyclic graph (DAG) [
4]. And AHP is a multi-criteria design-making strategy that is used for complex problems with a hierarchical analysis [
5]. With the integrated BN-AHP method, the construction safety situation can be easily and accurately evaluated with real-time decision making.
This paper focuses on the following objectives: a. identification of the direct risk indicators and indirect risk indicators of construction accidents, b. predication of the economic loss index for construction risk assessment based on the analysis of the proportion and severity of each of the risk indicators through the BN-AHP method, and c. usability verification of the economic loss model. To deliver the above objectives, the current risk assessment methods are reviewed first. Both BN and AHP have been widely used in risk assessment and safety management in various industries. However, few researchers are applying the BN-AHP integrated solution for safety control in the construction industry due to the complexity of the construction site. The following section introduces the BN-AHP integrated solution, including the data collection, BN-AHP analysis, and model verification. The perspectives of man, machine, material, method, and environment (4M1E) are selected as the five criteria in the AHP model for evaluating the accident severity in construction safety management. Additionally, the staged results are presented and discussed. In addition, the benefits and limitations of the model were analyzed. Under the premise of collecting more project data, this safety assessment model can be further optimized in the next step of the research. In this research, the author collected the accident events on the construction site and extracted the risk factors from the database. This model is conducive to the management department’s ability to realize the timely adjustment of the safety management strategy. As a result, further optimization of investment and budget for construction site safety management can be achieved. At the same time, the model can be set as a safety module and placed in the online construction project management platform (i.e., digital works supervision system) to form a real-time safety assessment of the whole construction project progress.
Nowadays, safety management on the construction site lacks systematic management from the top to the bottom. It mainly depends on the personal experience of project managers and safety management personnel. However, the quality of safety management personnel is uneven, the exact method of safety measures also cannot be derived in real time, and there could be different judgments made by safety staff, which makes the process highly inefficient. There are few specific safety management strategies provided to the safety manager based on convincing data analysis. The innovation of this study lies in its quantitative analysis of the factors contributing to prevalent safety incidents in the construction sector. Utilizing this quantification, the paper develops a risk assessment model that empowers safety managers to ascertain the economic repercussions associated with diverse risk mitigation strategies. This model serves as a cornerstone for top-down decision-making processes, enabling authoritative teams to craft precise and evidence-based policies. Additionally, the economic loss model presented herein is designed to offer dynamic recommendations, adapting to the evolving conditions on construction sites. The flexibility and responsiveness of this model ensure that it remains pertinent in the face of fluctuating onsite realities, thus providing a robust tool for strategic safety and financial planning in the construction industry.
2. Literature Review
2.1. Risk Assessment Method
The current risk assessment models in construction safety management primarily involve qualitative and quantitative analysis [
11]. Over the past four decades, numerous accident analysis models have been proposed in China, such as Monte Carlo Simulation, Decision Trees, Fault Trees, FMECA, Complex Networks, etc. [
12]. Moreover, quantitative risk analysis (QRA) is applied in many industries as a method to improve safety performance [
13]. One of the most famous analysis methods that is widely used in risk evaluation perspectives in the construction industry is 4M1E framework, which consists of man, material, machine, method, and environment [
14,
15,
16,
17]. However, an effective risk analysis should be conducted based on both the probability of potential accidents and the severity [
18]. Specifically, regarding safety management in the construction industry, risk assessment primarily includes evaluating the likelihood (probability) and potential consequences (severity) of hazards. This dual assessment helps the management team with a comprehensive understanding of potential risks to prioritize and implement the appropriate mitigation measures [
19]. In this research, the BN is utilized to complete the quantitative analysis of the level of risk. And the AHP based on the 4M1E framework is taken as a significant method to rank the risk factors to guide further decision making in the safety management process.
2.2. Quantitative Risk Assessment
The benefits of implementing the quantitative risk assessment (QRA) methods are emphasized in various domains [
20]. Additionally, verification of the validity of the quantitative assessment on the safety-related problems is also widely discussed [
13,
21]. The quantitative approaches have also been involved in many risk management standards and guidelines, which brings the benefits of better performance of risk management [
22].
In the construction industry, quantitative assessment methods are also the mainstream, utilized not only to evaluate the safety performance, but also to predict high-risk construction activities based on the accident data [
23,
24]. Furthermore, the severity of the high-risk construction activities can be analyzed by ensuring risk factors are confirmed with QRA [
25].
It has been around 30 years since QRA was first applied to broad technological systems. Initially, the evaluation of safety levels using QRA typically employed a bottom-up method. Currently, modern QRA risk assessments have shifted to a top-down approach. It aims to answer three questions including the cause of the risk, how likely it is, and what its consequences are. Beyond that, some authors also advocated for assessing risk impact from a financial perspective as well. It has been proposed that the ‘risk cost’ can be used as a common scale P-I (Probability-Impact) risk model [
26,
27]. Another quantitative risk assessment equation is proposed, which shows that the risk is closely related to hazard and exposure. This underscores that strategies to address construction safety issues aim to maximize improvements on these two points.
2.3. Analytical Hierarchy Process
The severity relationship among risks can be analyzed based on the AHP model. It was first introduced in 1968 and later developed by Saaty [
28]. The AHP model is commonly used in decision theory and considers conflicting, measurable, and abstract criteria [
29,
30]. The pairwise comparisons are applied in the AHP method. The selected criteria are under analysis of their weights and priorities to calculate the severity relationship between different risks [
5]. Criteria related to key issues are categorized and then formed into a hierarchy. Risk evaluation for occupational health and safety has been conducted based on the Pythagorean fuzzy AHP and fuzzy inference system [
31]. In addition, the risk ranking based on the AHP method is also conducted by Goerlandt, Khakzad, and Reniers [
13].
In the construction industry, it is proved that AHP can help sort out the most serious factors when considering the construction safety risk [
32]. The risk evaluation model of falling from height is analyzed by Shi et al. [
33]. The weight set of the 4 categories and 23 sub-categories are established based on the AHP method. Evaluating the risk is the initial step of the safety management optimization. It is significant to analyze the severity relationship of the risks to enable authorities to make informed decisions in further safety management, including the work planning and the budget control. Although AHP is proved to be an efficient method, there are only a few studies on the adoption of AHP in critical safety risk assessment techniques in construction projects [
34,
35].
2.4. Bayesian Network (BN)-Based Risk Evaluation
The BNs are represented as directed acyclic graphs. They are composed of nodes and lines to represent the variables and also their directed relationship. This method enables the expression of uncertainties and probabilistic events. Furthermore, this approach allows for an initial sorting of causation [
36]. Luu et al. [
37] did not consider risk as a project attribute; instead, they modeled it as the probability of construction project delay. Furthermore, the Bayesian Belief Network (BBN) models the relationships between the risks causing project delay and quantifies the probability of such a delay. Several methods are used to identify the safety and risk factors except BN, such as Fault tree (FT), bow-tie model, SVM (Support Vector Machine) and ANN (Artificial Neural Networks). Among these, BNs are recognized for their effectiveness in quantitative evaluation and in articulating uncertain knowledge [
29,
38,
39,
40,
41].
BN is used in safety and risk analysis in construction projects by many researchers. Xue et al. [
11] adopt BN to identify the critical factors and sensitive factors of construction safety. It is also used to realize the life cycle risk assessment of the diaphragm wall deflection, including the pre-/ during-/ post-accident control [
36]. In addition, Zhang et al. [
4] developed the BN analysis method to realize the deductive and abductive reasoning to increase the likelihood of a successful project under an unpredicted and complex site environment. In this research, BN is applied to continuously analyze the specific causal factors of the construction accidents, the causal relationship between factors and their conditional probability distributions.
Although the BN-AHP method is widely applied in risk management, such as marine disasters [
42], and the mining industry [
41], it is rarely utilized in the construction industry because of its complexity. However, identifying potential risks is crucial for project managers to foster more resilient and sustainable management in construction projects. In this research, the innovative method is proposed for real-time generation of both the probability of potential risk and distribution of risk factors, leveraging the integration of BN and AHP.
3. Methodology
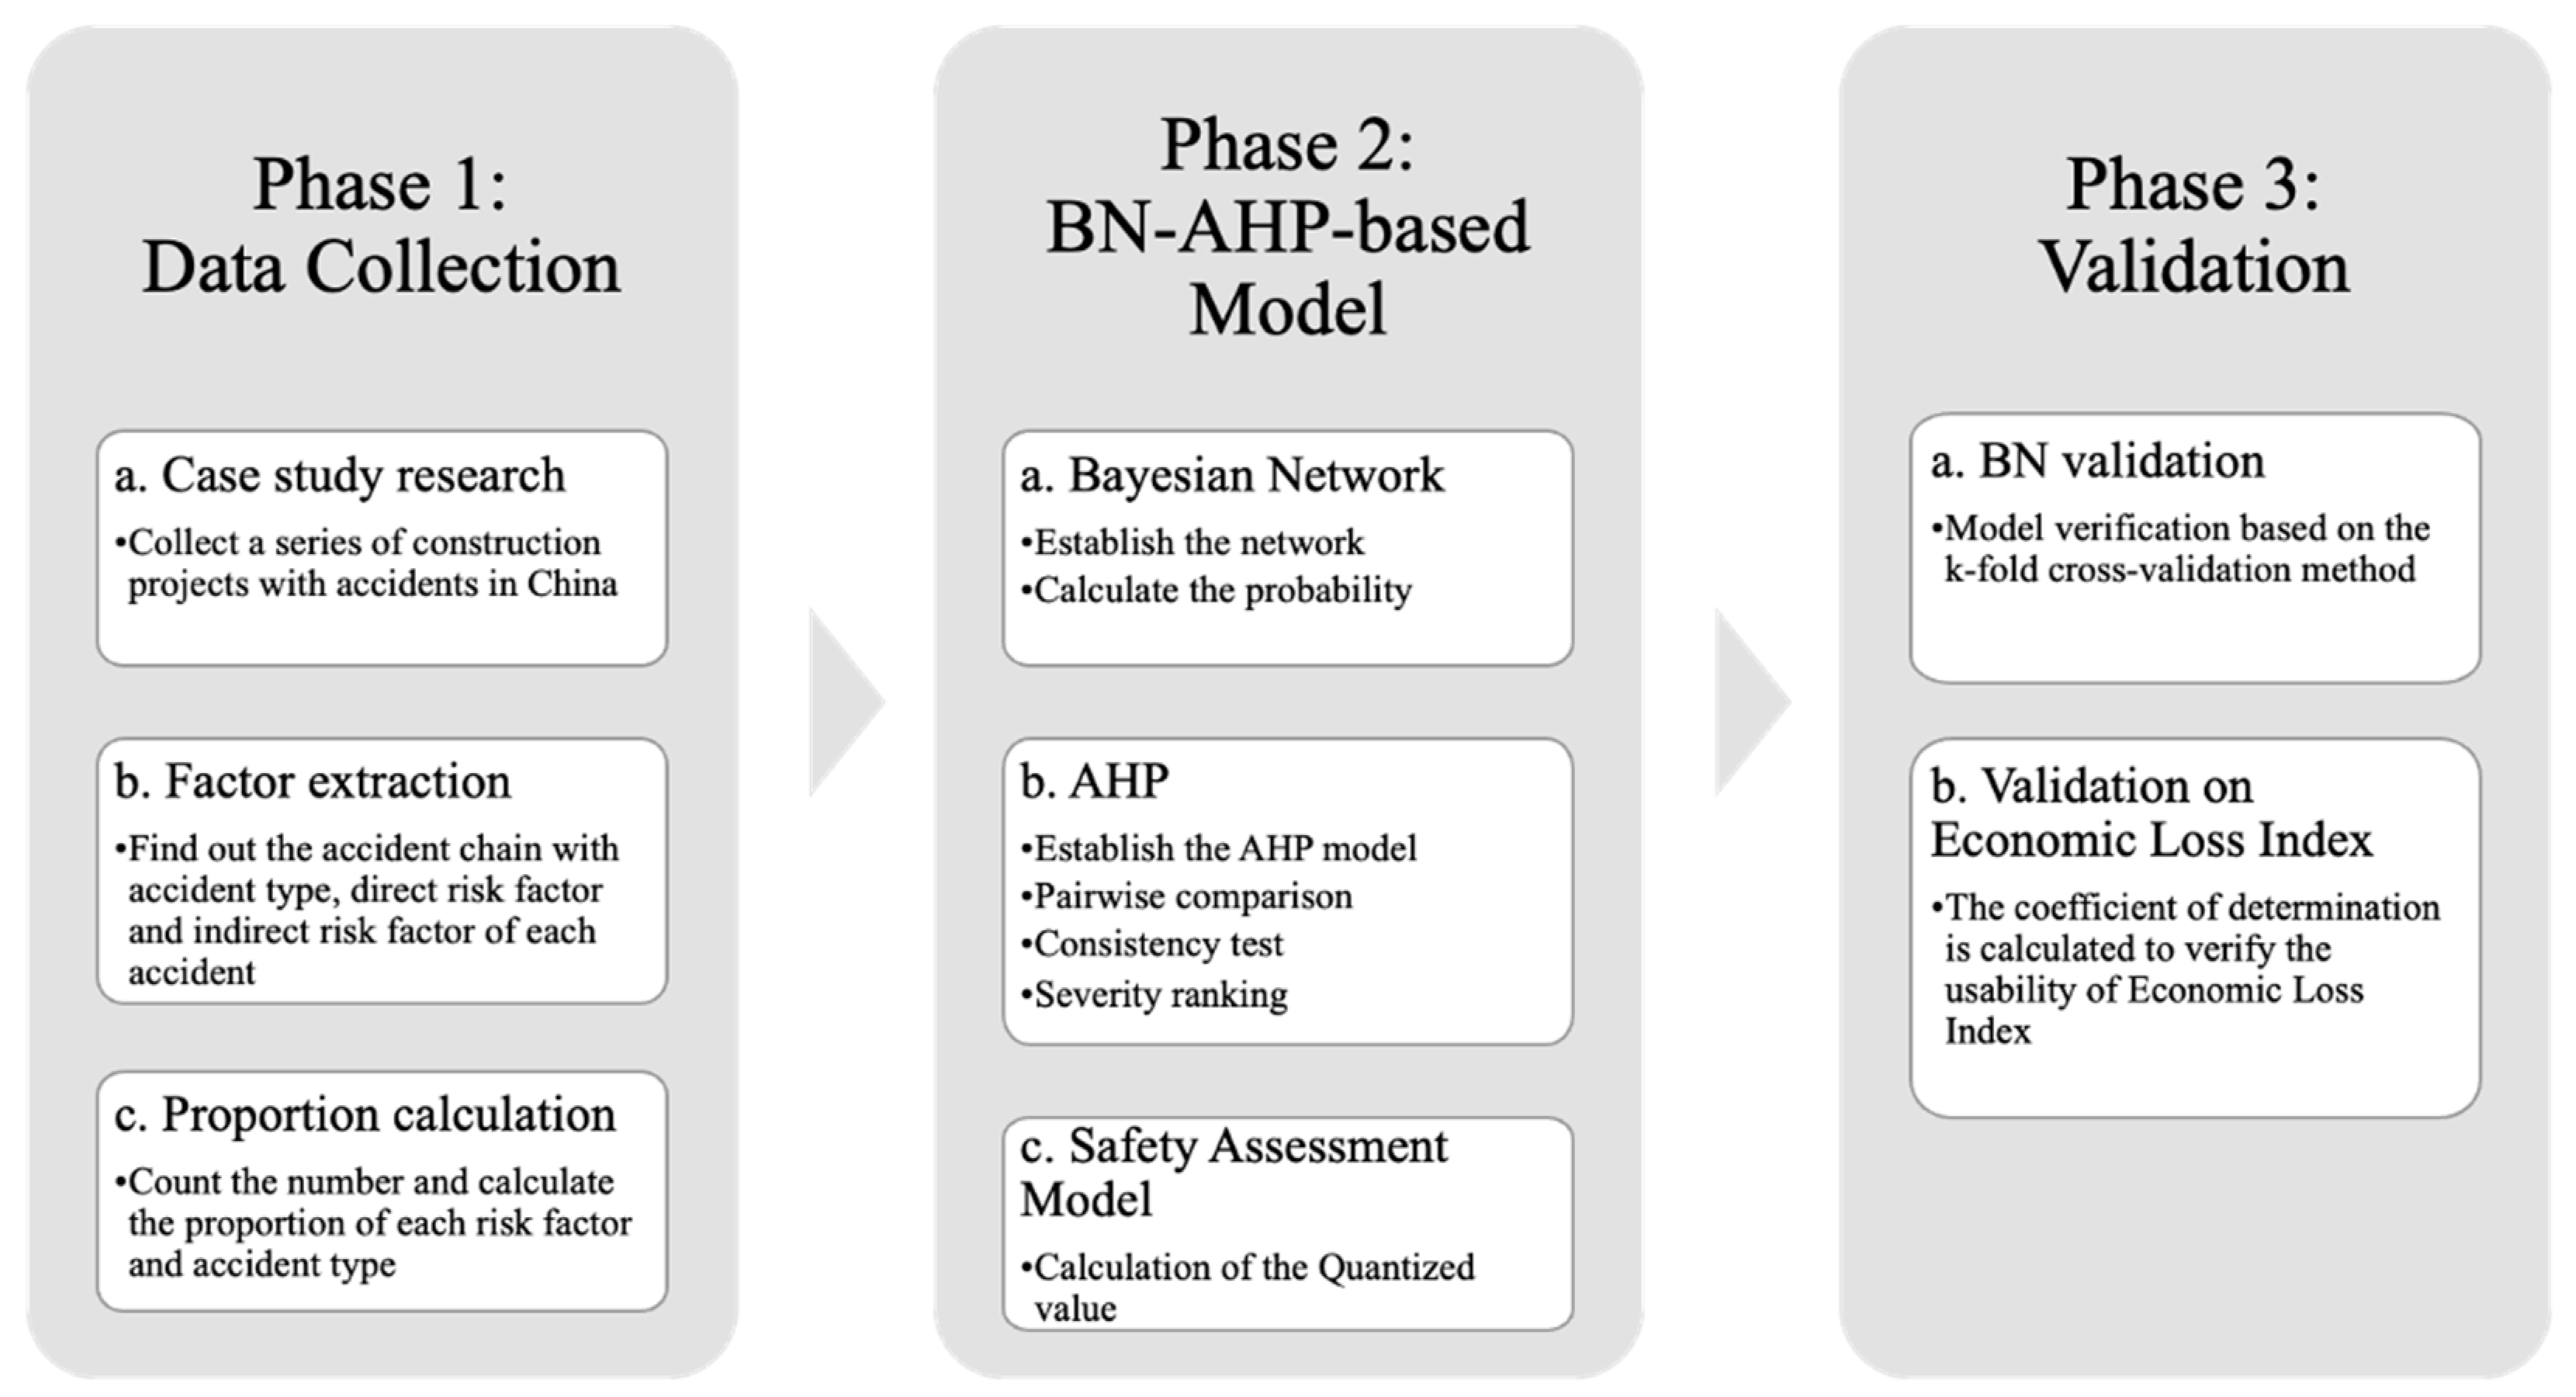
The methodology of this research consists of data collection, BN-AHP-based model establishment, and verification process (see
Figure 1). Firstly, the sample and verification data of this research are collected from the safety reports of the construction industry in mainland China. These reports are published in the official websites and to eliminate bias, only the ordinary accidents caused by construction safety issues are considered. The reports provide comprehensive details of the accident chains, including both direct and indirect factors contributing to the accidents, thus avoiding subjective conjectures and enhancing model precision. This extracted structural information is then synthesized for subsequent incorporation into the BN and AHP framework.
In the second phase, the collected data are put in the BN to calculate the probability. According to the Bayesian formula below (Equation (1)), the collected data encompassing risk factors and project types are imported, and each indirect factor’s probability is calculated.
Equation (1) Bayesian Network formula [
38].
A = risk factor; B = accident type; X1, X2, X3, …, Xn = random variables.
In the following step, the AHP pairwise comparison method is utilized. The evaluated criteria derive from the 4M1E framework, which entails gathering data through questionnaires reflecting practical experience. Consequently, the severity rankings of the accident types are generated. Based on the results from BN and AHP methods, the loss index of each indirect factor is calculated by multiplying the probability causing each accident type and severity of each accident type. Among these, probability of causing each indirect factor to lead to each accident type is calculated based on BN and the severity of each accident type is ranked by the AHP pairwise comparison. It is proved that the indirect factors are usually generated by the management vulnerabilities and could be managed by site safety or project managers to some extent. Quantifying the loss index of the indirect factors is more valuable than quantifying the direct factors, which could support the management level with decision making in practical conditions.
Phase 3 is the validation stage for the BN-AHP model. The k-fold cross-validation method is used to ensure the accuracy of the model. The model is considered effective if the AUC (Area Under Curve) value is larger than 0.75 [
43]. Simple random sampling of 30 datasets is applied to ensure the representativeness of the data to validate the effectiveness of our risk assessment model. The
R2 value is computed between the model’s predicted values and the actual economic loss values to assess the model’s predictive accuracy. An
R2 value that is close to 1 indicates a strong predictive capability of the model, while a lower value suggests that further optimization of the model is required.
4. The Establishment of the BN-AHP Risk Assessment Model
4.1. Data Collection
The data collection of this research aims to identify the accident chain, direct factor, and indirect factor. Additionally, it involves counting the number and proportion of each risk factor and accident type from the collected accident reports in China. These reports are compiled from government websites, databases of construction safety incidents, and interviews with project managers and safety managers. Approximately 1000 construction safety incident reports are anticipated to be collected for initial data, which will be used for modeling training and K-fold cross-validation.
The collected safety accident reports are collected from the official websites of the government [
44]. Each accident is described in one safety report on a particular accident type with its direct and indirect factors. The distributed area of the reports is shown in
Figure 2 and those reports have been used for model-building simulation.
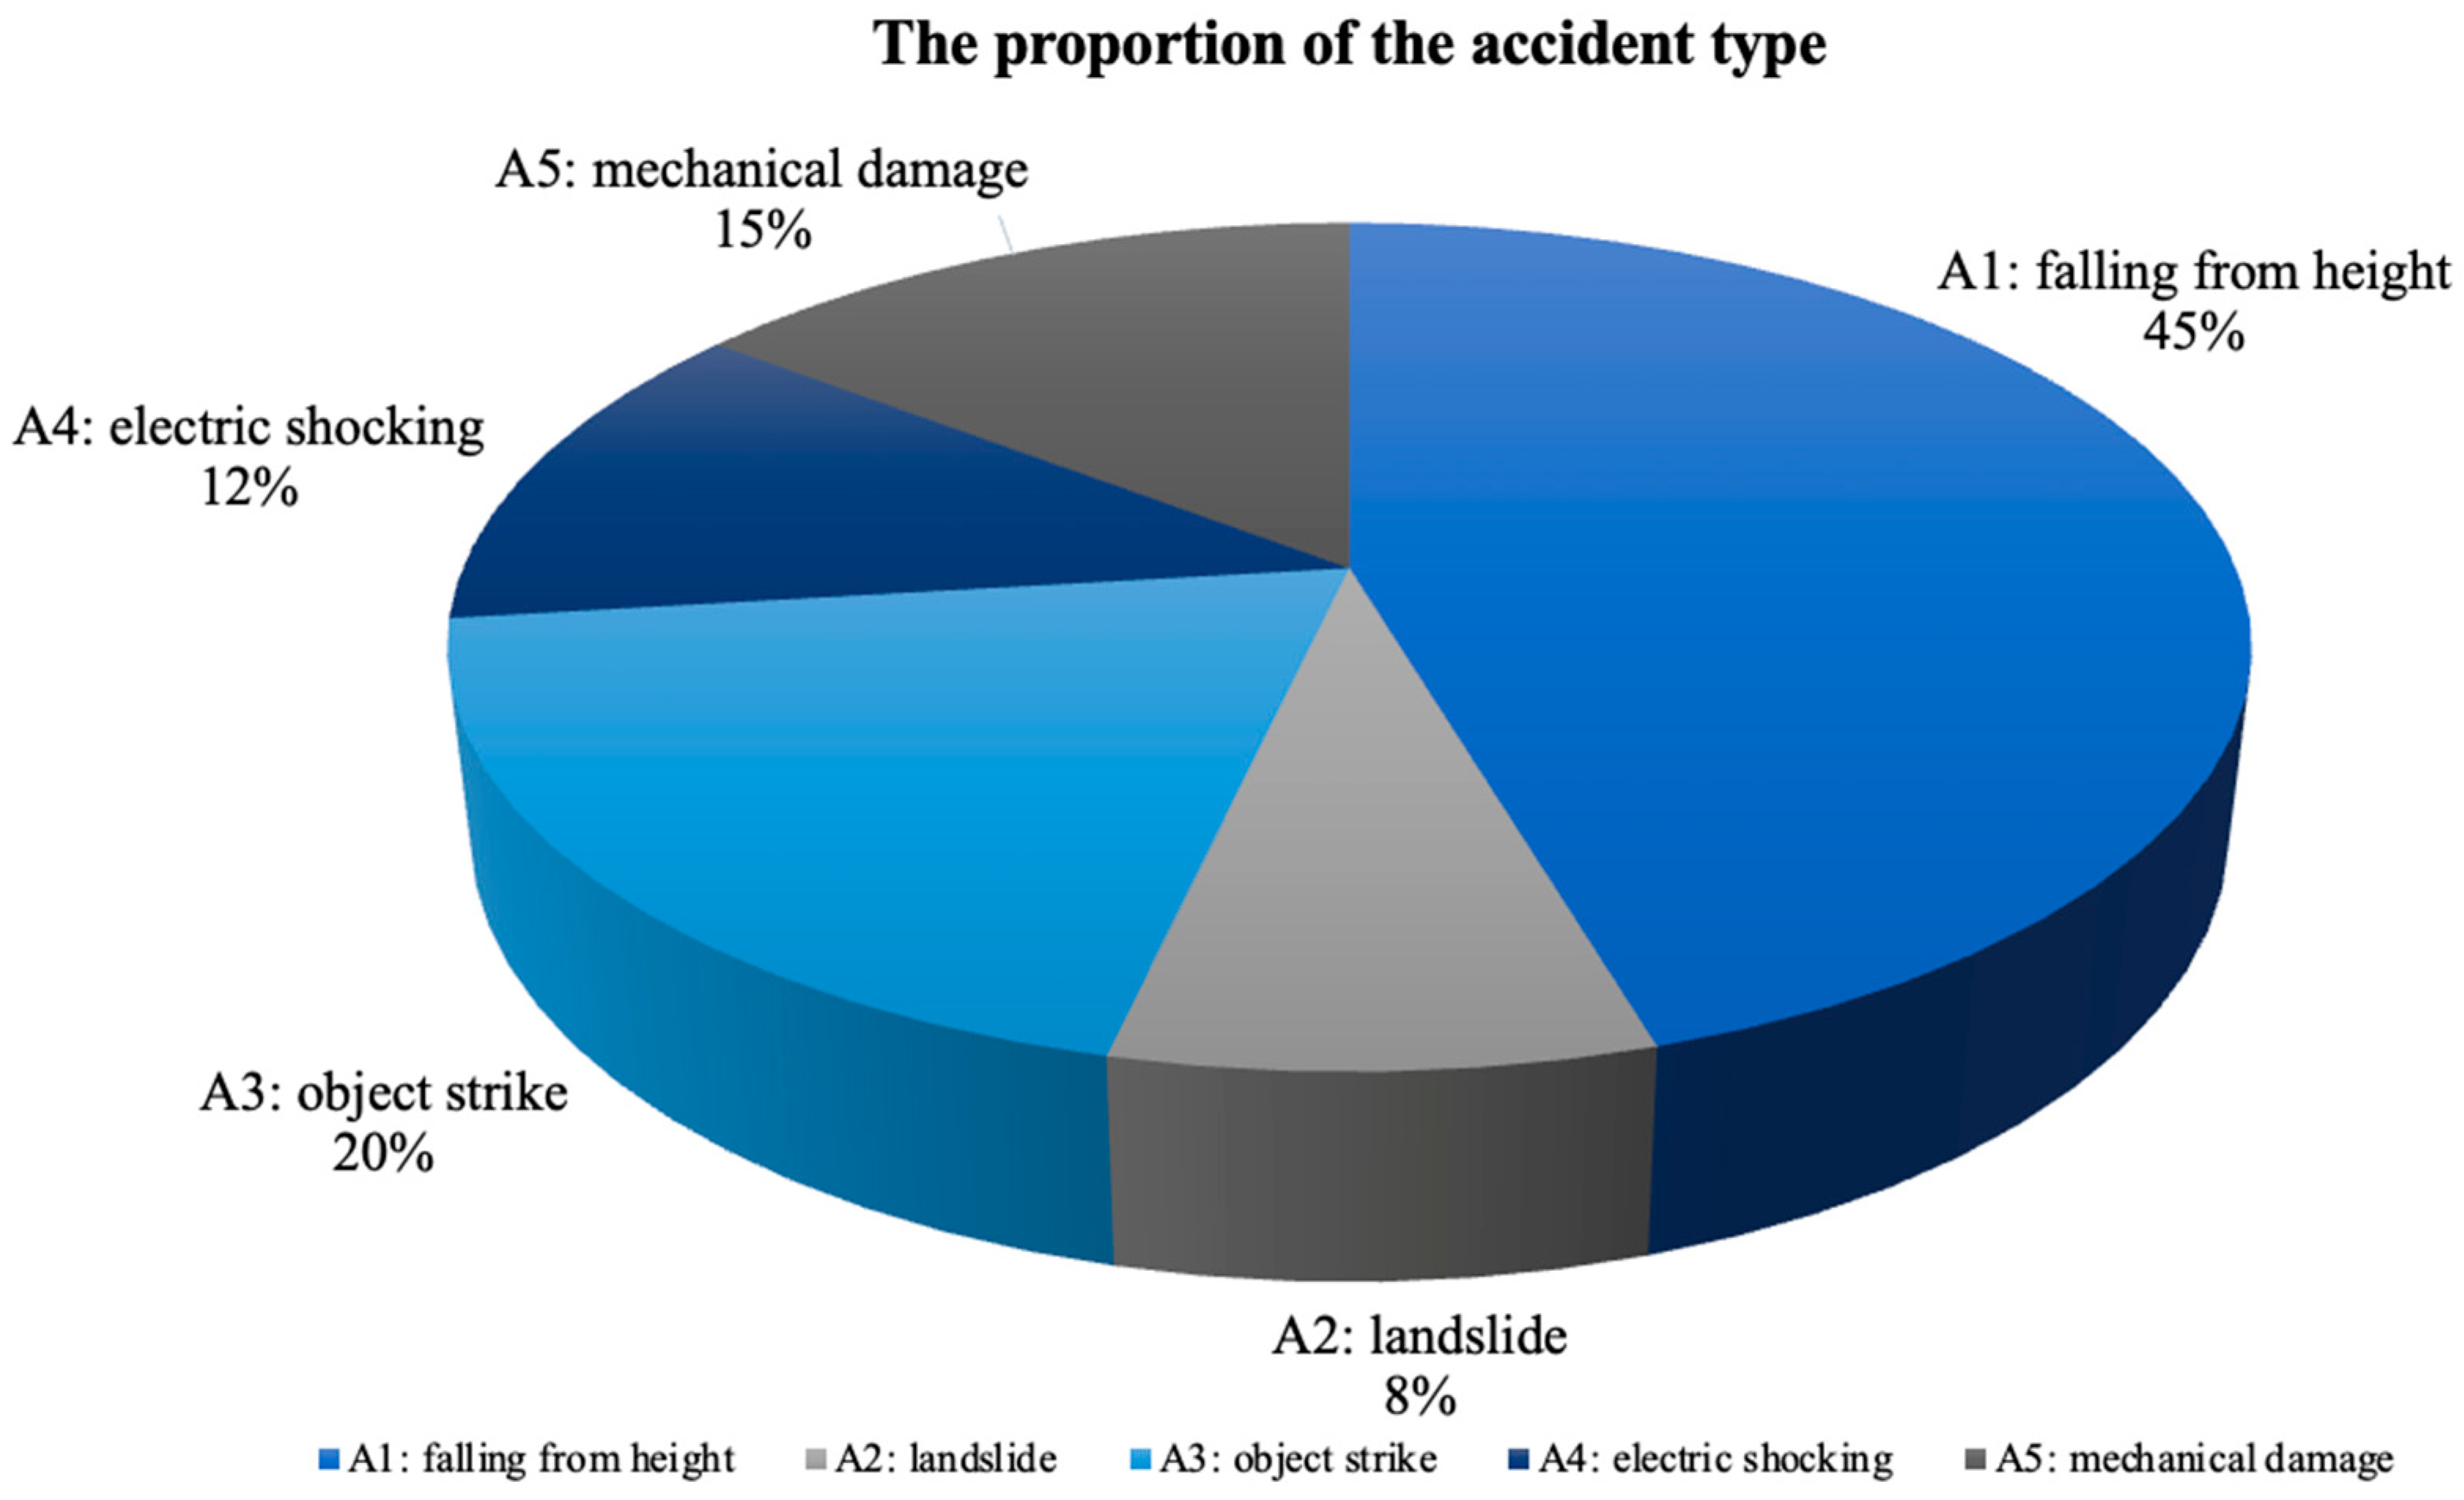
From those, five accident types (A1–A5) are extracted from the 1000 reports. They are falling from a height (A1), landslide (A2), object strike (A3), electric shocking (A4), and mechanical damage (A5). For those accident types, it is summarized that ‘falling from height’ is the most frequent of the situations shown in those reports, which takes up almost half the sample data (the specific number of accident types is shown in
Figure 3). Such incidents commonly transpire when workers engage in tasks at a height, such as on scaffolds, ladders, or rooftops, without the implementation of adequate fall prevention mechanisms. Direct indicators are observable and include the absence of fall protection equipment like guardrails and safety nets, or the failure to utilize personal fall arrest systems. Indirect indicators include an organizational disregard for fall protection, insufficient education regarding the hazards of height work, and a lack of comprehensive hazard analysis. Landslides (A2) within the construction industry are typically precipitated by excavation or natural earth movements which is also a significant construction risk. They may be caused by excavation work, which has the potential risks of the fissures in the earth, ground subsidence, or the compromised integrity of excavation support structures. Incidents of workers being struck by objects (A3) are recurrent in environments where materials are either moved or stored above ground level. This risk is characterized by unsecured tools or materials that possess the potential to fall and the lack of protective structures such as debris nets or catch platforms. Moreover, electric shock injuries (A4) are a critical concern in construction sites and are frequently a consequence of contact with electrical energy sources or the employment of malfunctioning equipment. Mechanical damage (A5) in construction is often a product of mechanical system failures or machinery malfunction, leading to grave outcomes including crush injuries or traumatic amputations.
Based on the analysis of the five types of accidents, the annotation of the direct and indirect factors is shown in
Table 2. It is also extracted from the safety production accident report issued by the government instead of subjective and summarized by authors to ensure research neutrality. In each report, there are usually one to two direct factors and around three indirect factors which caused the reported accident. In this paper, the direct factors are represented by D1–D6 and indirect factors are shown in Ind1–Ind7.
In the realm of construction safety, the causative factors of accidents are multifarious, interlinking direct and indirect elements that form a complex tapestry of risk. Indirect factors such as the cluttered construction site, the employment of personnel lacking requisite construction qualifications, the absence of critical safety training, and a deficit in standard protection supplies manifest a foundational negligence towards a culture of safety. The lack of security disclosures exacerbates this scenario by withholding crucial information regarding existing hazards, while the absence of a completed safety system and effective supervision fails to arrest this descent into unsafe practices. Conversely, direct factors cut more closely to the immediate causes of accidents. The absence of essential protective equipment leaves workers vulnerable to the raw dangers of the construction environment. Moreover, illegal operations without proper licenses, often ignoring safety for speed, set the stage for serious accidents. These direct factors are compounded by the usage of materials suffering from age-related deterioration and the ominous omission of edge protection in work at a height, each a potential harbinger of catastrophic failure. Together, these factors underscore a perilous lapse in safety governance, a breach in the edifice of hazard control that could precipitate a spectrum of accidents, from the minor to the fatal, within the construction sector. Effective mitigation thus hinges on a harmonious blend of stringent enforcement of safety regulations, pervasive safety education, and an unwavering commitment to a proactive safety culture—each an indispensable pillar in safeguarding the well-being of construction personnel.
4.2. Data Analysis with BN and AHP Model
4.2.1. Bayesian Network (BN)
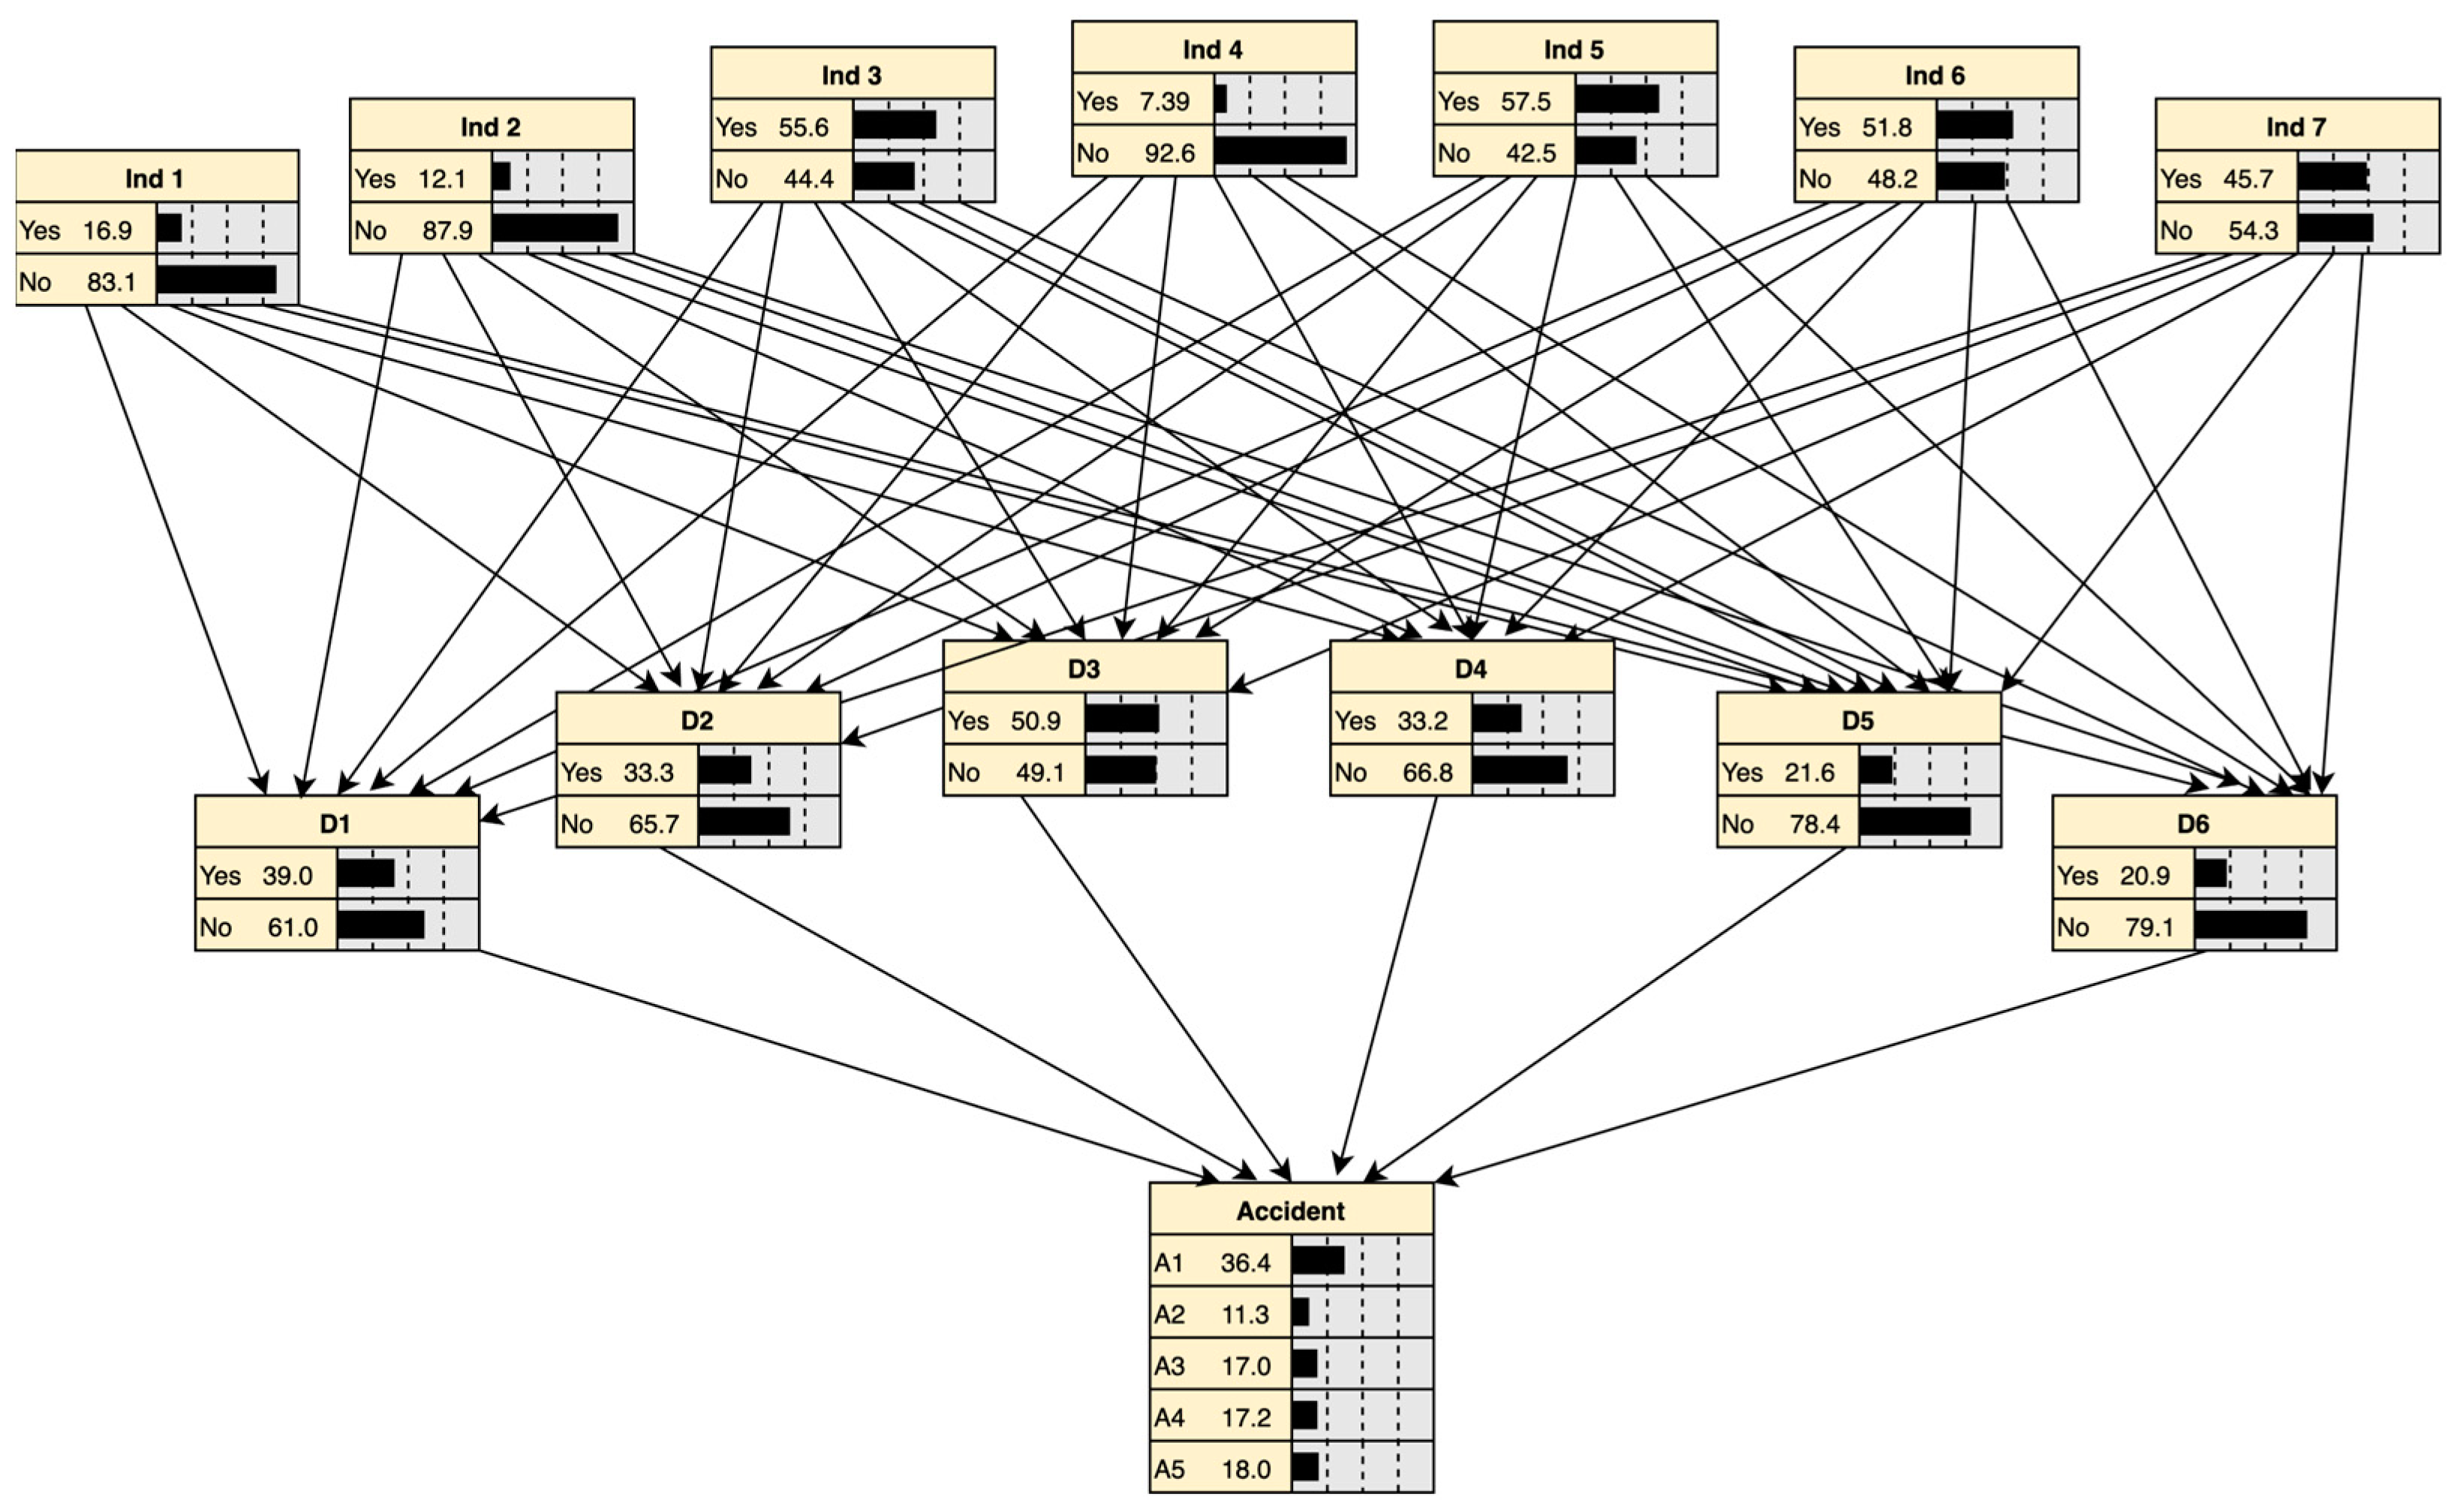
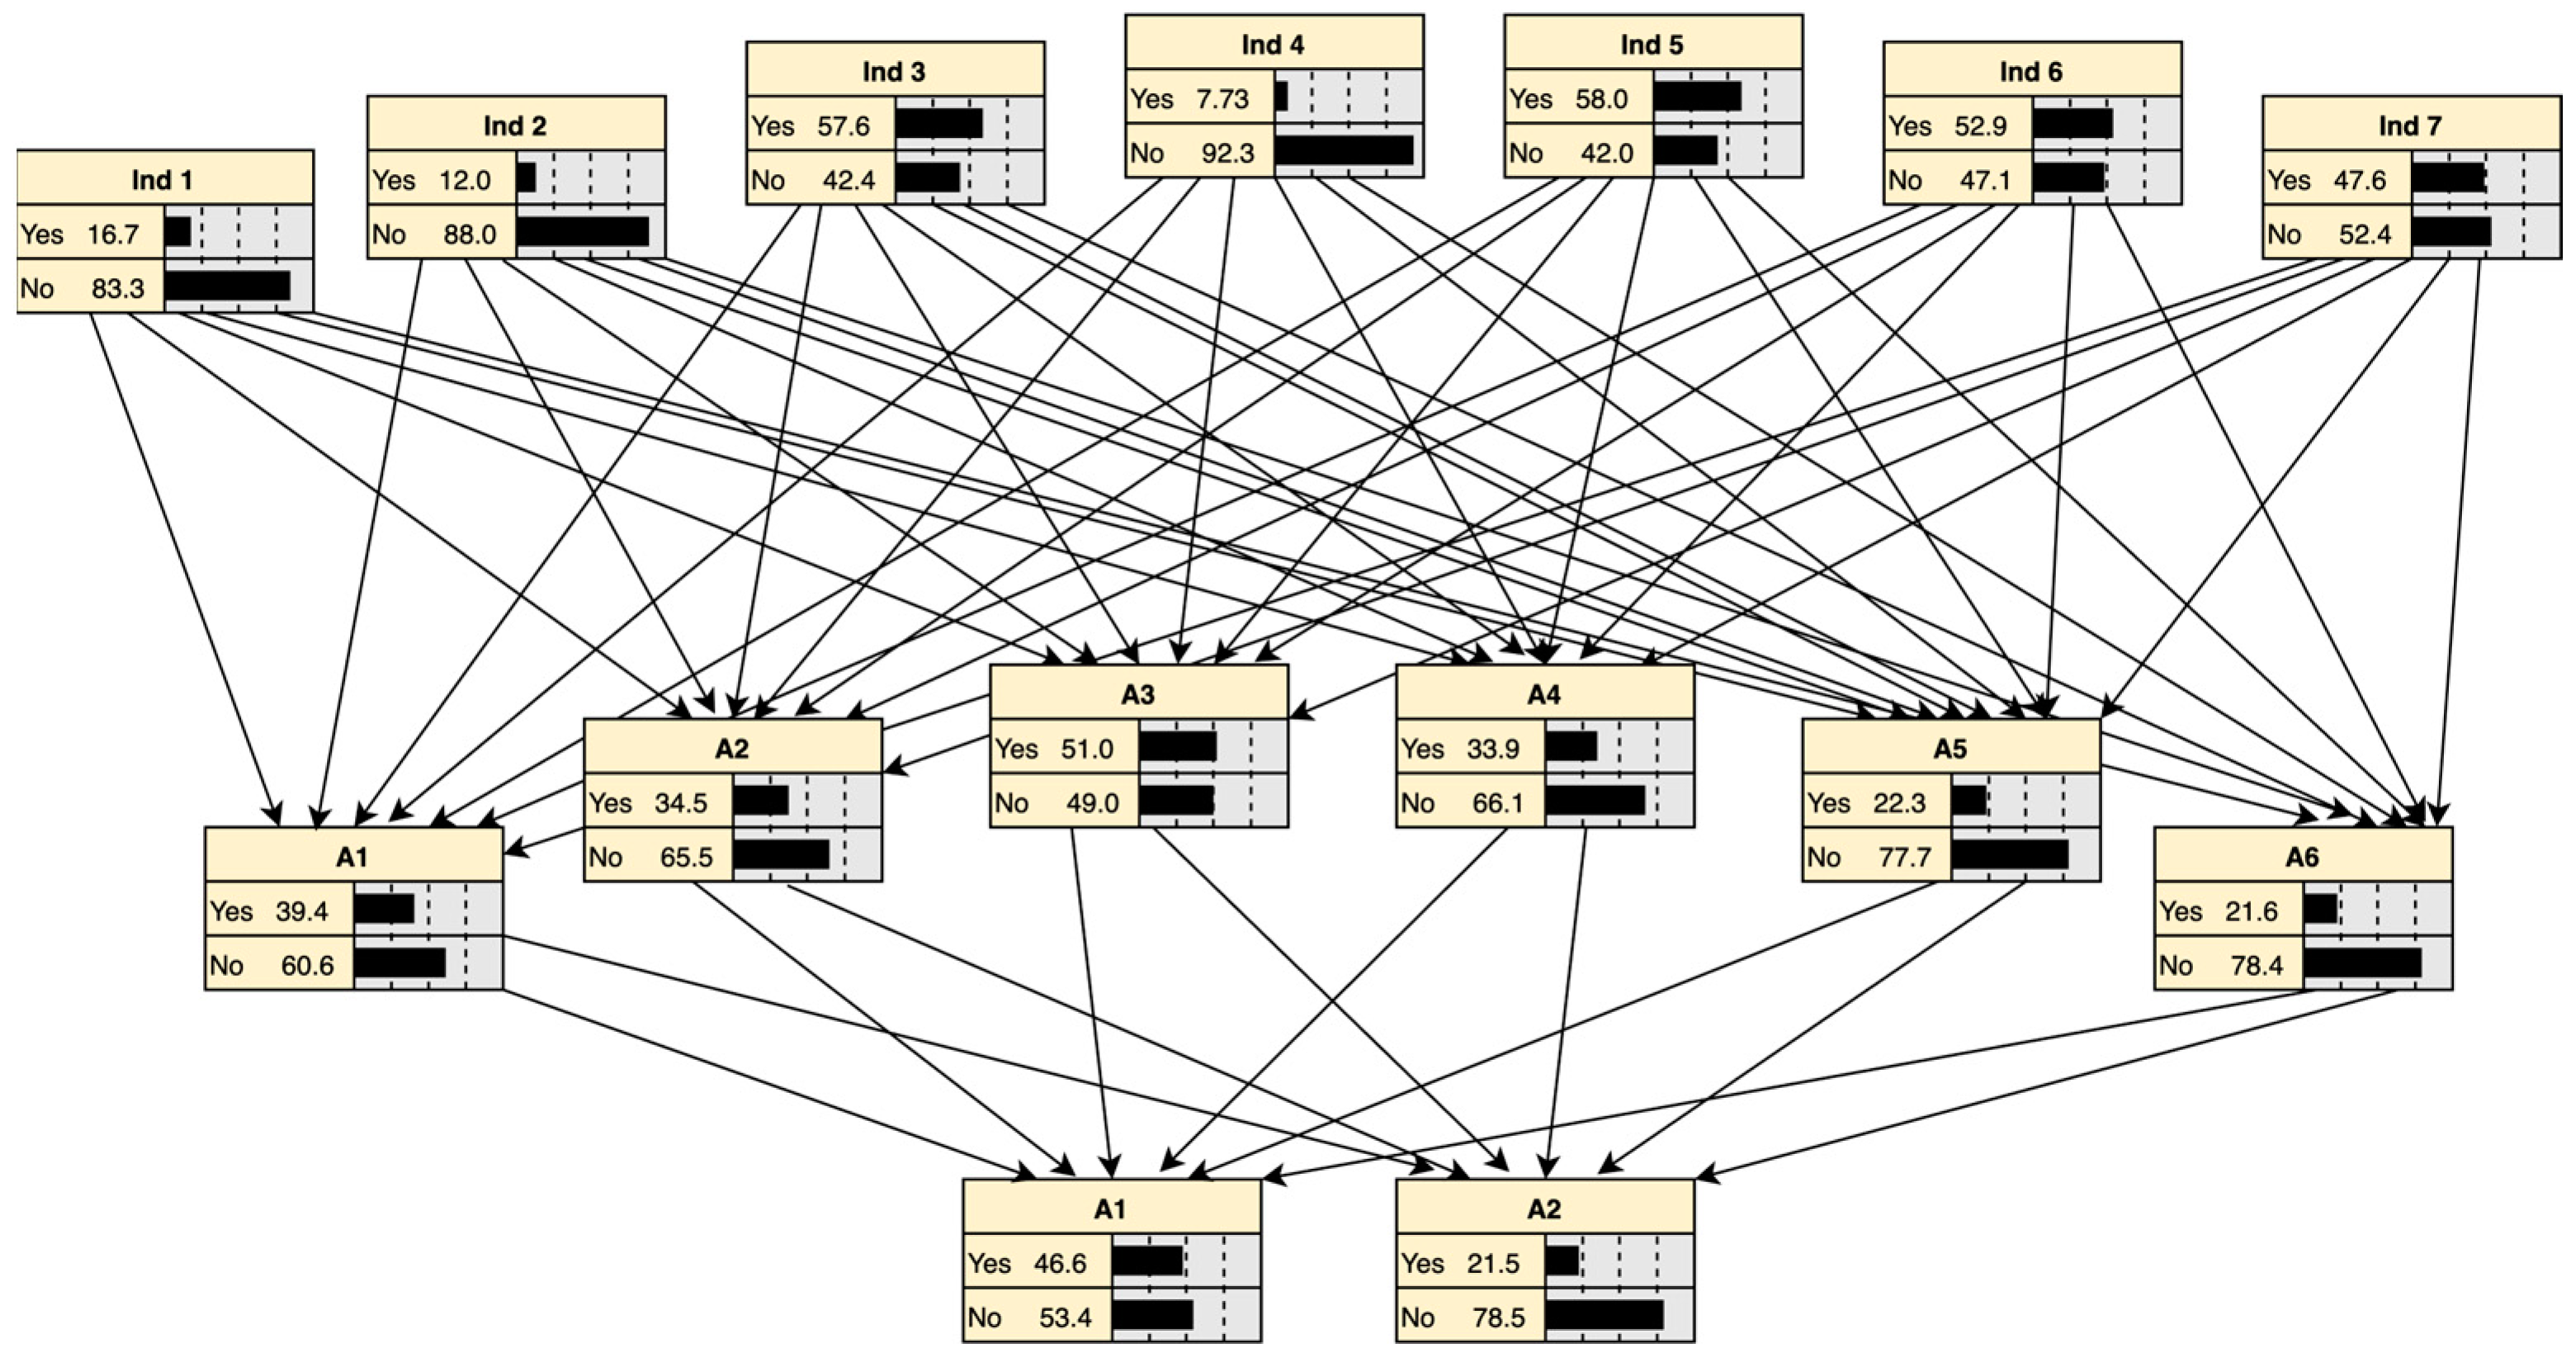
BN is also known as Belief Networks or DAG models. It is suitable for decision making that is conditionally dependent on multiple controlling factors. Meanwhile, it can make inferences from a lot of different knowledge and information. According to the collected safety production accident reports issued by the government websites, the causal chains of the accident are extracted and build a BN network.
The DAG network (see
Figure 4) is established, including the above eight indirect factors, six direct factors, and five accident types collected in Phase 1.
According to the research methodology, the probability of every indirect factor shall be calculated by importing the collected data (risk factors and project types) to BN. As shown in
Table 3, the probability of each single risk factor causing an accident is generated.
4.2.2. Analytical Hierarchy Process (AHP)
Since each project has its characteristics, there could not be the same security incident. Even for the same type of security incident, the loss is not going to be the same. Therefore, it is difficult to perform an objective calculation method to assess the severity. AHP is a subjective evaluation method, which shows the advantage of making full use of expert knowledge in the evaluation of security incidents. In this study, the AHP model consists of four steps.
The inputted data to the pairwise comparison is collected from the questionnaire of the industry practitioners. There are 10 practitioners invited to take the questionnaires. The background information of the interviewees is shown in
Table 4. The design of the questionnaire is based on the evaluation of two of the five criteria (4M1E) towards each accident type (A1 to A5). The invited practitioners will score the severity of the criteria to each accident type using the scoring range of 1 to 9. Among that, 9 shows the severest reason causing the corresponding accident. For example, if the practitioners are required to score the severity level of ‘Man’ and ‘Material’ causing the A1, the example question is ‘What do you think is the severity of falling accidents caused by "Man" and "Material"?’. The full set of questionnaires is omitted in this paper.
Through this method, the hierarchical structure model is established and shown in
Figure 5. The accidents are selected by the causes and the types, and then AHP is constructed based on these elements.
Firstly, the problem should be structured into a hierarchical structure based on the overall objectives, criteria, and the accident type alternatives (see
Figure 5).
The pairwise comparison method is conducted among the five factors of 4M1E in the five accident types (A1 to A5). It should comprise collected safety factors from the accident reports and interviews with safety managers. In the following step, the comparison matrix among the 4M1E criteria is conducted (see
Table 5), and the paired comparison among the safety accident types regarding each criterion is also shown in
Table 6. Scores are evaluated based on whether the severity is the same, and if they are, then it is scored as 1. In the case of not being the same, if the severity is greater, the greater score will be assigned.
- 2.
Construction of the Comparison Matrix
For each set of elements at a given level, a comparison matrix (A) must be created where each element is pairwise compared with others at that level, typically using a scale from 1 to 7 to indicate their relative importance.
Based on the AHP framework, through pairwise comparison among the 4M1E criteria and the accident types, the weights of the five different safety accident types are compared and sorted (see
Figure 6). The collected data are imported into the AHP model so that the weights and severity ranking can be generated.
- 3.
Consistency test
AHP is used to conduct the consistency testing to ensure the logical consistency of the judgment matrix and avoid decision-making errors caused by unreasonable subjective judgments. In the AHP method, λ is regarded as the maximum eigenvalue to compute the Consistency Index (CI). For an evaluation matrix of order n with a maximum eigenvalue λ, the CI can be defined in Equation (2).
Equation (2) Consistency test
where
CI = Consistency Index.
Moreover, for a matrix of a specific order, a reference Random Index (RI) is adopted. The Consistency Ratio (CR) can be determined using this value, as shown in Equation (3). And if CR < 0.1, the result is acceptable.
Equation (3) Consistency Ratio.
where
CR = Consistency Ratio.
RI = Random Index.
- 4.
Severity ranking
Based on the previous results, the ranking of severity can be generated through inputting the collected data to the AHP model (see
Figure 6).
4.2.3. Assessment of Construction Safety Risks
In this research, the construction safety risks are assessed with the benchmark of the quantized loss index. The result of the loss index per each factor is calculated through the probability multiplied by severity (see Equation (4)).
Equation (4) Loss Index of each indirect factor [
4,
19].
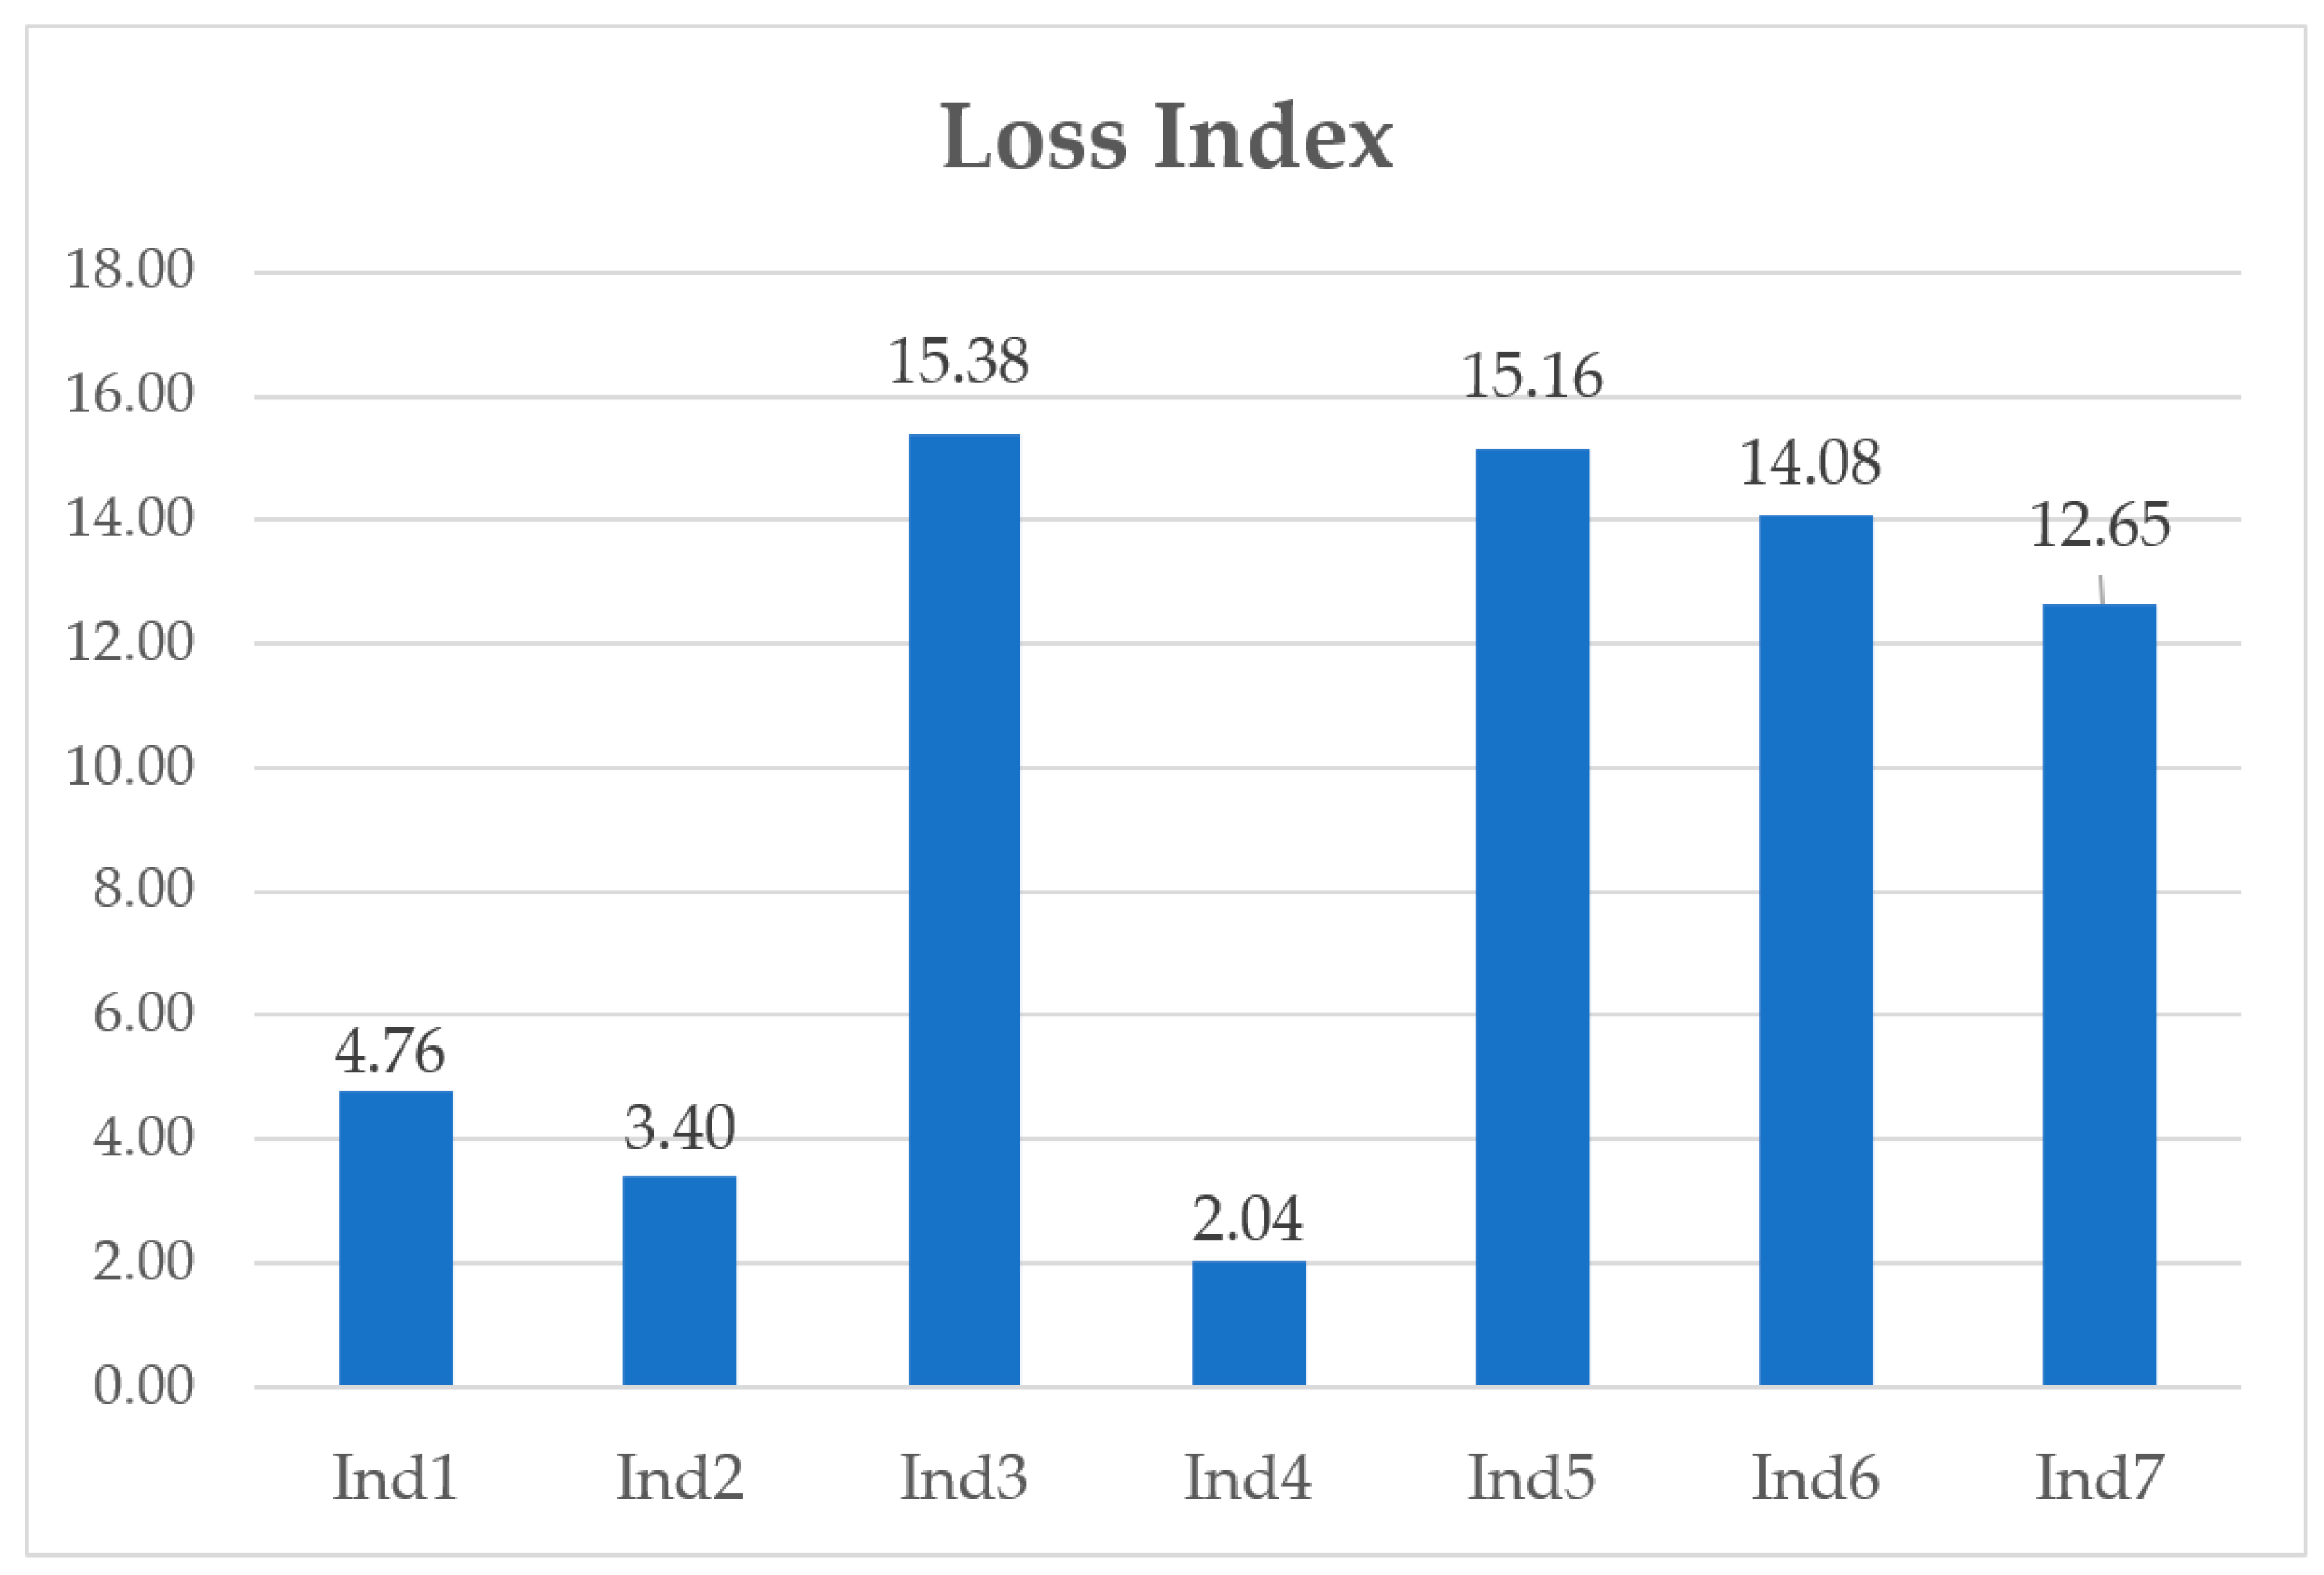
Based on the above result from the BN-AHP method, the loss index of every indirect factor can be calculated based on the proposed equation. As shown in
Figure 7, the result of the calculated model shows the degree of harm that each single risk factor can cause in a safety accident. It indicates that Ind3 (lack of construction safety training) has the highest score of 15.38%, followed by Ind5 (no security disclosure) and Ind6 (no completed safety system), with scores of 15.16% and 14.08%, respectively; in the last place is Ind4 (no standard protection supplies) with a score of 2.04%.
4.3. Verification of the Qualified Risk Assessment Model
4.3.1. Validation of BN Model
The BN model is validated through the K-fold cross-validation method. The 1000 accident reports are used as initial data, and they are divided into five groups (G1–G5). In each time of validation, there are four groups which are randomly selected as the training set, and the remaining one set is used as the test set (
Figure 8). When one round is complete, the other four groups are randomly selected to be the training data. After five rounds, the loss function is chosen to evaluate the optimal model and parameters.
AUC is proposed to represent a metric for the evaluation of the performance of a binary classification model. When the AUC value closes to 1, it indicates the perfect discrimination, and if it nears 0.5, it suggests it is no better than the random classification [
43]. By constructing the validation model and calculating the AUC value, the quality of the model can be evaluated. If the AUC value is greater than 0.75, it means the model can be accepted. Through testing, the average AUC value can be calculated after traversing five groups (see
Table 7). Through the calculation, it shows that the average AUC value of the model is 0.85, which is greater than 0.75. As a result, this model can be considered effective.
4.3.2. Validation on the Usability of the Loss Index
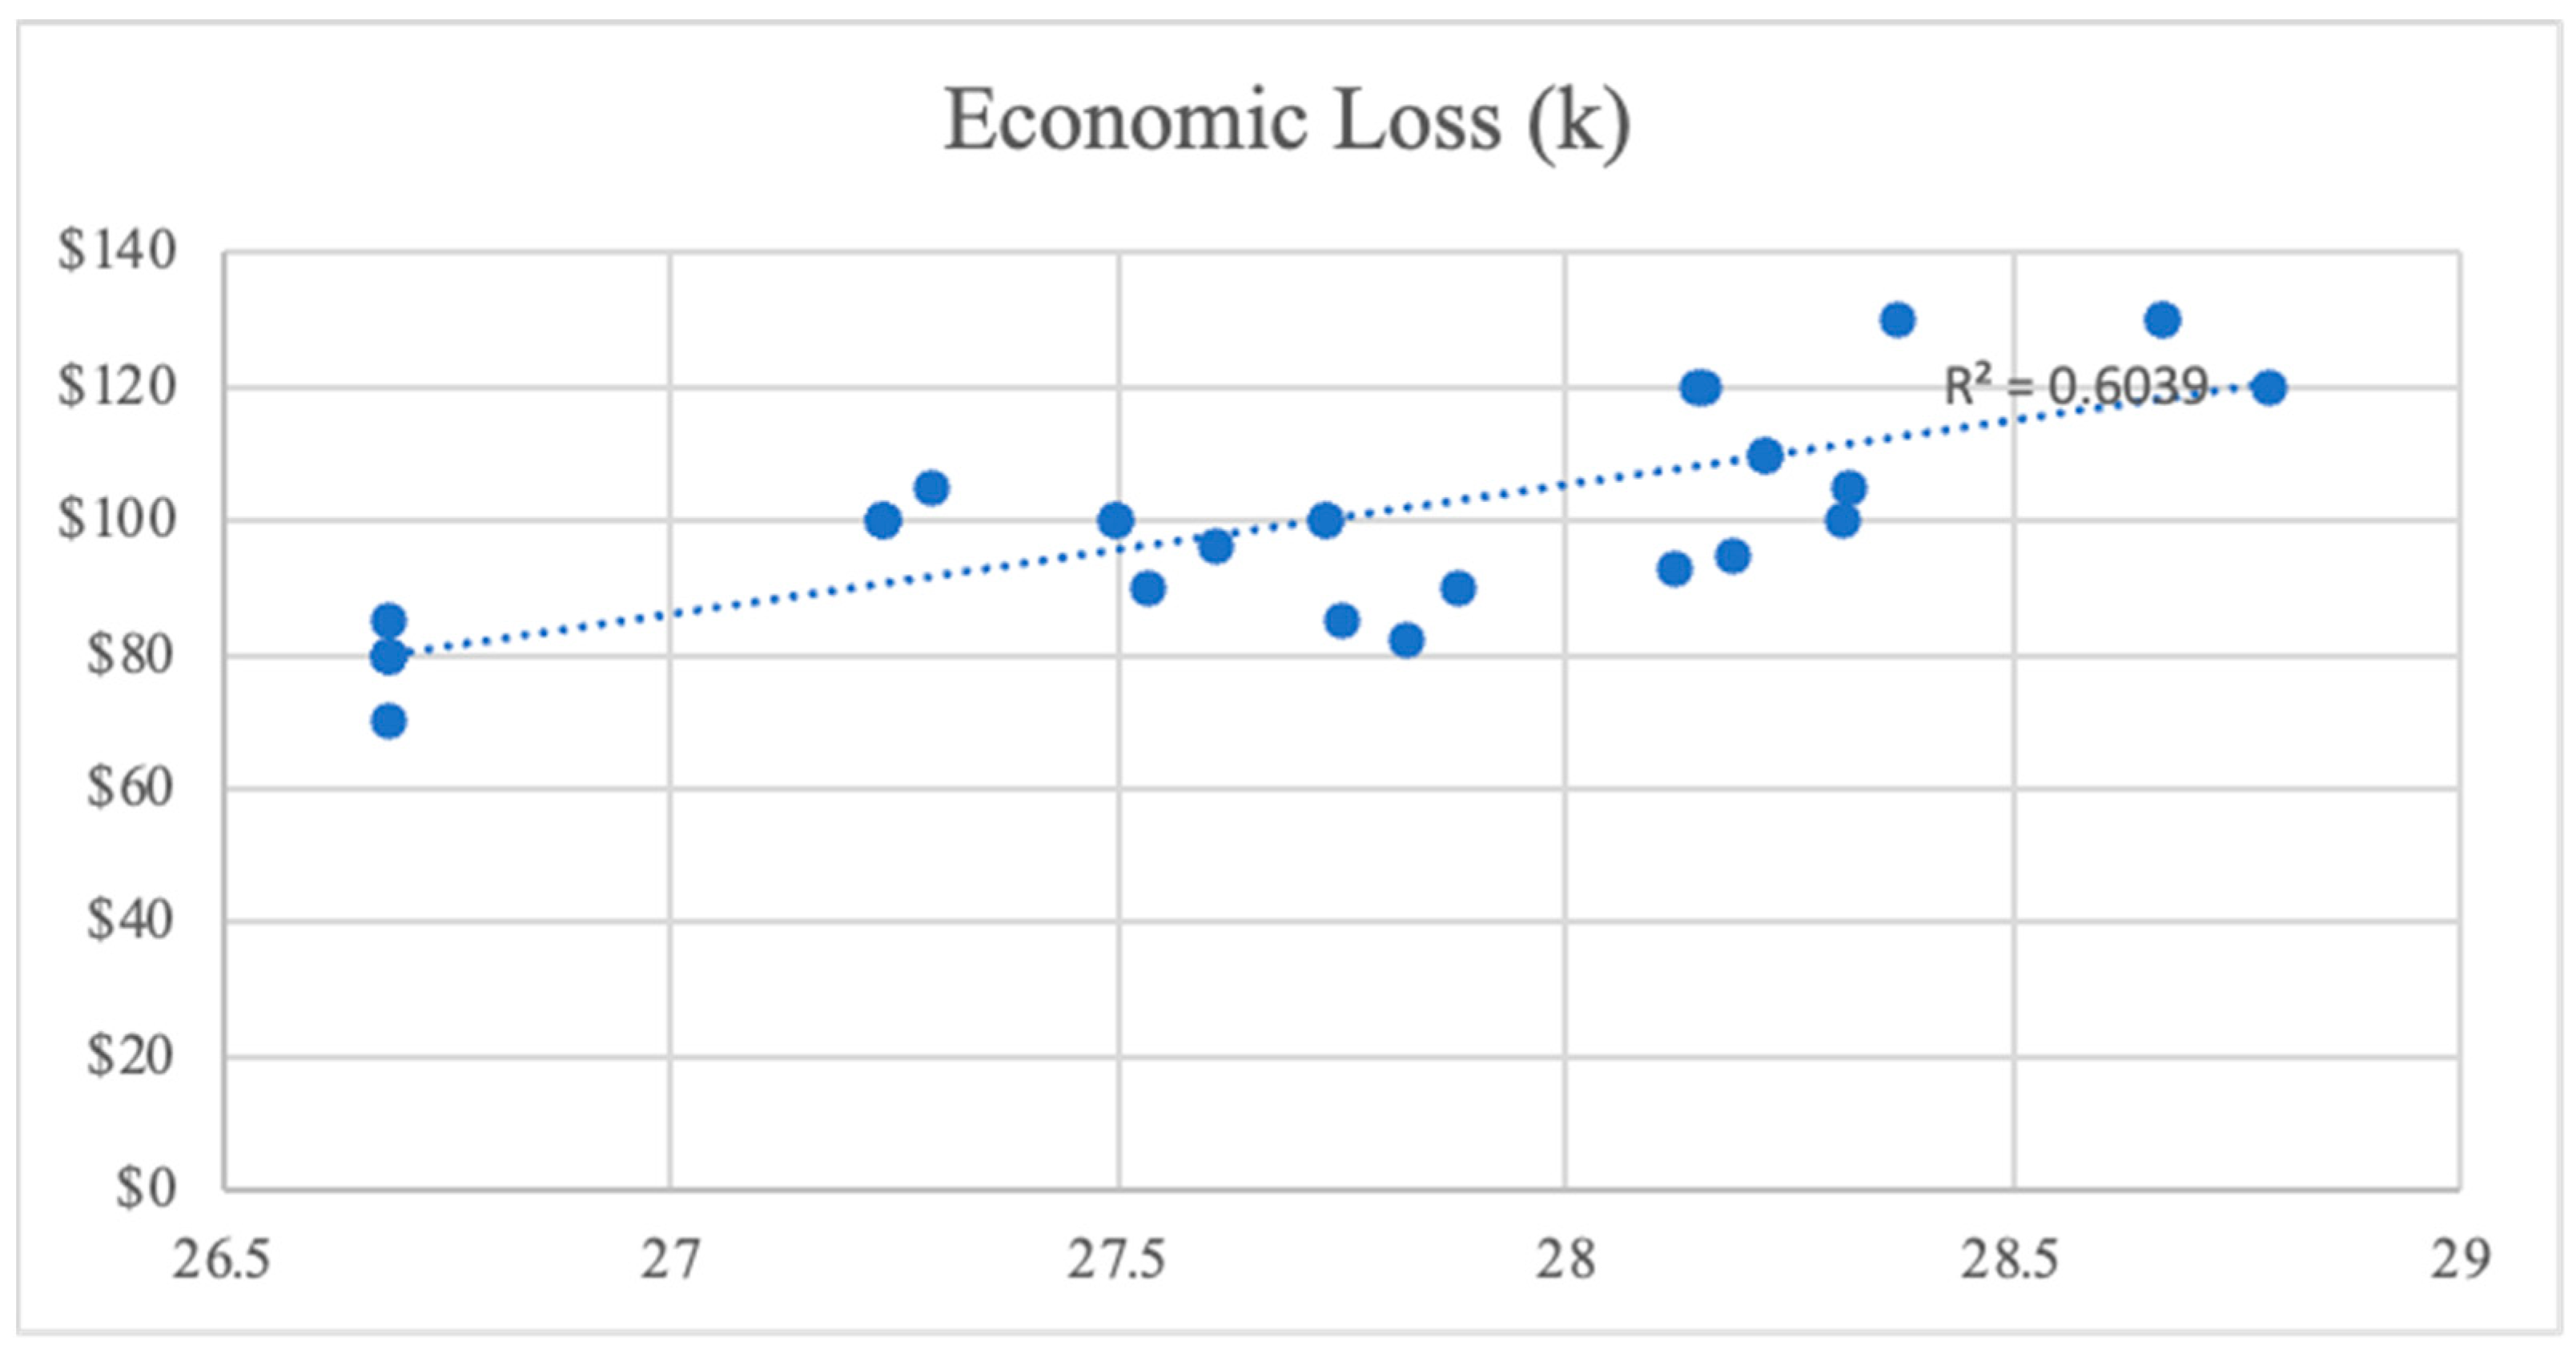
There are 30 safety incidents among the database which are randomly selected to validate the usability of the Loss Index. The potential factors in each case are identified and the economic loss is calculated by the Loss Index. Subsequently, a comparative analysis is conducted between the model’s predicted values and the economic loss in the real projects. And the outcome presents a linear correlation between them.
In the model validation process of this study, two-tailed t-test and coefficient of determination (R
2) are used to evaluate the statistical significance of the relationship between variables and the explanatory power of the model (
Table 8). Specifically, through a two-tailed t-test, at a significance level of 0.05, a
p-value is obtained that is below the standard threshold of significance, which is 1.51 × 10
−21. This result indicates that the sample mean is significantly different from the assumed population mean. At the same time, the corresponding critical t value is 2.0453, further verifying the significance of the statistical results.
In addition, the R
2 of the model is 0.6039 (see
Figure 9), indicating that the independent variables explain 60.39% of the variability of the dependent variable, showing the correlation between the explanatory variables of the model. Therefore, combined with the results of the two-tailed t test and R² analysis, this research model is statistically significant and demonstrates good explanatory power, laying a solid foundation for subsequent theoretical exploration and practical application. The validation results showcase its potential as a reliable tool in forecasting the loss of risk in construction sites in practical conditions.
This case study serves as a testament to the BN-AHP model’s practical utility, laying a promising foundation for its application in safety risk management and loss prediction in various urban contexts. Moving forward, the predictive accuracy could be augmented through further iterative refinements and the robustness and generalizability of the results can be improved through expanding the dataset.
5. Results
This research aims to provide a loss index model of various risk indicators for safety management practitioners to optimize their management strategy. According to the model results in
Figure 7, Ind3 (lack of construction safety training) scores the highest at 15.38, indicating that it is the most harmful factor to construction projects. Most resources are suggested to be invested in conducting safety training for practitioners to realize effective safety management. Ind5 (no security disclosure), which is 15.16, ranking in second place, indicates that lack of effective safety disclosure will lead to construction workers often working according to experience, while ignoring the particularity of different projects.
6. Discussion
6.1. Managerial Implications and Contribution
This study offers substantial managerial implications and contributes significantly to the field of construction safety management. By introducing a loss index model that quantifies the impact of various risk indicators, the research provides a pivotal tool for safety management practitioners. This model enables practitioners to fine-tune their management strategies for maximal effectiveness. From a strategic standpoint, the proposed solution is invaluable to safety managers, project managers, and high-level authorities in orchestrating a more nuanced and efficient safety management strategy. Its dynamic nature, with real-time adjustments reflecting actual site conditions, allows an adaptive approach to safety oversight. The daily safety patrols and inspections data can be updated to estimate the loss index in real time, enabling a responsive and informed safety management process.
This research enables project and safety managers to implement preventive measures that are aligned with the dynamic conditions of the construction project. It acts as a decision-support system, offering authoritative guidance on the allocation of investments in safety measures that are likely to yield a higher return. In essence, the model serves as a pragmatic reference for authorities, directing further investments into safety initiatives that not only mitigate risk but also enhance economic efficiency, supporting the dual objectives of safety and cost-effectiveness in construction project management.
6.2. Limitations and Suggestion for Future Research
One of the key limitations of this model’s applicability is contingent upon region-specific data within China, which may circumscribe its generalizability across varying geographic and cultural milieus. Thus, it is incumbent upon subsequent research endeavors to validate and potentially recalibrate the model with a broader international dataset to authenticate its applicability across disparate construction contexts.
Furthermore, the predominance of quantitative data within the current model might not encapsulate the multifaceted nature of human factors and the intricacies of organizational culture in risk management. Future research could endeavor to integrate qualitative research methods to capture the nuanced dynamics of safety practices within the construction industry.
The advent of digital technologies offers an opportunity to refine the model’s predictive precision and real-time responsiveness. Future studies could investigate the integration of artificial intelligence and machine learning algorithms to engender a more advanced, predictive, and adaptive safety management framework. Moreover, the algorithm of quantified risk assessment models can be integrated into the construction project management platform. The smart construction platform is a powerful choice that can support timely safety management. The integration of the risk economic index to the project management platform can provide intuitive and informed decision-making suggestions to those at the level of authority.
Lastly, the economic outcomes predicated in the model do not fully consider the broader social impact of construction accidents. Further research should extend beyond economic metrics to incorporate the societal and psychological costs associated with construction safety incidents. The expanded scope would provide a more holistic understanding of the implications of construction safety and contribute to the development of comprehensive risk management strategies.
7. Conclusions
This research proposes an integrated solution to analyze the risks and provides the loss index model to benefit the management level with optimized safety management guidance. In this paper, the real-world accidents data are collected, and the risk factors are extracted based on the BN. In the following step, AHP is used to further analyze the human, material, management, and environmental factors. Through the combination of BN and AHP, the dynamic loss index model is established to provide evidence for decision making in the safety management process. The significant feature of this model is to evaluate the project safety conditions in real time based on the content of the daily collected working log. According to the construction progress, the safety plan can be adjusted in time, sorting and preventing different risks at different stages of the project. In addition, it also provides opportunities for further continuous enrichment of the risk predication model with more data input in the construction industry.
The current result generated by the proposed model in this research is conducted with limited data size and diversity. The accuracy of the model shall be largely increased if more accidents are analyzed with various risk factors. In further research, the author shall enlarge the research pool, and the Fuzzy BN and Fuzzy AHP method will also be utilized to improve the model. In addition, the next research target would be the budget and the investment allocation control of the safety management in the construction industry based on the loss index model of the current research. At the same time, this model would be combined with the Markowitz Portfolio Theory. Based on the quantitative data provided by the model, the costs and benefits of risks can be compared. Eventually, the best investment rate on safety management is explored with the best security venture capital for various construction projects.
In the context of advancing construction management and disaster risk management, this study emphasizes a pivotal role through the integration of BN and AHP in quantifying the probability and severity of risks, thereby calculating potential losses. The robust method proposed in this research paves the way for the sustainable and secure future of construction management through analyzing the multifaceted value. Through working out a strategy to respond to dynamic construction safety situations, this model enables the practitioners to make informed decisions. In the future, the approach will be improved to potentially benefit the projects towards avenues that promise heightened value and reduced loss, thereby nurturing a landscape that is economically viable and socially beneficial in the long run.


