1. Introduction
For decades, steel has been the backbone of construction, offering exceptional strength and ductility. However, it is not without its drawbacks. Steel reinforcements are susceptible to corrosion, leading to significant maintenance costs and compromising the longevity of structures [
1,
2]. Furthermore, the carbon footprint associated with steel production is substantial, contributing to the overall environmental impact of the construction industry [
3,
4].
The durability of reinforced concrete (RC) is a challenge frequently encountered in built assets and may prevent them from lasting their expected service life. The durability of RC structures is mostly related to the corrosion of the steel reinforcement [
5,
6]. This is particularly relevant to concrete structures located in aggressive environments such as coastal areas where steel is prone to corrosion-related damage due to its exposure to chloride-contaminated environments, leading to high-cost maintenance [
7,
8].
Steel in RCs that have been affected by corrosion is known [
9] to exhibit decreased flexural strength. The recent studies [
10,
11] that investigated the degradation rates of steel in RCs summarised the corrosion mechanisms and suggested control and protective measures. However, the proposed measures are too complicated, impractical or expensive to apply to existing structures. The construction industry, therefore, requires new solutions that are easy to adopt into construction practice and are not prohibitively expensive [
12].
Recognising these limitations of steel in RCs, fibre-reinforced polymer (FRP) is attracting attention as a suitable replacement for steel [
13,
14,
15]. Among the FRP variants, GFRP stands out with a high strength–weight ratio and is economically favourable [
12,
16] compared to carbon fibres, which are stronger but more expensive, and basalt fibres, which have better fire resistance but limited availability. Basalt-fibre-reinforced polymers (BFRP) also met the functional requirements as a potential replacement for steel, but the non-renewable geologic source rules it out as a sustainable replacement.
GFRP boasts good combinations of functional engineering properties, including high tensile strength, being lightweight, corrosion resistance, and excellent durability [
17,
18]. The durability mechanism of GFRP is commonly associated with resin hydrolysis, fibre degradation, and interfacial bonding behaviour after exposure to hygrothermal conditions and fatigue. This underscores the significance of material design for GFRP, emphasizing the selection of materials capable of withstanding such environmental degradation through thoughtful resin mix choices [
19]. While concerns exist regarding the long-term durability of GFRPs, evidence presented in many studies [
20,
21,
22,
23] highlights the advantages of GFRP over steel rebars in mitigating durability issues in reinforced concrete structures.
By replacing steel reinforcements with GFRP, there is the potential to revolutionise the construction industry, creating structures that are not only stronger and more sustainable but also require less maintenance and possess an extended service life [
24]. On the other hand, FRPs have a lower modulus of elasticity compared to steel. Therefore, with the pressing need for sustainable and resilient infrastructure, exploring the potential of GFRP as a replacement for steel reinforcement is a timely endeavour.
Bond behaviour refers to the interaction and adhesion between two materials, typically a reinforcing element like GFRP bars and a surrounding concrete matrix, and how loading conditions influence their cooperative structural performance. The effectiveness of the bond between concrete and reinforcement is critical for the structural integrity of RC systems. Developing a well-established bond is a fundamental requirement that enables the components of RC systems to act compositely [
25,
26]. The mechanics of mortar-GFRP bond in a GFRP-RC section requires clarifications compared to the conventional steel-RC. The role of the surface morphology difference and the obvious difference in the chemistry of material on the effectiveness of bond strength need clarification. It is clear that the traditional values of bond design coefficients established for steel reinforcements cannot be assumed for the structural designs of GFRP RCs. The complexity of modelling the mechanics of bond-slip in RC systems has led designers and researchers to assume 100% compliance for steel RC since the ribs in steel rebars allow very little slippage [
27]. For GFRP, most of the design guidelines and solutions in many published works (e.g., [
28,
29]) adopted similar design procedures developed for steel-reinforced concrete structures. There is a need to exclusively study the GFRP–mortar bond in GFRP rebars used in RCs.
Most of the studies [
30,
31,
32,
33] that have been conducted to evaluate the impact of various parameters on the strength of bonds generally focused on investigating the influence of factors such as bar diameter and concrete strength [
34,
35]. Since GFRPs are now available with different surface morphologies of sand coating and ribbed, it is important to consider the evaluation of the influence of the surface morphology along with other factors. There is little information on the characterisation of the failure mode and how it has been affected by possible combinations of the variables that contribute to optimising GFRP’s bonding in the mortar matrix. Further clarifications are required to determine the optimum combination of factors needed to achieve the most effective bond strength of GFRP reinforcement in RCs.
In the work presented in this paper, the effects of a broad range of parameters on the bond behaviour of GFRP-reinforced concrete are studied. This work aims to identify and characterise the combined effects of these parameters with regard to the strength and failure mode of GFRP-reinforced concrete structures through many pull-out tests.
2. Experimental Section
2.1. Materials and Pull-Out Test Preparation
As a composite material, GFRP is composed of high-strength glass fibres embedded in a polymer matrix. The combination includes glass fibres, typically made from silica-based materials, and the polymer matrix, often epoxy resin. The protrusion process is a key manufacturing step that transforms raw GFRP material into the familiar rebar form used in construction. In this process, high-strength glass fibres and epoxy resin are meticulously prepared, often pre-impregnated for a consistent resin distribution. The fibres are bundled to form the rebar’s core, with the arrangement determining the desired strength characteristics. Subsequently, the bundled fibres undergo resin infusion, ensuring thorough coating for strength and environmental protection. The protrusion process follows, involving the passage of resin-impregnated fibres through dies that shape and cure the material, achieved by pulling it through heated dies. Cooling solidifies the resin matrix, and the resulting GFRP rebar is cut to specified lengths, ready for deployment in construction projects.
GFRP rebars with sand-coated surfaces and ribbed surfaces were used for this study. Three diameter variables (8 mm, 12 mm and 16 mm) of each bar type were tested. GFRP rebars come with specifications of axial properties of a modulus of elasticity of 59 GPa and with a nominal strength of 1000 MPa.
The GFRP materials used in this study to prepare samples for pull-out tests were sourced from local industry suppliers. They were “off the shelf” materials used as supplied in their original form.
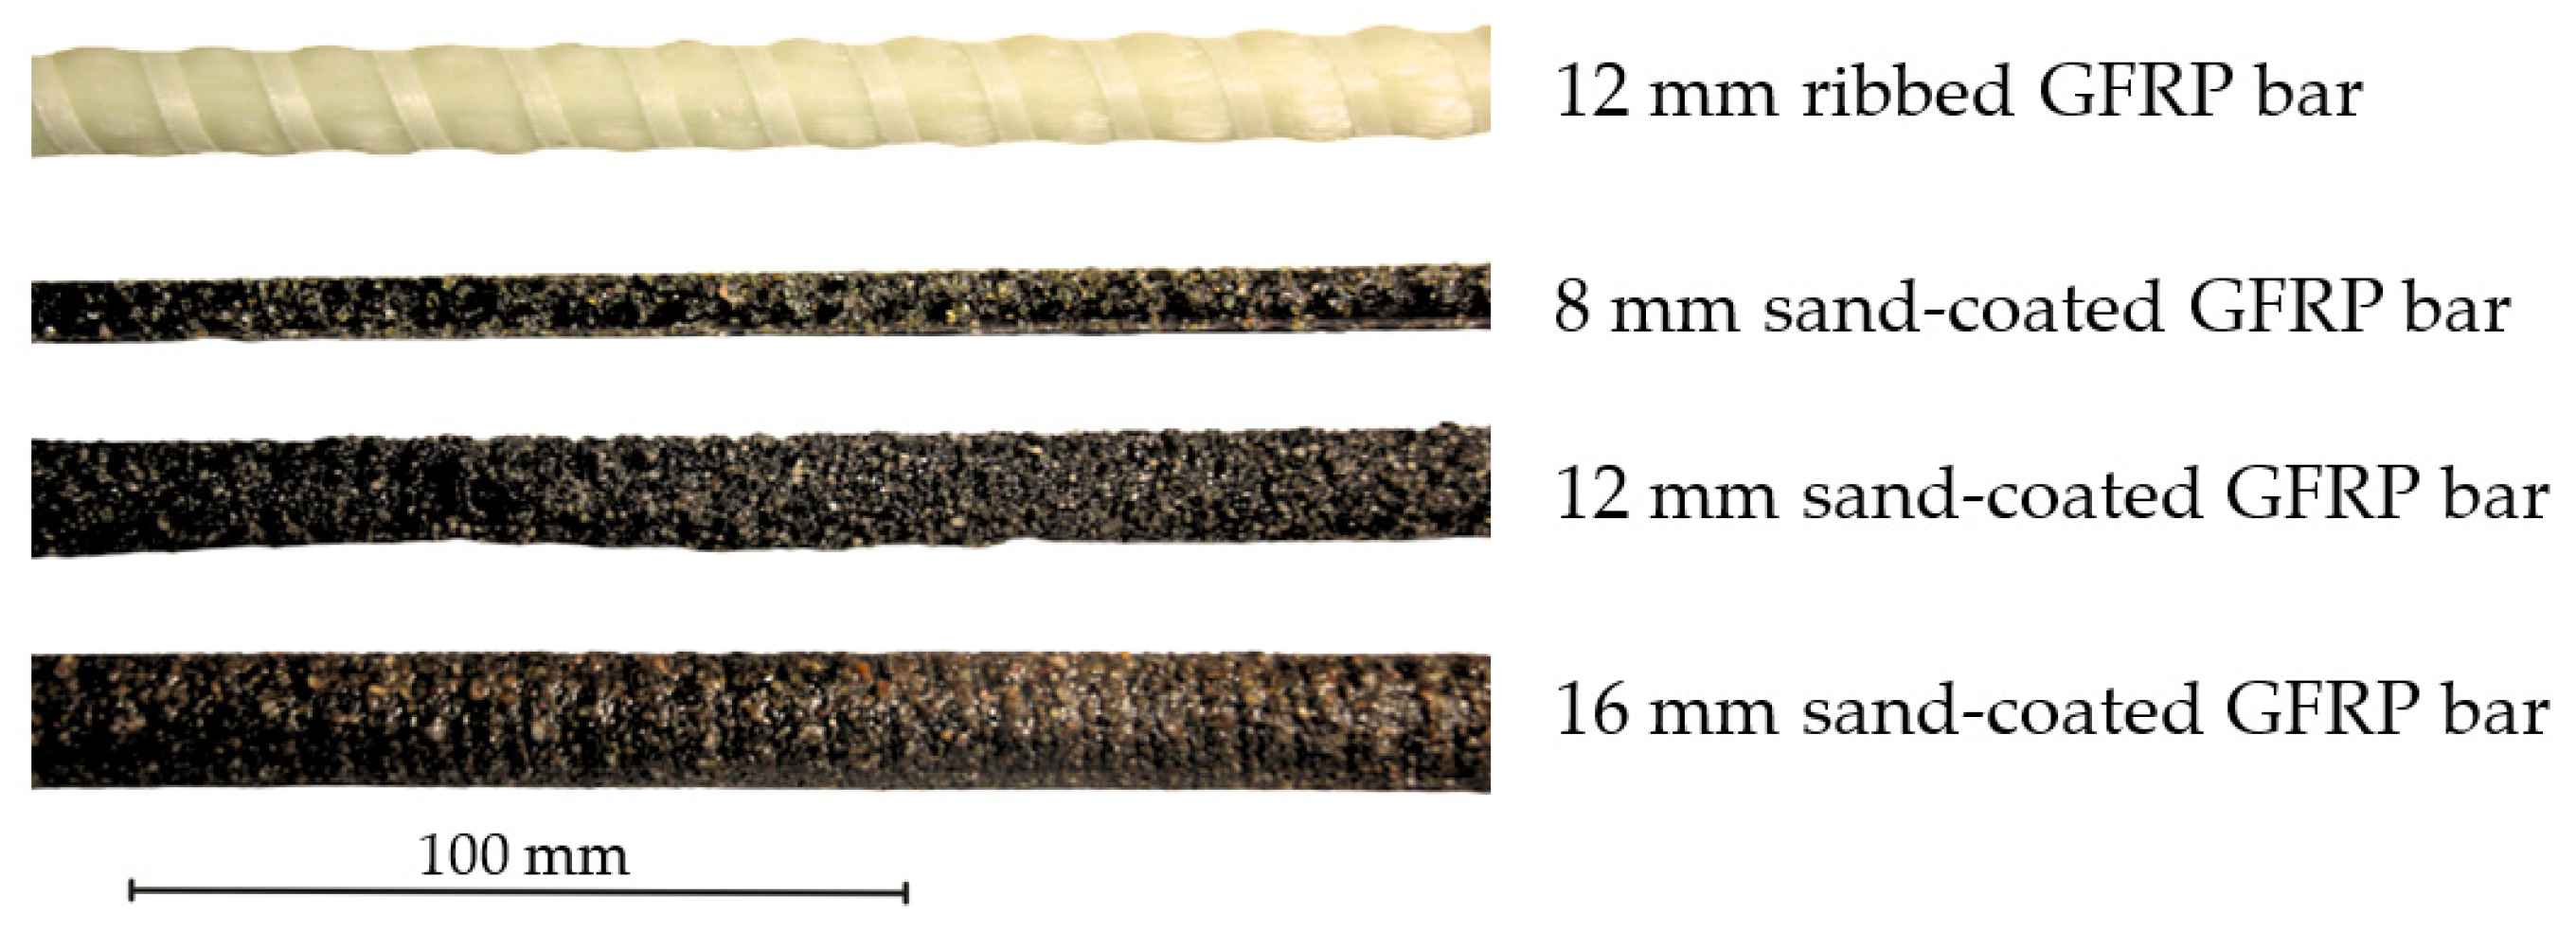
Figure 1 shows the GFRP bar variants used in this study.
Concretes with a compressive strength of 32 MPa, 40 Mpa and 50 Mpa were prepared following standard mix designs and are used to vary concrete strengths as part of this parametric investigation.
All specimens were prepared according to the recommendations of the American Society for Testing and Materials ACI 440 3R-14 Standard [
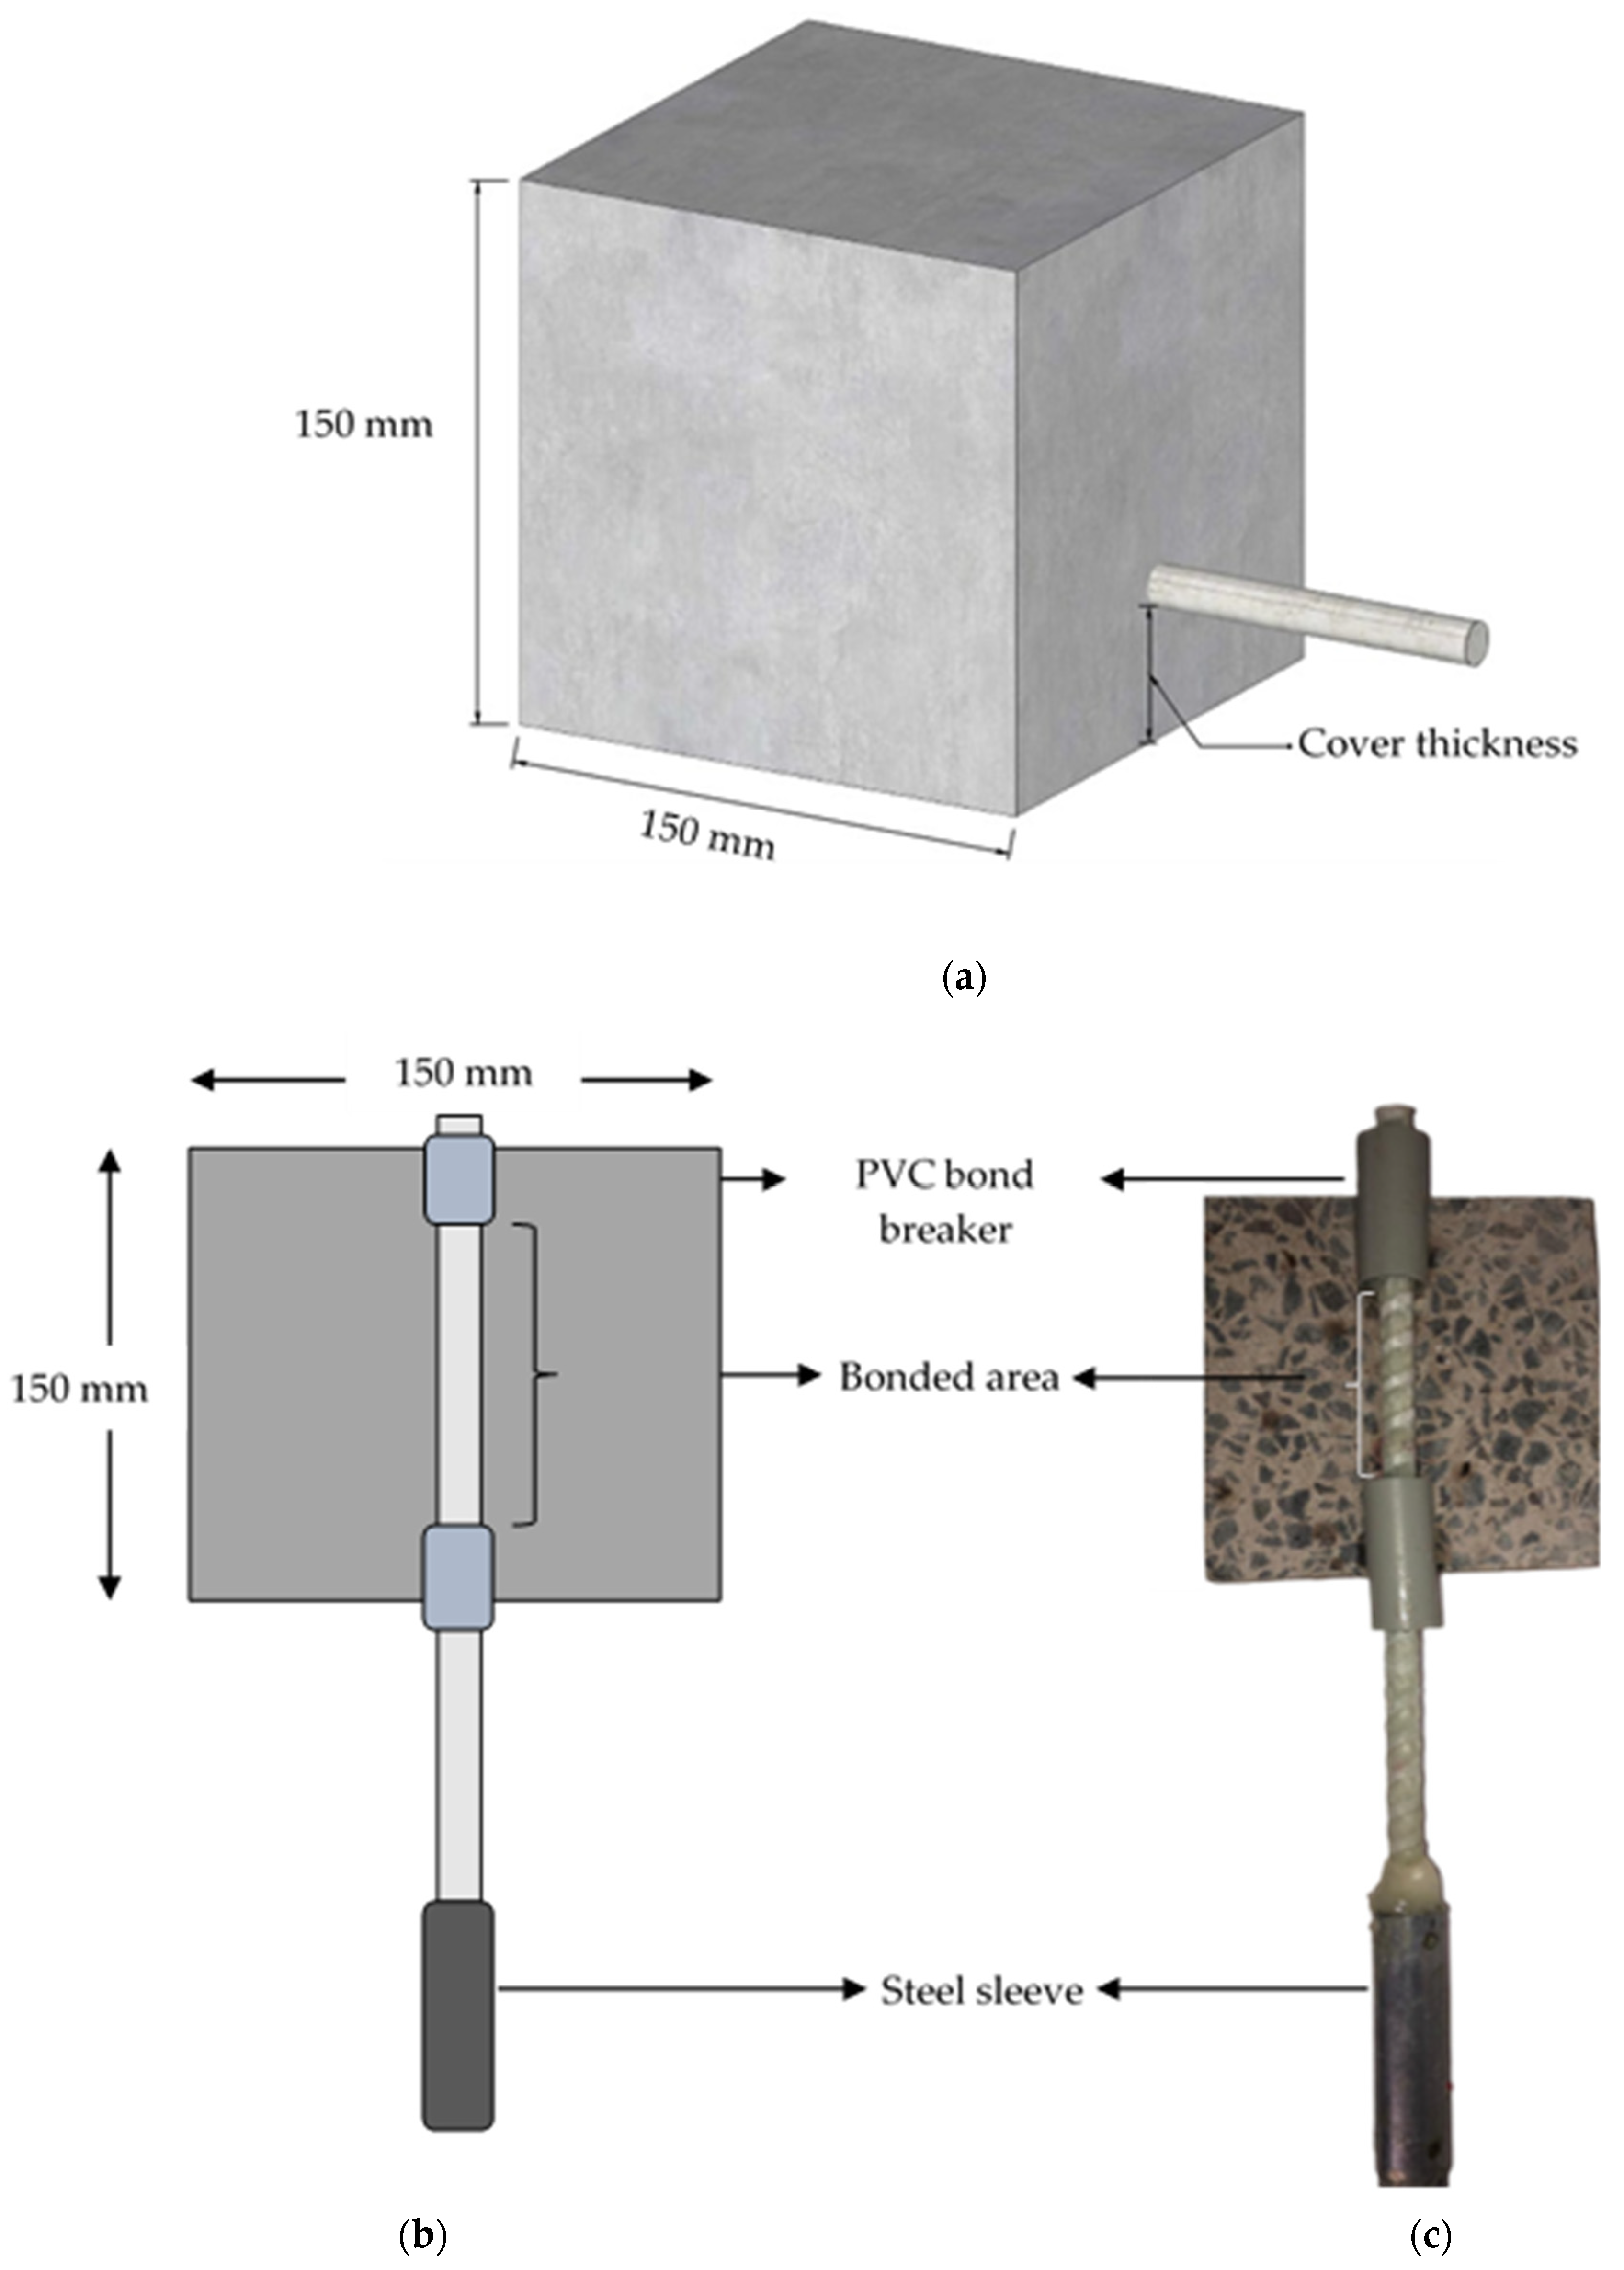
36] Test Method for Pull-out Strength for different concrete mixes. The GFRP bars were embedded in the concrete blocks, with dimensions of
as illustrated in
Figure 2. The concrete is left to cure for at least 28 days for all configurations.
PVC pipes were used as a bond breaker to accurately set the embedment lengths and minimise stress concentrations at the edge of the bond lengths. As illustrated in
Figure 2, a steel sleeve was also attached using high-strength epoxy resins to the pull end of the embedded GFRP bar to ensure a good grip at the jaws of the universal tensile machine (UTM). The details of the cross-sectional and dimensions of feature arrangements of the test specimen are expressed in
Figure 2.
Figure 3 describes the designations of the specimens that represent the different factors under investigation. The details of the test configurations are given in
Table 1.
2.2. Pull-Out Test
Figure 4 represents the schematic configuration of the pull-out test. The samples prepared (
Figure 2) for the pull-out test were held in the jaws of a 600 kN universal testing machine (UTM) using a purpose-made jig, as shown in
Figure 4. The test jig configuration consists of a welded square frame that is fitted on the UTM and onto which the sample is securely mounted.
The sample was pulled through the jaw of the UTM at a velocity of 2 mm/s. The force data were acquired via a 600 kN load cell. The relative slip of the rebar to the concrete block was recorded using a linear variable differential transformer (LVDT) with a self-retractable string mounted on the jig with the string attached to the free end of the GFRP bar, as indicated in
Figure 4. The data for displacement and force were collected via computer software, and raw data were processed and averaged.
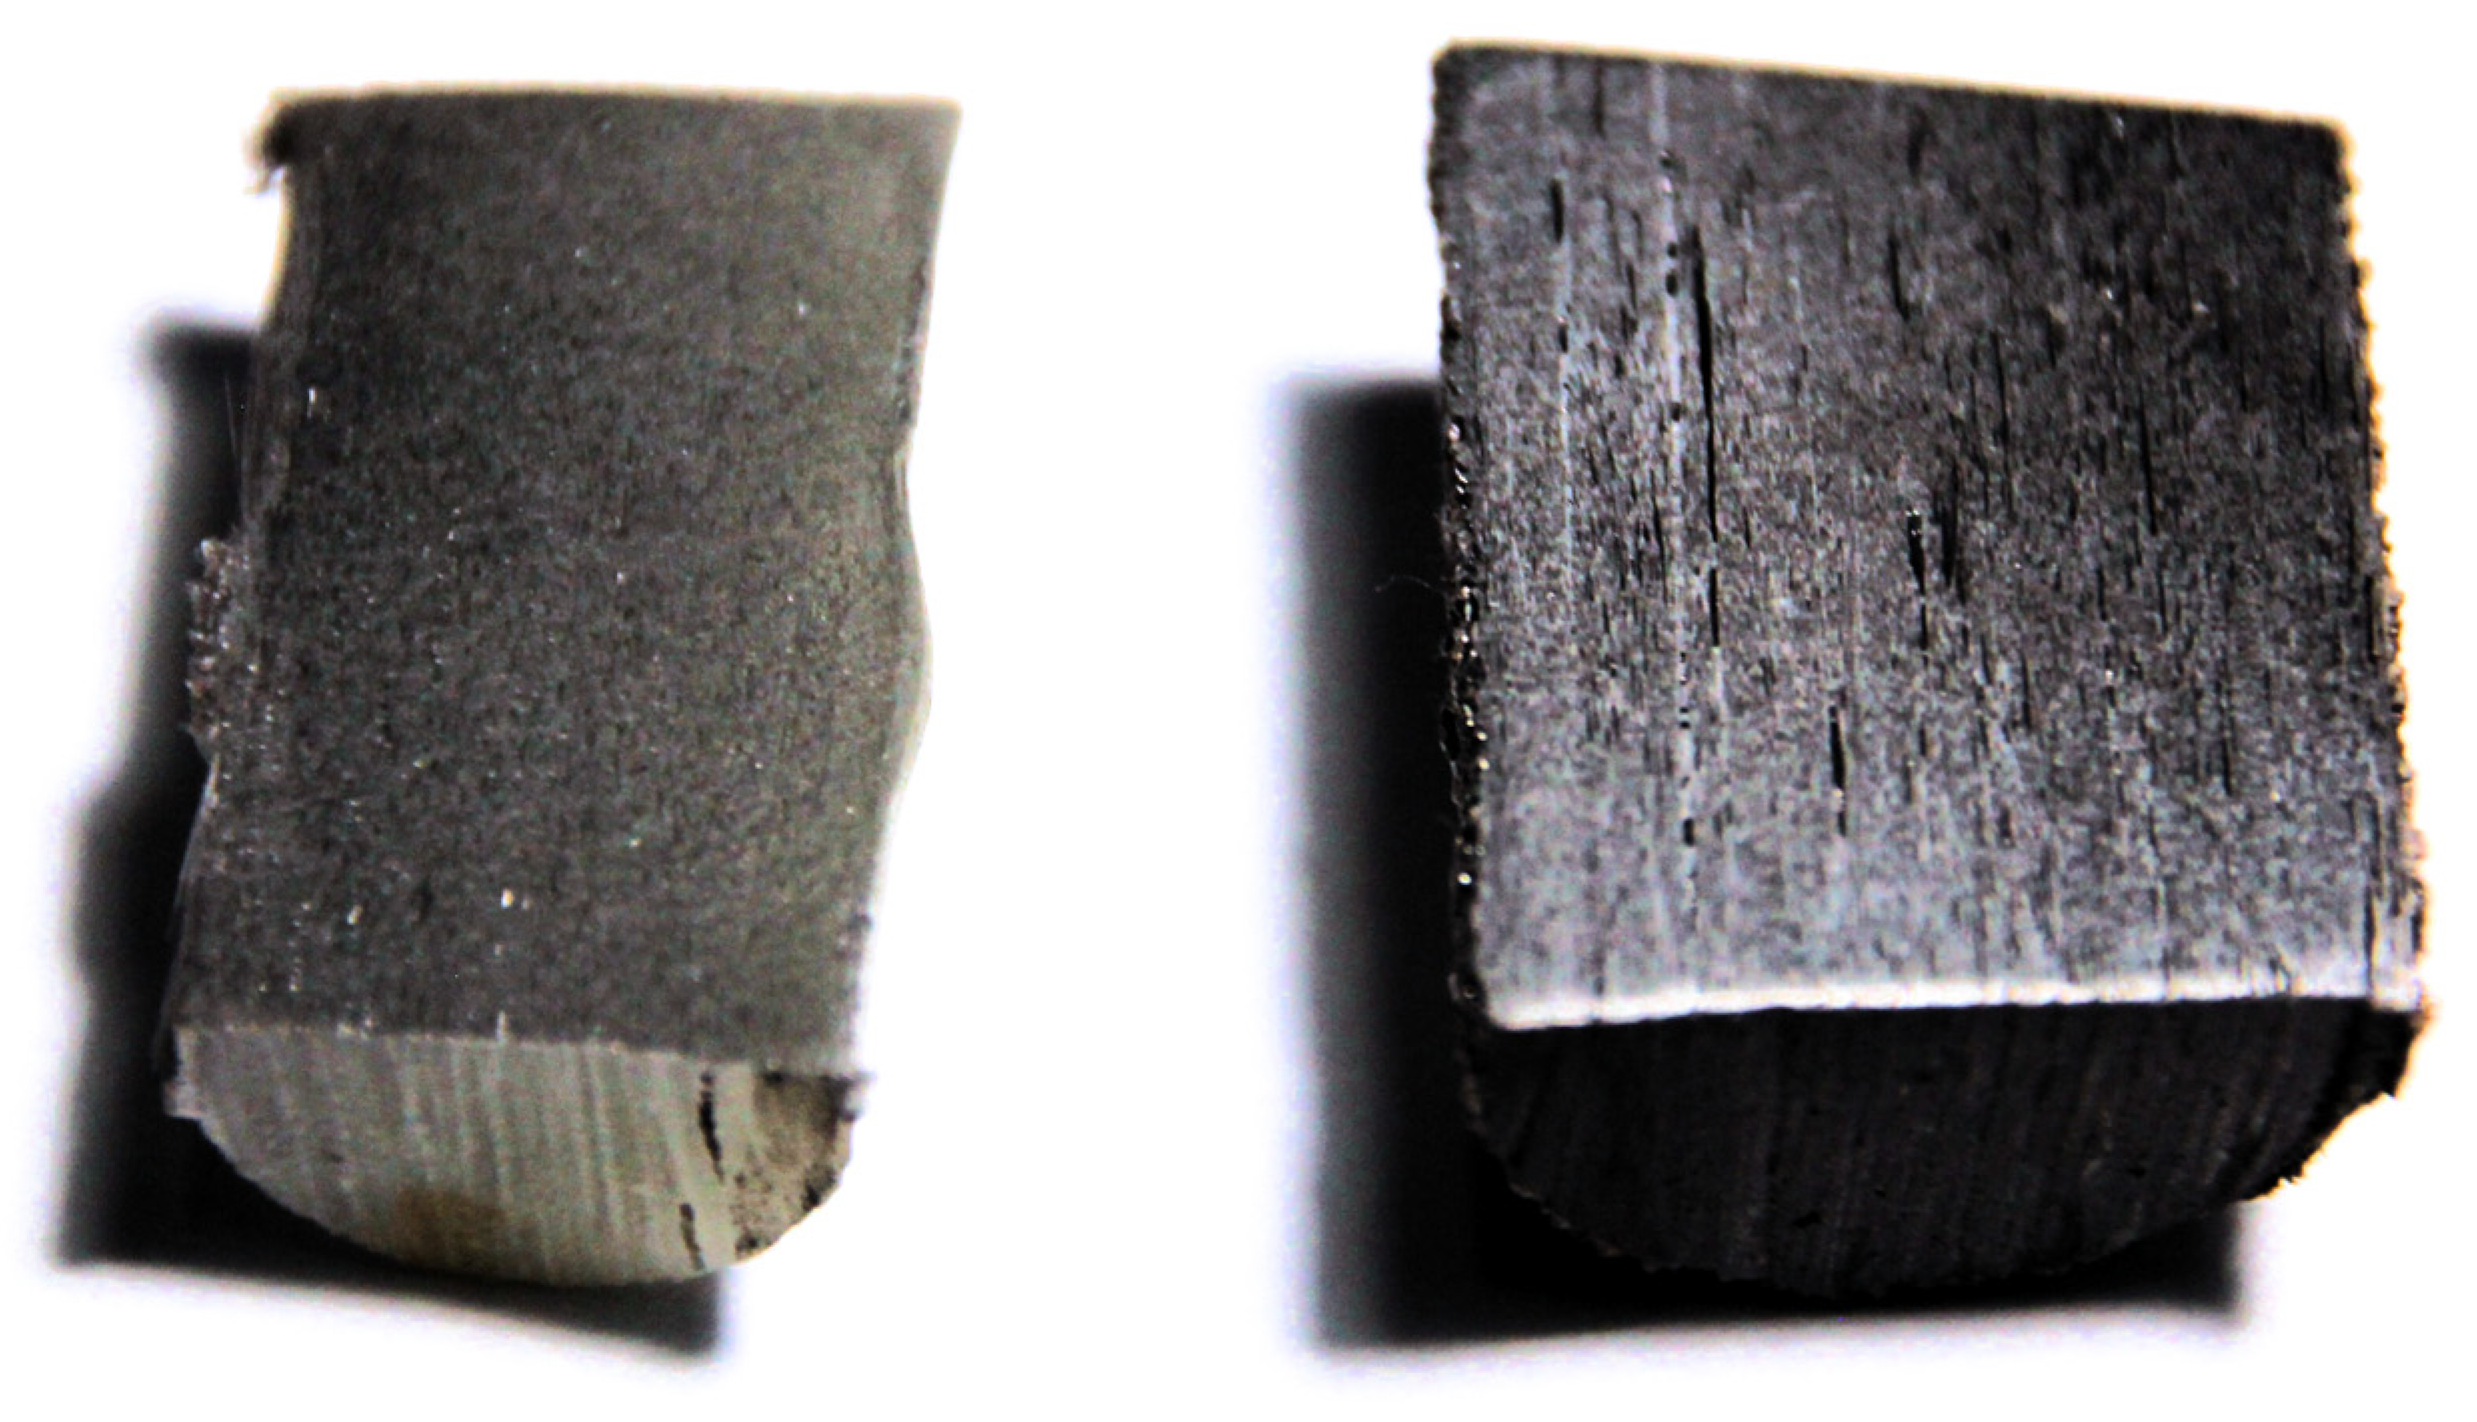
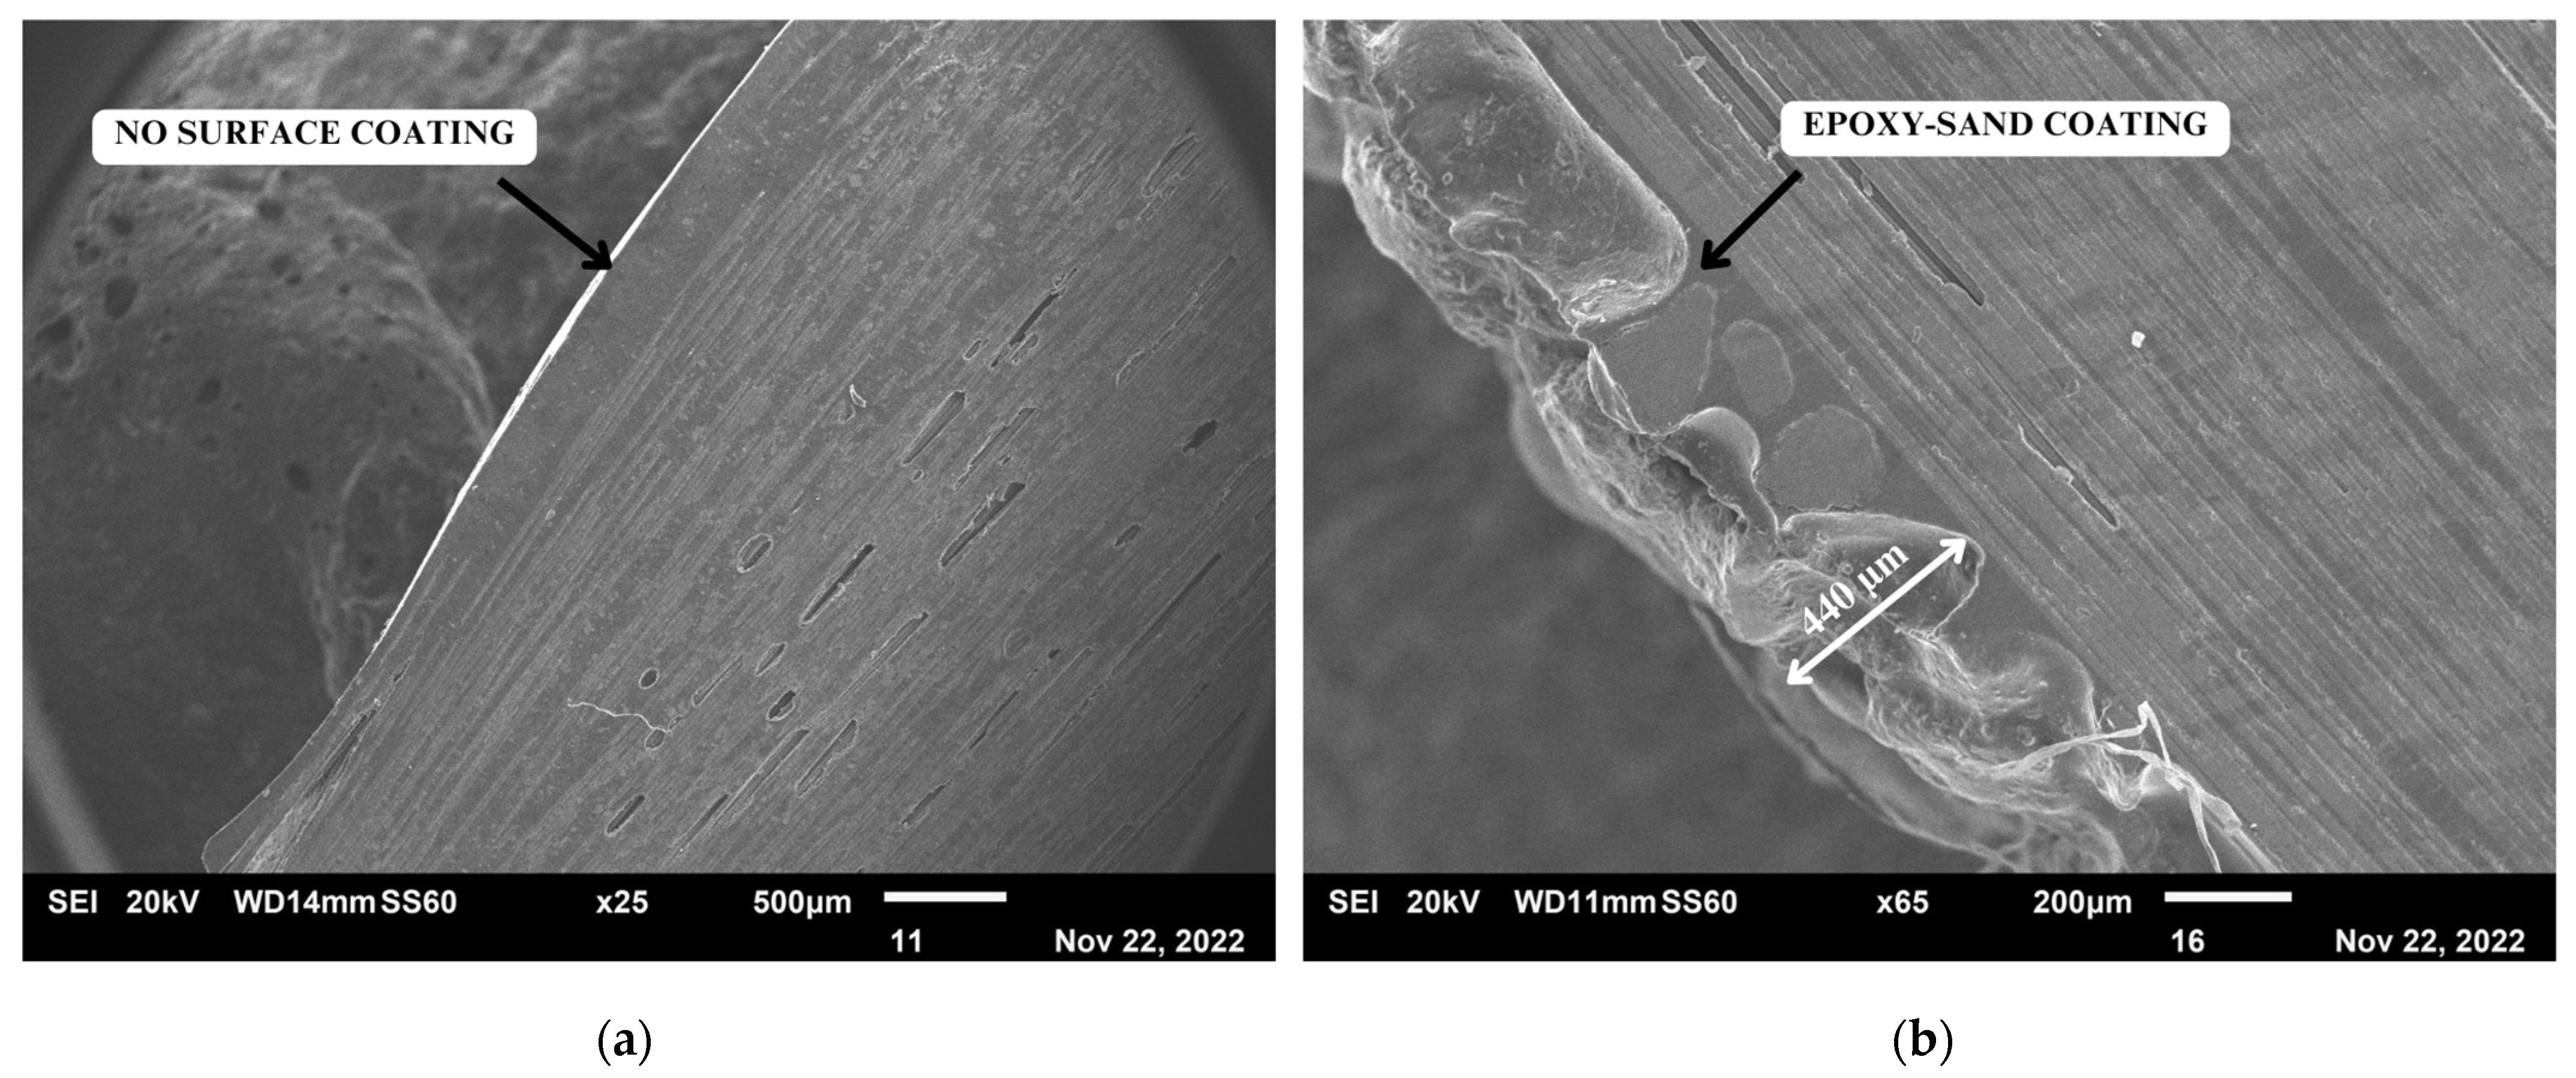
The thickness of the sand coating and the surface morphology of GFRP were examined via scanning electron microscope (SEM). The GFRP rebar sample for SEM was diametrically sectioned and gold-coated, as shown in
Figure 5.
3. Results and Discussion
3.1. Failure Patterns
The failure patterns observed in the test specimens were generally of two types:
- (1)
Bar slip;
- (2)
Concrete split.
Bar slip pertains to failure primarily due to sliding between the GFRP bar and the surrounding concrete without the concrete fracturing. This occurrence takes place when the applied load surpasses the bond strength between the bar and the concrete. On the other hand, concrete split involves failure initiated by the fracturing of the surrounding concrete due to localised stresses.
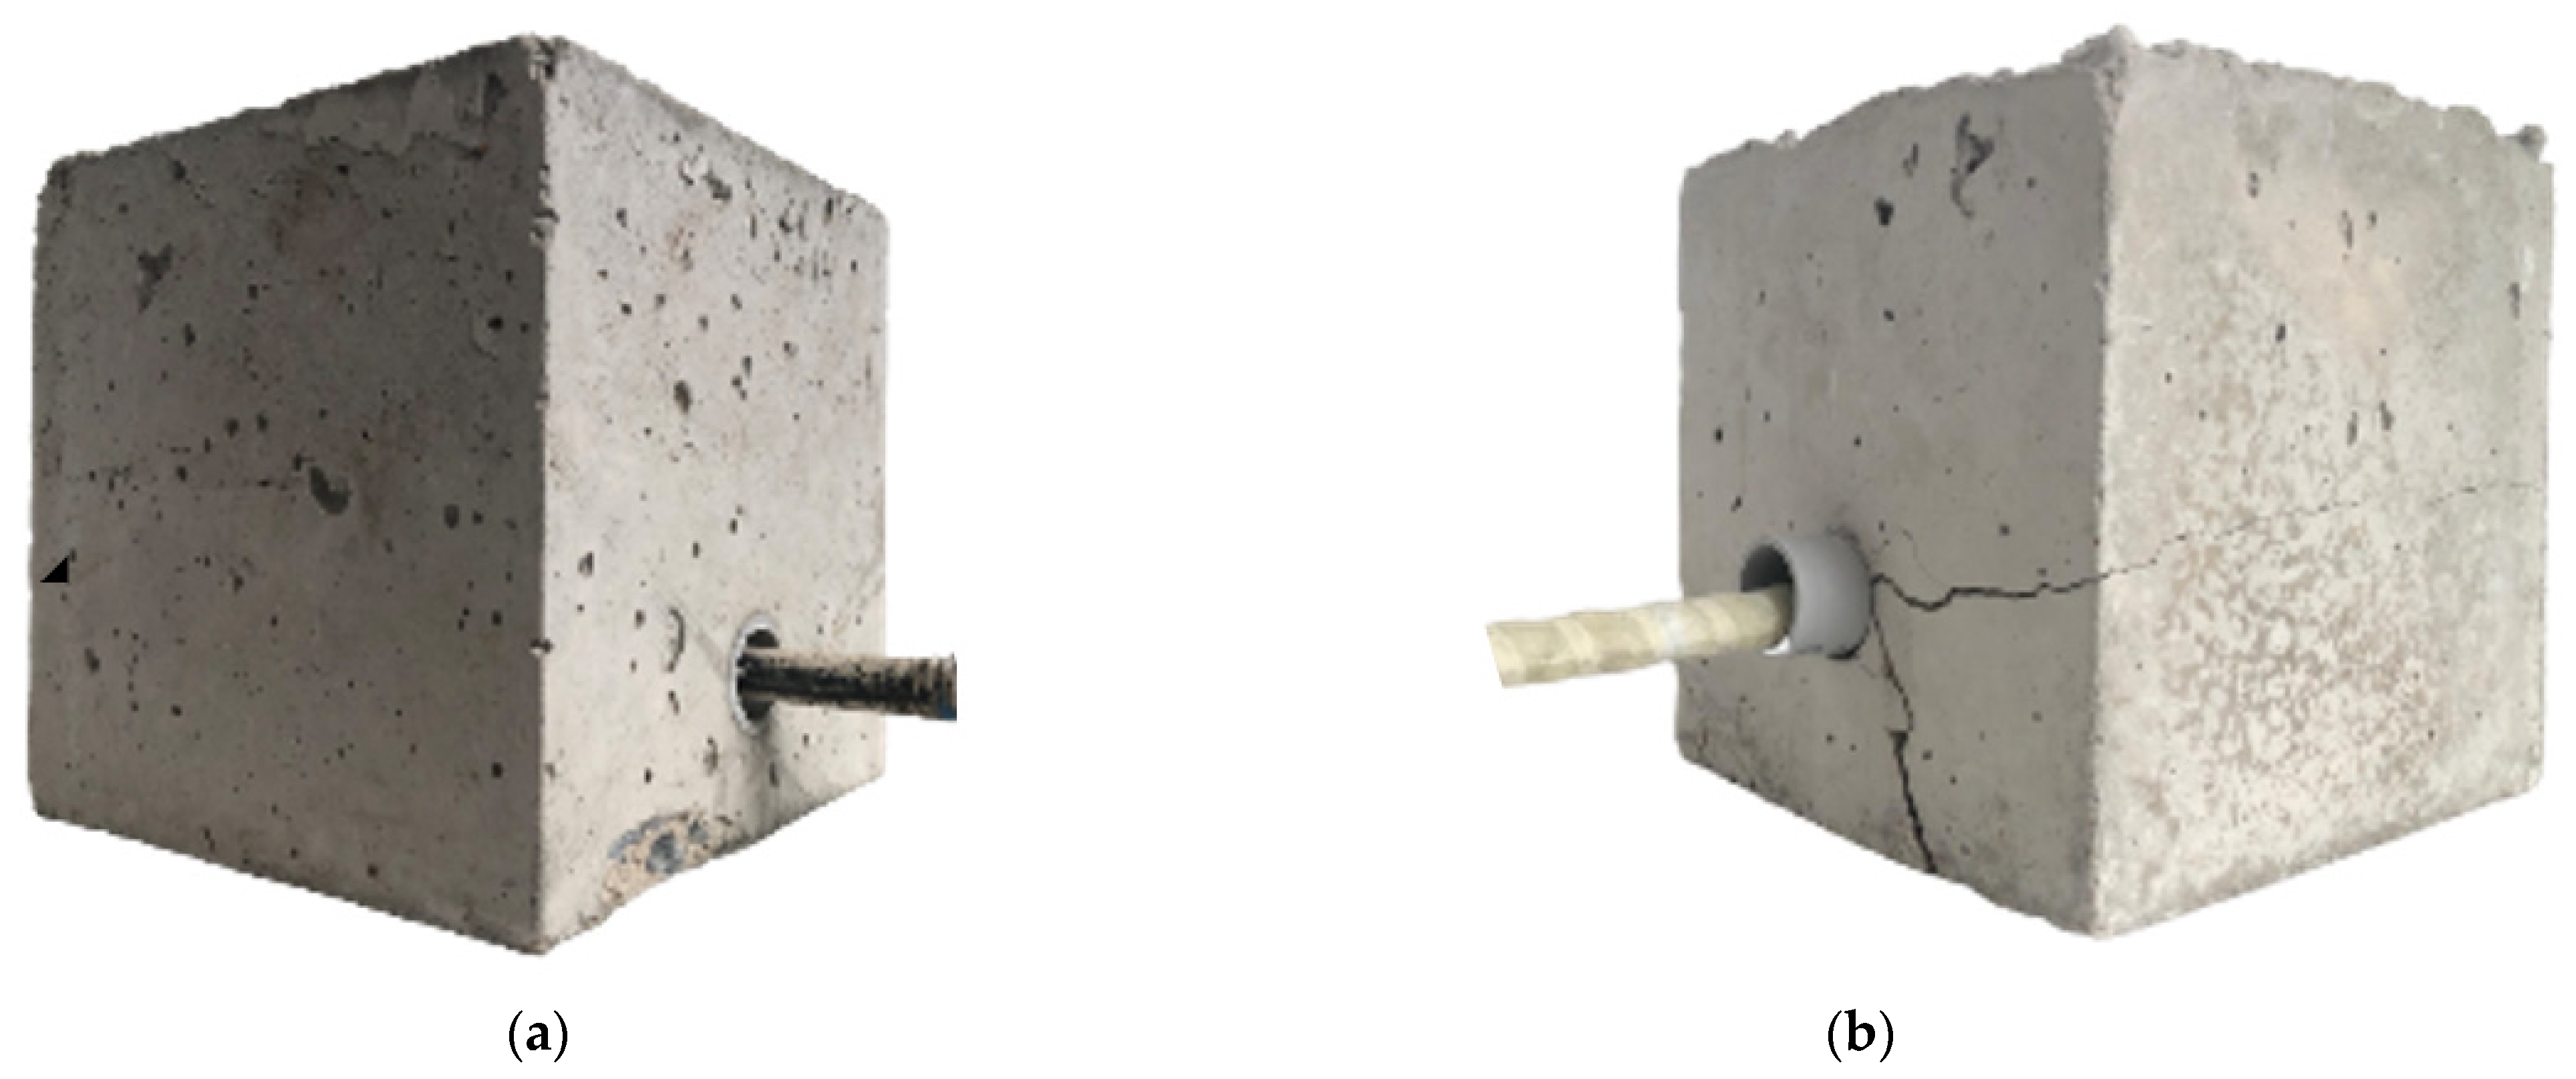
The examples of these types of failures observed are shown in
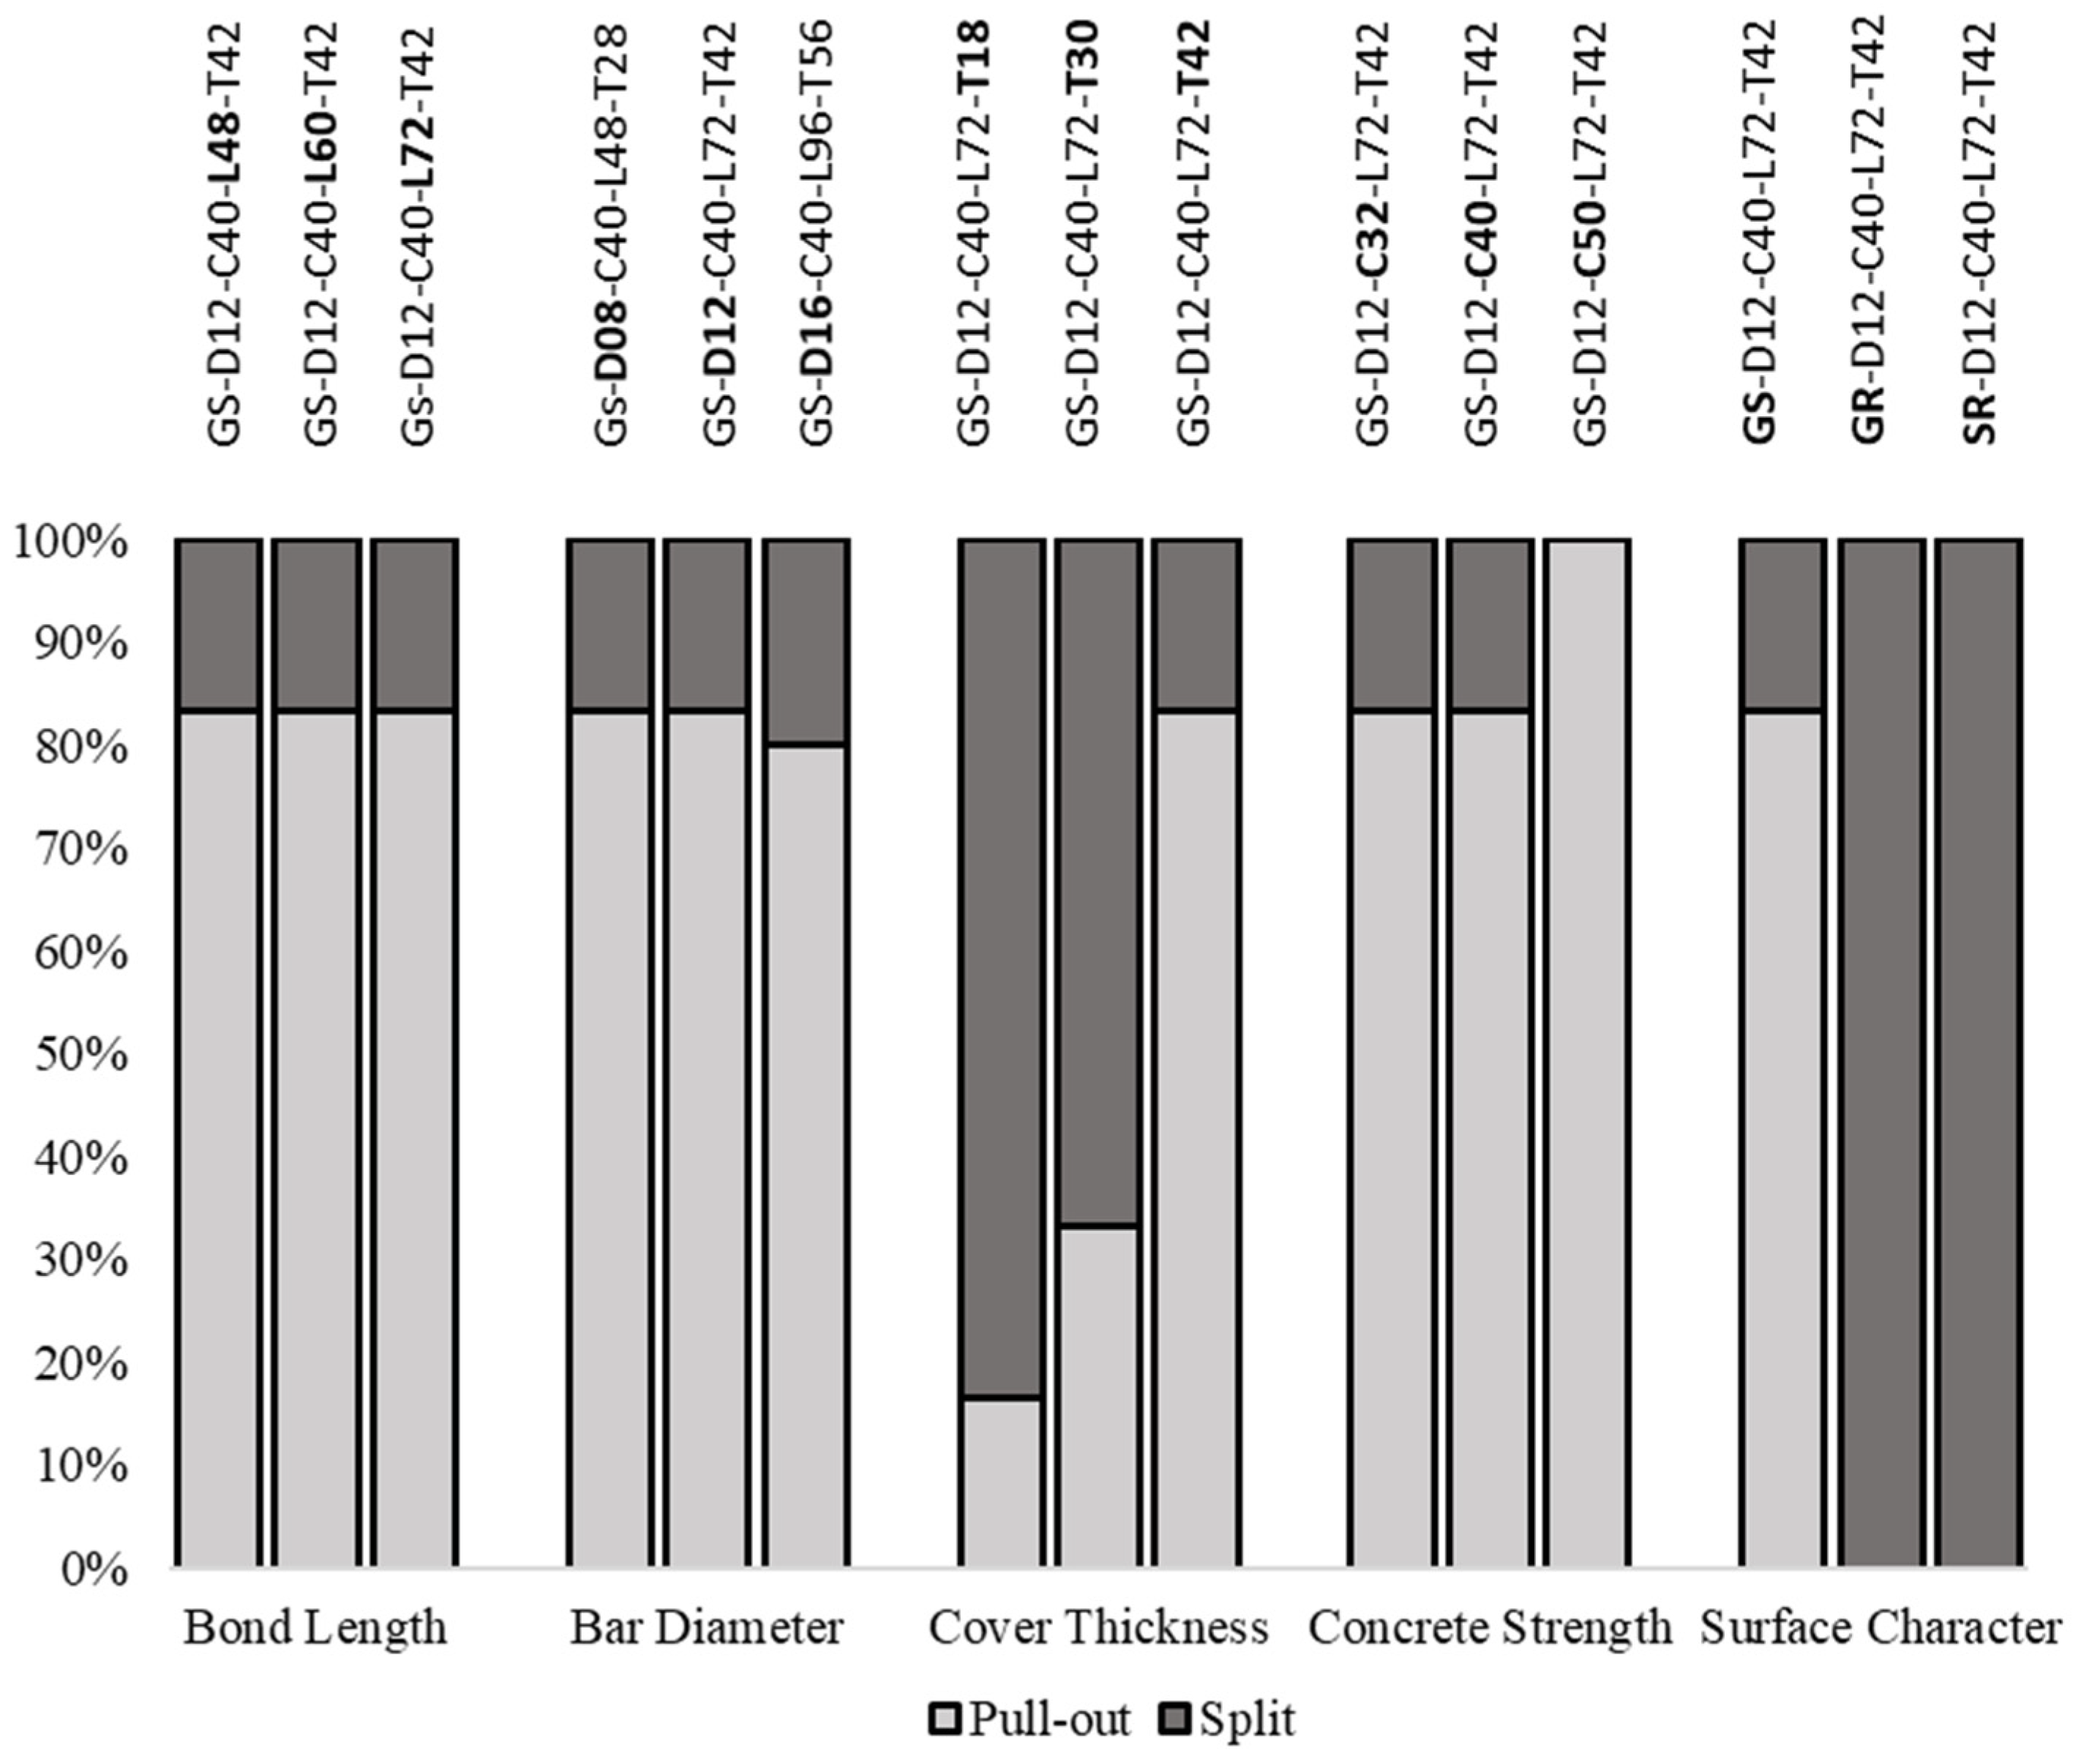
Figure 6. It is observed that all sand-coated GFRP bars experience a rebar slippage failure irrespective of the concrete strength. However, all ribbed GFRP and steel (normally ribbed) failed because of surrounding concrete splitting. This observation suggests that the ribbing of GFRP provided a better surface morphology to engage and optimise the mechanical contribution to the bond of GFRP bars to the concrete matrix.
Figure 7 summarises the relative distribution of the types of failure of the pull-out tests. It is evident that surface morphology is a significant factor in determining the failure mode in the pull-out test of GFRP bars. It is seen that for sand-coated bars, 80% of the samples failed due to rebar slipping, and for the ribbed GFRP and steel rebars, 100% of the samples failed due to concrete matrix splitting.
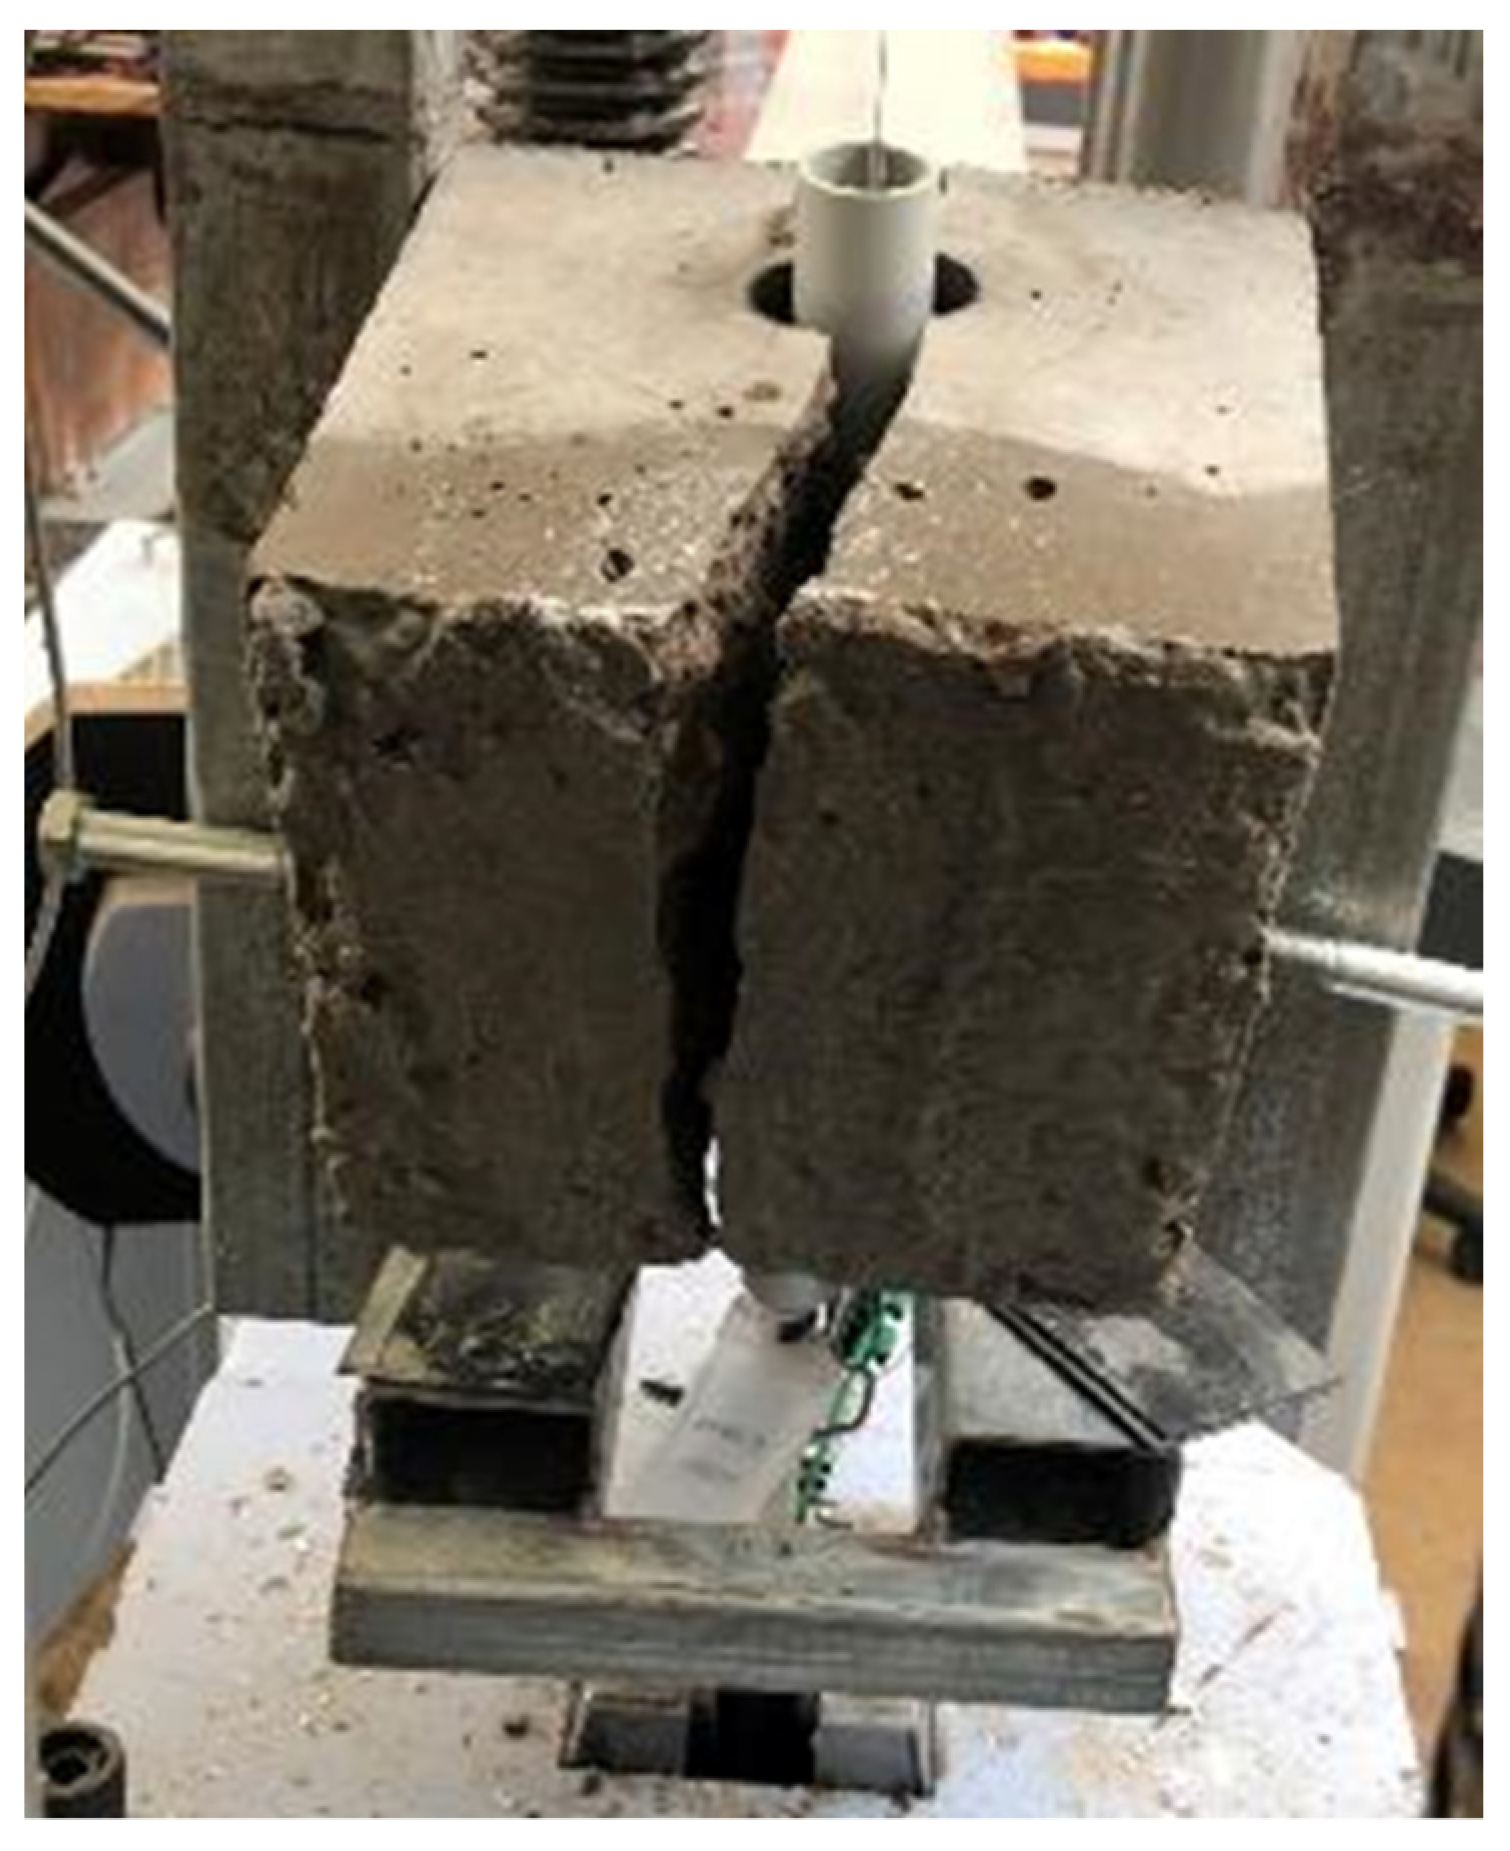
Concrete splitting was the predominant failure mode in the samples with GFRP and steel ribbed rebars. A typical surround concrete split is shown in
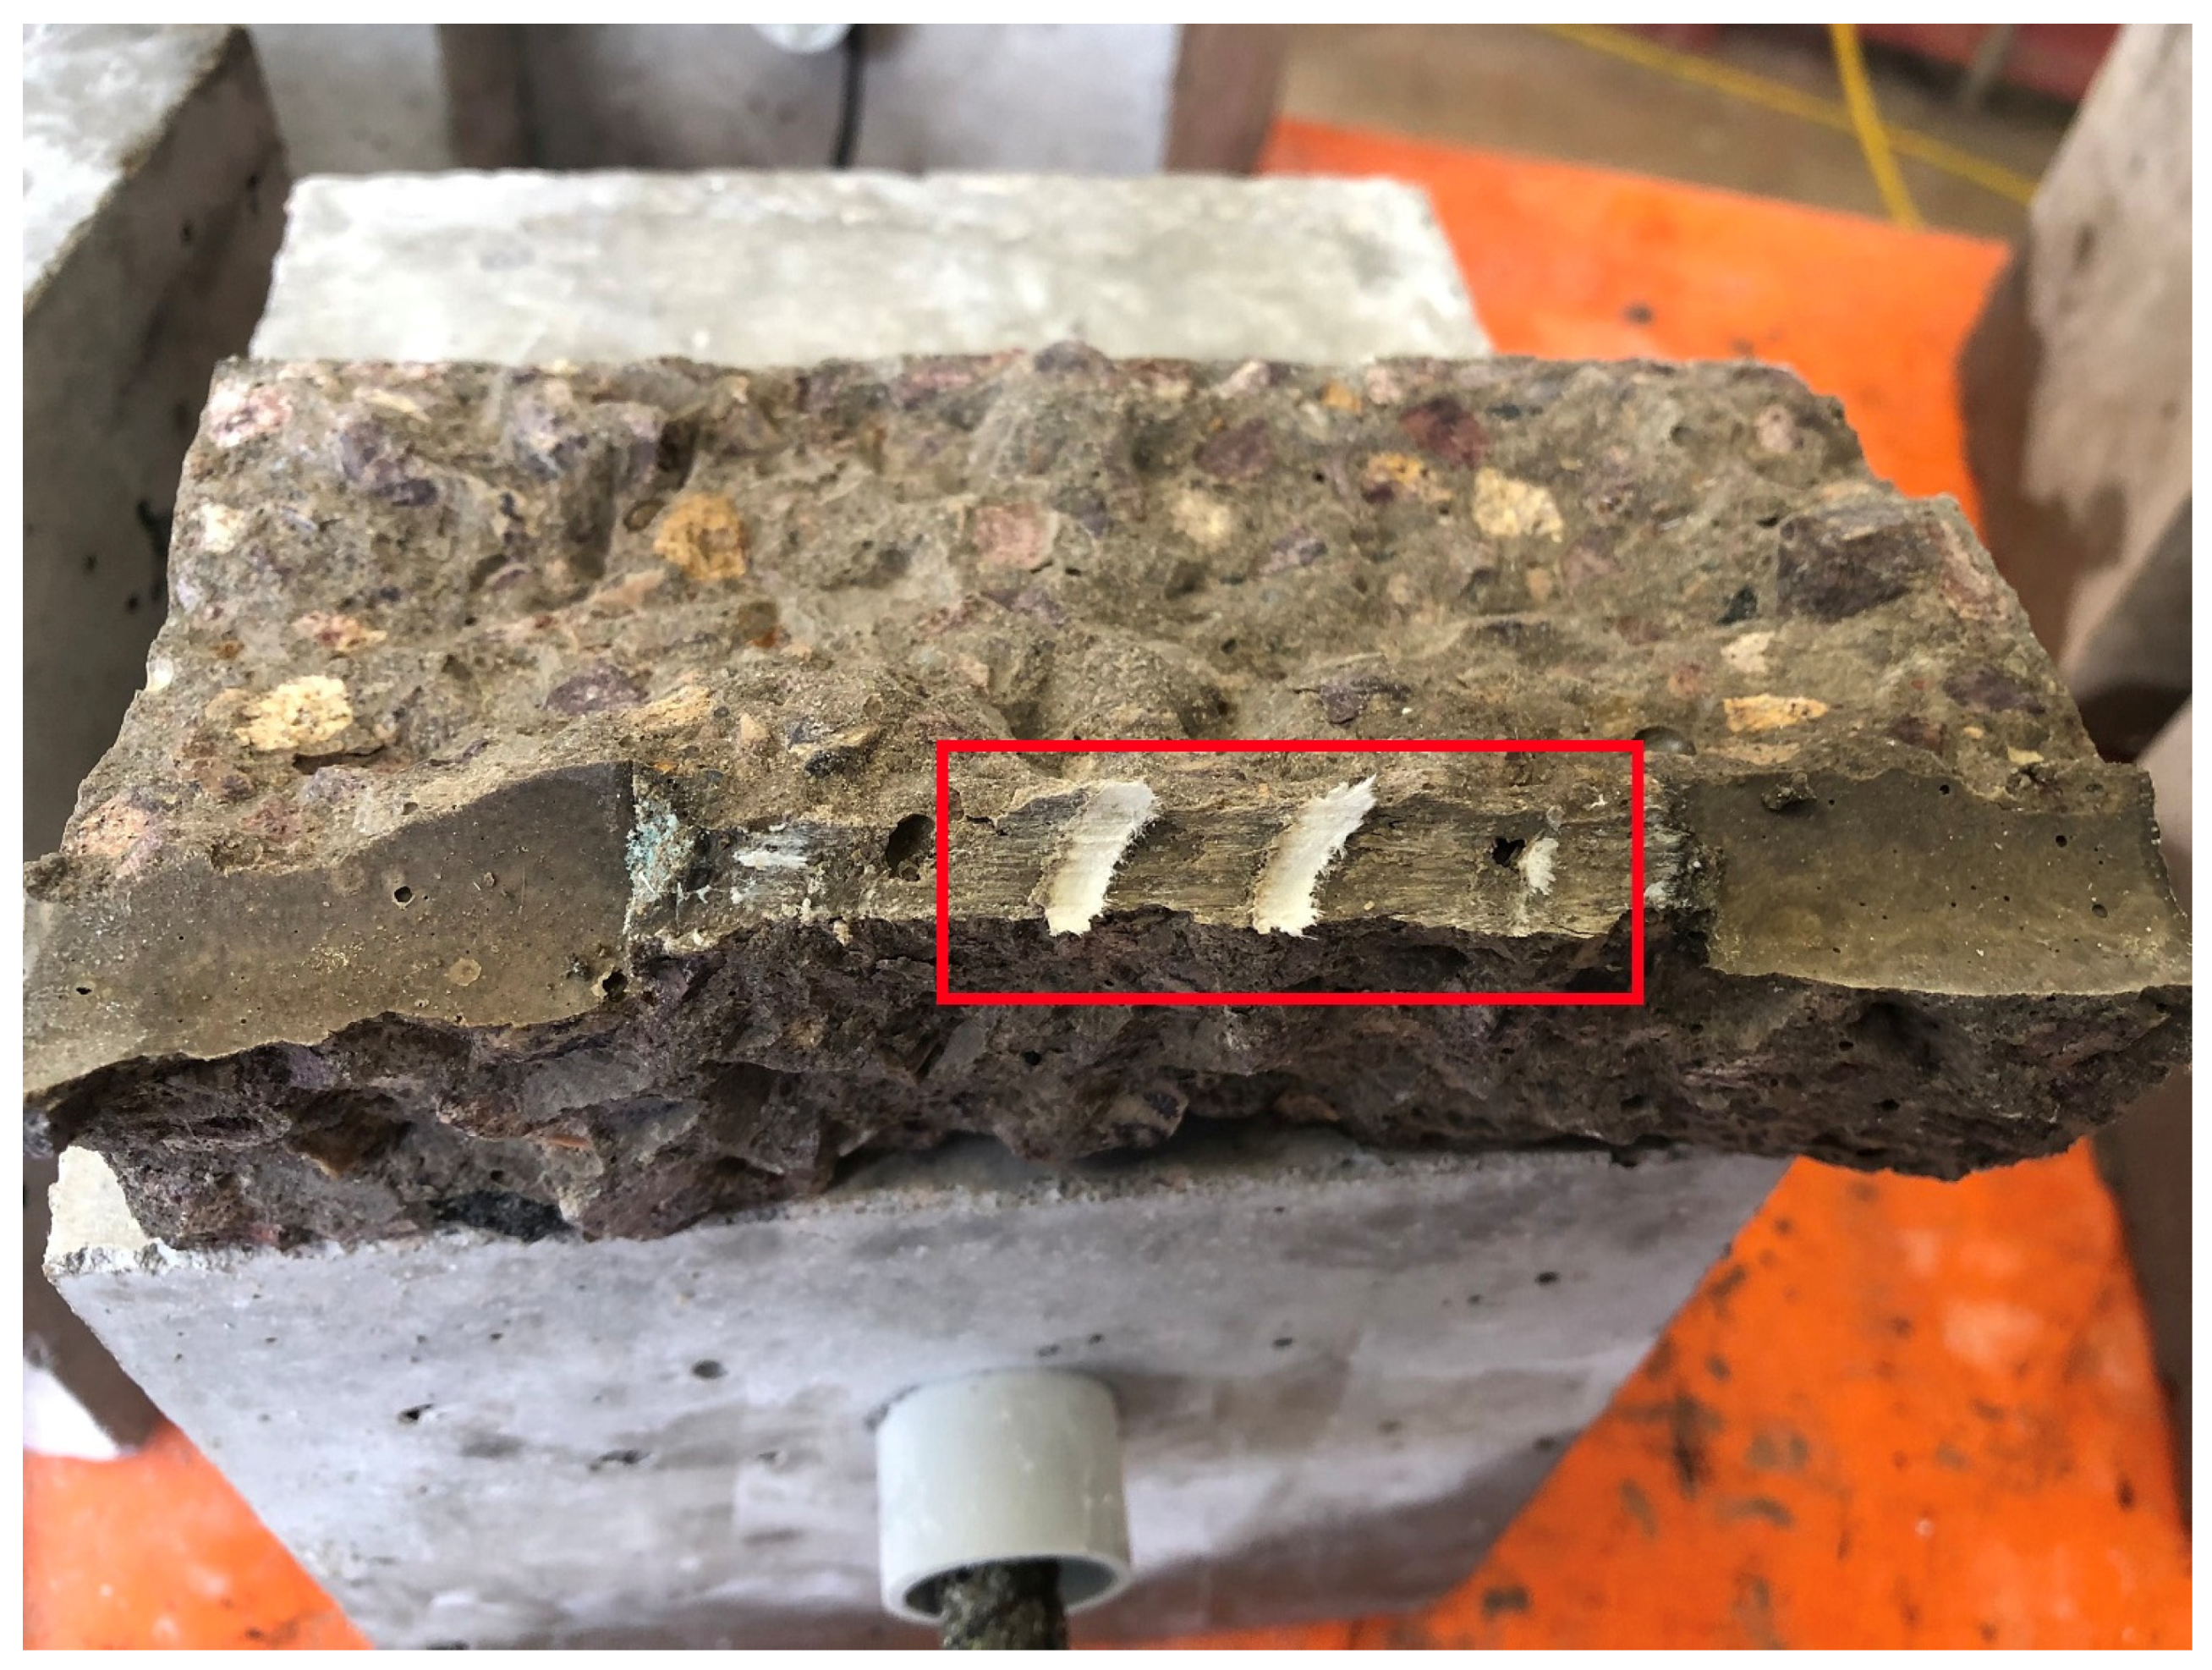
Figure 8. This failure was characterised by a sharp release of energy in the form of a sudden blast of the concrete body in the vicinity of the rebar. This failure occurred very quickly, and this sudden loss of surface contact led to the stress concentration reaching the maximum bond strength. Any gradual slippage or slow crack propagation did not accompany the suddenness of the concrete fracture. The forensic observation of the interfacial bonding area of the failed specimens confirmed the role of ribs in resisting the slip, where the ribbed pattern was a clear artefact in the fractured concrete matrix, as evidenced in
Figure 9.
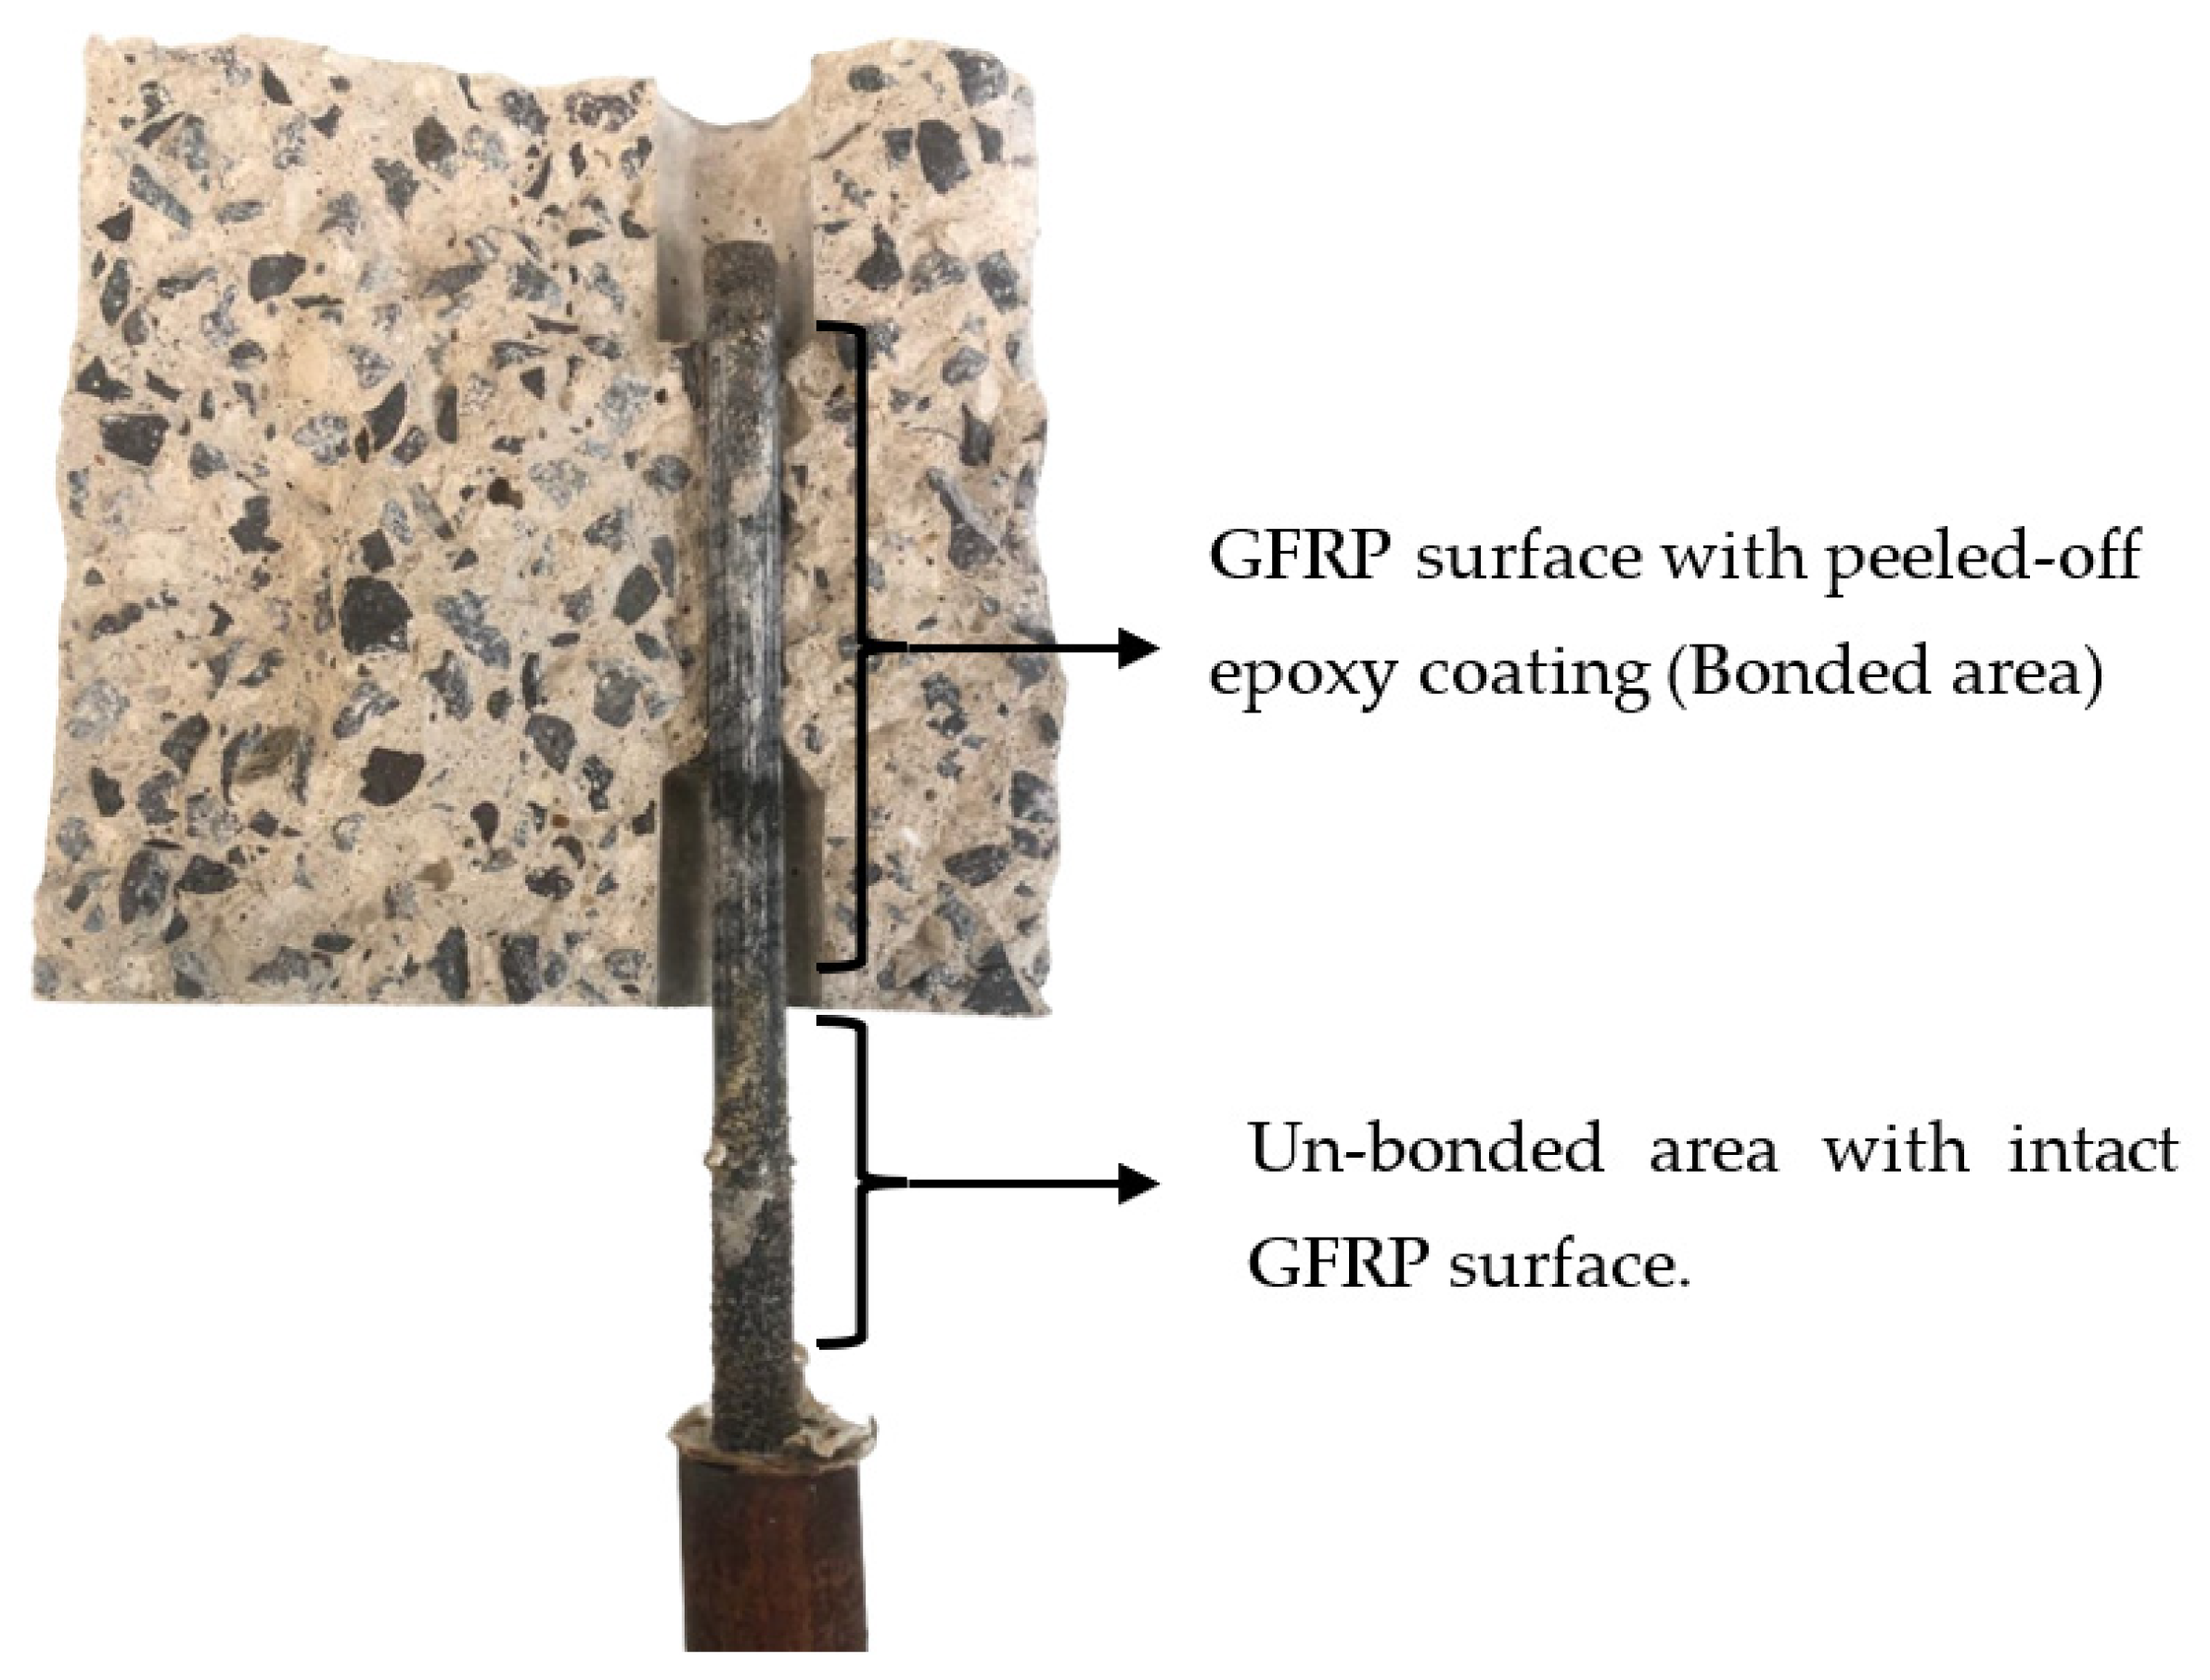
The pull-out tests with GFRP sand-coated rebar mostly experienced failure mode characterised by the slippage of the rebars. In contrast to the sharp blast failure of ribbed rebar specimens, the sand-coated rebar specimens displayed a softer failure where gradual slippage of the bar was observed until complete failure.
Figure 10 shows the failed state of a test sample with sand-coated rebar, i.e., sand-coated bar in a cross-sectioned specimen. It is evident that the slipped area is characterised by the peeling of the originally epoxy-bonded sand coating around the rebar.
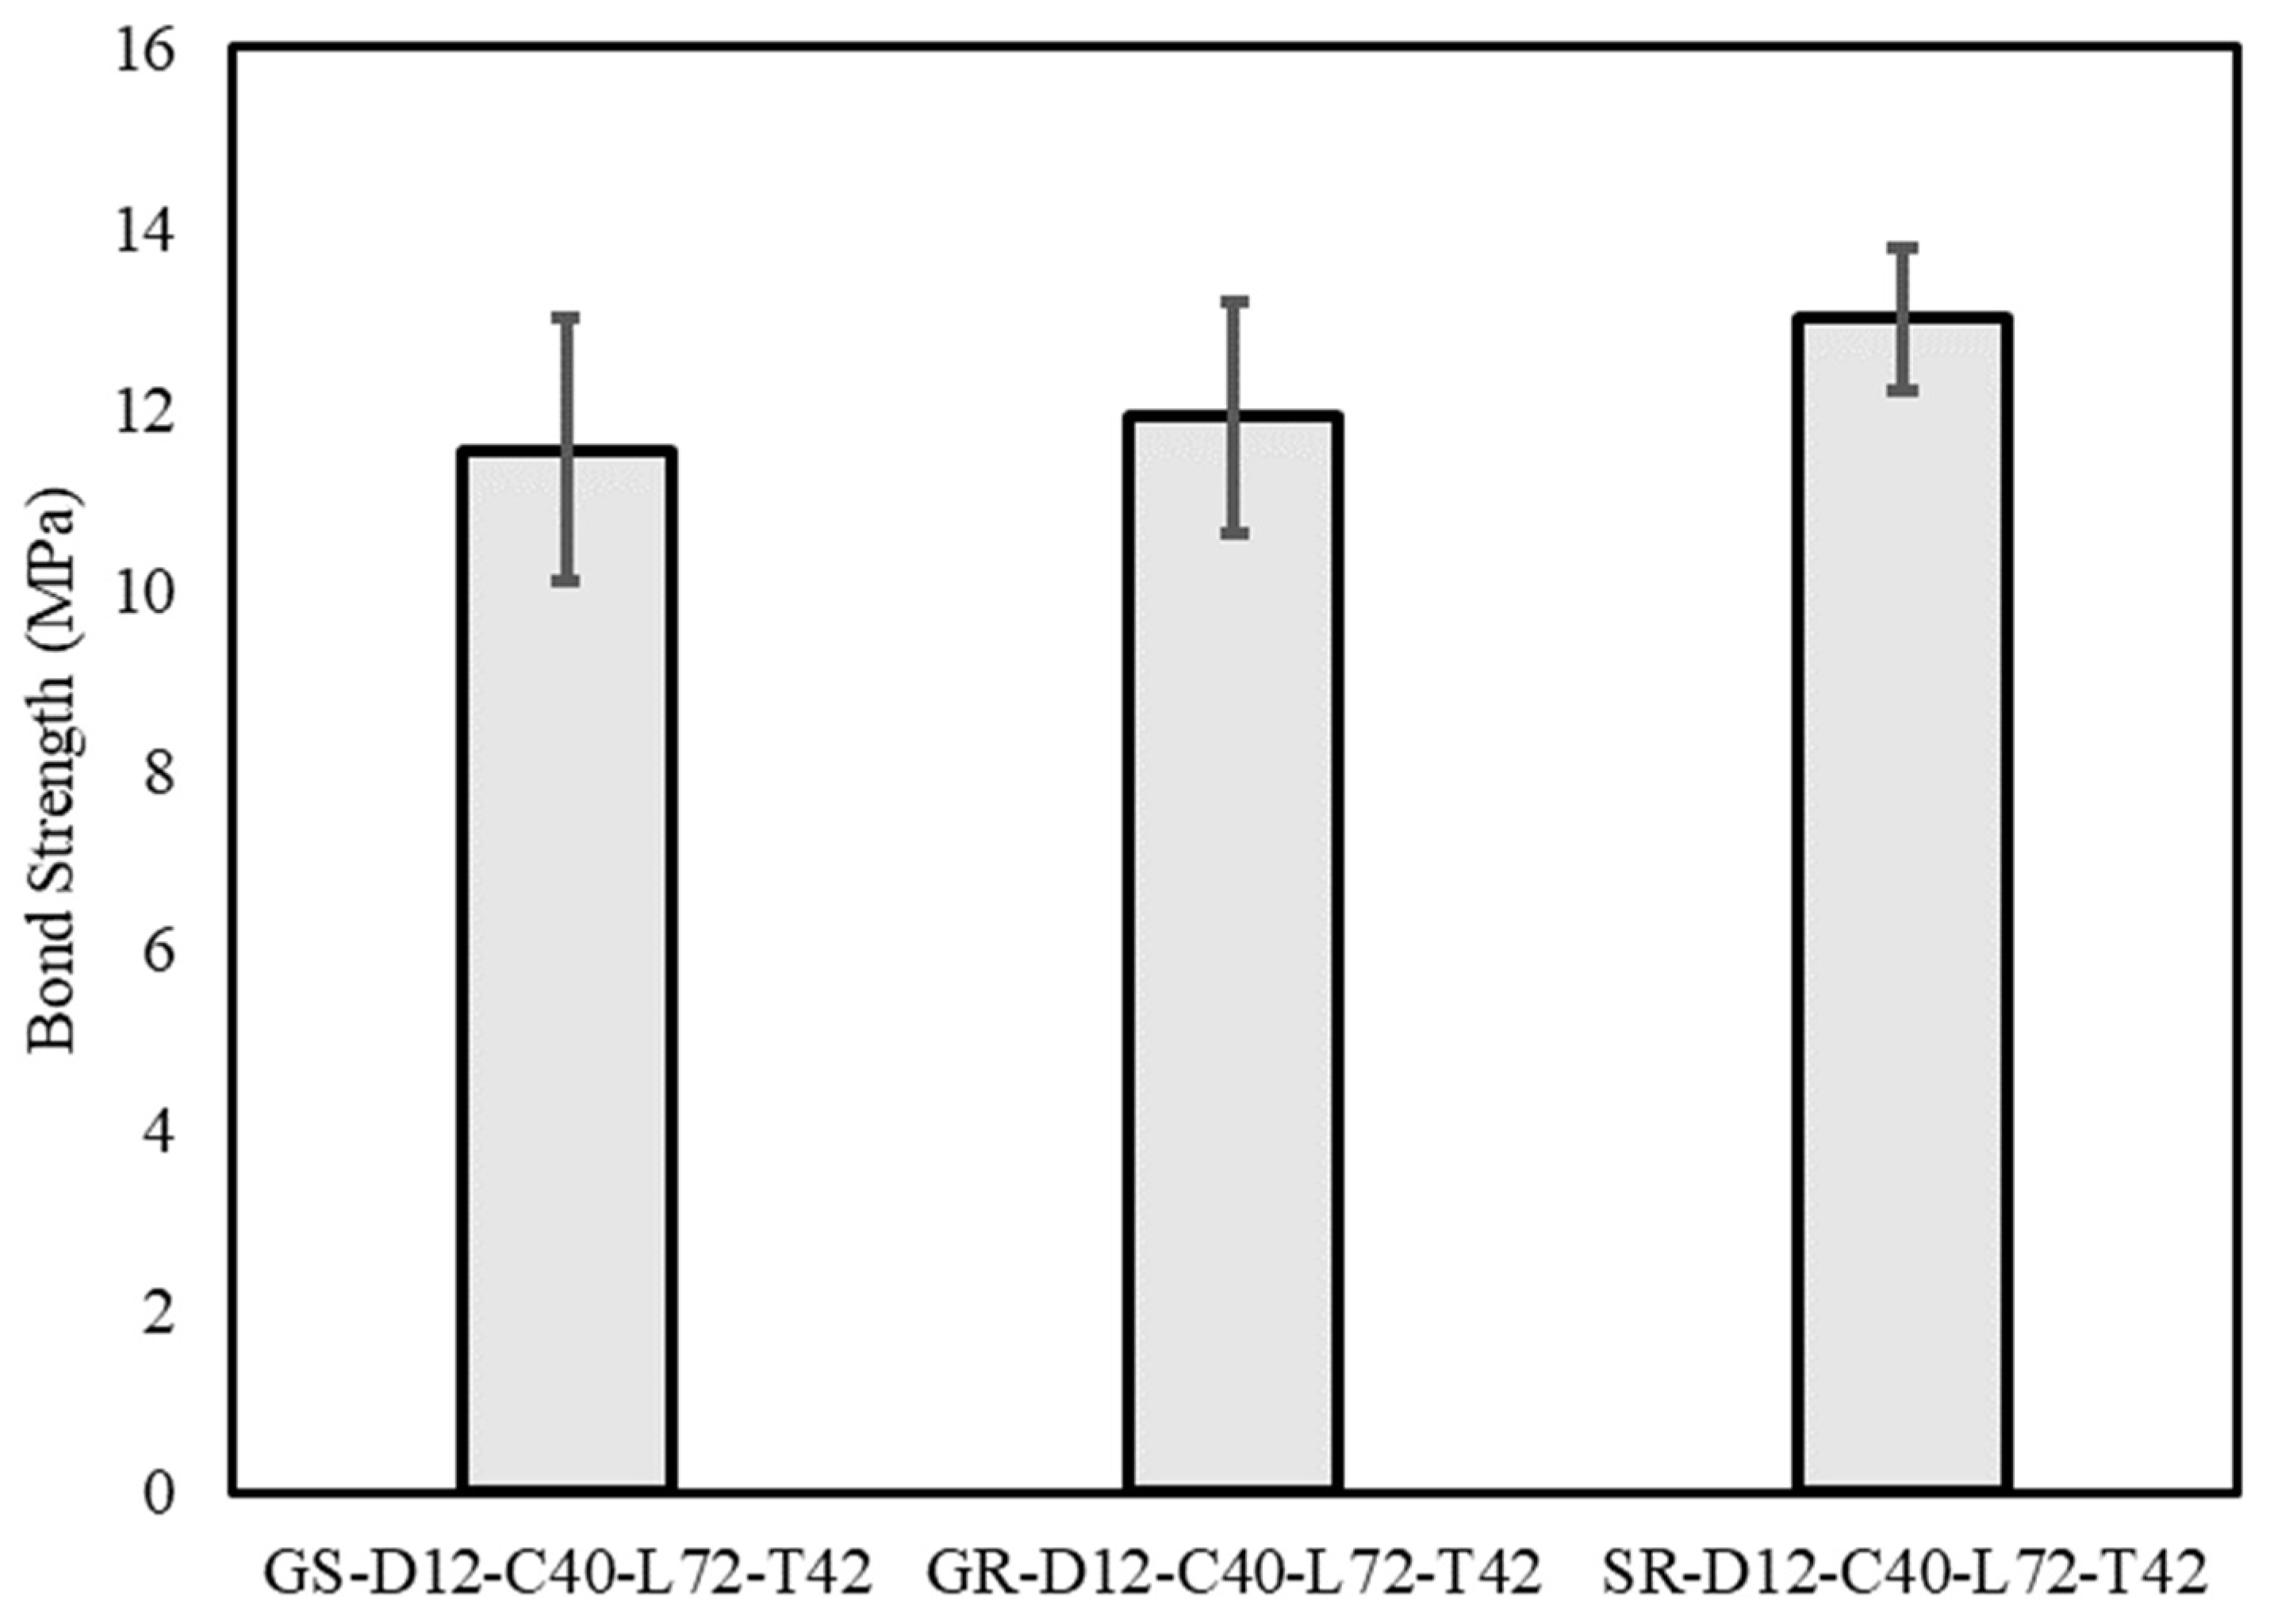
The maximum average bond strength computed for sand-coated GFRP, ribbed GFRP, and ribbed steel rebars is, respectively, 11.5 0.6 MPa, 11.9 0.5 MPa and 13.0 0.3 MPa. The bond strength differences between GFPRs and steel are small and not statistically significant.
3.2. Bond Failure Modes
The failure modes of the reinforcement bar in the concrete matrix are generally governed by the chemical adhesion and mechanical resistance developed by the rebars and their concrete encasement. The bond strength is therefore expected to be a combination of the chemical and mechanical resistance to shearing external stress. In the pull-out tests, the recorded bond stress corresponds to the greater of the chemical or mechanical interlock. After the failure of this initial capacity, the resistance that is provided by friction and the surface morphology would play a significant role.
When the surface morphology of the rebar is ribbed, the surrounding concrete offers combined resistances of chemical adhesion and mechanical interlock. Once the chemical adhesion fails, the mechanical interlocking of the ribs to the concrete takes over and governs the bond strength. The ribbed bars samples also exhibited increased pull-out strength post-chemical bond failure. The increase in the pull-out resistance incurs stresses to the concrete surrounding the rebar, in particular tensile stresses, that eventually result in splitting failures of the concrete once its tensile strength is exceeded.
In sand-coated rebars, the mechanical resistance depends on the interaction of the epoxied sand coating with the concrete and the behaviour of the coating to the core of the rebar. The sand coating, therefore, acts as the primary element of mechanical resistance. The failure of sand-coated rebars was initiated by the loss of bond to the surrounding concrete. It was followed by the adhesion failure of the coating and the rebar core, leading to large slippage.
Figure 11 shows the surface morphology of the ribbed and sand-coated GFRP bar observed through a scanning electron microscopical (SEM) study. The sand coat has a thickness of about 400 µm. The evidence from the failure modes suggests that sand-coated bars failed due to slipping through mostly because the sand coat is responsible for the loss of mechanical gripping. The shear strength of the sand coats, therefore, is lower than the concrete strength since the surroundings effectively withstood the stress at failure.
3.3. Bond Stress to Slip Behaviour
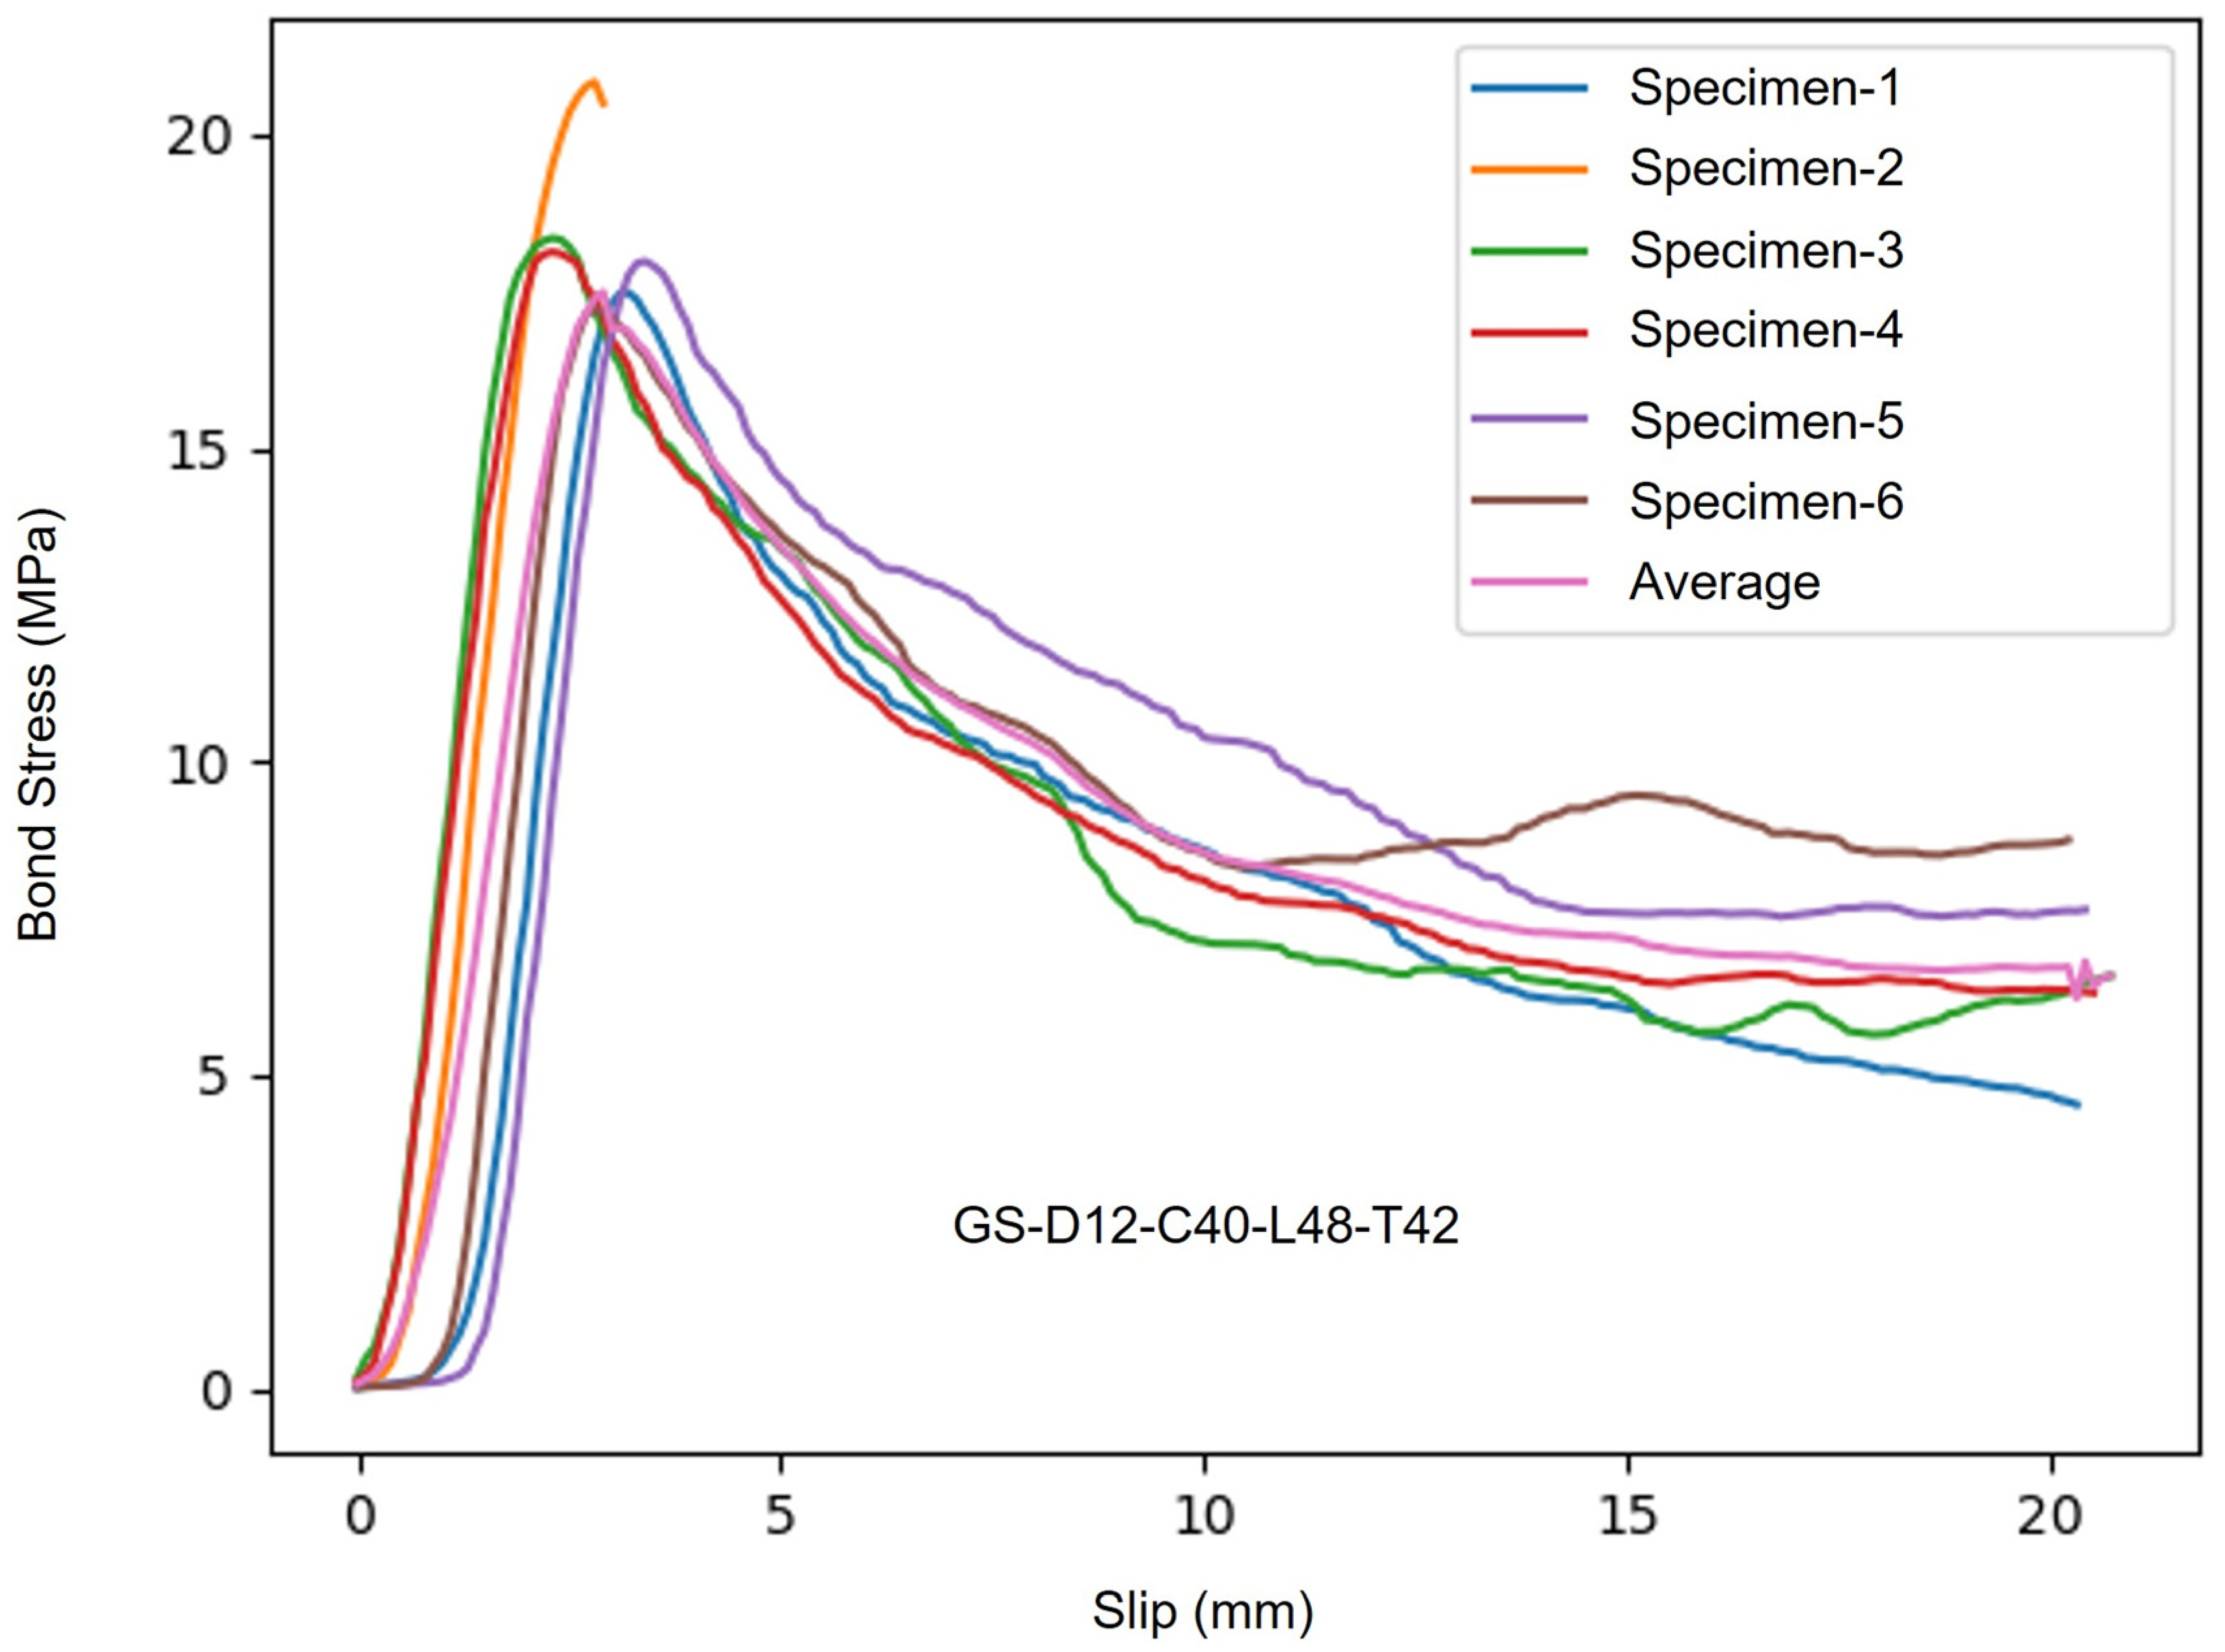
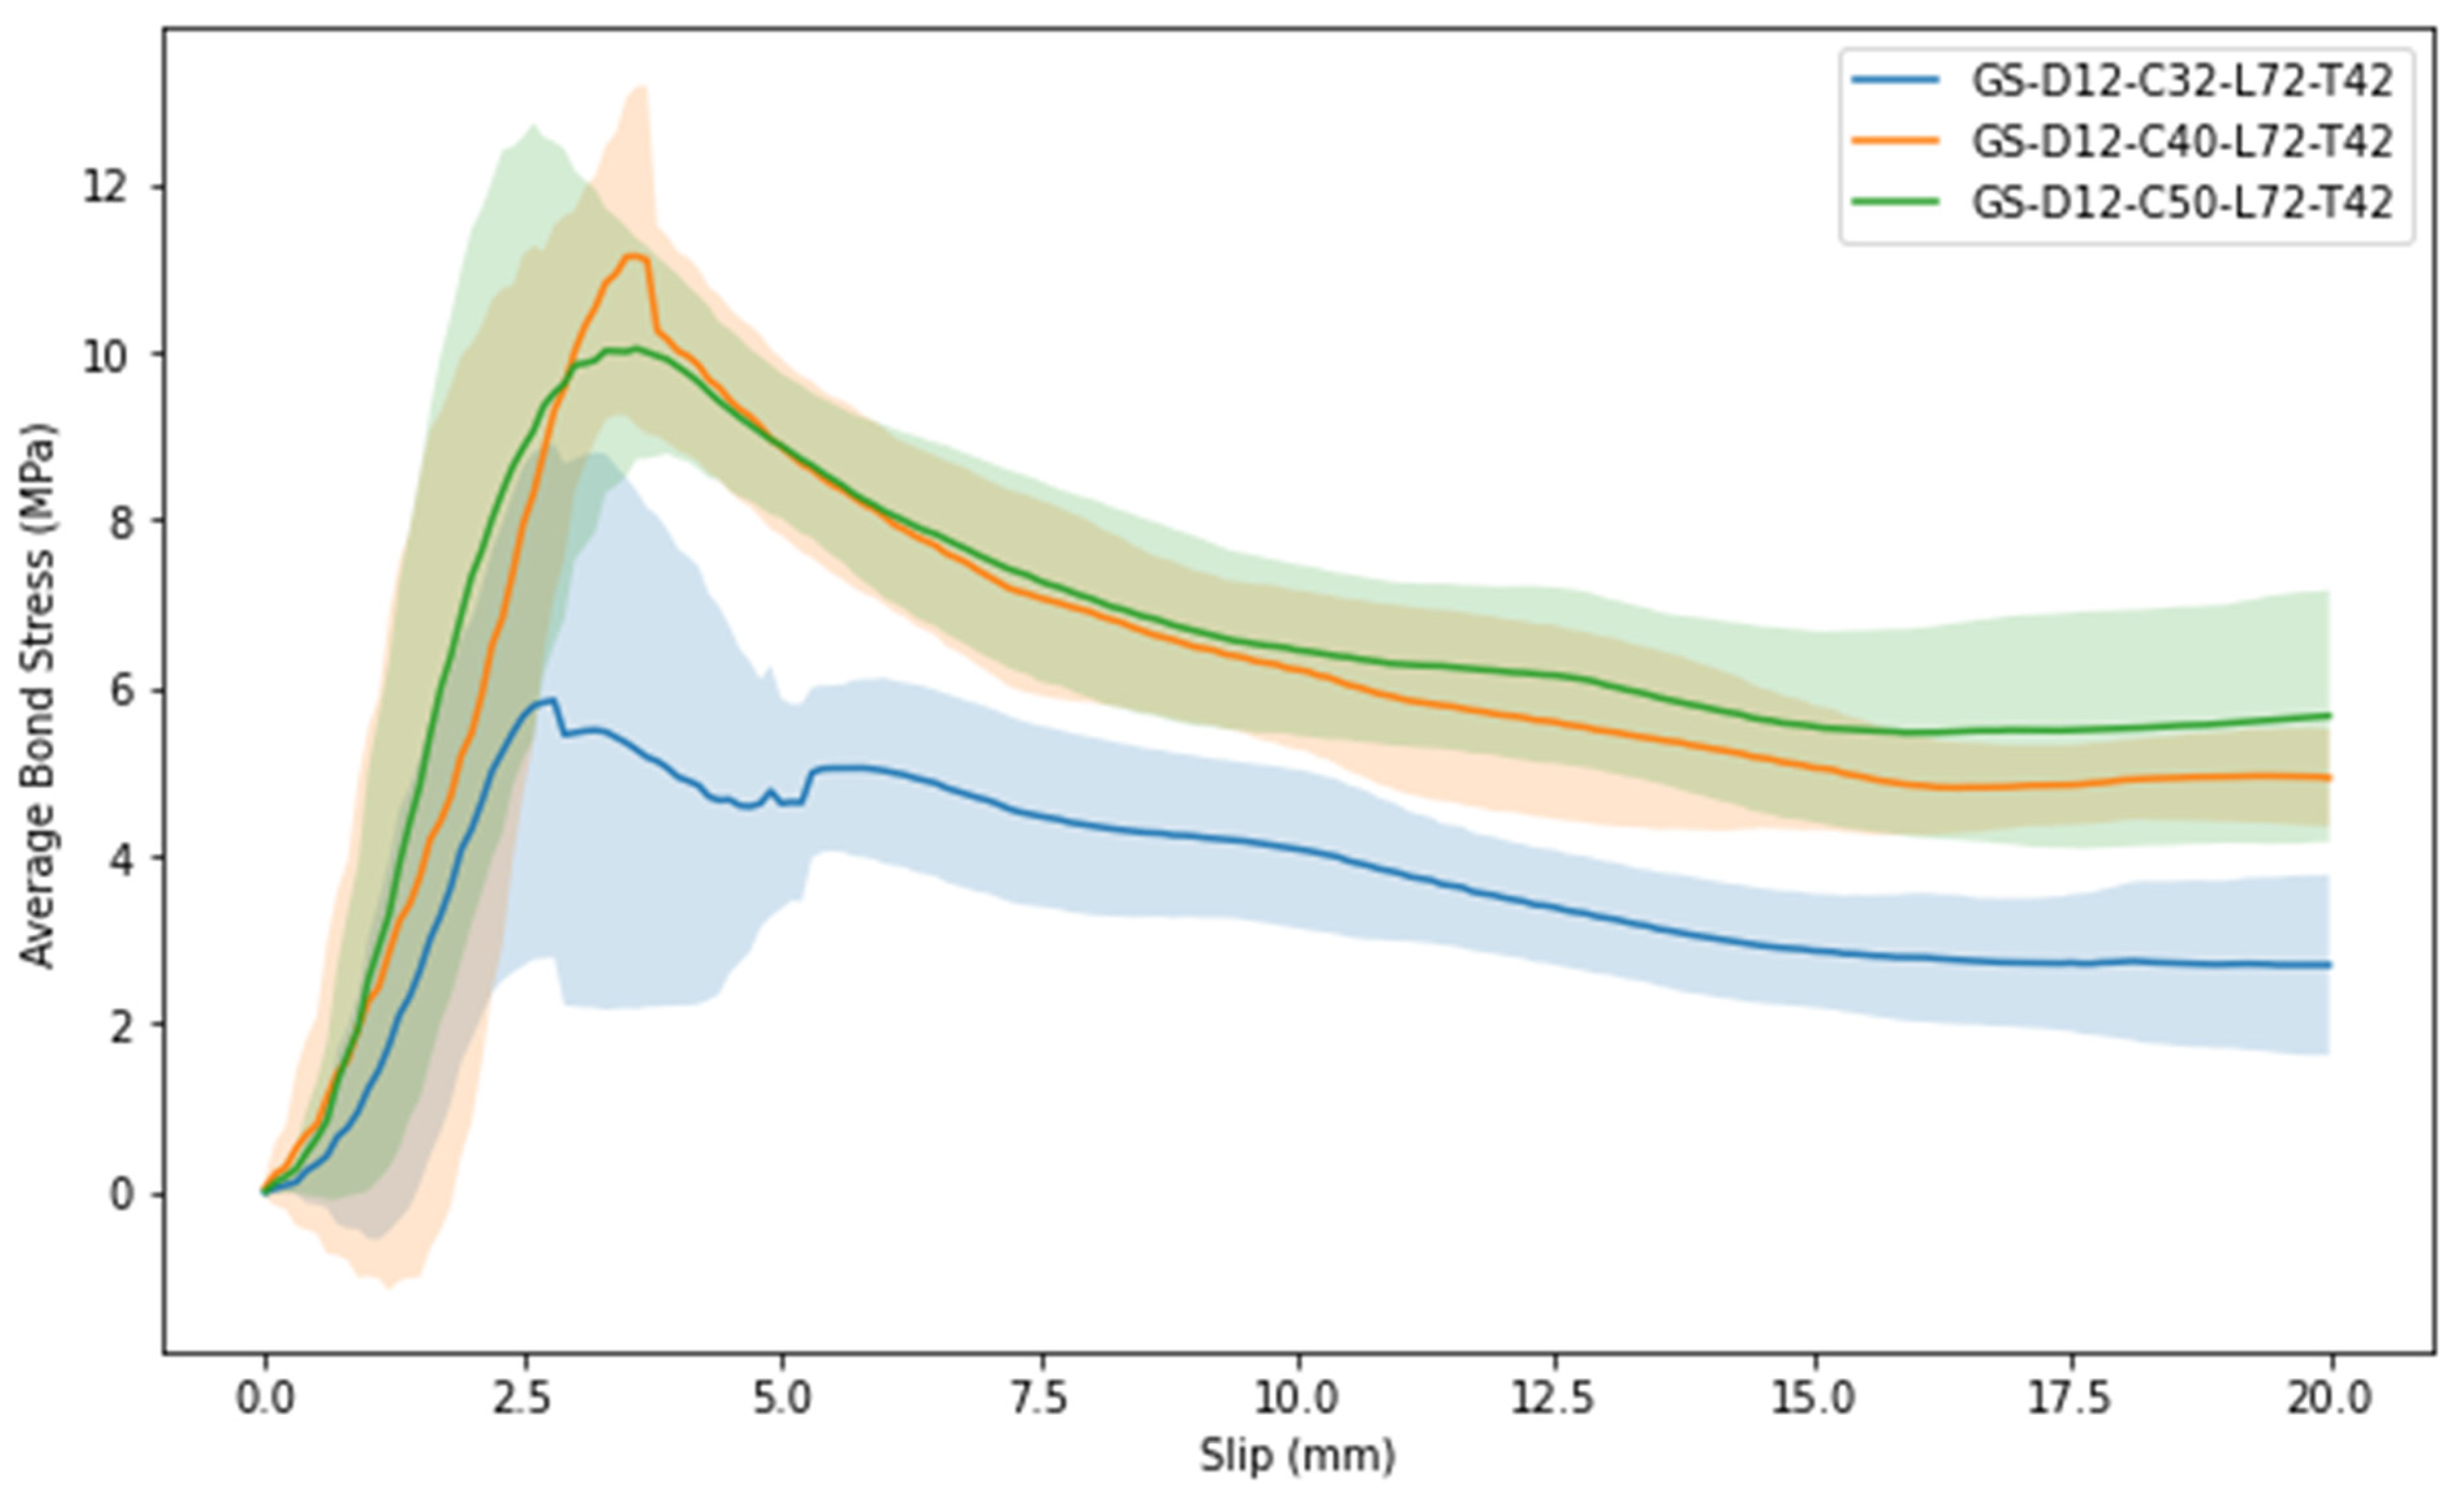
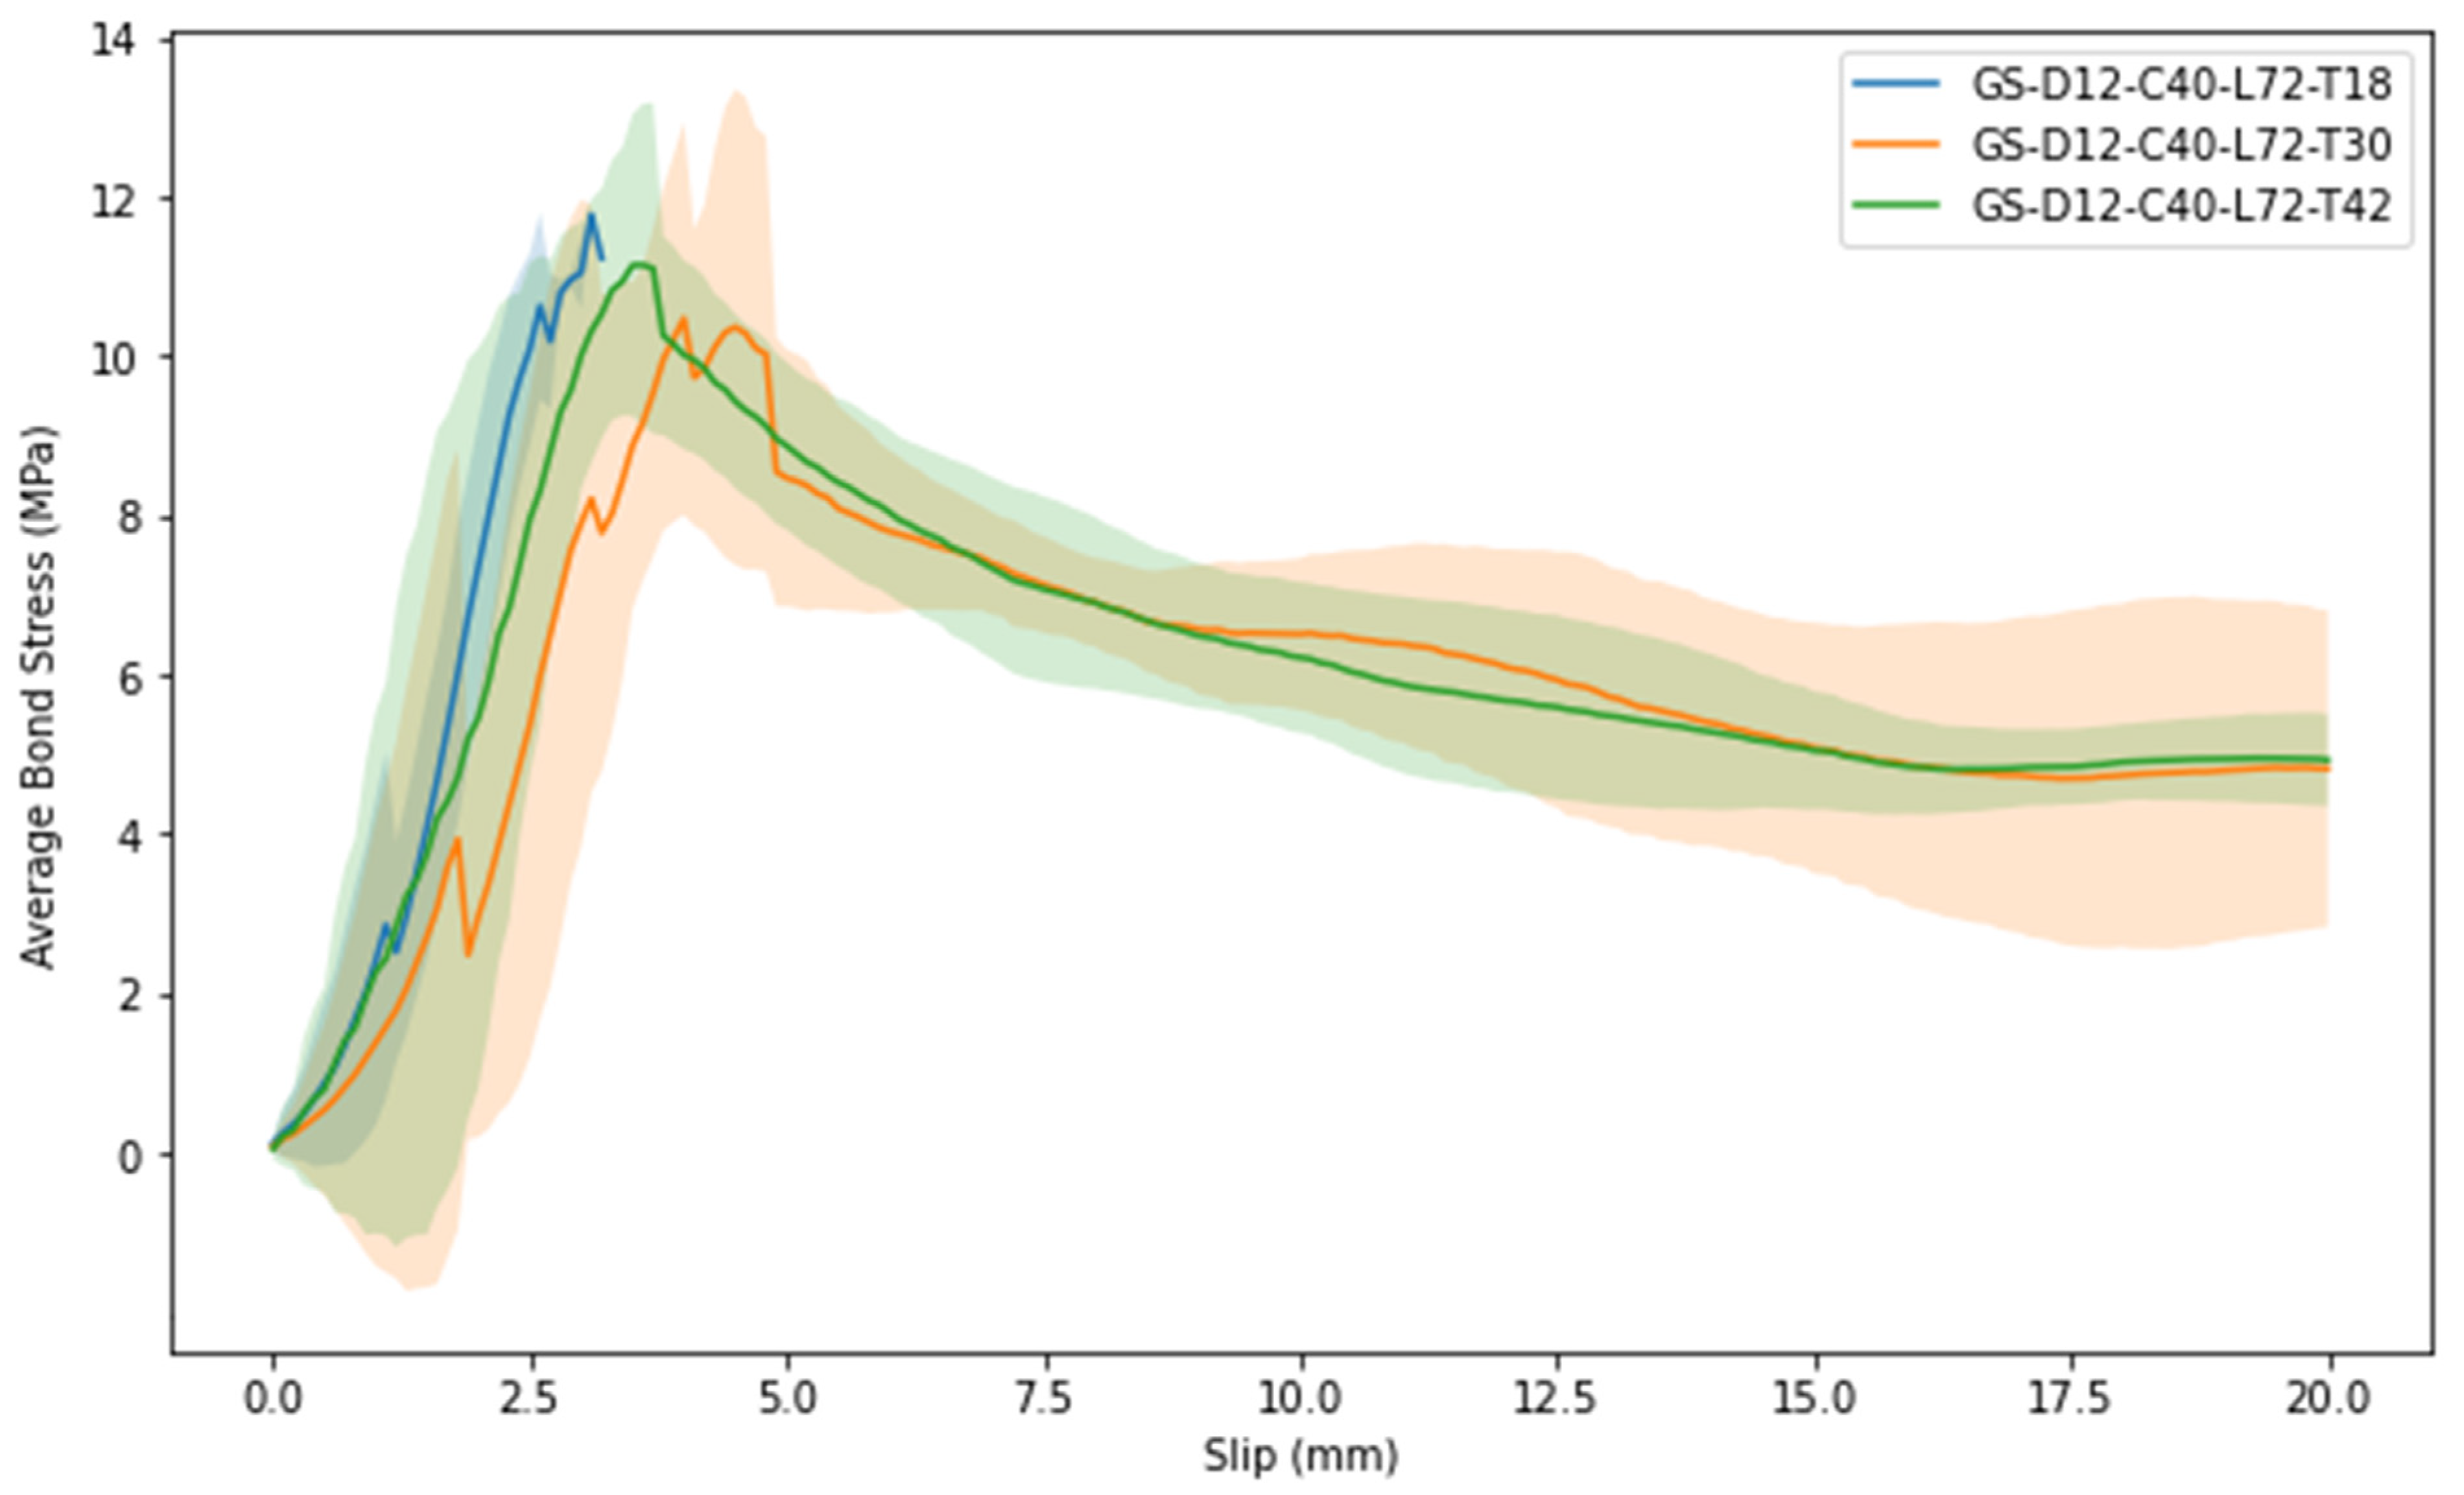
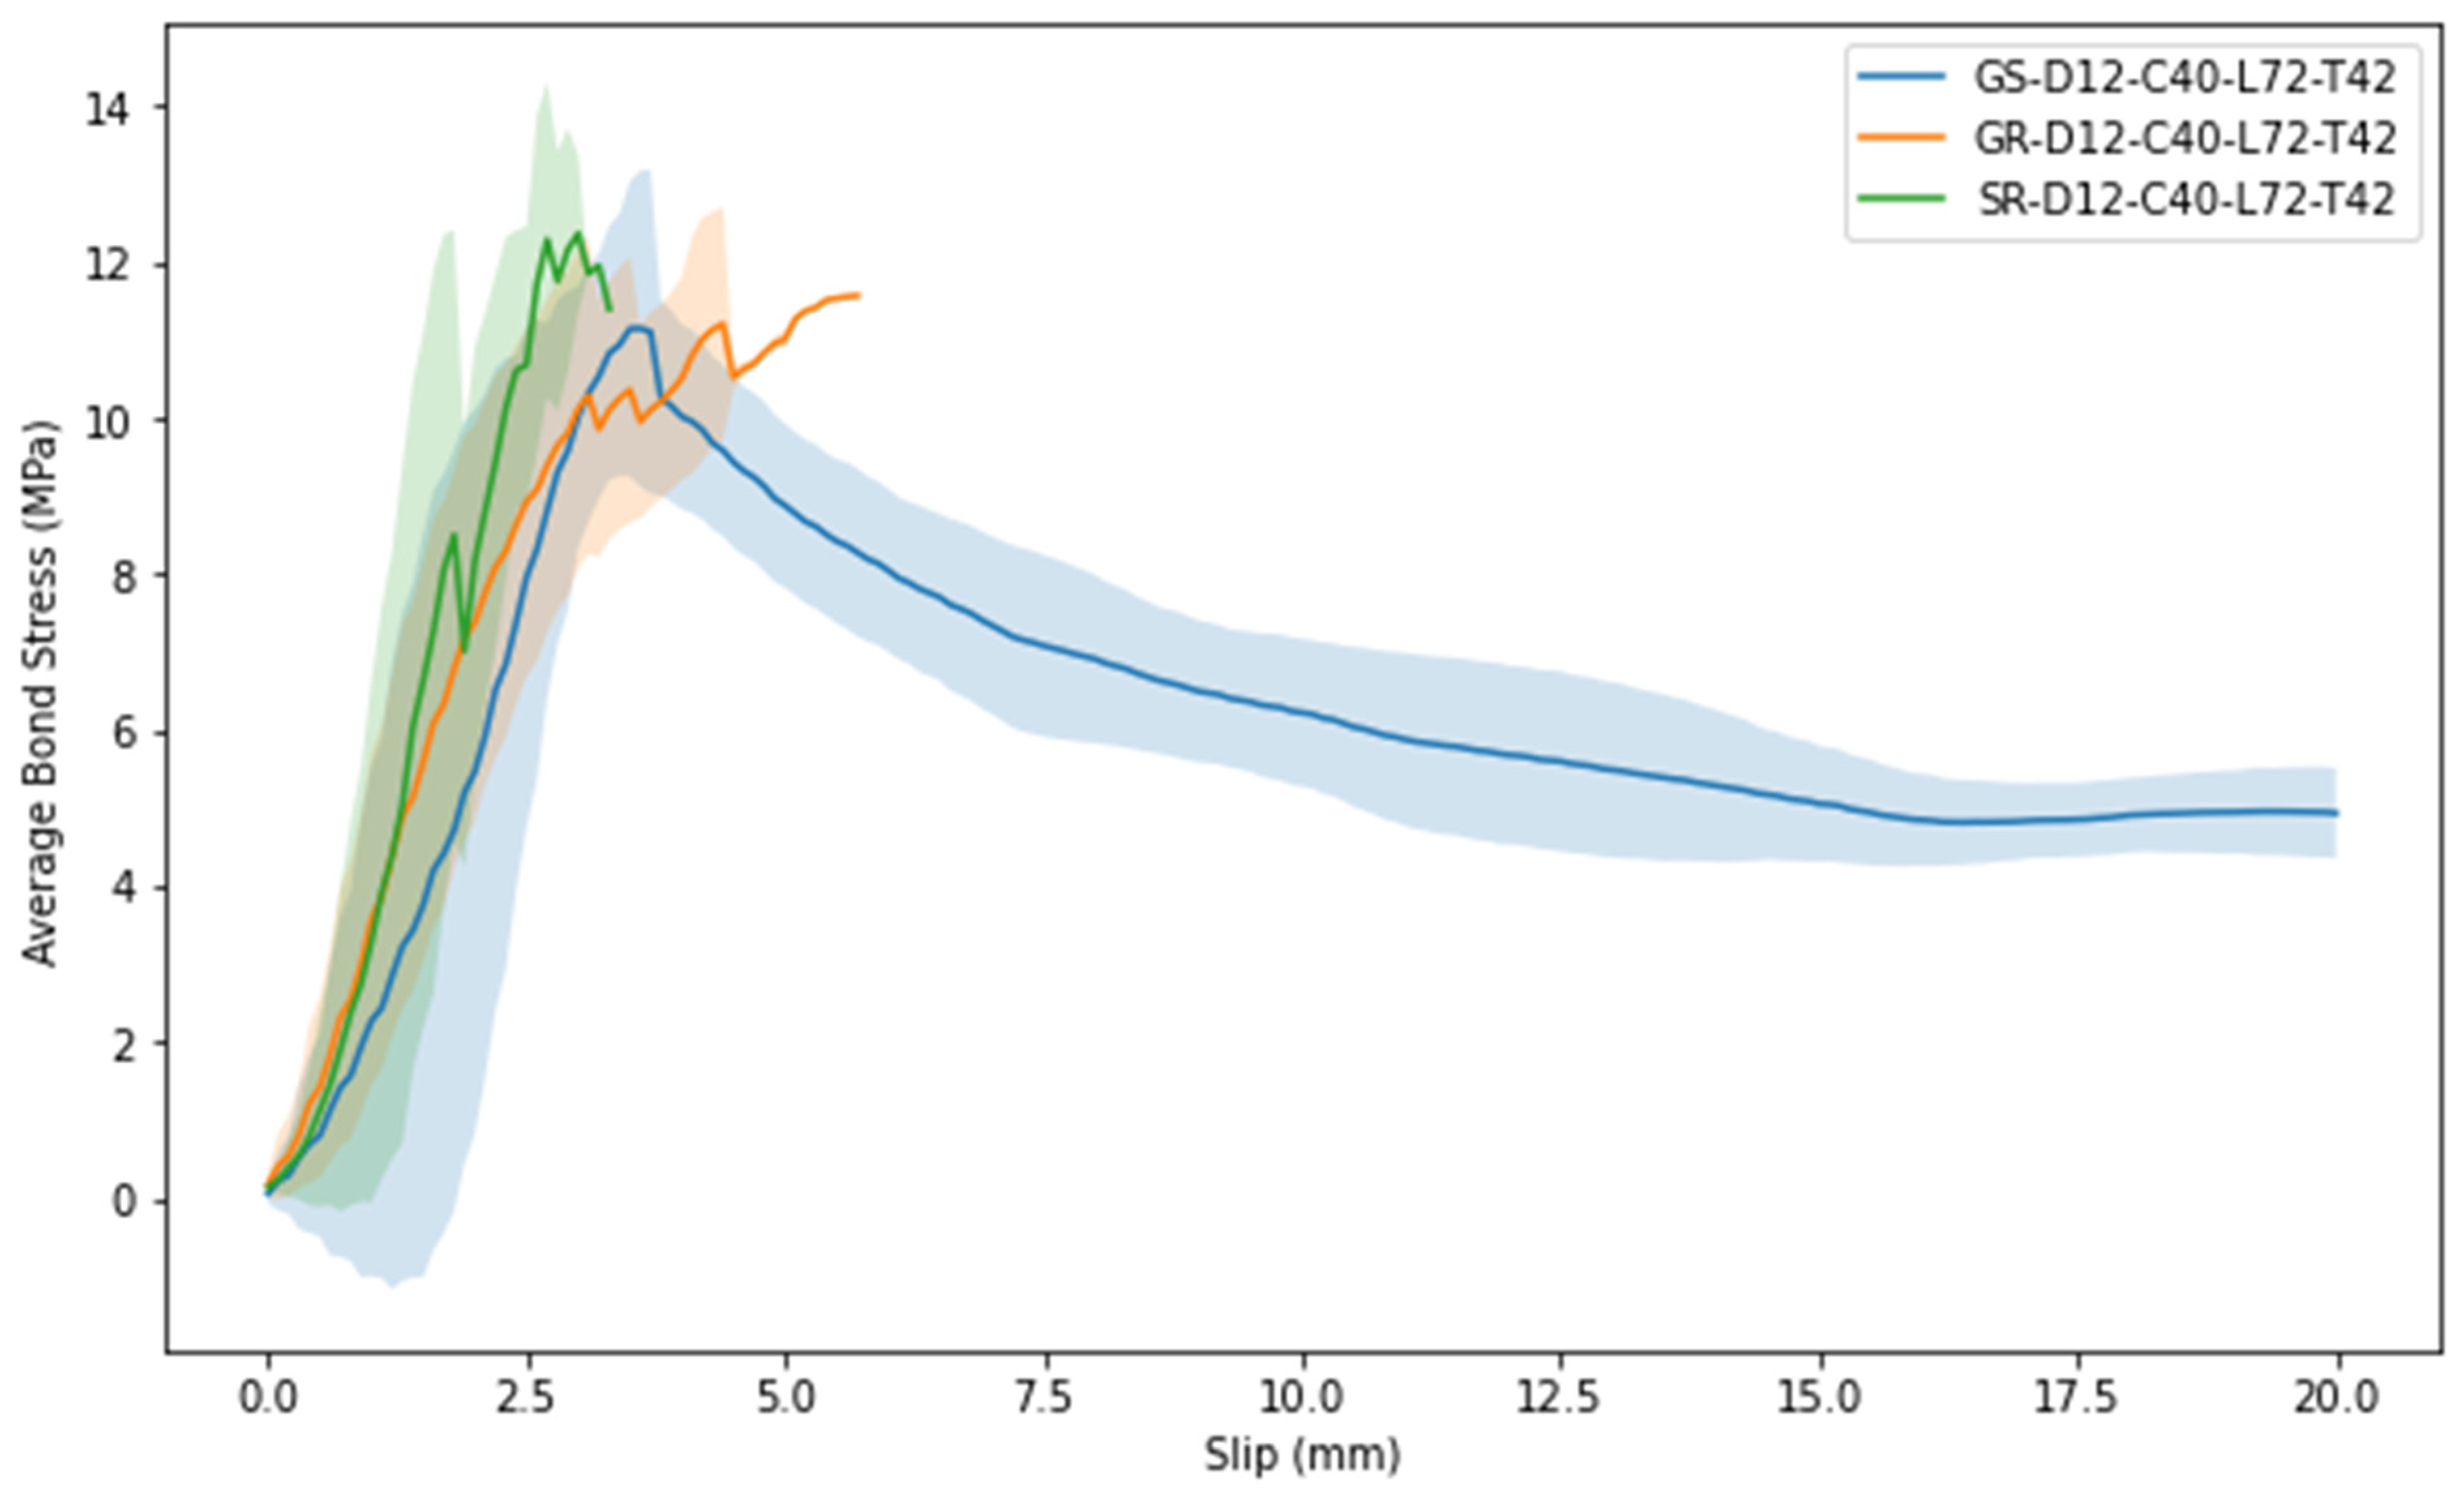
The analysis of the bond-slip mechanics is conducted to evaluate the energy absorbed for the failure of rebars. The curves were generated by averaging raw data from six test replications, as shown in
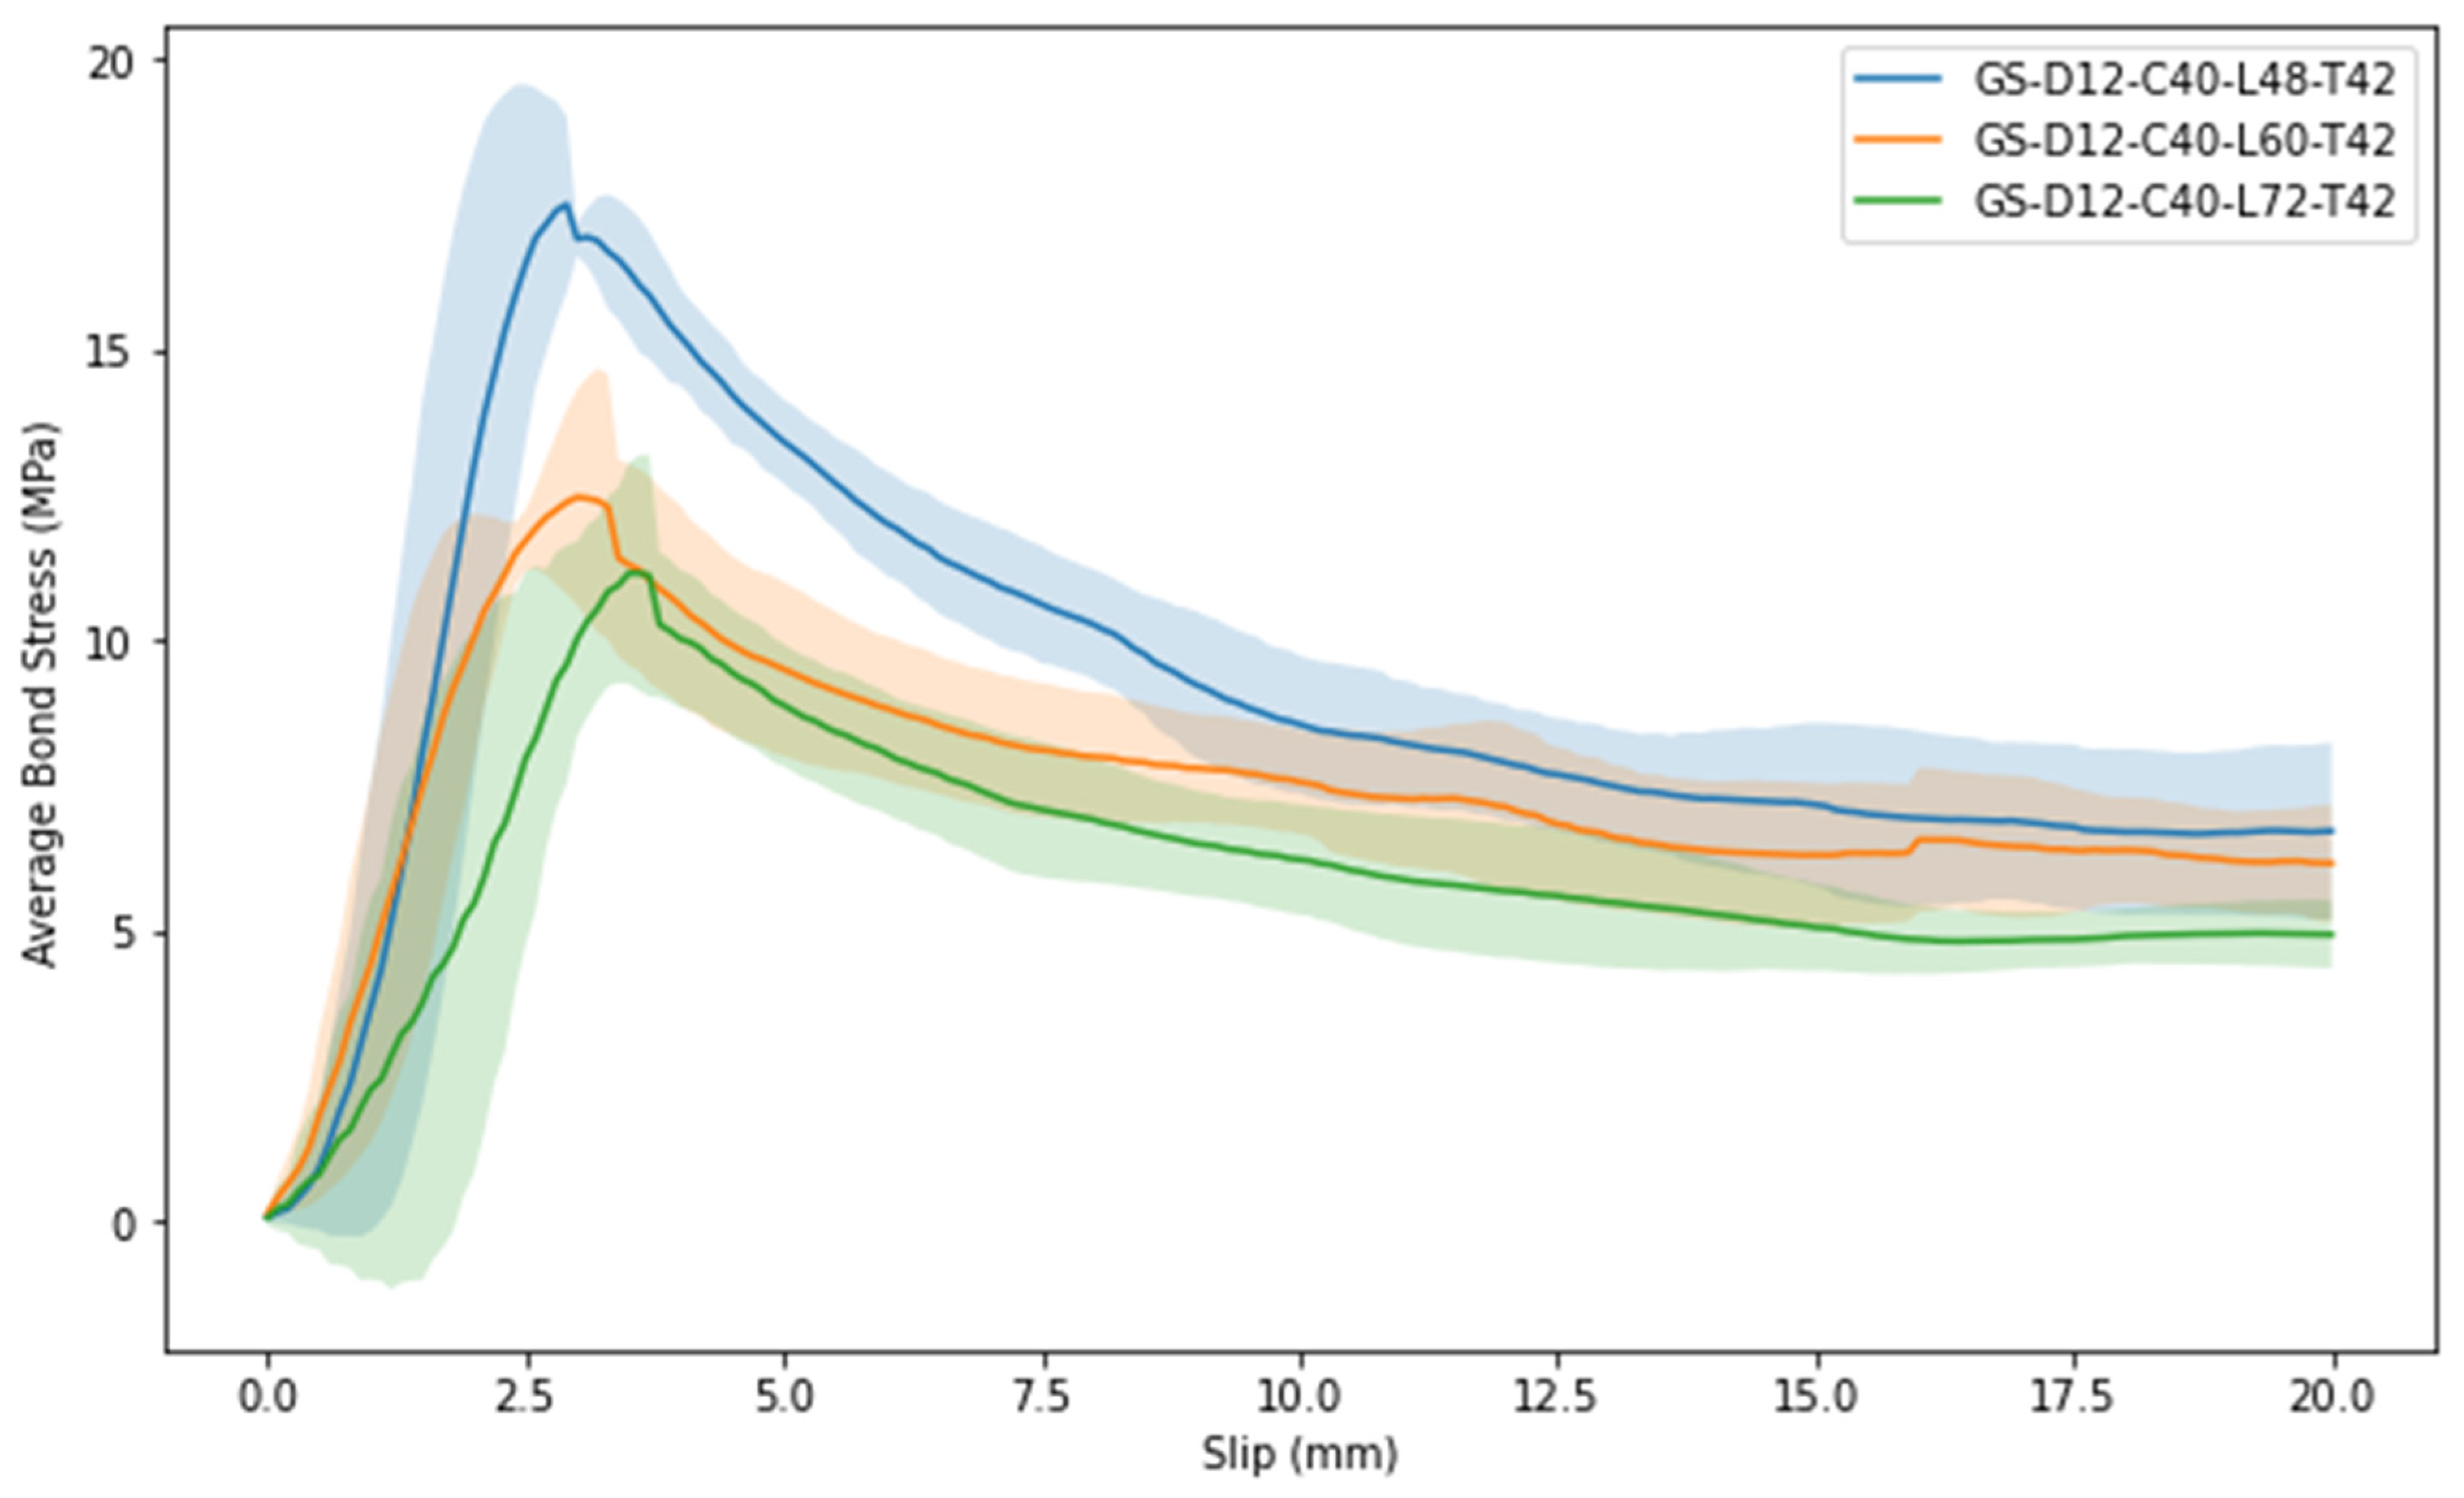
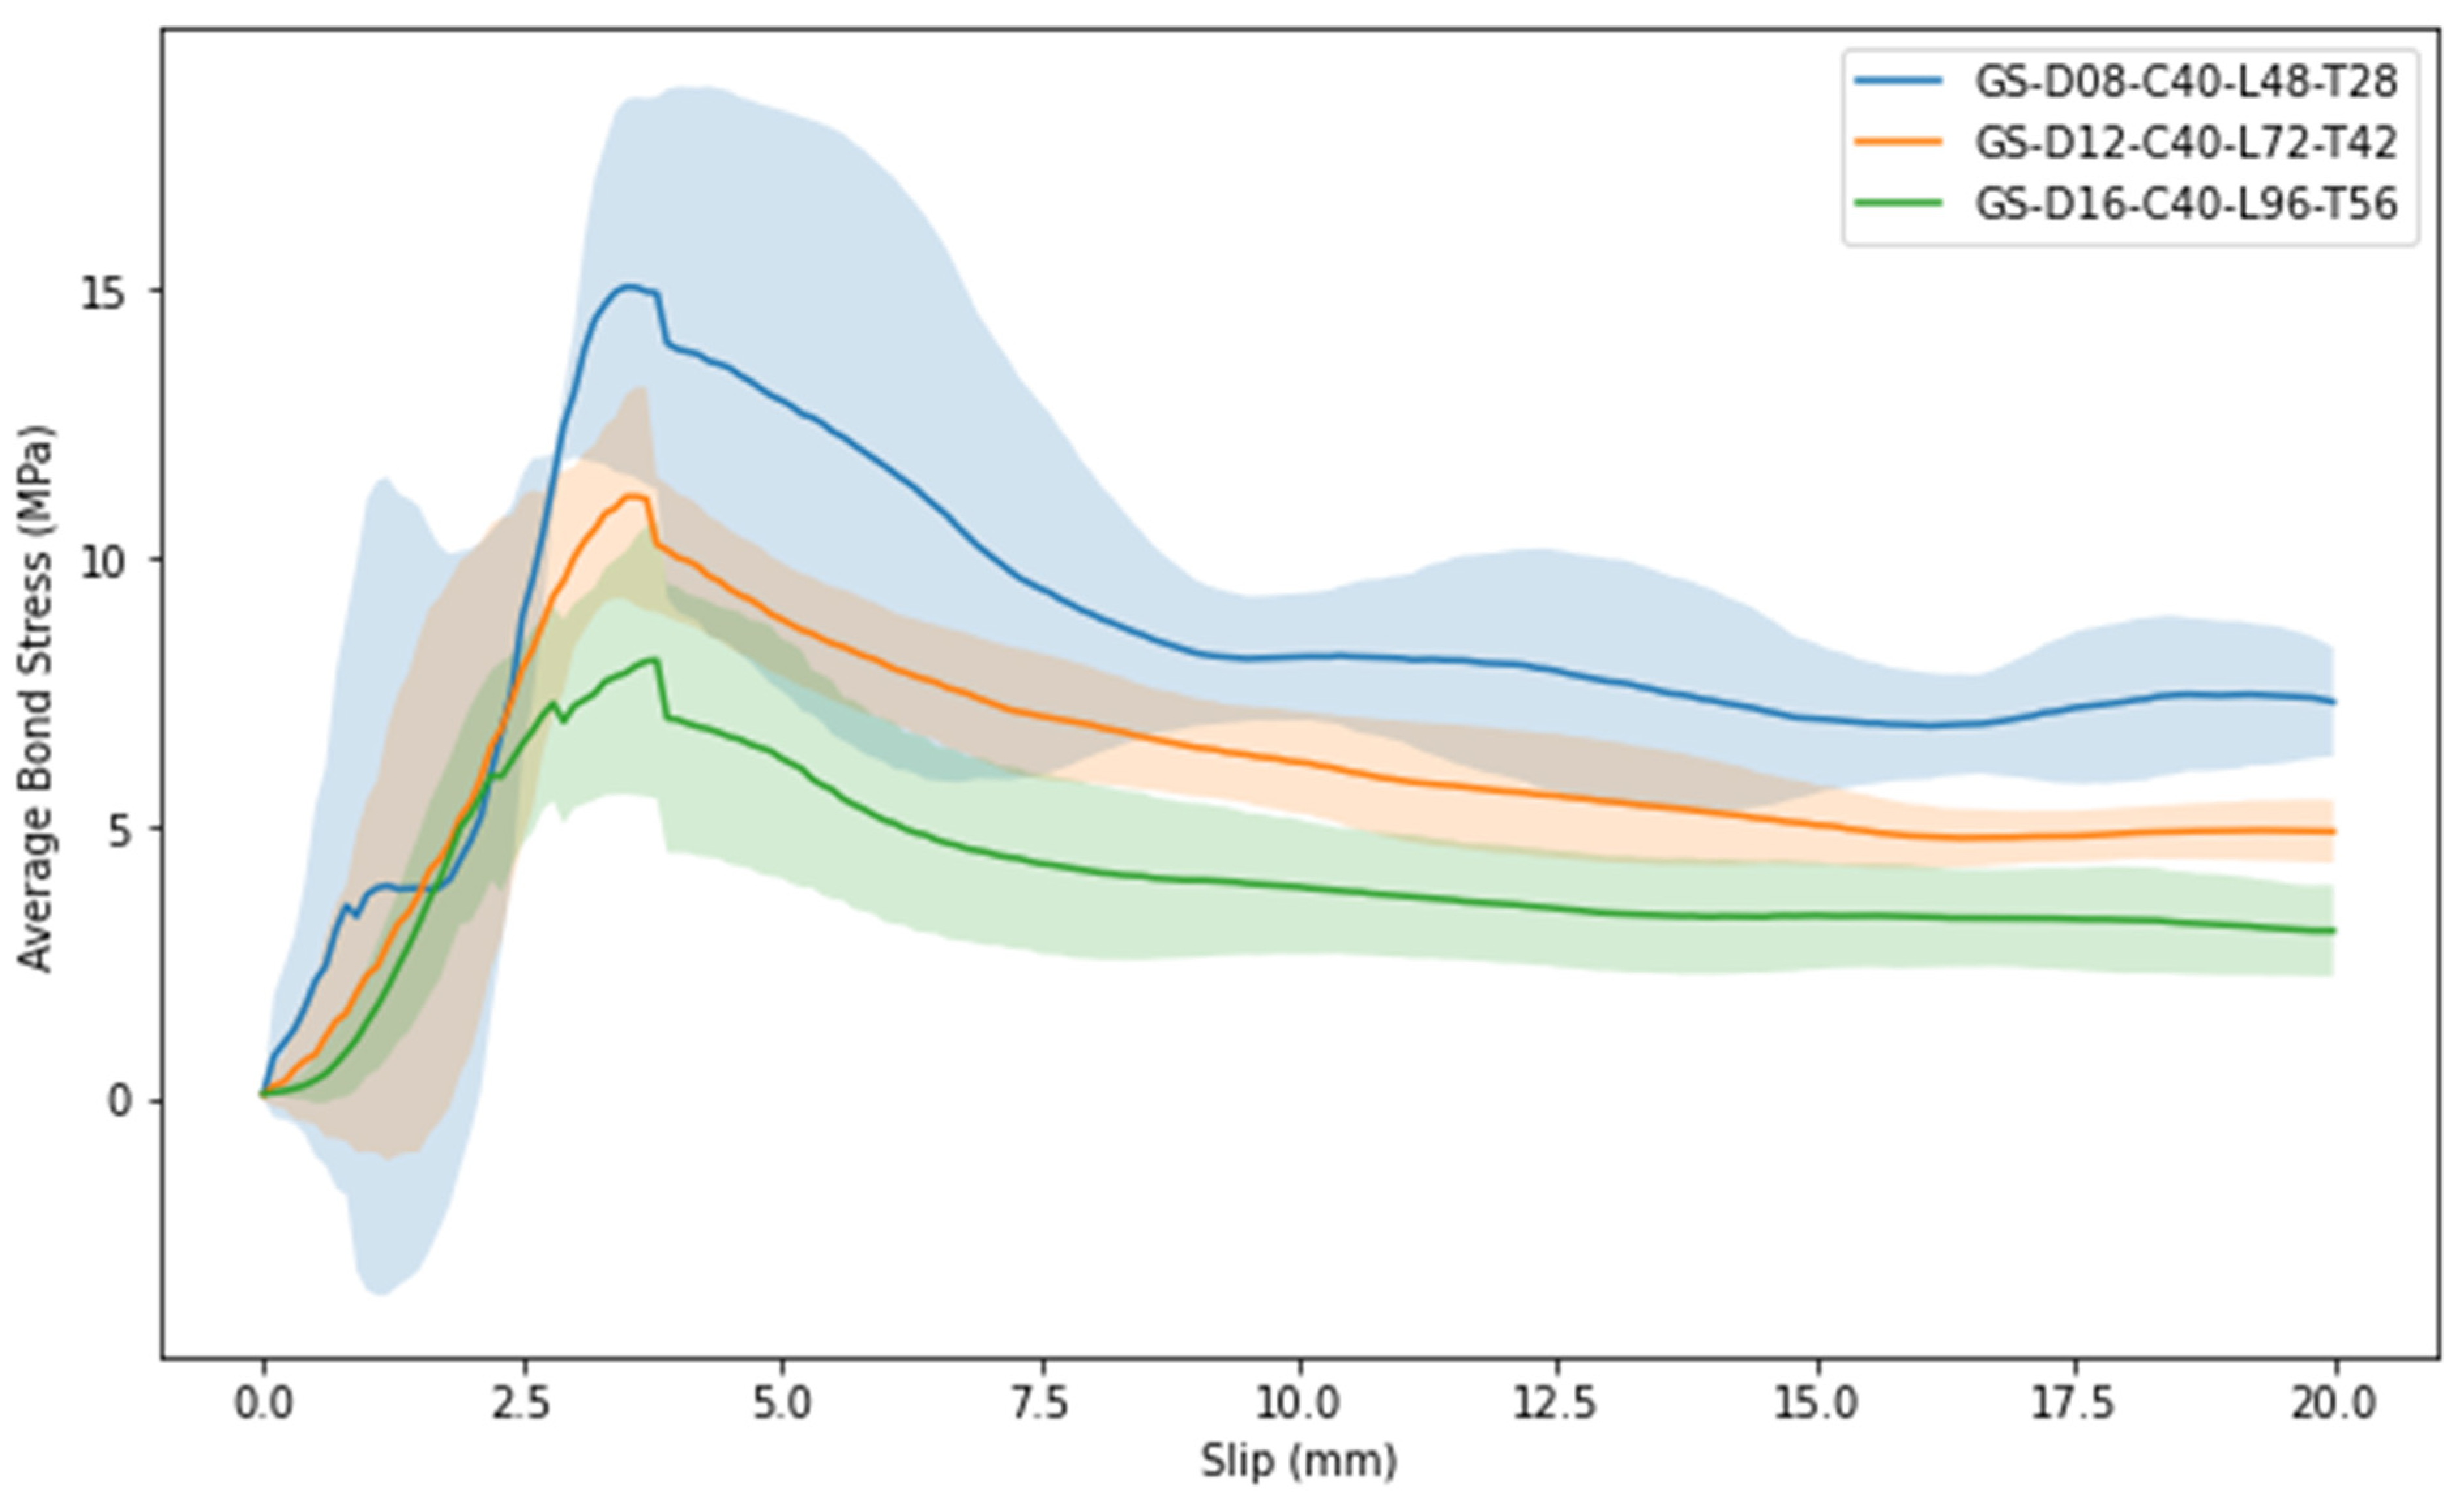
Figure 12. The average bond stress to slip graphs of the five parameters investigated are shown in
Figure 13,
Figure 14,
Figure 15,
Figure 16 and
Figure 17, and the standard deviation of each data point is presented as a shaded trace behind each curve.
Typically, the stress–slip relationship starts with a nearly linear-elastic profile until the peak that effectively represents the break of the chemical bond. Post peak, the capacity is characterised by large slippage accompanied by a rapid drop of stress before plateauing. The residual or plateaued stress expressed the frictional resistance of the rebar slipping out of the concrete following the loss of the bar–mortar and bar–concrete mechanical bond.
In the initial phase, the behavioural responses of the bond-slip can be related to the combination of chemical and mechanical resistance of the bond. Once the chemical bond is lost, the failure is governed by the progressive engagement of the mechanical interlocking. The peak stress is therefore characterised by the combined chemical and mechanical bond. Beyond this point, the curve represents the frictional resistance that is mostly related to the morphology of the rebar surface.
3.4. Analysis of Bond Strength
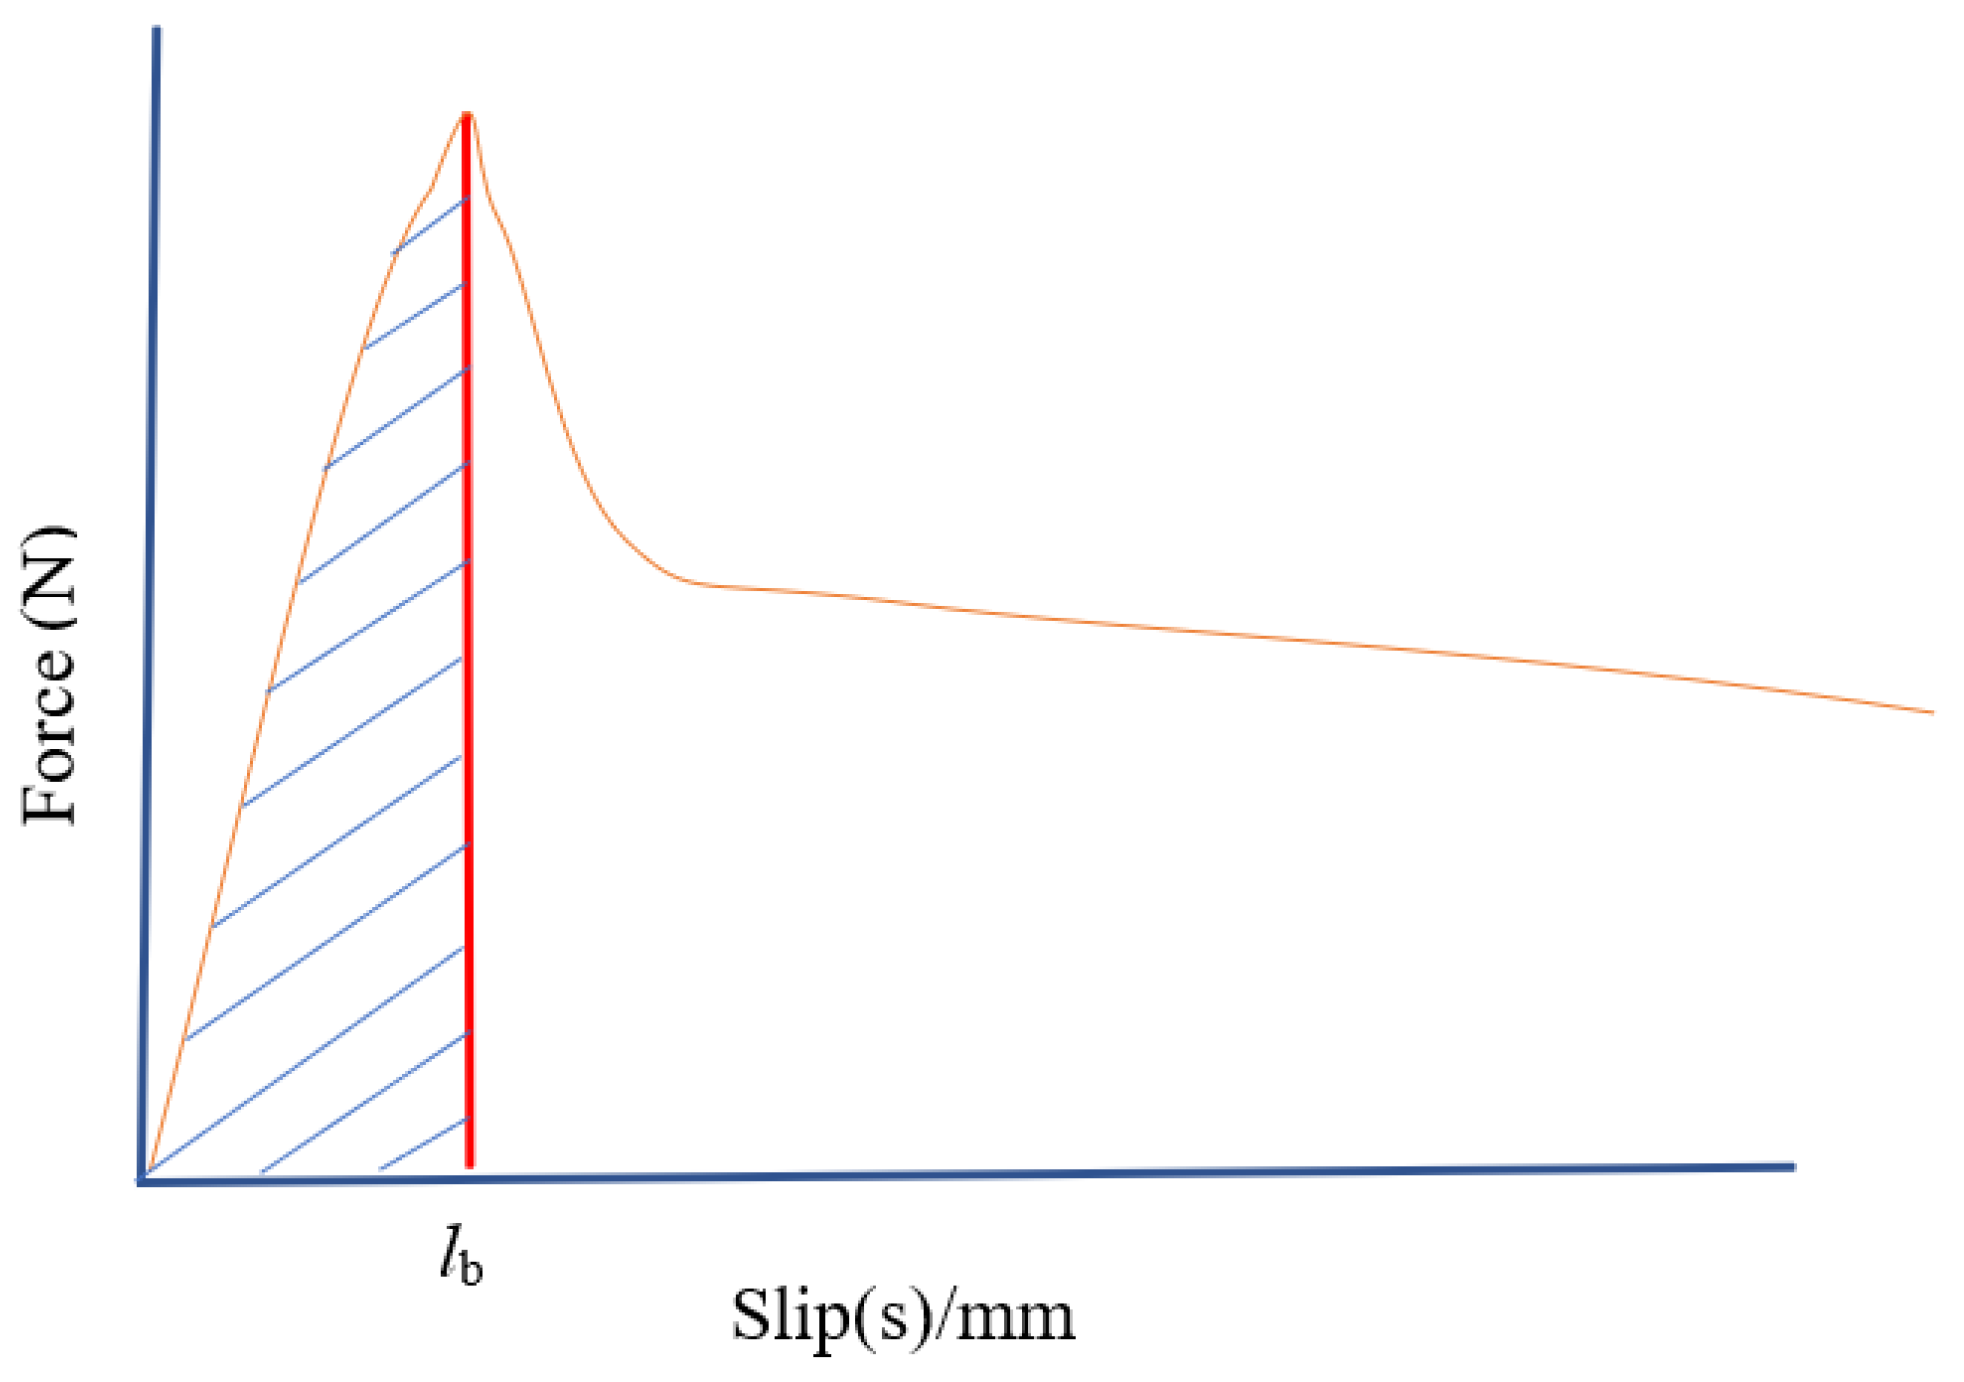
The area under the pull-out force–slip curve (
Figure 18) geometrically explains the pull-out energy or work
Wp, as expressed in Equation (1).
where
P(
s) is the pull-out force at slip distance
s, and
is slip displacement at the peak force.
To evaluate the pull-out tests, the bond strength of the samples is computed using Equation (2), where the bond strength (
τu) is determined with the assumption that the engineering stress is uniform over the whole interface of the GFRP bar embedded in the concrete matrix. The bond strength is, therefore, the expression of the pull-out force (
Pu) divided by the lateral surface area of the rebar (
).
where
Pu is the pull-out force acting on the rebar,
db is the diameter of the rebar, and
lb is the interface length.
Table 2 summarises the average bond strength and corresponding energy values computed from the force and slip data acquired with the pull-out tests.
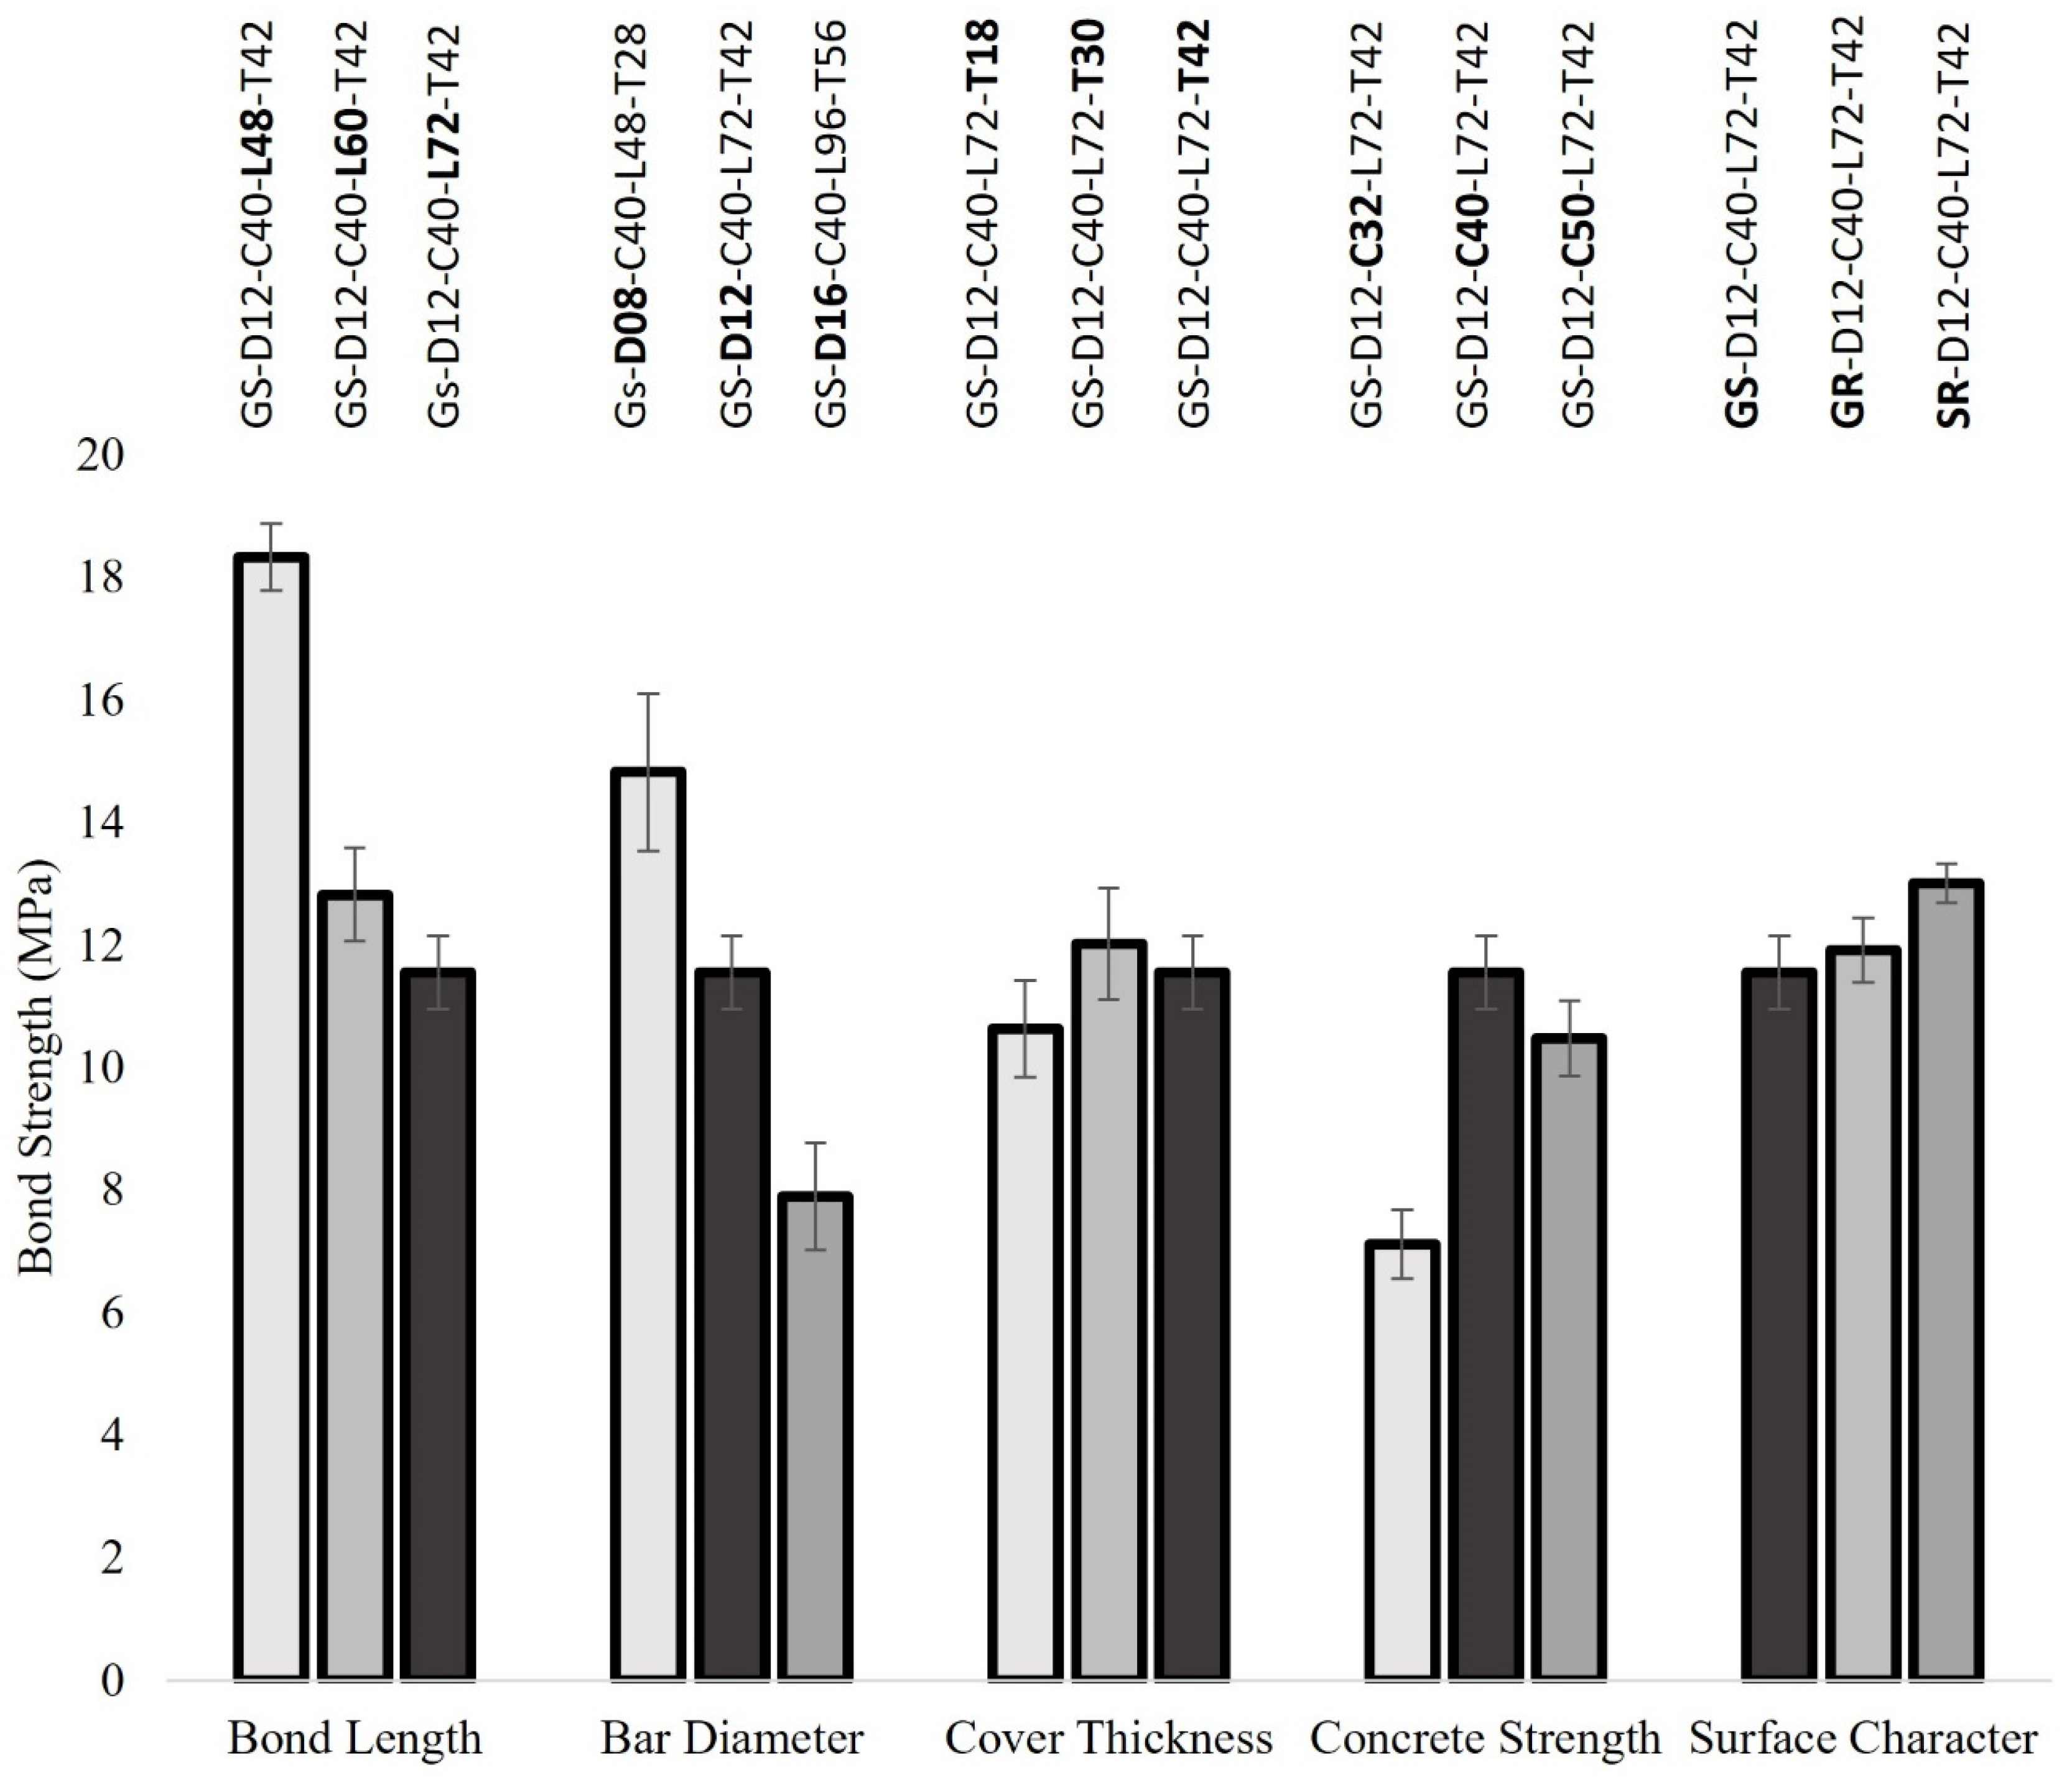
Figure 19 provides an overview of the bond strength of all pull-out test series, where the series are grouped by the parameters under investigation. Bar length and diameter have the biggest effects on imparting high bond strengths of 18.3 and 14.8 MPa, respectively. Furthermore, specimens with ribbed GFRP show the highest bond energy to their ultimate state, and the specimen with a bond length of 60 mm exhibited the second-highest bond energy.
3.5. Bond-Slip Parameters
3.5.1. Effect of Bond Length and Bar Diameter
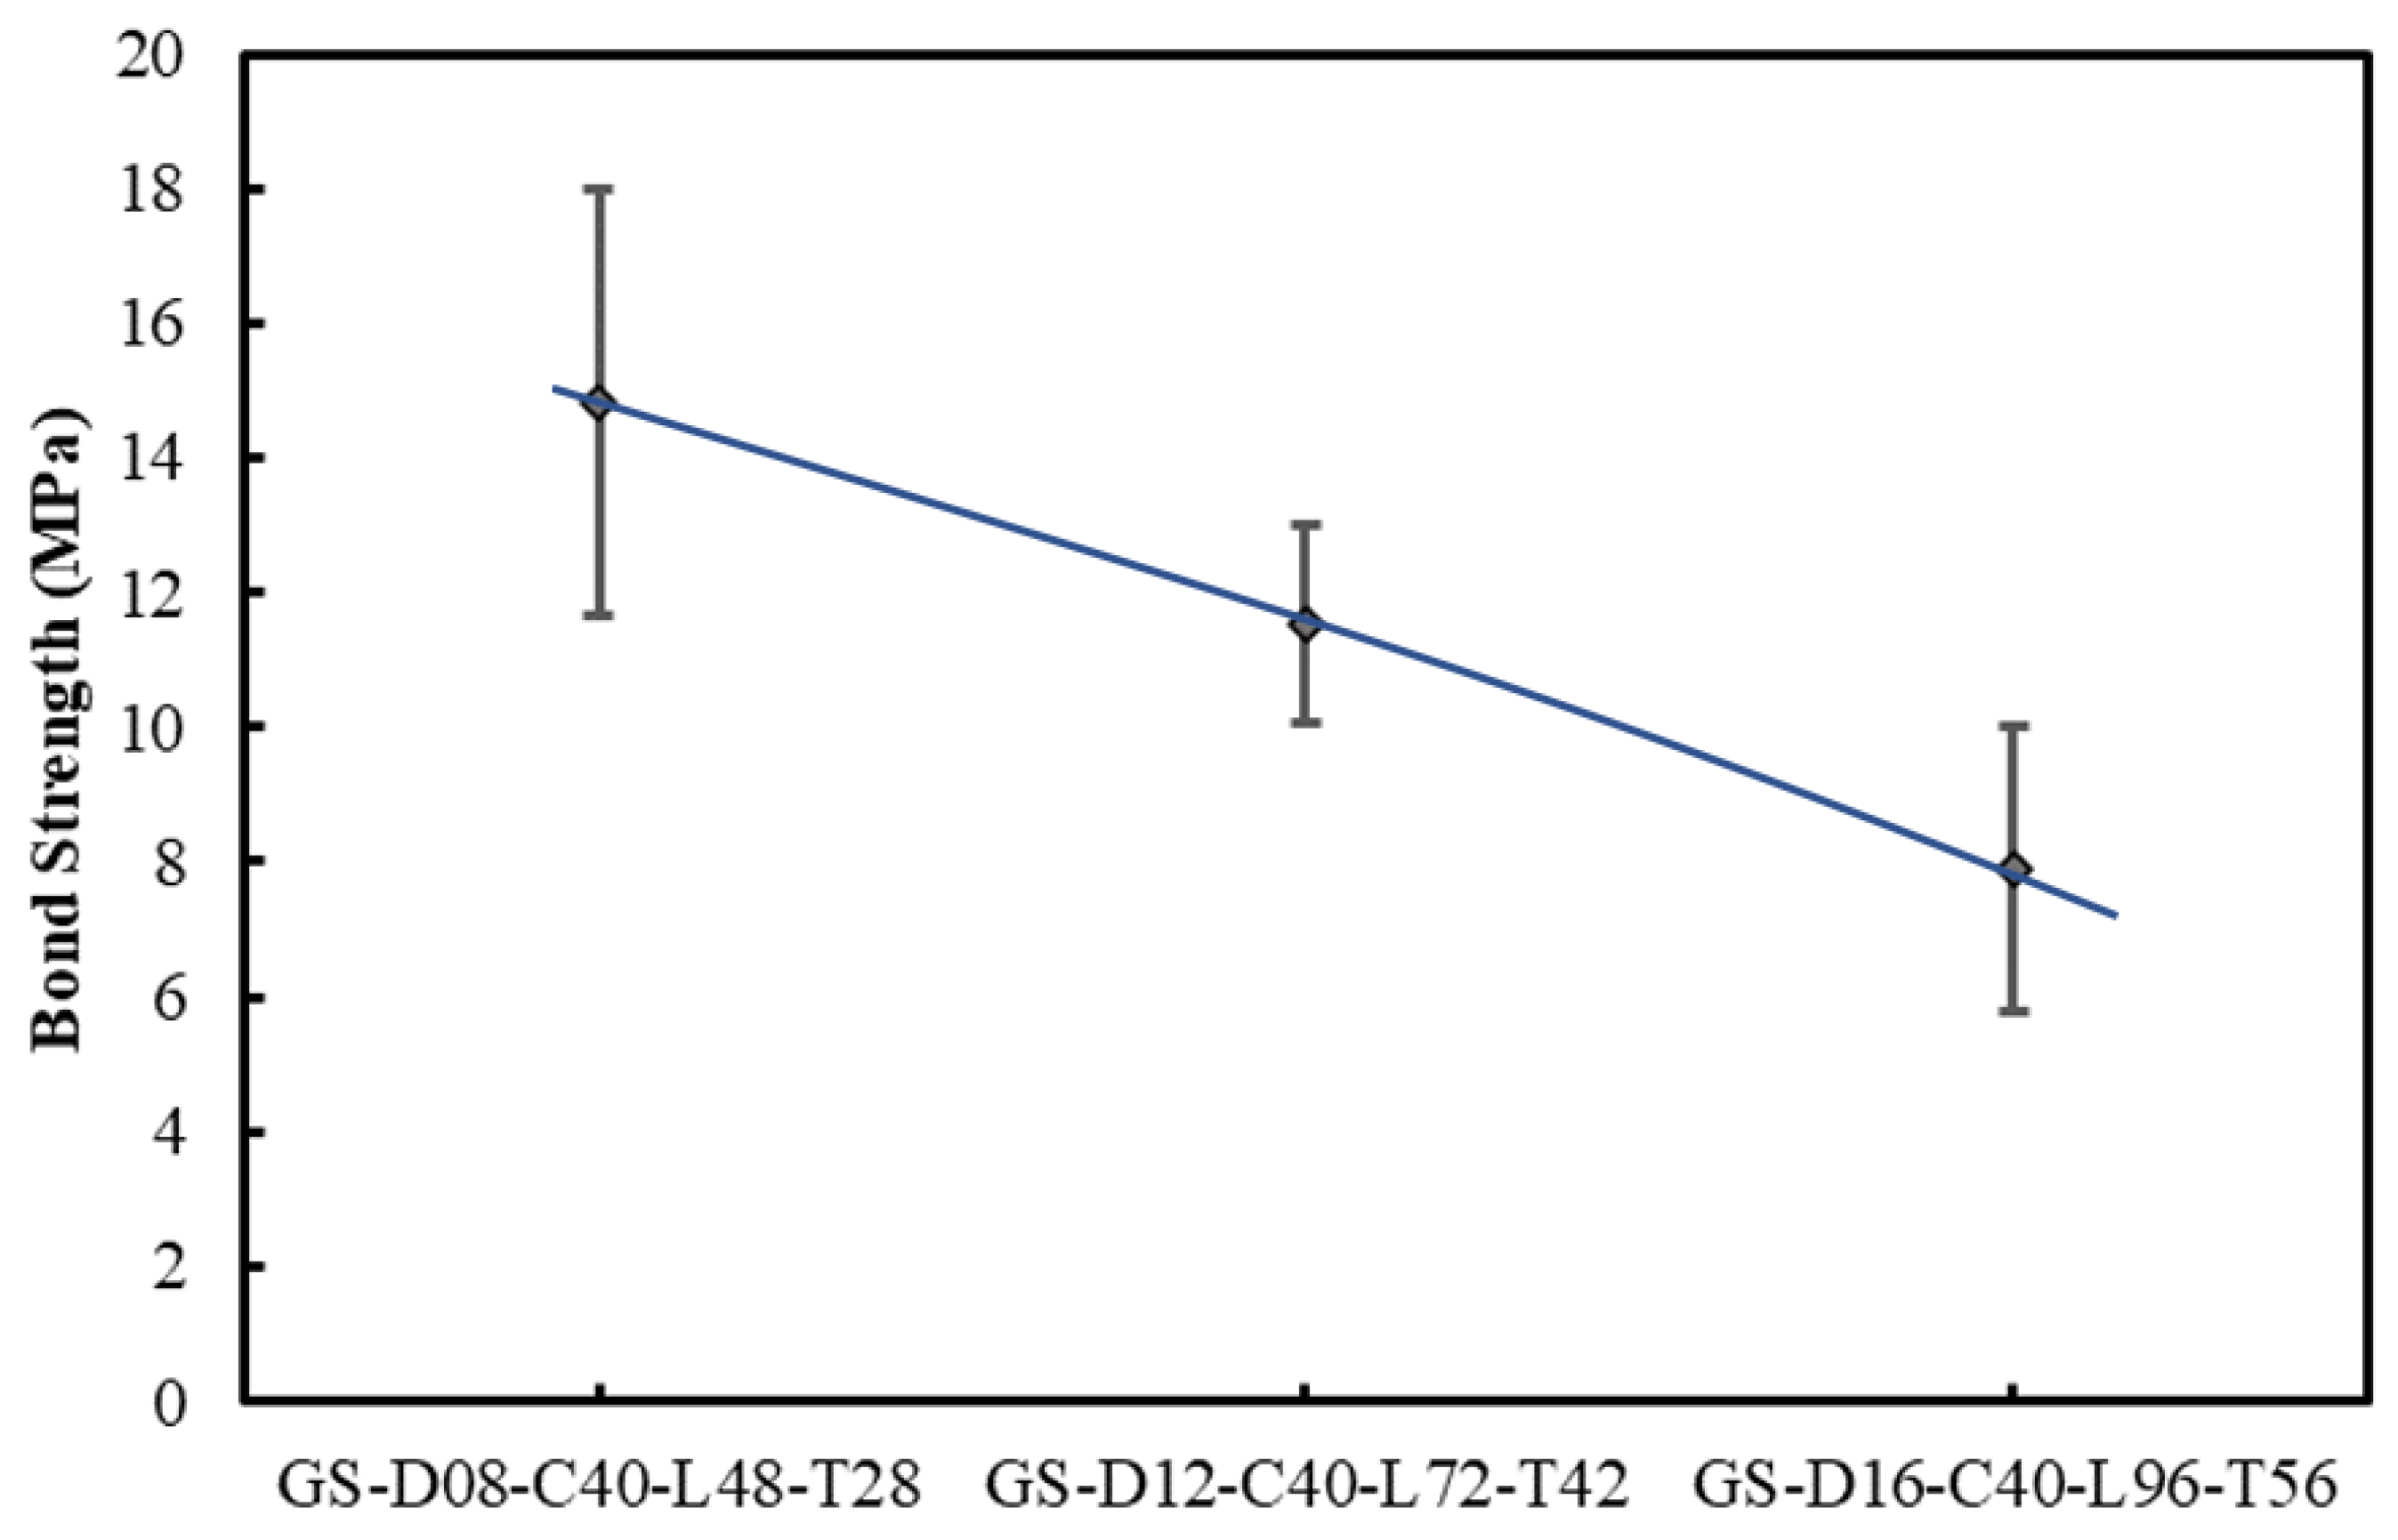
Figure 20 and
Figure 21 show the effect of the bond lengths and diameter of the GFRP bars on the bond strength. For 48 mm length (L48), the bond strength was the highest at 18 MPa, while it was significantly lower at about 13 MPa for L60 and L72. Similarly to the lengths, it was observed that bars with small diameters exhibit higher bond strength compared to large-diameter bars. There are a number of reasons supporting this observation: the confinement caused by voids, size effect and non-linear stress distribution. It is evidenced that smaller surface areas seem to give more effective and stronger bonds, in agreement with previous findings [
37]. The effects of bar length and diameter on the bond strength are most likely probabilistic. When the sand-coated bar is subjected to stress, it may contain flaws or defects that can act as stress concentrators and initiate failure. Flaws can occur during the manufacturing process or arise due to other factors. The strength of the bond with a concrete matrix is influenced by the presence and size of these flaws. Assuming that the distribution of flaw sizes follows a statistical distribution, such as a Weibull distribution, the probability of failure for a fibre can be expressed as follows:
where:
is the probability of failure;
is the applied stress on the fibre;
is the characteristic strength of the fibre (strength below which all fibres fail);
is the Weibull modulus (a measure of the variability in strength).
Rebars with relatively smaller surface areas have a higher probability of being defect-free or containing fewer flaws compared to longer bars. As a result, the characteristic strength () of short bars tends to be higher than that of long fibres. Moreover, the larger flaws in bars with higher surface area make them more susceptible to early failure. The presence of these probable larger flaws, as well as their higher frequency of occurrence, decreases the characteristic strength () of bars with higher length and diameter, making them seemingly weaker on average. The flaw sensitivity, combined with the statistical distribution of flaw sizes, is anticipated to contribute to the difference in strength observed between the smaller and larger embedment areas. However, this effect plateaus when the length tends to infinite lengths.
3.5.2. Effect of Concrete Compressive Strength
The effects of the compression strength of concrete were investigated with sand-coated bars embedded in 32, 40 and 50 MPa concretes. The bond strengths observed for the different concrete strengths are shown in
Figure 22. The bond strength peaks with the 40 MPa concrete, indicating that this concrete strength allows for achieving the optimum bond strength. The data suggest that the bond strength was 7 MPa with 32 MPa concrete. It develops to about 11 MPa for 40 and 50 MPa concrete, an increase of some 70%. However, while high concrete strength seems to improve bond strength, increasing beyond 40 MPa does not provide additional benefits. Indeed, the coating peel-off found at the interface of the sectioned samples indicates that the trend of declining bond strength in high-strength concrete also depends on the strength of the epoxy outer layer of the sand-coated rebars.
3.5.3. Effect of Concrete Cover Thickness
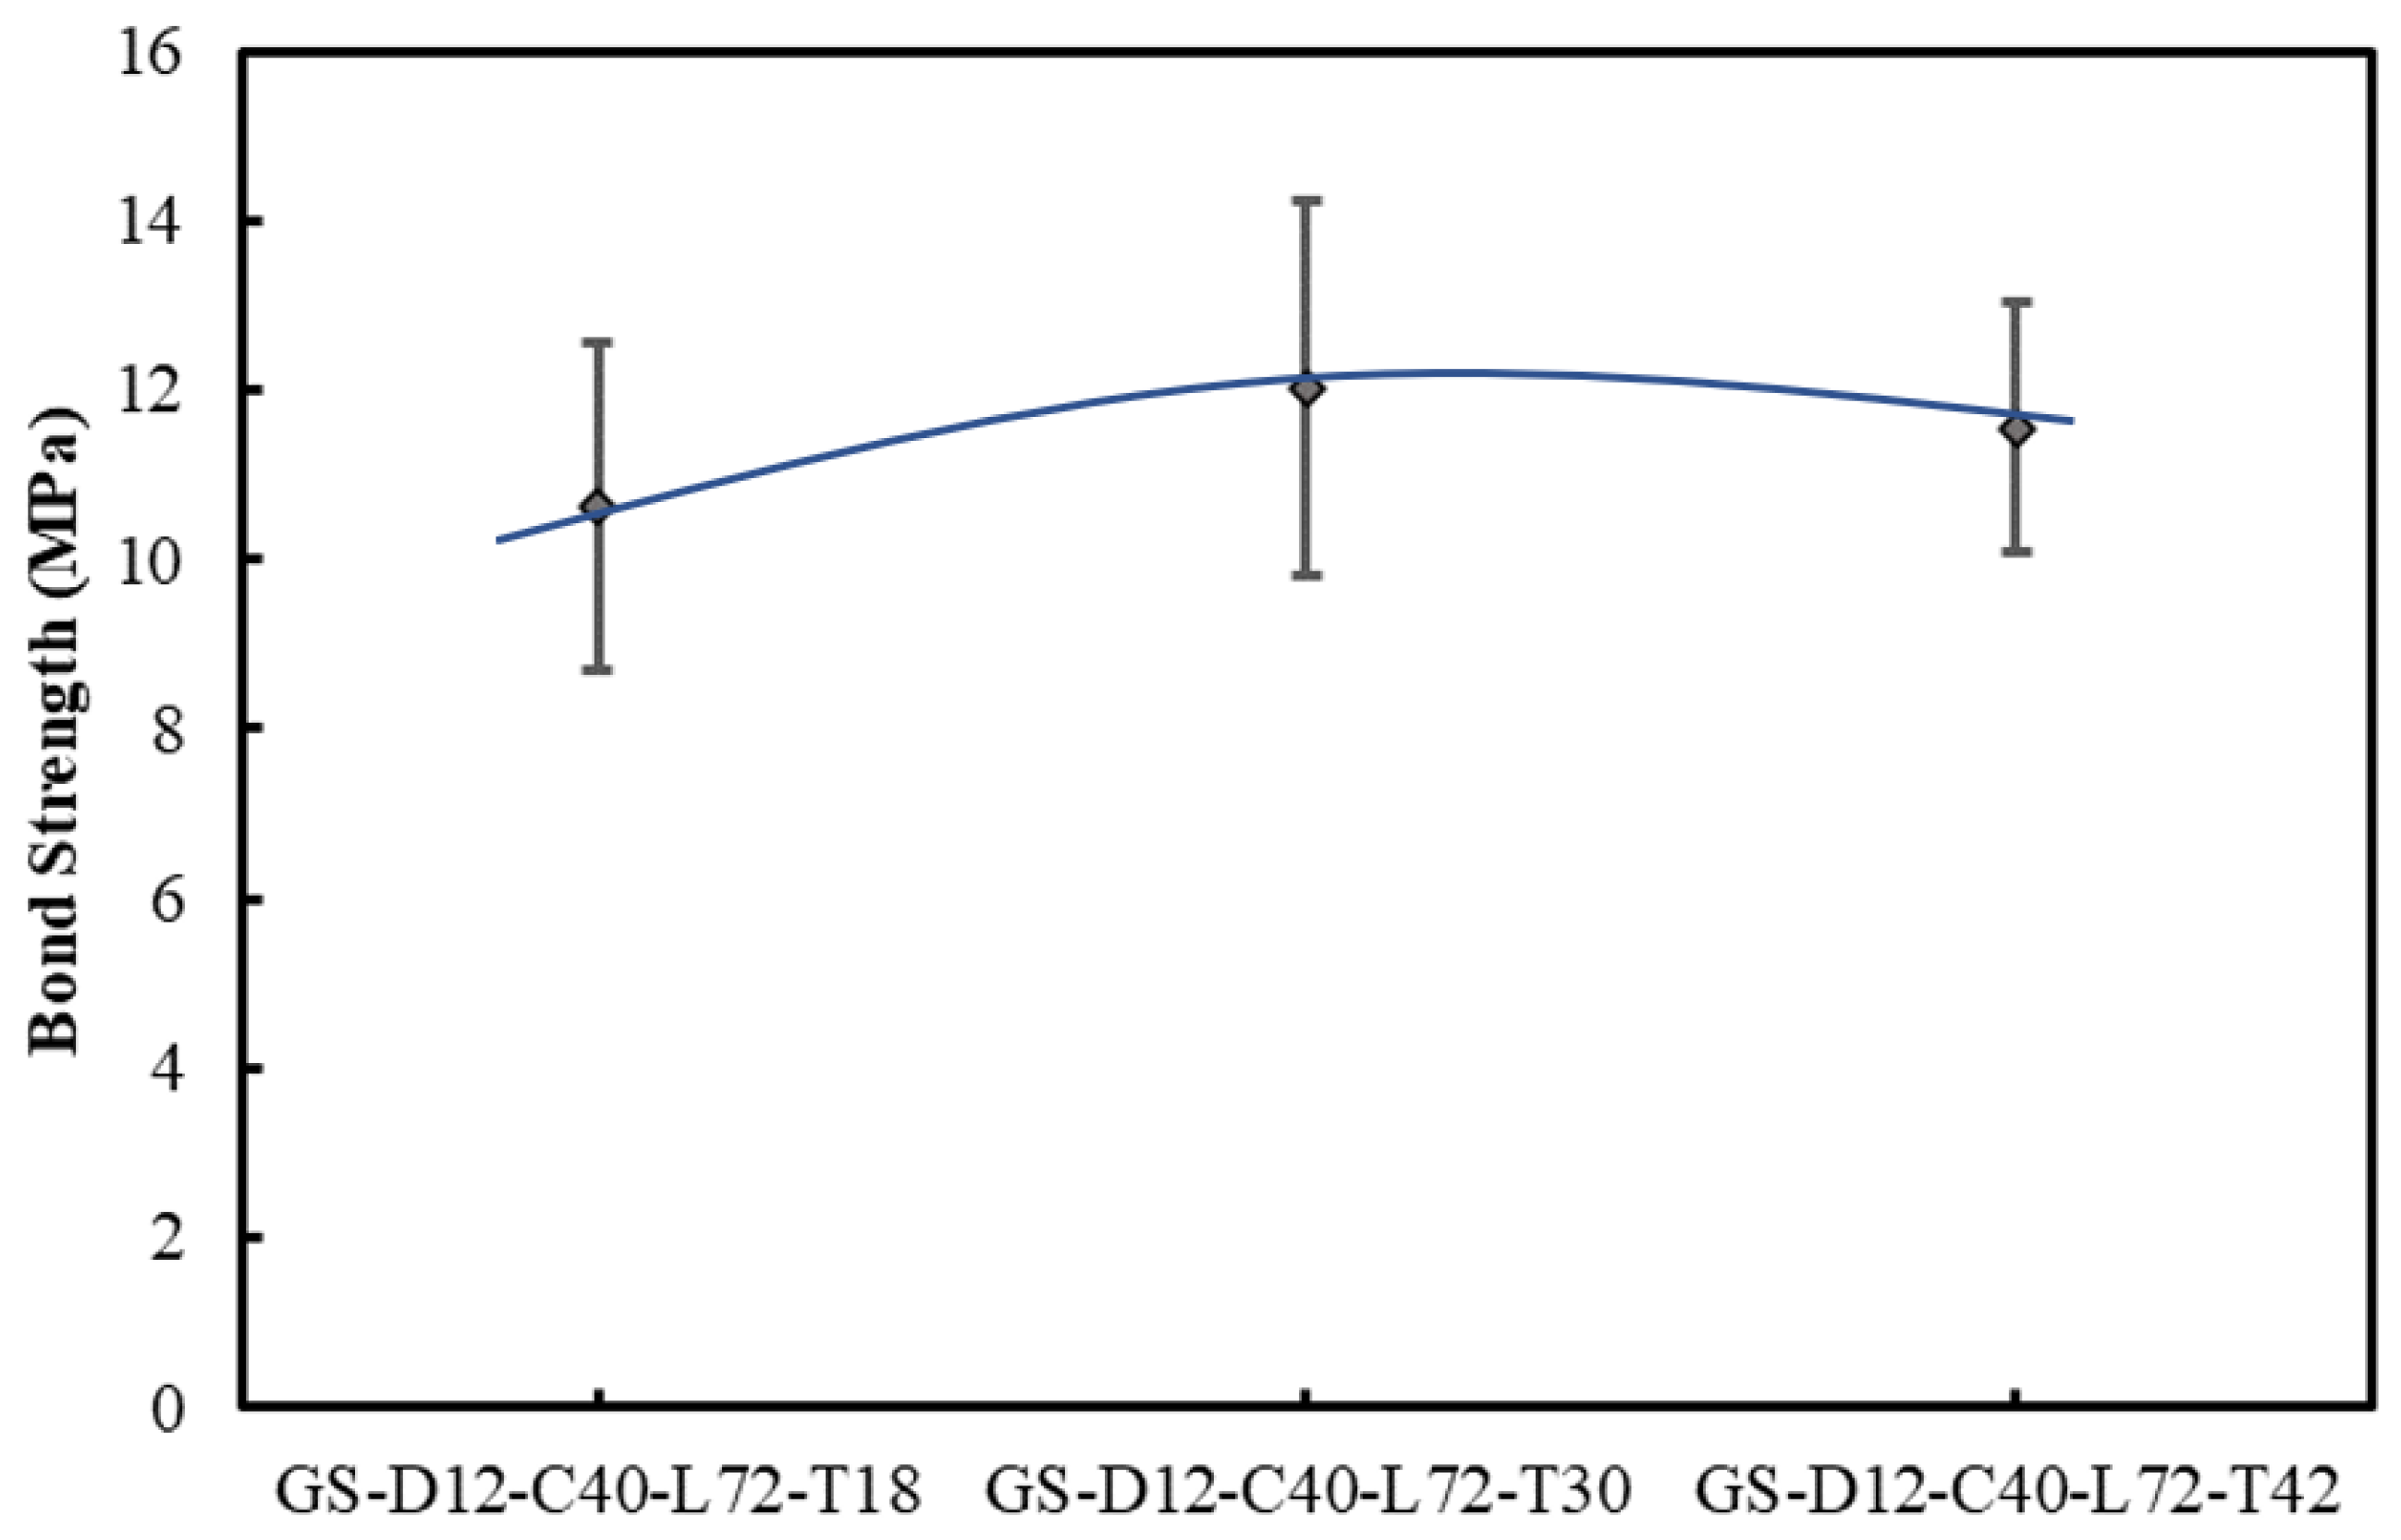
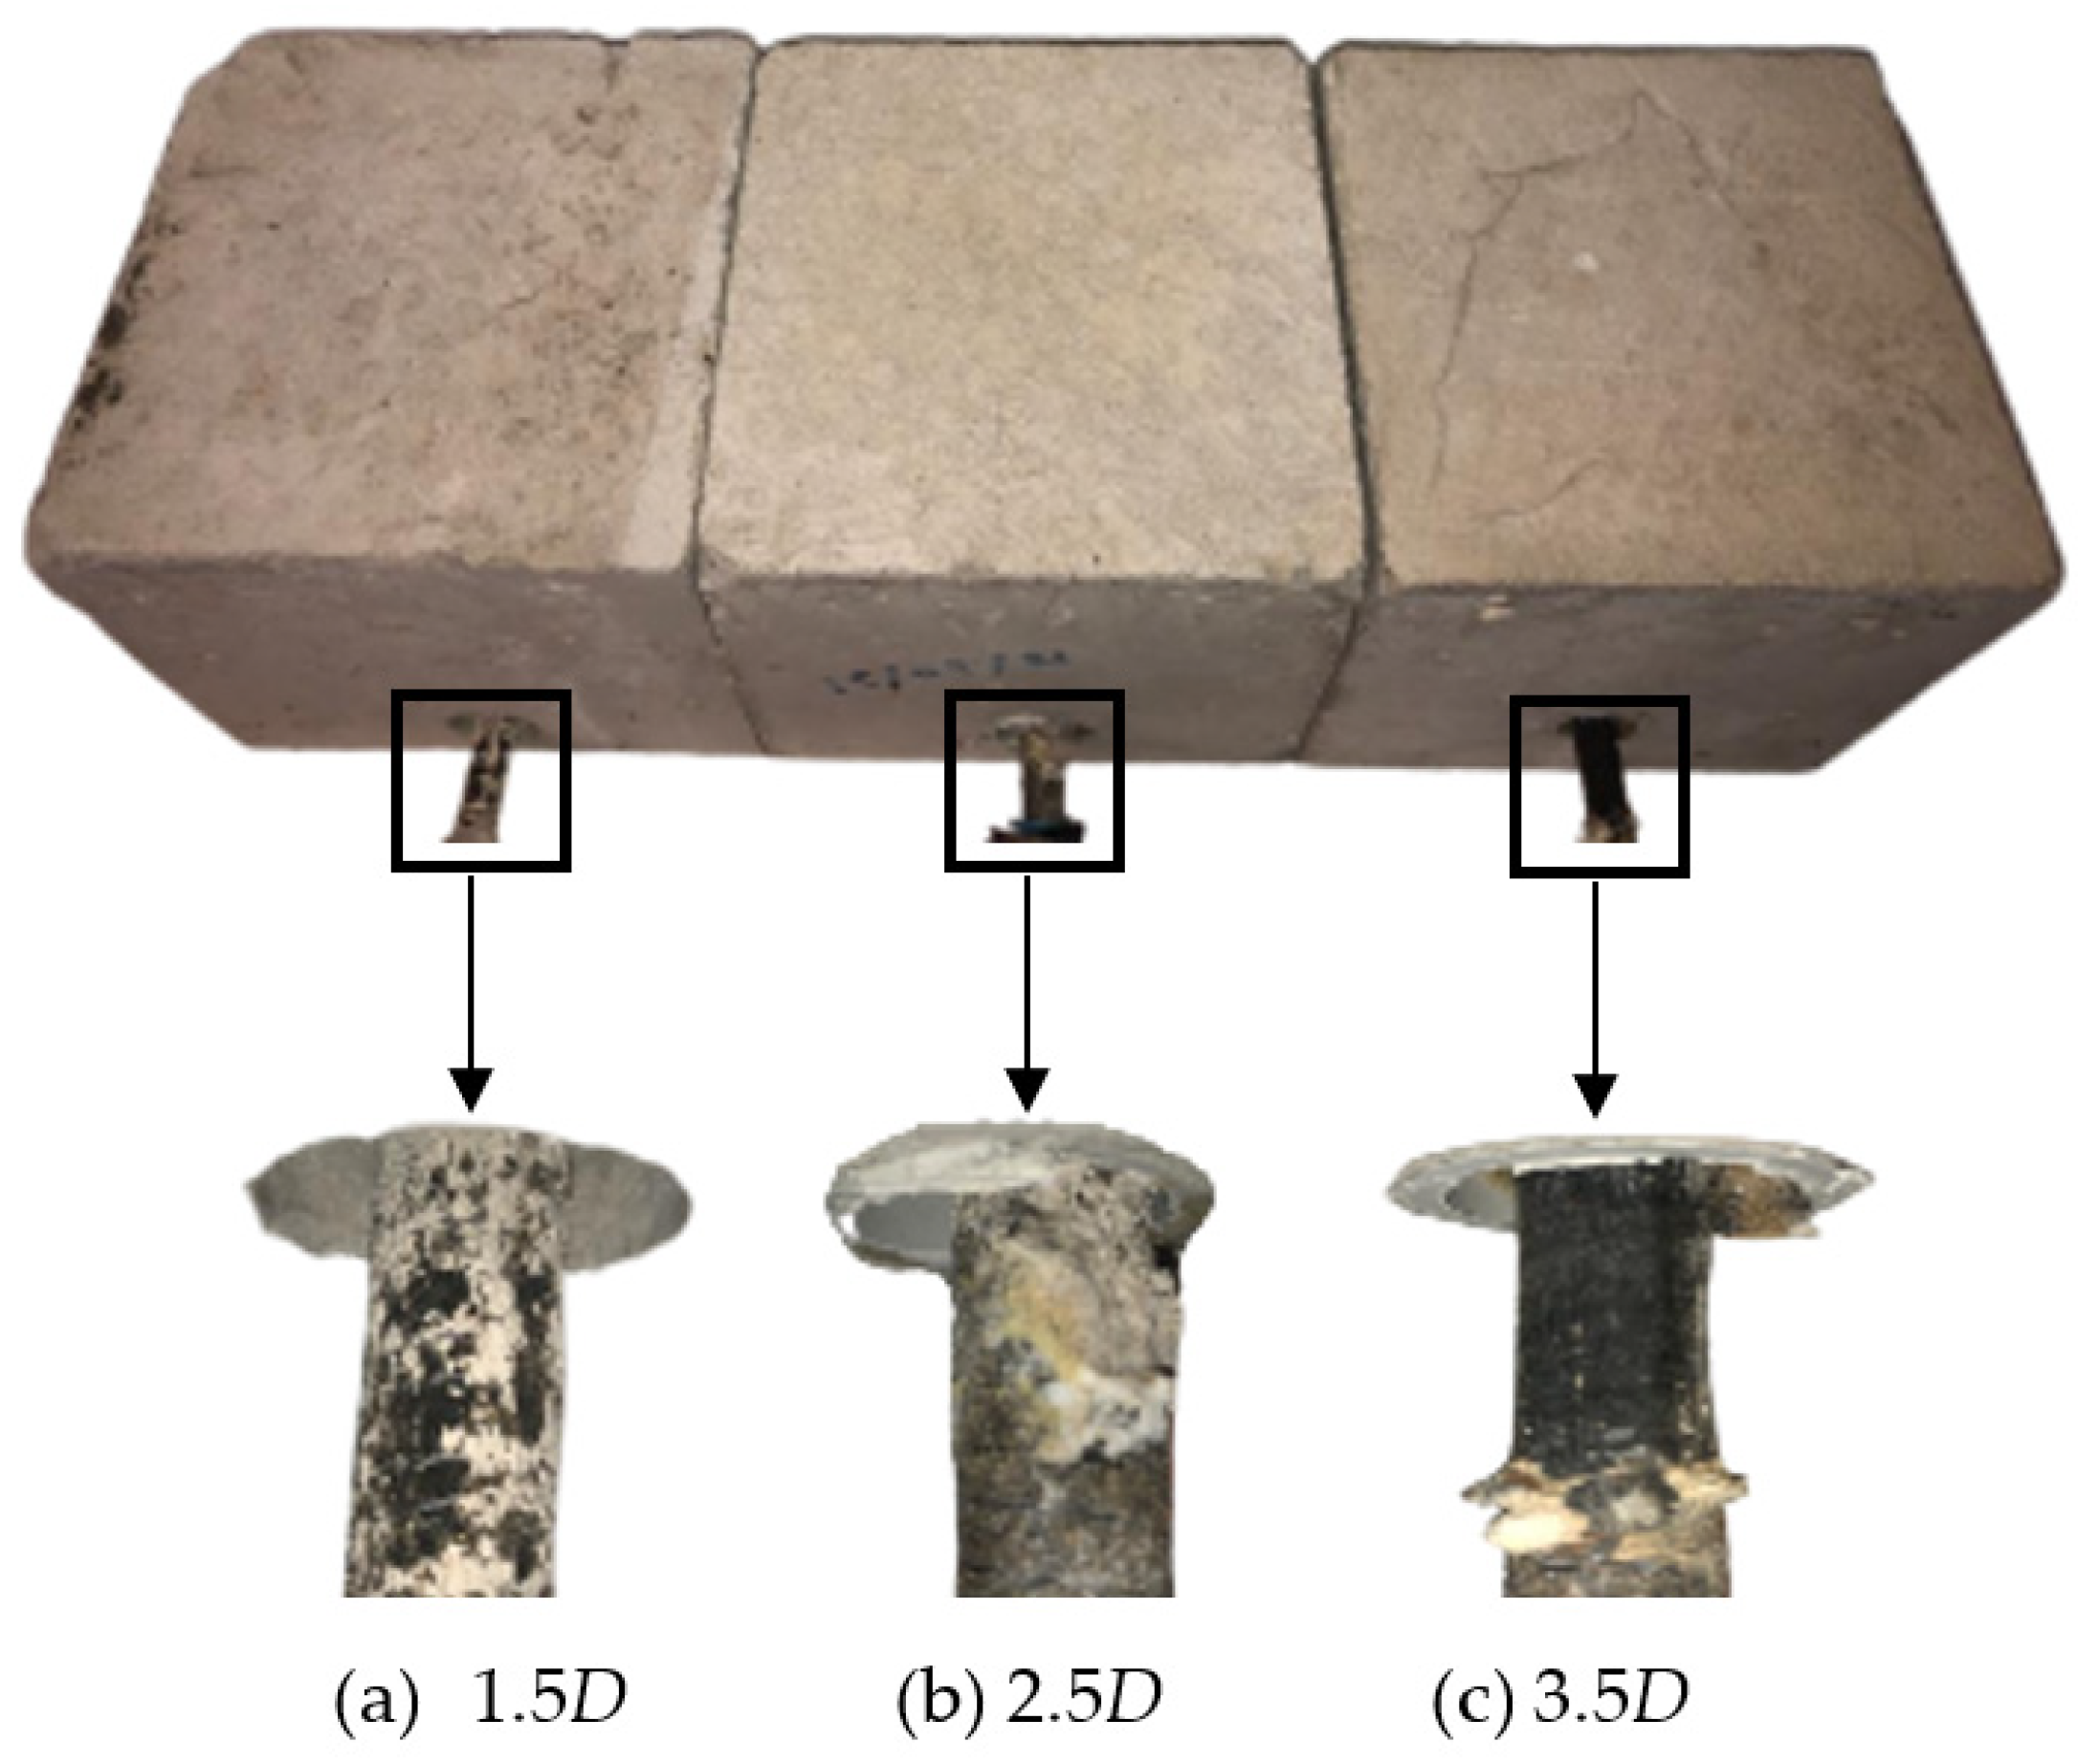
The effect of the cover thickness on the bond behaviour was investigated with three concrete covers: 18 mm, 30 mm and 42 mm. These covers correspond to the 1.5, 2.5 and 3.5 multiples of the bar diameters (12 mm).
Figure 23 depicts the average bond strengths and provides the trend between these three variables. The specimens with a cover thickness of 30 mm give the highest average bond strength of 12.02 MPa, whilst the 18 mm and 42 mm cover thicknesses exhibited bond strengths of 10.64 and 11.55 MPa, respectively.
There is little variation in the bond strength with regard to the cover thickness, and this variation is not significant, i.e., within the confidence limits. It is shown that the cover thickness of 30 mm achieves the optimum bond strength.
Figure 24 compares the failed specimens after the pull-out test. While observing the GFRP surfaces of specimens tested with a cover of 18 and 30 mm (
Figure 24a,b), the presence of concrete particles is evident without much damage to the surface of the GFRP bar. On the other hand, the specimen with a cover thickness of 40 mm (
Figure 24c) shows peel-off damage at the surface of the GFRP bar.
Furthermore, most specimens with 18 mm and 30 mm covers failed due to concrete splitting, while only a few samples of the 42 mm cover experienced splitting. This observation suggests that, although the cover thickness appears to have no statistical significance on bond strength, it influences the failure mode or, in other words, thicker covers may contribute to preserving the integrity of the concrete host and improve the confinement of the rebar, as confirmed in previous studies [
38,
39].
3.5.4. Effect of Rebars Surface Morphology
The effect of surface morphology was investigated with sand-coated and ribbed GFRP bars. As
Figure 25 shows, the average bond strengths exhibited by sand-coated GFRP, ribbed GFRP, and steel ribbed rebars are 11.55 MPa, 11.91 MPa and 13.01 MPa, respectively. This shows that there is no significant difference between the sand-coated and ribbed GFRP bars. The differences in bond strength between both GFPRs and steel are also small and not statistically significant. It can therefore be concluded that the surface morphology and material of the reinforcement, whilst being engaged with the bond-slip of the reinforcement to the concrete, are not determinant fabrication parameters. However, it has been observed that ribbed bars failed with less slip than sand-coated ones. This outcome is mostly related to the failure of ribbed bars being strongly related to the compression strength of the concrete.
4. Statistical Analysis
One-way ANOVA statistical significance analyses have been completed to determine whether there is a significant difference between the parameters. Computing the F-values allow us to quantify the effects of the parameters within a group, e.g., bond lengths, and across groups, e.g., bond length vs. bar surface morphology. The p-value allows us to determine the significance of differences within a group and across groups. The absence of a difference established the null hypothesis of this examination.
The statistical significance analysis is summarised in
Table 3. It shows that the factors that are significant are the bond length and bar diameter, as the
p-values of these parameters are of less than 0.05, along with higher F-ratios compared to their F
critical values. Other parameters, such as the concrete strength, cover thickness and rebar surface morphology, have
p-values greater than 0.05, indicating that there is no statistically significant difference between the levels of these factors. The F-ratios for these three parameters are also lower than their respective critical F values, indicating that the variance within the levels is greater than the variance between the levels.
It must be mentioned that the statistical significance analysis only reflects the difference between the means of the maximum values generated from the experimental data. While this information is helpful in understanding the impact of each factor on bond behaviour, it is also important to consider other observations, such as the failure modes, in order to gain a complete understanding of the significance and influences of each constructional parameter.
5. Discussion
This study investigated the parameters influencing the bond behaviour between GFRP bars and concrete by subjecting the samples to pull-out tests. The parameters under examination were the embedment length (4D, 5D and 6D), bar diameter (8, 12 and 16 mm), concrete strength (32, 40 and 50 MPa), cover thickness (1.5D, 2.5D and 3.5D), and surface morphologies of the bars.
The analysis of the stress-slip data and the evaluation of the failure modes provided information to identify four phases in the bond behaviour of GFRP reinforcement material in concretes:
The combination of chemical adhesion and mechanical resistance is accountable for the first stage of the bond-slip behaviour, where the concrete remains mostly uncracked, and the bond stress tends to reach its peak.
The formation of initial micro-cracks at the surrounding concrete characterises the second stage. This is where the strength shifts to mechanical resistance.
The bond strength corresponds to the mechanical bearing resistance during the third stage. This is when the interlocking of the rebar surface morphology to the concrete engages. It is characterised by the propagation of large cracks in the concrete.
Lastly, once mechanical resistance reaches its ultimate state, the bond-slip is characterised by the frictional resistance between the bar surface and concrete interface. The failure of the bar morphology may also play a role during this stage.
The analysis of bond strength values indicated that all the parameters studied have some impact on the bond strength between GFRP and the concrete matrix. The magnitude of the bond strength appears to be inversely related to the bar diameter. This indicates that the bond area has a considerable impact on the bond strength. This effect can be attributed to the combined effect of the shear lag, size effect, Poisson effect, and the non-uniform stress distribution along the bar.
The results suggest that the bond strength for concrete with compressive strength of 32 MPa is significantly lower than that for concrete with compressive strengths of 40 and 50 MPa (
Figure 22). The bond strength also appears to peak between the 40 and 50 MPa concrete strengths. It can therefore be stated that increasing concrete compression strength beyond 40 MPa yields little to no benefits to the bond strength.
The effect of cover thickness on bond strength has not appeared to be significant. The trend line established in
Figure 23 shows that 30 and 42 mm covers achieved a slightly higher bond strength than the specimen with a cover thickness of 18 mm, suggesting an 18 mm cover may not be adequate to develop full bond strength capacity.
In general, the strength pattern of sand-coated GFRP bars exhibited a linear-elastic behaviour until ultimate failure (
Figure 13). After the peak load, a non-linear decrease was noted and then a plateau until the complete collapse of the samples. This is ascribed to the typical mechanical characteristic of pull-out behaviour.
A consistent bond behaviour pattern was noted among all the specimens with ribbed GFRP bars (
Figure 17). Furthermore, the samples exhibited complete split failure after their ultimate mechanical bearing capacity. Hence, the stress curves ended at the beginning of the ascending path right after reaching their maximum.
The significance of each parametric group has been established with one-way ANOVAs. Significant differences were identified for the bond length, bar diameter and concrete compressive strength. In contrast, no significant difference could be determined for the cover thickness and rebar surface morphology.
The investigation has also identified that each parameter has key roles in the failure mode. Both the surface morphology of the bar (sand-coated or ribbed) and the cover thickness have a significant impact on the failure mode, even though their respective impact on the strength is limited.
6. Conclusions
This study investigated the influence of a series of parameters on the bond behaviour between GFRP bars and concrete. The results of the pull-out tests indicated that the bond strength was significantly impacted by the bond length, bar diameter and concrete strength, while the concrete cover thickness and bar surface morphology had limited impact.
Furthermore, the comparison of maximum bond strength values reveals an inverse relationship for bond strength variables: 18.3 MPa, 12.8 MPa, and 11.5 MPa for bond lengths of 48 mm, 60 mm, and 72 mm, respectively. Similarly, the variables of bar diameter (8 mm, 12 mm, and 16 mm) also exhibit an inverse relationship when compared against the bond strength values of 14.8 MPa, 11.5 MPa, and 7.9 MPa, respectively. At the same time, the variables of concrete (32 MPa, 40 MPa, and 50 MPa) demonstrate a non-linear relationship with the maximum bond strength values of 7.1 MPa, 10.5 MPa, and 11.5 MPa, respectively. Similarly, the cover thickness variables (18 mm, 30 mm, and 42 mm) depict a non-linear trend when compared against their respective maximum bond strength values of 106 MPa, 12 MPa, and 11.5 MPa.
The failure modes can be classified into splitting and bar slippage failures, with the latter being the most frequent. The split mode of failure has been limited to samples with a small cover. This indicated that adequate cover thickness, e.g., ≥2.5D, should be considered to achieve the full development of the bond-slip capacity. The pattern of the bond behaviour was consistent among sand-coated GFRP bars where a coating failure was observed. On the other hand, GFRP ribbed bars commonly exhibited a split failure.
This study has explored parameters that could potentially influence the bond behaviour between GFRP and concrete. While the obtained information lacks a comprehensive understanding of the combined effects of multiple parameters on behaviour, the provided bond information can be leveraged to assist future studies in advancing the knowledge of influential mechanisms.
