Abstract
Sheet piles are extensively used as foundation structures in urban environments. However, the vibrations associated with sheet pile construction can potentially adversely affect existing buildings, as well as cause discomfort to nearby residents. This study aims to analyze ground vibration response during the driving and extraction of sheet piles. To this end, field tests of U-shaped sheet piles were conducted in Beijing silty clay, during which ground vibrations in the near-field were monitored. Subsequently, a numerical model was developed using the coupled Eulerian–Lagrangian method to simulate the pile–soil interaction characteristics and to investigate ground vibration intensity in the far-field. The research results indicate that the ground vibration response modes during the driving and extraction of sheet piles are distinctly different. Due to the entry effect, the critical depth during pile driving typically occurs in shallow soil layers, while during pile extraction, the critical depth generally corresponds to the pile’s embedded depth to overcome the soil locking effect. Ground vibrations rapidly decrease in the near-field (<6 m), while in the far-field (>6 m), the attenuation rate significantly slows down. Vibrations can be widely perceived by residents at radial distances of less than 12 m. Through a systematic assessment, it was concluded that sheet pile construction is unlikely to directly damage surrounding buildings but may inconvenience nearby residents. Additionally, a parametric analysis of the vibration source revealed that appropriately adjusting the driving frequency and amplitude can effectively reduce vibration levels.
1. Introduction
Vibratory pile driving is an increasingly popular foundation method. In comparison to jacking and impact driving methods, vibratory driving offers higher drivability, faster penetration rates, reduced noise levels, and reduced risk of pile damage [1,2,3]. Variable vibratory drivers allow for adaptability to various site-specific conditions. However, the practical application of this approach is often limited. One critical factor is that driving piles into the ground generates vibrations that may potentially damage surrounding buildings and cause discomfort to nearby residents [4,5,6,7].
During vibratory driving, piles commonly exert high-frequency (>25 Hz) cyclic loads on the soil within a short duration [8]. In each cycle, the displacement of the pile tip generates outward-propagating spherical compression waves. Simultaneously, shear waves generate from the pile sides due to friction between the pile and the soil, propagating in a cylindrical shape. When reaching the ground surface, these waves transform into Rayleigh waves, which are the primary source of ground vibrations [9]. For environmental safety considerations, it is essential to assess the potential impacts of ground vibrations and to take suitable measures to mitigate the vibration levels.
Pile driving is a complex dynamic process [10], and extensive efforts have been made for several decades to improve understanding of this process. Daryaei et al. [2] compared the behavior of granular soils during impact and vibratory installation involving changes in horizontal stresses, void ratios, and pile displacements inside and outside the pile. Ekanayake et al. [11] conducted a numerical study on vibratory driving of closed-end piles, investigating the influence of various driving frequencies, amplitudes, soil stiffness, and material damping on wave propagation. Rooz and Hamidi [12] concluded through a parametric study that factors such as hammer impact force, pile diameter, pile tip angle, and soil damping ratio significantly affect ground vibrations during impact pile driving. Aforementioned studies demonstrate that the assessment of ground vibrations requires a comprehensive consideration of vibration source characteristics and soil properties.
Tavasoli and Ghazavi [13] reported that pile geometry has a significant influence on pile driving efficiency, energy consumption, and wave propagation. However, the existing research has predominantly focused on pipe piles (open-ended and closed-ended) [14,15]. In foundation projects, apart from pipe piles, sheet piles are also widely employed. They are versatile, cost-effective, and have excellent soil retaining and waterproofing capabilities, and are therefore often used as cofferdams, breakwaters, and retaining walls, etc. [16,17,18]. Lee et al. [19] conducted vibration-driven field tests on full-scale U-shaped piles to investigate the dynamic characteristics of the piles with and without clutch friction. Qin et al. [20] conducted field experiments on vibration-driven sheet piles in various soil conditions and investigated the effect of driving force, resistance, amplitude, and energy consumption on pile penetration rates. Grizi et al. [21] presented ground motion measurements during the driving of full-scale H-shaped piles using a diesel hammer, revealing the propagation and attenuation of the wave source. Massarsch et al. [22] carried out field tests to investigate the impact of operational parameters (frequency and eccentric moment) on the interaction between vibrating sheet piles and the surrounding ground. Table 1 provides a comparative overview of the key conditions for the aforementioned studies on driving-induced ground vibrations.

Table 1.
A comparison of key conditions in recent research on ground vibrations induced by pile driving.
Recently, sheet piles are commonly used as temporary supports in engineering practice and will be removed after the completion of construction, which leads to issues associated with pile extraction. However, to date, documented cases of the pile extraction process are still relatively limited [23,24]. Therefore, thorough investigation of the ground vibration behavior during pile extraction and assessment of the potential impacts of these vibrations is essential.
The purpose of this study is to investigate ground vibration responses during the vibratory driving and extraction of sheet piles, to analyze the negative impacts on existing buildings and potential disturbances to nearby residents, and to provide guidance for environmentally friendly construction. To achieve this objective, field tests of U-shaped sheet piles were conducted in Beijing silty clay, including both pile driving and extraction. Ground vibrations were monitored during the testing process. A numerical model was established based on the actual site conditions, utilizing the coupled Eulerian–Lagrangian (CEL) method to simulate the pile–soil interaction characteristics. The ground vibration response modes induced during pile driving and extraction were investigated, and vibration levels were assessed. Subsequently, a parametric study of the vibration source was conducted.
2. Field Testing
2.1. Project Overview
A sheet pile wall exceeding 3.7 km in length was installed to a depth of 12 m below the ground surface in an underground utility tunnel project located outside the Expo Park in Beijing, China. It was designed to be dismantled upon project completion. To assess and minimize the environmental impact during the construction of the sheet pile wall, project planners and contractors decided to conduct comprehensive field tests before the project. These field tests employed Larsen IV sheet piles, characterized by a U-shaped cross section with dimensions of 400 mm in width, 170 mm in height, 15.5 mm in thickness, and an area of 96.99 cm2; see Figure 1. Each 12 m long sheet pile weighs 913 kg. The driving and extraction of sheet piles were performed using a hydraulic vibratory hammer (PCF350, manufactured by FangFu Machinery, Tainan, China). This vibratory hammer generated an exciting force (Fc) through the counter-rotation of eccentric masses within its main body. The magnitude of the exciting force depends on the frequency and eccentric moment. The nominal parameters of this vibratory hammer are detailed in Table 2.
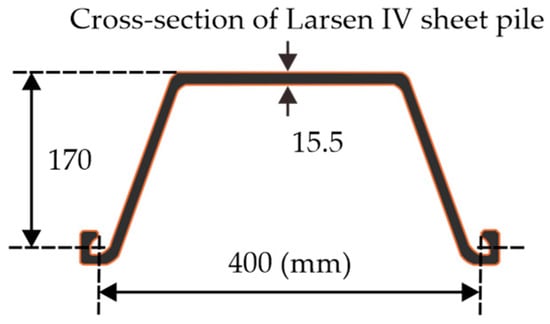
Figure 1.
Cross section and dimensions of Larsen IV sheet piles.

Table 2.
PCF350 vibratory hammer parameters as specified by the manufacturer.
2.2. Soil Conditions
Comprehensive information about the site’s soil conditions were provided by project engineers based on boreholes, in situ tests (such as standard penetration tests, shear wave velocity tests [25], etc.), and laboratory tests (such as triaxial tests, etc.). The soil conditions at the test site include plain fill, silty clay, clayey silt, and fine sand. Table 3 presents the physical and mechanical properties of each soil layer. Figure 2 illustrates the thickness of each soil layer, along with corresponding N-values obtained from standard penetration tests (SPT). Since no other results were available for cohesive soils, it was assumed that consistency index values are low for low N-values. The SPT results indicate that within the sediments at depths ranging from 1 to 20 m, N-values vary from 5 to 30. Specifically, the silty clay and clayey silt at depths of 1–18 m have relatively low N-values, less than 10, indicating a relatively soft or lose state. At greater depth, approximately 18–20 m (where fine sand is present), the N-values reach 30, indicating a denser state.

Table 3.
Physical and mechanical properties of each soil layer.
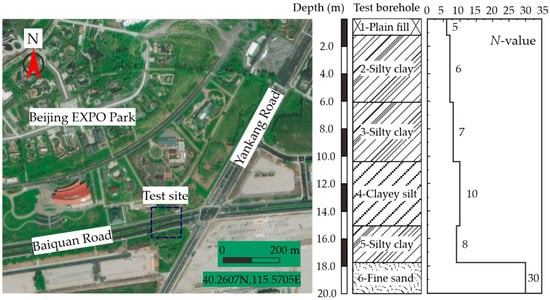
Figure 2.
In situ test site and borehole profile.
2.3. Test Procedures
The field test comprised two phases: pile driving and pile extraction. During pile driving, the applied force consisted of the exciting force and the combined weight of the vibrator and the pile, as shown in Equation (1). For pile extraction, the applied force included the exciting force and the pull force, as shown in Equation (2). Throughout the testing, the vibratory hammer operated at a constant frequency of 45 Hz.
where Fc is the exciting force; Fd is the driving force; Fe is the extraction force; f is the frequency; t is the time; Fsd and Fse are the static forces during pile driving and extraction, respectively.
The test site setup is depicted in Figure 3. Integrated Electronics Piezo-Electric (IEPE) accelerometers (DH186, DongHua Machinery Manufacturing, Jingjiang, China) were employed to monitor vertical ground vibration during the pile driving and extraction. The technical specifications of the acceleration sensor are as follows: it has a sensitivity of 100 mv/g, a measurement range of ±50 g, and a monitoring frequency range that extends from 0.5 to 5000 Hz. To install this, the shallow subsurface soil was excavated to a depth of 0.25 m, then the sensors were inserted into the soil profile and backfilled with soil. The sensors wires were connected to a multichannel data acquisition system (DH5909, DongHua Machinery, Jingjiang, China). This data acquisition system documented the voltage outputs of all accelerometers and stored the data in a computer. The velocity signals were obtained by a digital integration of the voltage signal through a data analysis system (DHDAS, Jiangsu Donghua Machinery, Jingjiang, China). It is worth noting that the reliability of the obtained velocity signals has been thoroughly verified by its manufacturer (DongHua Machinery, Jingjiang, China). To capture the ground vibration characteristics in the near field, accelerometers were positioned at radial distances of 2 m, 4 m, and 6 m, as illustrated in Figure 4.
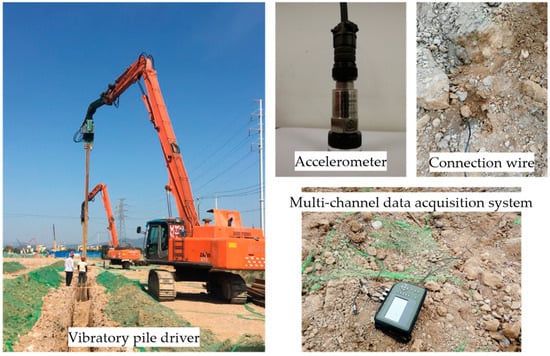
Figure 3.
Test site setup.
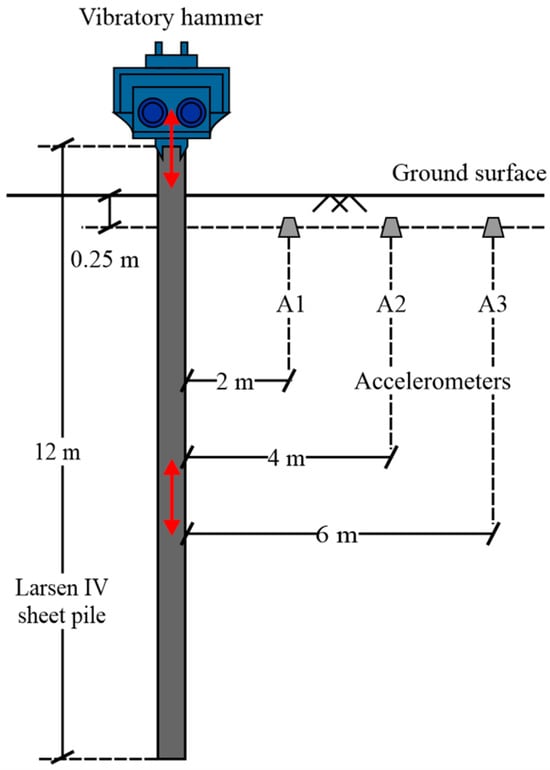
Figure 4.
Accelerometer arrangement at the test site.
Due to construction schedule constraints, the time interval between driving and extracting the sheet piles was set at 24 h. During the experimental process, a stopwatch with a precision of 0.01 s was used to record the time history of pile driving and extraction. Each moment when the sheet piles were penetrated or raised by 0.25 m increment was identified. Additionally, a video camera was fixed to document the entire process for future examination. Within each 0.25 m depth increment, the maximum velocity value from sensors was identified as the peak particle velocity (PPV) for that depth range, thus allowing for a correlation between the pile’s time history and the ground PPV data.
2.4. Test Results
In the field, achieving accurate control of the horizontal motion of sheet piles during both driving and extraction can be challenging. Grizi et al. [20] reported that the amplitude of the horizontal motion components of sheet piles is typically less than 30% of the vertical motion component. Therefore, the horizontal motions in this article are not considered. Figure 5 presents the relationship between pile depths and ground PPVs during the driving and extraction processes.
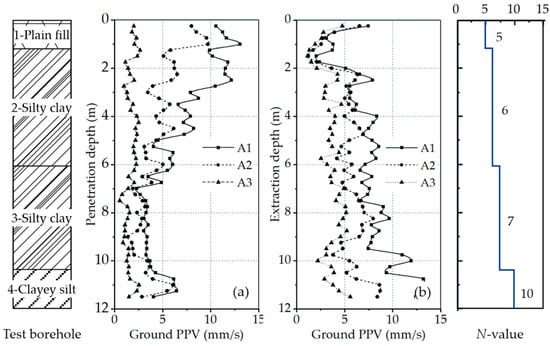
Figure 5.
Relationship between pile depth and ground PPV: (a) pile driving process; (b) pile extraction process.
The sheet pile reached a final penetration depth of 11.5 m and generally took 80 s (3600 cycles). As expected, the sensor closest to the driven sheet pile exhibited the highest vibration amplitude (velocity value), with the order being A1 > A2 > A3. The amplitude of ground vibration decreased with increasing radial distance from the driven sheet pile, due to the soil damping and energy dissipation. At further distances from the driven sheet pile, the amplitude of ground vibration continued to decrease until it eventually disappeared. In general, the amplitude variations for A1, A2, and A3 followed similar trends. Within a radial range of 6 m, the vibration velocity initially increased with penetration depth. Next, a significant decline was observed after reaching a penetration depth of approximately 2 m. As the penetration depth extended to around 6 m, the vibration velocity began to stabilize. Within a penetration depth of 10.0 m to 11.5 m, there was a slight increase in vibration velocity due to encountering soils with higher stiffness and shear strength (clayey silt layer). Generally, vibration velocity gradually decreased with increased penetration depth. During the driving tests, both A1 and A2 recorded their maximum ground PPV values at a depth of 1 m, measuring 13.06 mm/s and 9.71 mm/s, respectively. A3 recorded this value at a depth of 1.5 m, measuring 2.67 mm/s. It is evident that within the near-field range, the maximum ground PPV values are primarily occurred within the 1.5 m penetration depth range. Massarsch et al. [22] conducted field tests of vibratory sheet pile driving in sandy soils, in which a vibrator with a frequency of 38 Hz was used to drive Z-shaped sheet piles. They recorded a maximum ground PPV of approximately 16 mm/s, which occurred at penetration depths of 0.5–1 m. Although the soil properties, pile types, and vibration sources in their research are different from this article, the field observations are similar.
Extraction of the pile embedded at a depth of 11.5 m took about 50 s (2250 cycles). At the beginning of the pile extraction process, the highest ground vibration amplitudes were observed. At depths of approximately 11.25 m, A1 and A2 recorded their respective maximum ground PPV values of 13.65 m/s and 8.70 m/s. A3 recorded a maximum ground PPV value of 5.57 m/s, which was also at a depth of 11.5 m. Subsequently, as the sheet pile was gradually raised, the vibration velocity progressively decreased. Thereafter, when the extraction depth reached approximately 2 m, an upward trend in vibration velocity was once again observed.
3. Numerical Analysis
During field testing, due to site limitations, acceleration sensors were only arranged in the near-field range of the sheet pile, at a radial distance of 2, 4 and 6 m. In this section, the investigation range was expanded to the far-field through numerical simulation to gain a better understanding of ground vibration characteristics.
3.1. Numeriacal Methods
Vibratory pile driving is a typical dynamic problem, where large soil deformations occur within a short period and stress waves propagate rapidly. To effectively address this issue, an explicit time integration scheme was employed [26,27]. This scheme utilizes the central difference time integration rule, which can efficiently execute a large number of small-time increments with relatively low computational costs. For pile driving, solving this problem using the classical finite element (FE) method based on the Lagrangian formulation leads to mesh distortion around the pile. The coupled Eulerian–Lagrangian (CEL) method proposed by Noh [28] provides an effective solution. This method does not rely on a fixed mesh or coordinate system but tracks the displacement and velocity of the material. Hence, it can effectively deal with situations involving large deformations [29,30,31]. The CEL method enables the coexistence of Eulerian and Lagrangian elements within one model. The CEL method has been incorporated since commercial FE software Abaqus version 6.8. Figure 6 presents the conceptual CEL model used to simulate the vibratory pile driving process.
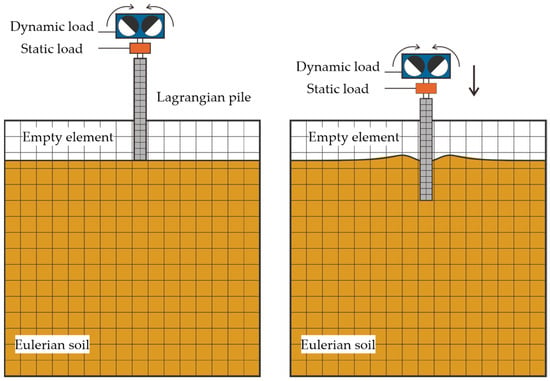
Figure 6.
Conceptual CEL model for simulating the vibratory pile driving process under field test conditions.
3.2. Model Generation
The modeling of dynamic response of vibratory pile driving is challenging, and a trade-off was made between numerical accuracy and computational cost, and then, an installation depth of 3 m for the sheet pile wall was considered. Heins and Grabe [32] found that for pile installation simulations, when the horizontal distance of the Eulerian region exceeds 9.5 times the pile’s outer diameter and the vertical model height exceeds 1.5 times the pile’s length, wave reflections at the truncated boundaries as well as potential impacts on the computational results are effectively eliminated. To this end, adequate dimensions of the Eulerian region were adopted: a horizontal distance exceeding 20 times the pile width (15 m) and a vertical distance greater than twice the depth of pile penetration (24 m). Additionally, a gradually coarsened mesh was employed to effectively absorb the waves generated. The soil was divided into two regions: the upper 1 m consisted of void Eulerian elements, allowing the subsoil to enter this region under a squeezing effect. The lower 23 m of the Eulerian elements were fully filled with material. Figure 7 depicts the geometry and meshing of the CEL model.
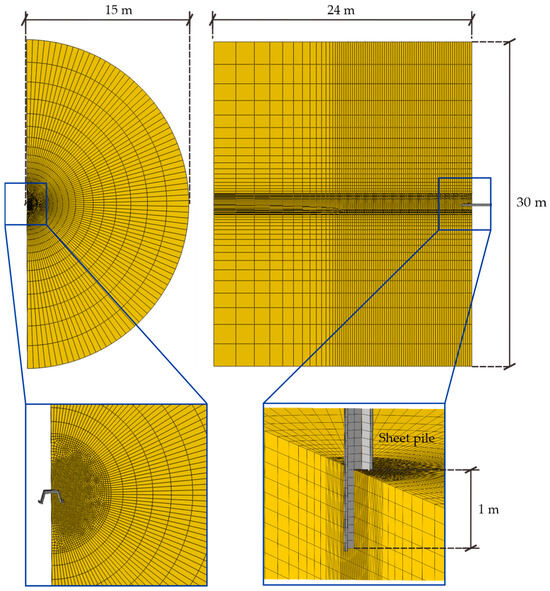
Figure 7.
Geometry and meshing of the CEL model.
In the model, all piles were discretized using Lagrangian elements, while the soil was discretized using Eulerian elements. The constitutive parameters for the materials utilized in the model are presented in Table 4. The pile materials were steel and were modeled using a linear elastic model. Due to technical constraints of the Eulerian elements, the entire soil profile was modeled using one Eulerian body. The subsoil within the 0–12 m depth of the test site (corresponding to soil layers 1–4) was simplified as a homogeneous silty clay layer. These soil domain parameters are mainly derived from the mean values of these four soil layers. The soil is assumed to follow the Mohr–Coulomb failure criterion and its associated flow rules. The analysis was conducted using the total stress formulation. Constraints were imposed on the horizontal and bottom boundaries of the model.

Table 4.
Constitutive parameters of the materials used in the model.
In CEL analysis, interactions are enforced using a general contact algorithm. The Coulomb friction model was employed to describe the tangential behavior of materials, while the hard contact was used to describe the normal behavior. Ko et al. [14] indicated that the friction coefficient at the soil–pile interface typically falls within the range of 0.21 to 0.42. In this study, a friction coefficient of 0.25 was defined.
In the model, Rayleigh damping provided by Abaqus was employed to simulate the soil damping effect. This damping mechanism includes two components as shown in Equation (3). The mass-related component reflects energy dissipation due to external factors, while the stiffness-related component represents material resistance to dynamic response, dependent on both strain and strain rate. Only the stiffness-proportional damping was introduced because the model’s external boundaries were constrained. The coefficient βR can be calculated using Equation (4). Ekanayake et al. [5] recommended a critical damping fraction associated with the first natural mode between 2% and 20% for numerical studies of vibratory pile driving. The natural frequency of this soil model was extracted using Abaqus/Standard, with a critical damping fraction ξ of 2%, resulting in ω1 of 2.396 Hz and ω2 of 2.467 Hz. Thus, the value of βR was determined to be 0.02.
where [C] is the damping matrices; αR and βR are the Rayleigh mass proportional damping coefficient and stiffness proportional damping coefficient, respectively; and [M] and [K] are mass matrix and stiffness matrix, respectively.
where ξ is the critical damping fraction, and ω1 is the first natural mode.
Appropriate dynamic and static loads were applied to the top of the sheet piles during vibratory pile driving and extraction. The dynamic load was an exciting force of 45 Hz, as shown in Figure 8. The static load was provided by the weight of the sheet pile, vibrator, and additional pressure. An implicit Lagrangian model was used to simulate the locking effect of the soil on the sheet pile after installation. The transfer of state variables was performed through a Python script. In this script, the state variables at the integration points of the CEL model were transferred to the integration points of the Lagrangian model. Subsequently, the obtained stress field was integrated into the pile extraction model.
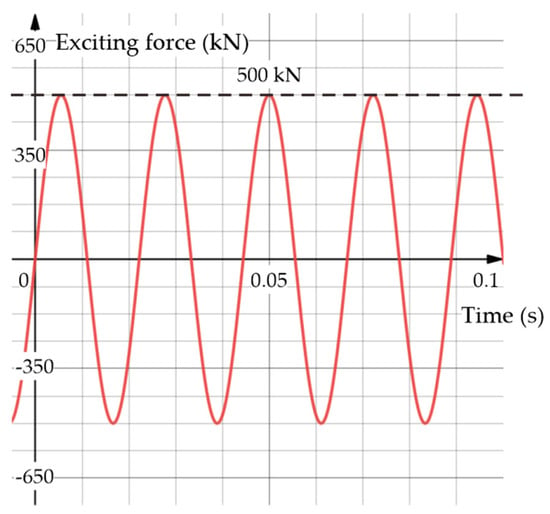
Figure 8.
Time history of dynamic loads applied to the top of the sheet pile in the model.
3.3. Validation and Analysis
Figure 9 compares the results of numerical simulations and field monitoring during vibratory driving. Overall, these two datasets show consistent trends. At a depth of approximately 1–2 m, there is a slight deviation between the numerical and measured values. This difference is likely due to the transition boundary between the plan fill layer and the silty clay layer within the test site. The varied soil properties in this transition zone would lead to wave reflection and refraction, thereby causing variations in ground vibration velocities. Considering the complexity of the vibratory pile driving process, some disparities between the two datasets are reasonable and understandable, as mentioned in References [31,33]. Figure 10 compares the results of numerical simulation and field monitoring during vibratory extraction (maximum ground PPV was extracted at each 0.5 m depth increment). Similarly, the consistency between these two datasets is slightly worse in the 1–2 m depth soil layers, as explained earlier. For the other parts, the consistency is good. By comparison, the reliability of the developed models is confirmed.
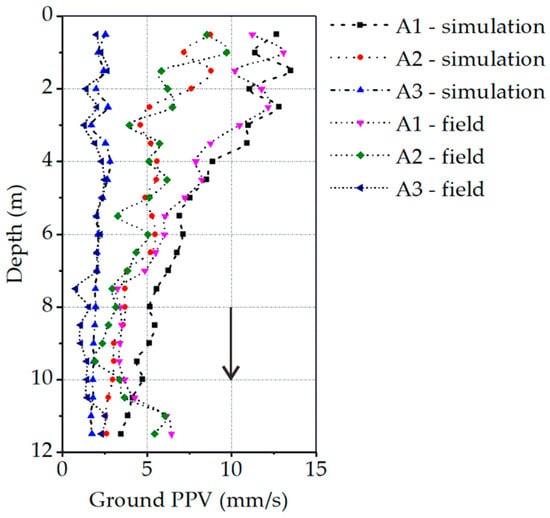
Figure 9.
Comparison between the numerical calculation results and the field monitoring data during sheet pile driving (maximum ground PPV was extracted at each 0.5 m depth increment).
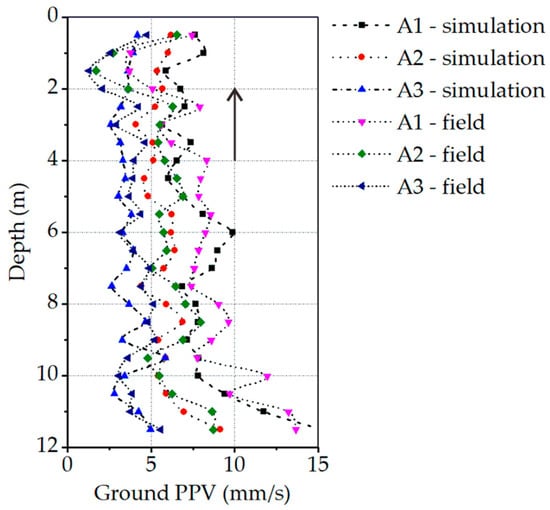
Figure 10.
Comparison between the numerical calculation results and the field monitoring data during vibratory sheet pile extraction (maximum ground PPV was extracted at each 0.5 m depth increment).
It can be concluded that the ground vibration amplitude changes from large to small as the sheet piles penetrate deeper. The higher vibration levels near the ground surface are mainly attributed to the pile’s entry effect. When the vibration source is located within the shallow subsoil, its impact on the ground is prominent. As the sheet piles penetrated deeper, the vibration energy is gradually dissipated in the deeper soil layers. During the initial stage of vibratory extraction, the amplitude of ground vibration induced is at its maximum to overcome the soil locking effect. The linear vibration of sheet piles leads to the softening of the surrounding soil. Consequently, the ground vibration levels gradually decrease in the later stages. When the sheet pile is pulled upwards into the shallow soil, the ground vibration levels increase again.
In order to observe the propagation trend of ground vibration with radial distance, the ground PPV versus radial distance curves were extracted as shown in Figure 11. The numerical results indicate that in the near-field range (<6 m), the ground PPV decreases rapidly. In the far-field range (>6 m), the attenuation rate slows down significantly. As the radial distance gradually increases to 12 m, the vibration levels are decreased to 1–2 mm/s. However, complete elimination of vibrations requires a greater distance.
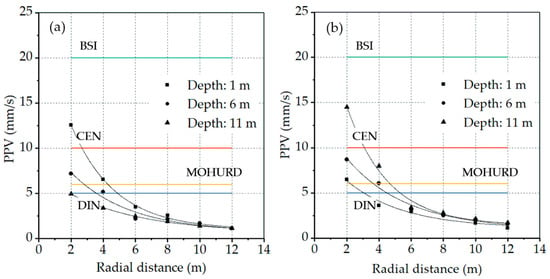
Figure 11.
Variation of ground PPV with radial distance as the sheet pile located at different depths in the models: (a) during pile driving; and (b) during pile extraction.
Sheet piles are commonly used in urban environments. Vibratory methods for driving and extracting sheet piles generate significant vibrations that may damage surrounding buildings and cause discomfort for local residents. To achieve the goal of environmentally friendly construction, many countries and regions have established standards and guidelines that specify allowable vibration levels for analyzing building damage issues, as displayed in Table 5. These standards typically use the PPV threshold as assessment criteria. Figure 12 presents a comparison between field vibration measurements in this study and allowable vibration levels for residential structures. It can be seen that due to the relatively thin cross section and light weight of sheet piles, their construction activities generally do not result in direct damage to surrounding buildings. Additionally, Table 6 provides guidance on analyzing vibration-level effects on human annoyance. The British Standards Institution (BSI) states that even vibrations with frequencies of about 1 Hz can lead to complaints in residential environments. It can be concluded that when the radial distance between the vibratory sheet pile construction and the residential area is less than 12 m, the vibration disturbance can be widely perceived by the residents. In other words, when the radial distance from the residential area is more than 12 m, the vibration disturbance to the local residents is within the acceptable limits.

Table 5.
Allowable vibration levels to prevent structural damage in Standards.
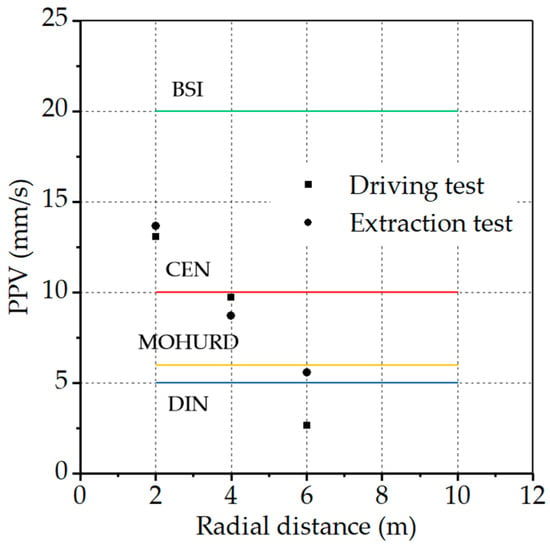
Figure 12.
Comparison of maximum PPV values measured in the field with allowable vibration levels: in residential structures.

Table 6.
Guidance on effects of vibration levels (British Standard BS 7385-2 [35]).
3.4. Parametric Study
In addition, numerical analyses were conducted to investigate the effects of vibration sources on ground vibration levels to mitigate potential risks. Six models were established, including both driving and extraction processes, and the driving frequency and amplitude were varied. Table 7 presents the results of the parametric study. During vibratory or impact pile driving, there exists a critical depth indicating the point at which ground vibration reach its maximum PPV [12,39,40]. The investigation of this critical depth helps to understand how pile vibration at different depths affects the ground surface, contributing to engineering planning and design.

Table 7.
Parametric study results for the models.
It was observed that during vibratory driving, as the amplitude of vibration sources decreases, the ground PPV slightly increases, and the critical depth moves upward. Figure 13 displays the displacement curves of the sheet pile in the models. It can be seen that with the decrease in amplitude, the pile’s penetration rate also decreases. The more cycles of loading the soil experiences within the same time frame, the more intense the ground vibration becomes. When the vibration source is located in shallow soil layers, the vibration energy is more easily transmitted to the ground surface, resulting in an increase in the ground PPV. Additionally, as the driving frequency decreases, the ground PPV increases, and the critical depth is located deeper. This may be attributed to the driving frequency approaching the resonance frequency of the pile–soil system, facilitating the pile penetration process but resulting in vibration amplification. The numerical results indicate that during vibratory sheet pile driving, the critical depth typically falls within the range of 0.58–0.63 m below the ground surface within a radial distance of 6 m. Rooz and Hamidi [12] conducted a numerical study on impact pipe pile driving in sandy clay soils and concluded that generally within a radial distance of 7 m from the pile, ground particles usually reach their maximum PPV value when the pile depth is in the range of 0.5 to 1 m. The numerical results are consistent with their conclusion.
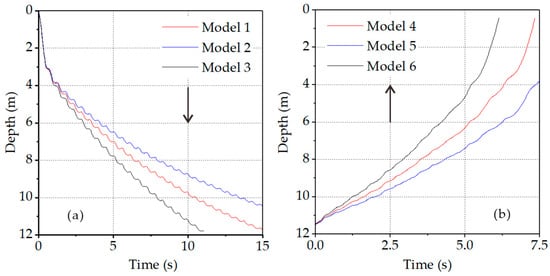
Figure 13.
Displacement curves of the sheet pile in the models: (a) during pile driving; and (b) during pile extraction.
Conversely, during vibratory extraction, as the amplitude of the vibration source decreases, the ground PPV also decreases, and the critical depth moves downward. Additionally, with a decrease in driving frequency, the pile’s extraction rate significantly increases, leading to an increase in ground PPV and an upward shift in the critical depth. The reasons for these phenomena were discussed earlier. During sheet pile extraction, the critical depth in the model belongs to 11.25–11.33 m, corresponding to the embedding depth of the sheet pile. A comparison reveals that when both driving frequency and amplitude are varied by 20%, the change in frequency has a more significant impact on the pile penetration rate and ground vibration levels.
4. Conclusions
Ground vibrations generated during sheet pile construction in urban environments is directly related to the infrastructure safety and environmental concerns. In this study, ground vibration response modes of driving and extracting sheet piles were investigated through field experiments and numerical simulations. The objective is to gain a comprehensive understanding of ground vibration behavior so as to effectively assess its potential impacts and take appropriate measures to mitigate the vibration levels. The results indicate that:
- (1)
- Ground vibration response modes are distinctly different during the driving and extraction of sheet piles. During pile driving, the critical depth typically belongs to the shallower soil layers (<1 m) due to the pile’s entry effect. During pile extraction, sheet piles need to overcome the soil locking effect, leading to a critical depth usually corresponding to the embedment depth of the sheet pile.
- (2)
- A systematic assessment reveals that ground vibrations caused by sheet pile construction activities generally do not directly damage adjacent buildings or structures, but may cause annoyance to nearby residents. Ground vibrations rapidly decrease in the near-field (<6 m), while in the far-field (>6 m), the attenuation rate significantly slows down. Vibration disturbance can be widely perceived by local residents within a radial distance of less than 12 m.
- (3)
- Appropriate adjustments to vibration source parameters can effectively reduce ground vibration levels. Rapidly driving sheet piles into shallow soil layers with higher frequencies and larger amplitudes can effectively mitigate vibrations. During pile extraction, it is recommended to initially vibrate the sheet pile at higher frequencies and smaller amplitudes for a period to soften the surrounding soil before slowly extracting it.
Author Contributions
Investigation, methodology, software, validation, and writing—original draft preparation, F.G.; writing—review and editing, C.J., Z.L., Y.W. and F.H.; project administration and supervision, C.J. and G.W.; data curation, S.Y. All authors have read and agreed to the published version of the manuscript.
Funding
The first author of this research was funded by the China Scholarship Council (No. 202206400056) and the 2023 Graduate Innovation Fund Project of China University of Geosciences, Beijing (No. ZD2023YC037). The third author was funded by the “Urban Geological Environment and Engineering” High-Precision Discipline Construction Project of the National Natural Science Foundation of China (No. 41772326).
Data Availability Statement
Data are contained within the article.
Acknowledgments
Data from the site were generously provided by Beijing Municipal Road and Bridge Co., Ltd., the entity responsible for designing and executing the sheet pile project. The authors would like to express their gratitude to the project team for their valuable support.
Conflicts of Interest
Author Shuo Yang was employed by the Beijing Municipal Road and Bridge Co., Ltd. The remaining authors declare that the research was conducted in the absence of any commercial or financial relationships that could be construed as a potential conflict of interest.
References
- Staubach, P.; Machacek, J.; Bienen, B.; Wichtmann, T. Long-term response of piles to cyclic lateral loading following vibratory and impact driving in water-saturated sand. J. Geotech. Geoenviron. Eng. 2022, 148, 04022097. [Google Scholar] [CrossRef]
- Daryaei, R.; Bakroon, M.; Aubram, D.; Rackwitz, F. Numerical evaluation of the soil behavior during pipe-pile installation using impact and vibratory driving in sand. Soil Dyn. Earthq. Eng. 2020, 134, 106177. [Google Scholar] [CrossRef]
- Tsetas, A.; Tsouvalas, A.; Gómez, S.; Pisanò, F.; Kementzetzidis, E.; Molenkamp, T.; Elkadi, A.S.K.; Metrikine, A.V. Gentle Driving of Piles (GDP) at a sandy site combining axial and torsional vibrations: Part I—Installation tests. Ocean. Eng. 2023, 270, 113453. [Google Scholar] [CrossRef]
- Molenkamp, T.; Tsouvalas, A.; Metrikine, A. The influence of contact relaxation on underwater noise emission and seabed vibrations due to offshore vibratory pile installation. Front. Mar. Sci. 2023, 10, 1118286. [Google Scholar] [CrossRef]
- Ekanayake, S.D.; Liyanapathirana, D.S.; Leo, C.J. Attenuation of ground vibrations using in-filled wave barriers. Soil Dyn. Earthq. Eng. 2014, 67, 290–300. [Google Scholar] [CrossRef]
- Colaço, A.; Costa, P.A.; Parente, C.M.; Cardoso, A.S. Ground-borne noise and vibrations in buildings induced by pile driving: An integrated approach. Appl. Acoust. 2019, 179, 108059. [Google Scholar] [CrossRef]
- Sun, Z.; Yu, H.; Li, C.; Liu, R.; Li, Q.; Su, C. Ground and pile vibrations induced by pile driving. Buildings 2023, 13, 1884. [Google Scholar] [CrossRef]
- Wang, W.; Wei, J.; Wu, J.; Zhou, R. Field test and analysis on effects of pile driving with high—Frequency and resonance—Free technology on surrounding Soil. J. Build. Struct. 2021, 42, 131–138. (In Chinese) [Google Scholar] [CrossRef]
- Wood, R.D. Dynamic Effects of Pile Installations on Adjacent Structures; NCHRP Synthesis 253; Transportation Research Board; National Research Council: Washington, DC, USA, 1997. [Google Scholar]
- Cui, C.; Liang, Z.; Xu, C.; Wang, B. Analytical solution for horizontal vibration of end-bearing single pile in radially heterogeneous saturated soil. Appl. Math. Model. 2023, 116, 65–83. [Google Scholar] [CrossRef]
- Ekanayake, S.D.; Liyanapathirana, D.S.; Leo, C.J. Influence zone around a closed-ended pile during vibratory driving. Soil Dyn. Earthq. Eng. 2013, 53, 26–36. [Google Scholar] [CrossRef]
- Rooz, A.F.H.; Hamidi, A. Numerical analysis of factors affecting ground vibrations due to continuous impact pile driving. Int. J. Geomech. 2017, 17, 04017107. [Google Scholar] [CrossRef]
- Tavasolia, O.; Ghazavib, M. Wave propagation and ground vibrations due to non-uniform cross-sections piles driving. Comput. Geotech. 2018, 104, 13–21. [Google Scholar] [CrossRef]
- Ko, J.; Jeong, S.; Lee, J. Large deformation FE analysis of driven steel pipe piles with soil plugging. Comput. Geotech. 2016, 71, 82–97. [Google Scholar] [CrossRef]
- Zhang, Y.; Yin, J.; Bai, X.; Cui, L.; Sang, S.; Liu, J.; Yan, N.; Zhang, M. Study on damage constitutive relationship of mudstone affected by dynamic pile driving. Soil Dyn. Earthq. Eng. 2023, 164, 107653. [Google Scholar] [CrossRef]
- Tang, L.; Cong, S.; Xi, W.; Ling, X.; Geng, L.; Nie, Z. Finite element analysis of lateral earth pressure on sheet pile walls. Eng. Geol. 2018, 244, 146–158. [Google Scholar] [CrossRef]
- Wang, J.; Xiang, H.; Yan, J. Numerical simulation of steel sheet pile support structures in foundation pit excavation. Int. J. Geomech. 2019, 19, 05019002. [Google Scholar] [CrossRef]
- Qu, L.; Luo, H.; Hu, H.; Jia, H.; Zhang, D. Dynamic response of anchored sheet pile wall under ground motion: Analytical model with experimental validation. Soil Dyn. Earthq. Eng. 2018, 115, 896–906. [Google Scholar] [CrossRef]
- Lee, S.; Kim, B.; Han, J. Prediction of penetration rate of sheet pile installed in sand by vibratory pile driver. KSCE J. Civ. Eng. 2012, 16, 316–324. [Google Scholar] [CrossRef]
- Qin, Z.; Chen, L.; Song, C.; Sun, L. Field tests to investigate the penetration rate of piles driven by vibratory installation. Shock. Vib. 2017, 2017, 7236956. [Google Scholar] [CrossRef]
- Grizi, A.; Athanasopoulos-Zekkos, A.; Woods, R.D. Ground vibration measurements near impact pile driving. J. Geotech. Geoenviron. Eng. 2016, 142, 04016035. [Google Scholar] [CrossRef]
- Massarsch, R.; Wersäll, C.; Fellenius, B.H. Dynamic ground response during vibratory sheet pile driving. J. Geotech. Geoenviron. Eng. 2021, 147, 04021043. [Google Scholar] [CrossRef]
- Sun, T.; Zhang, Z.; Yang, J.; Yang, J.; Zhang, X. Dynamic characteristics of the surrounding soil during the vibrational pulling process of a pile based on DEM. Shock. Vib. 2020, 2020, 5092102. [Google Scholar] [CrossRef]
- Inazumi, S.; Kuwahara, S.; Nontananandh, S.; Jotisankasa, A.; Chaiprakaikeow, S. Numerical analysis for ground subsidence caused by extraction holes of removed piles. Appl. Sci. 2022, 12, 5481. [Google Scholar] [CrossRef]
- Aloisio, A.; Totani, F.; Totani, G. Experimental dispersion curves of non-penetrable soils from direct dynamic measurements using the seismic dilatometer (SDMT). Soil Dyn. Earthq. Eng. 2021, 143, 106616. [Google Scholar] [CrossRef]
- Walker, J.; Yu, H. Adaptive finite element analysis of cone penetration in clay. Acta Geotech. 2006, 1, 43–57. [Google Scholar] [CrossRef]
- Pucker, T.; Grabe, J. Numerical simulation of the installation process of full displacement piles. Comput. Geotech. 2012, 45, 93–106. [Google Scholar] [CrossRef]
- Noh, W.F. CEL: A Time-Dependent, Two-Space-Dimensional, Coupled Eulerian-Lagrange Code; Lawrence Radiation Laboratory, University of California: Berkeley, CA, USA, 1963. [Google Scholar] [CrossRef]
- Hamann, T.; Qiu, G.; Grabea, J. Application of a Coupled Eulerian–Lagrangian approach on pile installation problems under partially drained conditions. Comput. Geotech. 2015, 63, 279–290. [Google Scholar] [CrossRef]
- Staubach, P.; Machacek, J.; Moscoso, M.C.; Wichtmann, T. Impact of the installation on the long-term cyclic behaviour of piles in sand: A numerical study. Soil Dyn. Earthq. Eng. 2020, 138, 106223. [Google Scholar] [CrossRef]
- Staubach, P.; Machacek, J.; Skowronek, J.; Wichtmann, T. Vibratory pile driving in water-saturated sand: Back-analysis of model tests using a hydro-mechanically coupled CEL method. Soils Found. 2021, 61, 144–159. [Google Scholar] [CrossRef]
- Heins, E.; Grabe, J. Class-A-prediction of lateral pile deformation with respect to vibratory and impact pile driving. Comput. Geotech. 2017, 86, 108–119. [Google Scholar] [CrossRef]
- Qiu, G.; Henke, S.; Grabe, J. Application of a Coupled Eulerian–Lagrangian approach on geomechanical problems involving large deformations. Comput. Geotech. 2011, 38, 30–39. [Google Scholar] [CrossRef]
- ENV 1993-5; Design of Steel Structures-Part 5: Piling. Eurocode 3. CEN (European Committee for Standardization): Brussels, Belgium, 1993.
- BS 7385-2; Evaluation and Measurement for Vibration in Buildings-Part 2: Guide to Damage Levels from Groundbourne Vibration. BSI (British Standards Institution): London, UK, 1993.
- DIN 4150-3; Structural Vibration–Part 3: Effects of Vibration on Structures. DIN (German Institute for Standardization): Berlin, Germany, 1999.
- SN640312; Vibrations—Vibration Effects in Buildings. SNV (Swiss Association for Standardization): Winterthur, Switzerland, 1992.
- GB50868; Standard for Allowable Vibration of Building Engineering-Part 8: Building Construction Vibration. MOHURD (China Standards Institution): Beijing, China, 2013.
- Rooz, A.F.H.; Hamidi, A. A numerical model for continuous impact pile driving using ALE adaptive mesh method. Soil Dyn. Earthq. Eng. 2019, 118, 134–143. [Google Scholar] [CrossRef]
- Hamidi, A.; Rooz, A.F.H. Efficiency analysis of open trench for impact pile driving through a single-variable method. Mar. Georesour. Geotechnol. 2019, 39, 82–102. [Google Scholar] [CrossRef]
Disclaimer/Publisher’s Note: The statements, opinions and data contained in all publications are solely those of the individual author(s) and contributor(s) and not of MDPI and/or the editor(s). MDPI and/or the editor(s) disclaim responsibility for any injury to people or property resulting from any ideas, methods, instructions or products referred to in the content. |
© 2023 by the authors. Licensee MDPI, Basel, Switzerland. This article is an open access article distributed under the terms and conditions of the Creative Commons Attribution (CC BY) license (https://creativecommons.org/licenses/by/4.0/).