
Local Climate Zone in Xi’an City: A Novel Classification Approach Employing Spatial Indicators and Supervised Classification


Abstract
:1. Introduction
1.1. Impact of Urbanization on Urban Climate
1.2. Role of LCZ in Urban Climate Research
1.3. LCZ Classification Methods and Statistical Units
1.4. Research Objectives
- To enhance local climate zoning in Xi’an by utilizing land parcels as the foundational statistical units. This will involve revising existing criteria to better align with the unique urban spatial planning features of Xi’an. We employ two distinct classification methodologies: one based on urban spatial indicators and supervised classification, and another reliant on urban morphology indicators, employing spatial clustering techniques to categorize surface attributes within the Xi’an region.
- To evaluate these two classification methods and determine the most suitable approach for urban local climate zoning in Xi’an. This evaluation not only assesses the compatibility of the local climate zoning hierarchical system but also explores the spatial distribution characteristics of local climate zoning within the Xi’an urban area.
2. Materials and Methods
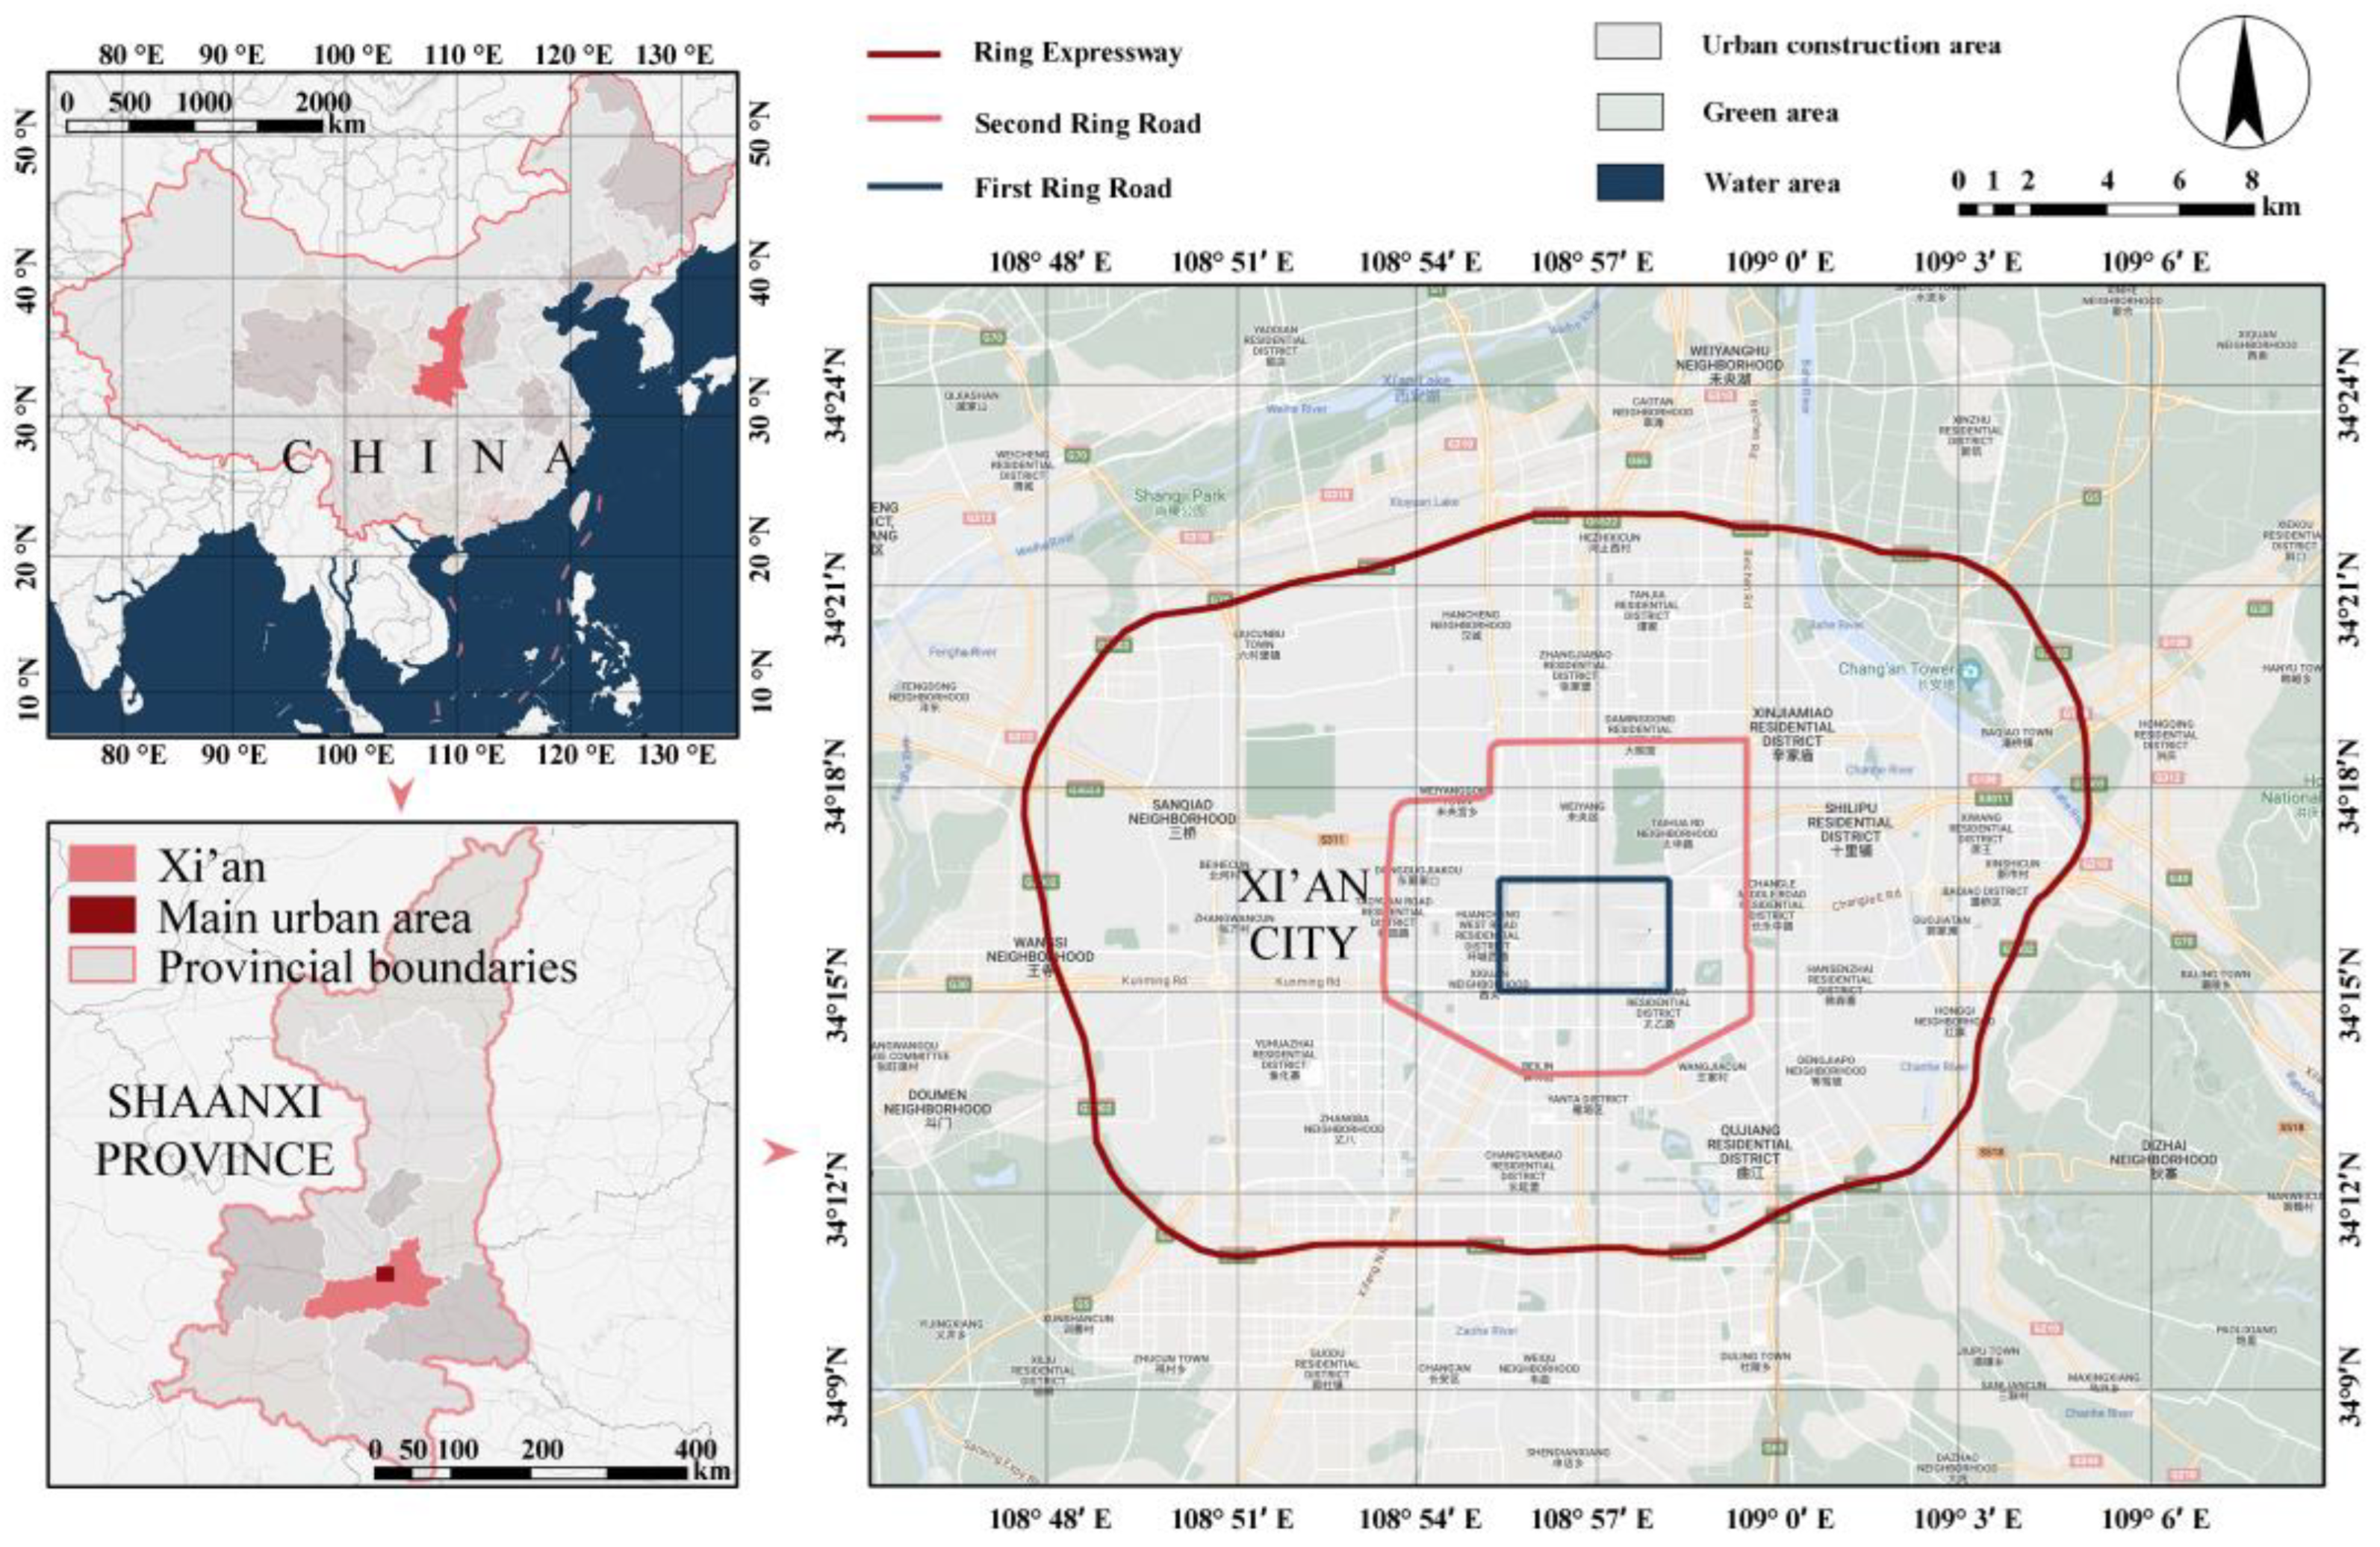
2.1. Research Area
2.2. Data Sources and Indicator Calculation Methods
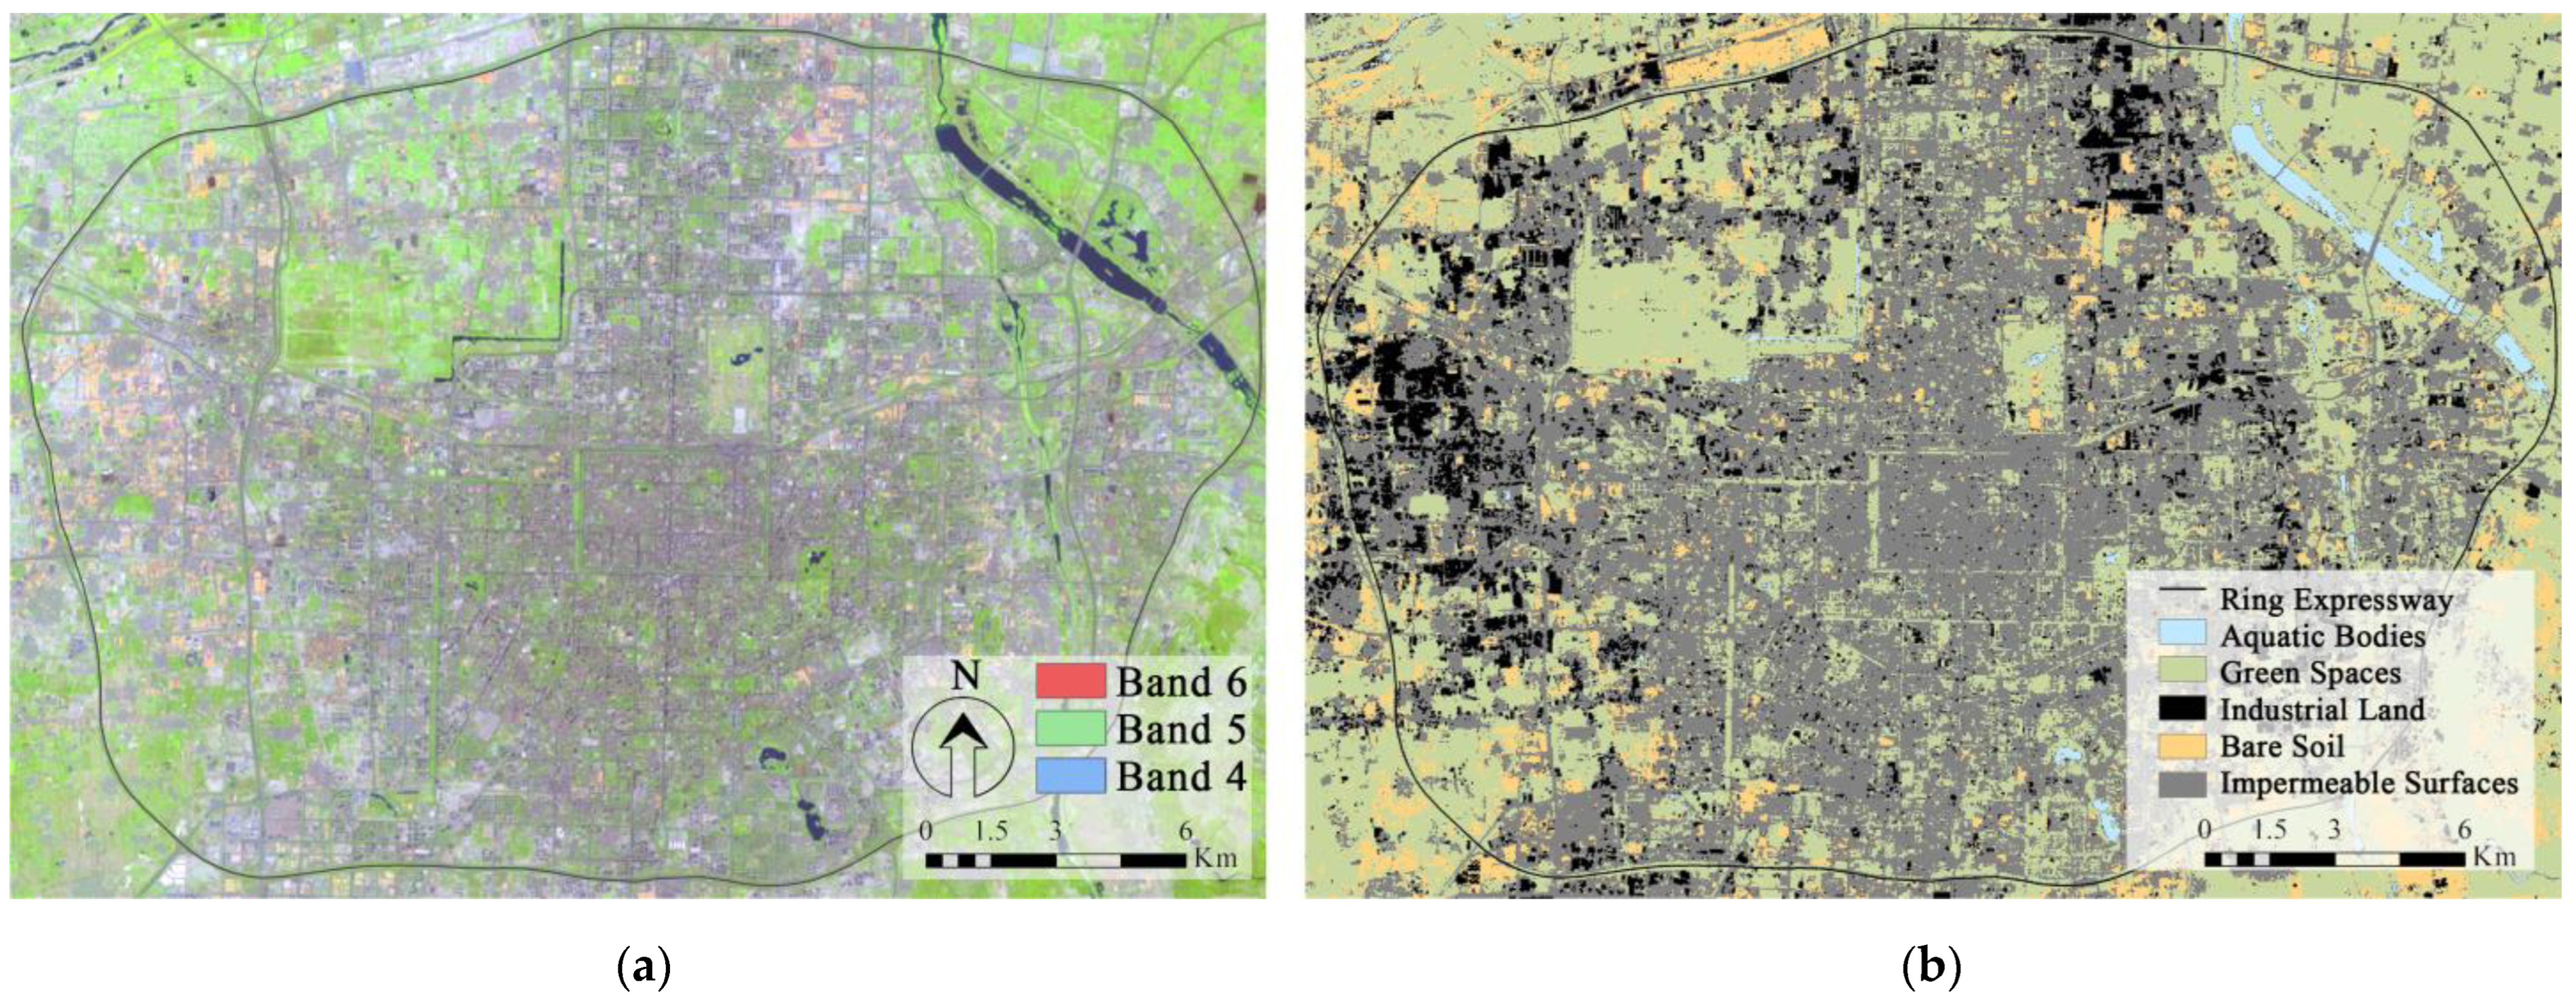
2.2.1. Underlying Surface Indicators
2.2.2. Street Block Three-Dimensional Morphology Indicators
2.3. Classification of Local Climate Zones in Xi’an Based on Urban Spatial Indicators and Supervised Classification
2.4. Classification of Local Climate Zones in Xi’an Based on Spatial Clustering Analysis Methods
3. Results and Discussion
3.1. Spatial Distribution Characteristics of Local Climate Zones in Xi’an City
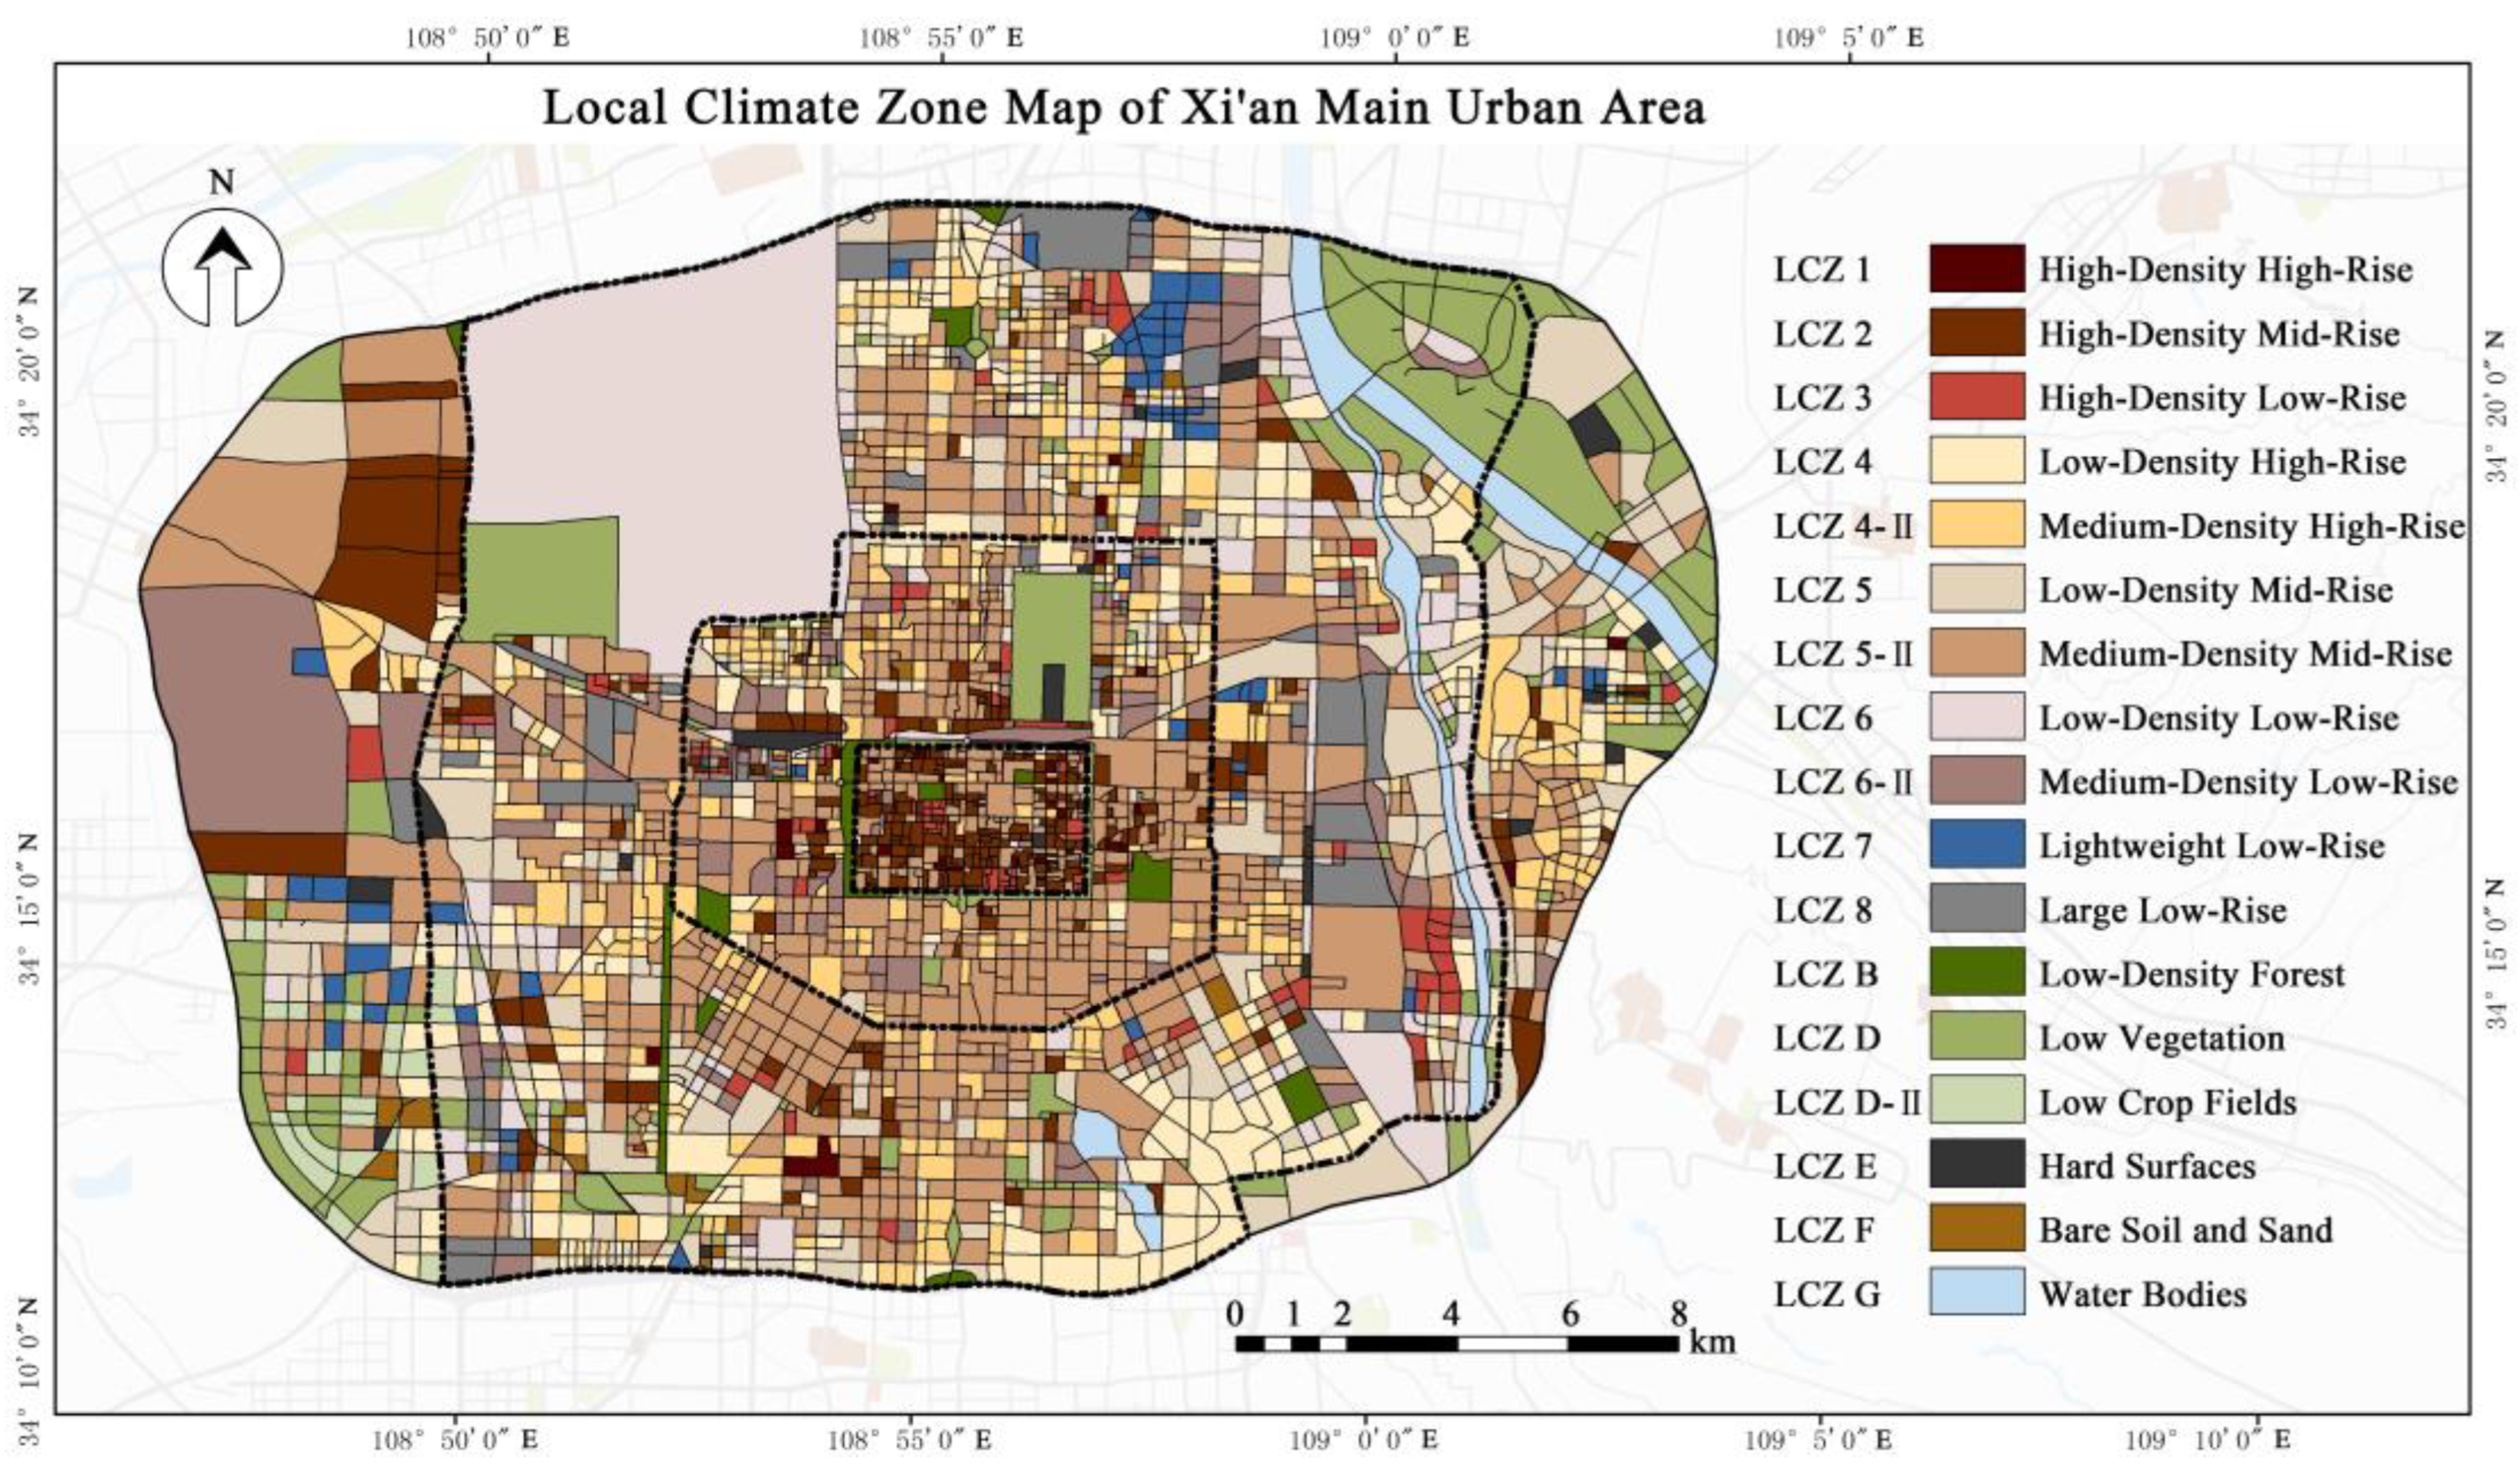
3.1.1. Local Climate Zone Based on the Supervised Classification Method
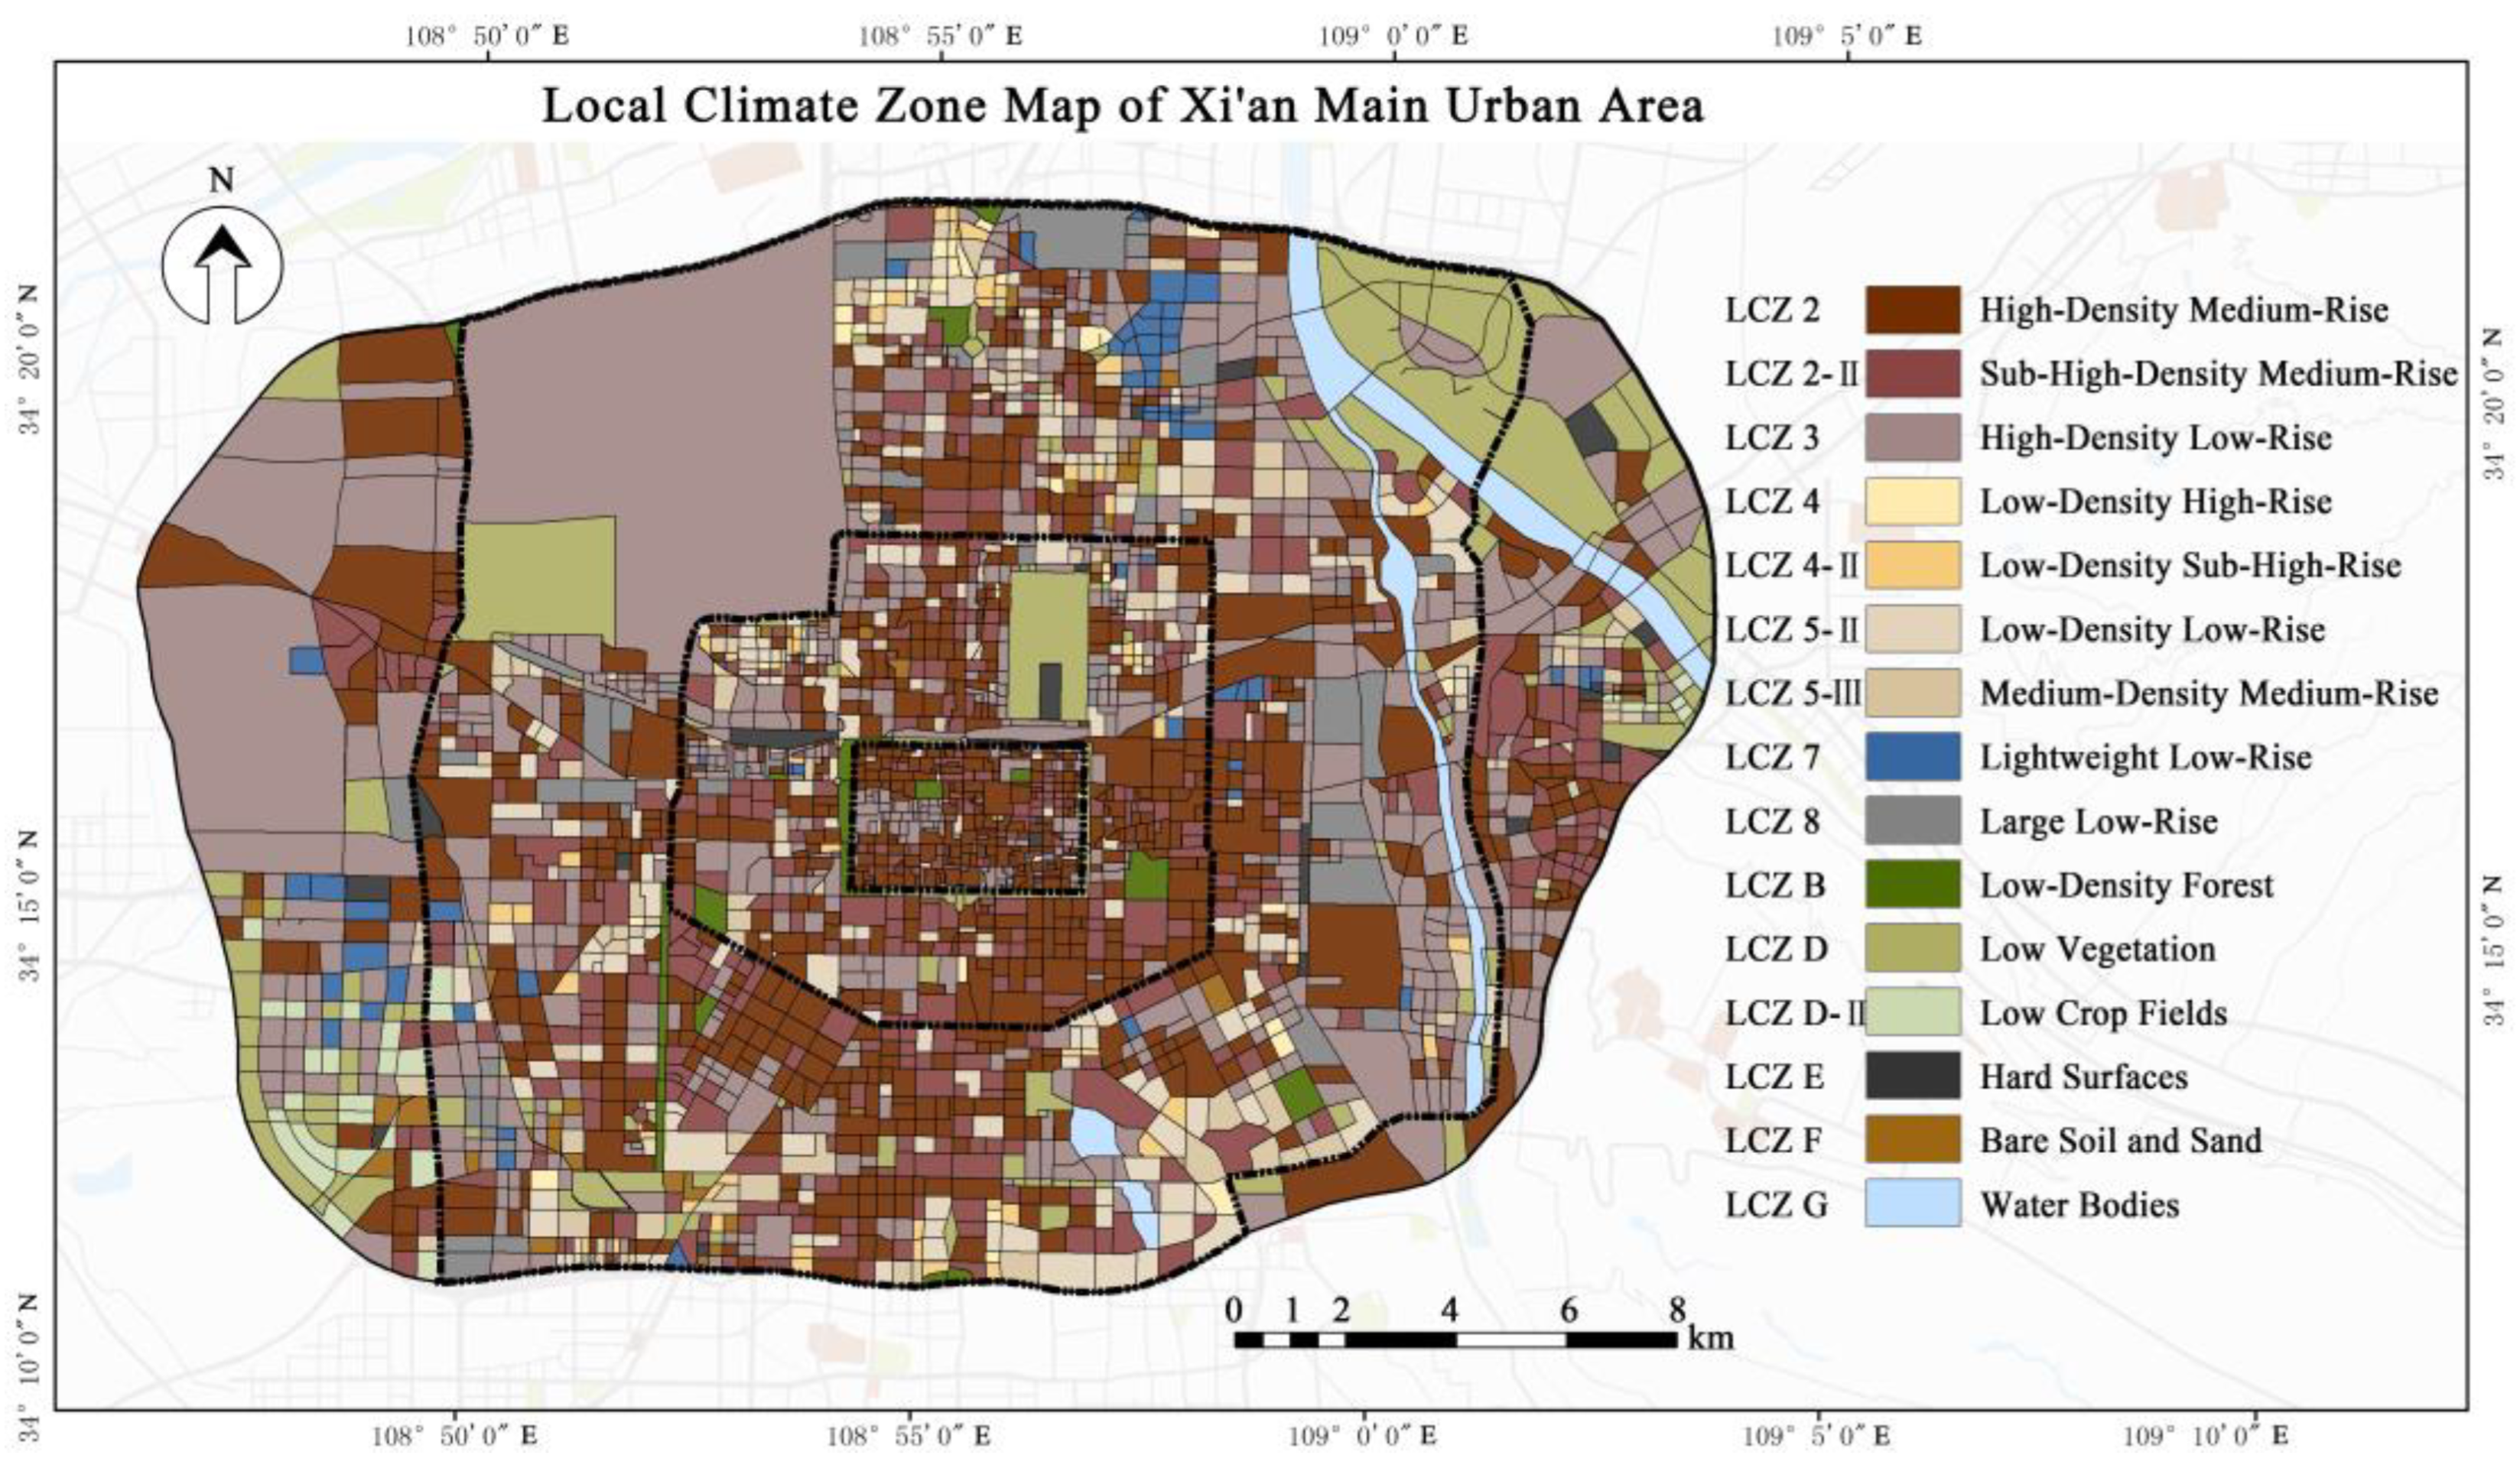
3.1.2. Local Climate Zone According to the Clustering Classification Method
3.2. Performance Evaluation of the Improved Local Climate Zone System in Xi’an
3.3. Comparison with Other Studies
4. Conclusions
Author Contributions
Funding
Data Availability Statement
Conflicts of Interest
References
- Lee, D.; Oh, K. Classifying urban climate zones (UCZs) based on statistical analyses. Urban Clim. 2018, 24, 503–516. [Google Scholar] [CrossRef]
- Stewart, I.D.; Oke, T. Local Climate Zones for Urban Temperature Studies. Bull. Am. Meteorol. Soc. 2012, 93, 1879–1900. [Google Scholar] [CrossRef]
- Guo, H.Z.Q.; Wang, J. Indicator System for Local Climate Zoning in Wuhan City: A Focus on Planning and Decision Making. Inheritance and Transformation. In Proceedings of the 2015 China Urban Planning Annual Conference, Guiyang, China, 19–21 September 2015; pp. 255–264. [Google Scholar]
- Lelovics, E.; Unger, J.; Gál, T.; Gál, C.V. Design of an urban monitoring network based on Local Climate Zone mapping and temperature pattern modelling. Clim. Res. 2014, 60, 51–62. [Google Scholar] [CrossRef]
- Alexander, P.J.; Mills, G. Local climate classification and Dublin’s urban heat island. Atmosphere 2014, 5, 755–774. [Google Scholar] [CrossRef]
- Leconte, F.; Bouyer, J.; Claverie, R.; Pétrissans, M. Using Local Climate Zone scheme for UHI assessment: Evaluation of the method using mobile measurements. Build. Environ. 2015, 83, 39–49. [Google Scholar] [CrossRef]
- Zheng, Y.; Ren, C.; Xu, Y.; Wang, R.; Ho, J.; Lau, K.; Ng, E. GIS-based mapping of Local Climate Zone in the high-density city of Hong Kong. Urban Clim. 2018, 24, 419–448. [Google Scholar] [CrossRef]
- Chen, F.H.Y. Construction of Local Climate Zoning Maps for Chengdu City Using the WUDAPT Method and Its Planning Applications. Urban Archit. 2018, 20, 29–32. [Google Scholar]
- Cai, M.; Ren, C.; Xu, Y.; Lau, K.K.L.; Wang, R. Investigating the relationship between local climate zone and land surface temperature using an improved WUDAPT methodology—A case study of Yangtze River Delta, China. Urban Clim. 2018, 24, 485–502. [Google Scholar] [CrossRef]
- Yang, X.; Yao, L.; Jin, T.; Peng, L.L.; Jiang, Z.; Hu, Z.; Ye, Y. Assessing the thermal behavior of different local climate zones in the Nanjing metropolis, China. Build. Environ. 2018, 137, 171–184. [Google Scholar] [CrossRef]
- Yin, J.; Yin, Z.; Zhong, H.; Xu, S.; Hu, X.; Wang, J.; Wu, J. Monitoring urban expansion and land use/land cover changes of Shanghai metropolitan area during the transitional economy (1979–2009) in China. Environ. Monit. Assess. 2011, 177, 609–621. [Google Scholar] [CrossRef]
- Patra, S.; Sahoo, S.; Mishra, P.; Mahapatra, S.C. Impacts of urbanization on land use /cover changes and its probable implications on local climate and groundwater level. J. Urban Manag. 2018, 7, 70–84. [Google Scholar] [CrossRef]
- Das, M.; Das, A.; Mandal, S. Outdoor thermal comfort in different settings of a tropical planning region: A study on Sriniketan-Santiniketan Planning Area (SSPA), Eastern India. Sustain. Cities Soc. 2020, 63, 102433. [Google Scholar] [CrossRef]
- Choudhury, D.; Das, A.; Das, M. Investigating thermal behavior pattern (TBP) of local climatic zones (LCZs): A study on industrial cities of Asansol-Durgapur development area (ADDA), eastern India. Urban Clim. 2021, 35, 100727. [Google Scholar] [CrossRef]
- Singh, P.; Kikon, N.; Verma, P. Impact of land use change and urbanization on urban heat island in Lucknow city, Central India. A remote sensing based estimate. Sustain. Cities Soc. 2017, 32, 100–114. [Google Scholar] [CrossRef]
- Murali, R.M.; Riyas, M.J.; Reshma, K.N.; Kumar, S.S. Climate change impact and vulnerability assessment of Mumbai city, India. Nat. Hazards 2020, 102, 575–589. [Google Scholar] [CrossRef]
- Shi, Y.; Ren, C.; Luo, M.; Ching, J.; Li, X.; Bilal, M.; Fang, X.; Ren, Z. Utilizing world urban database and access portal tools (WUDAPT) and machine learning to facilitate spatial estimation of heatwave patterns. Urban Clim. 2021, 36, 100797. [Google Scholar] [CrossRef]
- Ma, W.; Zeng, W.; Zhou, M.; Wang, L.; Rutherford, S.; Lin, H.; Liu, T.; Zhang, Y.; Xiao, J.; Zhang, Y.; et al. The short-term effect of heat waves on mortality and its modifiers in China: An analysis from 66 communities. Environ. Int. 2015, 75, 103–109. [Google Scholar] [CrossRef]
- Mayrhuber, E.A.S.; Dückers, M.L.; Wallner, P.; Arnberger, A.; Allex, B.; Wiesböck, L.; Wanka, A.; Kolland, F.; Eder, R.; Hutter, H.P.; et al. Vulnerability to heatwaves and implications for public health interventions—A scoping review. Environ. Res. 2018, 166, 42–54. [Google Scholar] [CrossRef]
- Wei, H.K.; Du, Z.P.Y.; Cui, H.; Yu, F. China’s Rural Development Report (2021) Agricultural and Rural Modernization towards 2035; China Social Sciences Press: Beijing, China, 2021. [Google Scholar]
- Das, M.; Das, A. Assessing the relationship between local climatic zones (LCZs) and land surface temperature (LST)—A case study of Sriniketan-Santiniketan Planning Area (SSPA), West Bengal, India. Urban Clim. 2020, 32, 100591. [Google Scholar] [CrossRef]
- Kotharkar, R.; Bagade, A. Evaluating urban heat island in the critical local climate zones of an Indian city. Landsc. Urban Plan. 2018, 169, 92–104. [Google Scholar] [CrossRef]
- Khamchiangta, D.; Dhakal, S. Future urban expansion and local climate zone changes in relation to land surface temperature: Case of Bangkok Metropolitan Administration, Thailand. Urban Clim. 2021, 37, 100835. [Google Scholar] [CrossRef]
- Huang, K.; Leng, J.; Xu, Y.; Li, X.; Cai, M.; Wang, R.; Ren, C. Facilitating urban climate forecasts in rapidly urbanizing regions with land-use change modeling. Urban Clim. 2021, 36, 100806. [Google Scholar] [CrossRef]
- Unal Cilek, M.; Cilek, A. Analyses of land surface temperature (LST) variability among local climate zones (LCZs) comparing Landsat-8 and ENVI-met model data. Sustain. Cities Soc. 2021, 69, 102877. [Google Scholar] [CrossRef]
- Lau, K.K.-L.; Chung, S.C.; Ren, C. Outdoor thermal comfort in different urban settings of sub-tropical high-density cities: An approach of adopting local climate zone (LCZ) classification. Build. Environ. 2019, 154, 227–238. [Google Scholar] [CrossRef]
- Geletič, J.; Lehnert, M.; Savić, S.; Milošević, D. Inter-/intra-zonal seasonal variability of the surface urban heat island based on local climate zones in three central European cities. Build. Environ. 2019, 156, 21–32. [Google Scholar] [CrossRef]
- Hu, J.; Yang, Y.; Pan, X.; Zhu, Q.; Zhan, W.; Wang, Y.; Ma, W.; Su, W. Analysis of the Spatial and Temporal Variations of Land Surface Temperature Based on Local Climate Zones: A Case Study in Nanjing, China. IEEE J. Sel. Top. Appl. Earth Obs. Remote Sens. 2019, 12, 4213–4223. [Google Scholar] [CrossRef]
- Geletič, J.; Lehnert, M.; Dobrovolný, P. Land Surface Temperature Differences within Local Climate Zones, Based on Two Central European Cities. Remote Sens. 2016, 8, 788. [Google Scholar] [CrossRef]
- Collins, J.; Dronova, I. Urban Landscape Change Analysis Using Local Climate Zones and Object-Based Classification in the Salt Lake Metro Region, Utah, USA. Remote Sens. 2019, 11, 1615. [Google Scholar] [CrossRef]
- Aslam, A.; Rana, I.A. The use of local climate zones in the urban environment: A systematic review of data sources, methods, and themes. Urban Clim. 2022, 42, 101120. [Google Scholar] [CrossRef]
- Zhou, X.; Okaze, T.; Ren, C.; Cai, M.; Ishida, Y.; Mochida, A. Mapping local climate zones for a Japanese large city by an extended workflow of WUDAPT Level 0 method. Urban Clim. 2020, 33, 100660. [Google Scholar] [CrossRef]
- János, U.; Enikő, L.; Mátyás, G.T. Local Climate Zone mapping using GIS methods in Szeged. Földrajzi Értesítő 2015, 63, 29–41. [Google Scholar]
- Quan, S.J.; Bansal, P. A systematic review of GIS-based local climate zone mapping studies. Build. Environ. 2021, 196, 107791. [Google Scholar] [CrossRef]
- Estacio, I.; Babaan, J.; Pecson, N.J.; Blanco, A.C.; Escoto, J.E.; Alcantara, C.K. GIS-based mapping of local climate zones using fuzzy logic and cellular automata. Int. Arch. Photogramm. Remote Sens. Spat. Inf. Sci. 2019, 42, 199–206. [Google Scholar] [CrossRef]
- Hidalgo, J.; Dumas, G.; Masson, V.; Petit, G.; Bechtel, B.; Bocher, E.; Foley, M.; Schoetter, R.; Mills, G. Comparison between local climate zones maps derived from administrative datasets and satellite observations. Urban Clim. 2019, 27, 64–89. [Google Scholar] [CrossRef]
- Kwok, Y.T.; Schoetter, R.; Lau, K.K.L.; Hidalgo, J.; Ren, C.; Pigeon, G.; Masson, V. How well does the local climate zone scheme discern the thermal environment of Toulouse (France)? An analysis using numerical simulation data. Int. J. Climatol. 2019, 39, 5292–5315. [Google Scholar] [CrossRef]
- Zhan, Q.; Fan, Y.; Xiao, Y.; Ouyang, W.; Lan, Y.; Jin, Z.; Yin, J.; Zhang, L. Sustainable Strategy: Comprehensive Computational Approach for Wind Path Planning in Dense Urban Area. Int. Rev. Spat. Plan. Sustain. Dev. 2018, 6, 148–164. [Google Scholar] [CrossRef]
- Wang, R.; Ren, C.; Xu, Y.; Lau, K.K.L.; Shi, Y. Mapping the local climate zones of urban areas by GIS-based and WUDAPT methods: A case study of Hong Kong. Urban Clim. 2018, 24, 567–576. [Google Scholar] [CrossRef]
- Kaloustian, N.; Bechtel, B. Local Climatic Zoning and Urban Heat Island in Beirut. In Proceedings of the 4th International Conference on Countermeasures to Urban Heat Island (UHI), Singapore, 30 May–1 June 2016. [Google Scholar]
- Cai, M.; Ren, C.; Xu, Y.; Dai, W.; Wang, X.M. Local Climate Zone Study for Sustainable Megacities Development by Using Improved WUDAPT Methodology—A Case Study in Guangzhou. In Proceedings of the International Conference on Geographies of Health and Living in Cities—Making Cities Healthy for All (H-Cities), Hong Kong, China, 21–24 June 2016. [Google Scholar]
- Shi, Y.; Lau, K.K.L.; Ren, C.; Ng, E. Evaluating the local climate zone classification in high-density heterogeneous urban environment using mobile measurement. Urban Clim. 2018, 25, 167–186. [Google Scholar] [CrossRef]
- He, S.; Zhang, Y.; Gu, Z.; Su, J. Local climate zone classification with different source data in Xi’an, China. Indoor Built Environ. 2019, 28, 1190–1199. [Google Scholar] [CrossRef]
- Huang, F.; Jiang, S.; Zhan, W.; Bechtel, B.; Liu, Z.; Demuzere, M.; Huang, Y.; Xu, Y.; Ma, L.; Xia, W. Mapping local climate zones for cities: A large review. Remote Sens. Environ. 2023, 292, 113573. [Google Scholar] [CrossRef]
- Perera, N.G.R.; Emmanuel, R. A “Local Climate Zone” based approach to urban planning in Colombo, Sri Lanka. Urban Clim. 2018, 23, 188–203. [Google Scholar] [CrossRef]
- Xu, D. Urban Spatial Planning to Cope with Urban Heat Island Effect; China Architecture & Building Press: Beijing, China, 2022. [Google Scholar]
- Han, B.; Luo, Z.; Liu, Y.; Zhang, T.; Yang, L. Using Local Climate Zones to investigate Spatio-temporal evolution of thermal environment at the urban regional level: A case study in Xi’an, China. Sustain. Cities Soc. 2022, 76, 103495. [Google Scholar] [CrossRef]


| Primary Steps | Description | Tools Used |
|---|---|---|
| Band Synthesis | Synthesize Landsat 8 remote sensing image data’s bands 7, 5, and 3 into a single raster image. | Band synthesis |
| Training Sample Creation | Create training sample areas for impermeable surfaces, bare soil, water bodies, green spaces, and industrial land. Ensure even distribution within the study area. | Image classification |
| Supervised Classification | Employ an algorithm based on spectral information to cluster the pixels in the raster image according to the classification rules defined by the training sample areas. | Maximum Likelihood method |
| Post-Classification Processing | Utilize boundary cleaning and mode filtering to smooth small patches or region edges in the image. | Mode filtering |
| Classification Accuracy Assessment | Evaluate the accuracy of the classified raster image, resulting in a classification accuracy of 88% and a Kappa index of 0.85, demonstrating a reasonable classification. | Accuracy, Kappa coefficient |
| Indicators | Indicator Description and Calculation Method | Data Source |
|---|---|---|
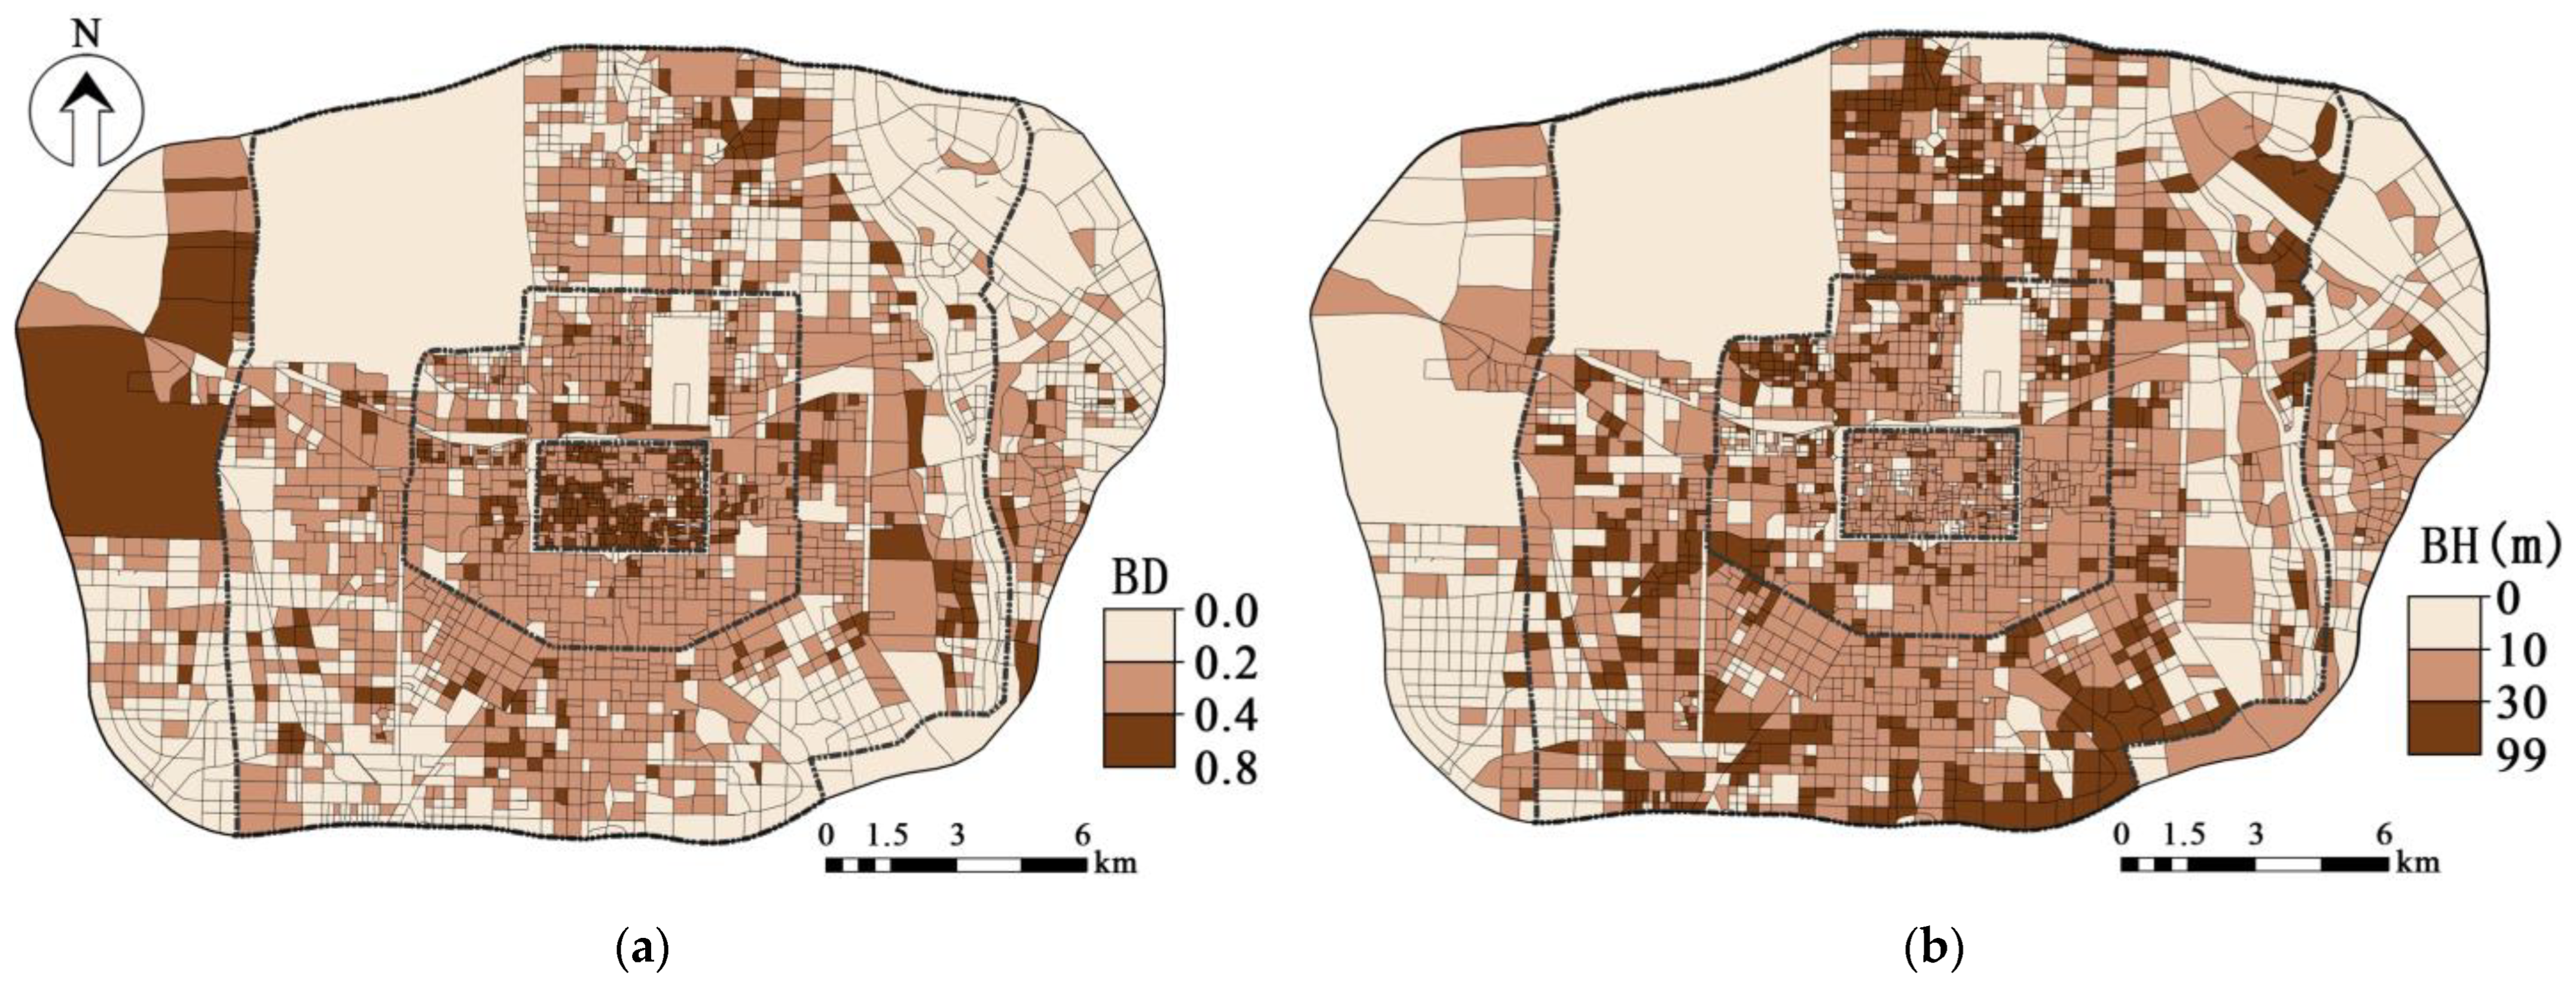
| Building Density (%) | Sum of the footprint areas of all buildings/Total area of the parcel | Urban Spatial Model |
| Building Height (m) | Average height of all buildings within the parcel, total volume of all buildings/Sum of footprint areas of all buildings | Urban Spatial Model |
| Indicators | Formula | Coefficient Description |
|---|---|---|
| Building Density | BD refers to building density. BSi represents the footprint area of building i. Sblock denotes the parcel area. n signifies the total number of buildings within the parcel. | |
| Building Height | BH signifies building height. Vi indicates the volume of building i. represents the total footprint area of all n buildings within the parcel. |
| LCZ Category | Classification Criteria | Land Use |
|---|---|---|
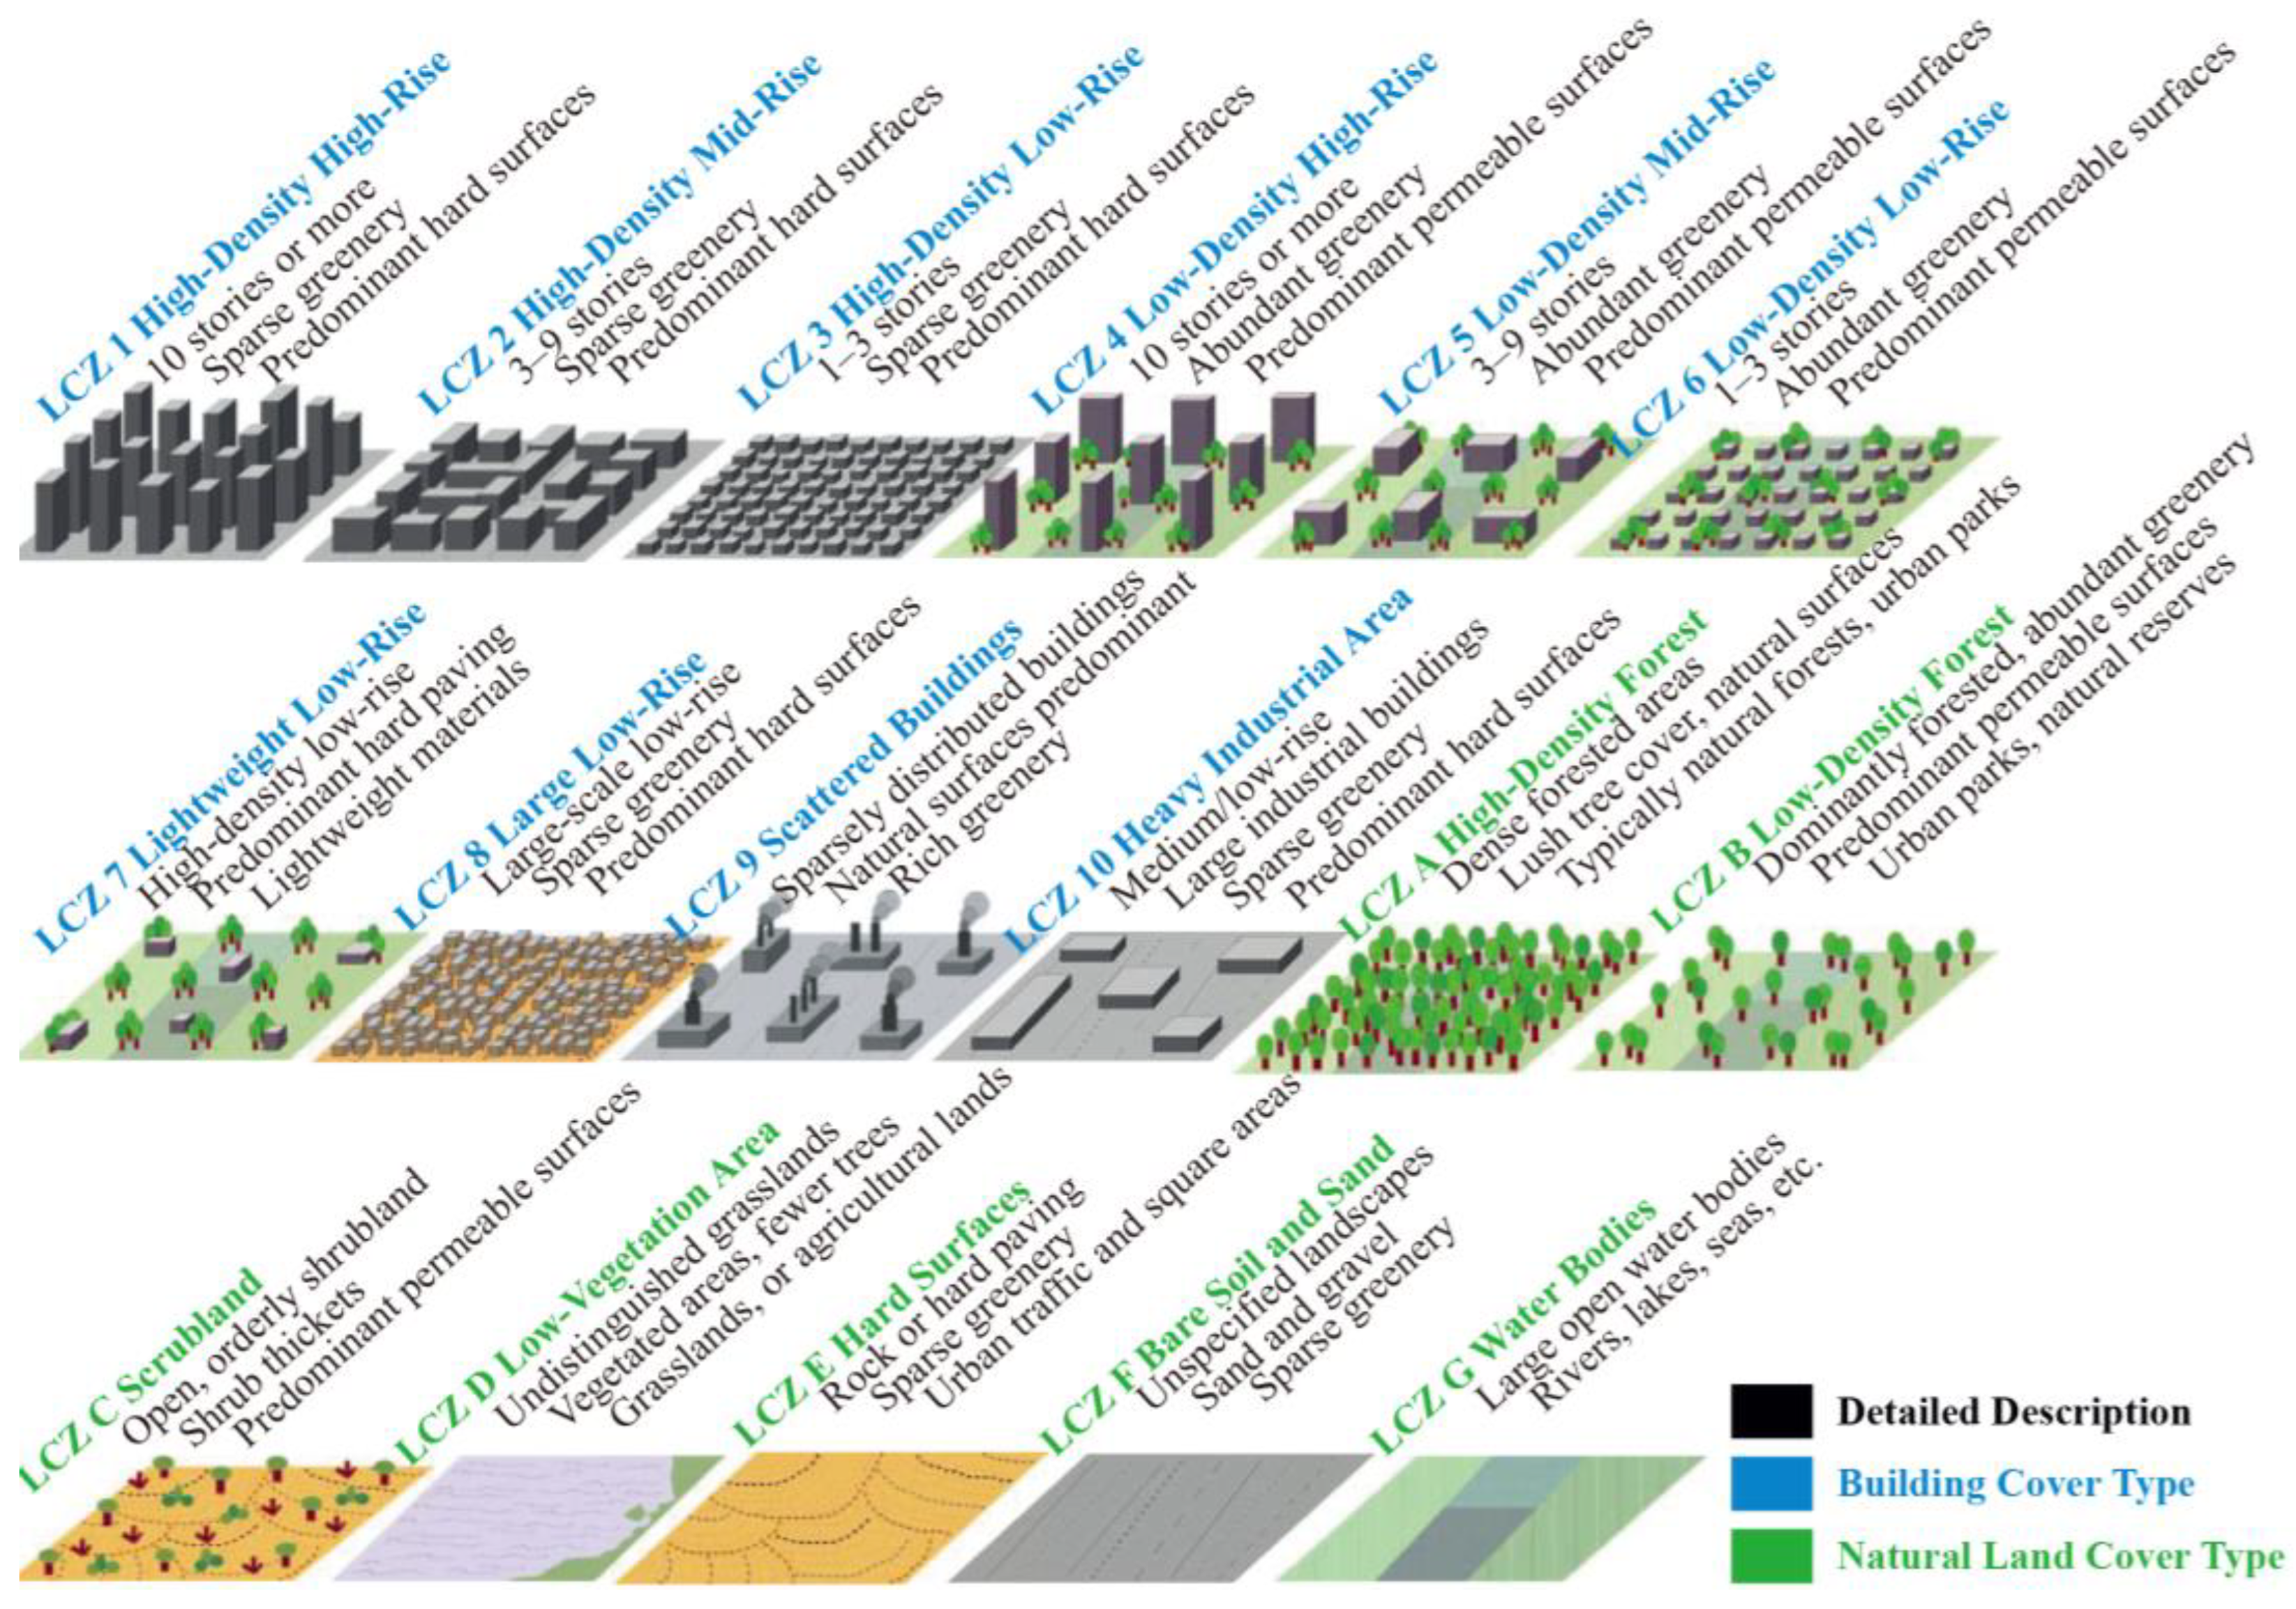
| LCZ B | Greenery Ratio > 0.7 with Predominance of Tall Vegetation in Urban Parks | Green Spaces |
| LCZ D | Building Density = 0; Greenery Ratio > 0.5, Predominantly Lawns and Farmland | Green Spaces |
| LCZ D-II | Building Density = 0; Greenery Ratio < 0.5 | Green Spaces |
| LCZ E | Paved Surface Ratio > 0.7, Mainly Utilized for Transportation or Plazas | Other |
| LCZ F | Bare Soil Ratio > 0.7, Predominantly in Urban Open Areas | Other |
| LCZ G | Water Body Ratio > 0.7, Primarily Comprising Rivers and Water Bodies | Water Bodies |
| LCZ D | Building Density = 0; Greenery Ratio > 0.5, Predominantly Lawns and Farmland | Green Spaces |
| LCZ Category | Classification Criteria | Land Use |
|---|---|---|
| LCZ 7 | Industrial Ratio > 0.7; Building Height < 10 m, Predominantly Lightweight Materials such as Prefabricated Structures | Industrial |
| LCZ 8 | Large-Scale Buildings with Area > 7000 m2 and Height < 10 m | Industrial/Commercial |
| Category | Classification Criteria | Building Density | Building Height |
|---|---|---|---|
| LCZ 1 | High-Density High-Rise | Building density ≥ 0.4 | Average height ≥ 30 m (10 stories or more) |
| LCZ 2 | High-Density Mid-Rise | Building density ≥ 0.4 | 10 ≤ Average height < 30 m (3–9 stories) |
| LCZ 3 | High-Density Low-Rise | Building density ≥ 0.4 | Average height < 10 m (1–3 stories) |
| LCZ 4 | Low-Density High-Rise | Building density < 0.4 | Average height ≥ 30 m (10 stories or more) |
| LCZ 4-II | Medium-Density High-Rise | 0.2 ≤ Building density < 0.4 | Average height ≥ 30 m (10 stories or more) |
| LCZ 5 | Low-Density Mid-Rise | Building density < 0.4 | 10 ≤ Average height < 30 m (3–9 stories) |
| LCZ 5-II | Medium-Density Mid-Rise | 0.2 ≤ Building density < 0.4 | 10 ≤ Average height < 30 m (3–9 stories) |
| LCZ 6 | Low-Density Low-Rise | Building density < 0.4 | Average height < 10 m (1–3 stories) |
| LCZ 6-II | Medium-Density Low-Rise | 0.2 ≤ Building density < 0.4 | Average height < 10 m (1–3 stories) |
| ANOVA | |||||||
|---|---|---|---|---|---|---|---|
| Clustering | Error | F | Significance | p-Value | |||
| Mean Square | Freedom Degrees | Mean Square | Freedom Degrees | ||||
| Building Height | 120,413.137 | 6 | 10.405 | 2311 | 11,572.515 | 0.000 | <0.001 |
| Building Density | 0.550 | 6 | 0.016 | 2311 | 34.517 | 0.000 | <0.001 |
| Final Clustering Center | |||||||
|---|---|---|---|---|---|---|---|
| Clustering | |||||||
| 1 | 2 | 3 | 4 | 5 | 6 | 7 | |
| Building Height | 91.56 | 8.69 | 58.85 | 28.81 | 73.20 | 41.66 | 18.29 |
| Building Density | 0.17 | 0.30 | 0.20 | 0.27 | 0.19 | 0.22 | 0.33 |
| Classification Criteria | L-D H-R | H-D L-R | M-D SH-R | SH-D M-R | L-D SH-R | M-D M-R | H-D M-R |
| Local Climate Zone | LCZ 4 | LCZ 3 | LCZ 5-III | LCZ 2-II | LCZ 4-II | LCZ 5-II | LCZ 2 |
| Indicators | LCZ1 | LCZ2 | LCZ3 | LZC4 | LCZ4-II | LCZ5 | LCZ5-II | LCZ6 | LCZ6-II |
|---|---|---|---|---|---|---|---|---|---|
| SVF | 0.4–0.7 0.55 | 0.4–0.8 0.54 | 0.4–0.8 0.64 | 0.6–0.9 0.81 | 0.5–0.86 0.67 | 0.7–0.9 0.88 | 0.5–0.86 0.69 | 0.8–0.9 0.89 | 0.7–0.9 0.82 |
| H/W | 1.1–3.3 1.6 | 0.5–1.3 0.8 | 0.2–0.5 0.36 | 1.2–3.5 2.0 | 1.2–3.2 1.7 | 0.1–1.1 0.71 | 0.5–1.2 0.79 | 0.1–0.4 0.24 | 0.16–0.50 0.33 |
| BH (m) | 30–63 34 | 11–24 16 | 5–9 8 | 31–78 48 | 30–68 40 | 10–26 17 | 11–26 18 | 3–9 6 | 4–10 7 |
| ROU | 1–2 1 | 1–1 1 | 1–1 1 | 0.5–2 1 | 0.5–2 1 | 0.5–2 0.5 | 0.5–2 1 | 0.5–0.5 0.5 | 0.5–1 0.5 |
| BD | 0.4–0.5 0.45 | 0.4–0.6 0.45 | 0.4–0.7 0.50 | 0.1–0.2 0.15 | 0.2–0.3 0.26 | 0.1–0.2 0.15 | 0.2–0.4 0.29 | 0–0.18 0.10 | 0.22–0.37 0.29 |
| PSF | 0.1–0.4 0.29 | 0.1–0.4 0.32 | 0–0.41 0.25 | 0.2–0.7 0.5 | 0.3–0.6 0.5 | 0.1–0.6 0.40 | 0.2–0.6 0.42 | 0–0.56 0.28 | 0.05–0.56 0.39 |
| TSF | 0–0.12 0 | 0–0.1 0 | 0–0.12 0 | 0–0.6 0.24 | 0–0.32 0.06 | 0–0.66 0.35 | 0–0.42 0.13 | 0.1–0.9 0.47 | 0–0.51 0.15 |
| P_R | 0.1–0.2 0.15 | 0.1–0.19 0.16 | 0.1–0.18 0.14 | 0.24–0.28 0.26 | 0.2–0.3 0.23 | 0.2–0.3 0.26 | 0.18–0.24 0.22 | 0.24–0.29 0.26 | 0.19–0.25 0.21 |
| SA | 0.12–0.15 0.13 | 0.12–0.15 0.13 | 0.13–0.15 0.13 | 0.12–0.15 0.14 | 0.12–0.15 0.13 | 0.13–0.15 0.14 | 0.12–0.15 0.13 | 0.12–0.15 0.14 | 0.12–0.15 0.13 |
| BAH (W/m2) | 422–1136 817 | 164–610 255 | 79–233 122 | 121–382 215 | 229–707 360 | 30–183 84 | 107–340 181 | 2–51 21 | 37–137 71 |
| Indicators | LCZ2 | LCZ2-II | LCZ3 | LZC4 | LCZ4-II | LCZ5-II | LCZ5-III |
|---|---|---|---|---|---|---|---|
| SVF | 0.7–0.9 0.86 | 0.5–0.9 0.70 | 0.6–1.0 0.83 | 0.5–0.9 0.73 | 0.6–0.9 0.75 | 0.5–0.9 0.71 | 0.6–0.9 0.72 |
| H/W | 0.2–0.4 0.28 | 0.9–1.7 1.18 | 0.2–0.56 0.40 | 2.9–4.9 3.34 | 2.3–4.1 2.78 | 1.3–2.3 1.67 | 1.9–3.5 2.46 |
| BH (m) | 4–10 7 | 25–33 29 | 4–12 9 | 86–99 90 | 67–80 73 | 36–48 41 | 52–65 60 |
| ROU | 0.5–1 1 | 0.5–2 1 | 0.5–1 0.5 | 0.5–2 1 | 0.5–2 1 | 0.5–2 1 | 0.5–2 1 |
| BD | 0.3–0.6 0.36 | 0.1–0.4 0.26 | 0.4–0.7 0.29 | 0.1–0.3 0.15 | 0.1–0.3 0.19 | 0.1–0.3 0.21 | 0.1–0.3 0.19 |
| PSF | 0.0–0.5 0.34 | 0.2–0.6 0.43 | 0–0.5 0.34 | 0.2–0.6 0.53 | 0.3–0.7 0.54 | 0.2–0.6 0.48 | 0.2–0.6 0.51 |
| TSF | 0–0.6 0.13 | 0–0.4 0.13 | 0–0.6 0.14 | 0–0.5 0.14 | 0–0.4 0.07 | 0–0.5 0.12 | 0–0.6 0.15 |
| P_R | 0.1–0.2 0.20 | 0.2–0.3 0.23 | 0.1–0.3 0.22 | 0.2–0.3 0.25 | 0.2–0.3 0.26 | 0.2–0.3 0.24 | 0.2–0.3 0.25 |
| SA | 0.12–0.15 0.14 | 0.12–0.15 0.13 | 0.13–0.15 0.14 | 0.12–0.15 0.14 | 0.13–0.15 0.14 | 0.12–0.15 0.13 | 0.13–0.16 0.14 |
| BAH (W/m2) | 32–224 121 | 131–584 240 | 14–214 86 | 215–1113 423 | 237–940 412 | 162–520 270 | 186–549 340 |
Disclaimer/Publisher’s Note: The statements, opinions and data contained in all publications are solely those of the individual author(s) and contributor(s) and not of MDPI and/or the editor(s). MDPI and/or the editor(s) disclaim responsibility for any injury to people or property resulting from any ideas, methods, instructions or products referred to in the content. |
© 2023 by the authors. Licensee MDPI, Basel, Switzerland. This article is an open access article distributed under the terms and conditions of the Creative Commons Attribution (CC BY) license (https://creativecommons.org/licenses/by/4.0/).
Share and Cite
Xu, D.; Zhang, Q.; Zhou, D.; Yang, Y.; Wang, Y.; Rogora, A. Local Climate Zone in Xi’an City: A Novel Classification Approach Employing Spatial Indicators and Supervised Classification. Buildings 2023, 13, 2806. https://doi.org/10.3390/buildings13112806
Xu D, Zhang Q, Zhou D, Yang Y, Wang Y, Rogora A. Local Climate Zone in Xi’an City: A Novel Classification Approach Employing Spatial Indicators and Supervised Classification. Buildings. 2023; 13(11):2806. https://doi.org/10.3390/buildings13112806
Chicago/Turabian StyleXu, Duo, Qian Zhang, Dian Zhou, Yujun Yang, Yiquan Wang, and Alessandro Rogora. 2023. "Local Climate Zone in Xi’an City: A Novel Classification Approach Employing Spatial Indicators and Supervised Classification" Buildings 13, no. 11: 2806. https://doi.org/10.3390/buildings13112806
APA StyleXu, D., Zhang, Q., Zhou, D., Yang, Y., Wang, Y., & Rogora, A. (2023). Local Climate Zone in Xi’an City: A Novel Classification Approach Employing Spatial Indicators and Supervised Classification. Buildings, 13(11), 2806. https://doi.org/10.3390/buildings13112806