1. Introduction
Assembly, an ancient construction method, has been an integral part of architectural evolution throughout history. Around 4500 years ago, ancient Egyptians assembled towering pyramids over 100 m high using millions of boulders. In the 1980s, Hong Kong workers assembled the 180 m high HSBC building with tens of thousands of components [
1].
Today’s assembly technology is no longer the same as it was in the past, but even in today’s high-tech world, there is still much room for improving building assembly efficiency. A century ago, automobiles had been efficiently produced on assembly lines. Today, automated robotic assembly has been widely used in product manufacturing. In contrast, building assembly remains a meticulous and step-by-step process, often reliant on cranes. This begs the question: when will architecture experience a new assembly revolution?
The primary goal of construction industrialization is to enhance construction efficiency, quality, and cost-effectiveness [
2]. Traditional, inefficient production and organizational methods are gradually being replaced by modern, efficient construction and management techniques. To fully realize construction industrialization, various methods and approaches can be employed, with lean construction and prefabricated construction serving as important management and technical tools. Lean construction developed from lean production, also aiming to maximize value and minimize waste, thus creating a new project delivery process [
3]. Lean construction, by employing the just-in-time approach, can reduce construction time and expedite the production of building components. The Design for Assembly (DFA) method incorporates both lean and prefabricated construction concepts, offering design and management strategies to achieve high-efficiency and high-quality construction.
The DFA concept refers to designing a product for ease of assembly. It was initially proposed by Boothroyd et al. in the 1970s for product design [
4]. The primary objective of DFA is to reduce assembly costs and enhance efficiency and quality by minimizing components and steps involved in the assembly process. As a quantitative tool, DFA can calculate the improved efficiency, cost savings, and time reduction. Consequently, DFA can serve as a design, evaluation, and costing tool, providing guidance for building design, assessing assembly efficiency, and controlling costs to promote construction industrialization [
4].
Despite the ongoing progress in construction industrialization over the past century, there is still a need for improving the assembly efficiency of buildings. However, there is a lack of effective evaluation methods to assess assembly efficiency in the construction field, leading to a lack of metrics for measuring improvements in assembly efficiency. Furthermore, enhancing assembly efficiency requires not only advancements in construction technology but also improvements in architectural design.
Therefore, this study develops a DFA evaluation method specifically applicable to prefabricated buildings, based on the principles of product DFA. The paper first provides a review of the origins of the DFA method, variations of DFA methods, and their application in the construction industry. Subsequently, through a literature research and formula design, an assembly efficiency evaluation method is established. Additionally, the study employs text analysis, the Delphi method, and the Analytic Hierarchy Process (AHP) method to develop an assembly design evaluation method. Finally, the proposed DFA method is applied to evaluate a case, the New Lawuga School.
2. Literature Review
DFA has emerged as a scientific design and evaluation method relatively recently, but it has spawned numerous systematic strategies. Due to the potential to enhance assembly efficiency and yield significant benefits for product companies and manufacturers, many organizations have developed their own DFA methods.
In the 1970s, Mogens Myrup Andreasen, Ken Swift, and colleagues collaborated on designing principles and workflows for efficient assembly, aiming to make assembly cost-effective and rational [
5,
6]. They discussed strategies and principles for easy-to-assemble designs, focusing on planning, structural, and component levels. During the same period, Geoffrey Boothroyd, Alan Redford, and colleagues developed a quantitative DFA method [
7,
8]. They categorized assembly into three basic types: manual assembly, dedicated assembly, and flexible assembly, to determine suitable assembly methods based on product characteristics and production conditions. They also devised a method for calculating assembly time by considering factors such as handling, feeding, and inserting time. By the 1990s, a multitude of DFA methods had been developed, such as IPA Stuttgart Method, Hitachi AEM, Lucas Method, Modified Westinghouse Method, Hinchley Assembly Complexity Factor, Sony Standard Time Assembly Method, and Bralla Method [
8,
9,
10]. These DFA methods continue to serve as design tools and quantitative evaluation tools, playing a critical role in improving assembly efficiency.
The IPA Stuttgart method, developed by the Fraunhofer IPA research institute, is an assembly evaluation method focusing on assemblability and global costs [
8]. Assemblability, or suitability for assembly, is assessed using a penalty score that quantifies the level of difficulty in assembly. The updated version of the IPA Stuttgart method utilizes the cost per part as a measure of assembly difficulty.
The Hitachi Assembly Evaluation Method (AEM) employs two indicators to evaluate assembly difficulty and cost: the assemblability evaluation score E and the estimated assembly cost ratio K [
11], i.e., “The assemblability of evaluation score ratio used to assess design quality by determining the difficulty of operation and assembly cost ratio used to project elements of assembly cost” [
8]. In the assemblability assessment (E score), approximately 20 basic assembly operations are defined, and each is assigned a symbol and a penalty score [
11]. The cost ratio K represents the ratio of the assembly cost for an optimal design to that of a previous standard assembly. It is essential to consider both the E and K values, as the solution with the highest E score may not necessarily have the lowest assembly cost.
The Boothroyd method, briefly mentioned earlier, begins by identifying suitable assembly methods for the product, such as manual, automatic, and robotic assembly [
7]. For manual assembly, the primary evaluation indicator is design efficiency, specifically the DFA index (
Table 1). The DFA index is calculated by dividing the theoretical minimum assembly time by the estimated (actual) assembly time. The theoretical minimum assembly time is determined by multiplying the minimum number of parts by the basic assembly time. The estimated (actual) assembly time is the sum of assembly times for each part. Thus, the key to improving efficiency is reducing the number of parts and reducing the assembly time (difficulty) of each part.
The Lucas method was developed by Lucas Corporation in collaboration with the University of Hull in the 1980s. Similar to the Boothroyd method, its primary focus lies in identifying and retaining essential components while reducing the complexity of assembly operations. The Lucas method employs three indicators to assess assembly efficiency: design efficiency, feeding (handling) ratio, and fitting ratio [
11] (
Table 2). To improve these indicators, the method emphasizes reducing unnecessary parts and simplifying essential parts. Moreover, the Lucas method distinguishes between manual and automatic assembly. In manual assembly, the insertion process is the primary factor influencing assembly, while in automatic assembly, feeding plays a more significant role in the assembly process.
Over the past decade, the DFA method has expanded its application from the product industry to the construction sector, offering potential contributions to the goal of construction industrialization [
12]. Design for Manufacture and Assembly (DFMA) is an emerging design methodology that includes both DFM (designed for ease of manufacture) and DFA. In 2016, the Royal Institute of British Architects released the Design for Manufacture and Assembly (DfMA) overlay to the RIBA Plan of Work 2013 [
13]. In Singapore, the Building and Construction Authority released the Essential Guide of BIM for DfMA in 2016, providing guidance on integrating Building Information Modeling (BIM) and DFMA methods [
14]. The Hong Kong SAR government also highlighted the development of DFMA and Modular Integrated Construction (MiC) in their publication Construction 2.0: Time to Change released in 2018 [
15]. Furthermore, in 2019, the Hong Kong Construction Industry Council established the DFMA Alliance [
16]. Recently, digital fabrication and additive manufacturing for DFMA are rapidly advancing, offering significant value to the construction industry [
17,
18].
Despite the gradual integration of the DFA method into the construction field, there remains a lack of objective evaluation of building assembly efficiency. Without proper assembly evaluation, it is challenging to assess the current level of assembly efficiency and determine the extent of optimization achieved.
3. Designing Evaluation Method of Building Assembly Efficiency
In the realm of product design, well-established DFA methods already exist, so this study draws upon the assembly efficiency index used in product design [
4]. The study adapts product DFA to suit prefabricated buildings by taking into account the specific characteristics of construction.
3.1. Analyzing Problems with Product DFA Method in Building Context
Various quantitative DFA methods have been developed for product design (see
Table 3). However, applying these indexes directly to building assembly evaluation can present challenges due to the differences between construction and product design.
One of the challenges is related to the evaluation of assembly efficiency. In product design, the ratio of the minimum assembly parts (or times) to the actual (or estimated) assembly parts (or times) (e.g., Boothroyd method or Lucas method) is used [
7,
8]. However, determining the minimum number of parts or times in construction is more complex. In product design, the minimum number of parts is typically determined by assessing whether parts can be eliminated or combined under specific conditions. In construction, however, the possibility to delete or combine components is constrained by factors such as structural performance, raw material size, processing machinery, transportation conditions, and assembly tools. Consequently, determining whether the number of building parts has been minimized becomes challenging. Therefore, it is necessary to revise and adapt the DFA method to address these specific challenges and ensure its suitability for evaluating assembly efficiency in the context of prefabricated buildings.
Another challenge arises from the larger number of parts involved in building assembly compared to product assembly. When evaluating product assembly efficiency, the time, cost, or difficulty of each part can be calculated individually. However, in construction, the large number of parts makes it time-consuming and labor-intensive to calculate such data for each component. While simple products may have only a few parts, complex products like automobiles or airplanes have tens of thousands of parts [
19], medium-scale buildings typically consist of tens of thousands of parts, and large-scale buildings have even more assembly components. Therefore, performing detailed calculations of assembly time and cost for each part, as done in product assembly evaluation, would be impractical and time-consuming, particularly during the early design stage. Consequently, there is a need for a rapid estimation tool.
Moreover, building components are generally larger and heavier compared to product components, which adds complexity to the assembly process. In product assembly evaluation, the assembly steps are typically categorized into two key steps: handling (feeding) and insertion (fitting) [
8]. These steps have the most significant impact on assembly time, with other operations included within them. However, building assembly involves additional time-consuming steps beyond handling and inserting, such as orientation or temporary support.
To summarize, the differences between building assembly and product assembly pose challenges in applying product DFA evaluation indexes to building evaluation. Therefore, a modified approach is necessary to address the unique characteristics of building assembly.
3.2. Establishing Evaluation Index of Assembly Efficiency for Buildings
Indeed, the product DFA evaluation method may not be directly applicable to architectural design, but it offers valuable insights. In the research of product assembly efficiency indexes, two widely used efficiency metrics have emerged: (1) the ratio of input to output, and (2) the ratio of the theoretical optimal value to the actual value as shown in
Table 4. These efficiency calculation methods align with those employed in various disciplines. For instance, these two ratios are commonly utilized in assessing energy efficiency [
20], machine efficiency [
21], and economic efficiency [
22].
It is common to use the ratio of the theoretical optimal value to the actual value as an efficiency index. However, applying this approach to evaluating building assembly presents challenges. The Lucas method and the Boothroyd method [
7,
8] serve as examples that highlight the difficulties in their application to construction. As mentioned previously, determining the minimum number of components that constitute a building is not a straightforward task.
Another commonly used method for calculating efficiency is the ratio of output to input, which is the approach adopted in this study. This efficiency calculation method is employed in the IPA Stuttgart method and the Lucas method [
8]. In the IPA method, the cost per part (the ratio of the total cost to the total number of parts) is utilized. In the Lucas method, the feeding (fitting) ratio is determined by the ratio of the feeding (fitting) index to essential components. The feeding (fitting) index can be understood as the total input, as it represents the required operation, while the essential components represent the output. This method, using the ratio of output to input, is widely employed and is also a means to calculate construction efficiency [
23]. When calculating construction productivity, the consumed resources, such as labor, materials, equipment, and tools, are considered as the input, while completed construction work, such as the number of components, area, and volume, are regarded as the output [
24,
25].
After determining the assembly efficiency index calculation method as the ratio of output to input, the subsequent step involves specifying the output and input parameters.
3.3. Selecting Parameters of Assembly Efficiency Evaluation for Building
The output and input parameters can be selected by filtering assembly-related factors. Several options are available for the output parameters, including building area, volume, structure, envelope, and price (
Table 5). Building area and volume represent the space created through assembly, while structure and envelope represent the functional systems resulting from assembly. Price reflects the value of construction as a commodity. After comparing factors such as quantifiable operability, cost-effectiveness in calculation, and precision in the design stage, building volume is chosen as the final output value. The calculation method for building volume is relatively objective and straightforward, allowing for early calculations. Additionally, the most crucial outcome of this process is the recognition that architectural space, as the object of use, serves as the fundamental output.
For input parameters, possible options include assembly cost, time, labor, equipment, steps, parts, and information [
25] (
Table 6). Firstly, cost and time involve statistical issues, as mentioned earlier. Secondly, labor and equipment are not suitable as input parameters for efficiency calculations due to significant regional variations in labor and equipment costs, making estimation challenging during the design stage. Finally, accurately quantifying assembly steps and information is difficult, making it challenging to objectively reflect efficiency. Therefore, this study adopts the number of parts as the input value. Several reasons support this choice: (1) it can be accurately quantified; (2) the calculation process is faster and less costly; and (3) it can be used at all stages of design and construction. Furthermore, the product DFA method demonstrates that the number of parts significantly impacts assembly efficiency [
4].
Based on the ratio method of output to input, this study employs the ratio of building volume to the number of parts as the calculation method for assembly efficiency, referred to as the Assembly Efficiency Index (AEI) = Building Volume (Vb)/Number of Parts (Np).
The calculation of the number of parts uses the sum of the total number of parts that need to be assembled on-site. However, in the design stage, the number of parts for a scheme varies considerably due to design depth, so it is necessary to further specify the parts to be counted. Building components are broadly divided into structure, envelope, connection, fastener, decoration, and Mechanical, Electrical and Plumbing (MEP) parts. Because they are the basic parts required to form a building, structure, envelope, and connection parts serve as the basis for calculating the number of parts in the current study. On the other hand, fastener, decoration, and MEP parts are not essential parts in a building and are usually not determined at the design stage; thus, they are not included here.
3.4. Testing the Validity of the Evaluation Method
The objective of the AEI evaluation method is to accurately and effectively assess the assembly speed of a building. To validate the evaluation method, 19 constructed cases from Unitinno Studio [
26] were chosen to compare the AEI value with the actual assembly efficiency (
Table 7). (Detailed information about the projects can be found on Unitinno’s official website.
www.unitinno.com) The actual efficiency value is determined based on the building volume that can be assembled per day, which corresponds to the building volume per part as indicated by the AEI.
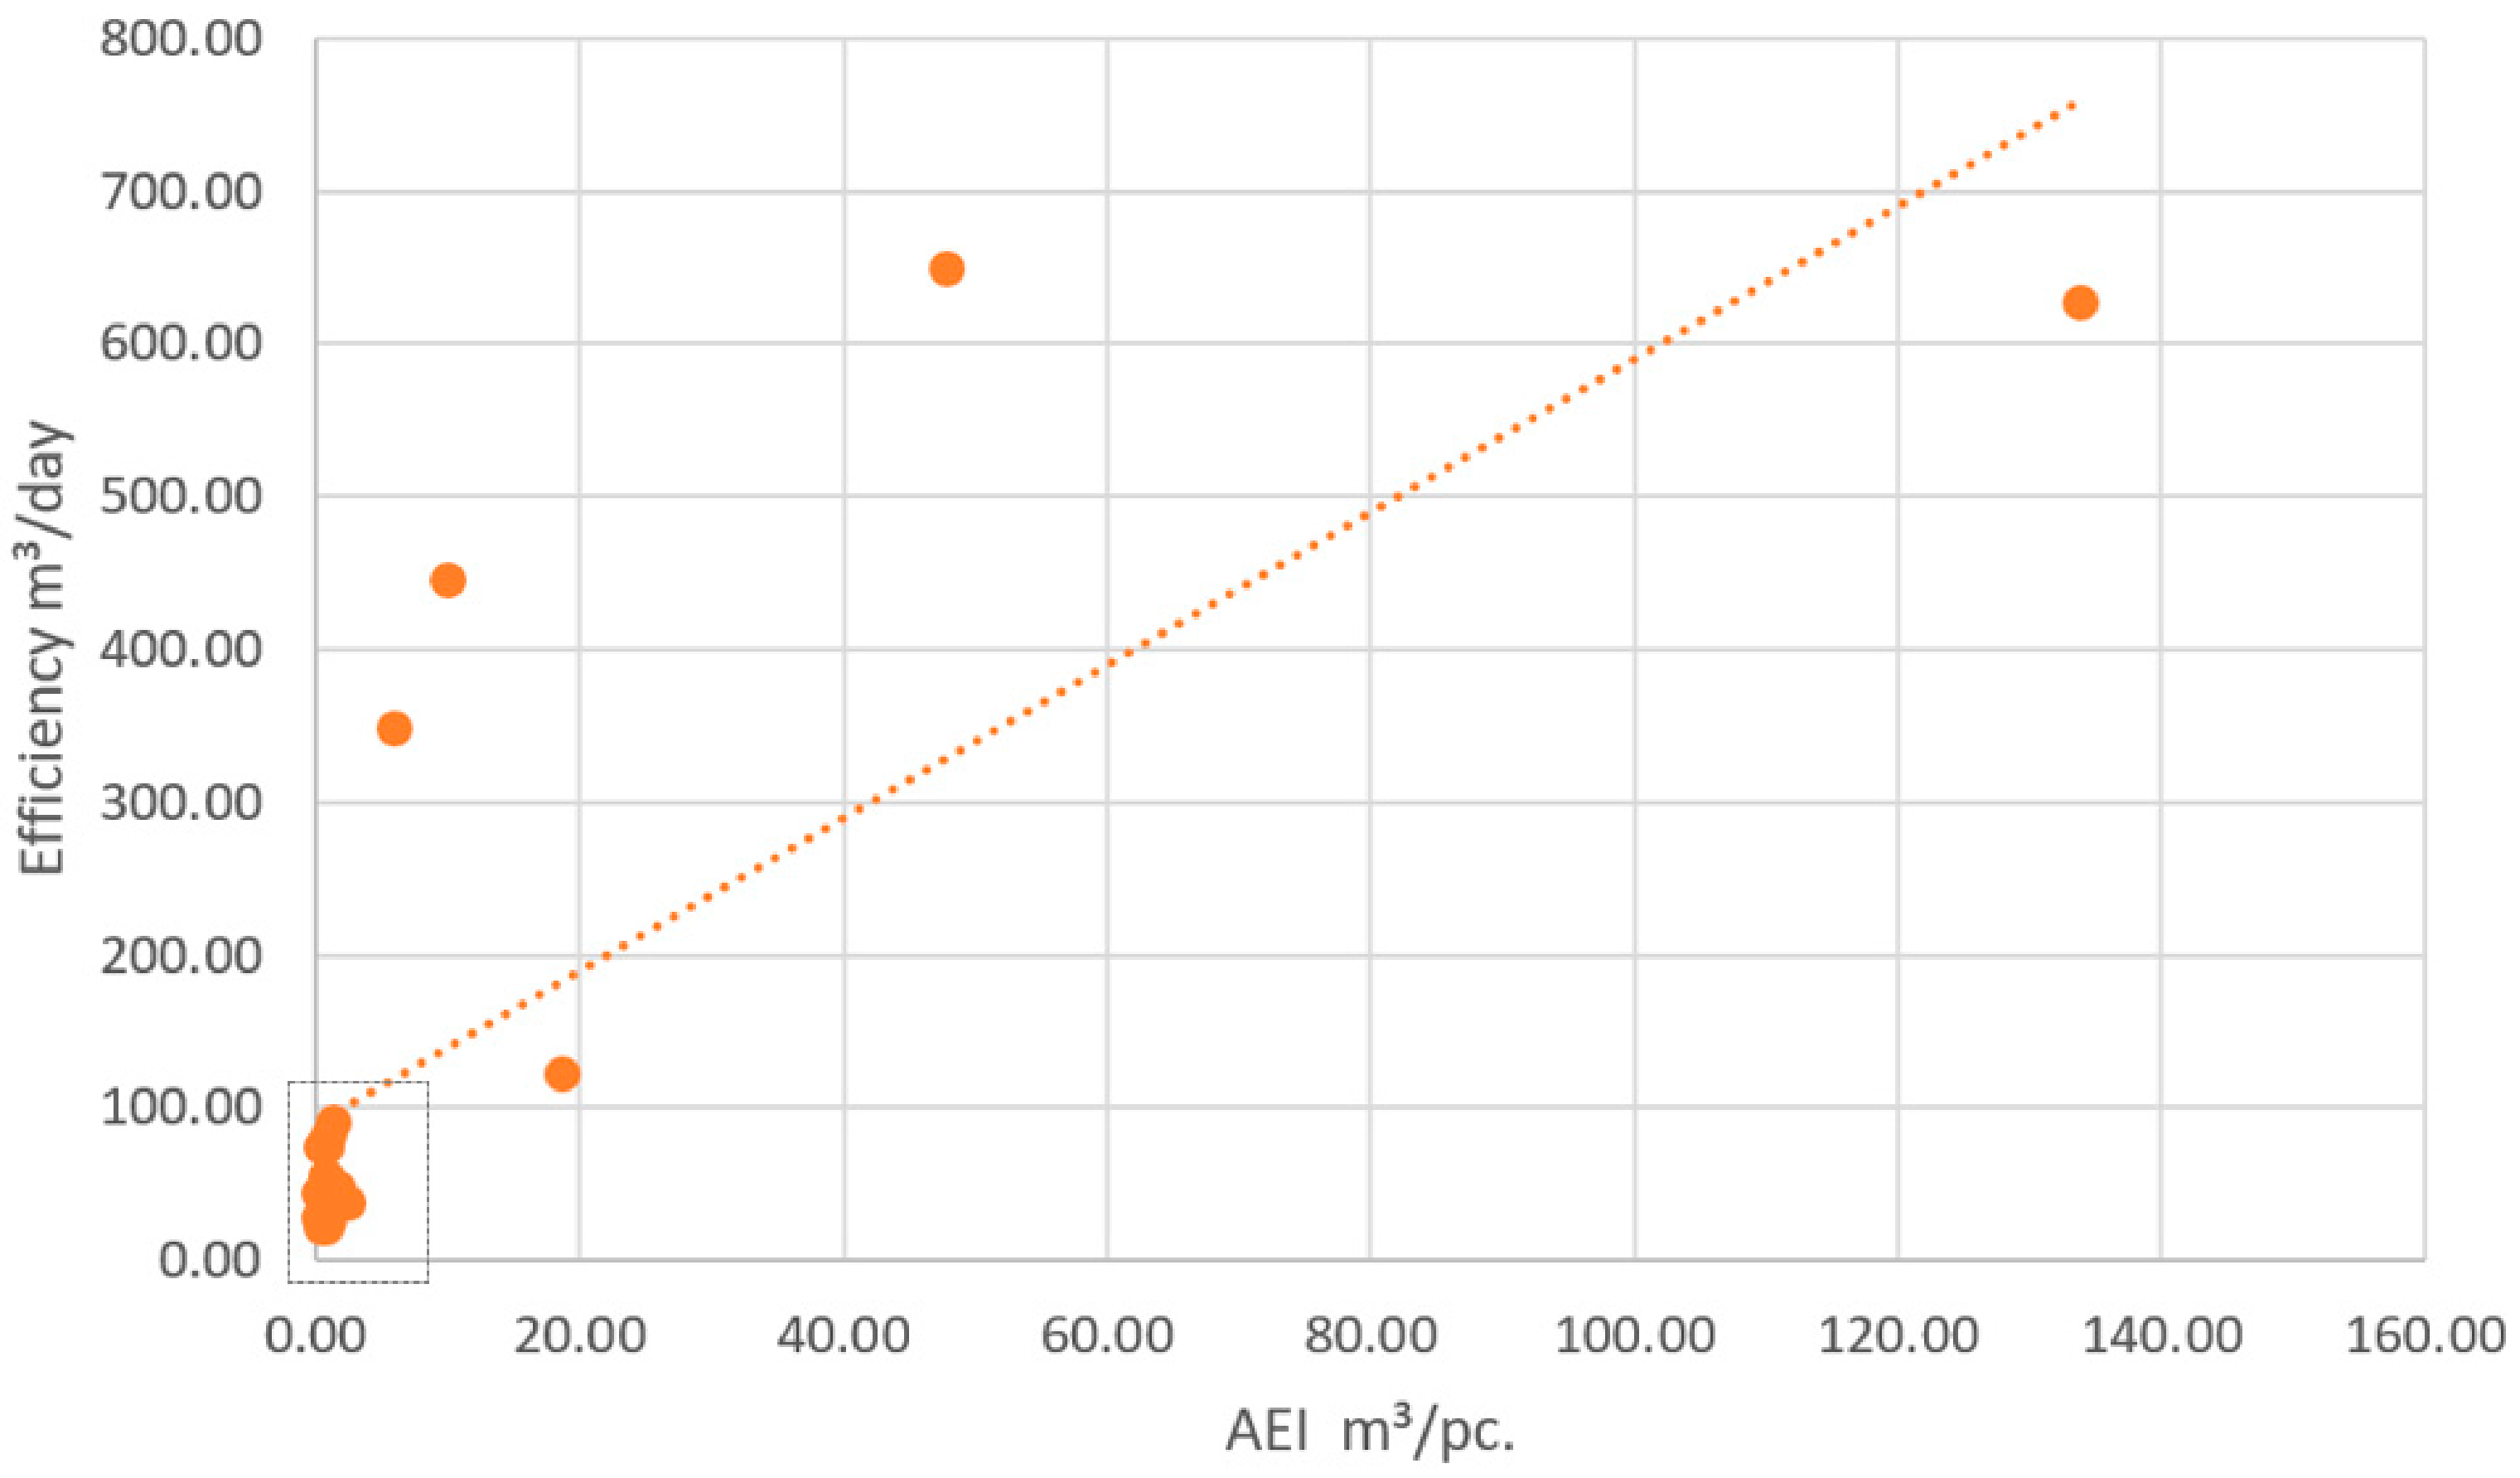
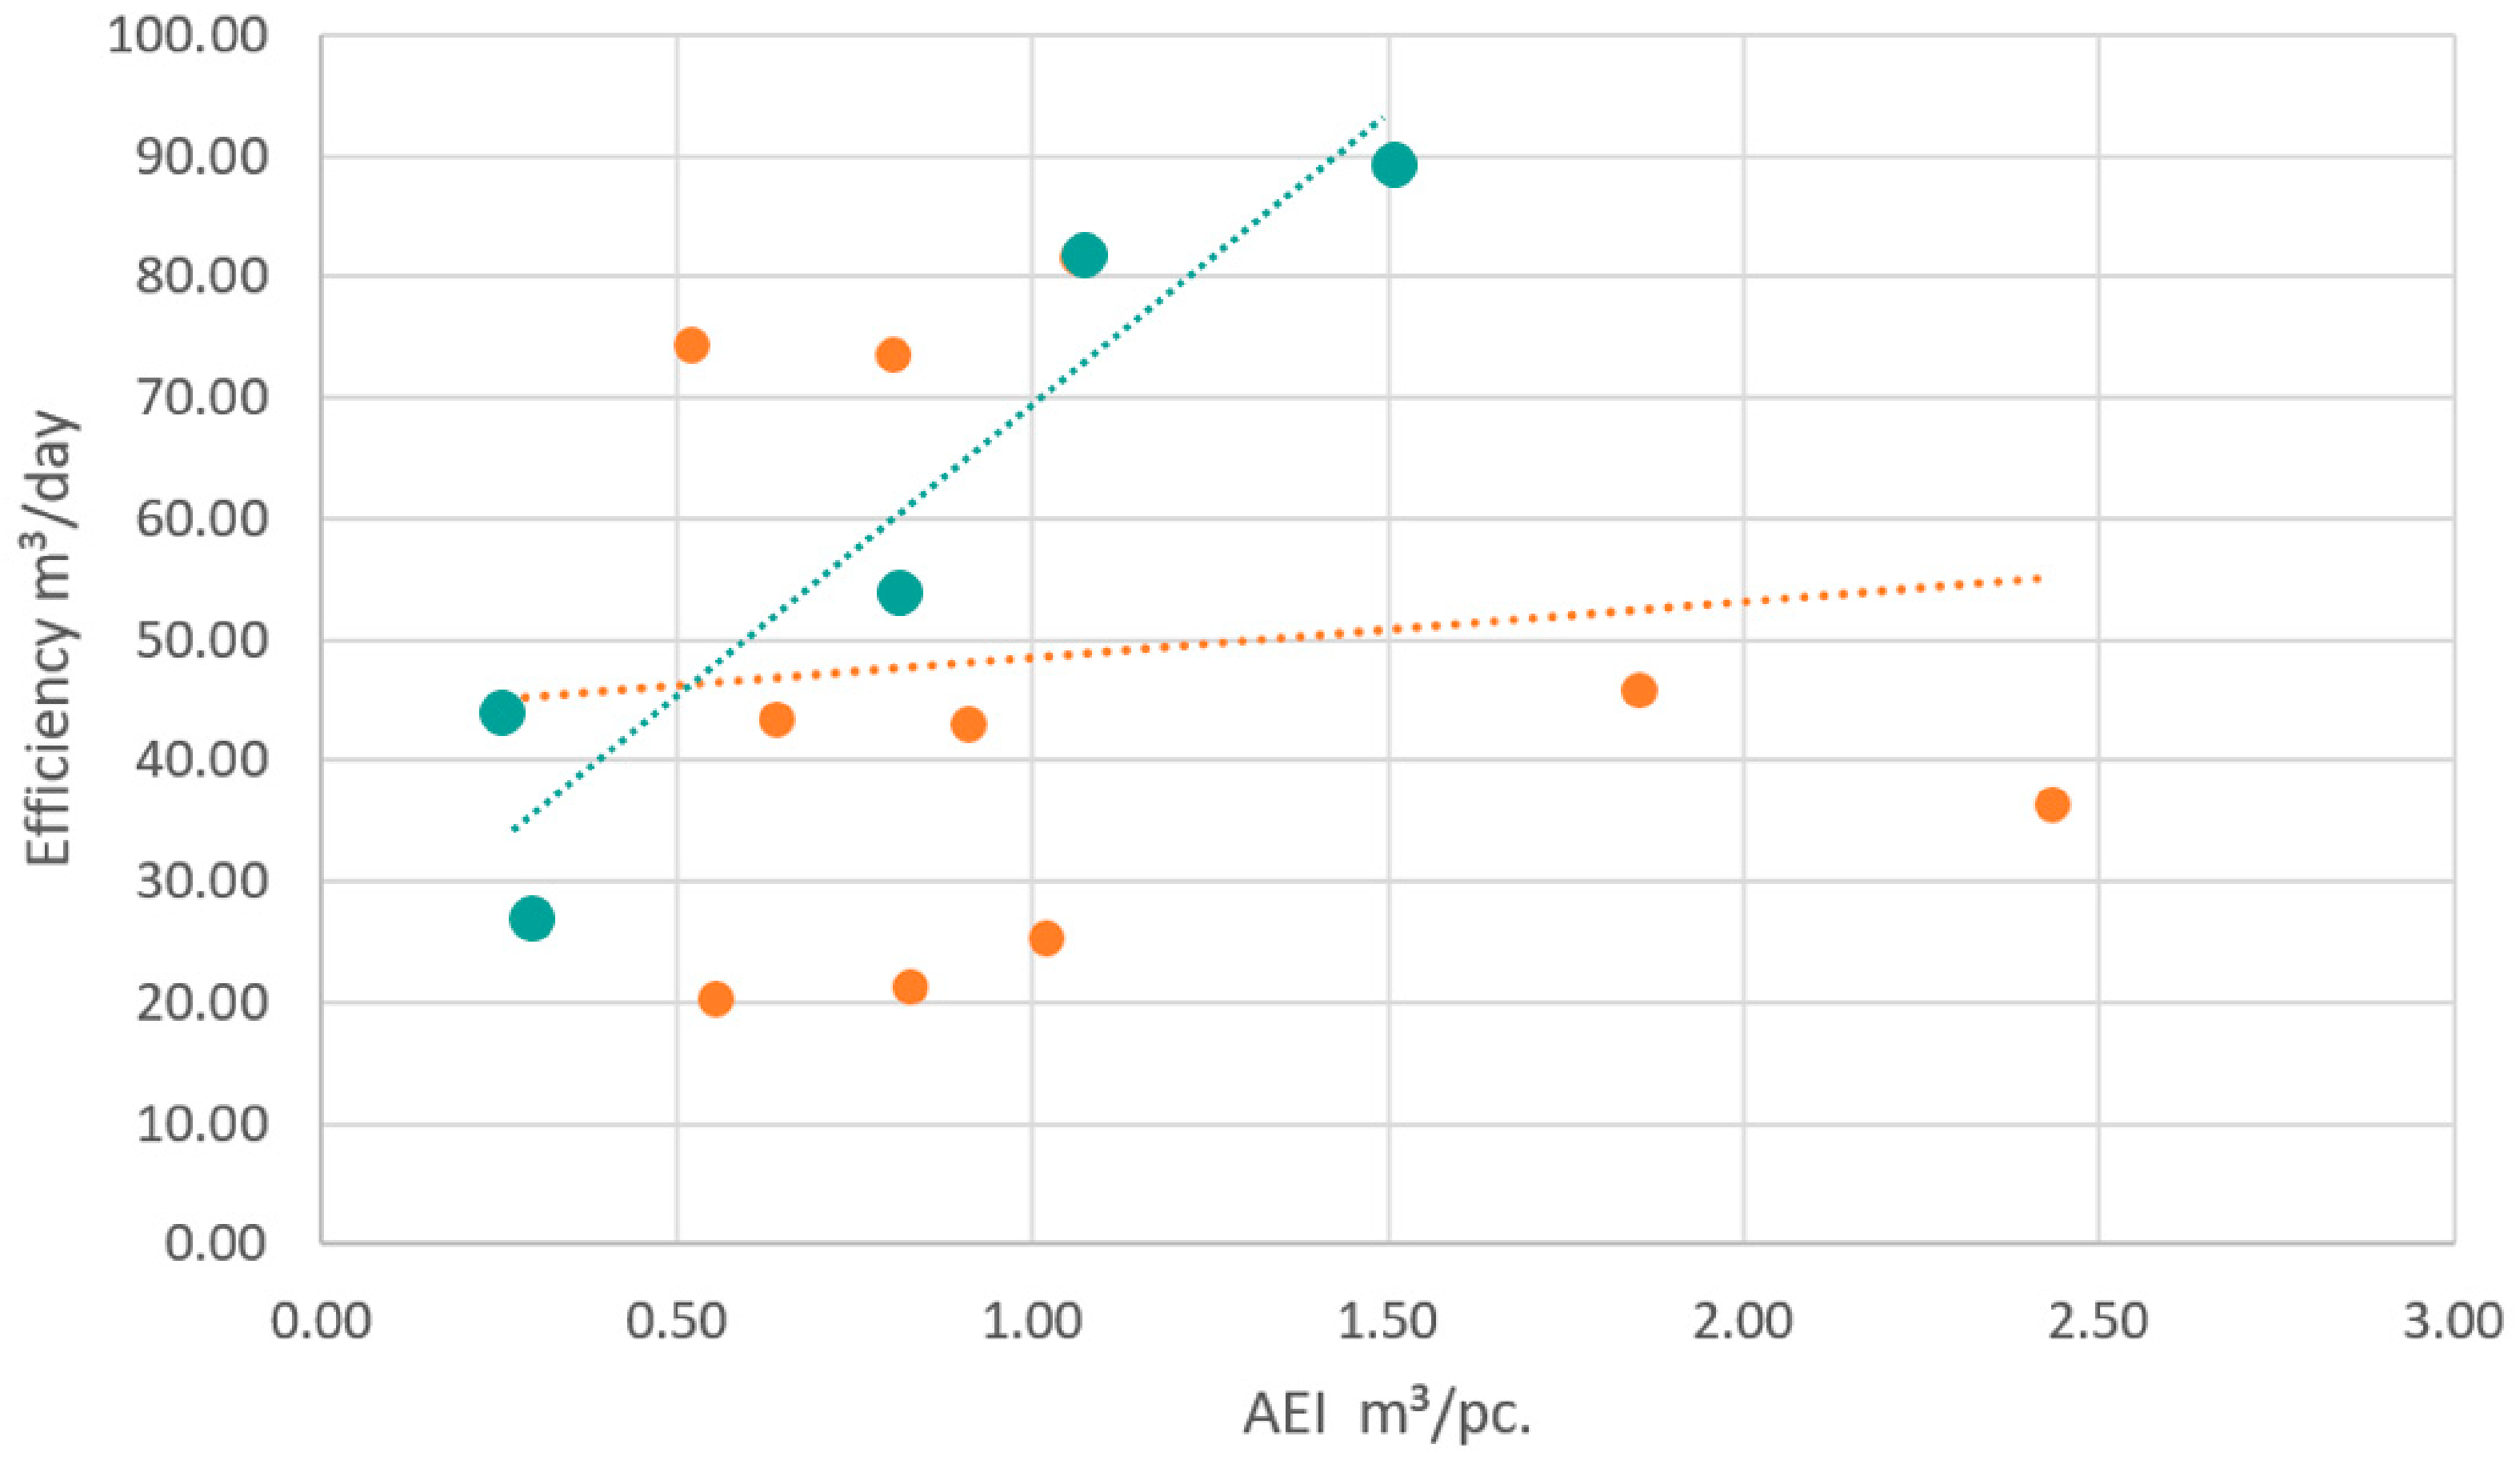
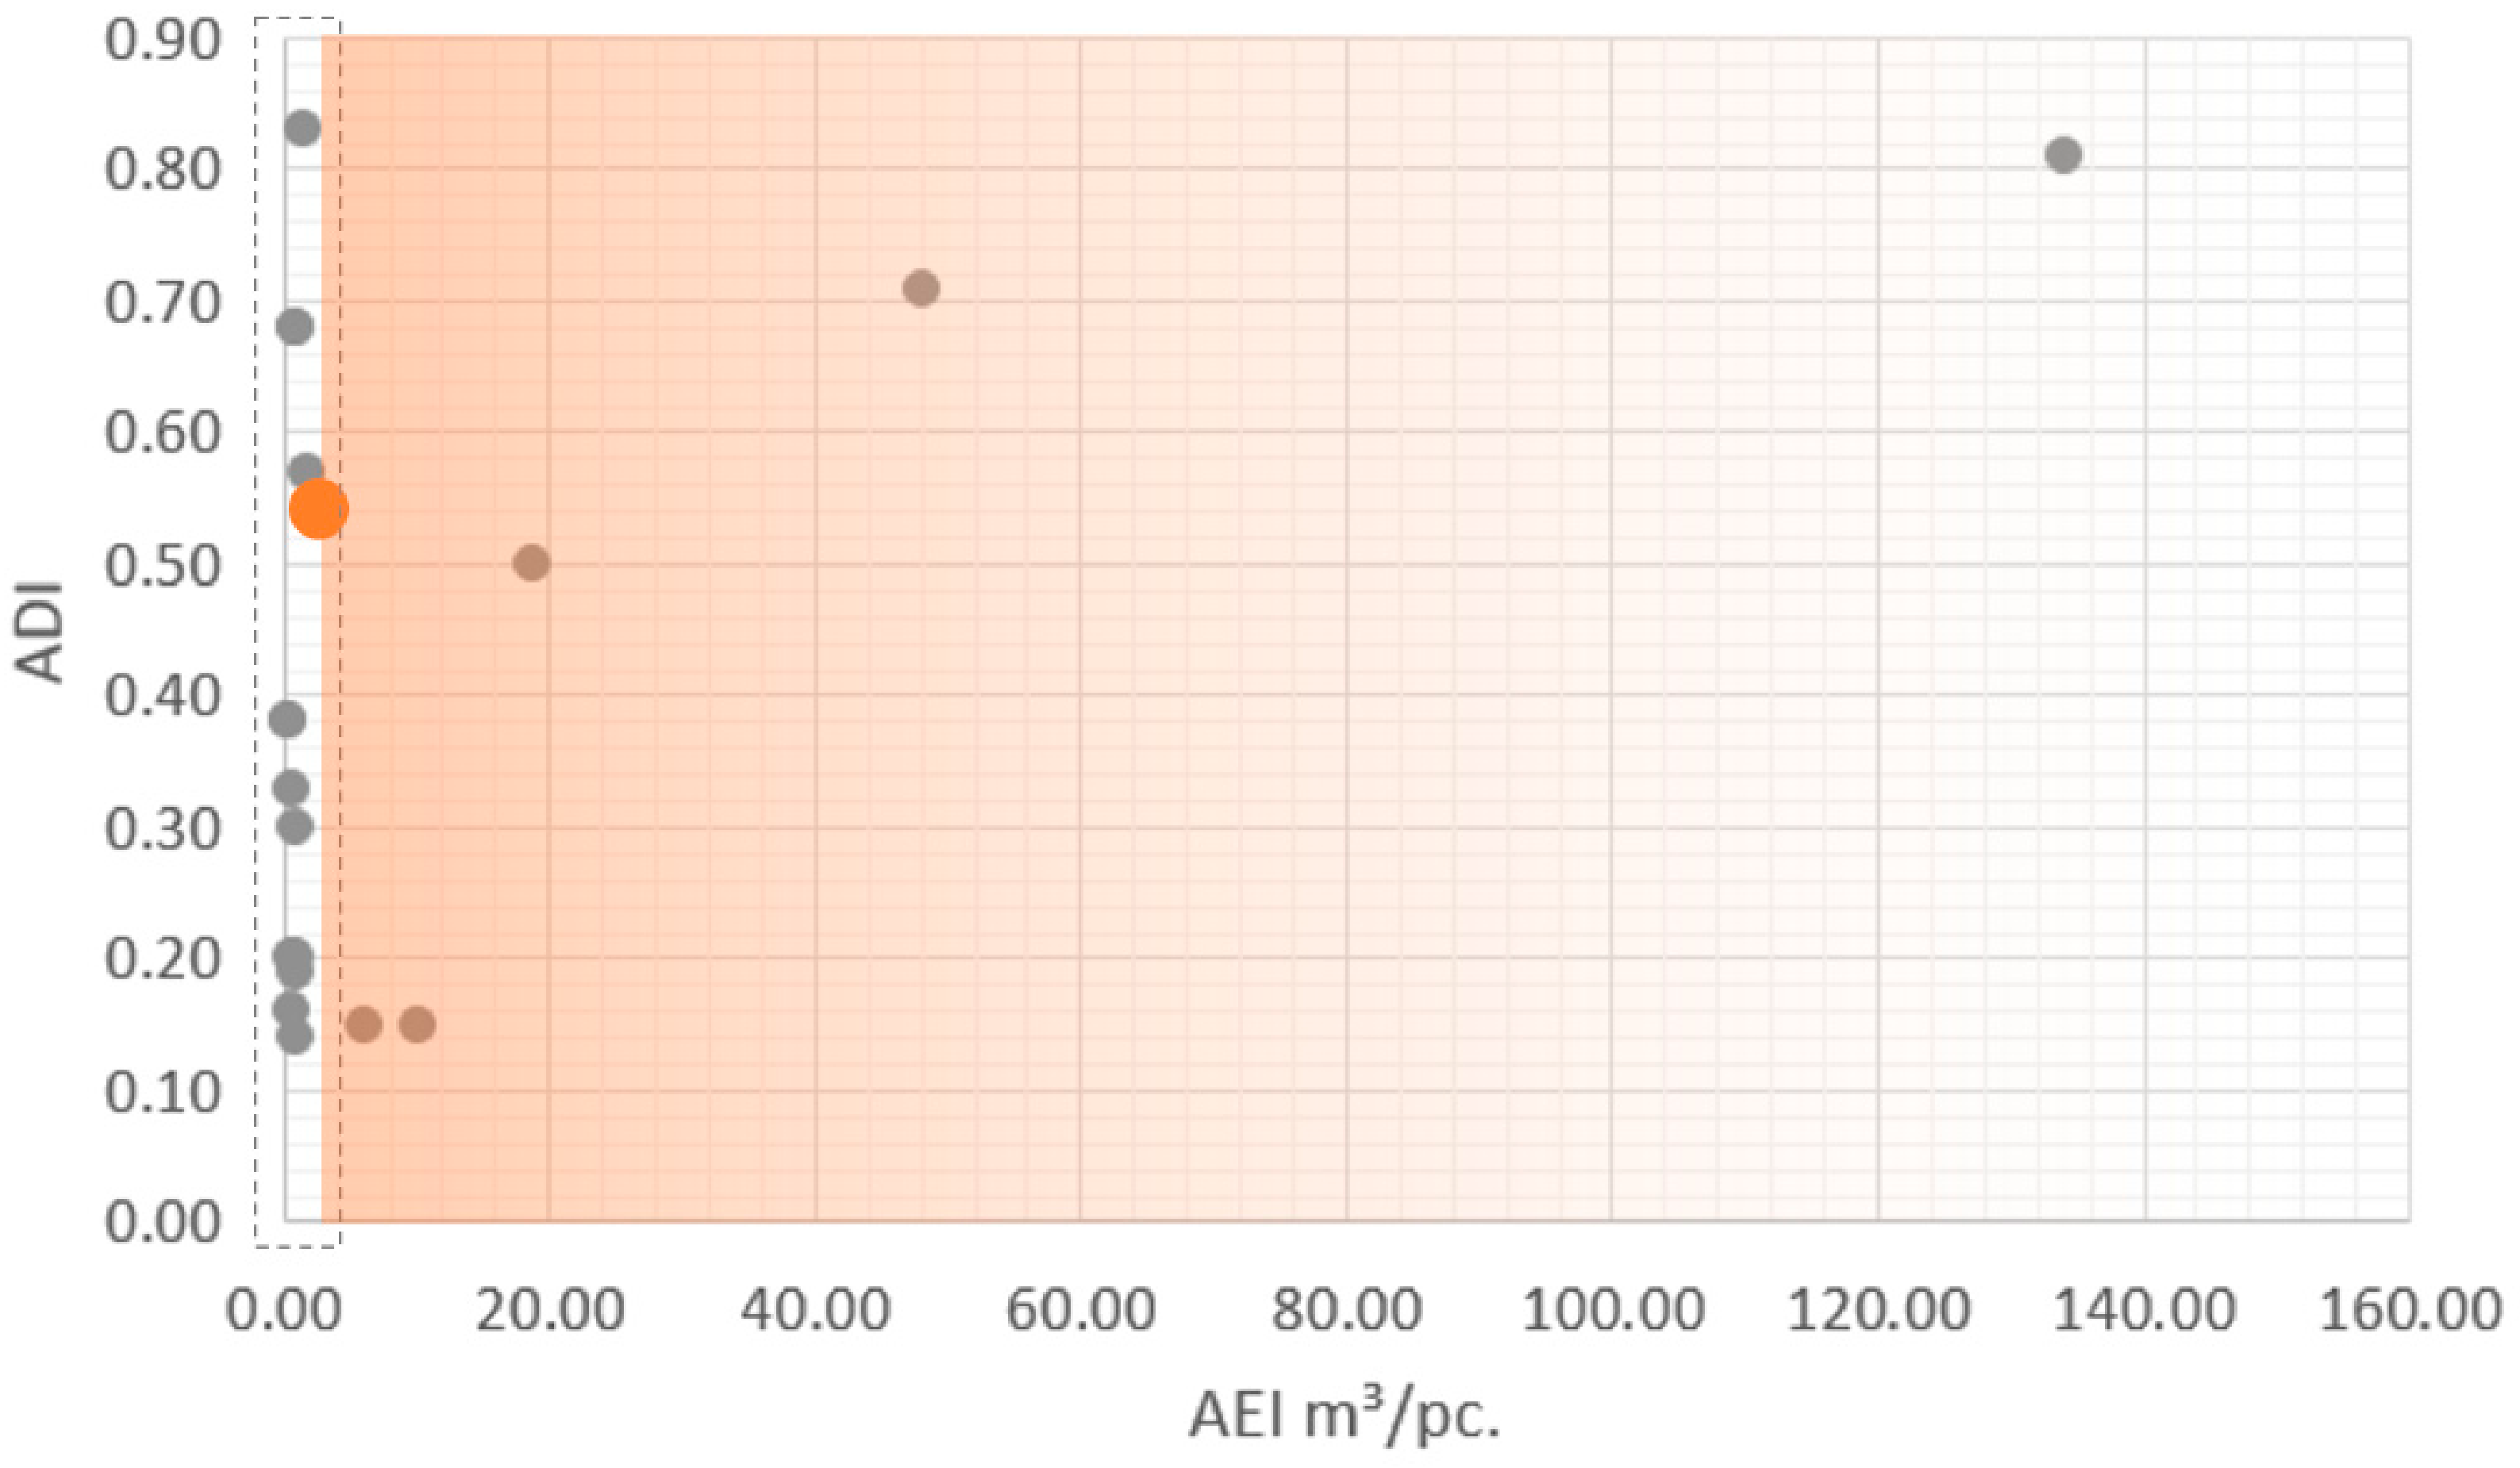
The verification process reveals a positive correlation between the calculated AEI value and the actual assembly efficiency. The overall correlation coefficient (ρ, Pearson’s correlation coefficient) between these two parameters for the 19 Unitinno projects is 0.77 (see
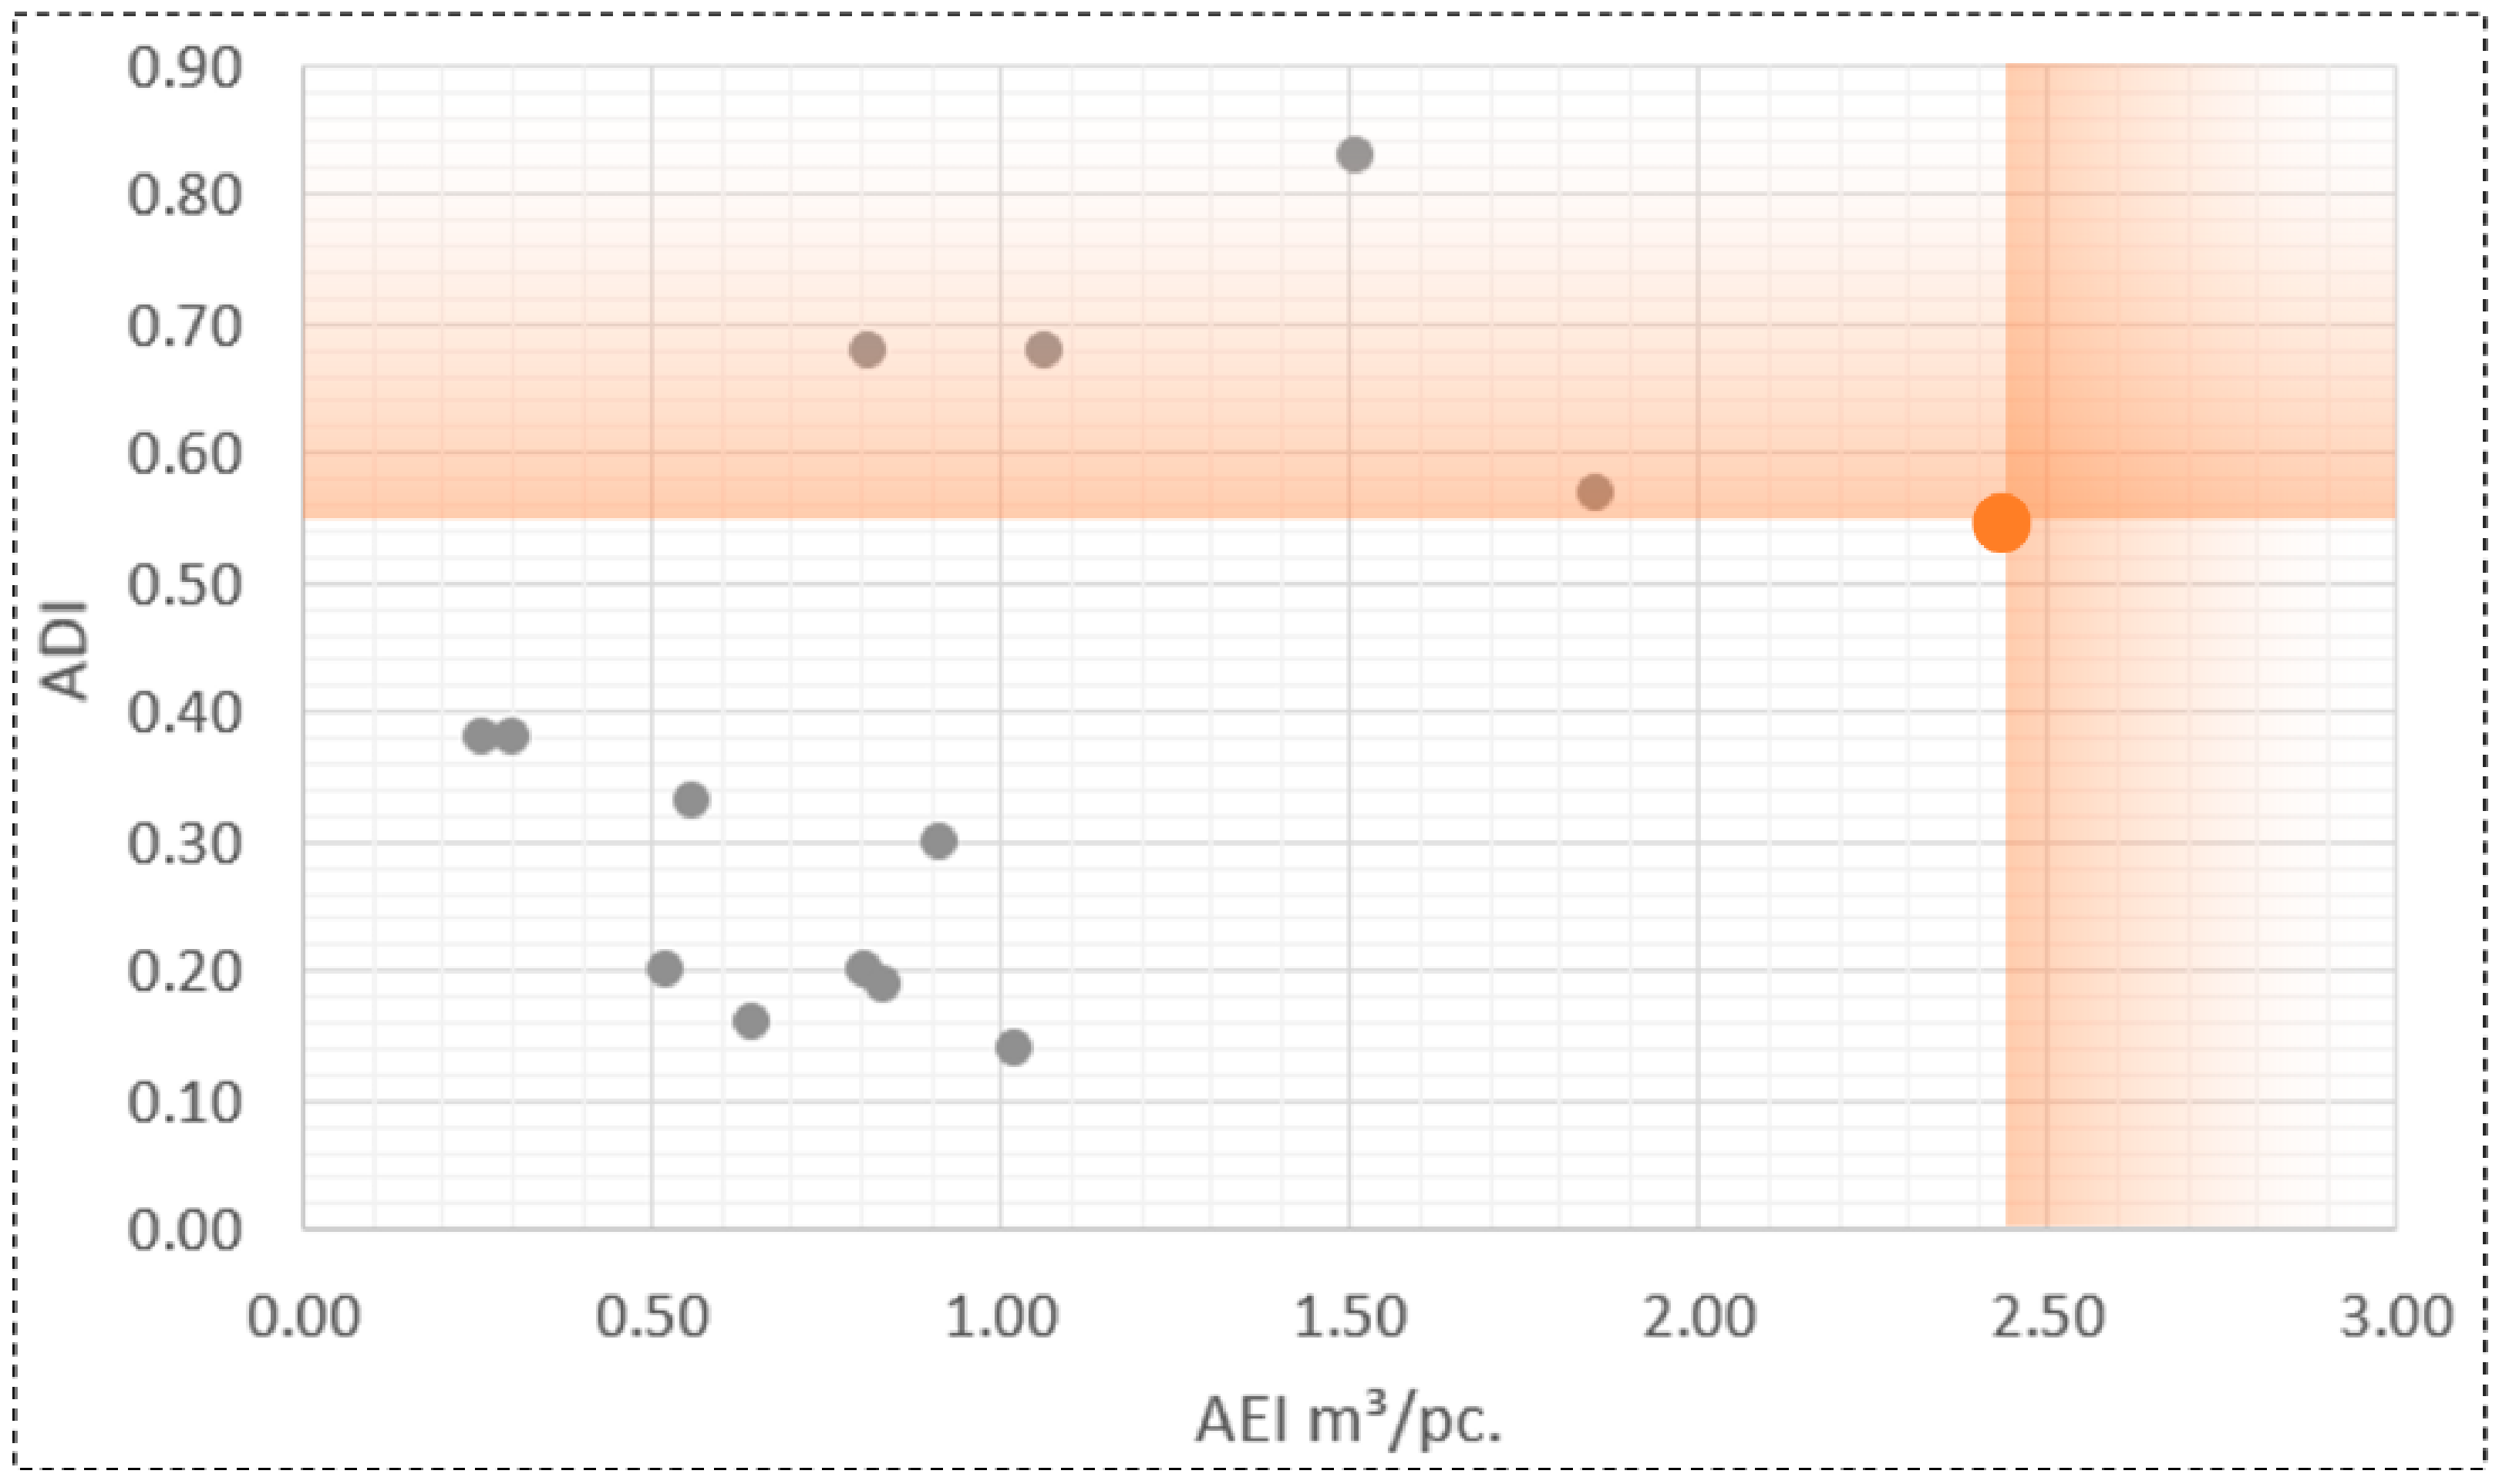
Figure 1). Even after excluding five extreme values, the remaining items still demonstrate a positive correlation between the AEI value and the actual assembly efficiency (see
Figure 2). It is worth noting that assembly time can vary significantly across different construction systems. To further examine the correlation, five projects utilizing the same Checkered Playrooms system were selected. The correlation coefficient between the AEI and actual efficiency for these five projects is as high as 0.94. This indicates that the AEI effectively reflects the actual assembly efficiency.
4. Designing an Evaluation Method for Building Assembly Design
In order to analyze the in-depth design factors that influence efficiency, it is essential to establish a comprehensive evaluation system for building assembly design.
4.1. Formulating Evaluation System of Assembly Design for Buildings
The objective of the building assembly design evaluation system is to identify and select design factors that are relevant to assembly efficiency in order to assess the design. To achieve a comprehensive evaluation of assembly design, this study examines 10 significant documents related to DFA in construction (refer to
Table 8). The key points regarding assembly design are analyzed and summarized based on these documents.
Through a text analysis of the literature, relevant design principles for assembly design are identified and classified according to the design focus. The texts related to assembly are examined in detail to extract and analyze the overall design principles. Consequently, the assembly design principles found in the literature are divided into three categories: (1) whole design; (2) parts design; and (3) connections design.
Hence, the evaluation system for building assembly design comprises three evaluation conditions: whole, parts, and connections. The “whole design” evaluates the overall composition of the building or system, including the overall structure, component relationships, and material selection. The “parts design” evaluates individual components or groups of components, taking into consideration their shape, weight, material, and structure. The “connections design” focuses on evaluating the material and structure of the joints.
4.2. Defining Evaluation Criteria
Once the classification of the evaluation system is determined, a text analysis is conducted to filter the design principles for each factor. In this process, relevant design principles are first selected from each study, followed by the removal of duplicates. Ultimately, 14 design principles related to the assembly design of the whole, parts, and connections are obtained (see
Table 9).
For the whole design, assembly efficiency can be enhanced by primarily reducing the number of parts and joints. Seven documents propose standardized design strategies. For example, the BCA of Singapore mentions the “adoption of standard grids driven by modular systems, standardisation of building elements and details” [
14]. Integrated design can effectively reduce the number of parts and joints, thereby reducing assembly time. Additionally, reducing the variety of materials is an important assembly design principle, for instance, Bogue’s strategy “to use as few dissimilar materials as possible” [
33].
Regarding parts design, assembly efficiency can be improved by utilizing standard, larger, lighter, easy-to-handle, strong, and replaceable parts. Standard parts can be easily manipulated, leading to reduced assembly time. The size, weight, and shape of components are crucial factors affecting assembly operations. Gbadamosi et al. mention that the “weight of parts should be within the efficient handling” [
10]. Moreover, “fragile parts that require special damage protection and handling should be avoided” [
10], which is also an important principle of component design. The use of replacement components allows for quick disassembly and replacement in case of assembly errors.
For connections design, the objectives of standardization and simplification align with the whole design and parts design aspects. Adopting appropriate tolerances is a significant factor influencing assembly. RIBA and the BCA of Singapore both propose tighter control of tolerances [
13,
14]. Additionally, the BCA suggests developing robust connection details [
14].
To validate the selected design principles, the Delphi method [
34] was employed in this study, involving two rounds of consultations with 12 professionals through questionnaires. The selection of professionals was based on criteria such as academic qualifications, occupation, industry of work, and assembly experience, ensuring a mix of expertise and diversity (refer to
Figure 3). More than half of the final selected experts held a bachelor’s degree or higher, with at least two years of work experience. Their occupations included architects, engineers, managers, and researchers, all working in fields related to assembly. They possessed 2–15 years of assembly experience and demonstrated a good understanding of the questionnaire’s content. Ultimately, after two rounds of inquiry, experts confirmed the validity of all 14 design principles.
4.3. Defining Weights of Criteria
Once the validity of the design evaluation criteria is confirmed, it is necessary to assign weights to each criterion. This process involves utilizing expert ratings obtained from the questionnaire and calculating the weights using the Analytic Hierarchy Process (AHP) method [
35]. By comparing the criteria pairwise, the weights of each criterion can be analyzed and quantified. The importance of each criterion is derived from the previous expert surveys, where experts were required to rate the importance of each design principle (see
Table 10). Based on the results obtained through the Delphi method, the weights were calculated using the AHP method. The experts generally considered the whole design and standardization to be more important, while the importance of reducing material variations and using strong parts and connections was relatively lower.
Finally, after establishing the weights for each criterion, it is essential to define the scoring principles to form a comprehensive evaluation system. Although the design evaluation presented here is a qualitative method aimed at assessing the pros and cons of assembly design and analyzing assembly issues, a scoring method is necessary to evaluate the strengths and weaknesses. Therefore, this research employs a scoring method with three levels: 1–0.5–0, representing high, medium, and low levels, respectively. Finally, a complete DFA evaluation system for building assembly design is established.
Subsequently, a prefabricated building case is evaluated using the developed DFA evaluation method to verify the feasibility of the evaluation method and identify assembly design issues.
5. Case Study: DFA Evaluation of the New Lawuga School
5.1. Background Information
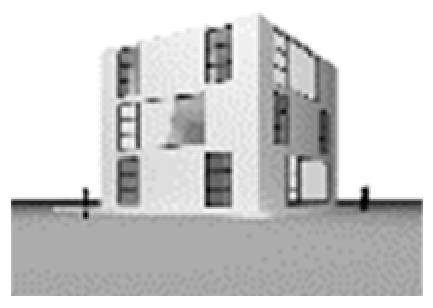
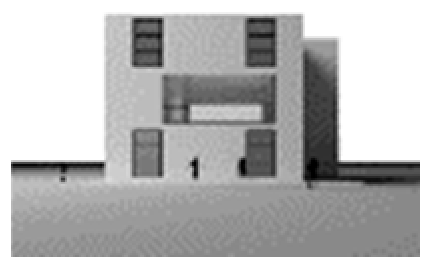
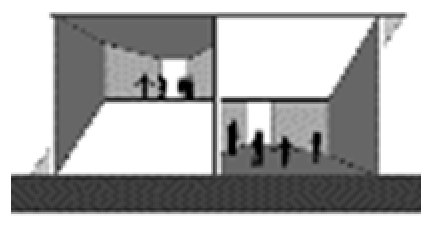
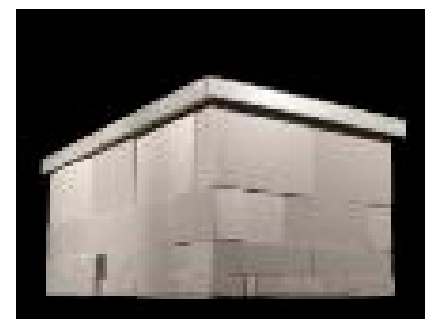
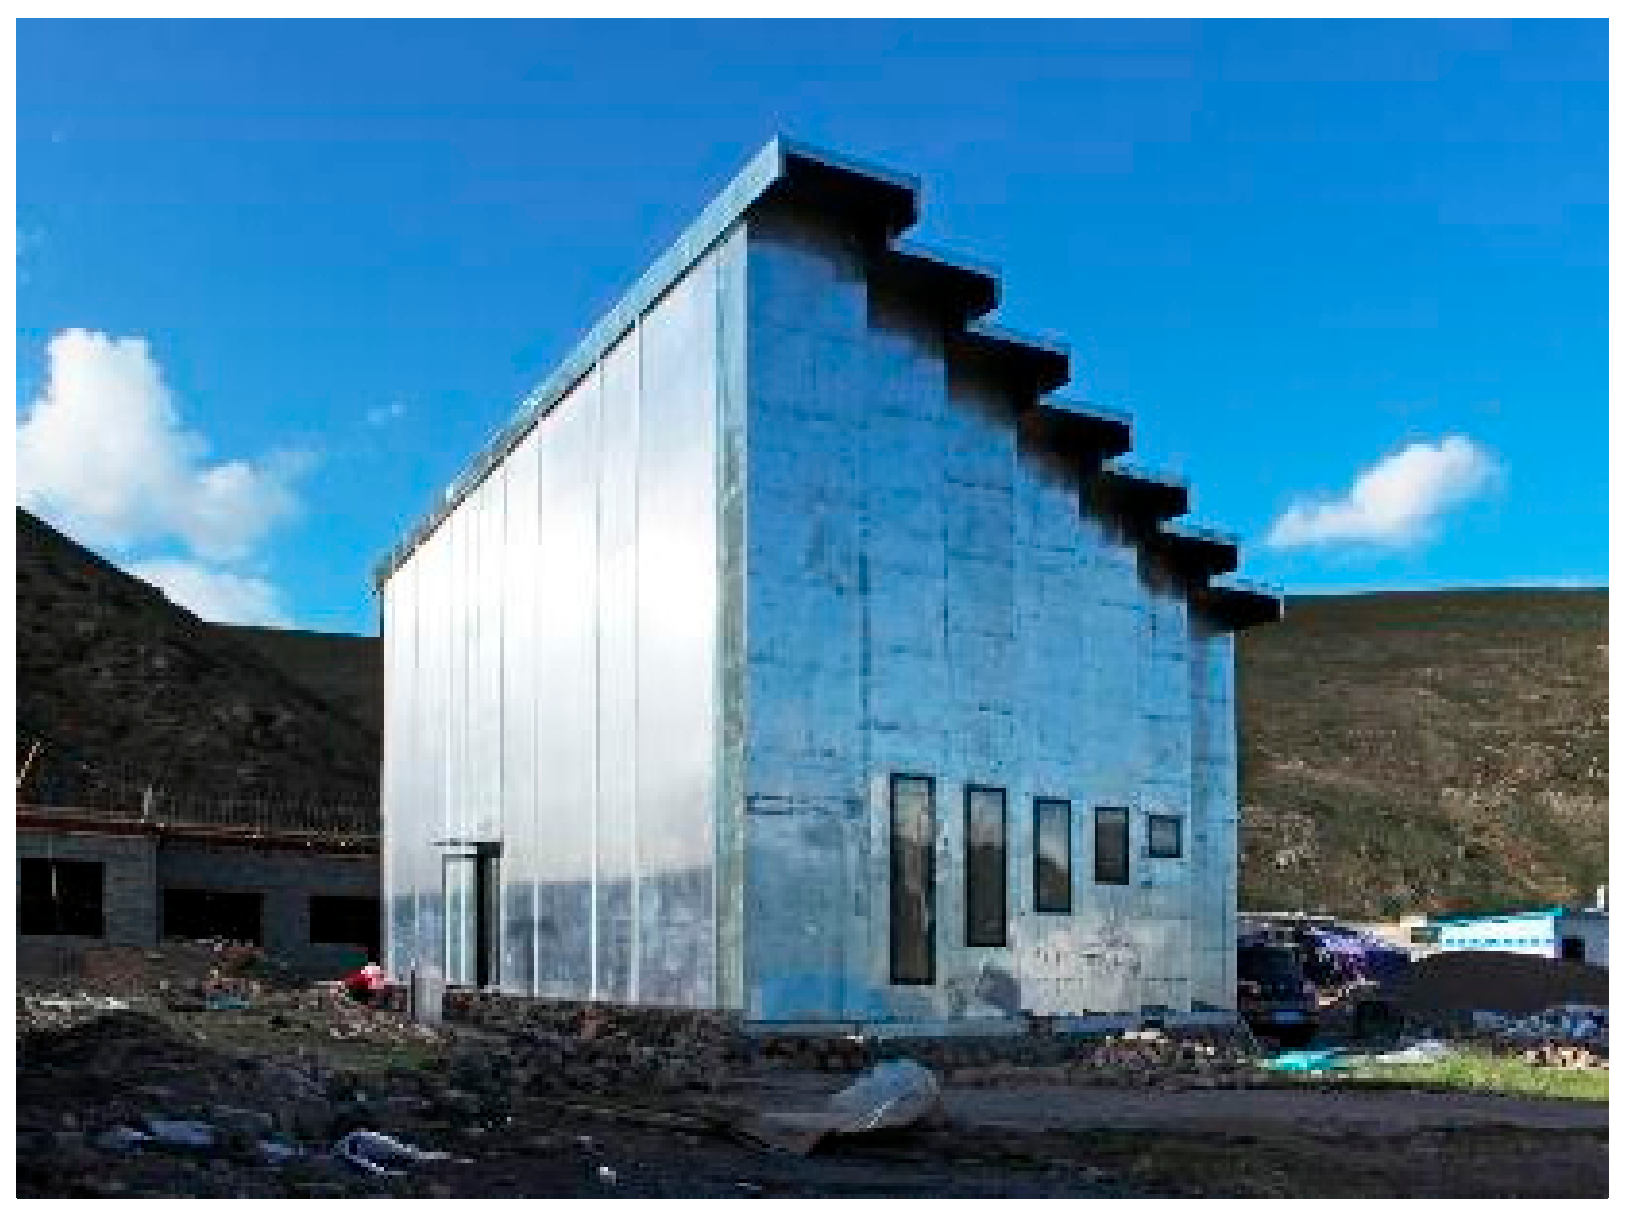
The New Lawuga School was chosen as the study case because detailed information was acquired while working with the design team, even though the authors were not directly involved in the project. The New Lawuga School (
Figure 4), designed by Unitinno Studio in 2015 and covering an area of 200 m
2, is situated in the Yushu region of Qinghai, China [
36]. The school is located in a plateau environment, characterized by its unique geographical features and climatic conditions.
The building site in Yushu, Qinghai, experienced a devastating earthquake with a magnitude of 7.1 on the Richter scale in 2010. As a result of the earthquake, 70% of the school buildings in Yushu collapsed [
37]. The New Lawuga School was constructed as a charitable primary school as part of the reconstruction efforts following the earthquake. The site is situated in a region characterized by typical plateau climate conditions, including long freezing winters with heavy snowfall and short summers with significant temperature fluctuations between day and night. The snow cover period in the area ranges from 207 to 343 days, and the annual average temperature is approximately 3 °C, with the lowest temperature recorded at −28 °C. Moreover, the oxygen content in the air at this altitude is only 1/3 to 1/2 of that at sea level [
38,
39]. Construction in Yushu is only feasible for approximately five months each year, with a winter break occurring from October to April. Therefore, the architectural design needed to meet the requirements of sustainability, user comfort, construction conditions, and limited construction periods.
The design process for this project involved the development of a new building system. The design team undertook extensive exploration and experimentation with various system solutions throughout the process. The design and construction were divided into four stages: preliminary design, in-depth design, factory fabrication, and on-site assembly. The entire process took 29 months, spanning from 2013 to 2015.
In the first phase of the project, six different design schemes were developed (see
Table 11). Although these schemes varied in terms of volume, layout, and form, they all incorporated modular or panel systems. Specifically, they utilized three-dimensional modules made of panels, referred to as ‘spatial panels’ by the architect [
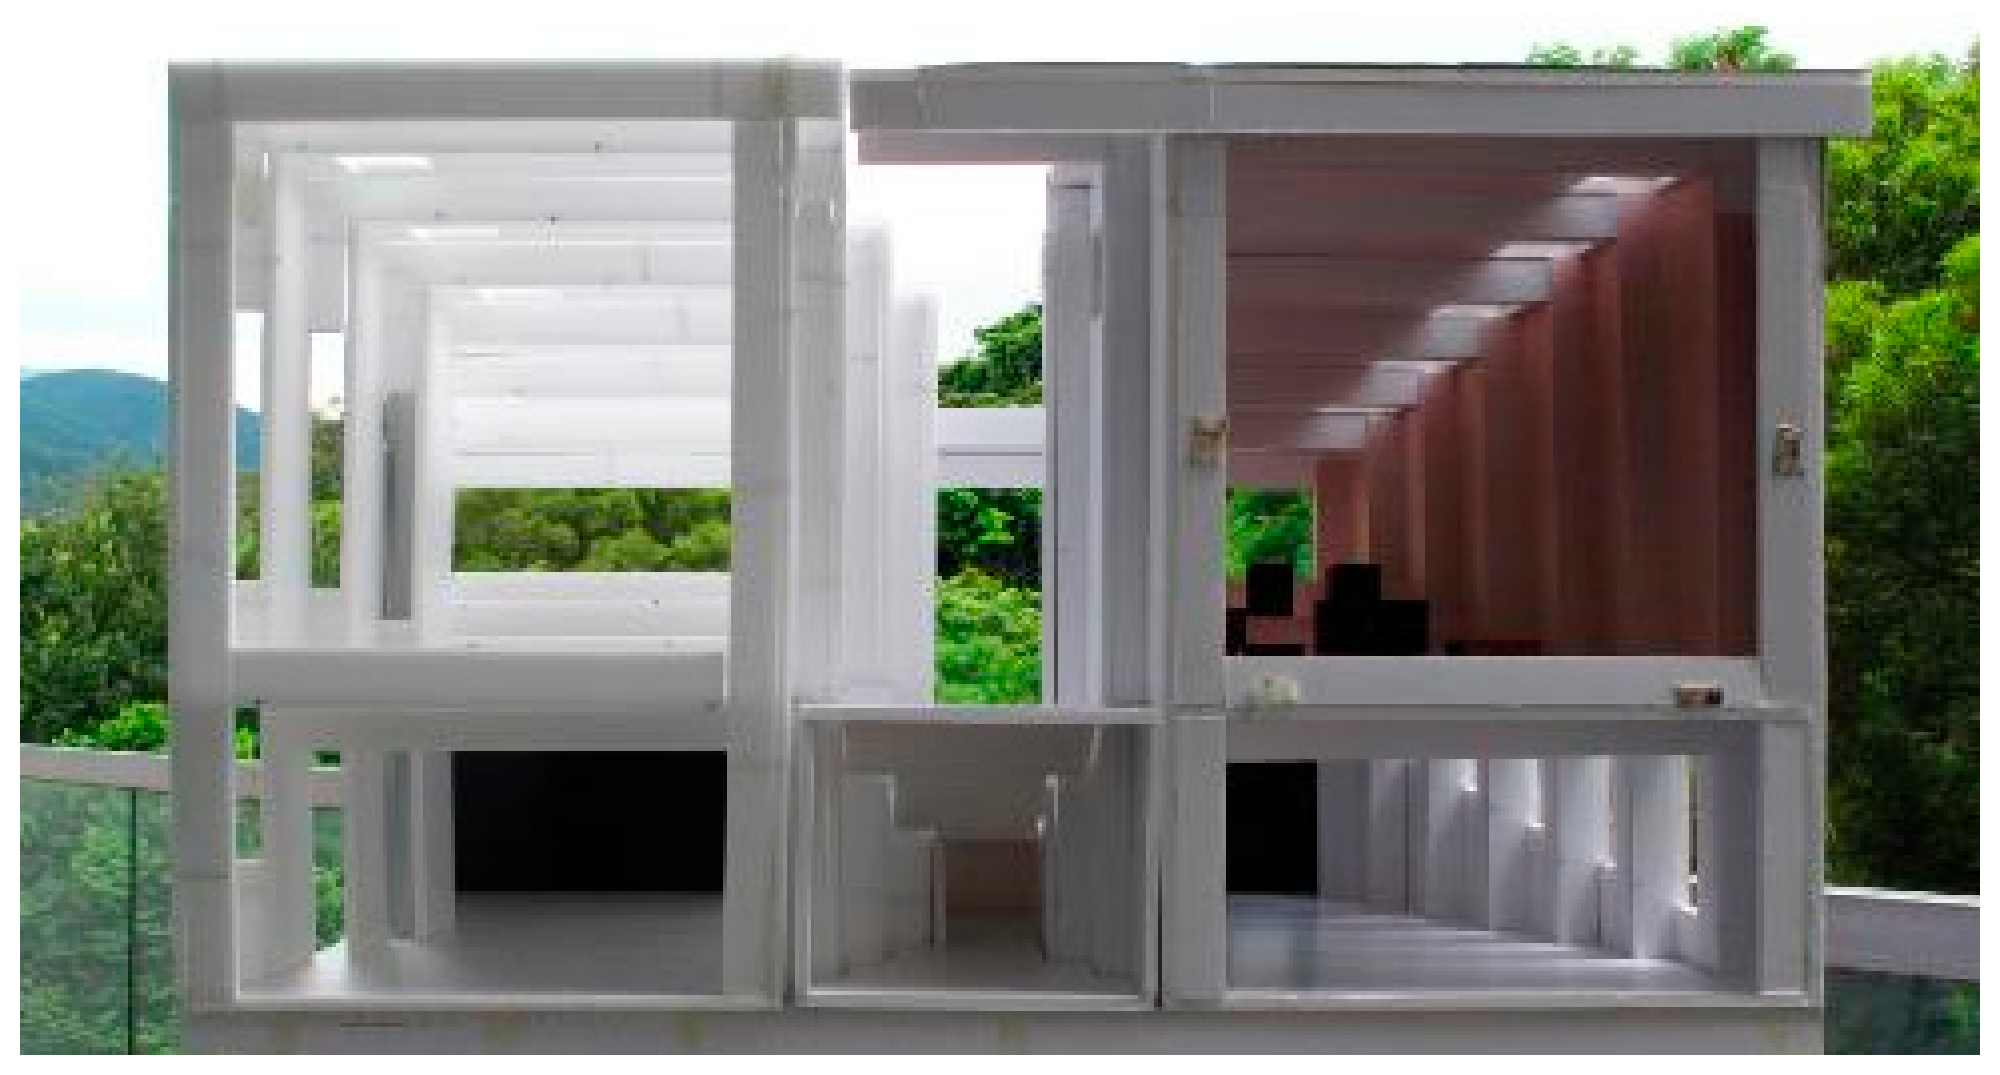
26]. The concept of using panel systems in construction was initially explored by the project team in earlier projects such as the Liziping Reserve Workstation in 2012 and an exhibition space utilizing a Z-shaped panel system in 2013 [
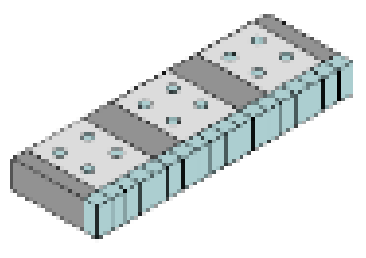
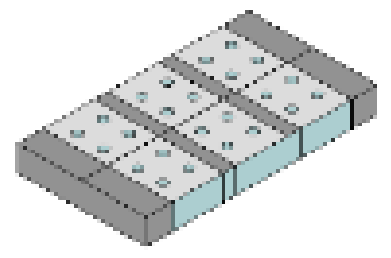
40]. These previous experiences provided inspiration for the system design in the second phase of the New Lawuga School. In the second phase, the overall function, structure, envelope, and construction of the school were improved based on the original spatial concept. The focus was on developing a spatial panel construction system composed of Z-shaped panels [
36] (
Figure 5).
The construction process involved manufacturing the components in factories and then transporting them to the site for assembly. The component manufacturing took six months and was carried out in three different factories: two wood factories for wood panel processing and a metal workshop for metal sheets, joints, and foundation elements.
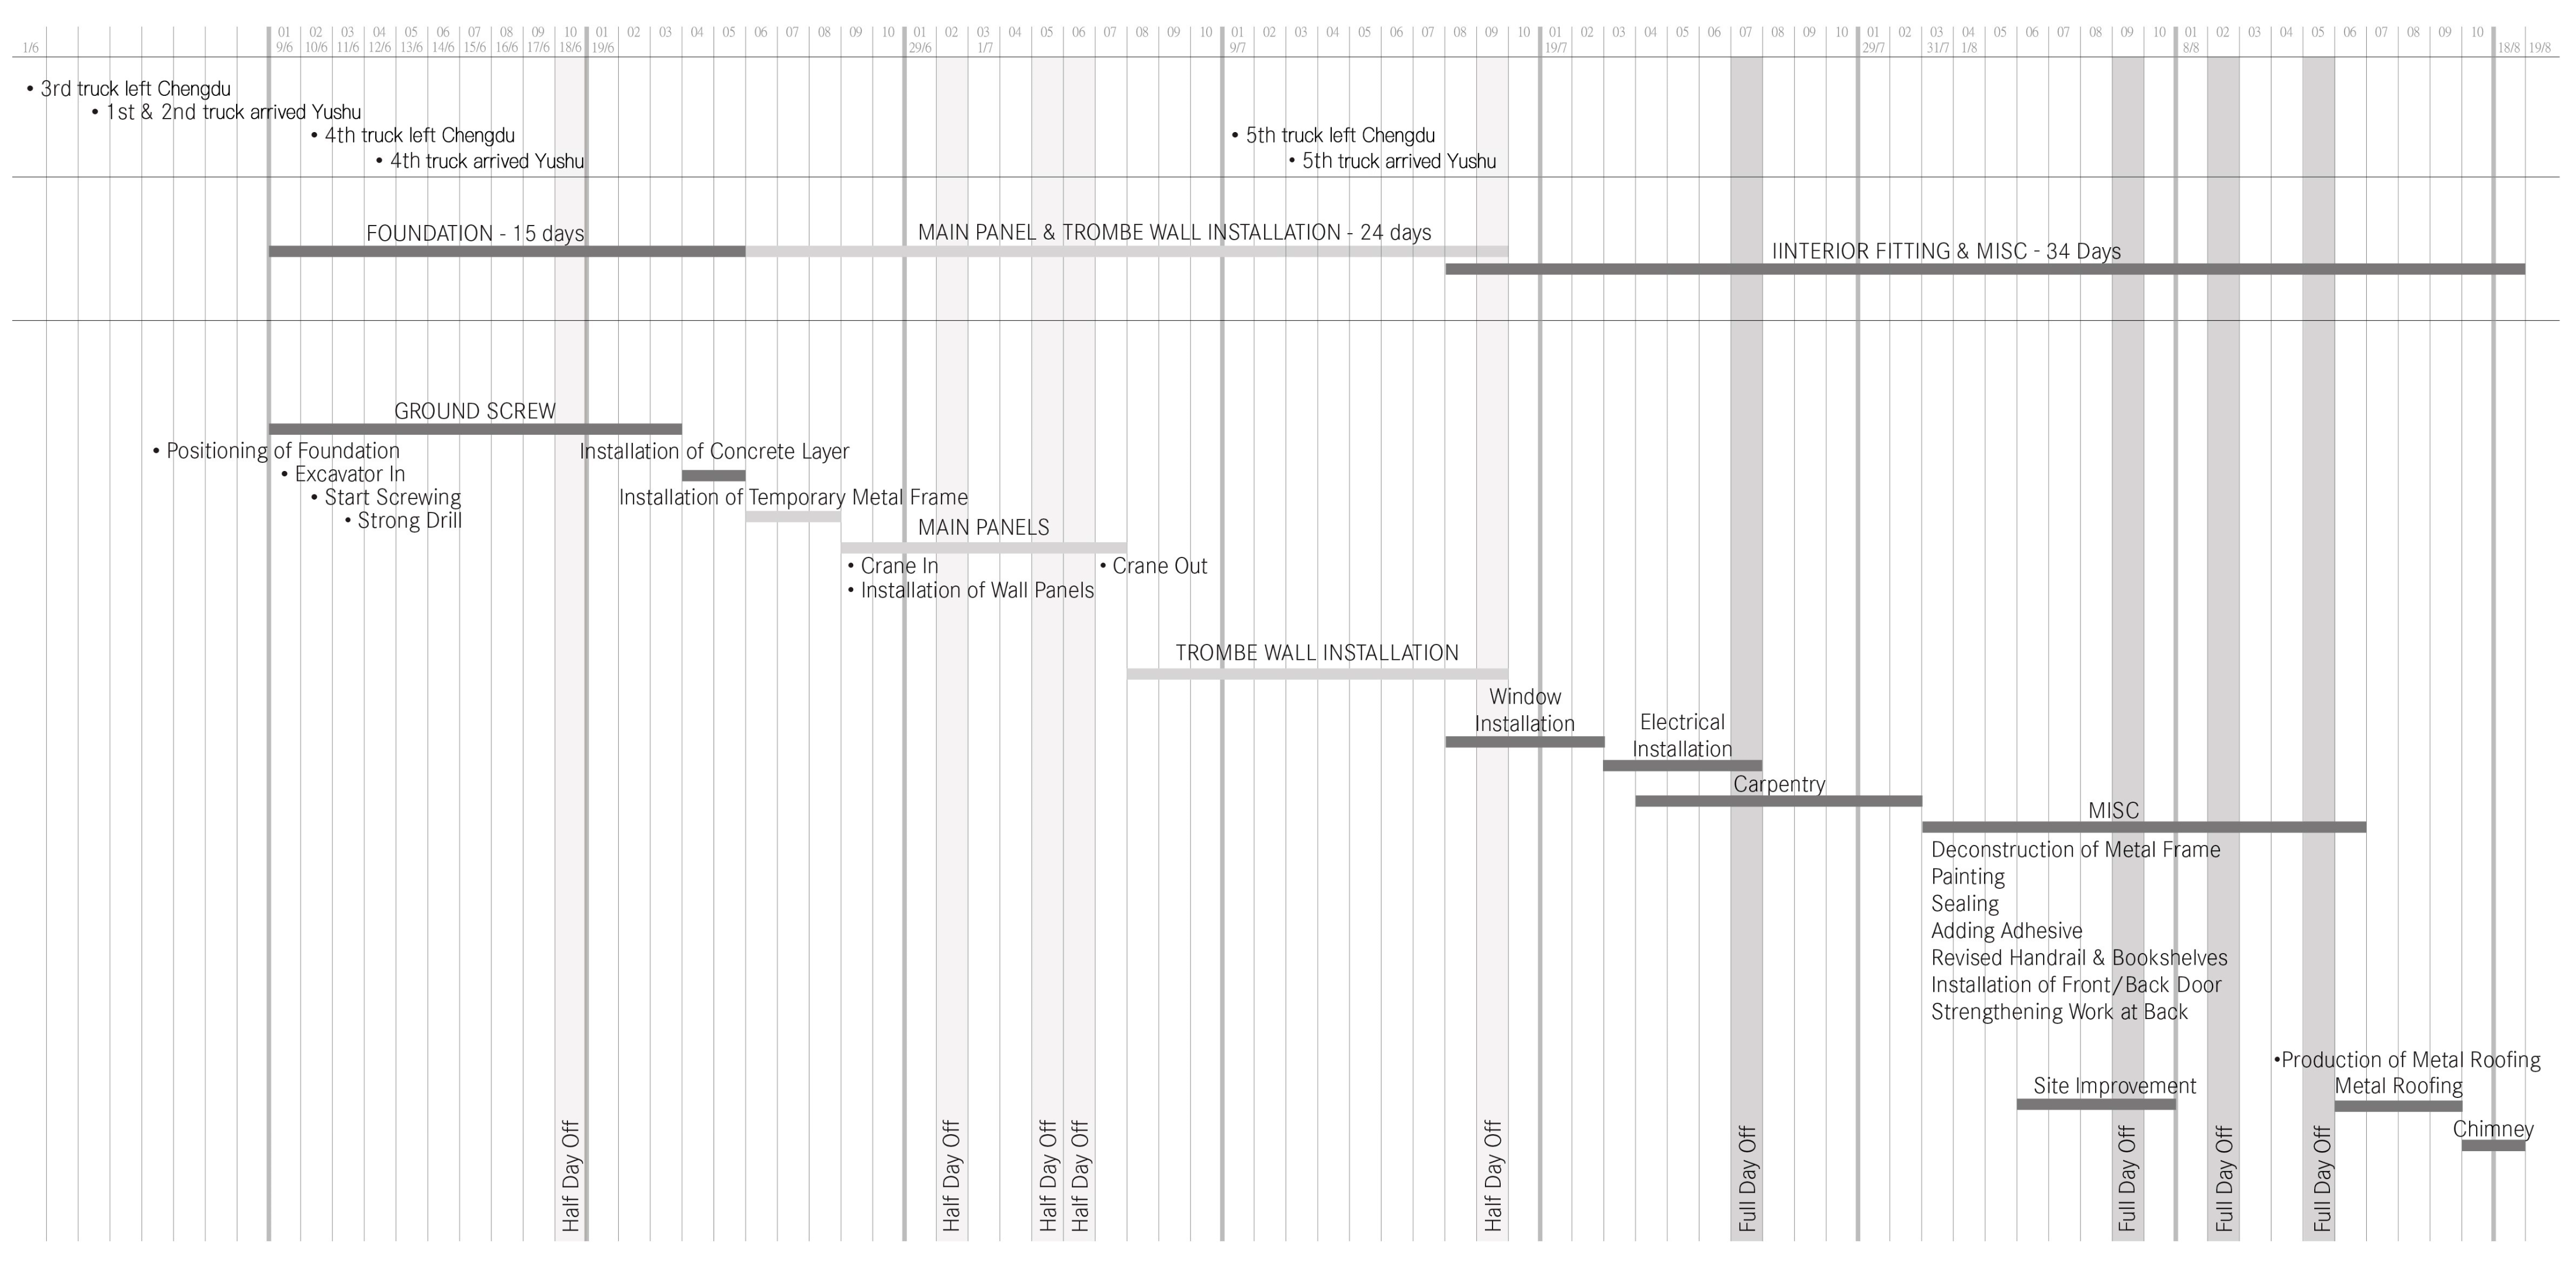
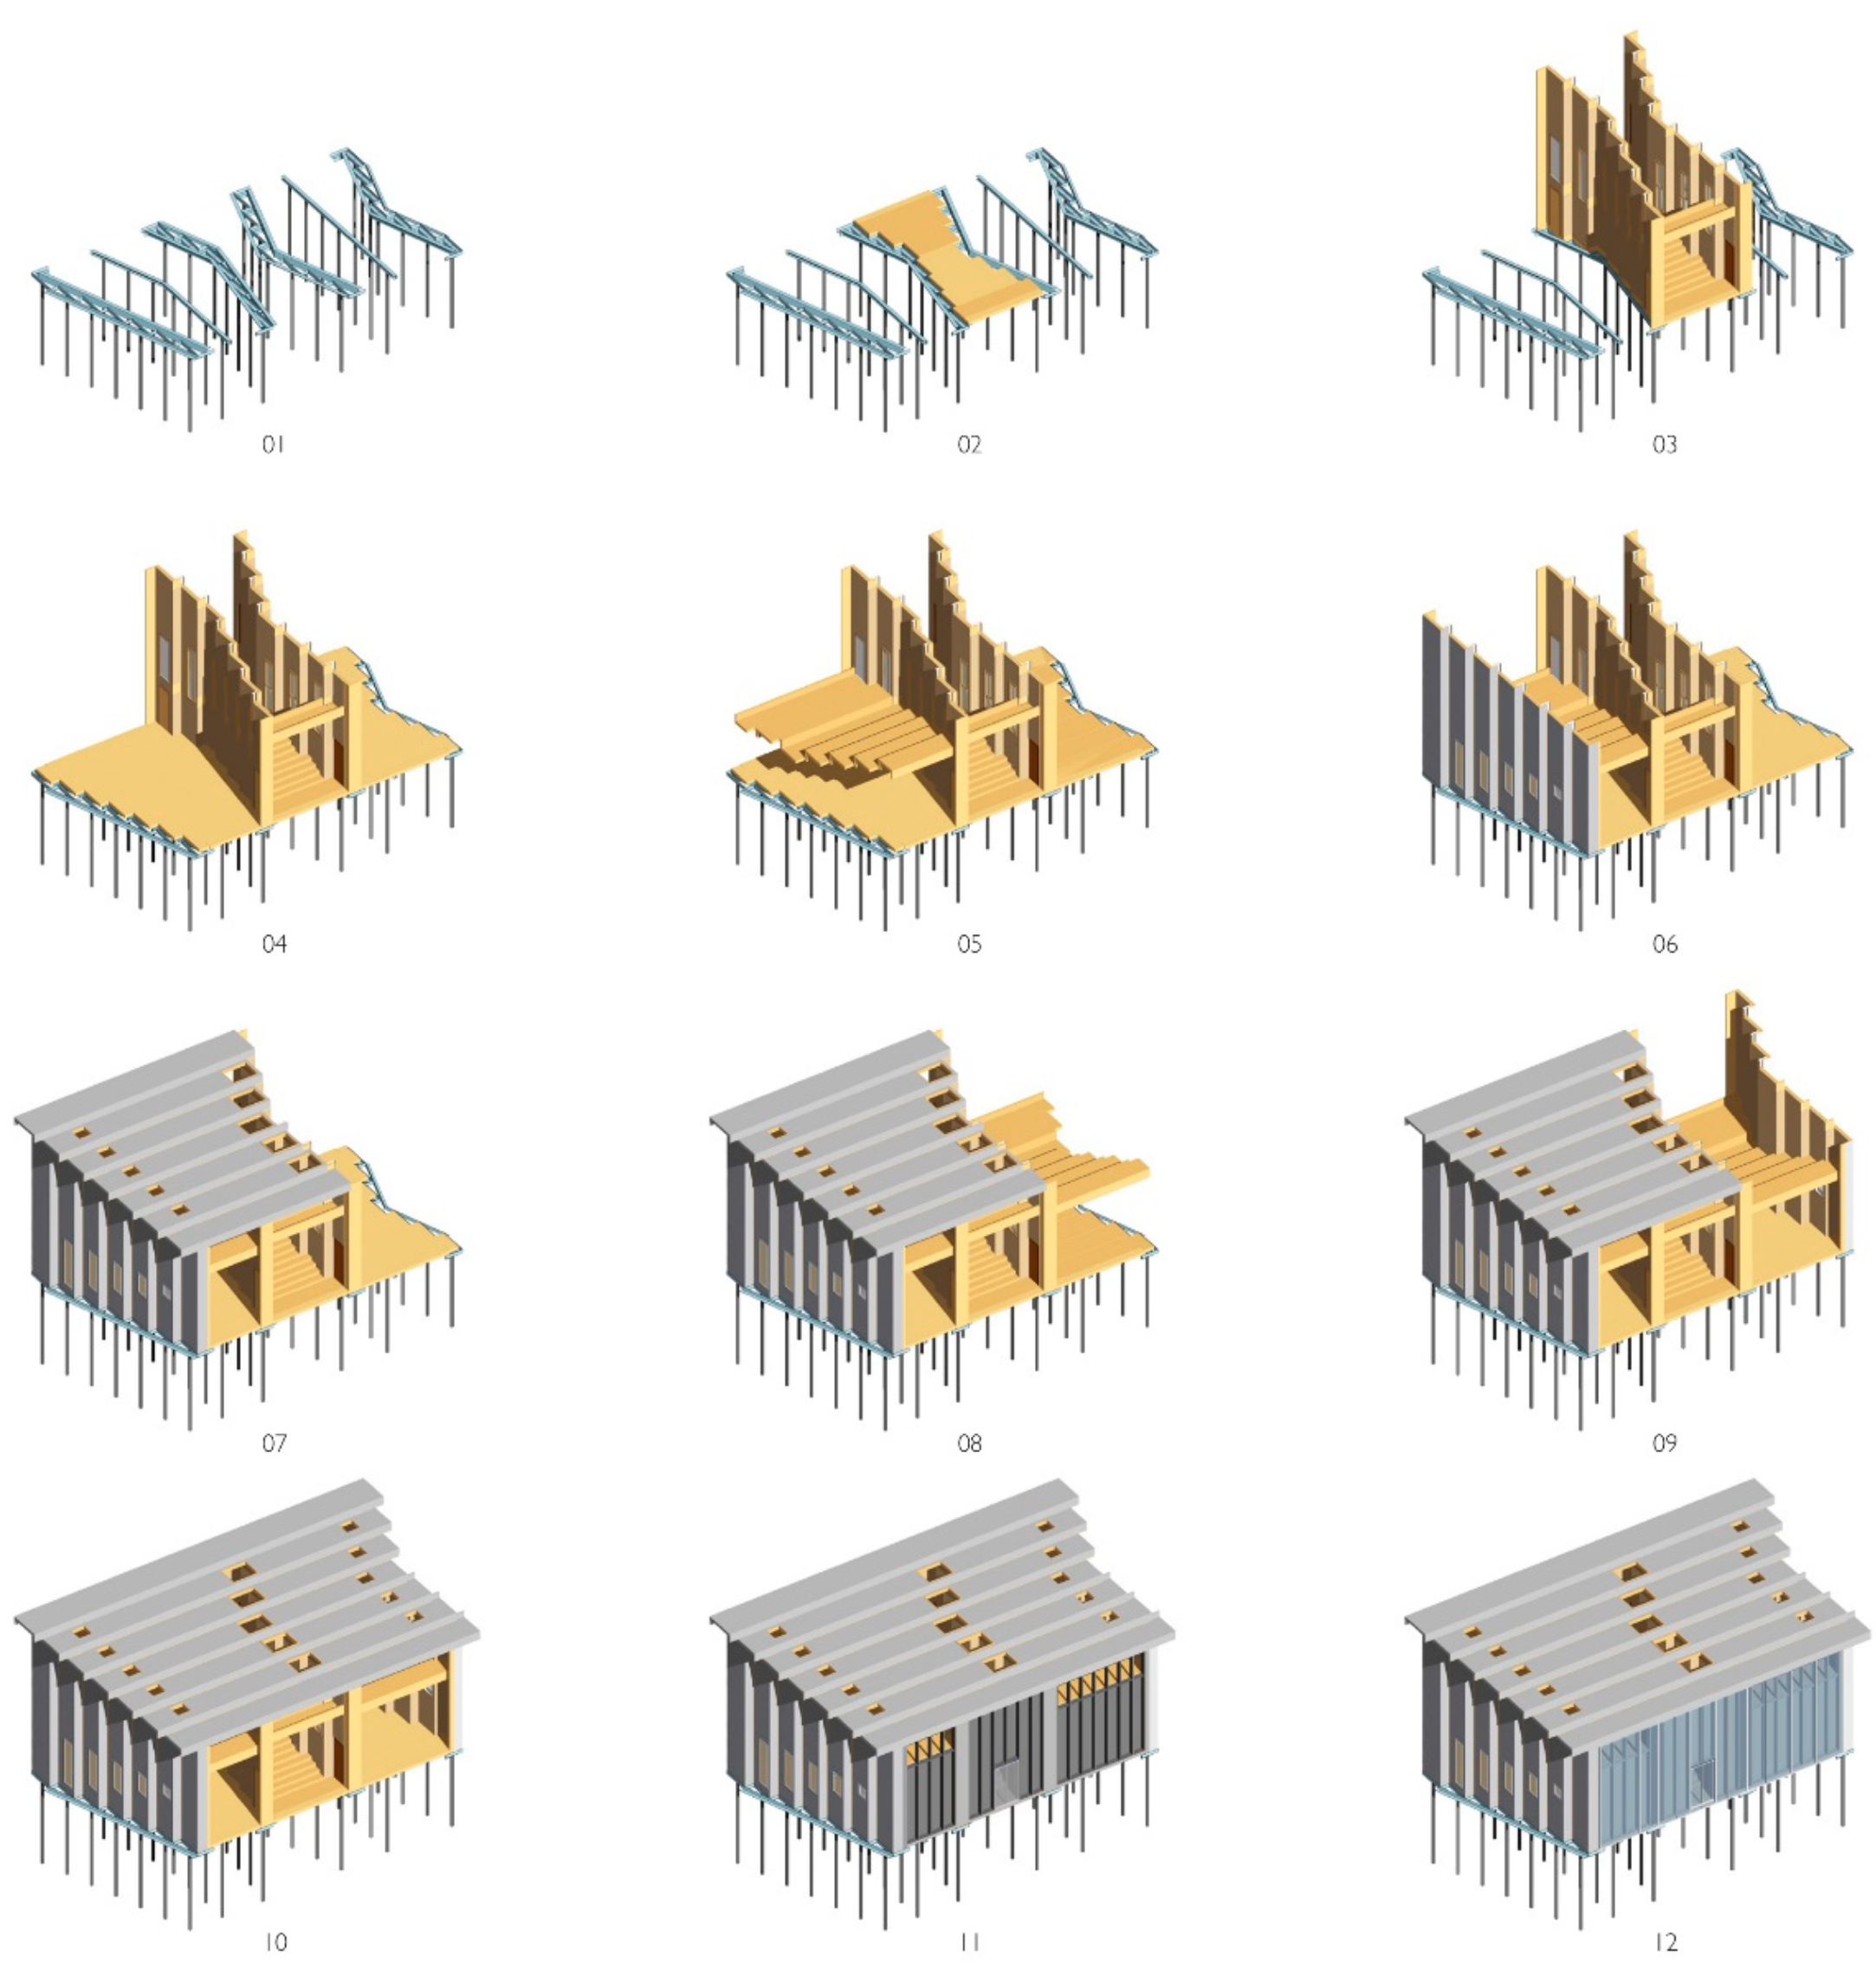
The on-site construction began on June 9, 2015, and lasted until August 18, with a total of 70 days including 6.5 days of rest (
Figure 6). The construction process can be divided into five stages: foundation, main panels, Trombe walls, interior fittings, and other miscellaneous tasks (
Figure 7). The foundation work started on June 9 and continued for 15 days after the mechanical equipment and the first batch of components arrived at the site. The building’s foundation was constructed using a ground screw system [
41]. Once the foundation was completed, the construction progressed by erecting the central wall panels to establish an independent and stable central structure [
41]. Subsequently, the floors were installed on the south side with temporary scaffolding supporting the overhead floor panels. Following that, the south side walls and roof were installed, followed by the same process on the north side.
5.2. DFA Evaluation Process and Results
The New Lawuga School had a total area of 201 m
2 and a volume of 760 m
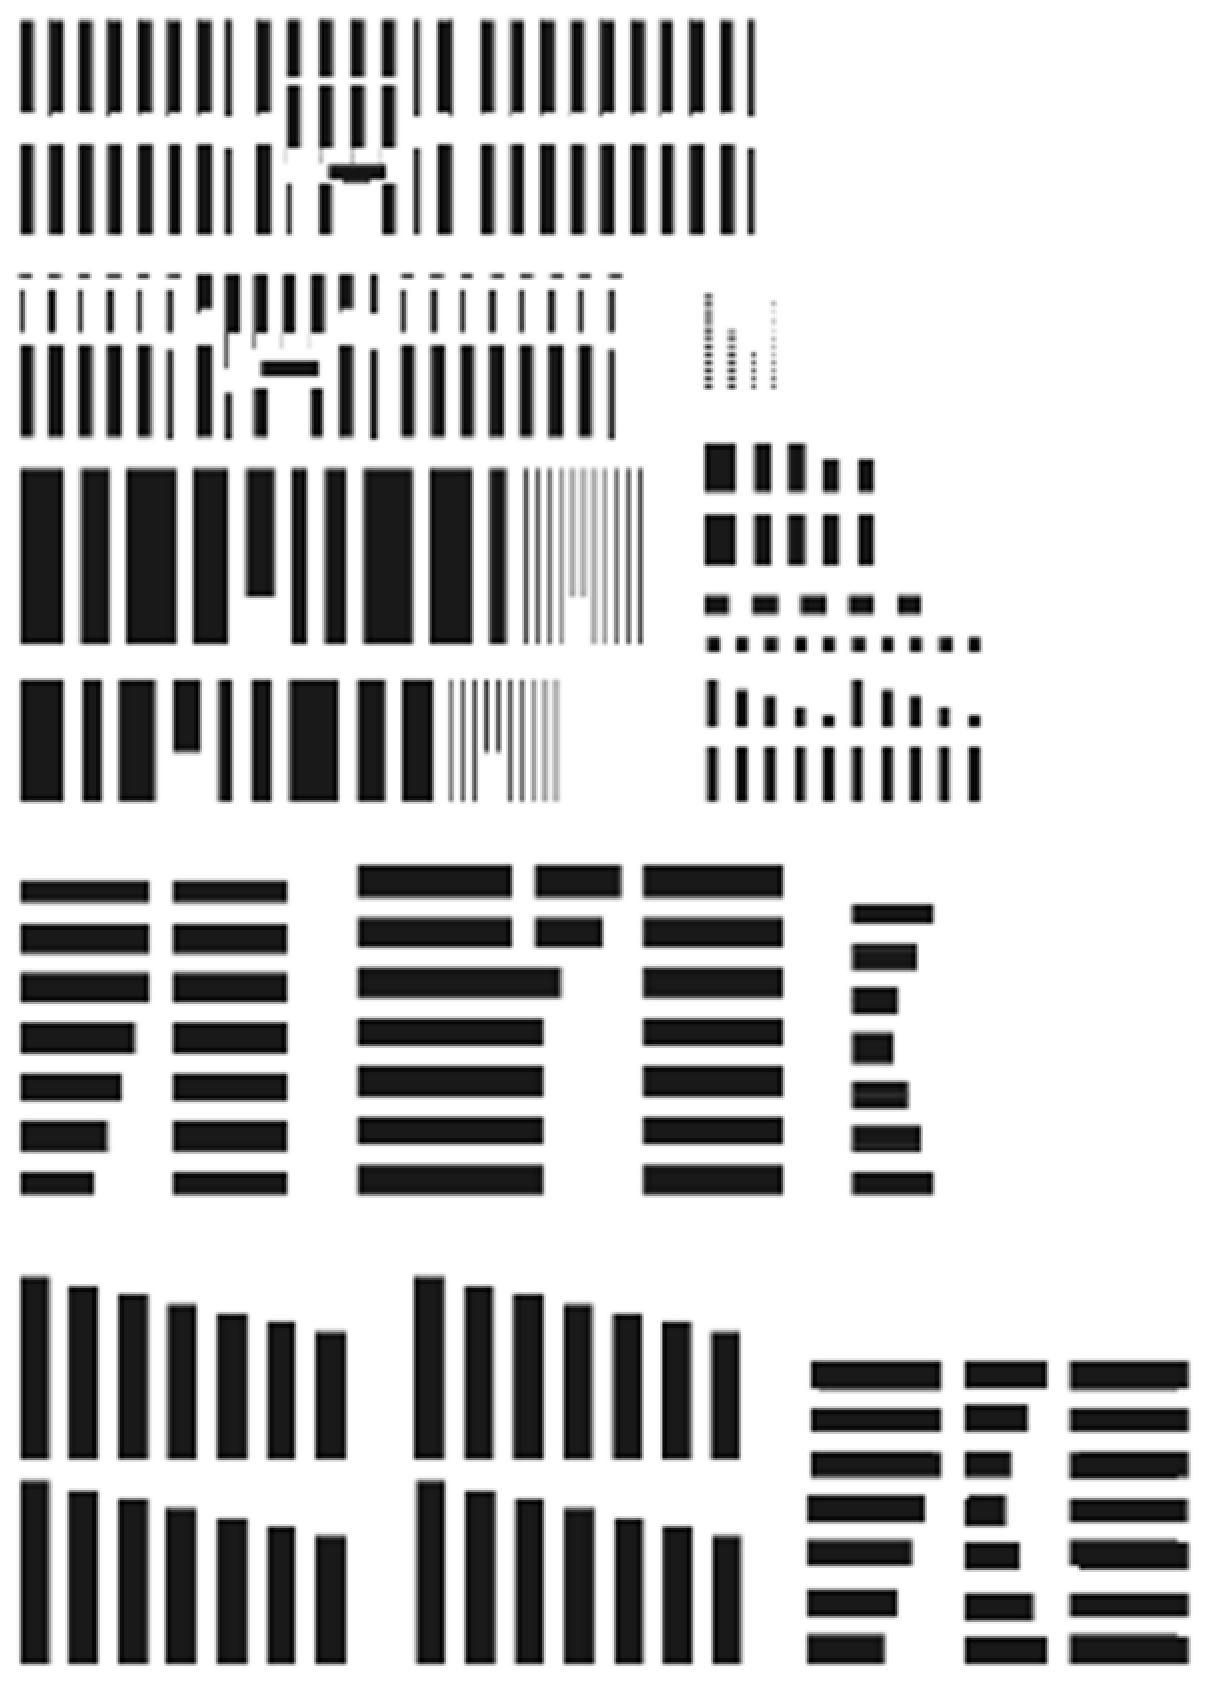
3, which included four classrooms. The assembly of the structure and envelope of the building took a total of 21 days, with 8 days dedicated to the main structure. The building was composed of 312 components, including 86 structural components, 143 Trombe wall components, 45 door and window components, and 38 connection components (
Figure 8). By calculating the AEI using the formula building volume divided by the number of parts, the New Lawuga School achieved an AEI result of 2.44 m
3/pc.
When comparing the AEI of the New Lawuga School with 18 other cases from Unitinno Studio (
Figure 9), it can be observed that its efficiency level is relatively lower. However, this is mainly due to the inclusion of extreme cases that have particularly high assembly advantages. If these extreme values are removed, the AEI of the New Lawuga School is shown to be at a high level (
Figure 10). However, the assessment of AEI indicates that although the assembly efficiency of the implemented scheme was already quite high, there is still potential for further improvement.
To further evaluate the assembly design and identify the design factors affecting assembly, an ADI assessment was conducted based on the collected data. The ADI assessment results (see
Table 12) indicate that the whole design of the New Lawuga School received the highest score, followed by the connections design, while the parts design received the lowest score.
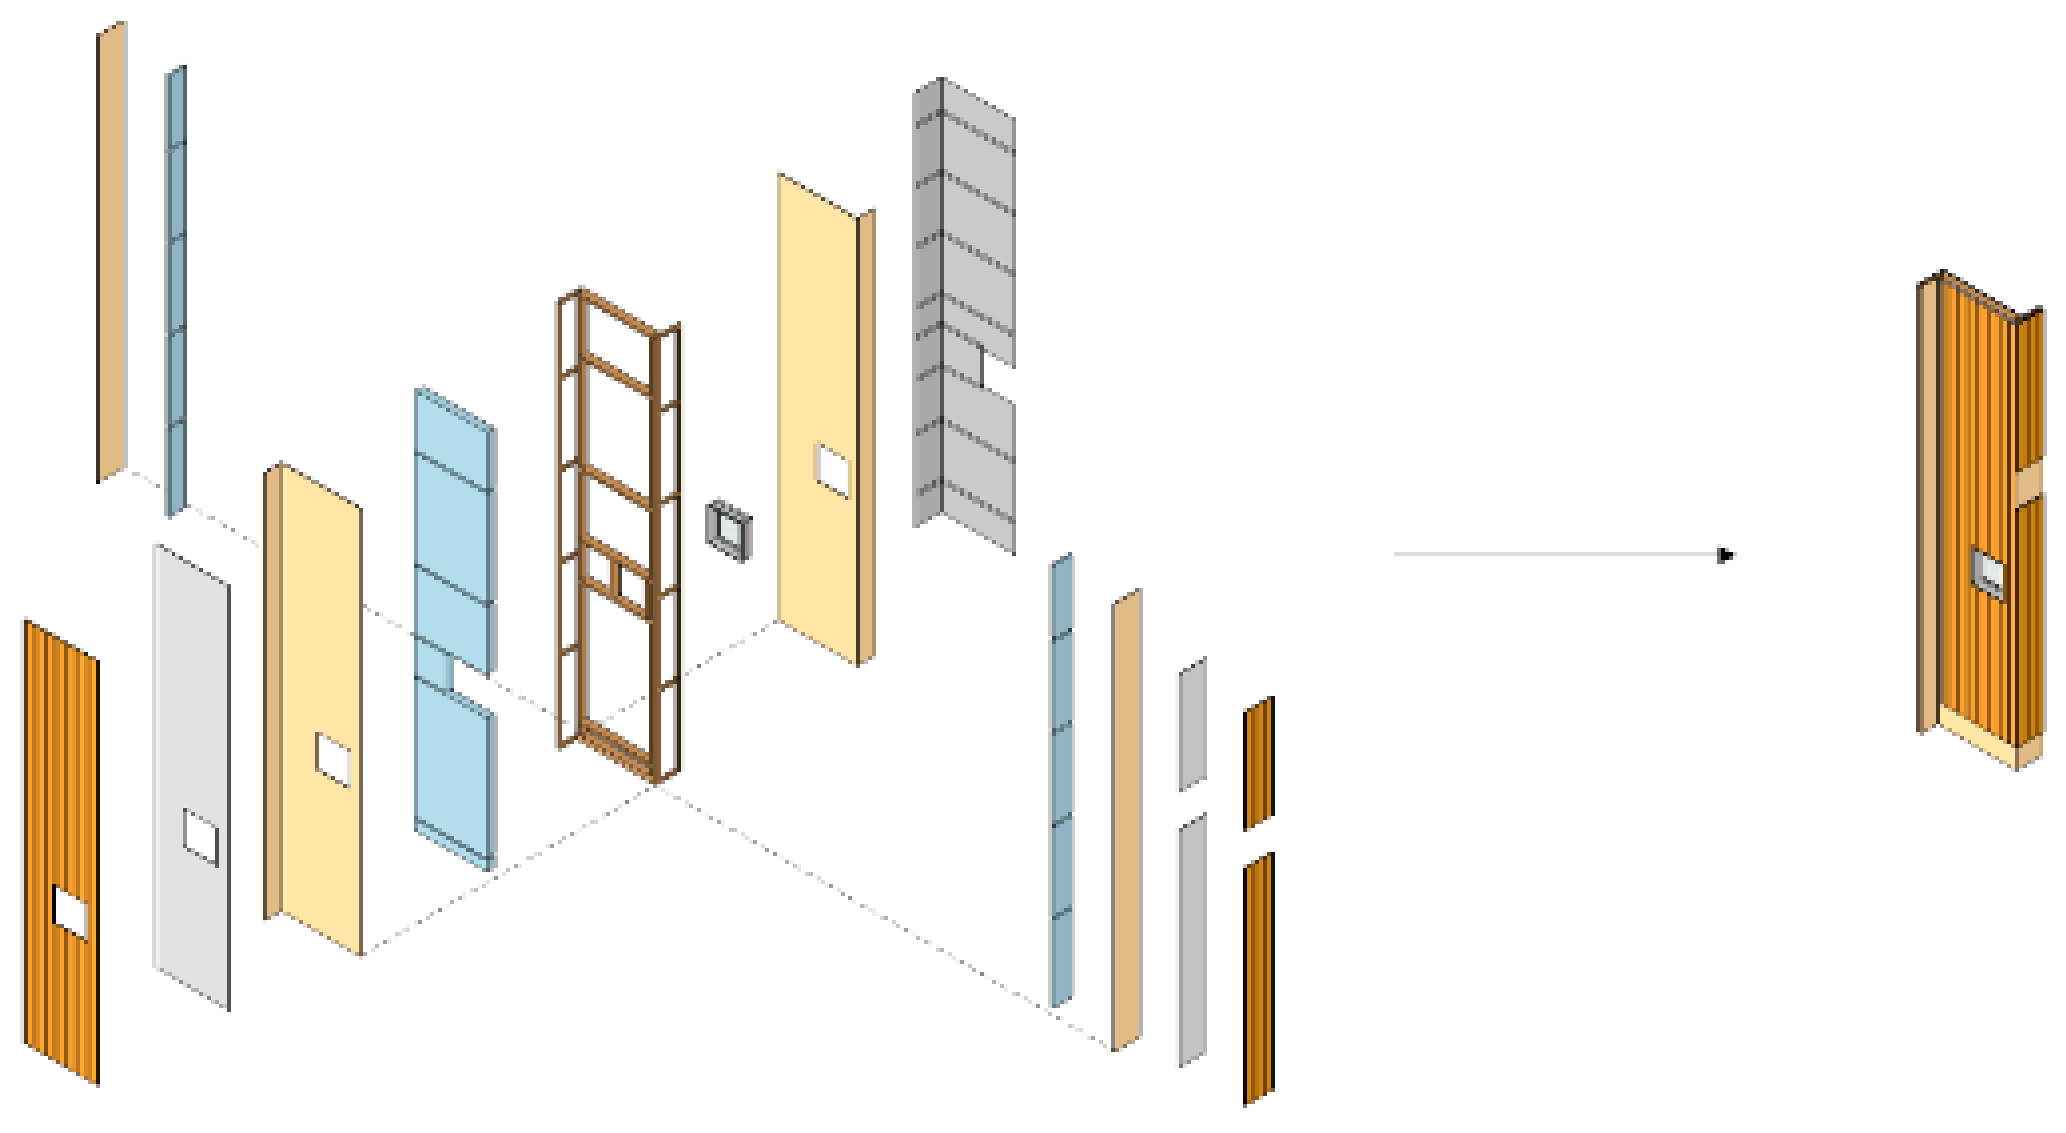
In the evaluation of the whole design, the highest scores are given to integrated design and the reduction in the number of parts and joints. This is attributed to the relatively low number of building components, with only 312 components. Similarly, the number of joints in the building is also small, with only 38 connecting elements. The integrated design approach is primarily achieved through the integral prefabrication of the Z-shaped panels (
Figure 11). Most design factors are integrated onto the Z-shaped panels and pre-processed in the factory. However, there is still room for improvement in terms of material variety and standardization in the building.
In the evaluation of parts design, the size, weight, geometry, and structure of the components receive high ratings. This is because the Z-shaped panel was optimized to maximize size and minimize weight, aligning it with the construction conditions. Additionally, the Z-shaped geometry of the component is relatively simple and structurally robust. However, standardization and replaceability of components are relatively poor.
Regarding connections design, the structural strength of the joints is evaluated as very good. However, the design of connecting elements is relatively complex and diverse, resulting in lower scores in this category. Furthermore, although the design allows for a certain tolerance space at the joints, it still presents installation challenges due to the small tolerances.
From the ADI score details, the whole design category accounts for 67% of the total score with a score of 0.36, making it the main factor contributing to improved assembly efficiency. However, the standard designs of the whole, parts, and connections receive zero points, indicating that the lack of standardization is the biggest hindrance to assembly. Therefore, it is important to further analyze the positive factor of integrated design and the negative factor of non-standardization.
Integrated design refers to the consideration of multiple factors simultaneously during the design process and the integration of these factors into a cohesive whole [
42]. Through integrated design, the New Lawuga School was able to reduce the number of components and joints, resulting in an improved overall ADI score. The Z-shaped panels used in the building were initially designed based on considerations of space and structure, resulting in structurally stable classroom spaces. Additionally, the Z-shaped panel design also took into account transportation and assembly aspects. The stacked Z-shaped panels could be efficiently transported to the site and quickly assembled in a stable manner. Furthermore, the Z-shaped panels integrated various protective layers such as thermal insulation, fire protection, and waterproofing, as well as internal and external surface decorations. This integration allowed the Z-shaped panel to serve as both an integrated internal and external form. Through integrated design, more than 80 parts were combined to form the Z-shaped panels, significantly reducing the number of components that needed to be assembled on-site (
Figure 12).
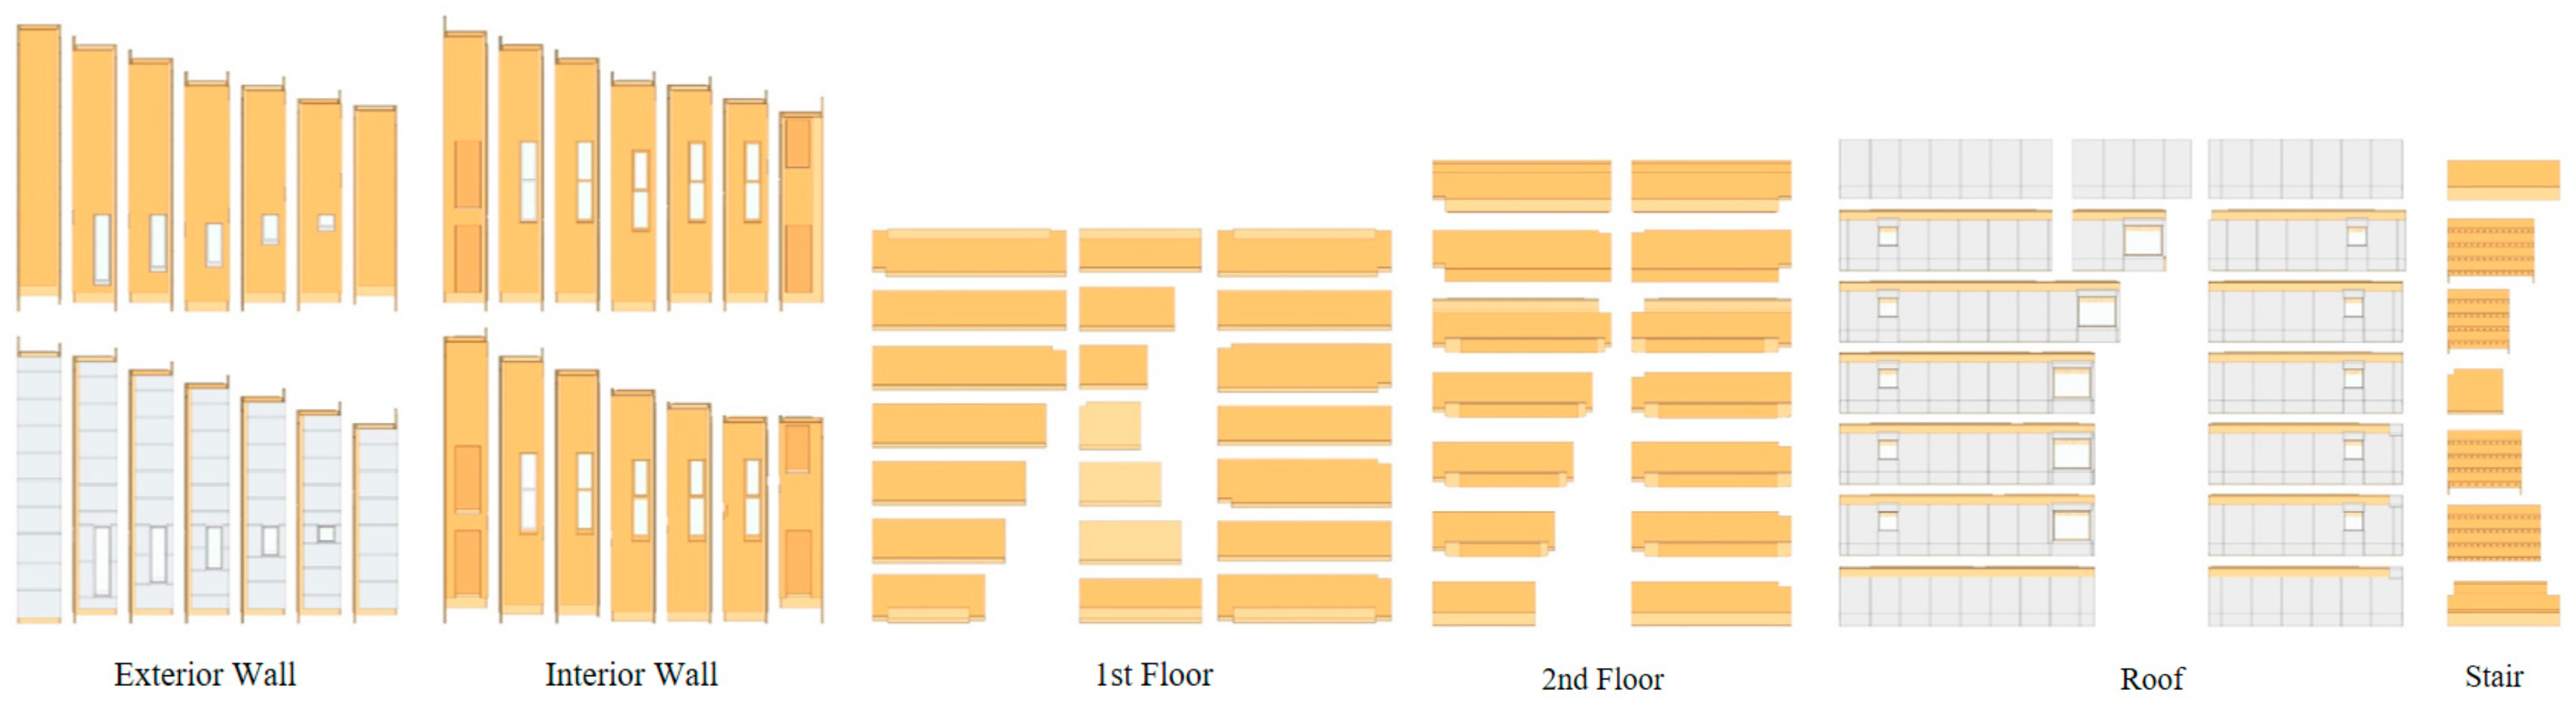
The non-standardized design became a significant problem that hindered the assembly process of the New Lawuga School. The lack of standardization was evident not only in the overall design of the classrooms but also in the constituent components, including joints, doors, and windows. Among the 86 main components of the building, only three pairs were identical, while all others were different (
Figure 13). This lack of standardization had several negative impacts on the assembly process. Firstly, it resulted in a lengthy component prefabrication time of 26 weeks, significantly delaying the on-site work. Each unique component required individual fabrication, increasing the overall production time. Secondly, during the assembly of non-standardized components on-site, additional time was required to identify and handle the various parts. Overall, the lack of uniformity made it more challenging to locate specific components and determine their correct placement.
6. Discussion
The DFA method, initially developed in the 1970s for product design and evaluation, has been adapted for the construction field in this study to address the lack of applicable DFA evaluation methods for buildings. The DFA evaluation method established in this study consists of two parts: assembly efficiency evaluation (AEI) and assembly design evaluation (ADI), both aimed at improving assembly efficiency.
For AEI, the study selected the ratio of output to input as the measure of assembly efficiency. Building volume was chosen as the output value, while the number of parts was selected as the input value. The AEI is calculated as the ratio of building volume to the number of parts, indicating that a higher assembly efficiency is achieved when a building can be constructed with fewer parts for a given volume.
The ADI of the DFA method in this study focused on 14 design principles that influence assembly. These principles were categorized into whole design, parts design, and connections design. Through consultation with experts and the application of the AHP method, each criterion was assigned an evaluation weight. An evaluation table was created, allowing the design to be scored (0–0.5–1) based on the criteria.
The application of the established DFA method to the New Lawuga School in the Qinghai Plateau validated the feasibility and validity of the evaluation method and identified factors influencing assembly. The school achieved a relatively high efficiency level (AEI) in terms of assembly. The assessment of the assembly design (ADI) revealed that integrated design, particularly through the use of the Z-shaped panel, played a crucial role in speeding up the assembly process by reducing the number of parts and joints. However, the highly integrated design also led to the non-standardization problem, which hindered the assembly process.
Despite the successful application of the DFA method to the selected case, there are limitations to be addressed. One limitation is the lack of validation across a broader range of applications. Due to resource constraints, the method was only tested on a small scale. Future studies should collect and test more cases to validate its effectiveness on a larger scale. Additionally, the development of DFA evaluation software tailored for the construction industry would enhance its applicability. The DFA method is expected to evolve from a basic tool to a comprehensive method, from a single technique to an integrated strategy, from manual calculation to digital computing, and from individual applications to universal adoption.
7. Conclusions
The research focuses on the development of a Design for Assembly (DFA) evaluation method, with a particular emphasis on its applicability to prefabricated buildings. The DFA method, incorporating lean and prefabricated construction concepts, is gaining prominence as a novel approach to industrializing the construction industry. Several countries have introduced guidance documents to improve assembly efficiency and quality through DFA methods, yet there remains significant room for improvement in the assembly efficiency of prefabricated buildings.
The DFA evaluation method introduced in this study consists of two key components: the Assembly Efficiency Index (AEI) and the Assembly Design Index (ADI). The AEI is utilized to assess the efficiency level of a construction system and identify space for enhancement, while the ADI identifies factors affecting assembly, allowing for process improvement.
To illustrate the application of this method, the New Lawuga School in Yushu, China, was analyzed, revealing an AEI of 2.44 m3/pc. and an ADI value of 0.54. The assessment of the New Lawuga School highlights the achievement of efficient assembly through integrated design and parts reduction. However, non-standardized design posed a challenge to the assembly process.
The primary contribution of this research is the development of a tailored DFA evaluation method for prefabricated buildings, addressing a significant need in the construction industry. This method offers a valuable framework for assessing and enhancing assembly efficiency, with the potential to drive further advancements in the construction sector.
The DFA method tailored for prefabricated buildings presents a significant opportunity to integrate it with BIM in the future, marking a promising advancement in the construction industry. The integration of DFA and BIM can enable a seamless flow of information, from the early design stages through to assembly and beyond. By harmonizing these methodologies, construction projects can benefit from improved collaboration, enhanced decision-making, and increased efficiency.


