Modelling Framework for Reducing Energy Loads to Achieve Net-Zero Energy Building in Semi-Arid Climate: A Case Study
Abstract
:1. Introduction
2. Materials and Method
2.1. Case Study
2.2. Walk-Through Energy Audit and Data Collection
- The information on the current energy consuming points and sources
- The identification of point-to-point potential energy conservation measures with quick results
2.3. Retrofitting Data Analysis
2.3.1. Electrical Devices
2.3.2. Building Envelope
2.4. Environmental Impact Analysis
2.5. Economic Analysis
3. Results and Discussion
3.1. Comparison of Existing and Recommended Appliances
3.2. Effect of Retrofitting Measures on Cooling Load
3.3. Integrating Renewable Energy
3.4. Net-Zero Energy Potential
3.5. Environmental Analysis
3.6. Economic Analysis
3.7. Comparison of the Case Study
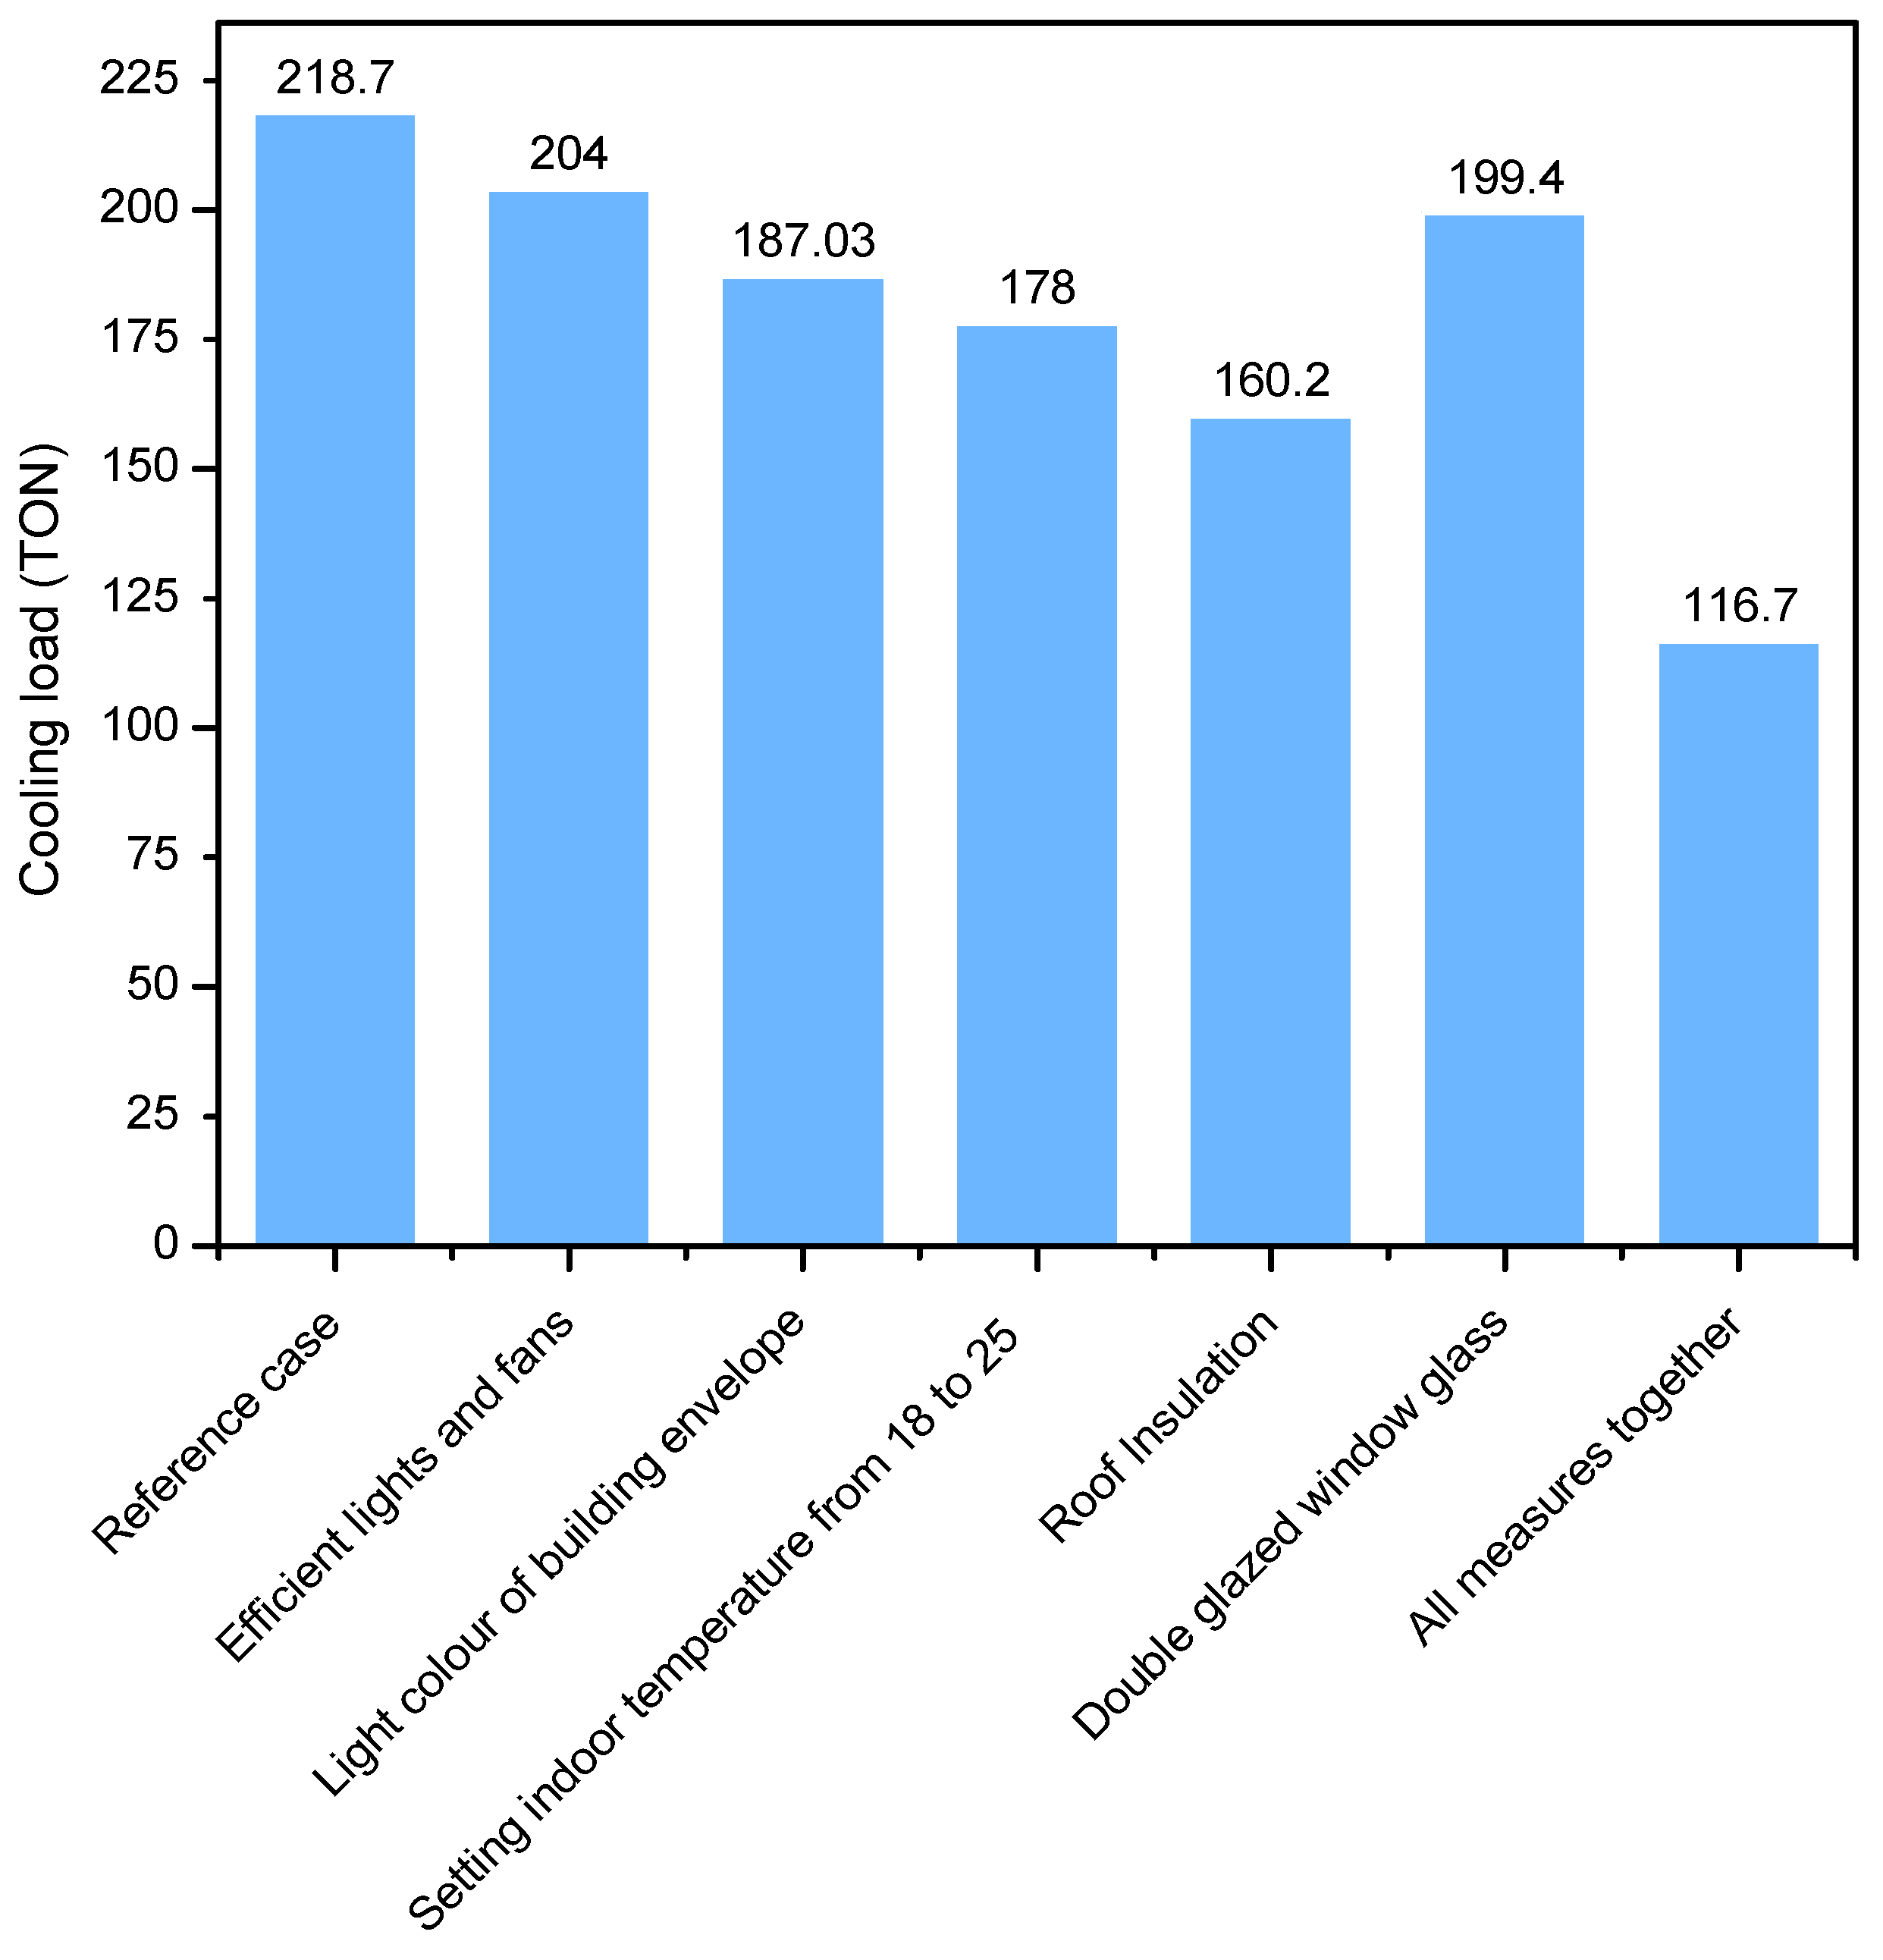
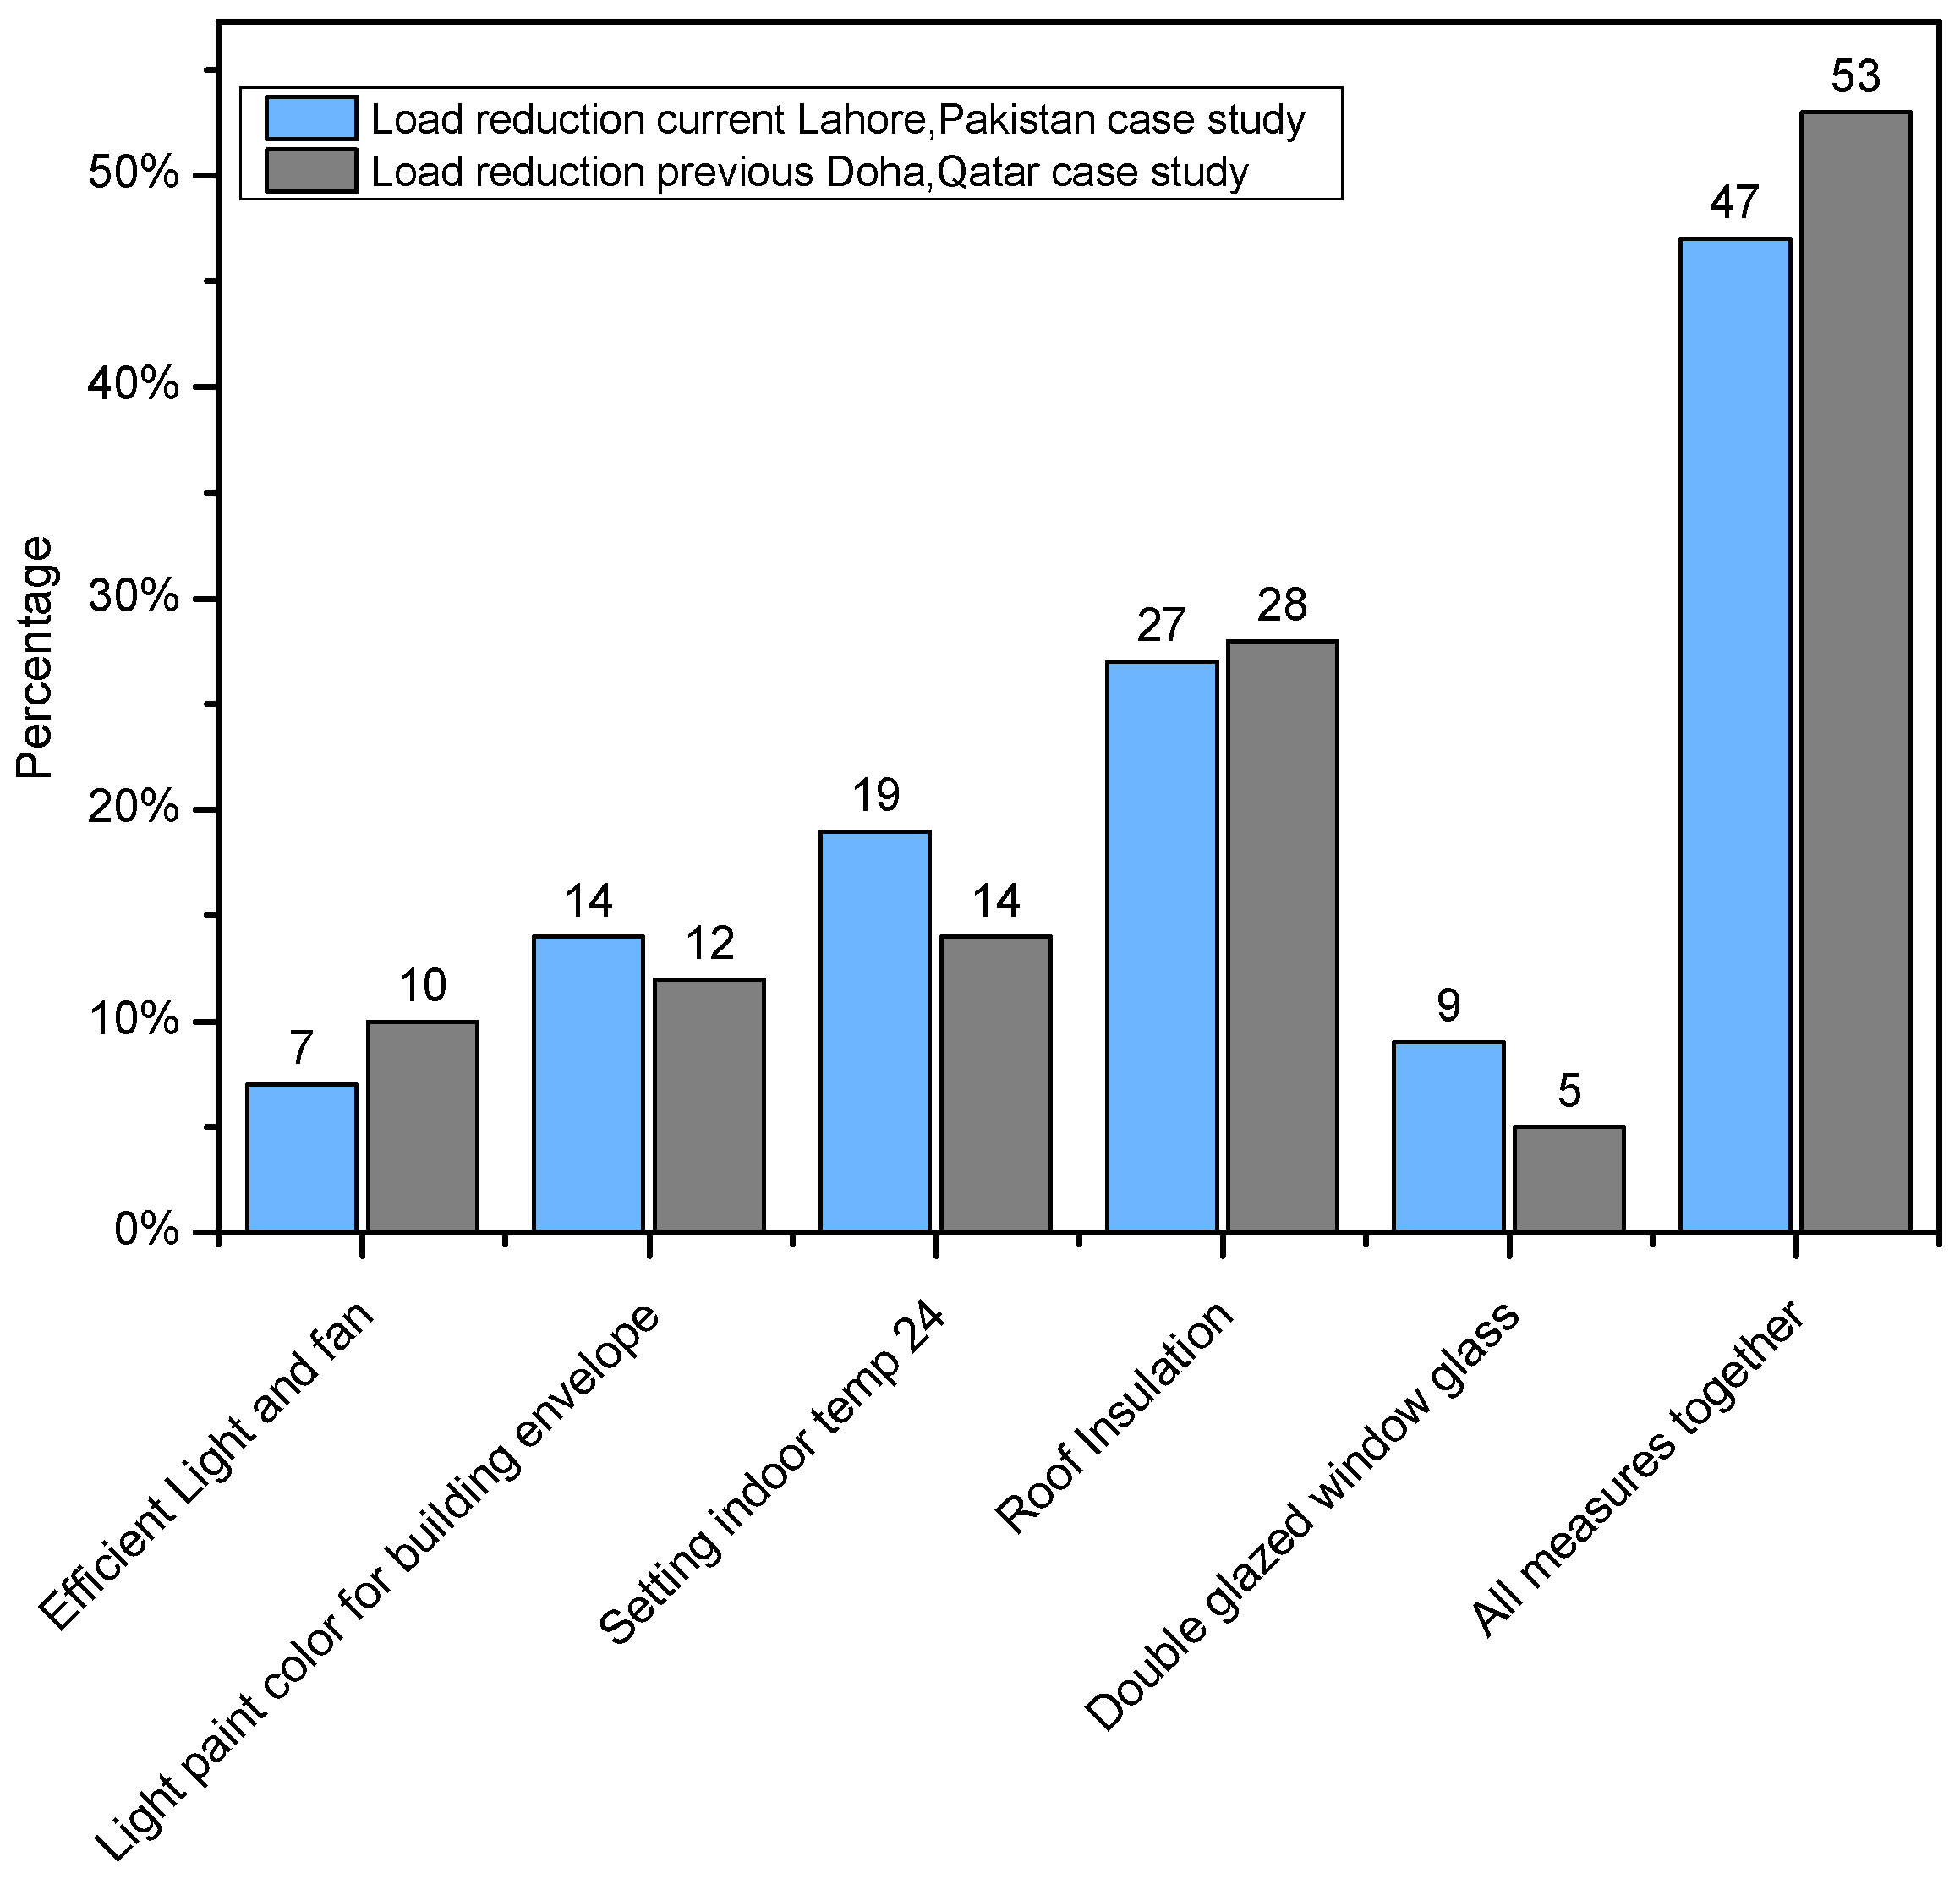
- The reduction in the cooling load by replacing lights and fans with efficient ones for Lahore Pakistan was 6.73%, while for Doha, Qatar it was 10%.
- By changing the outside color from dark to light, 14.50% cooling load reduction was achieved in the current study whereas it was 12% for the previous study.
- By increasing the set temperature from 18 to 24 °C, the cooling load was decreased by up to 18.61% for Lahore, Pakistan while it was 14% for Doha, Qatar.
- Adding a 2 cm layer of polyurethane on the roof caused a 26% decline in the cooling load for Pakistan while 28% for Qatar.
- Replacing a single-glazed window with double-glazed window, reduced thecooling load up to 8.83% for current study while it was 4.5% for the previous study.
- By implementing all retrofitting measures together, the cooling load for Lahore, Pakistan was found to exhibit a drop of 46.64% with a payback period of 2.5 years while for Doha, Qatar it was 53%, as represented in Figure 7.
- The payback period for all these measures in Lahore, Pakistan was about 2.5 years while for Doha Qatar it was about 1.5 years.
3.8. Practical Implication of This Study
4. Conclusions
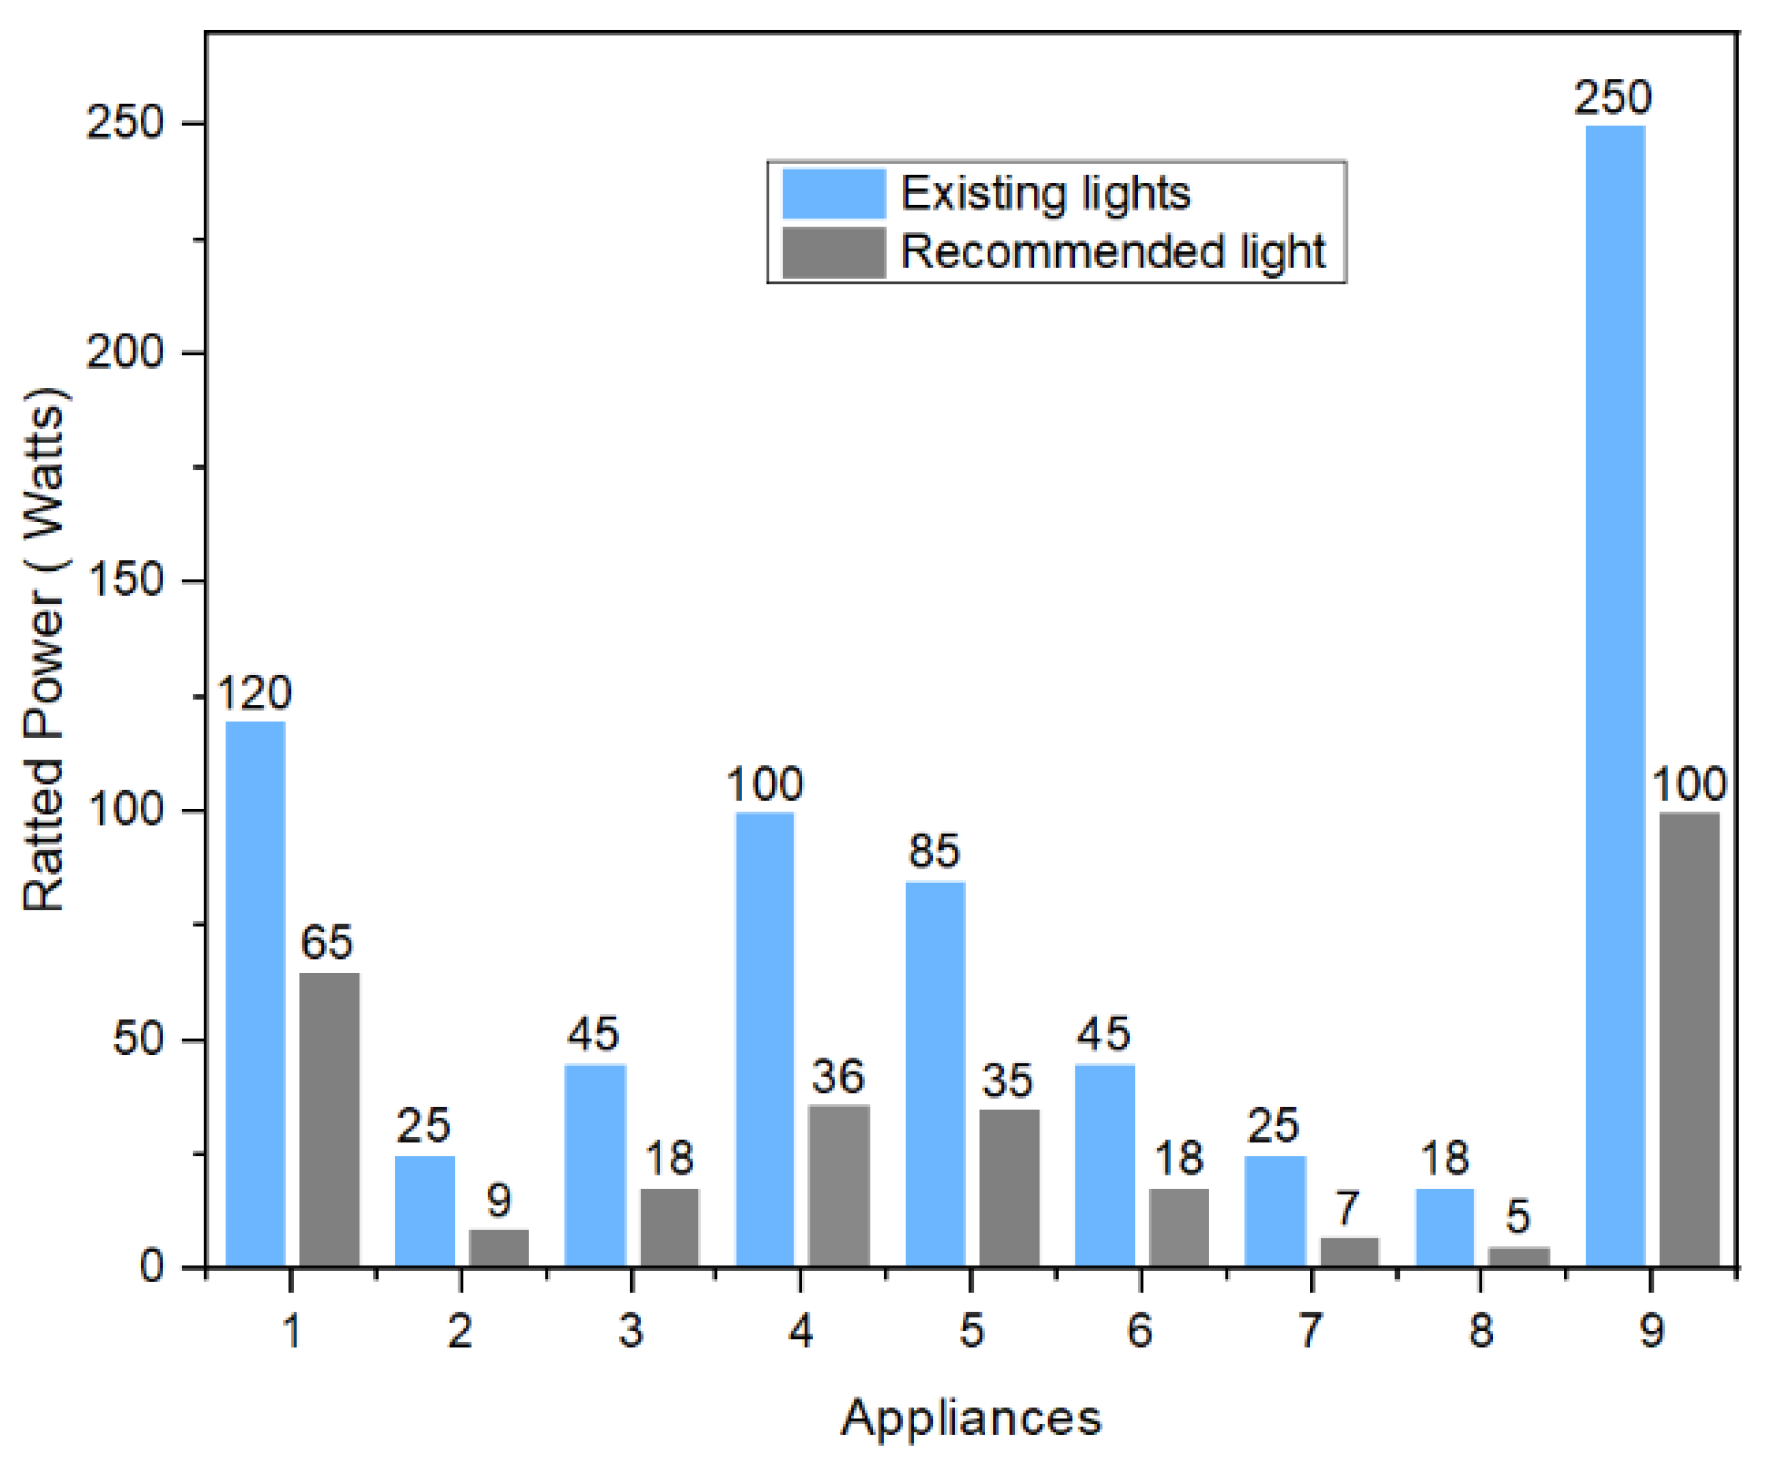
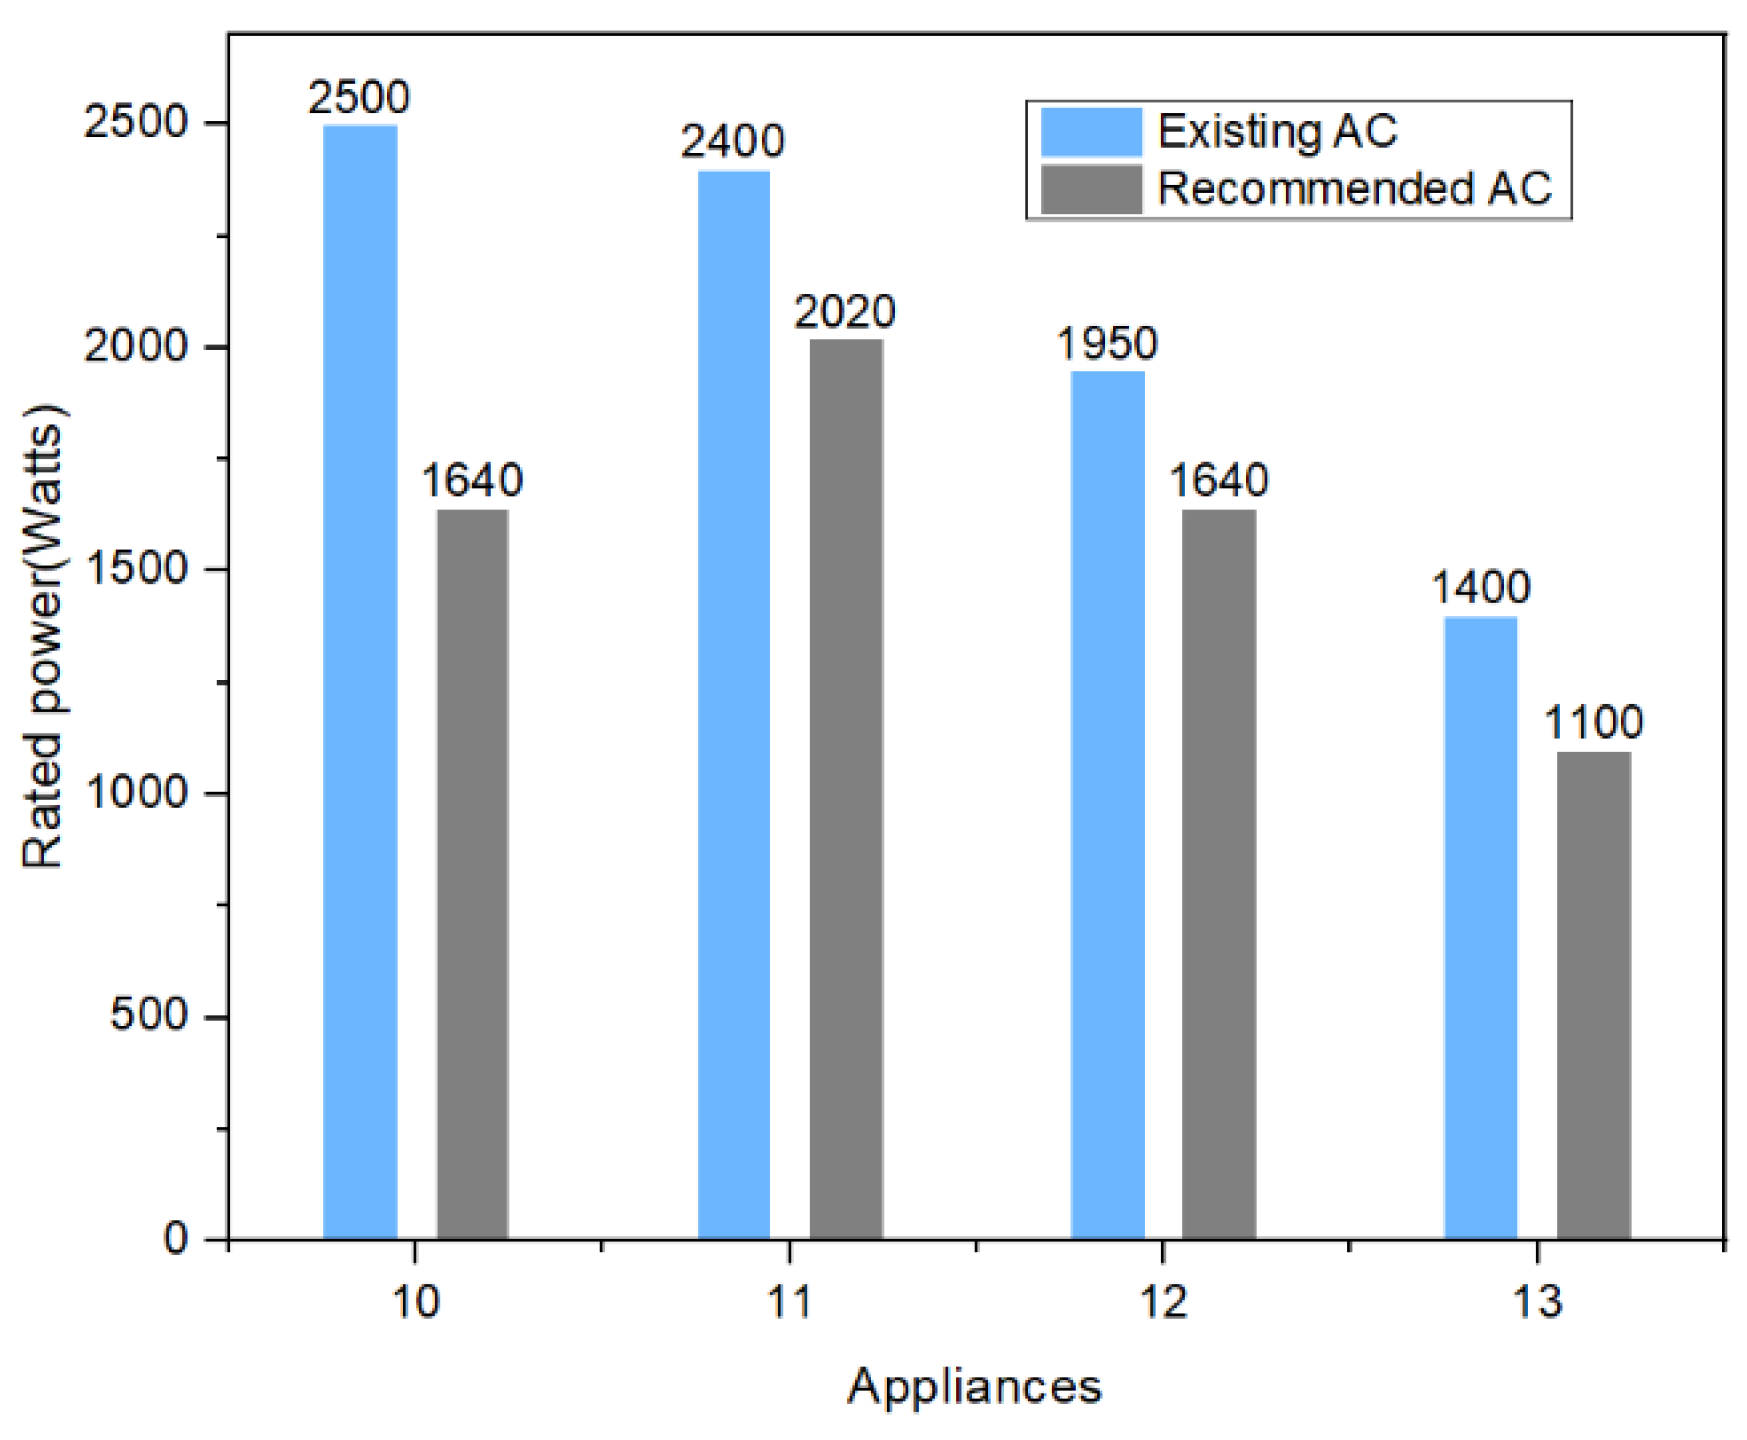
- Electricity consumption was reduced by up to 45% by replacing existing electrical appliances with energy efficient appliances. Carbon emission declined by up to 46.6%. The required capital for this change was calculated as 1.04 M PKR with a payback period of 2.30 years.
- The improving building envelope for energy efficiency led to 46.6% reduction in cooling load and carbon dioxide emission, with a capital investment of PKR 4.28 M with a 2.5 year payback period.
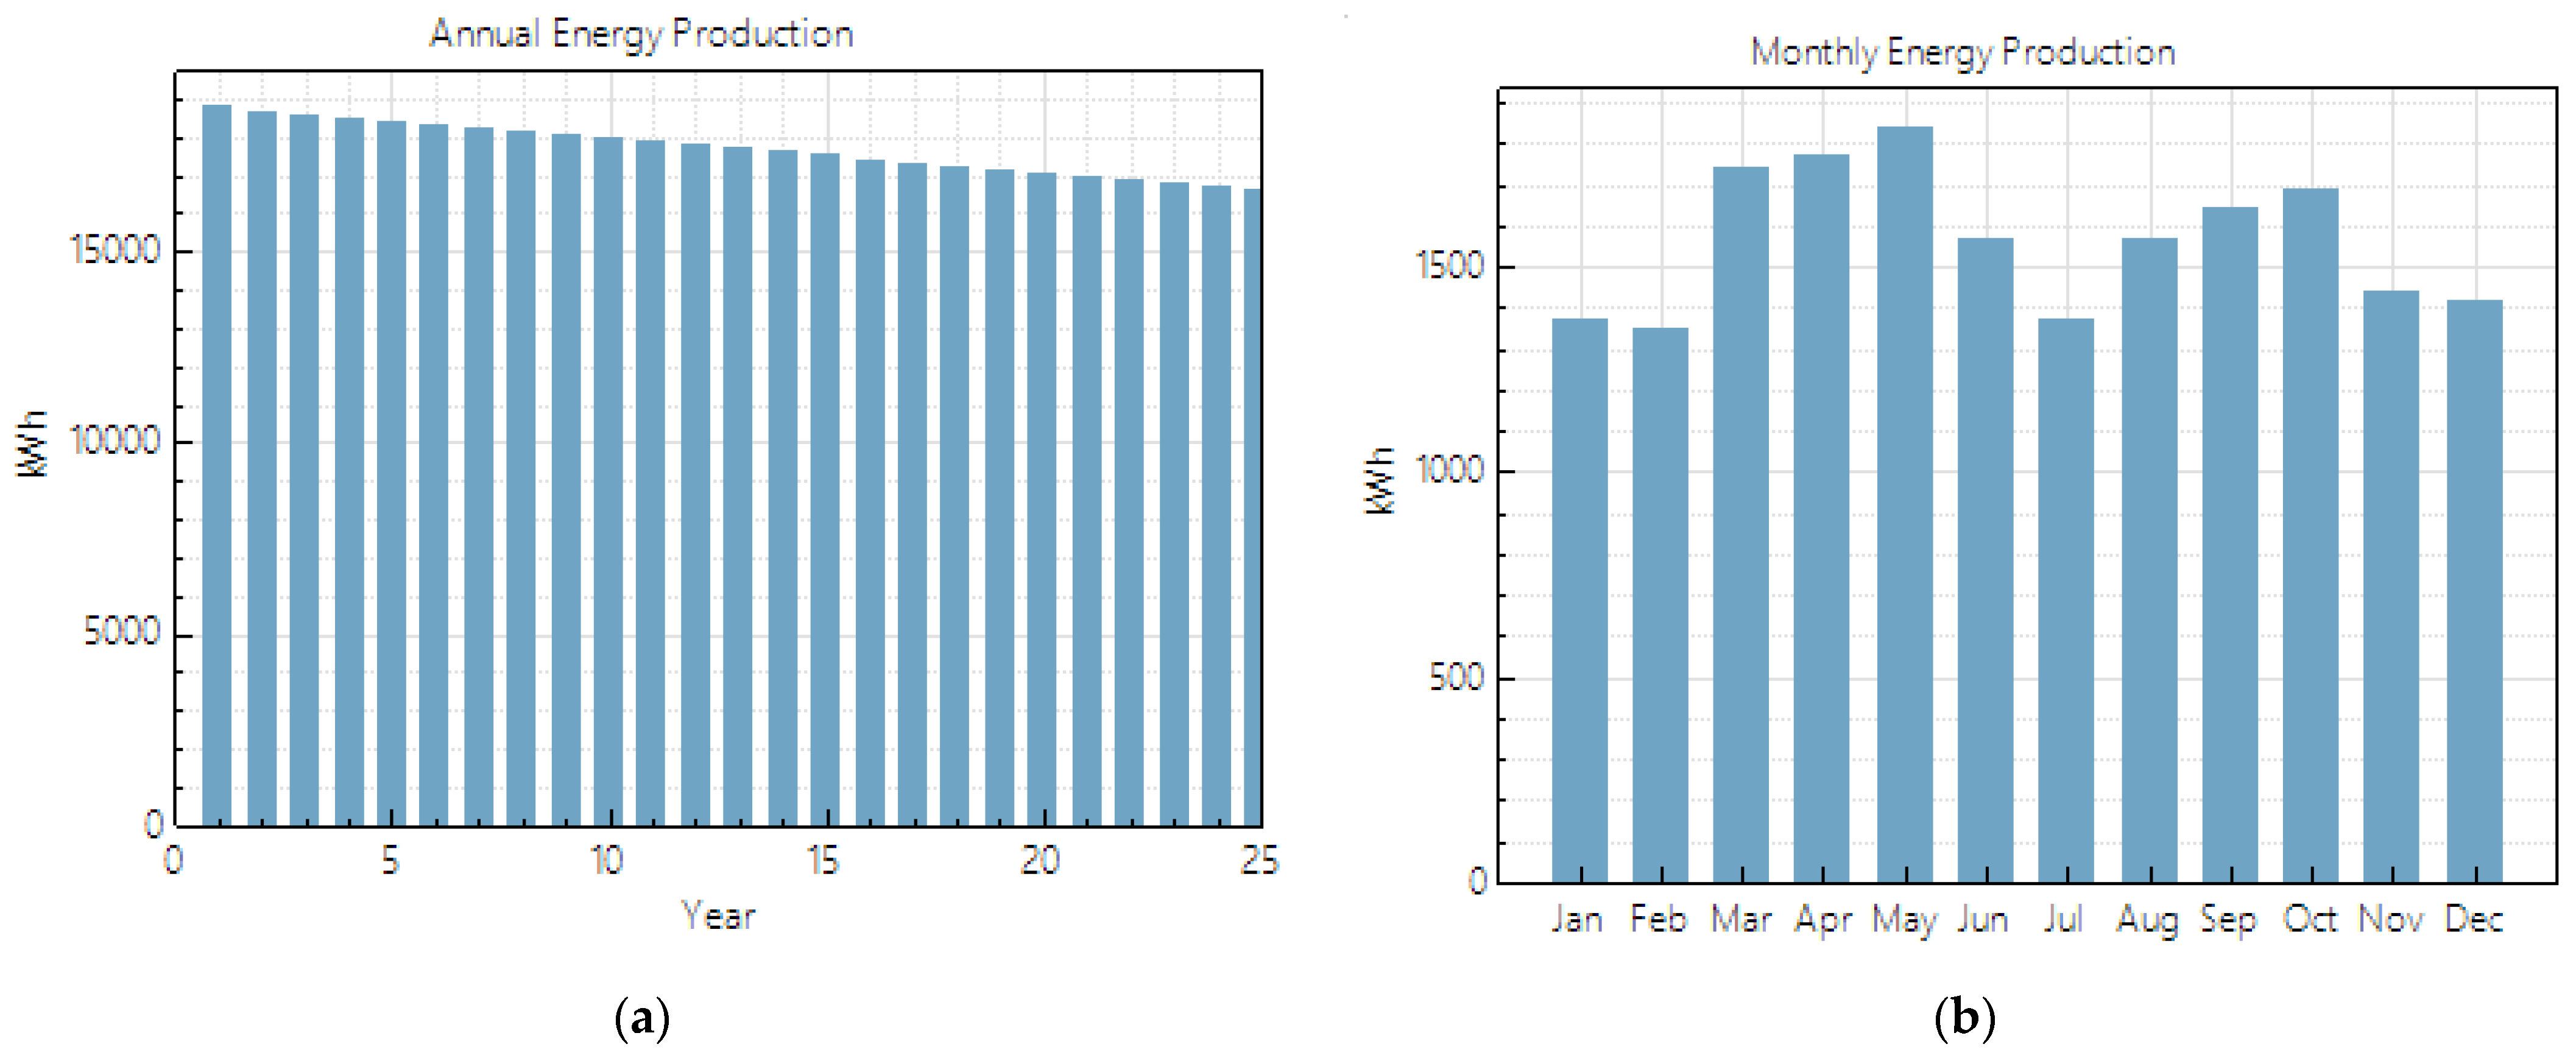
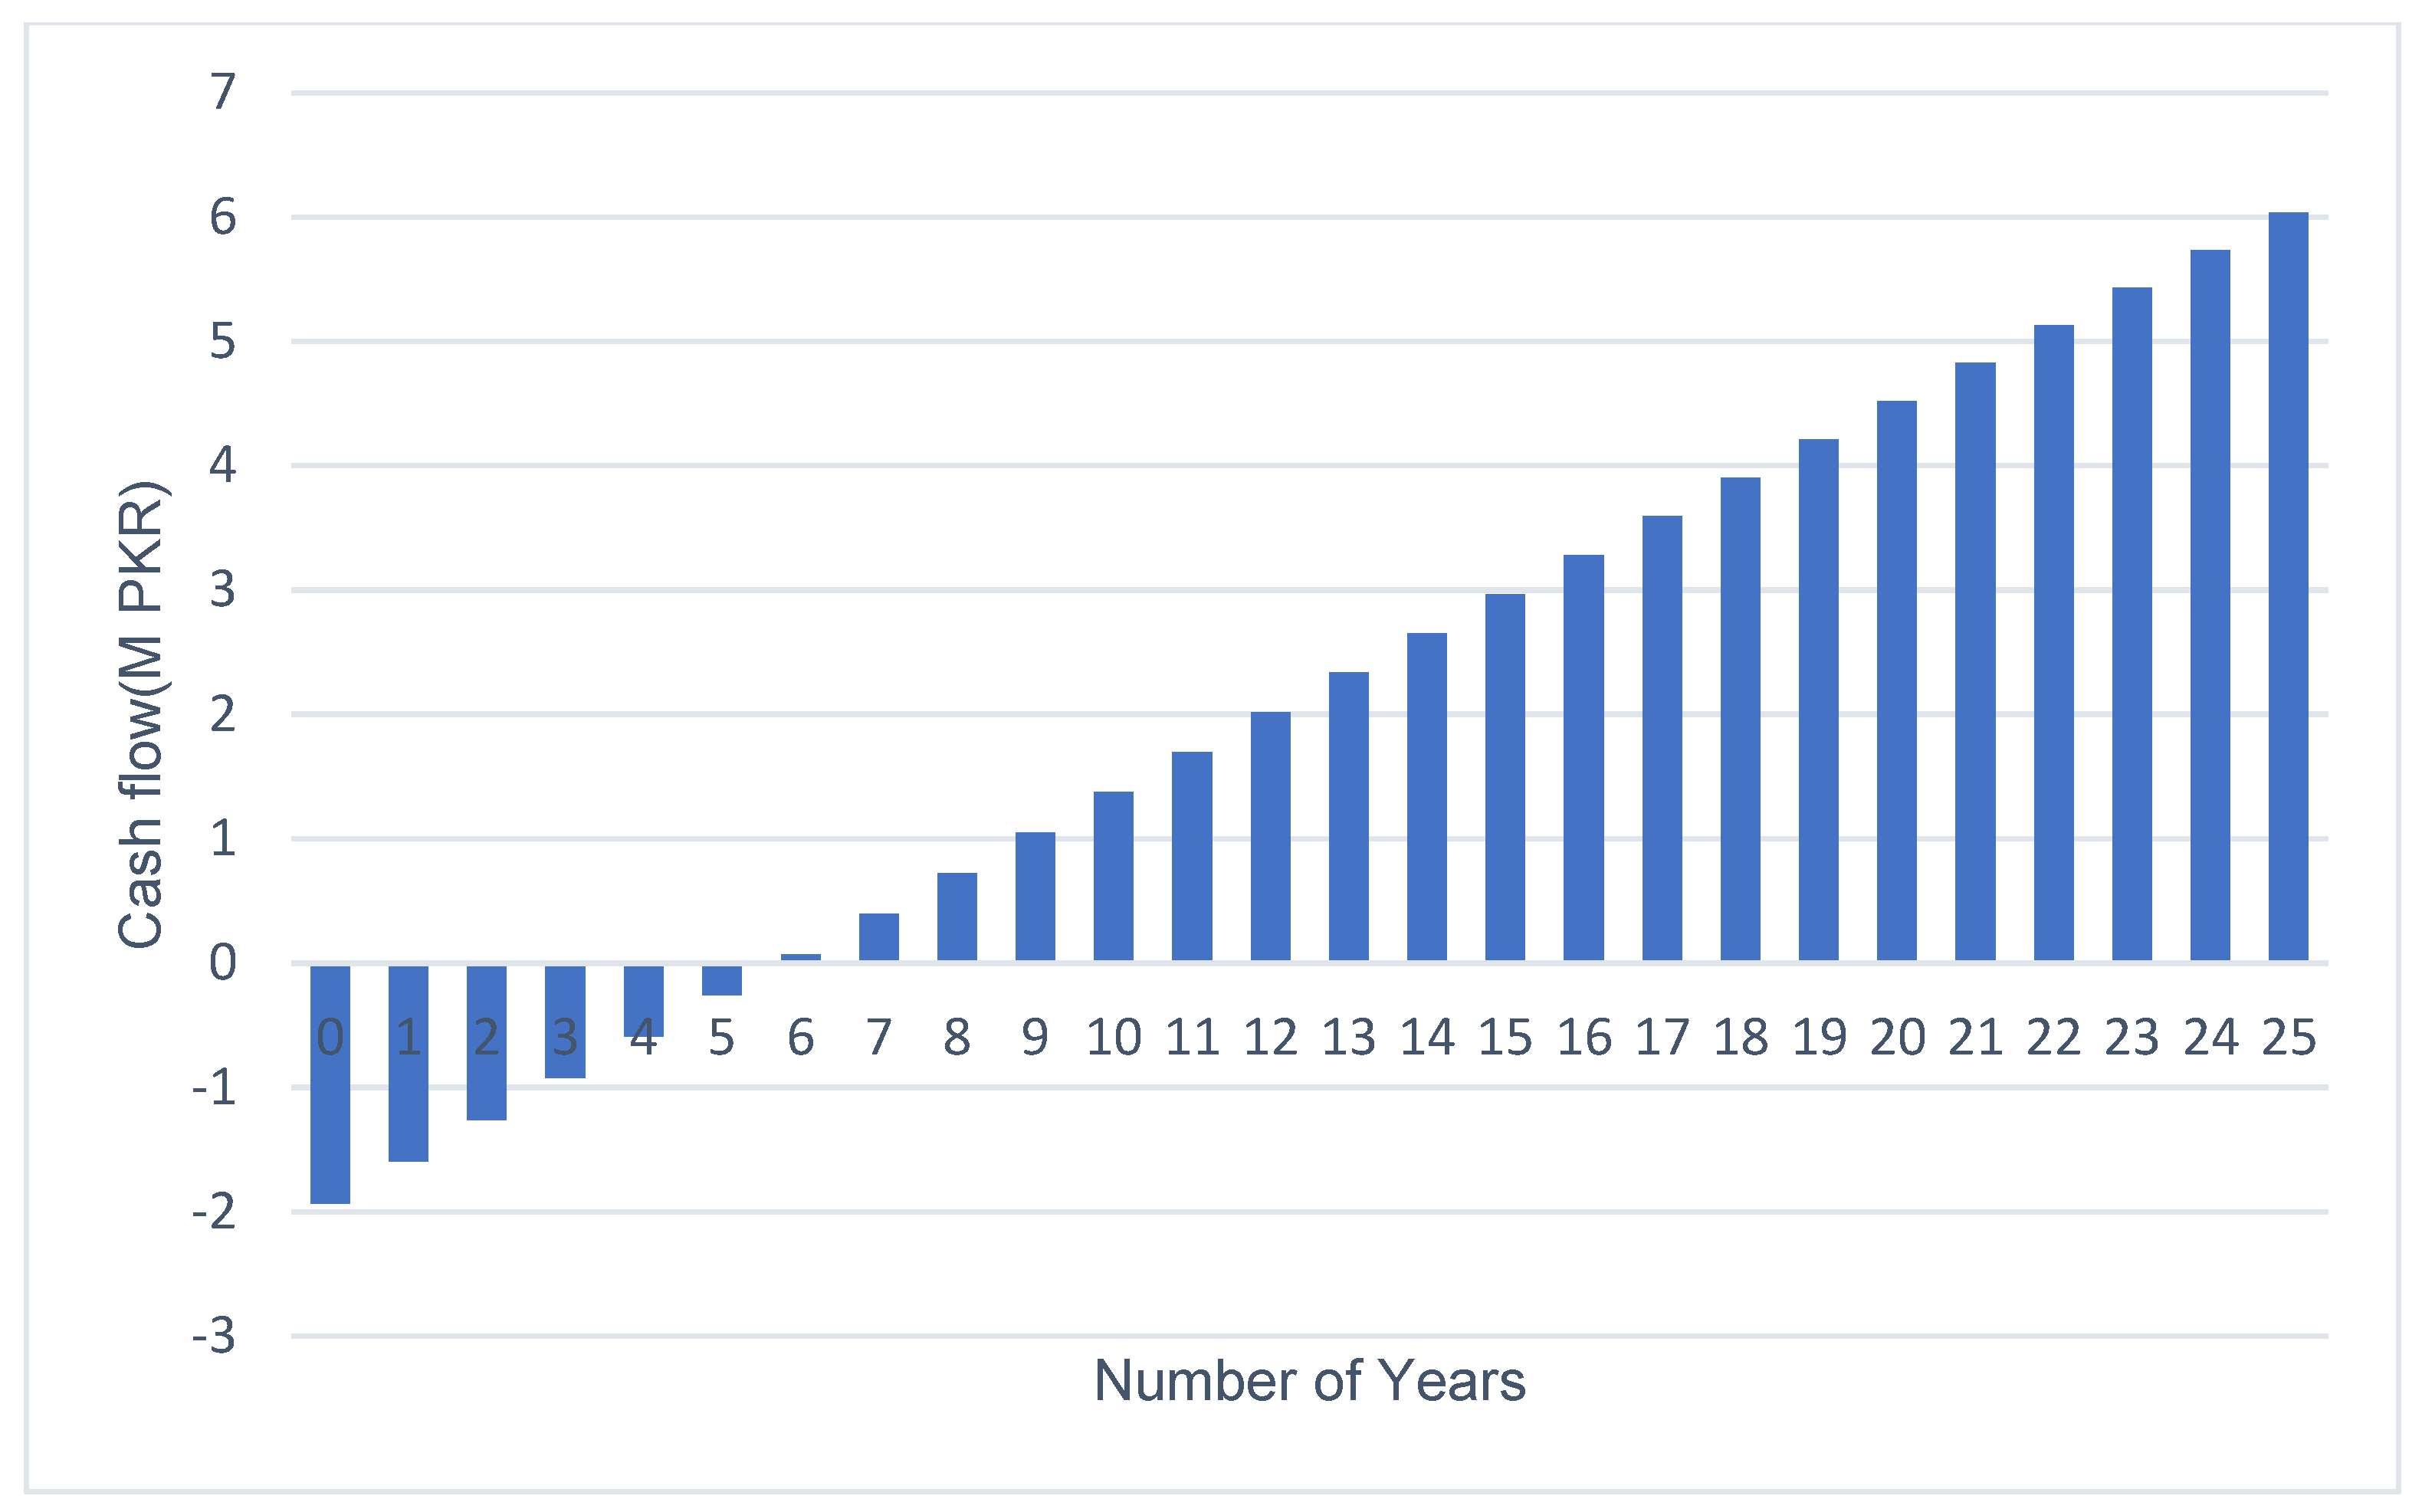
- The addition of a solar energy source for achieving the net-zero level required a cost of PKR 1.9 M, with a required time of recovery of 5.78 years.
- In addition to the above stated reduction in carbon emissions, this intervention would reduce 13.2 metric tons additional carbon dioxide emission annually, a significant amount for a single building.
- Retrofitting of an existing structure has potential for energy conservation of more than 40 percent. No matter how small it is, a simple energy retrofit measure contributes greatly towards a green world and therefore must be implemented and used.
- Energy conservation starts from the design phase. All process designs must undergo a strong energy efficiency audit and the suggested measures must be implemented for the improved design.
- Building envelopes have a strong ability to determine the energy consumption pattern of a building. Therefore, it must be a hot topic of debate for building information models and designs. As some modern practices depict, the use of solar plates for creating a building envelope can be adopted to obtain improved results.
Limitations
- It is important to mention that the reported reduction of electricity consumption after retrofitting shows the value from a software model and the actual intervention on the structure may vary due to multiple factors related to installation and fixation in addition to the lack of control over exposure conditions.
- The impact of the building type based on the nature of occupancy, i.e., residential, commercial, or institutional, of the building is beyond the scope of the current study.
- The payback period in comparison to the invested capital corresponds to the average prevailing market rates at the time of research and may vary in the current scenario
5. Recommendations
Author Contributions
Funding
Data Availability Statement
Acknowledgments
Conflicts of Interest
References
- Bhatla, R.; Verma, S.; Ghosh, S.; Gupta, A. Abrupt changes in mean temperature over India during 1901–2010. J. Earth Syst. Sci. 2020, 129, 166. [Google Scholar] [CrossRef]
- Liu, Z.; Li, H.; Hou, K.; Xu, X.; Jia, H.; Zhu, L.; Mu, Y. Risk assessment and alleviation of regional integrated energy system considering cross-system failures. Appl. Energy 2023, 350, 121714. [Google Scholar] [CrossRef]
- Clarke, L.; Eom, J.; Marten, E.H.; Horowitz, R.; Kyle, P.; Link, R.; Mignone, B.K.; Mundra, A.; Zhou, Y. Effects of long-term climate change on global building energy expenditures. Energy Econ. 2018, 72, 667–677. [Google Scholar] [CrossRef]
- Liu, Z.; Tang, P.; Hou, K.; Zhu, L.; Zhao, J.; Jia, H.; Pei, W. A Lagrange-multiplier-based Reliability Assessment for Power Systems Considering Topology and Injection Uncertainties. IEEE Trans. Power Syst. 2023. early access. [Google Scholar] [CrossRef]
- Mastouri, H.; Bahi, H.; Radoine, H.; Benhamou, B. Improving energy efficiency in buildings: Review and compiling. Mater. Today Proc. 2020, 27, 2999–3003. [Google Scholar] [CrossRef]
- Riaz, F.; Tan, K.H.; Farooq, M.; Imran, M.; Lee, P.S. Energy Analysis of a Novel Ejector-Compressor Cooling Cycle Driven by Electricity and Heat (Waste Heat or Solar Energy). Sustainability 2020, 12, 8178. [Google Scholar] [CrossRef]
- Li, X.; Wang, F.; Al-Razgan, M.; Awwad, E.M.; Abduvaxitovna, S.Z.; Li, Z.; Li, J. Race to environmental sustainability: Can structural change, economic expansion and natural resource consumption effect environmental sustainability? A novel dynamic ARDL simulations approach. Resour. Policy 2023, 86, 104044. [Google Scholar] [CrossRef]
- Irfan, M.; Abas, N.; Saleem, M.S. Thermal performance analysis of net zero energy home for sub zero temperature areas. Case Stud. Therm. Eng. 2018, 12, 789–796. [Google Scholar] [CrossRef]
- Xiao, Z.; Li, H.; Jiang, H.; Li, Y.; Alazab, M.; Zhu, Y.; Dustdar, S. Predicting Urban Region Heat via Learning Arrive-Stay-Leave Behaviors of Private Cars. IEEE Trans. Intell. Transp. Syst. 2023, 24, 10843–10856. [Google Scholar] [CrossRef]
- Jiang, H.; Xiao, Z.; Li, Z.; Xu, J.; Zeng, F.; Wang, D. An Energy-Efficient Framework for Internet of Things Underlaying Heterogeneous Small Cell Networks. IEEE Trans. Mob. Comput. 2022, 21, 31–43. [Google Scholar] [CrossRef]
- AlAjmi, A.; Abou-Ziyan, H.; Ghoneim, A. Achieving annual and monthly net-zero energy of existing building in hot climate. Appl. Energy 2016, 165, 511–521. [Google Scholar] [CrossRef]
- Imani, N.; Vale, B. A framework for finding inspiration in nature: Biomimetic energy efficient building design. Energy Build. 2020, 225, 110296. [Google Scholar] [CrossRef]
- Cai, T.; Dong, M.; Chen, K.; Gong, T. Methods of participating power spot market bidding and settlement for renewable energy systems. Energy Rep. 2022, 8, 7764–7772. [Google Scholar] [CrossRef]
- Jiang, J.; Zhang, L.; Wen, X.; Valipour, E.; Nojavan, S. Risk-based performance of power-to-gas storage technology integrated with energy hub system regarding downside risk constrained approach. Int. J. Hydrogen Energy 2022, 47, 39429–39442. [Google Scholar] [CrossRef]
- Ferrari, S.; Beccali, M. Energy-environmental and cost assessment of a set of strategies for retrofitting a public building toward nearly zero-energy building target. Sustain. Cities Soc. 2017, 32, 226–234. [Google Scholar] [CrossRef]
- Riaz, F.; Yam, F.Z.; Qyyum, M.A.; Shahzad, M.W.; Farooq, M.; Lee, P.S.; Lee, M. Direct Analytical Modeling for Optimal, On-Design Performance of Ejector for Simulating Heat-Driven Systems. Energies 2021, 14, 2819. [Google Scholar] [CrossRef]
- Charles, A.; Maref, W.; Ouellet-Plamondon, C.M. Case study of the upgrade of an existing office building for low energy consumption and low carbon emissions. Energy Build. 2019, 183, 151–160. [Google Scholar] [CrossRef]
- D’Agostino, D.; Mazzarella, L. What is a Nearly zero energy building? Overview, implementation and comparison of definitions. J. Build. Eng. 2019, 21, 200–212. [Google Scholar] [CrossRef]
- Wells, L.; Rismanchi, B.; Aye, L. A review of Net Zero Energy Buildings with reflections on the Australian context. Energy Build. 2018, 158, 616–628. [Google Scholar] [CrossRef]
- Yin, L.; Wang, L.; Huang, W.; Liu, S.; Yang, B.; Zheng, W. Spatiotemporal Analysis of Haze in Beijing Based on the Multi-Convolution Model. Atmosphere 2021, 12, 1408. [Google Scholar] [CrossRef]
- Yin, L.; Wang, L.; Zheng, W.; Ge, L.; Tian, J.; Liu, Y.; Yang, B.; Liu, S. Evaluation of Empirical Atmospheric Models Using Swarm-C Satellite Data. Atmosphere 2022, 13, 294. [Google Scholar] [CrossRef]
- Hussain, M.; Liu, G.; Yousaf, B.; Ahmed, R.; Uzma, F.; Ali, M.U.; Ullah, H.; Butt, A.R. Regional and sectoral assessment on climate-change in Pakistan: Social norms and indigenous perceptions on climate-change adaptation and mitigation in relation to global context. J. Clean. Prod. 2018, 200, 791–808. [Google Scholar] [CrossRef]
- Riaz, F.; Qyyum, M.A.; Bokhari, A.; Klemeš, J.J.; Usman, M.; Asim, M.; Awan, M.R.; Imran, M.; Lee, M. Design and Energy Analysis of a Solar Desiccant Evaporative Cooling System with Built-In Daily Energy Storage. Energies 2021, 14, 2429. [Google Scholar] [CrossRef]
- Yin, L.; Wang, L.; Huang, W.; Tian, J.; Liu, S.; Yang, B.; Zheng, W. Haze Grading Using the Convolutional Neural Networks. Atmosphere 2022, 13, 522. [Google Scholar] [CrossRef]
- Chen, J.; Liu, Z.; Yin, Z.; Liu, X.; Li, X.; Yin, L.; Zheng, W. Predict the effect of meteorological factors on haze using BP neural network. Urban Clim. 2023, 51, 101630. [Google Scholar] [CrossRef]
- Rafique, M.M.; Rehman, S. National energy scenario of Pakistan—Current status, future alternatives, and institutional infrastructure: An overview. Renew. Sustain. Energy Rev. 2017, 69, 156–167. [Google Scholar] [CrossRef]
- Adam, A.D.; Apaydin, G. Grid connected solar photovoltaic system as a tool for green house gas emission reduction in Turkey. Renew. Sustain. Energy Rev. 2016, 53, 1086–1091. [Google Scholar] [CrossRef]
- Vares, S.; Häkkinen, T.; Ketomäki, J.; Shemeikka, J.; Jung, N. Impact of renewable energy technologies on the embodied and operational GHG emissions of a nearly zero energy building. J. Build. Eng. 2019, 22, 439–450. [Google Scholar] [CrossRef]
- Zafar, U.; Rashid, T.U.; Khosa, A.A.; Khalil, M.S.; Rashid, M. An overview of implemented renewable energy policy of Pakistan. Renew. Sustain. Energy Rev. 2018, 82, 654–665. [Google Scholar] [CrossRef]
- Mirza, F.M.; Kanwal, A. Energy consumption, carbon emissions and economic growth in Pakistan: Dynamic causality analysis. Renew. Sustain. Energy Rev. 2017, 72, 1233–1240. [Google Scholar] [CrossRef]
- Feng, W.; Zhang, Q.; Ji, H.; Wang, R.; Zhou, N.; Ye, Q.; Hao, B.; Li, Y.; Luo, D.; Lau, S.S.Y. A review of net zero energy buildings in hot and humid climates: Experience learned from 34 case study buildings. Renew. Sustain. Energy Rev. 2019, 114, 109303. [Google Scholar] [CrossRef]
- Ban, Y.; Liu, X.; Yin, Z.; Li, X.; Yin, L.; Zheng, W. Effect of urbanization on aerosol optical depth over Beijing: Land use and surface temperature analysis. Urban Clim. 2023, 51, 101655. [Google Scholar] [CrossRef]
- Song, K.; Ahn, Y.; Ahn, J.; Kwon, N. Development of an Energy Saving Strategy Model for Retrofitting Existing Buildings: A Korean Case Study. Energies 2019, 12, 1626. [Google Scholar] [CrossRef]
- Ali, M.R.; Shafiq, M.; Andejany, M. Determinants of consumers’ intentions towards the purchase of energy efficient appliances in Pakistan: An extended model of the theory of planned behavior. Sustainability 2021, 13, 565. [Google Scholar] [CrossRef]
- Fan, Y.; Xia, X. A multi-objective optimization model for energy-efficiency building envelope retrofitting plan with rooftop PV system installation and maintenance. Appl. Energy 2017, 189, 327–335. [Google Scholar] [CrossRef]
- Saikia, P.; Pancholi, M.; Sood, D.; Rakshit, D. Dynamic optimization of multi-retrofit building envelope for enhanced energy performance with a case study in hot Indian climate. Energy 2020, 197, 117263. [Google Scholar] [CrossRef]
- Gugul, G.N.; Koksal, M.A.; Ugursal, V.I. Techno-economical analysis of building envelope and renewable energy technology retrofits to single family homes. Energy Sustain. Dev. 2018, 45, 159–170. [Google Scholar] [CrossRef]
- El-Darwish, I.; Gomaa, M. Retrofitting strategy for building envelopes to achieve energy efficiency. Alex. Eng. J. 2017, 56, 579–589. [Google Scholar] [CrossRef]
- Granadeiro, V.; Duarte, J.P.; Correia, J.R.; Leal, V.M. Building envelope shape design in early stages of the design process: Integrating architectural design systems and energy simulation. Autom. Constr. 2013, 32, 196–209. [Google Scholar] [CrossRef]
- Kharseh, M.; Al-Khawaja, M.; Hassani, F. Comparison between different measures to reduce cooling requirements of residential building in cooling-dominated environment. Energy Build. 2015, 88, 409–412. [Google Scholar] [CrossRef]
- Kharseh, M.; Al-Khawaja, M. Retrofitting measures for reducing buildings cooling requirements in cooling-dominated environment: Residential house. Appl. Therm. Eng. 2016, 98, 352–356. [Google Scholar] [CrossRef]
- Yadav, S.; Panda, S.; Tripathy, M. Performance of building integrated photovoltaic thermal system with PV module installed at optimum tilt angle and influenced by shadow. Renew. Energy 2018, 127, 11–23. [Google Scholar] [CrossRef]
- Paydar, M.A. Optimum design of building integrated PV module as a movable shading device. Sustain. Cities Soc. 2020, 62, 102368. [Google Scholar] [CrossRef]
- Das, B.K.; Al-Abdeli, Y.M. Optimisation of stand-alone hybrid CHP systems meeting electric and heating loads. Energy Convers. Manag. 2017, 153, 391–408. [Google Scholar] [CrossRef]
- Kim, M.-H.; Kim, D.; Heo, J.; Lee, D.-W. Techno-economic analysis of hybrid renewable energy system with solar district heating for net zero energy community. Energy 2019, 187, 115916. [Google Scholar] [CrossRef]
- Harkouss, F.; Fardoun, F.; Biwole, P.H. Optimal design of renewable energy solution sets for net zero energy buildings. Energy 2019, 179, 1155–1175. [Google Scholar] [CrossRef]
- Available online: https://www.pmd.gov.pk/en/ (accessed on 30 June 2019).
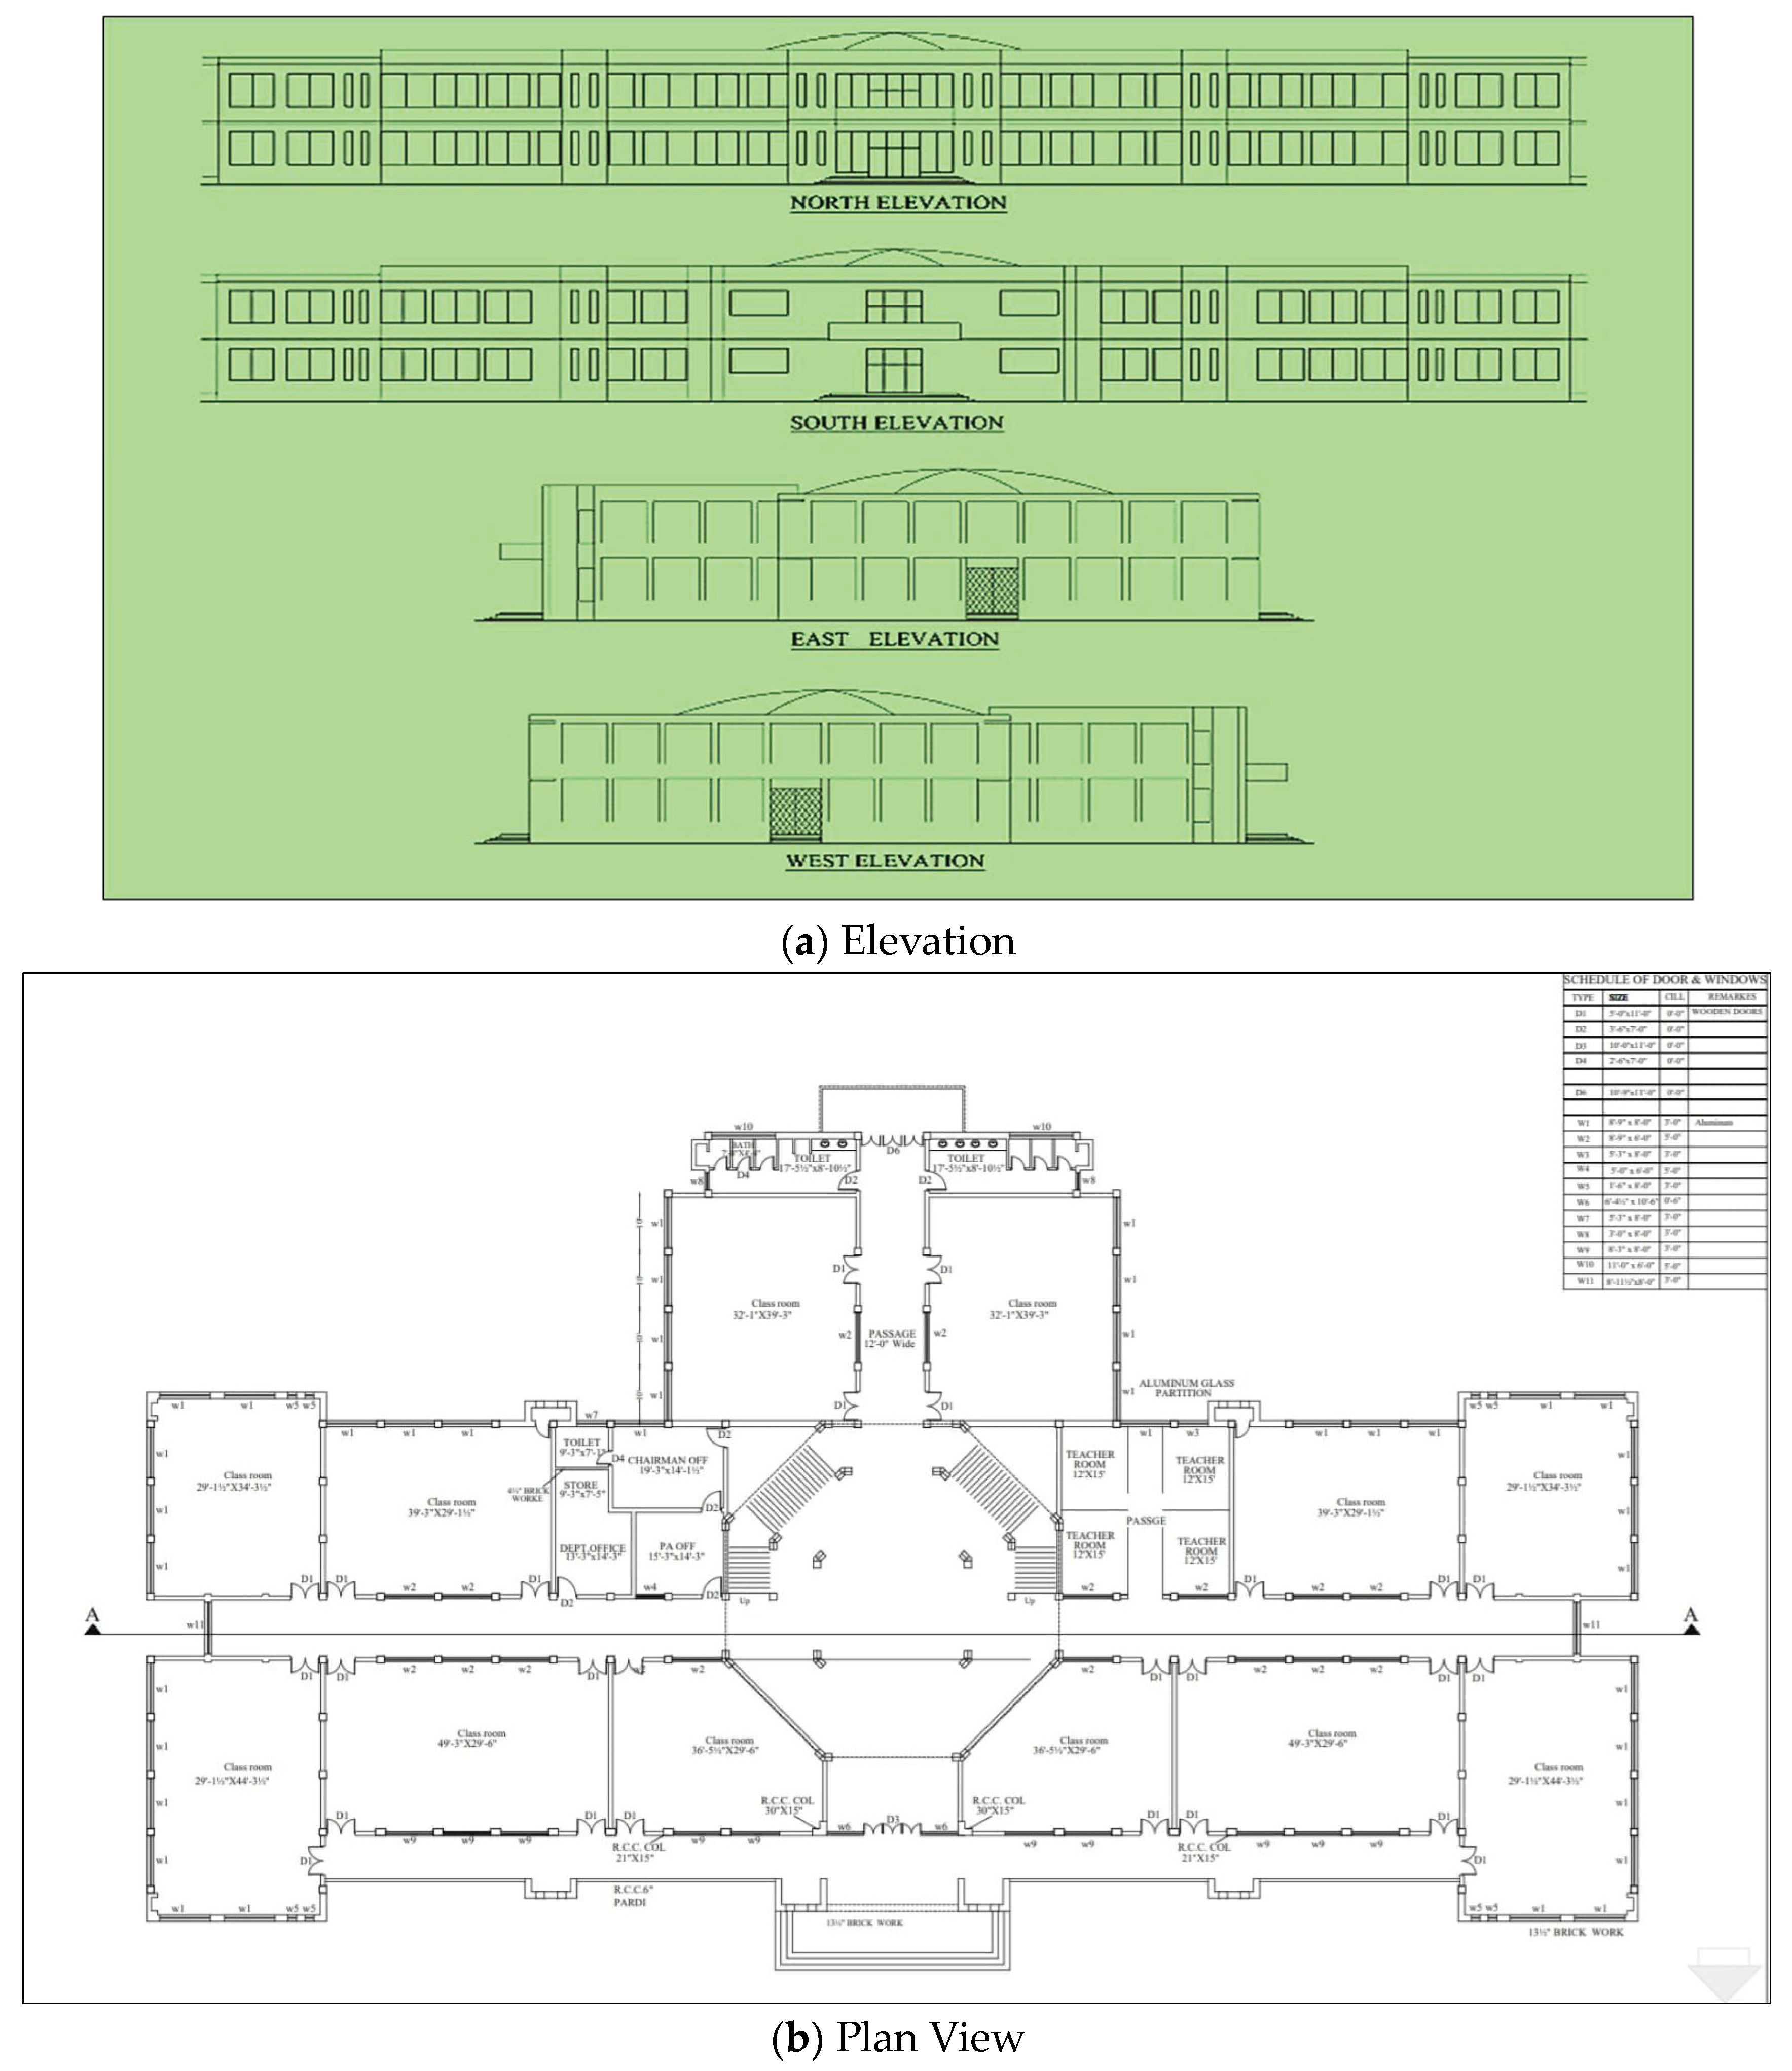
| Sr. No | Building Parameter | Values |
|---|---|---|
| 1 | Number of stories | 2 |
| 2 | Total Area | 2191 sq. meter |
| 3 | Ceiling height | 3.65 m |
| 4 | Orientation | South |
| 5 | Schedule | 8 a.m. to 5 p.m. |
| 6 | Occupancies | 200 |
| 7 | Unconditioned Space Max Temp | 40 °C |
| 8 | Unconditioned Space Min Temp | 12 °C |
| 9 | Ambient at space Max (Maximum outside) Temperature | 44 °C |
| 10 | Ambient at space Min (Minimum outside) Temperature 9 | 12 °C |
| 11 | Class Rooms/Labs occupancy | 12 per Class on Each Floor |
| 12 | Offices occupancy | 3 per Office on Each Floor |
| 13 | Construction Material | Double Brick Walls, Concrete Roof, Single Glazed Window, Wooden Doors |
| (a) | |||||
| Audit Equipment | Purpose | Model | Range | Unit | Working Temperature |
| Lux meter | Intensity of light on surface | UT-381 | 20 Lux–20,000 Lux | Lux | 0 to 40 °C |
| Anemometer | Wind speed and wind pressure | UT-360 | 0 m/s–30 m/s | m/s | 0 to 40 °C |
| Clamp meter | Voltage | UT-203 | 400 mV–600 V | Volt | N/A |
| Current | 40–400 amp | Ampere | |||
| Resistance | 400–40 M ohm | Ohm | |||
| Thermal imager | Heat signal imagery | FLUKE TI 105 | Focus free beyond 1.2 m | None | −20 to 150 °C |
| Infra-red thermometer | Temperature even from distance | UT-301C | −18 to 550 °C | Degree Celsius | N/A |
| (b) | |||||
| Appliances | Rated Power (W) | Quantity | Expected Peak Power (kW) | ||
| Conventional AC 24,000 BTU | 2400 | 1 | 2.4 | ||
| Conventional AC 18,000 BTU | 1950 | 1 | 1.95 | ||
| Conventional AC 12,000 BTU | 1400 | 1 | 1.4 | ||
| Conventional Fan | 110 | 114 | 12.54 | ||
| Compact fluorescent lamp CFL | 45 | 12 | 0.54 | ||
| Compact fluorescent lamp CFL | 25 | 7 | 0.175 | ||
| Compact fluorescent lamp CFL | 18 | 10 | 0.18 | ||
| LED panel | 36 | 173 | 6.228 | ||
| Fluorescent tube lights—4 Foot | 45 | 272 | 12.24 | ||
| Total | 37.653 | ||||
| No. of Years | Electricity Generation (kWh) | Cash Flow (M PKR) | Cumulative Cash Flow (M PKR) | Profit (M PKR) |
|---|---|---|---|---|
| 0 | 0 | 0 | 0 | −1.9338 |
| 1 | 18,786.9 | 0.3381642 | 0.3381642 | −1.5956358 |
| 2 | 18693 | 0.336474 | 0.6746382 | −1.2591618 |
| 3 | 18,599.5 | 0.334791 | 1.0094292 | −0.9243708 |
| 4 | 18,506.5 | 0.333117 | 1.3425462 | −0.5912538 |
| 5 | 18,414 | 0.331452 | 1.6739982 | −0.2598018 |
| 6 | 18,321.9 | 0.3297942 | 2.0037924 | 0.0699924 |
| 7 | 18,230.3 | 0.3281454 | 2.3319378 | 0.3981378 |
| 8 | 18,139.2 | 0.3265056 | 2.6584434 | 0.7246434 |
| 9 | 18,048.5 | 0.324873 | 2.9833164 | 1.0495164 |
| 10 | 17,958.2 | 0.3232476 | 3.306564 | 1.372764 |
| 11 | 17,868.4 | 0.3216312 | 3.6281952 | 1.6943952 |
| 12 | 17,779.1 | 0.3200238 | 3.948219 | 2.014419 |
| 13 | 17,690.2 | 0.3184236 | 4.2666426 | 2.3328426 |
| 14 | 17,601.8 | 0.3168324 | 4.583475 | 2.649675 |
| 15 | 17,513.7 | 0.3152466 | 4.8987216 | 2.9649216 |
| 16 | 17,426.2 | 0.3136716 | 5.2123932 | 3.2785932 |
| 17 | 17,339 | 0.312102 | 5.5244952 | 3.5906952 |
| 18 | 17,252.4 | 0.3105432 | 5.8350384 | 3.9012384 |
| 19 | 17,166.1 | 0.3089898 | 6.1440282 | 4.2102282 |
| 20 | 17,080.3 | 0.3074454 | 6.4514736 | 4.5176736 |
| 21 | 16,994.9 | 0.3059082 | 6.7573818 | 4.8235818 |
| 22 | 16,909.9 | 0.3043782 | 7.06176 | 5.12796 |
| 23 | 16,825.3 | 0.3028554 | 7.3646154 | 5.4308154 |
| 24 | 16,741.2 | 0.3013416 | 7.665957 | 5.732157 |
| 25 | 16,657.5 | 0.299835 | 7.965792 | 6.031992 |
| Appliances | Carbon Dioxide Emission for Existing Appliances (Metric Ton) | Carbon Dioxide Emission for Recommended Appliances (Metric Ton) | Reduction in Carbon Dioxide Emission (Metric Ton) | Percentage Reduction in Carbon Dioxide Emission (Percentage) |
|---|---|---|---|---|
| Air conditioner | 5 | 4.14 | 0.86 | 17.2 |
| Light | 16.27 | 6.4 | 9.78 | 60 |
| Fan | 12.48 | 7.37 | 5.1 | 40.9 |
| Net impact | 33.76 | 18 | 15.74 | 46.6 |
| Measures Taken | Carbon Dioxide Emission (Metric Ton) | Reduction in Carbon Dioxide Emission (Metric Ton) | Percentage Reduction in Carbon Dioxide Emission (Percentage) |
|---|---|---|---|
| Reference case | 144.31284 | _ | _ |
| Efficient lights and fans | 134.6128 | 9.7 | 6.7 |
| Light paint color for building envelope | 123.4148627 | 20.9 | 14.47 |
| Setting indoor temp from 18 to 25 °C | 117.4562667 | 26.86 | 18.6 |
| Roof Insulation | 105.71064 | 38.6 | 26.7 |
| Double glazed window glass | 131.5774133 | 12.74 | 8.8 |
| Installing solar wall on south | 128.674 | 15.64 | 10.8 |
| All measures together | 77.00644 | 67.31 | 46.6 |
| Appliance | Load Reduction (Percentage) | Load Reduction (kW) | Expected Cost (M PKR) | Expected Payback Period (Years) |
|---|---|---|---|---|
| Lights | 60 | 7.88 | 0.32 | 1.35 |
| Air conditioners | 17 | 0.99 | 0.24 | 4.07 |
| Fans | 41 | 5.13 | 0.48 | 1.5 |
| Net impact | 45 | 14.00 | 1.04 | 2.30 |
| Measures Taken | Load Reduction (Percentage) | Cooling Load (kW) | Retrofitting Cost (M PKR) | Pay Back Period (Years) |
|---|---|---|---|---|
| Reference case | - | 765.45 | - | - |
| Efficient lights and fans | 6.73 | 714 | - | - |
| Light paint color for building envelope | 14.50 | 654.6 | 0.43 | 0.8 |
| Setting indoor temp from 18 to 25 °C | 18.61 | 623 | - | - |
| Roof insulation | 26.75 | 560.7 | 2.4 | 2.4 |
| Double-glazed window glass | 8.83 | 697.9 | 1.45 | 4.4 |
| Installing solar wall on south | 10.84 | 682.5 | - | - |
| All measures together | 46.64 | 408.45 | 4.28 | 2.5 |
| Measures Taken | Load Reduction | |
|---|---|---|
| Current Case Study Lahore, Pakistan (Percentage) | Previous Case Study Doha, Qatar (Percentage) | |
| Efficient lights and fans | 6.73 | 10 |
| Light paint color for building envelope | 14.50 | 12 |
| Setting indoor temp 24 °C | 18.61 | 14 |
| Roof insulation | 26.75 | 28 |
| Double-glazed window glass | 8.83 | 4.5 |
| All measures together | 46.64 | 53 |
Disclaimer/Publisher’s Note: The statements, opinions and data contained in all publications are solely those of the individual author(s) and contributor(s) and not of MDPI and/or the editor(s). MDPI and/or the editor(s) disclaim responsibility for any injury to people or property resulting from any ideas, methods, instructions or products referred to in the content. |
© 2023 by the authors. Licensee MDPI, Basel, Switzerland. This article is an open access article distributed under the terms and conditions of the Creative Commons Attribution (CC BY) license (https://creativecommons.org/licenses/by/4.0/).
Share and Cite
Azam, U.; Farooq, M.; Munir, M.A.; Riaz, F.; Sultan, M.; Rehman, A.U.; Imran, M. Modelling Framework for Reducing Energy Loads to Achieve Net-Zero Energy Building in Semi-Arid Climate: A Case Study. Buildings 2023, 13, 2695. https://doi.org/10.3390/buildings13112695
Azam U, Farooq M, Munir MA, Riaz F, Sultan M, Rehman AU, Imran M. Modelling Framework for Reducing Energy Loads to Achieve Net-Zero Energy Building in Semi-Arid Climate: A Case Study. Buildings. 2023; 13(11):2695. https://doi.org/10.3390/buildings13112695
Chicago/Turabian StyleAzam, Umair, Muhammad Farooq, Muhammad Adeel Munir, Fahid Riaz, Muhammad Sultan, Ateekh Ur Rehman, and Muhammad Imran. 2023. "Modelling Framework for Reducing Energy Loads to Achieve Net-Zero Energy Building in Semi-Arid Climate: A Case Study" Buildings 13, no. 11: 2695. https://doi.org/10.3390/buildings13112695
APA StyleAzam, U., Farooq, M., Munir, M. A., Riaz, F., Sultan, M., Rehman, A. U., & Imran, M. (2023). Modelling Framework for Reducing Energy Loads to Achieve Net-Zero Energy Building in Semi-Arid Climate: A Case Study. Buildings, 13(11), 2695. https://doi.org/10.3390/buildings13112695


