Abstract
Straight-wall arch cross-sections are usually designed at the entrance and exit tunnels of subway stations, and dense underground pipelines often cross these cross-sections at close range. Among these pipelines, gas pipelines have the highest risk level. Therefore, it is necessary to reduce the deformation influence of underground crossing construction on existing gas pipelines. Based on the No. 2 entrance and exit tunnel project of Zhongshan Road Station of the Hohhot Metro Line 2, using the methods of numerical simulation and field monitoring, this paper has particularly investigated the influence of straight-wall arch tunnel construction by applying the pre-grouting reinforcement and double-side drift method to the deformation of existing gas pipelines. The research results show that the double-side drift method is an efficient and sustainable construction method for straight-wall arch tunnels, which can effectively reduce the crossing construction disturbance to overlying gas pipelines. The measured maximum settlement of the existing gas pipeline is 18.46 mm, and the maximum settlement of the new tunnel vault is 22.86 mm, with both values satisfying the requirements for deformation control. The simulation results are consistent with the measured results of gas pipeline settlement. This study shows that the safety control scheme employed in the field with a tunnel excavation step of 6 m, stratum reinforcement with upper semi-section grouting, and a grouting reinforcement range of 2.0 m is reasonable and effective. This scheme can provide a reference for the deformation control of similar underground gas pipelines in the crossing construction of straight-wall arch tunnels at close range.
1. Introduction
With the continuous increase in people’s demand for traveling, the construction planning of urban rail transit in China is increasing progressively, with the emergence of many energy-saving, efficient, and environmentally friendly subway tunnels with open excavation, underground excavation, or a combination of both methods in the promotion of sustainable urban development. In urban central business areas, dense underground municipal pipelines are often encountered in the construction of subway tunnels. Close-range construction of subway tunnels imposes a serious impact on various pipelines, among which gas pipelines are one kind of municipal pipeline with the highest risk level. Deformation or even cracking of existing gas pipelines is likely to be caused by the construction disturbance of subway tunnels. Disaster accidents such as gas damage, leakage, and explosions caused by the construction of subway tunnels occur from time to time, which pose a serious threat to national property and the safety of people’s lives. How to better protect gas pipelines in the process of tunnel excavation has become a key issue in the development of urban tunnels.
At present, numerous scholars have conducted extensive research and achieved a series of research results regarding the response of existing pipelines to undercrossing construction of tunnels. The research methods that were adopted included analytical solutions, numerical simulations, model tests, and field monitoring. Two analytical solutions incorporating the elastic-continuum model and the Pasternak model were formulated to estimate the deflection and bending moment of two adjacent pipelines situated above a newly constructed tunnel [1]. The tunnel–pipeline–soil interaction problem was also examined from an elastic-continuum-based approach [2,3]. When using the Winkler model to analyze the impact of tunnel excavation on existing pipelines, one of the key issues is to evaluate the subgrade modulus under external soil displacement. An expression of the Winkler subgrade modulus for a pipeline buried at an arbitrary depth and subjected to soil displacement with an arbitrary curve shape was given [4]. Underground pipelines with joints also remain worth studying. Regarding joints of pipelines as rational springs, a Winkler solution based on the improved Winkler modulus was proposed to analyze the response of jointed pipelines due to tunneling [5]. Moreover, tunnel excavations can cause ground surface settlement, which in turn affect the mechanics characteristics and structural integrity of adjacent pipelines [6,7,8,9,10]. Although some valuable insights have been gained from the theoretical analysis, there are few working conditions studied for analytical solutions, and numerical simulations can effectively compensate for this deficiency. Based on the boundary element model, a displacement-controlled two-stage method was presented to predict the deformation behavior of existing pipelines subjected to tunneling-induced deformations in layered soils [11]. The influence of tunnel excavation on surface and existing pipeline deformation were studied by establishing a finite difference model corresponding to actual engineering [12,13,14,15]. When studying jointed pipelines through numerical simulations, the joints were usually simplified as hinges [16]. Capable of solving problems in a complex field, three-dimensional numerical studies were widely applied to predict the displacement of different types of pipelines [17,18,19]. It is very common that two or more pipelines in the ground exist beneath or close to the newly built tunnels to be excavated in practice. Centrifuge tests were conducted to investigate the tunnel–pipeline–soil interaction and the response of pipelines to multi-tunneling [20,21,22,23]. In numerical studies, the parameters of the numerical models are difficult to determine accurately and conform to reality. Field monitoring remains a reliable method for comprehending the interaction [24,25,26]. Although scholars have conducted a lot of research on the newly constructed tunnels crossing underground pipelines, existing research has mostly simplified the tunnel construction process, which cannot truly reflect the impact of such crossing engineering on gas pipeline deformation. In addition, there is relatively little research on the response of gas pipelines during the straight-sided arch tunnel under-crossing construction.
Based on the No. 2 entrance and exit tunnel project at the Zhongshan Road Station of the Hohhot Metro Line 2, the advance grouting reinforcement scheme and tunnel excavation scheme were first presented. Then, the influence of grouting reinforcement form, grouting reinforcement range, and tunnel excavation step on the settlement of gas pipeline caused by the double-side drift method of straight-wall arch tunnel was analyzed using a three-dimensional finite element numerical simulation. The rationality and reliability were verified by comparing with the measured data.
2. Project Overview
2.1. Project Outline
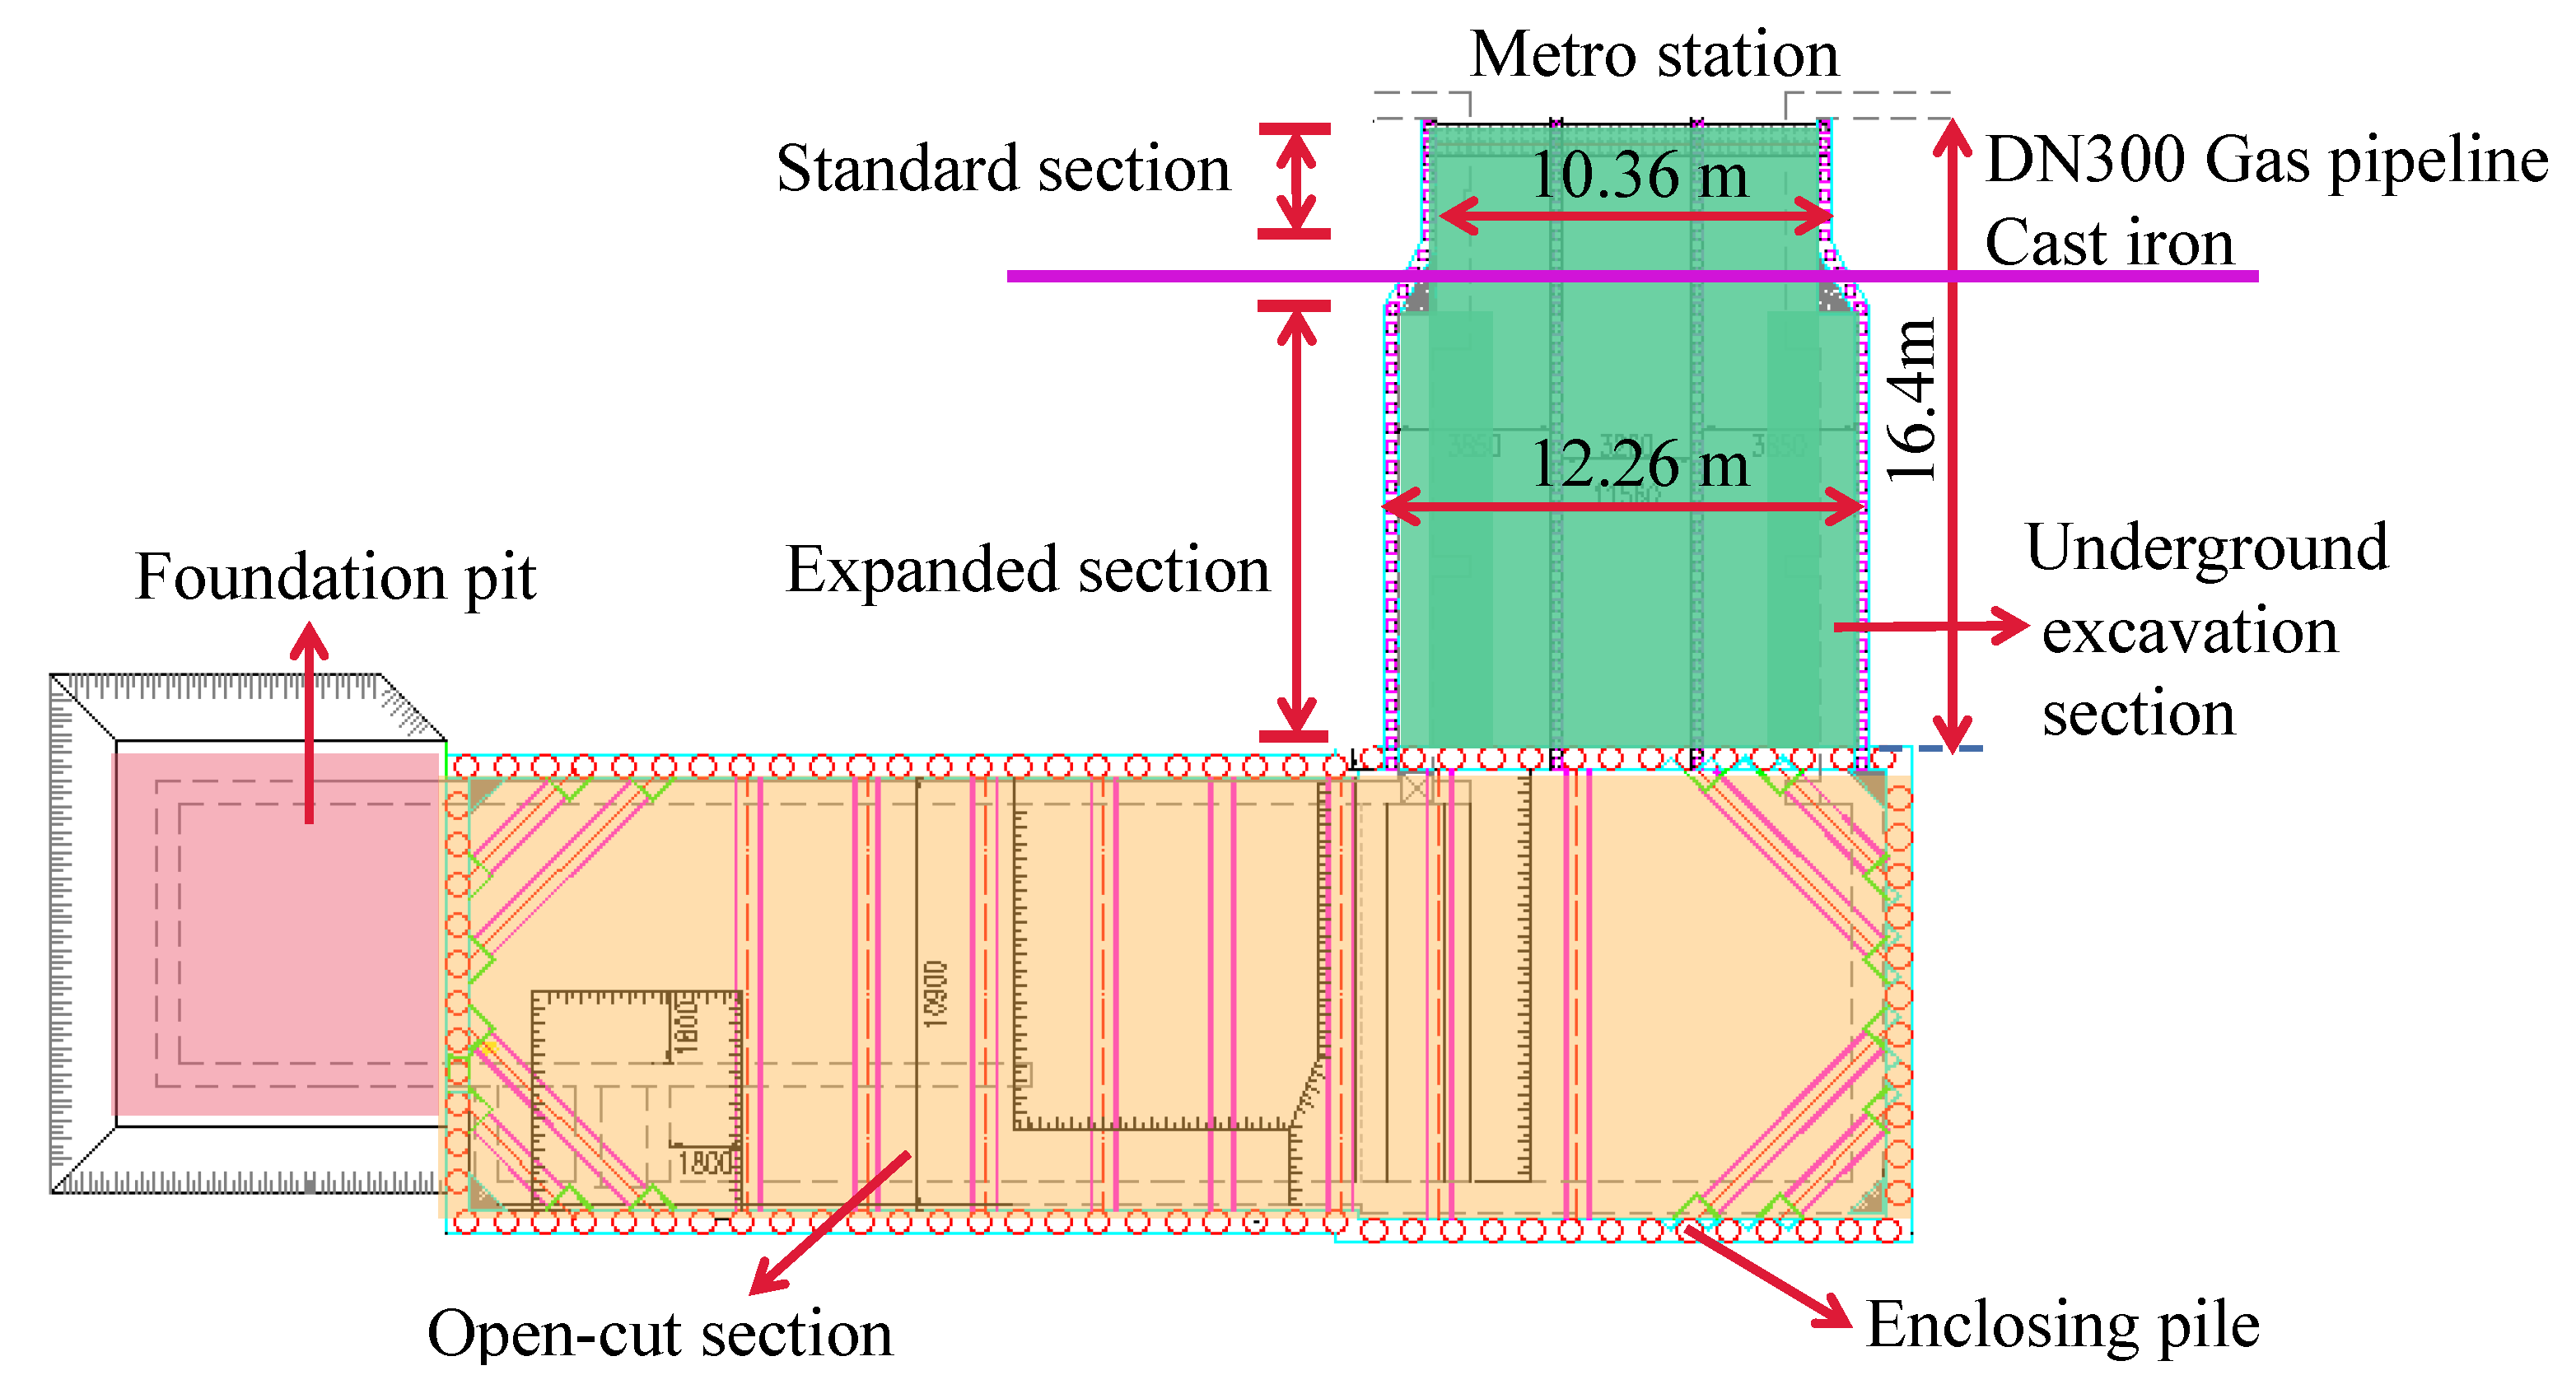
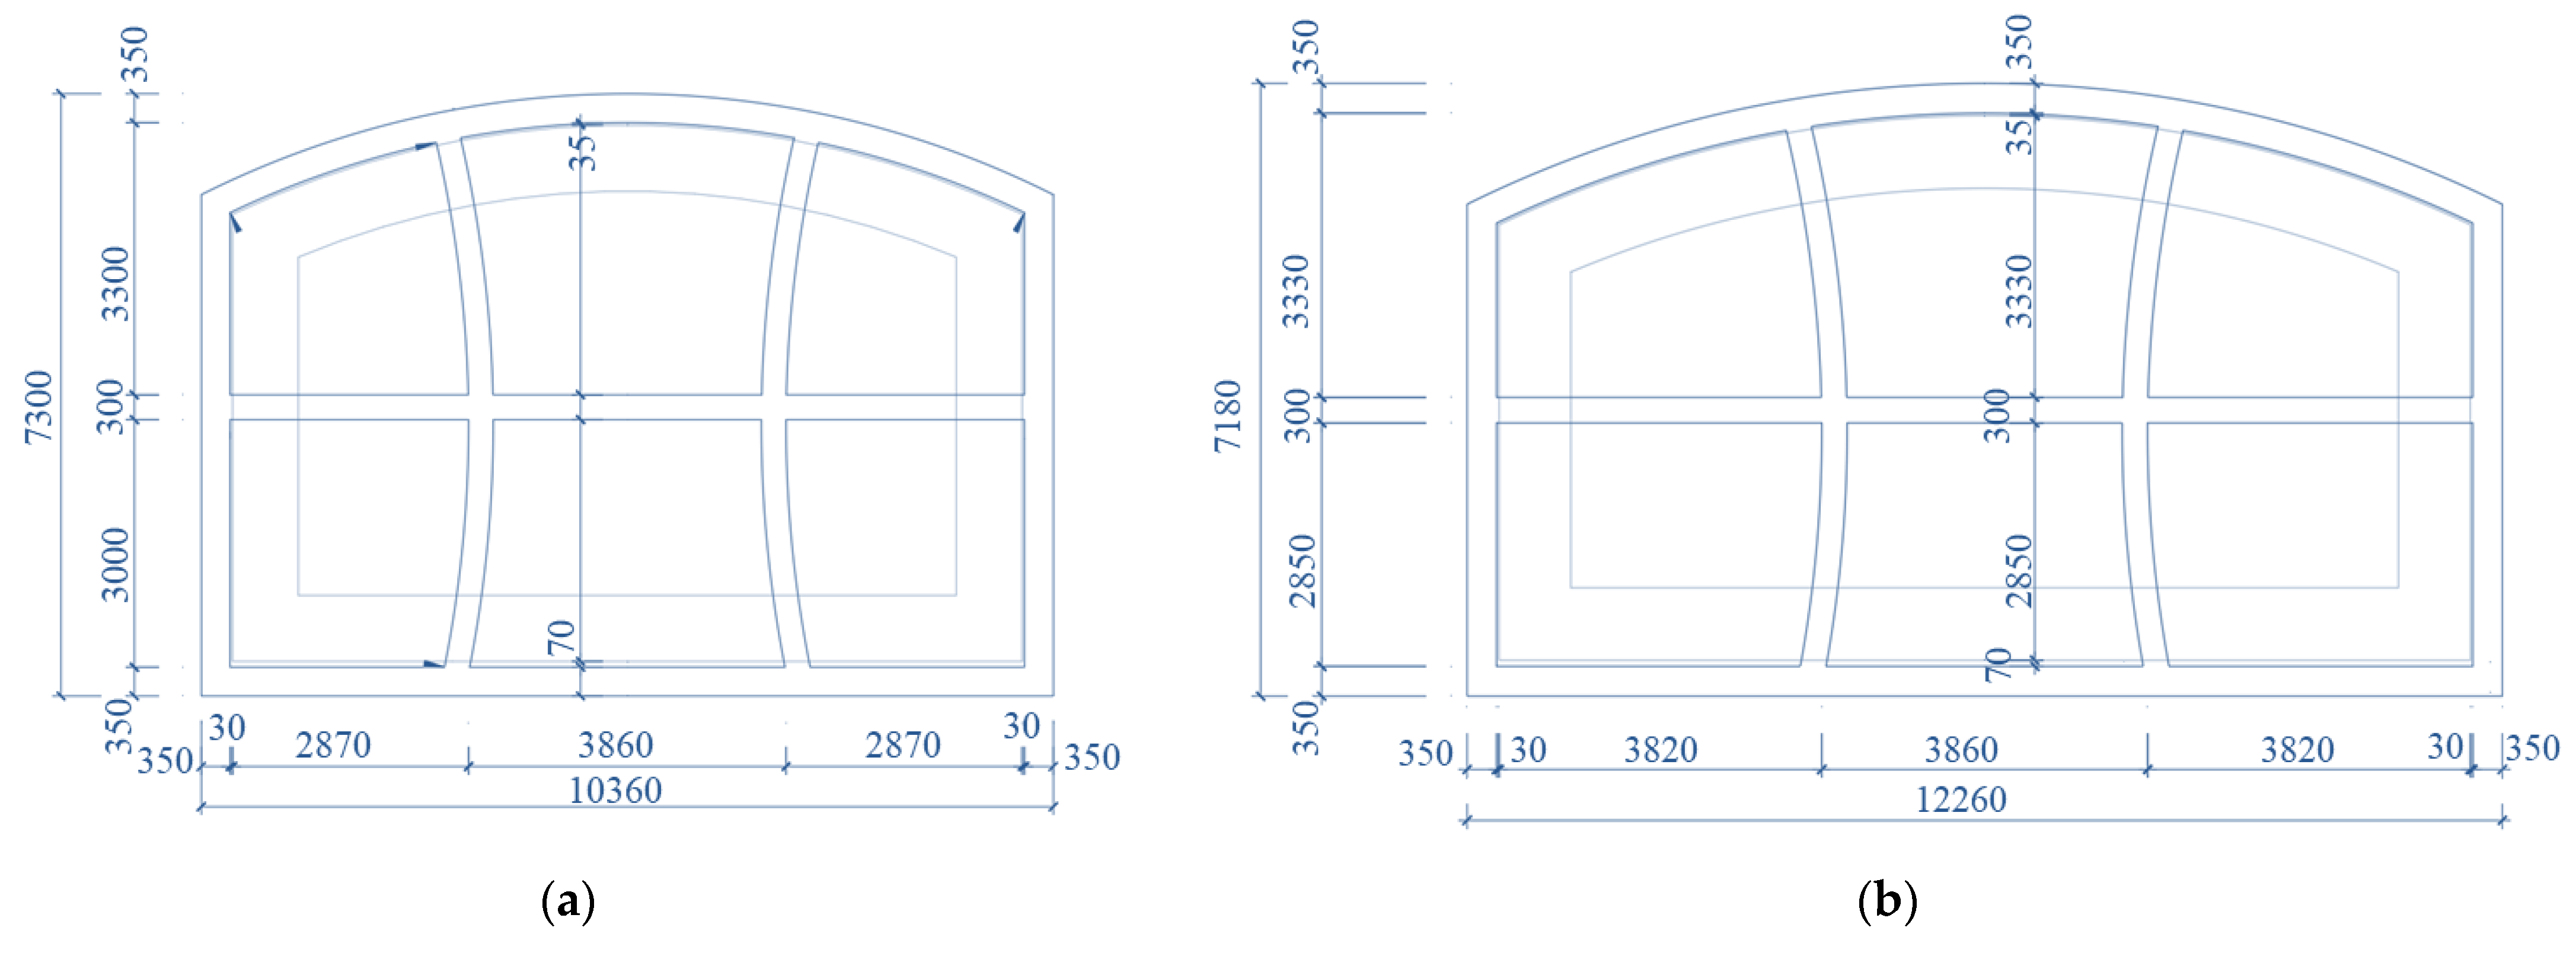
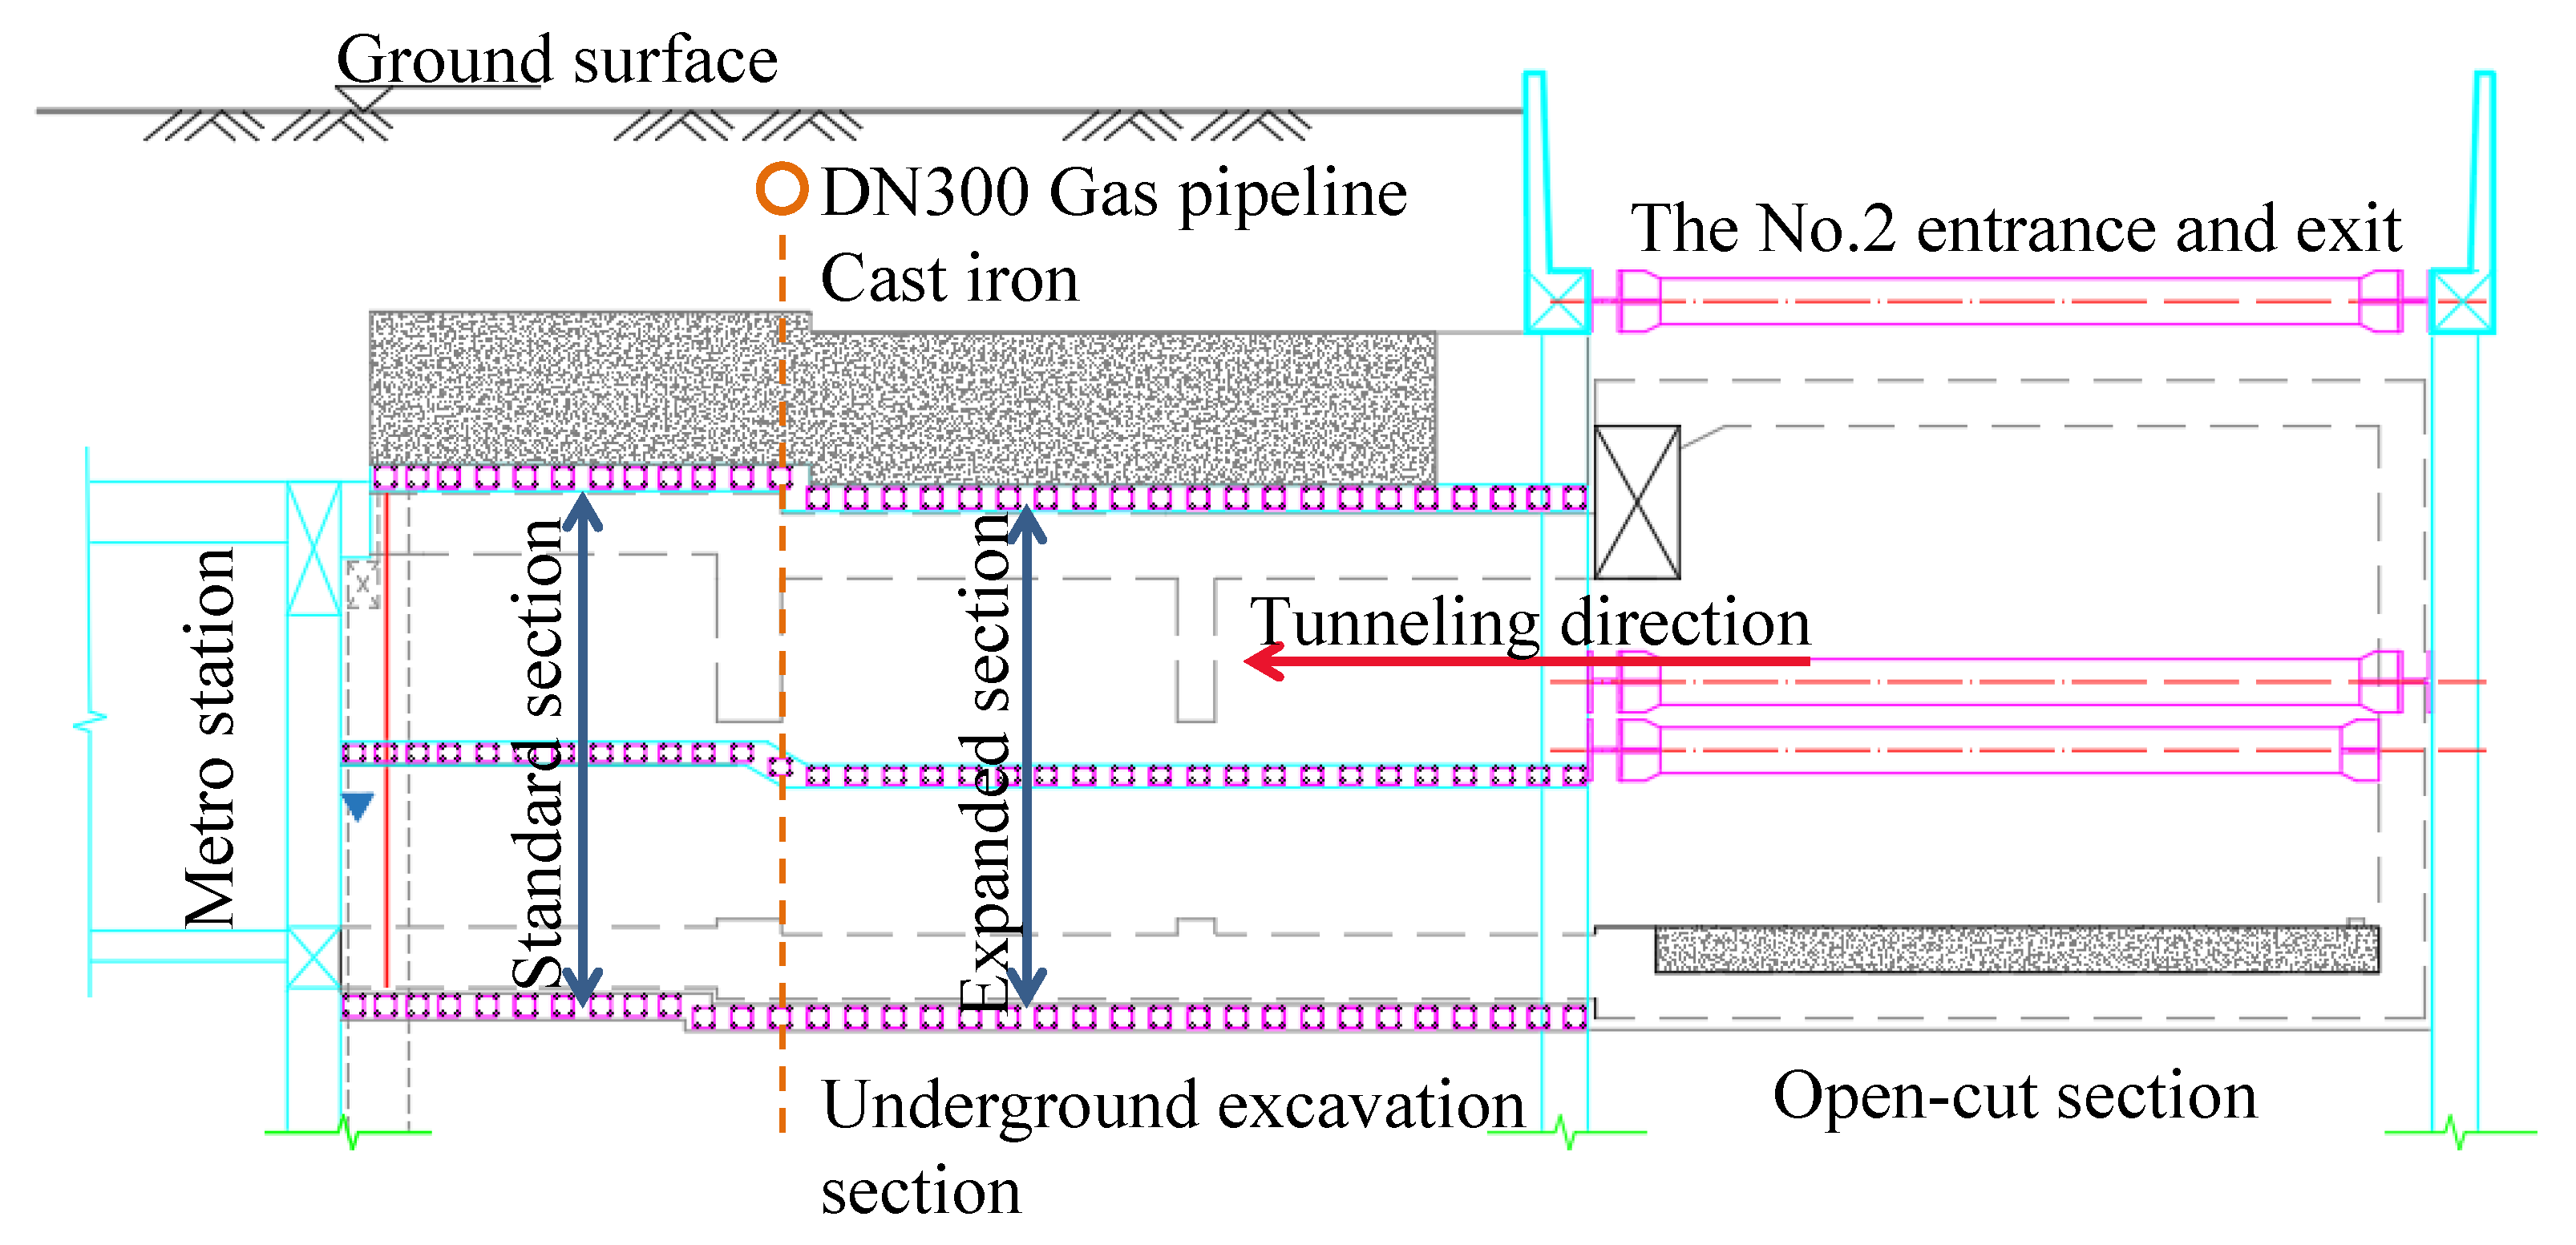
The Zhongshan Road Station of Hohhot Metro Line 2 is located on the south side of the intersection of Xilingol South Road and Zhongshan East Road. The No. 2 entrance and exit of this station consist of one underground excavation tunnel and one open-cut foundation pit, as shown in Figure 1. The underground excavation tunnel is in the form of a straight-wall arch section. With a total length of 16.40 m, this tunnel is composed of a standard section and an expanded section. Figure 2 shows the cross-sectional dimensions of this tunnel. A double-side drift method was applied in the construction of the straight-wall arch tunnel. Steel grid frames, steel meshes, and C25 sprayed concrete with a thickness of 35 cm were used for the primary support of the tunnel, and for the secondary lining, C35-reinforced concrete construction with a thickness of 60 cm was used.
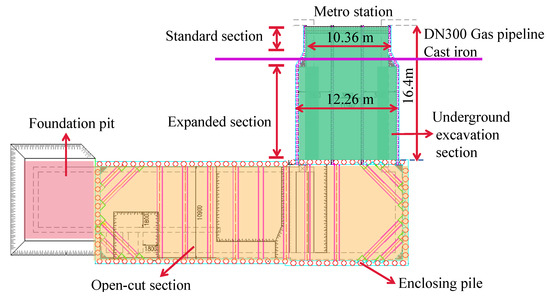
Figure 1.
Plan view of the site.
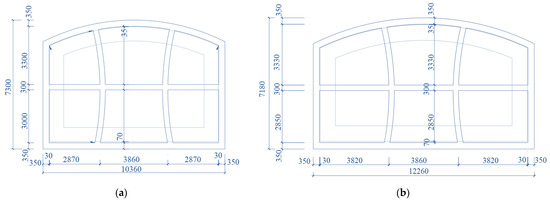
Figure 2.
Tunnel cross-sectional dimensions (unit: mm). (a) Standard section and (b) expanded section.
Right above the underground excavation tunnel, there lies an orthogonal gas pipeline. This gas pipeline is made of cast iron, with an outer diameter and wall thickness of 30 cm and 3 cm, respectively. With a buried depth of 2.17 m, the pipeline has a vertical distance of 2.7 m from the primary support of the tunnel. Figure 3 shows the longitudinal profile of the No. 2 entrance and exit of the Zhongshan Road Station.
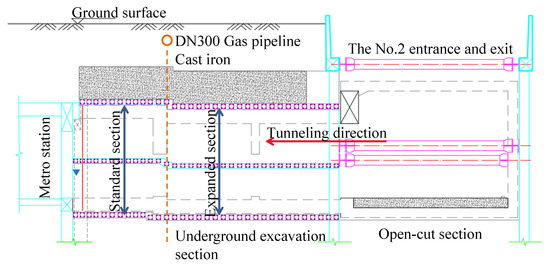
Figure 3.
Longitudinal cross-section of the site.
2.2. Project Geological Conditions
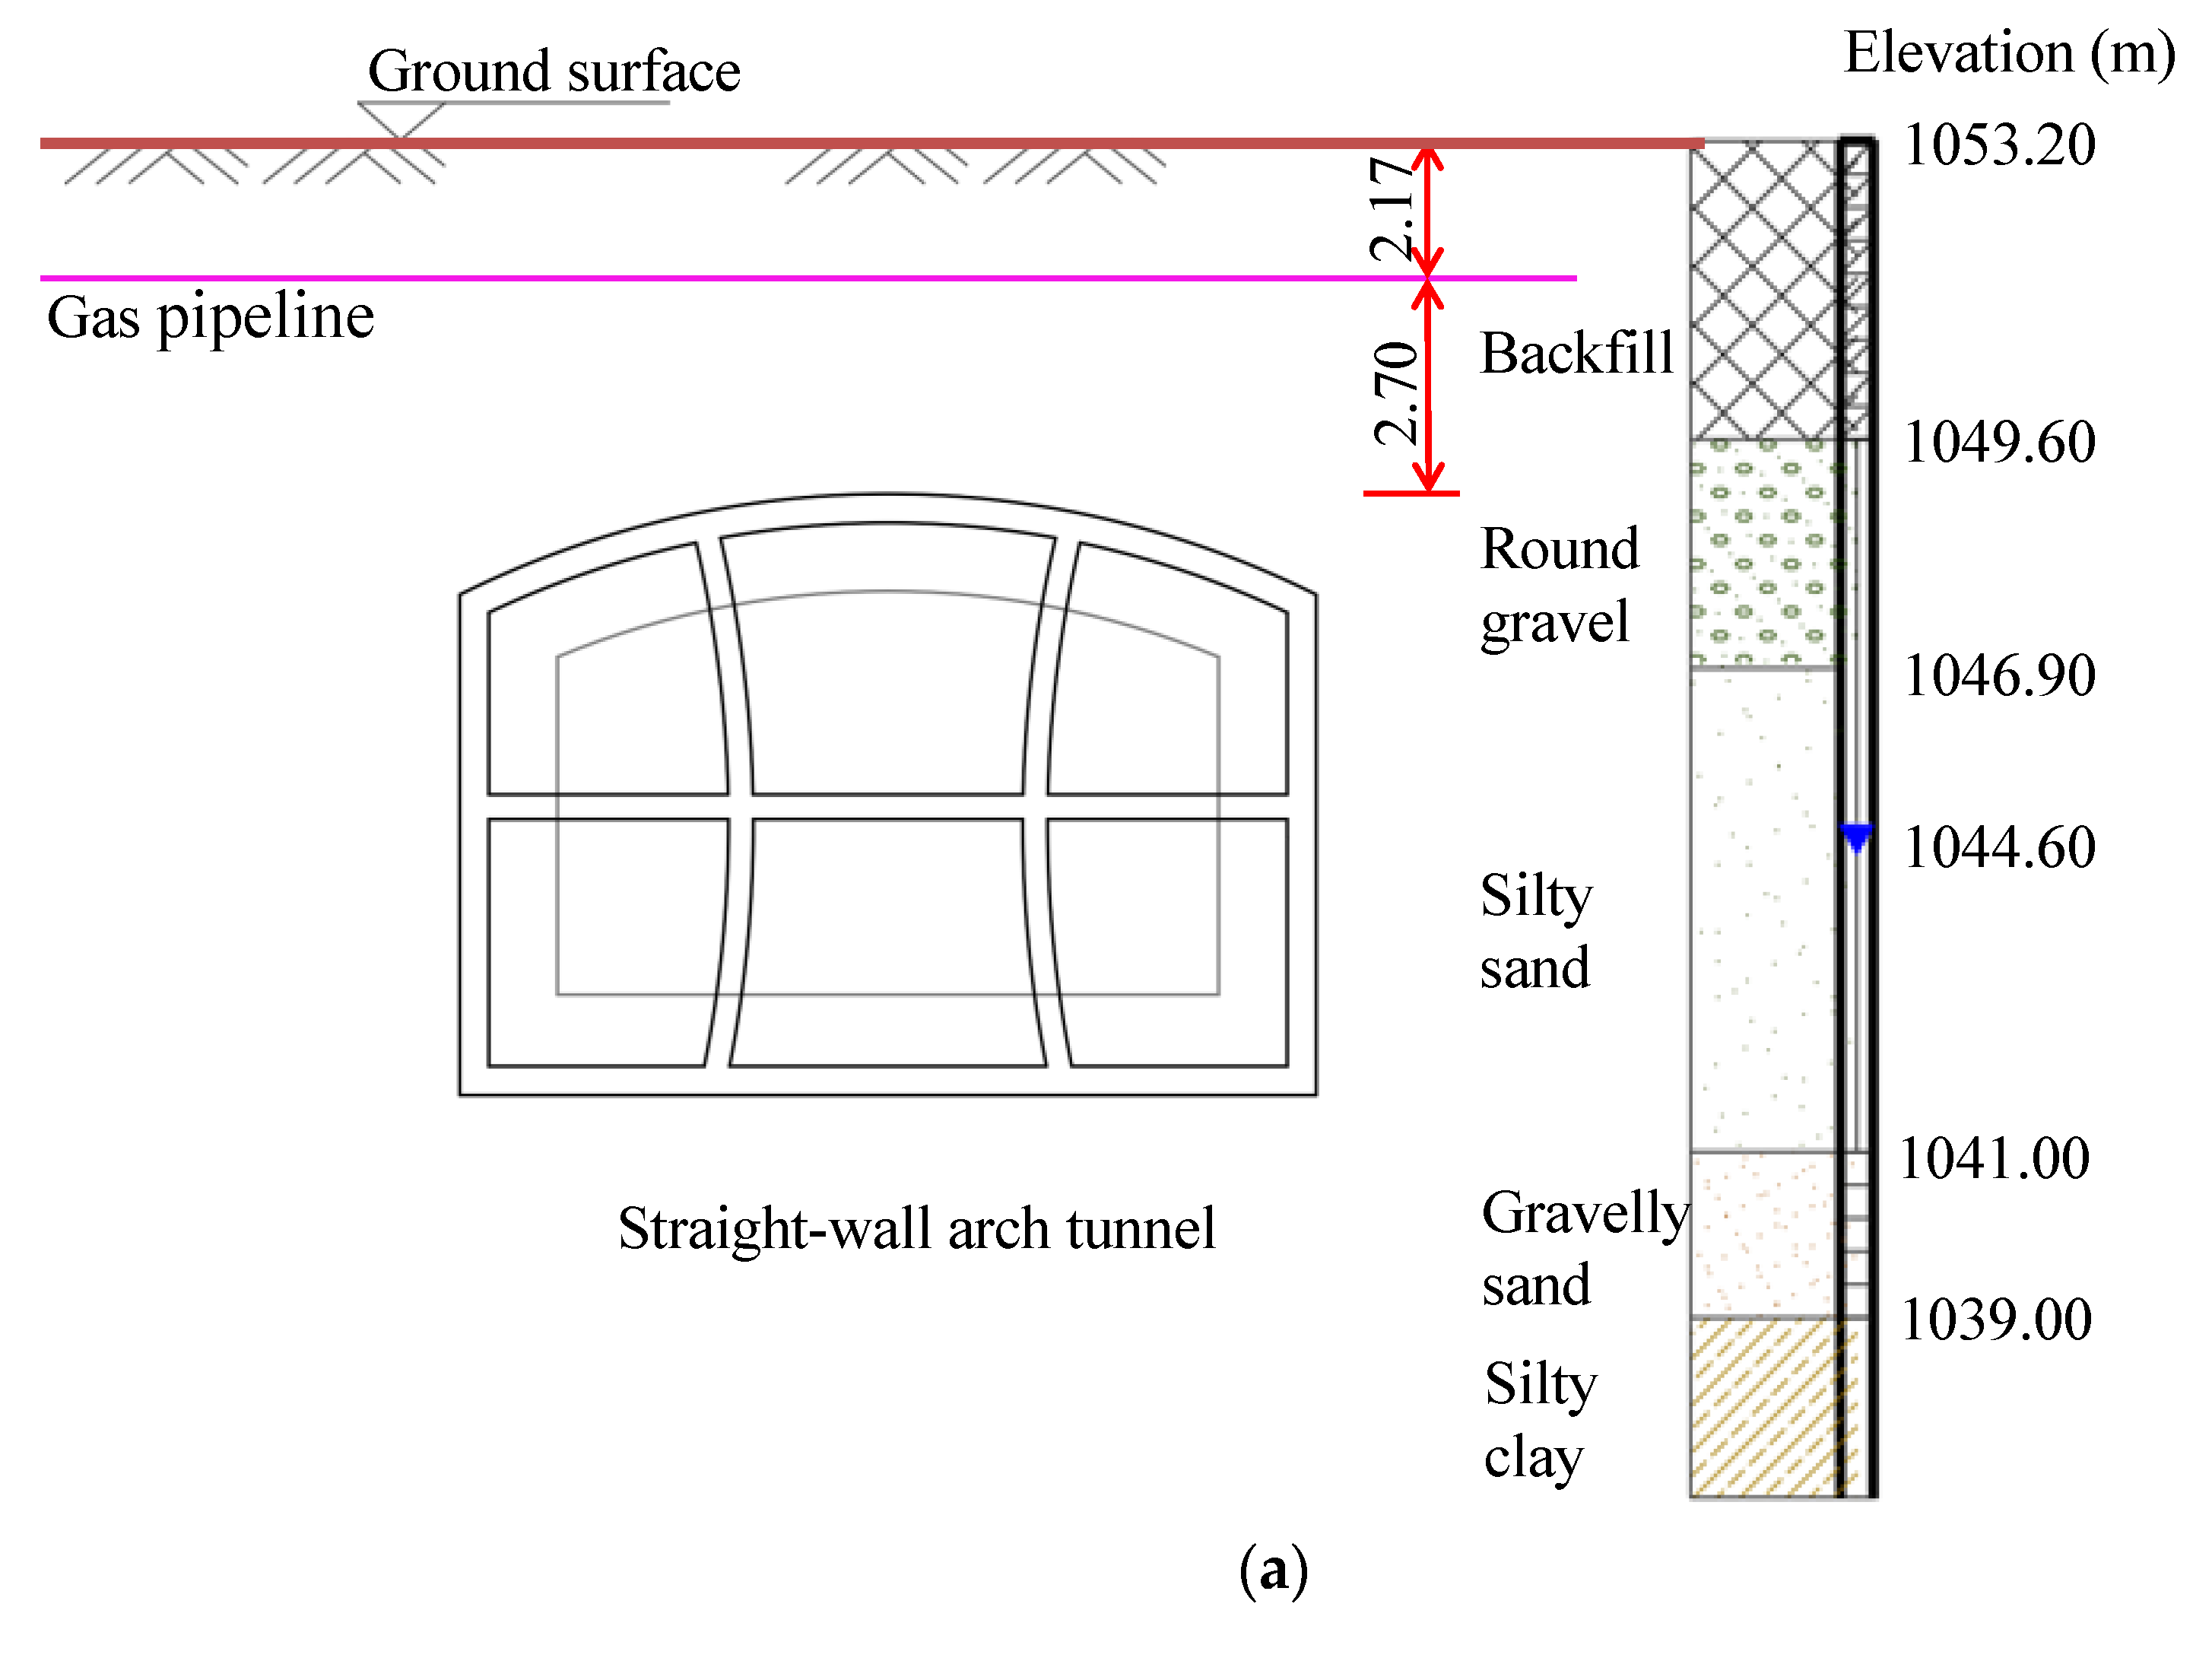
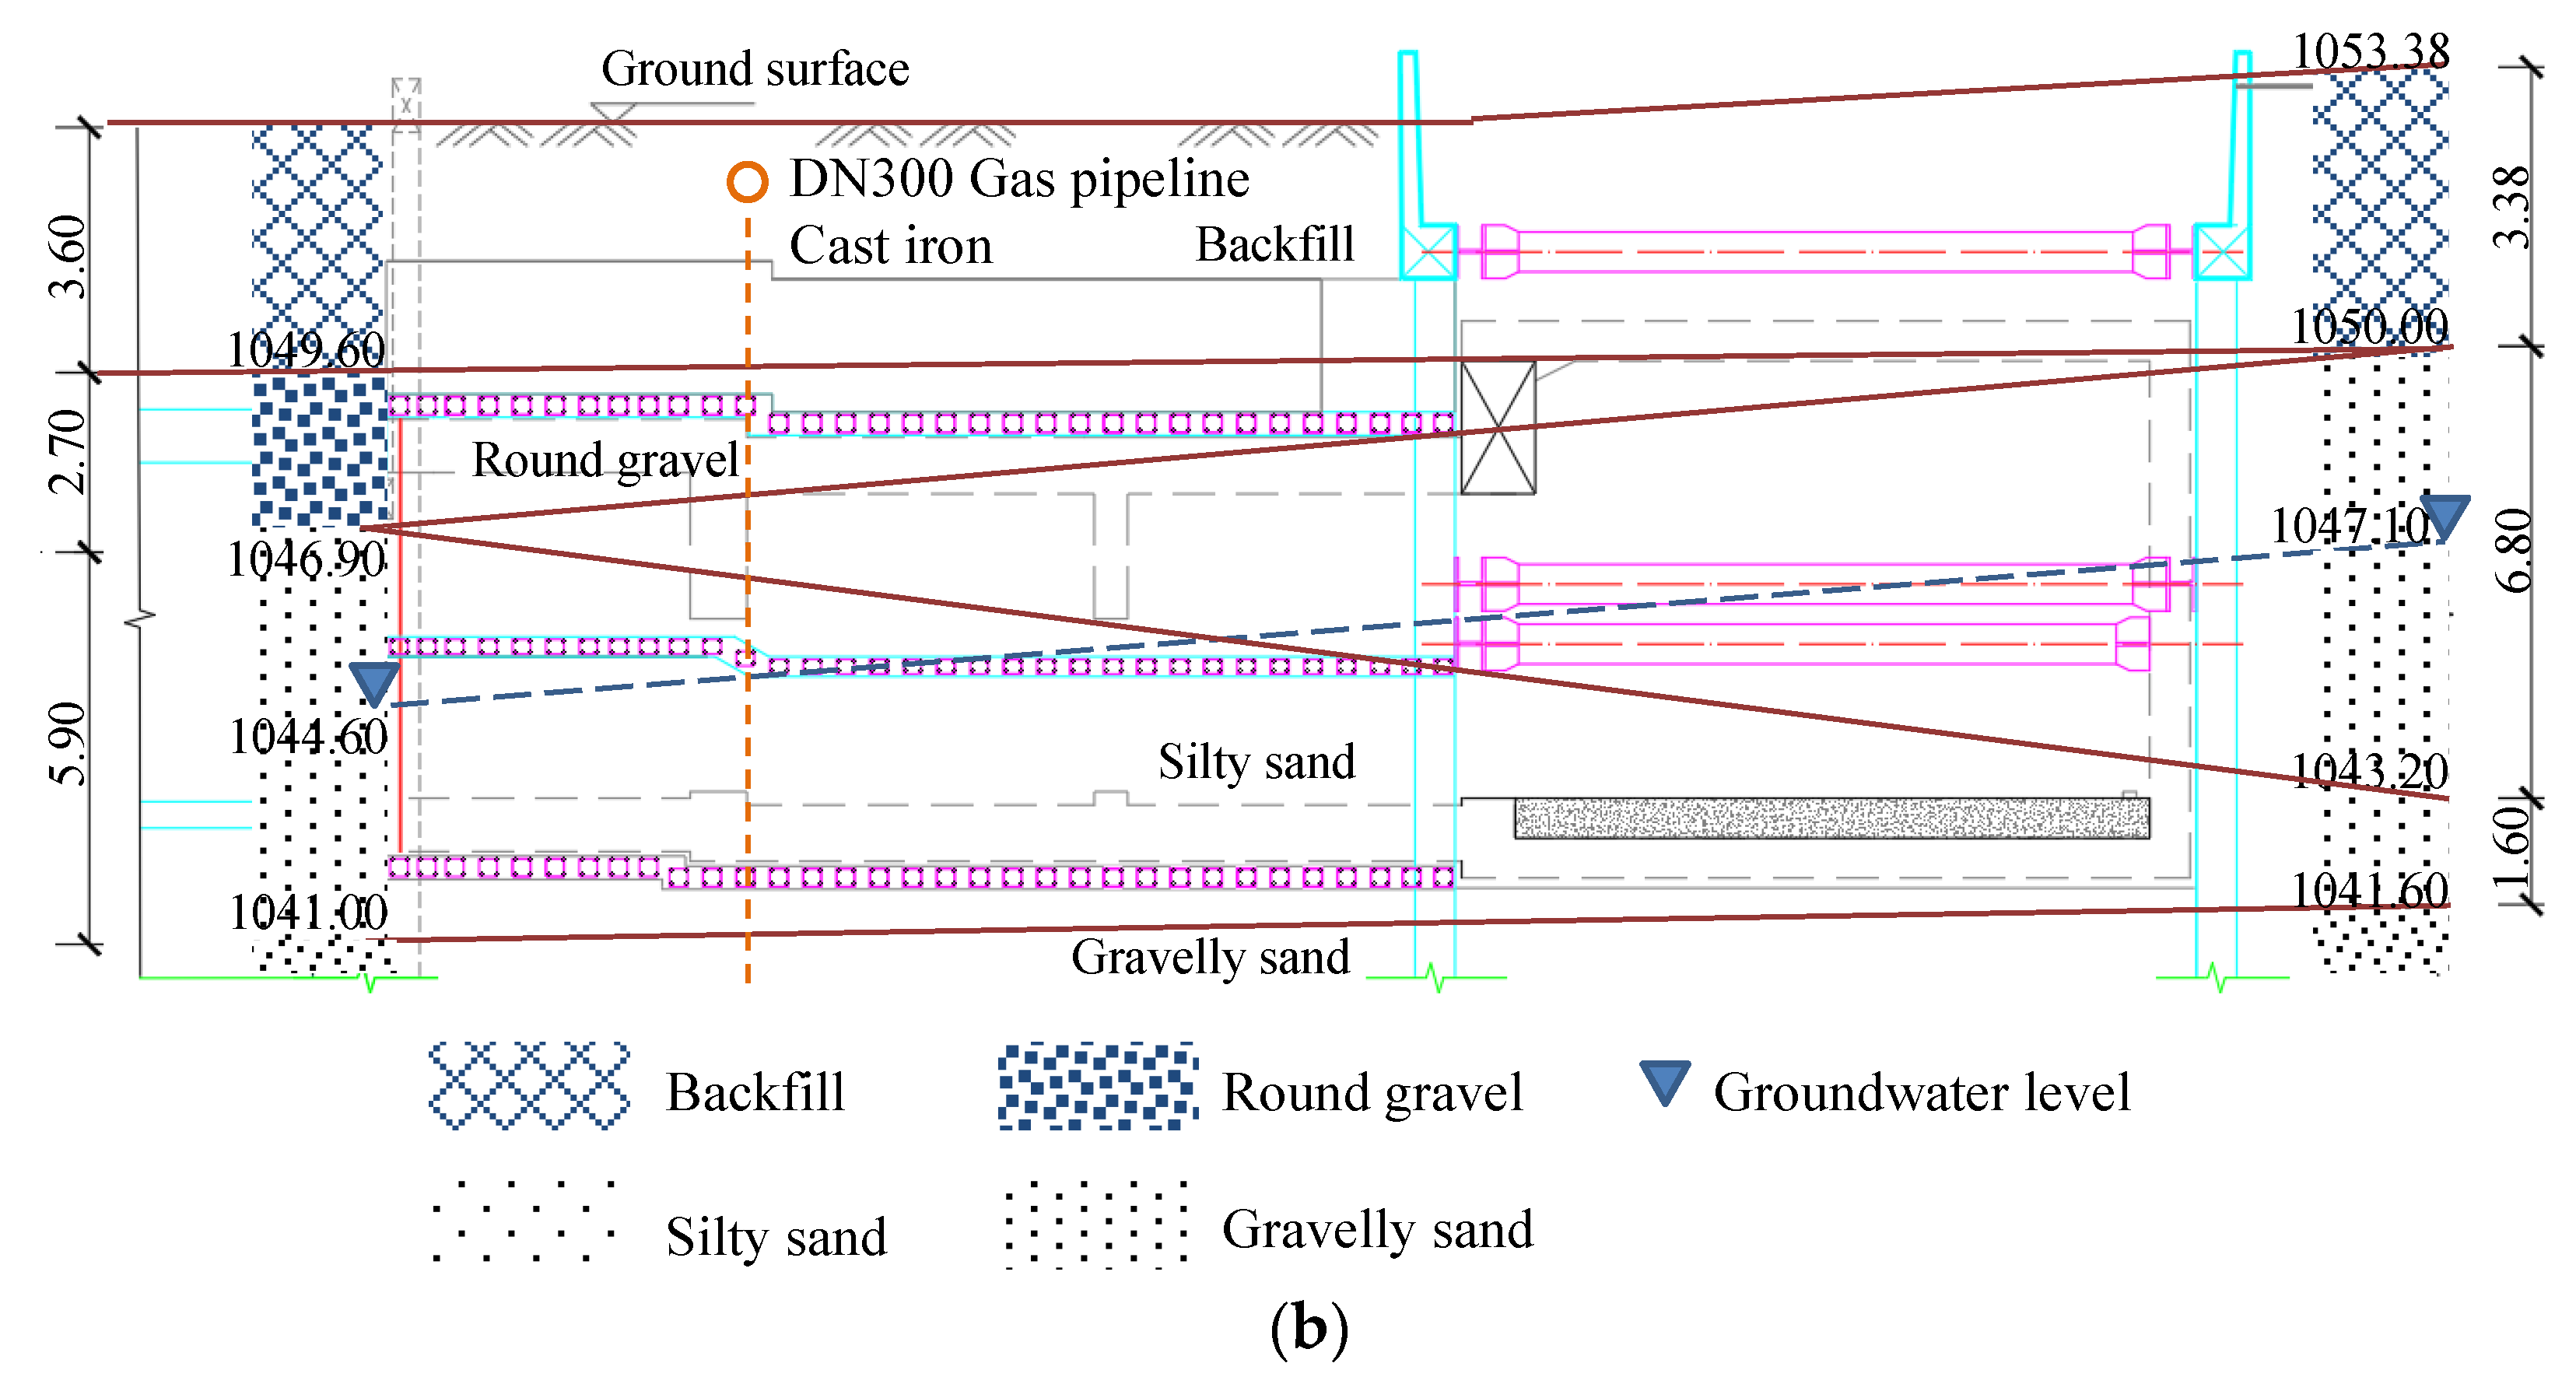
According to the geological survey report, from the surface downward, the stratum of the underground excavation tunnel in the No. 2 entrance and exit of the station is composed of plain fill, round gravel, silty sand, and grit, while the stratum where the gas pipeline lies primarily consists of plain fill. The soil structure here is loose, with strong water permeability and a poor self-stabilization capacity. Figure 4 shows the geological profile of this project. As shown in this figure, elevations of some parts are marked. For example, “1049.60” means that this part has an elevation of 1,049.60 m. Groundwater in the tunnel belongs to the Quaternary phreatic water type, with an aquifer thickness of about 10.00–14.00 m. In the stage of detailed exploration, the measured field underground water depth ranged from 8 m to 8.80 m.
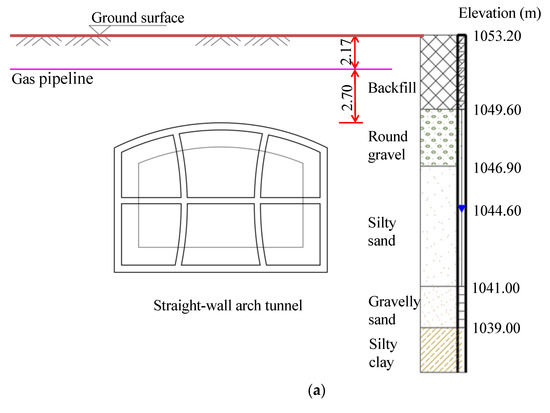
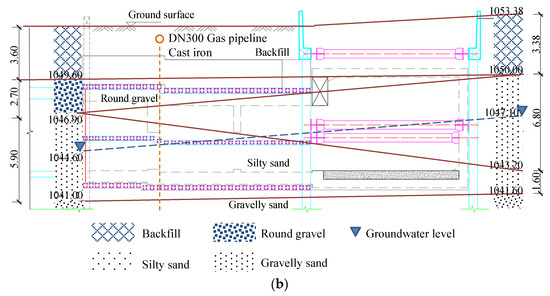
Figure 4.
Engineering geological profile (unit: m). (a) Geological cross-section profile, and (b) geological longitudinal section profile.
2.3. Field Construction Scheme
2.3.1. Grouting Reinforcement Scheme
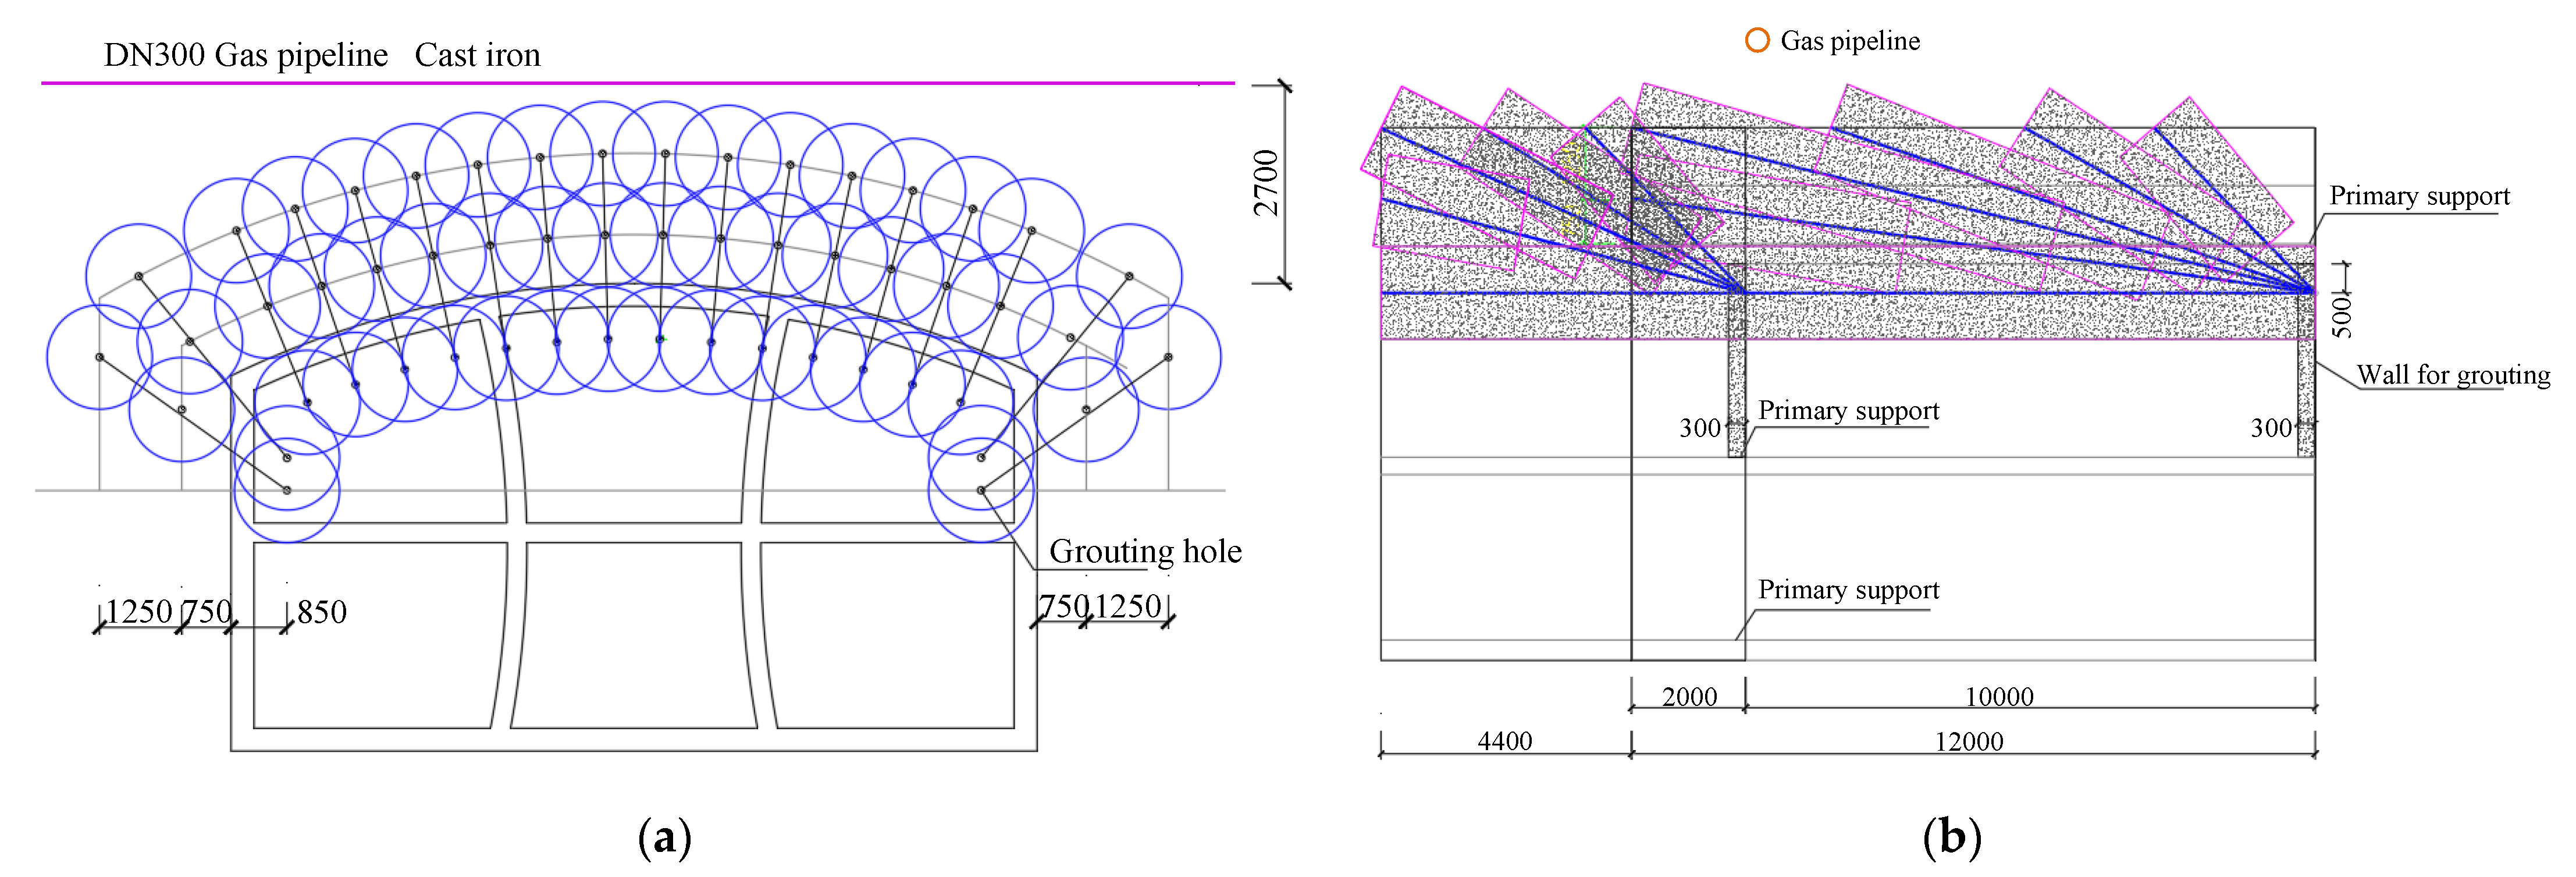
The soft soil layer at the tunnel vault of the underground excavation section in the No. 2 entrance and exit was reinforced through ahead grouting, with a grouting range of 2.0 m outside the excavation contour line of the upper section, and the layout angle of the grouting pipe was adjusted according to the pipeline’s actual situation. With a first grouting length of 12 m and an excavation length of 10 m, a sealing batholite with a length of 2 m was reserved. Meanwhile, in order to avoid grout leakage, a grout wall was set before grouting. Strength-grade C25 shotcrete with mesh reinforcement and a thickness of 300 mm was used to build the grout wall. Also, double-layered steel mesh with a diameter of 6.5 mm was used, with a distance of 150 mm between every two steel bars. During construction, every mesh was fixed on the steel anchor rod and welded firmly with the main reinforcement of the grid. Grade HRB400 steel bars with a diameter of 22 mm and a length of 1.5 m were used to build the steel anchor rod, with a spacing of 500 mm between every two steel bars. Grouting holes were arranged in the pattern of a plum blossom, with three rows arranged from outside to inside. The length of each leading conduit is 2 m and the diameter and wall thickness of the grouting pipe are 32 mm and 3.25 mm, respectively. Also, with an external plug angle of 15°, the grouting pipe has a circumferential spacing of 350 mm. Cement and sodium silicate mixed slurry were used with a grouting filling influence radius of 0.8 m, a grouting speed of 30–50 L/min, and a grouting pressure of 0.8–1.5 MPa. Figure 5 shows the schematic diagram of grouting reinforcement.

Figure 5.
Diagram of grouting reinforcement (unit: mm). (a) Cross section; (b) longitudinal section.
2.3.2. Tunnel Excavation Scheme
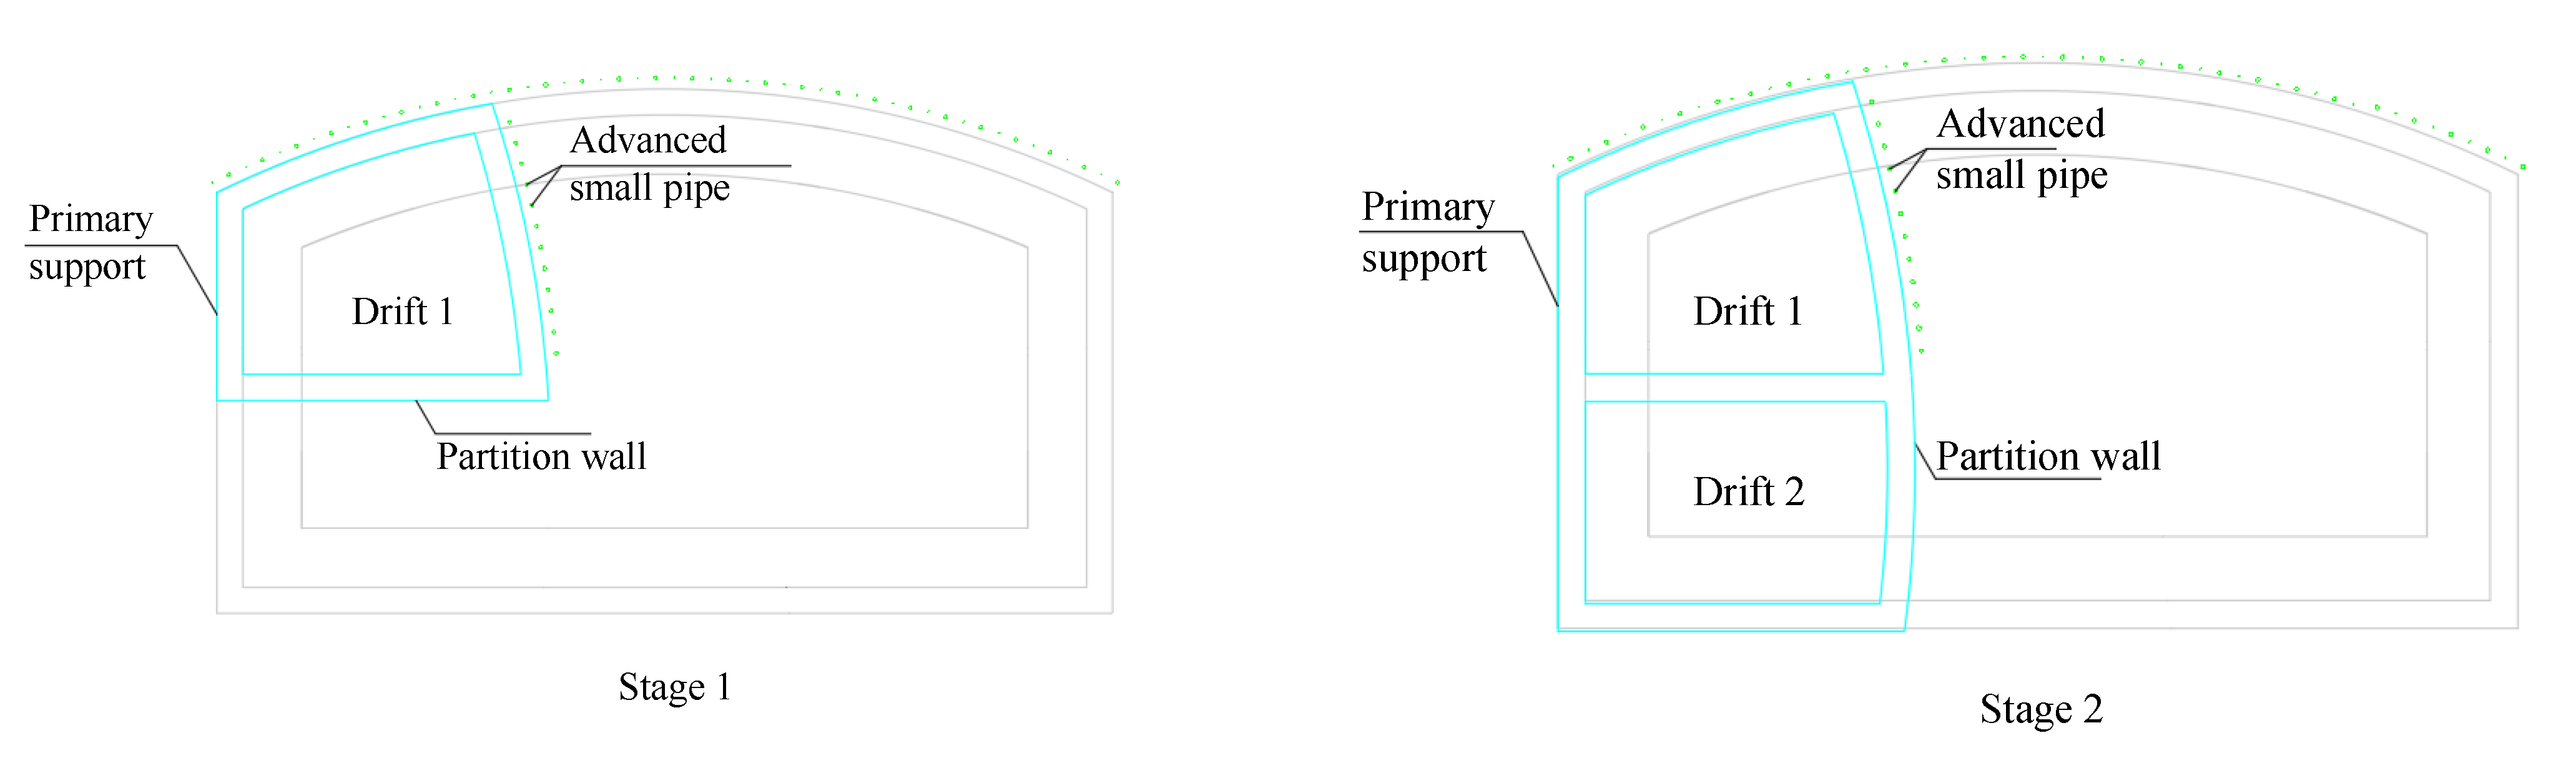
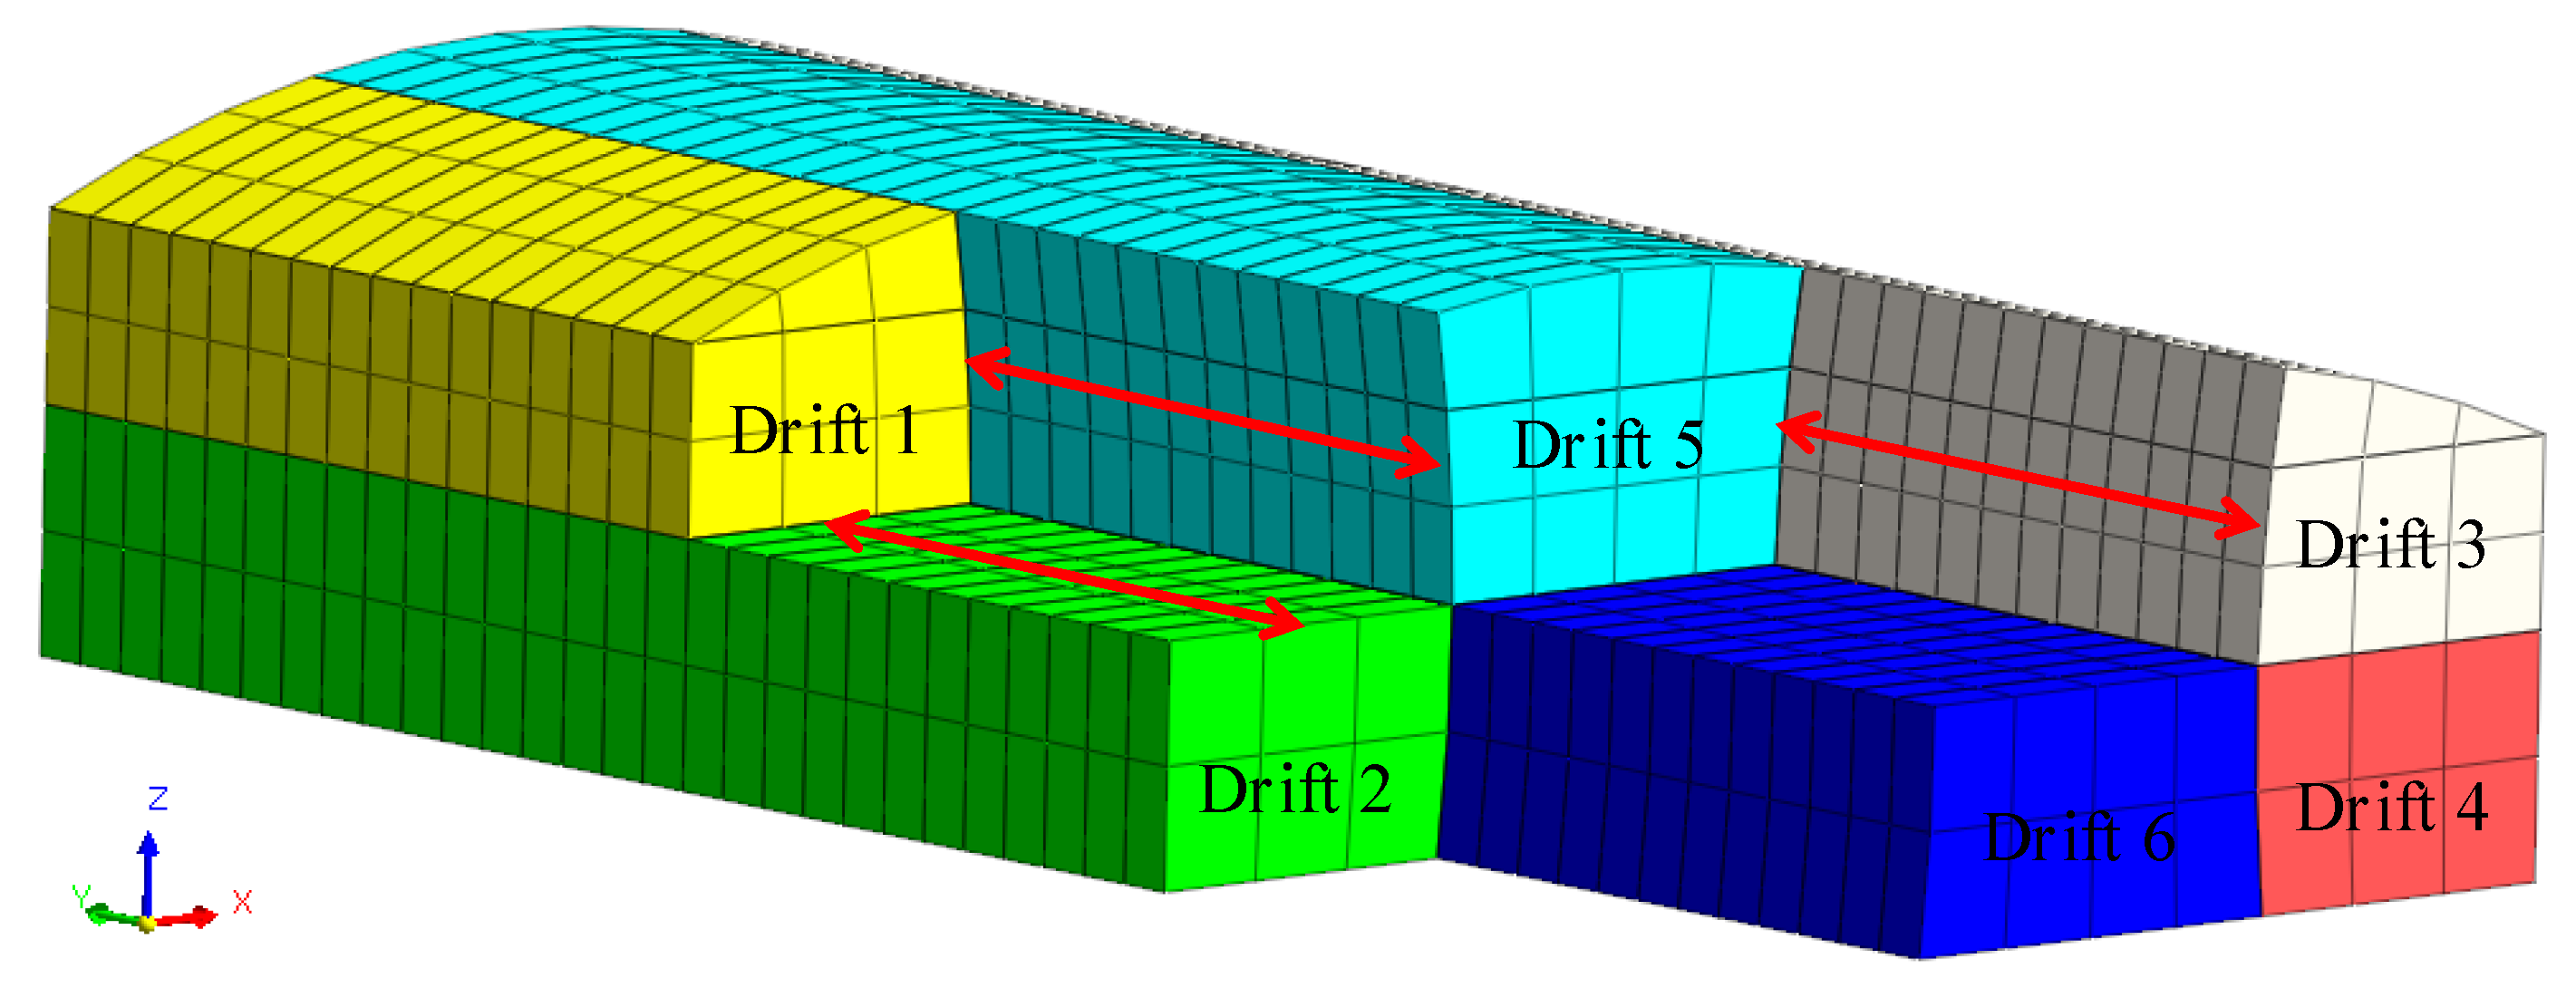
A double-side drift method was applied to construct the straight-wall arch tunnel, with the main construction stages shown in Figure 6. In this figure, “Stage 1” represents the lead grouting and the excavation of the No. 1 pilot tunnel, “Stages 2–6” represents the excavation of the No. 2–No. 6 pilot tunnels, and “Stage 7” represents the demolition of the partition wall for building the secondary lining structure. After the excavation of soil mass on the upper step of the No. 1 pilot tunnel, the steel mesh was hung, and the lattice girders of the tunnel arch, side walls, and partition wall were erected, with the foot-locking anchor rod settled and concrete sprayed.
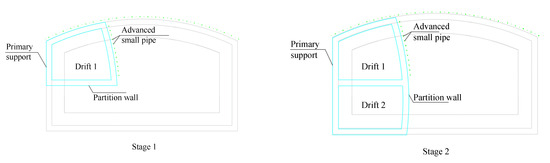
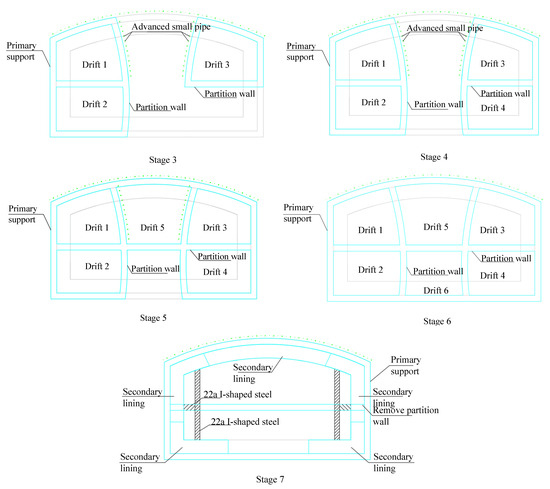
Figure 6.
Diagram of double-side drift method construction.
The No. 2 pilot tunnel was excavated with its support constructed, with a no less than 6 m longitudinal excavation step distance between the No. 1 and No. 2 chambers. Then, the No. 3 and No. 4 chambers were excavated, and their primary supports were built, with the longitudinal excavation step between the No. 1 and No. 3 chambers, as well as that step between the No. 2 and No. 4 chambers, no less than 6m. Then, the No. 5 chamber was excavated after the building of its primary arch support and a temporary inverted arch. After that, the excavation of the No. 6 chamber was carried out. Then, the bottom secondary lining was built, and after the removal of some parts of the temporary partition wall, the upper structure of the secondary lining and its bracing were built, with the remaining part of the temporary partition wall demolished.
3. Analysis of Finite Element Numerical Simulation
3.1. Establishment of Numerical Model
3.1.1. Model Establishment
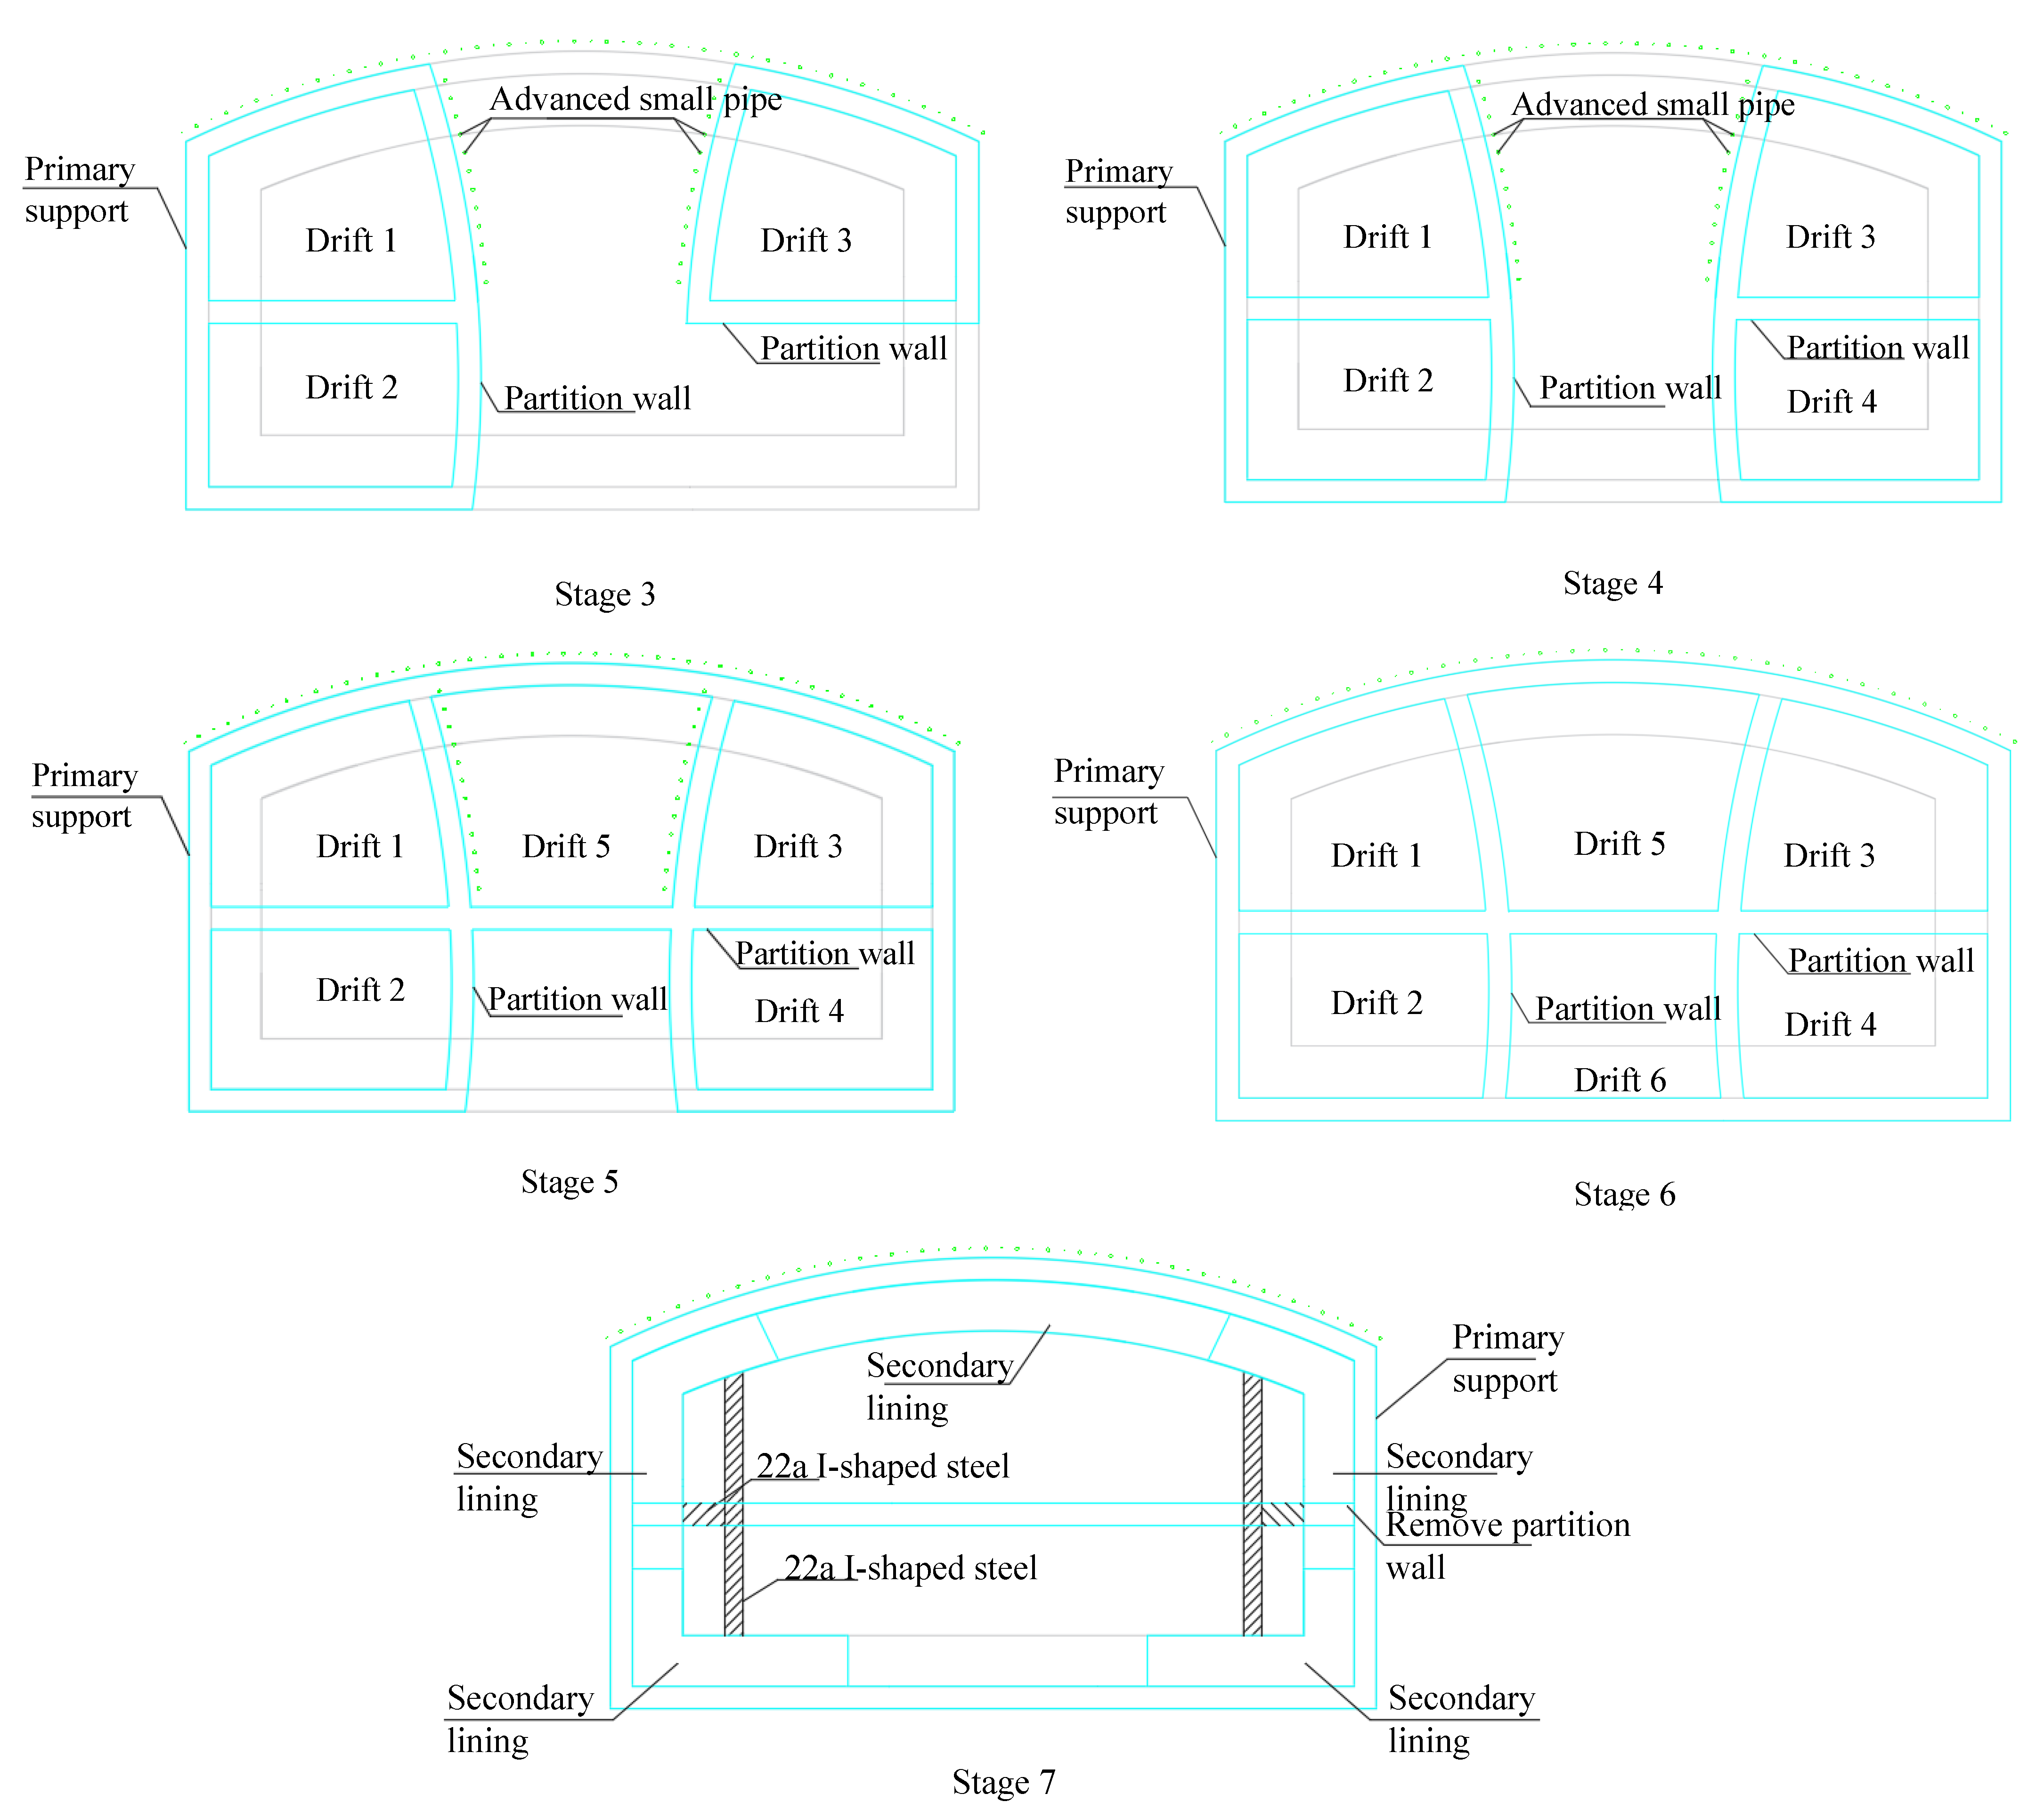
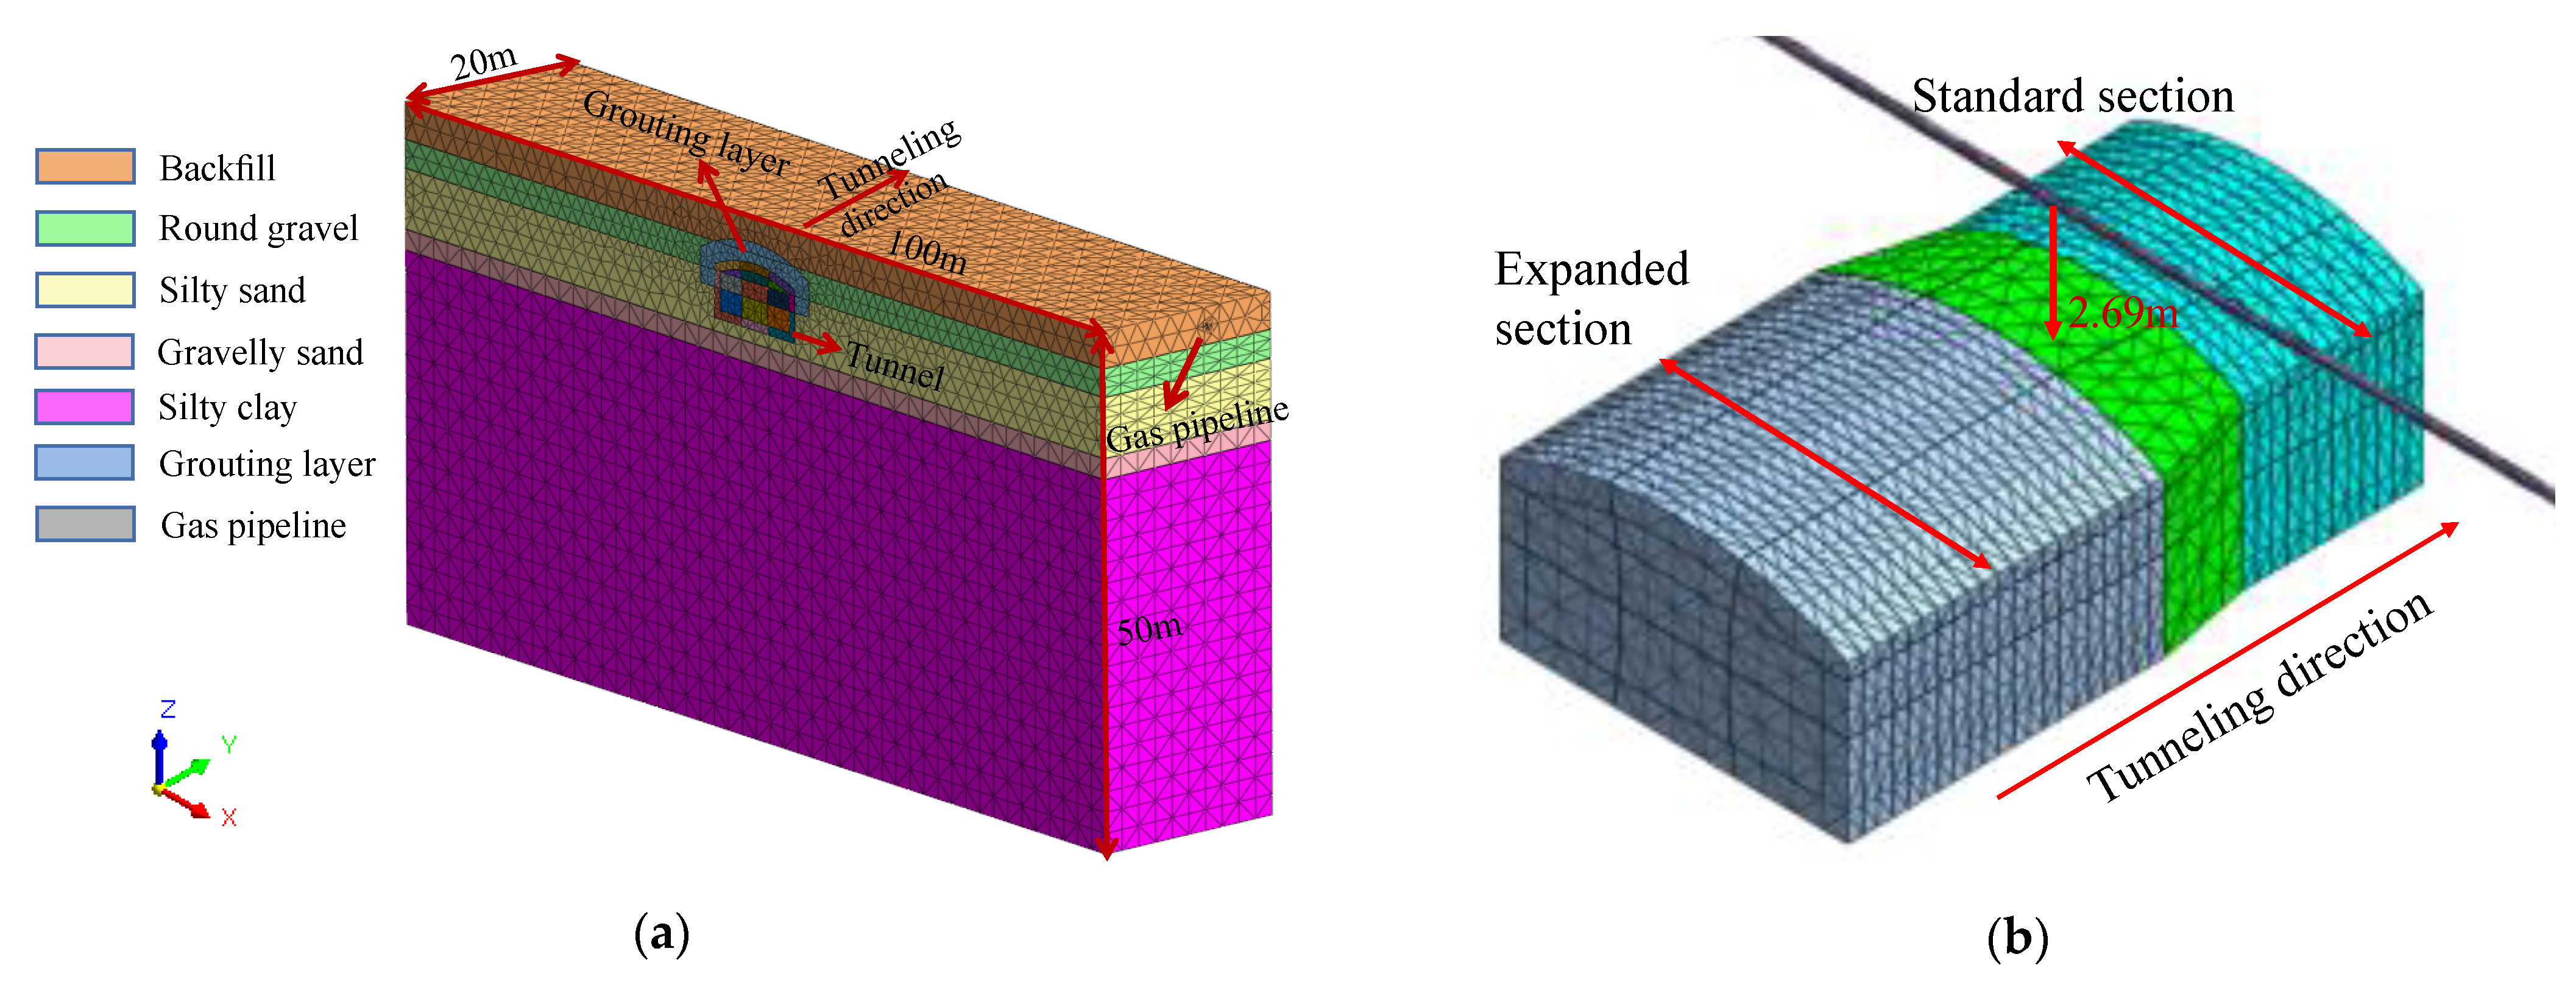
Figure 7 shows the three-dimensional numerical model established with a size of 100 m × 20 m × 50 m. This study was modeled using the 3D finite element software Midas GTS NX (2020). The constitutive model used for soils was Mohr–Coulomb, which corresponds to the prototype materials in the actual engineering. The soil, tunnel structure, and gas pipeline were all simulated using 3D solid elements. The primary support and middle partition were modeled using 2D plate elements. In order to restrict the horizontal movement, the top and side surfaces of the model were set as a free boundary and a displacement boundary, respectively. The ground surface was set as a displacement boundary to restrict the movement along the vertical direction.
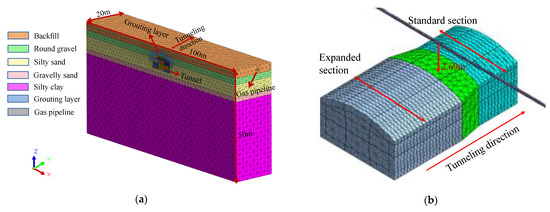
Figure 7.
Three-dimensional numerical model. (a) Overall structure; (b) relative position of tunnel and gas pipeline.
3.1.2. Calculation Parameters
The stratum calculation parameters with stratum distribution simplified into a homogeneous and stratified pattern are listed in Table 1. The simulation of the grouting reinforcement area was realized through the changes in stratum properties, and the parameters of the grouting reinforcement area were settled through reference to the engineering cases of similar underground excavation tunnels. Also, the calculation parameters of the primary support, secondary lining, and partition wall were determined based on design data. The structural calculation parameters are listed in Table 2.

Table 1.
Physical and mechanical indexes of the surrounding soil.
Table 2.
Physical and mechanical index of structure.
3.2. Numerical Simulation Scheme
In the construction of straight-wall arch tunnels, the close-range crossing of the underground gas pipeline using double-side drift method poses a relatively high risk. This paper has applied the control variable method to perform the numerical simulation analysis under nine groups of working conditions corresponding to those three aspects of the form and scope of the grouting reinforcement area and the excavation steps of tunnels. The aim is to investigate the influences of different safety control schemes on pipeline deformation in the construction of new straight-wall arch tunnels crossing existing underground gas pipelines. The specific numerical simulation design schemes are listed in Table 3.
Table 3.
Numerical simulation scheme.
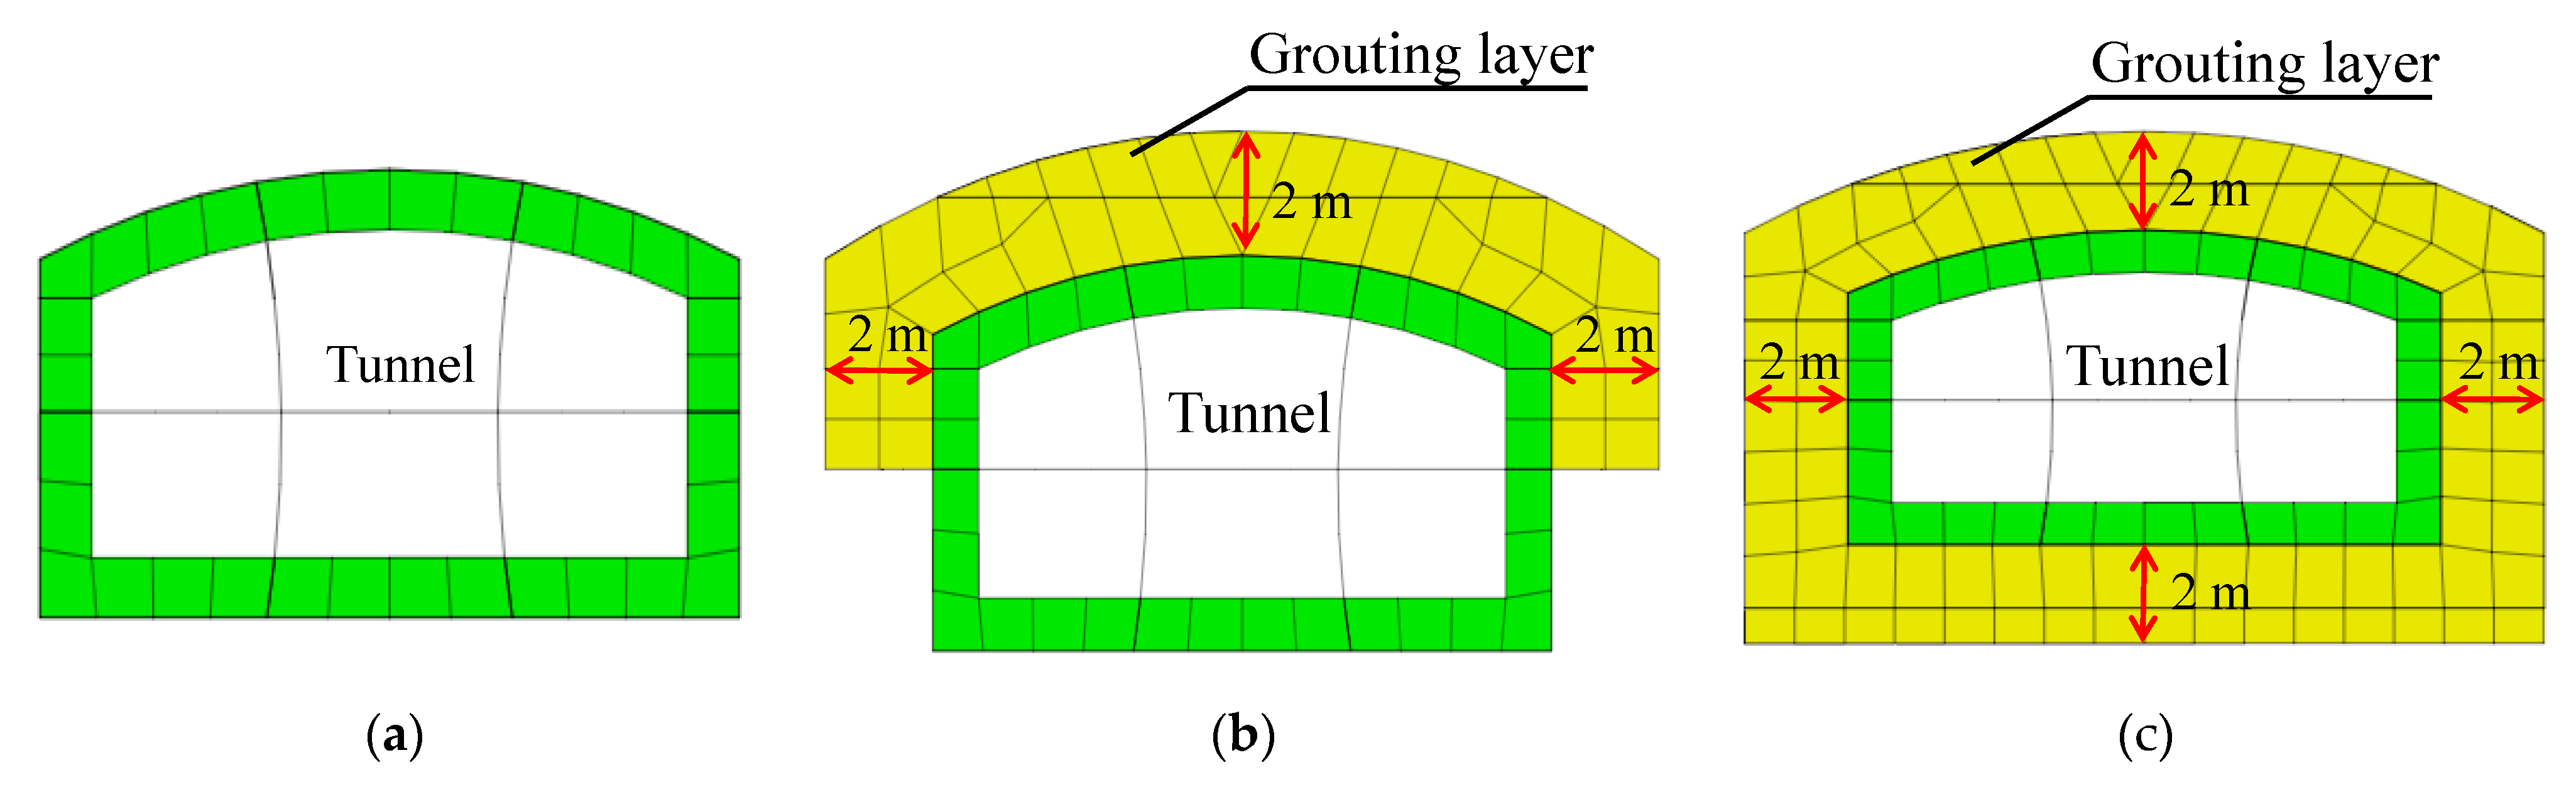
Among these schemes, Scheme 1 was used as a basic safety control scheme to compare different working conditions. In Schemes 1–3, the influences of three different types of grouting reinforcement areas on the deformation of gas pipelines were primarily investigated, with the types of grouting reinforcement areas shown in Figure 8. The influences of four different ranges of grouting reinforcement on the deformation of gas pipelines were primarily studied in Schemes 1 and 4–6. Also, the influences of four different tunnel excavation steps on the deformation of gas pipelines were investigated in Schemes 1 and 7–9, with the schematic diagram of excavation steps shown in Figure 9.
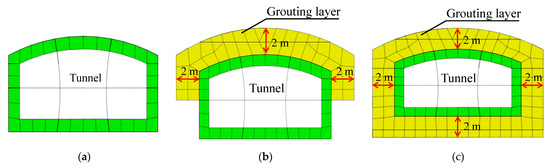
Figure 8.
Grouting reinforcement form. (a) Without grouting; (b) upper semi-section grouting; and (c) full-section grouting.
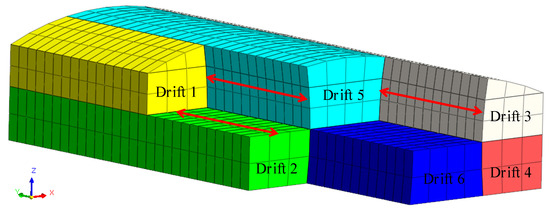
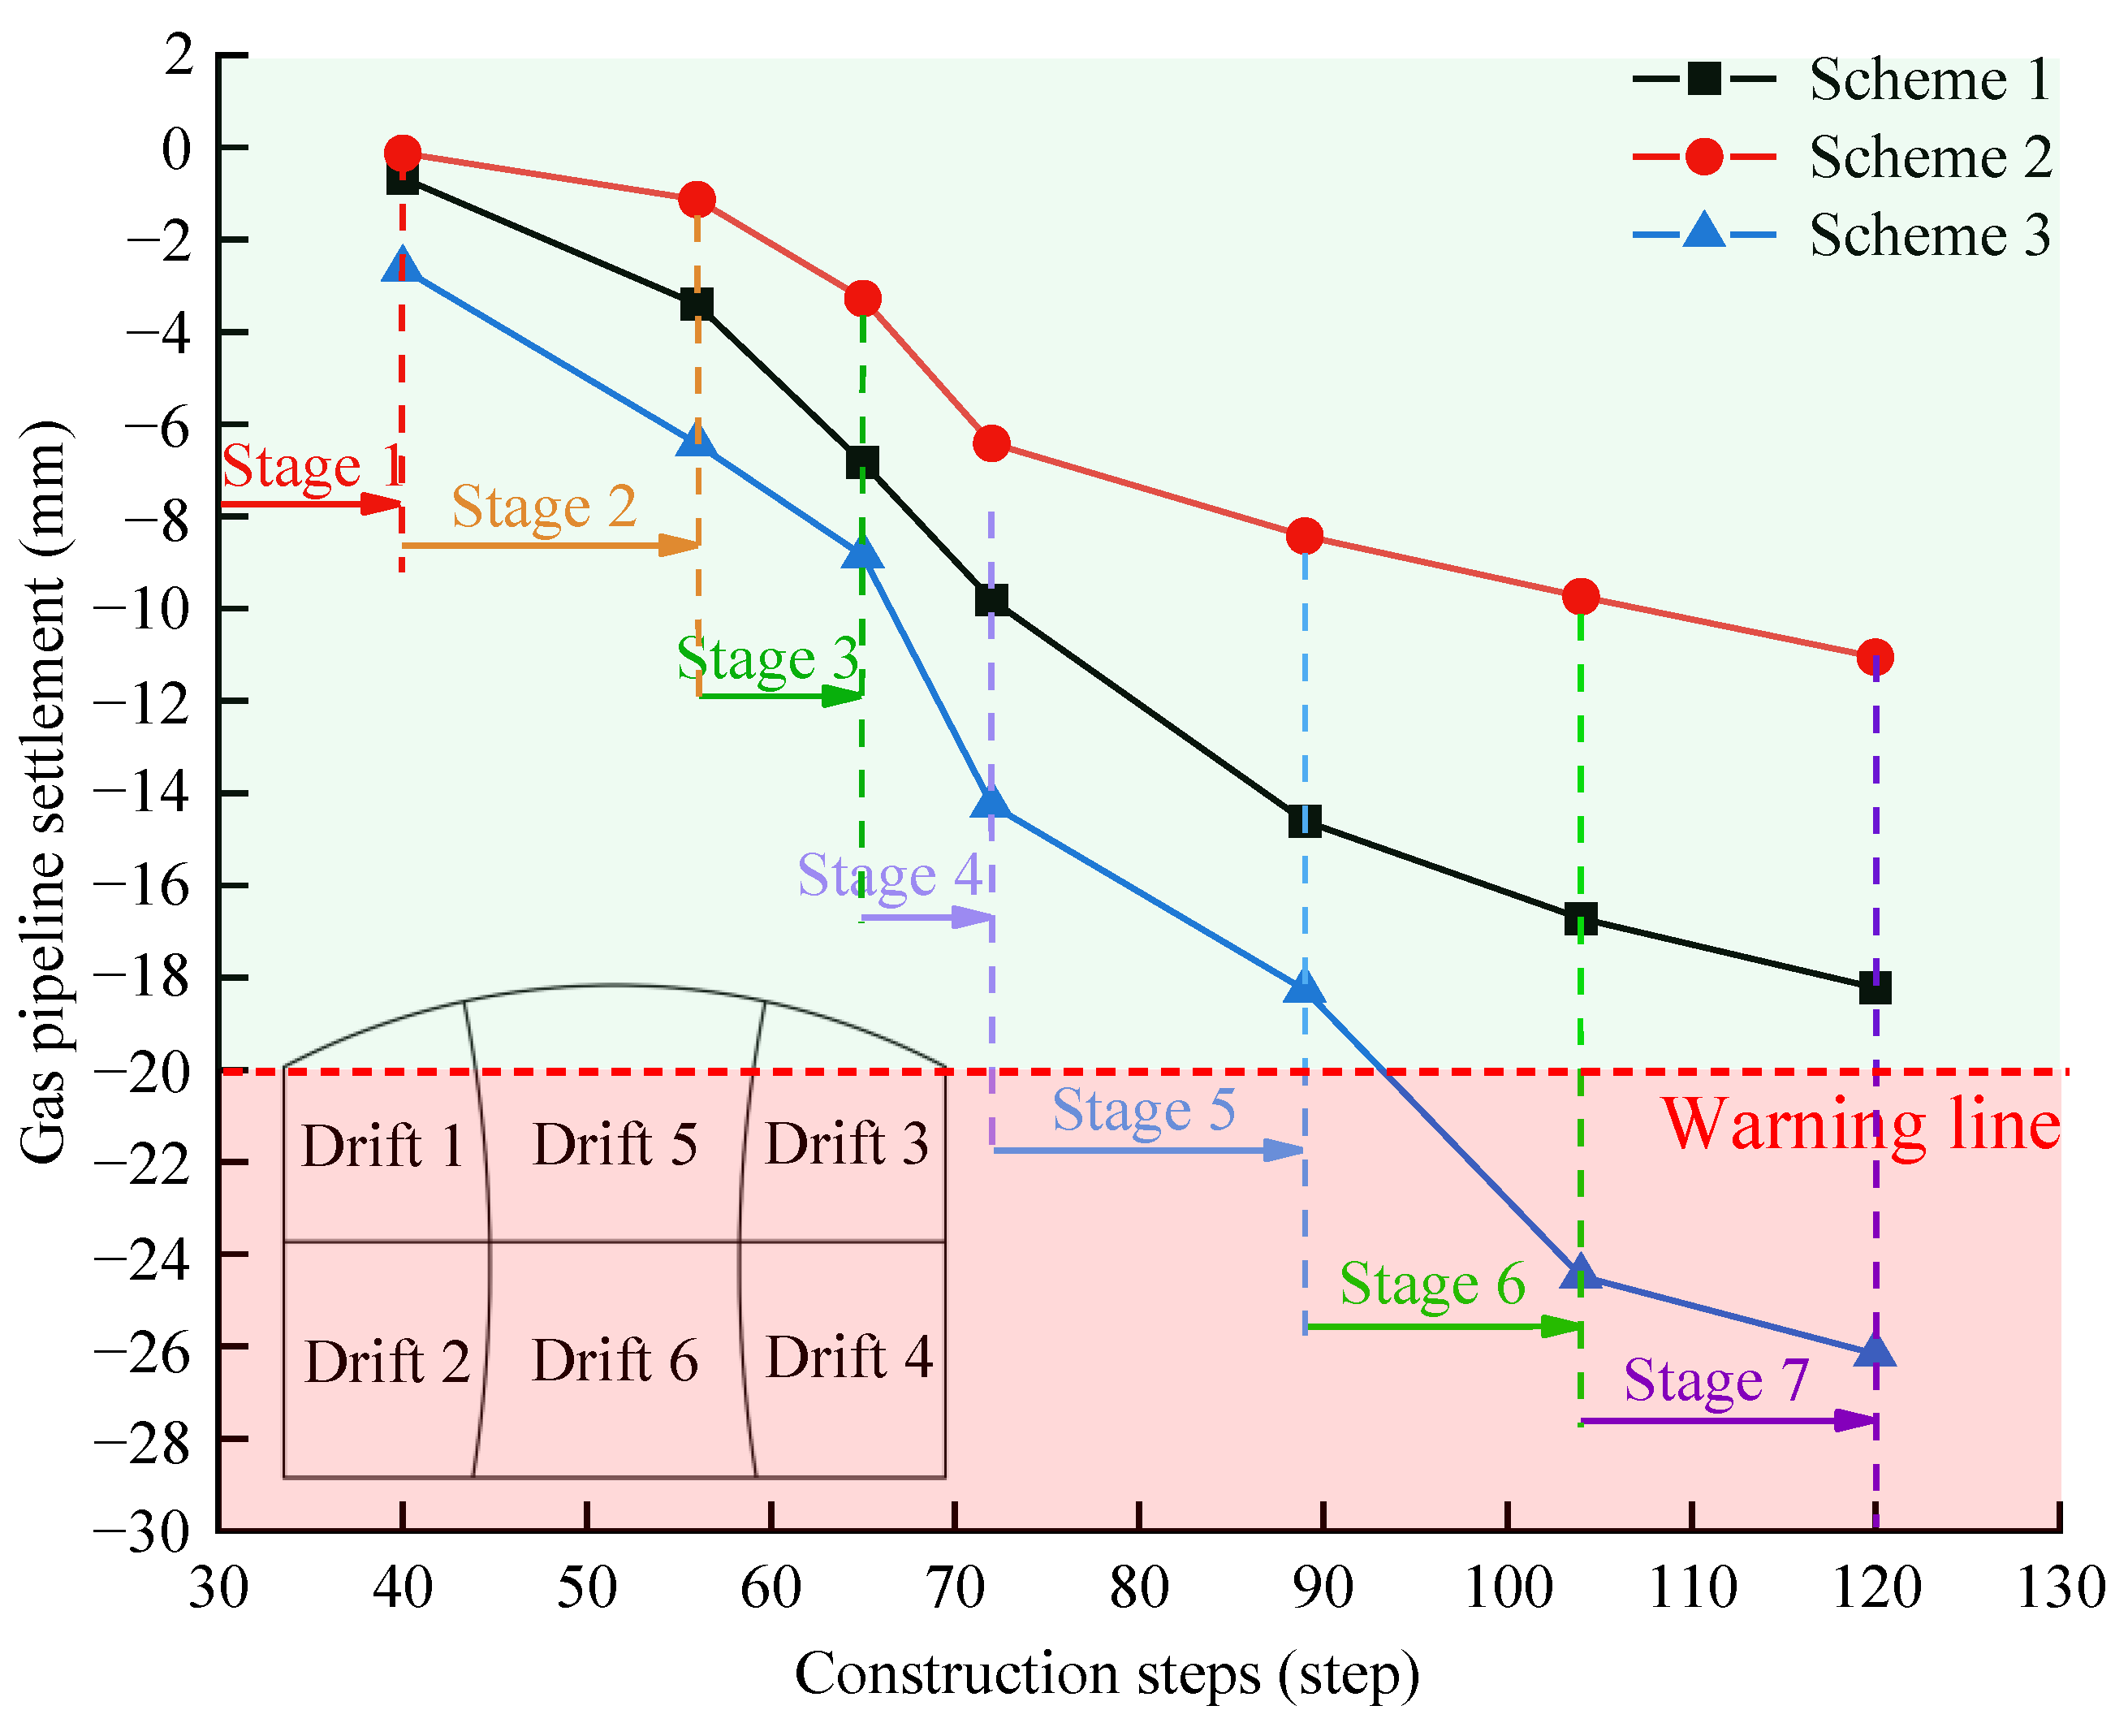
Figure 9.
Diagram of excavation steps.
3.3. Control Indexes
According to the Code for Risk Management of Underground Works in Urban Rail Transit (GB 50652-2011) and the Code for Design of City Gas Engineering (GB 50028-2006) [27,28], in this paper, the accumulated control values of tunnel vault settlement and gas pipeline settlement were set at 30 mm and 20 mm, respectively.
3.4. Results of Numerical Simulation
3.4.1. Types of Grouting Reinforcement
The settlement trough curves of the gas pipeline under different working conditions of grouting reinforcement are shown in Figure 10. Also, the fitted settlement trough parameters of the gas pipeline are listed in Table 4. The results of the numerical simulation show that the type of grouting reinforcement has a significant influence on the settlement of underground pipelines. Under a full-section grouting type, the maximum settlement, offset, and settlement trough width of the gas pipeline reach their smallest values. The settlement of gas pipelines under the schemes of full-section grouting and upper semi-section grouting reach the values of 11.06 mm and 18.23 mm, respectively, with the latter being 39% higher than the former. With no grouting reinforcement, the maximum settlement of the gas pipeline reaches a value of 26.17 mm. The difference between the fitted value of gas pipeline settlement through the modified Peck formula and the numerical simulation results has a maximum value of 1.54 mm. It is worth noting that because pilot tunnels at the left side were excavated first, the maximum settlement of the gas pipeline tends to appear at the left side of the center line of the straight-wall arch tunnel.
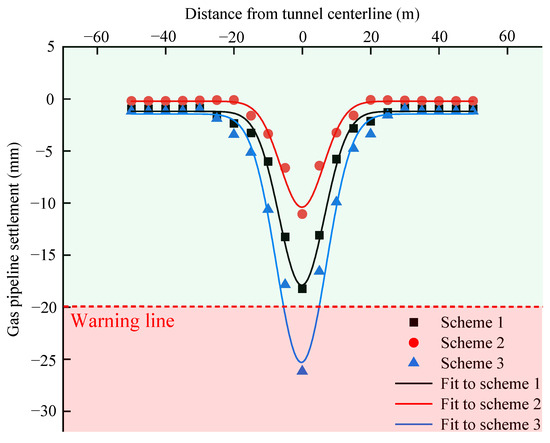
Figure 10.
Settlement trough curves of gas pipeline under different grouting reinforcement types.
Table 4.
Settlement trough parameters of gas pipeline under different grouting reinforcement types.
The development of gas pipeline settlement under different grouting reinforcement types is shown in Figure 11. Tunnel grouting reinforcement can effectively control the settlement of the overlying gas pipeline, with the effect of full-section grouting being superior to the effect of upper semi-section grouting. After the grouting reinforcement, gaps in soil masses can be filled, and the strength of soil masses can be improved, thus reducing the stratum settlement caused by tunnel construction. The upper semi-section grouting reinforcement scheme proposed field can effectively control the settlement of the gas pipeline and save time and materials compared with the full-section grouting reinforcement scheme. Therefore, it is appropriate to employ this scheme for field construction.
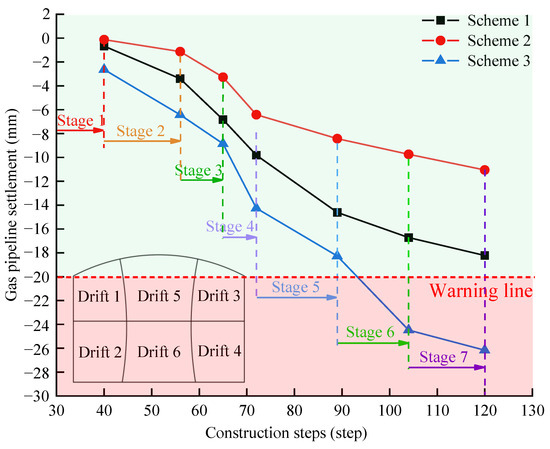
Figure 11.
The development of gas pipeline settlement.
3.4.2. Grouting Reinforcement Range
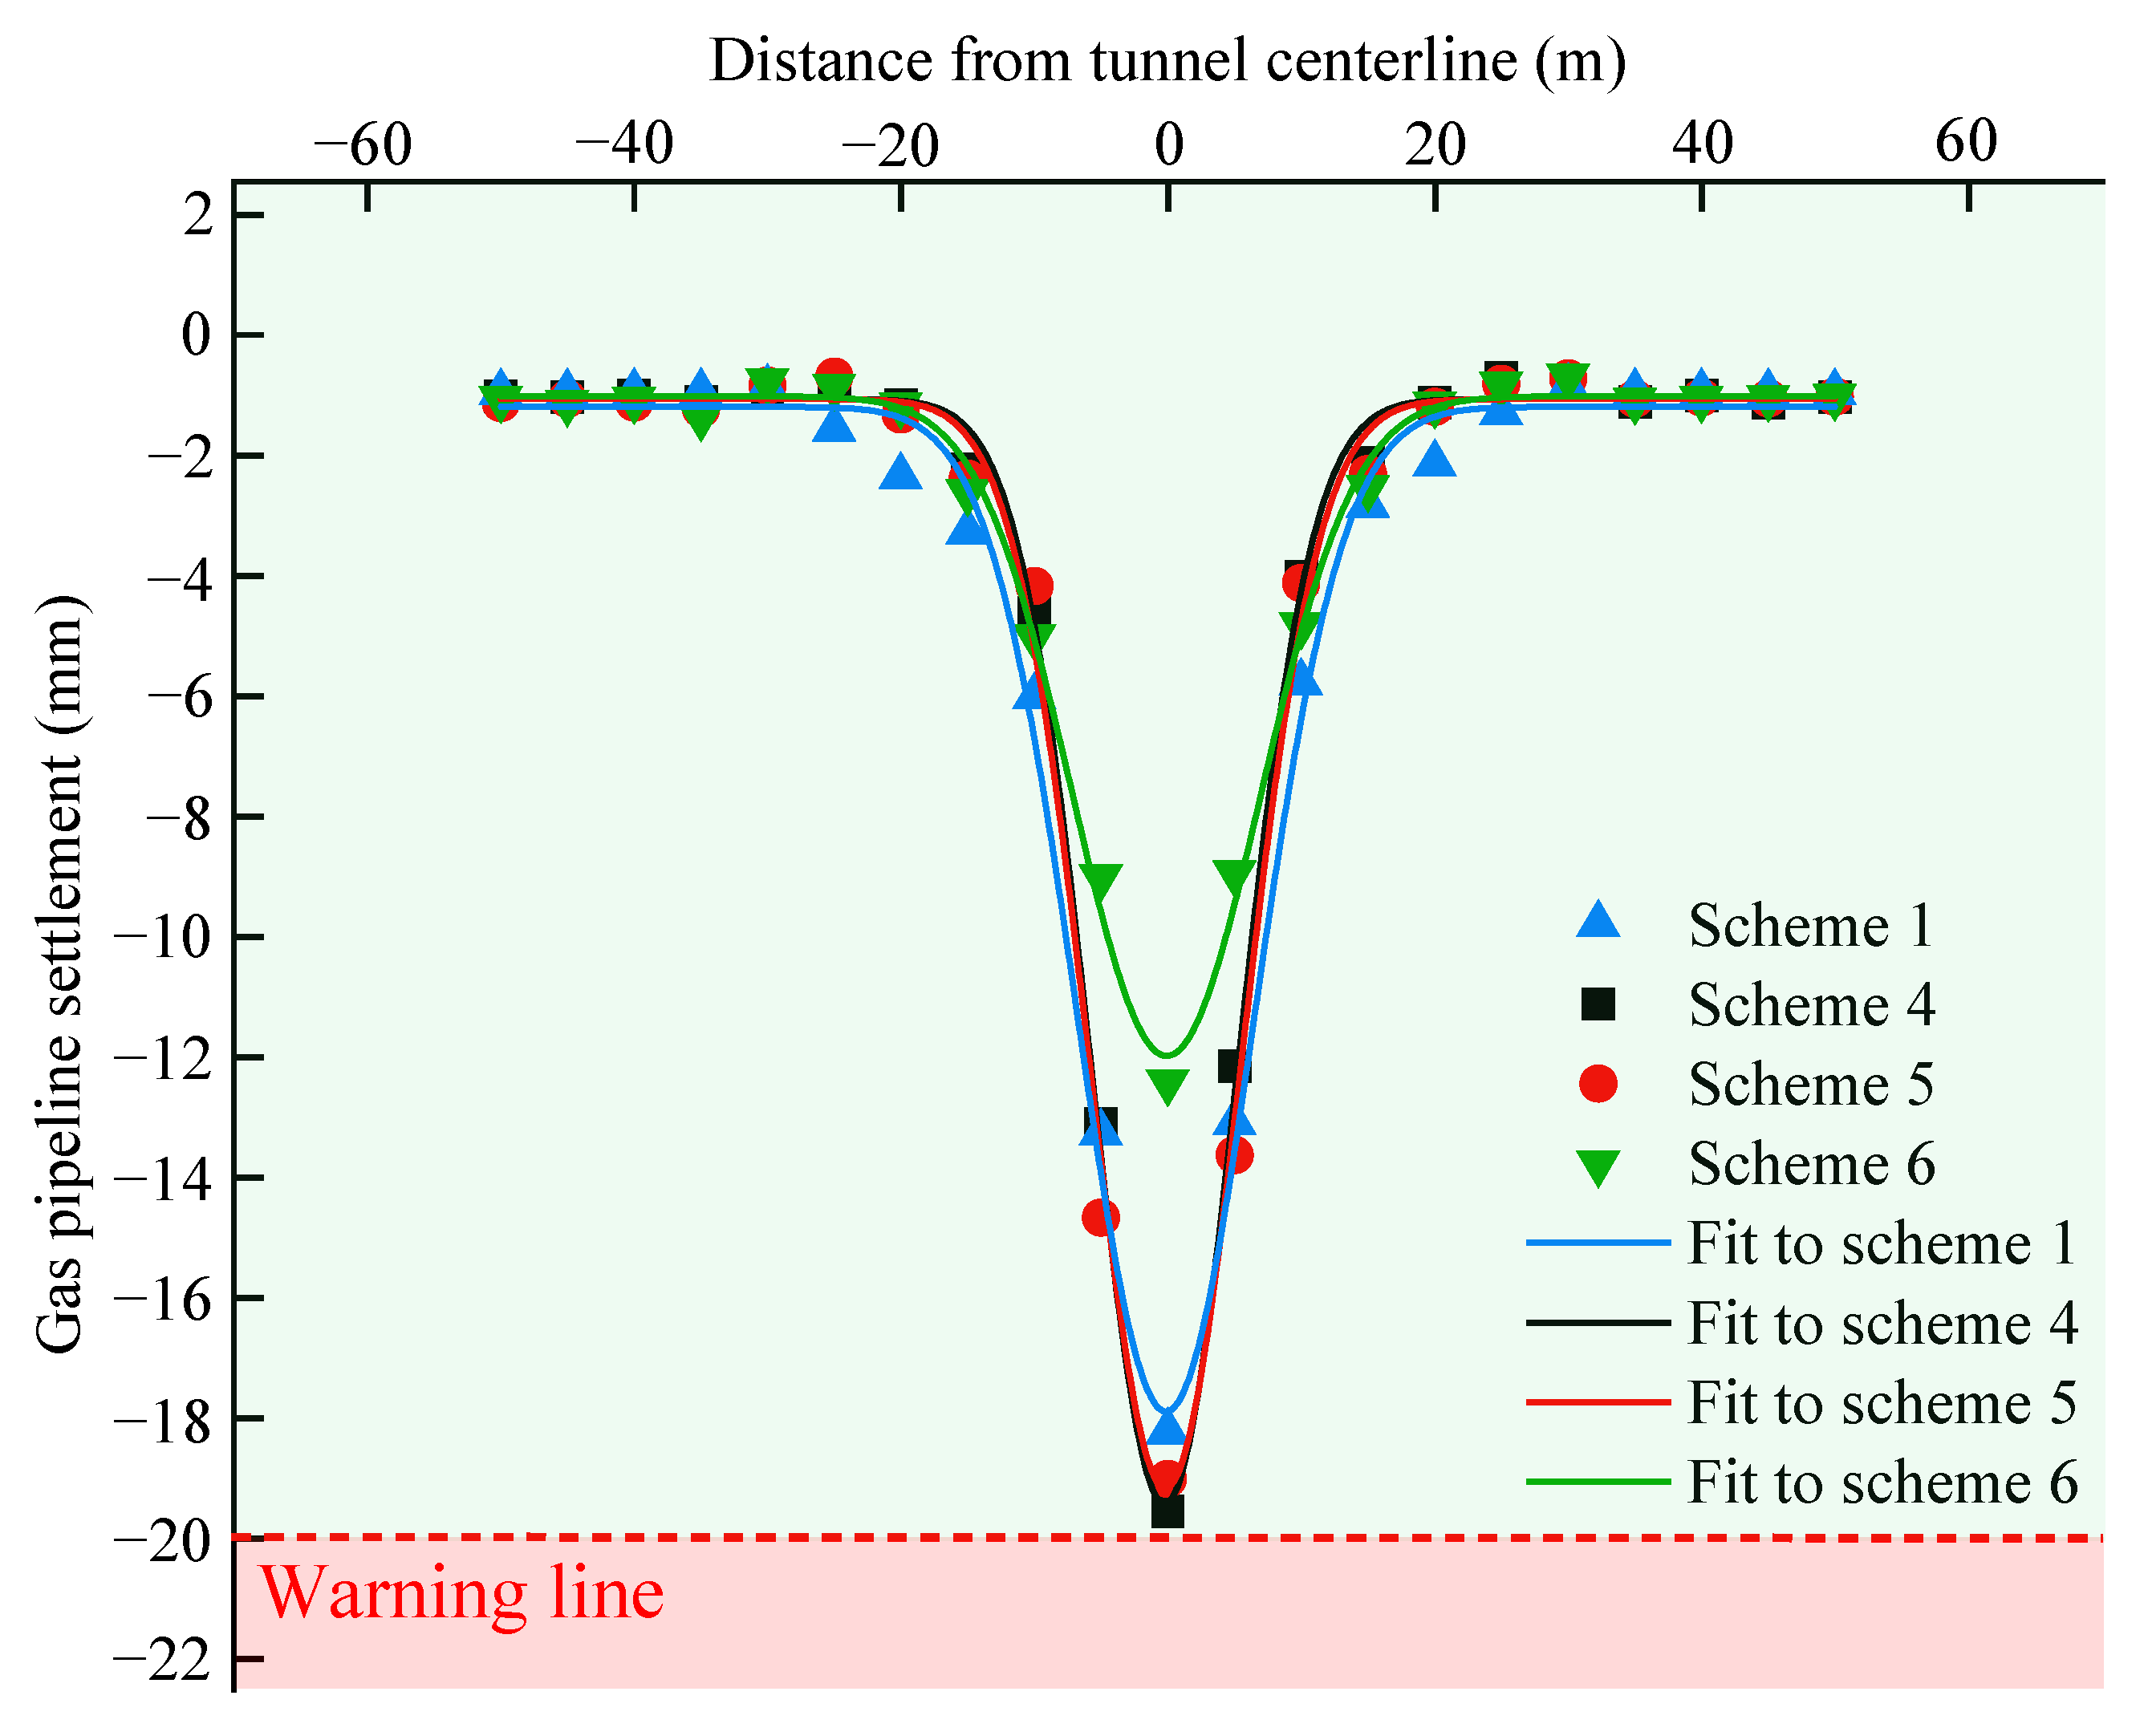
When the upper semi-section grouting reinforcement is applied on site, its range will also have a certain influence on the settlement of the gas pipeline. With the consideration that there is a vertical distance of 2.69 m between the primary support and the gas pipeline, the maximum grouting range was set at 2.5 m. Figure 12 shows the settlement trough curves of the gas pipeline under working conditions with different grouting reinforcement ranges. Also, the fitted settlement trough parameters of the gas pipeline are listed in Table 5. With the increase in grouting range, the maximum value of gas pipeline settlement gradually decreased, with a decreasing value of gas pipeline offset and an increasing width of settlement trough. With the grouting range increased from 1.0 m to 2.0 m, the maximum value of gas pipeline settlement, which is close to 20 mm, changed slightly. When the grouting range was increased to 2.5 m, the value of gas pipeline settlement dropped to 12.41 mm. There will be an optimal control effect under a grouting range of 2.5 m. However, because the grouting area is too close to the gas pipeline, grouting construction could have some impact on the gas pipeline. Therefore, a final decision was made on site that grouting should be carried out within an outward range with a 2.0 m distance from the outer contour line of the tunnel.
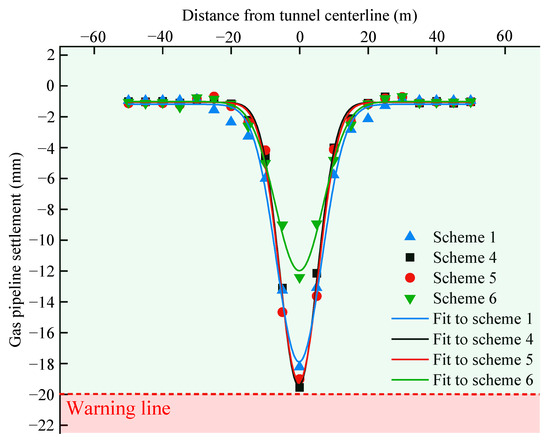
Figure 12.
Settlement trough curves of gas pipeline under different grouting reinforcement ranges.
Table 5.
Settlement trough parameters of gas pipeline under different grouting reinforcement ranges.
3.4.3. Step Distance of Tunnel Excavation
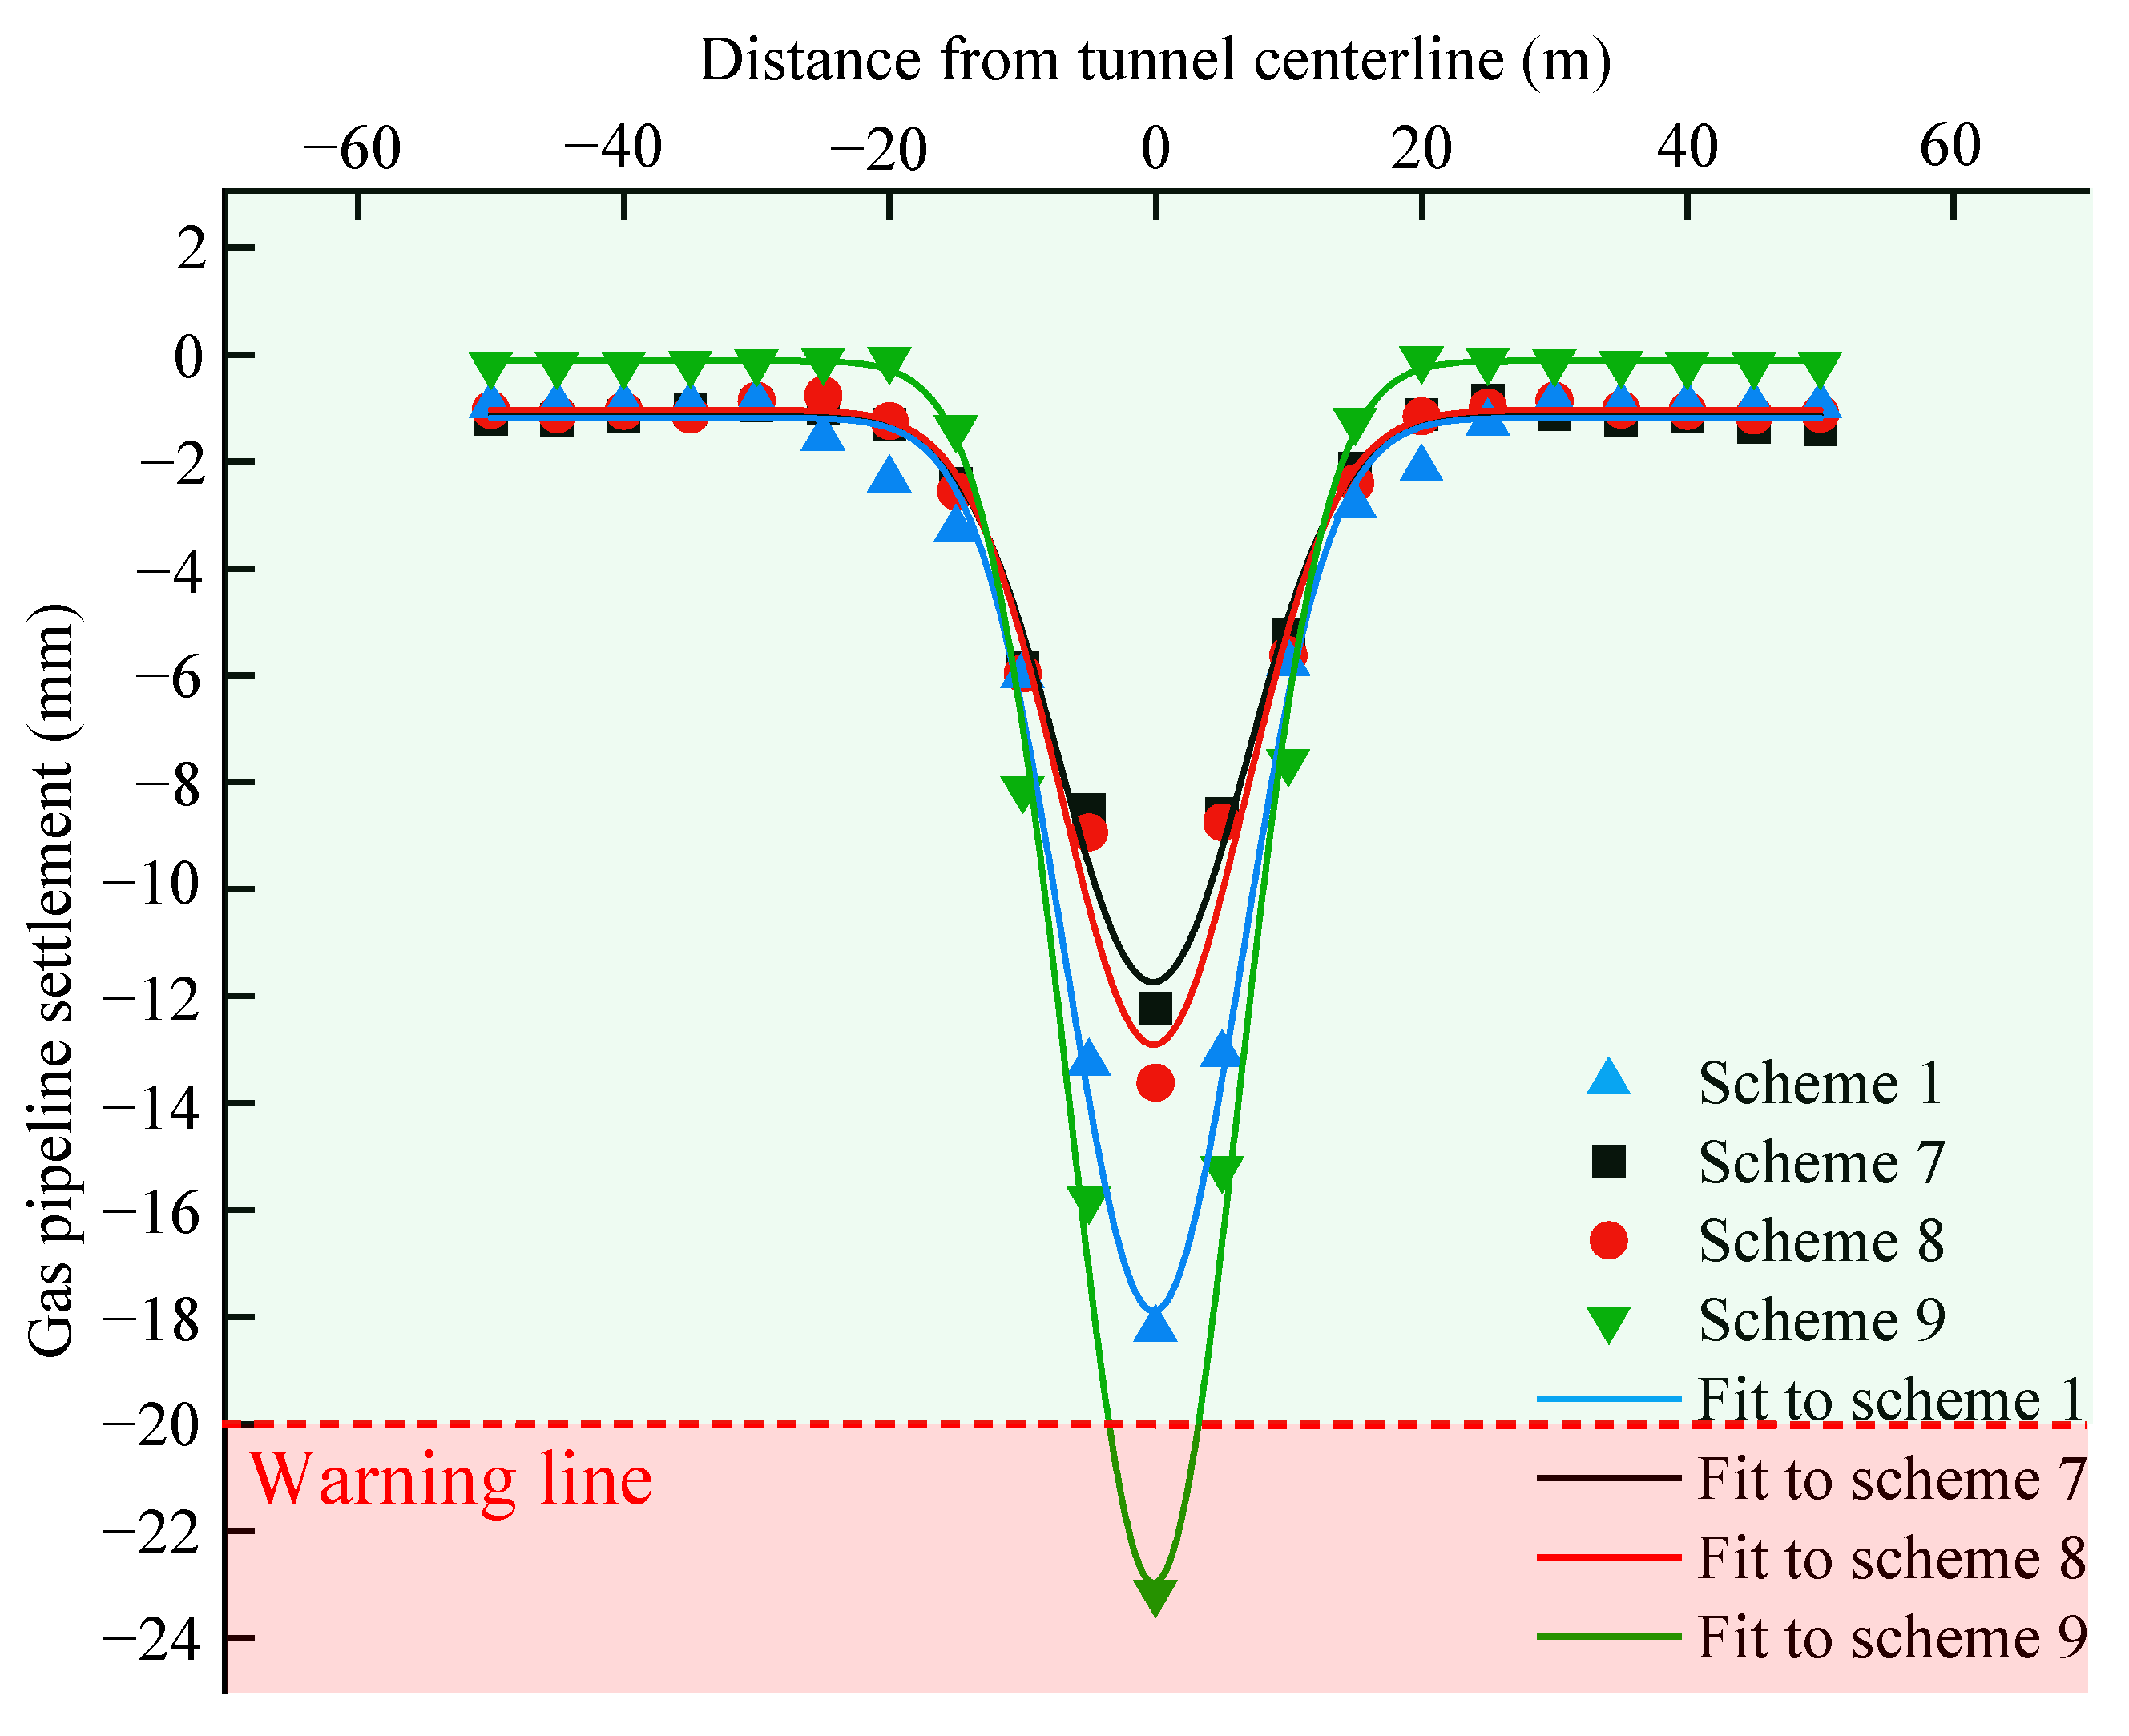
Figure 13 shows the settlement trough curves of the gas pipeline under different step distances of tunnel excavation. Also, the fitted settlement trough parameters of the gas pipeline are listed in Table 6. The maximum settlement value of the gas pipeline increases with the step distance of tunnel excavation. With a relatively large step distance of tunnel excavation, failing to close the tunnel lining promptly will result in intensified settlement of the upper soil mass, which in turn leads to increased pipeline settlement. Under tunnel excavation step distances of 2 m and 4 m, the maximum settlement of the gas pipeline reaches values of 12.23 mm and 13.62 mm, respectively. Under tunnel excavation step distances of 6m and 8m, the maximum pipeline settlement reaches values of 18.23 mm and 23.16 mm, respectively, representing a large increase compared with the maximum pipeline settlement under working conditions of excavation step distances of 2 m and 4 m. The fitted maximum settlement values of the gas pipeline are relatively close to the simulation results. However, there is no great change in the width of the settlement trough. In order to control the settlement of the gas pipeline reasonably, in the actual construction, a step distance of 6m was selected for tunnel excavation.
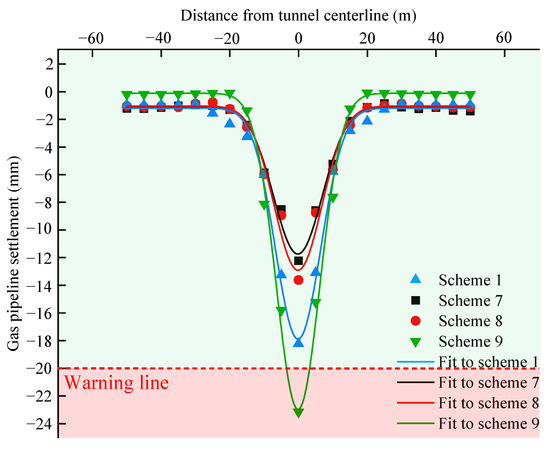
Figure 13.
Settlement trough curves of the gas pipeline under different step distances of tunneling.
Table 6.
Settlement trough parameters of gas pipeline under different step distances of tunneling.
4. Field Monitoring Data Analysis
4.1. Field Monitoring Scheme
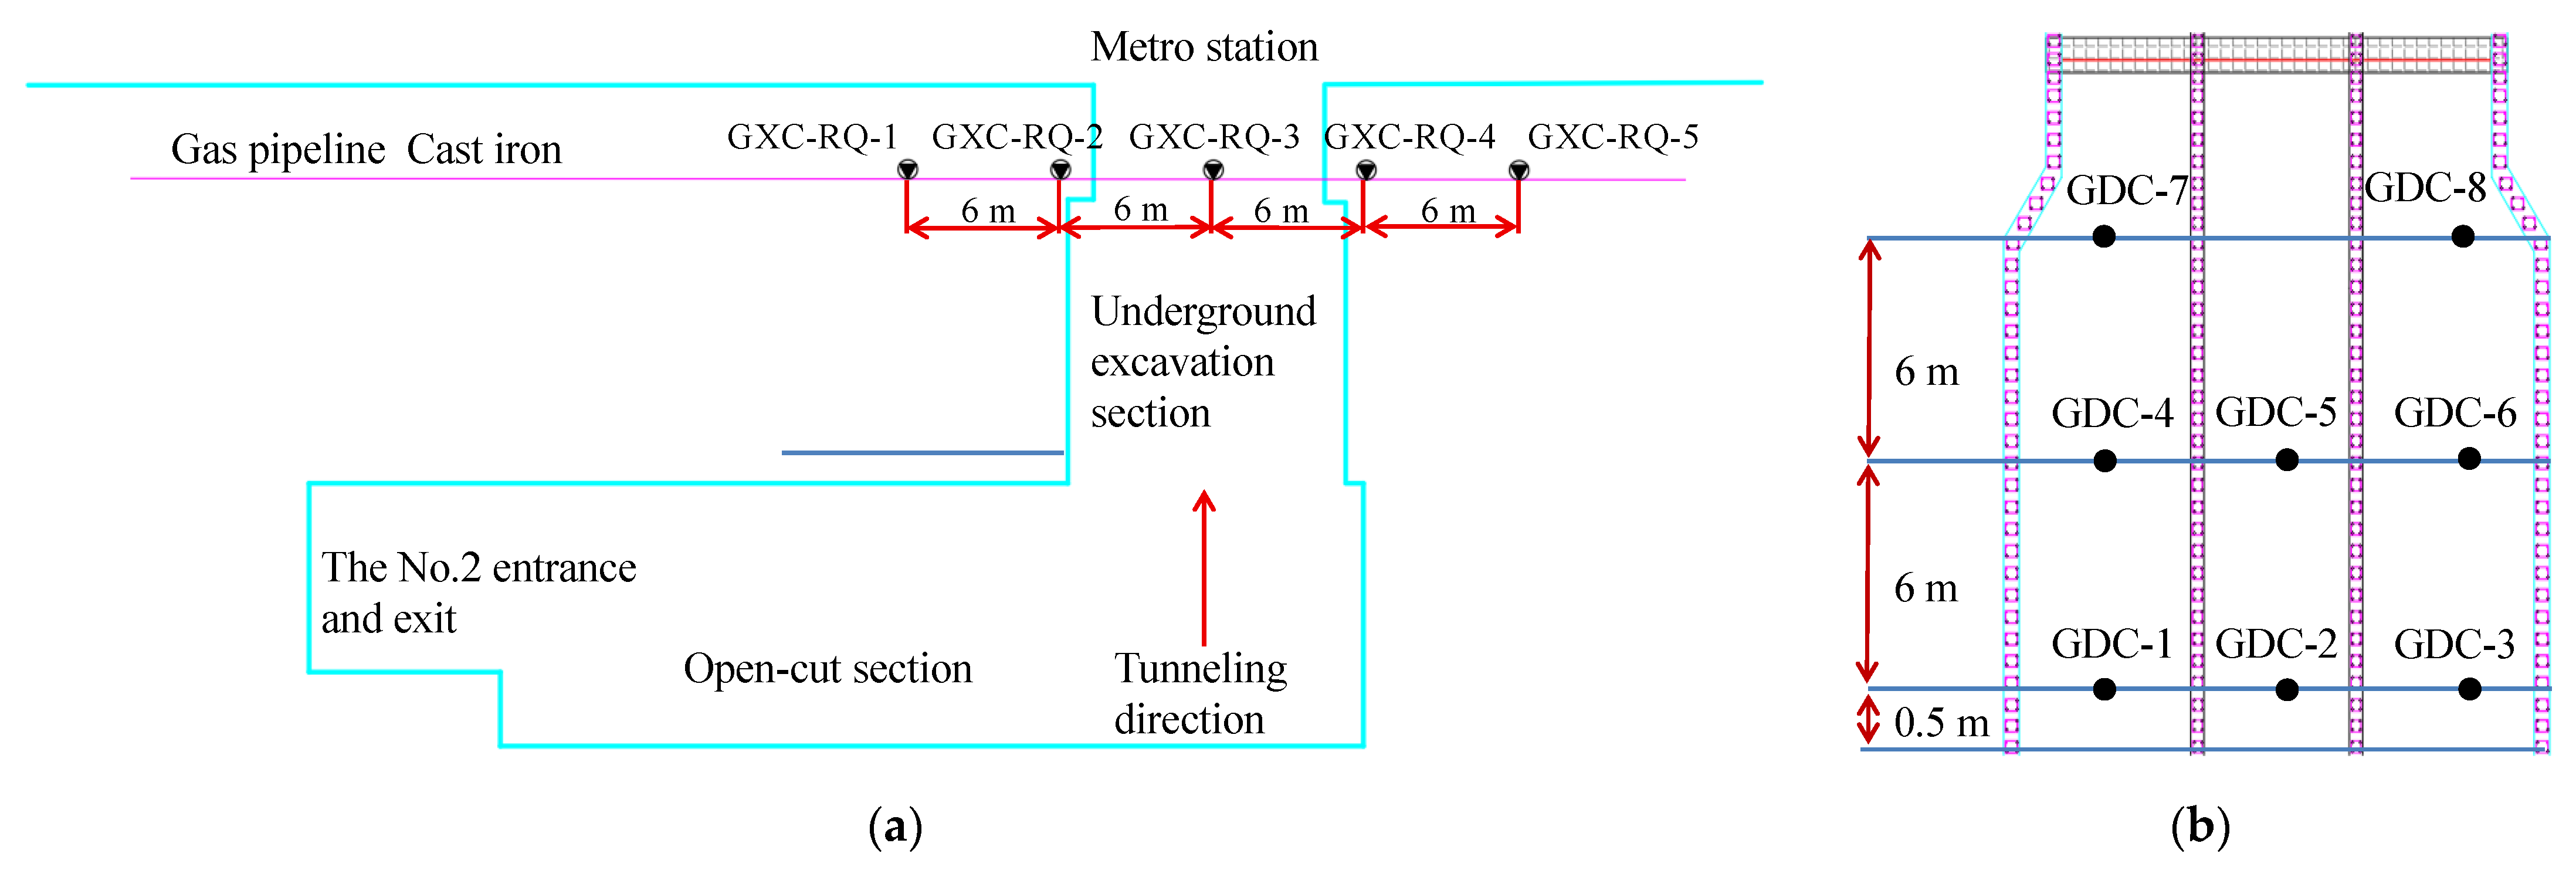
Figure 14 shows the arrangement of the field measuring points. A total of eight measuring points were arranged in the tunnel, with two rows of measuring points arranged in the expanded section and three measuring points arranged in each section. There were three monitoring sections, which were 0.5 m, 6.5 m, and 12.5 m away from the entrance section of the tunnel. The measuring points of the gas pipeline are represented with the letter “R”, and the measuring points of the vault settlement of the underground excavation tunnel are represented with the letter “G”. The uplift and settlement of the gas pipeline and tunnel vault are represented with the positive and negative values of their vertical displacements, respectively. When the horizontal distance (L) between the tunnel surface and monitoring points is less than 2B, measure once every two days. When L is greater than 2B and less than 5B, measure once every two days. B is the width of the tunnel.
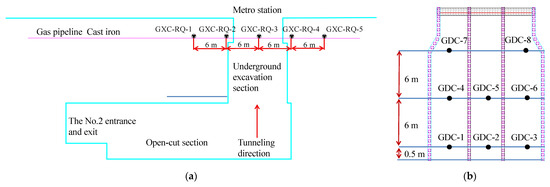
Figure 14.
Layout of field measuring points. (a) Gas pipeline, and (b) straight-sided arch tunnel.
4.2. Analysis of Monitoring Results
4.2.1. Gas Pipeline Settlement
Figure 15 shows the settlement duration curve of the gas pipeline. Settlement is the primary movement pattern of the gas pipeline, with the largest settlement of the gas pipeline measured at the measuring point GXC-RQ2-03, directly above the No. 5 pilot tunnel. When the No. 1 and No. 2 pilot tunnels were connected on 17 May, the maximum settlement of the gas pipeline was measured at 3.66 mm. When the No. 3 and No. 4 pilot tunnels on the right side were connected on 1 June, an increase in the settlement of the gas pipeline on the upper right side of the tunnel was witnessed. When the No. 5 and No. 6 pilot tunnels were connected on 14 June, there was a significant settlement of the overlying pipeline caused by the soil mass excavation in the middle of the straight-wall arch tunnel. When the middle partition wall was demolished and the secondary lining structure was constructed on 21 July, the settlement of the gas pipeline increased greatly.
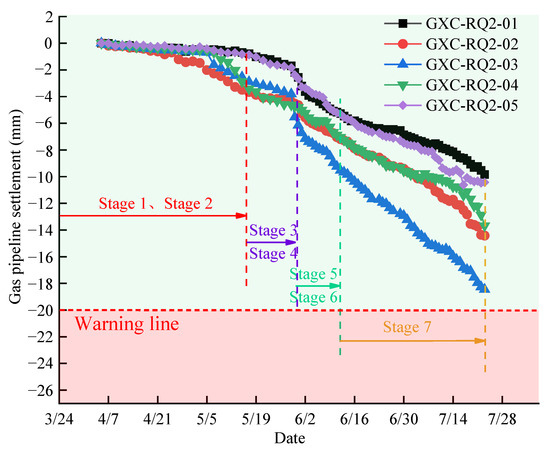
Figure 15.
Settlement duration curve of the gas pipeline.
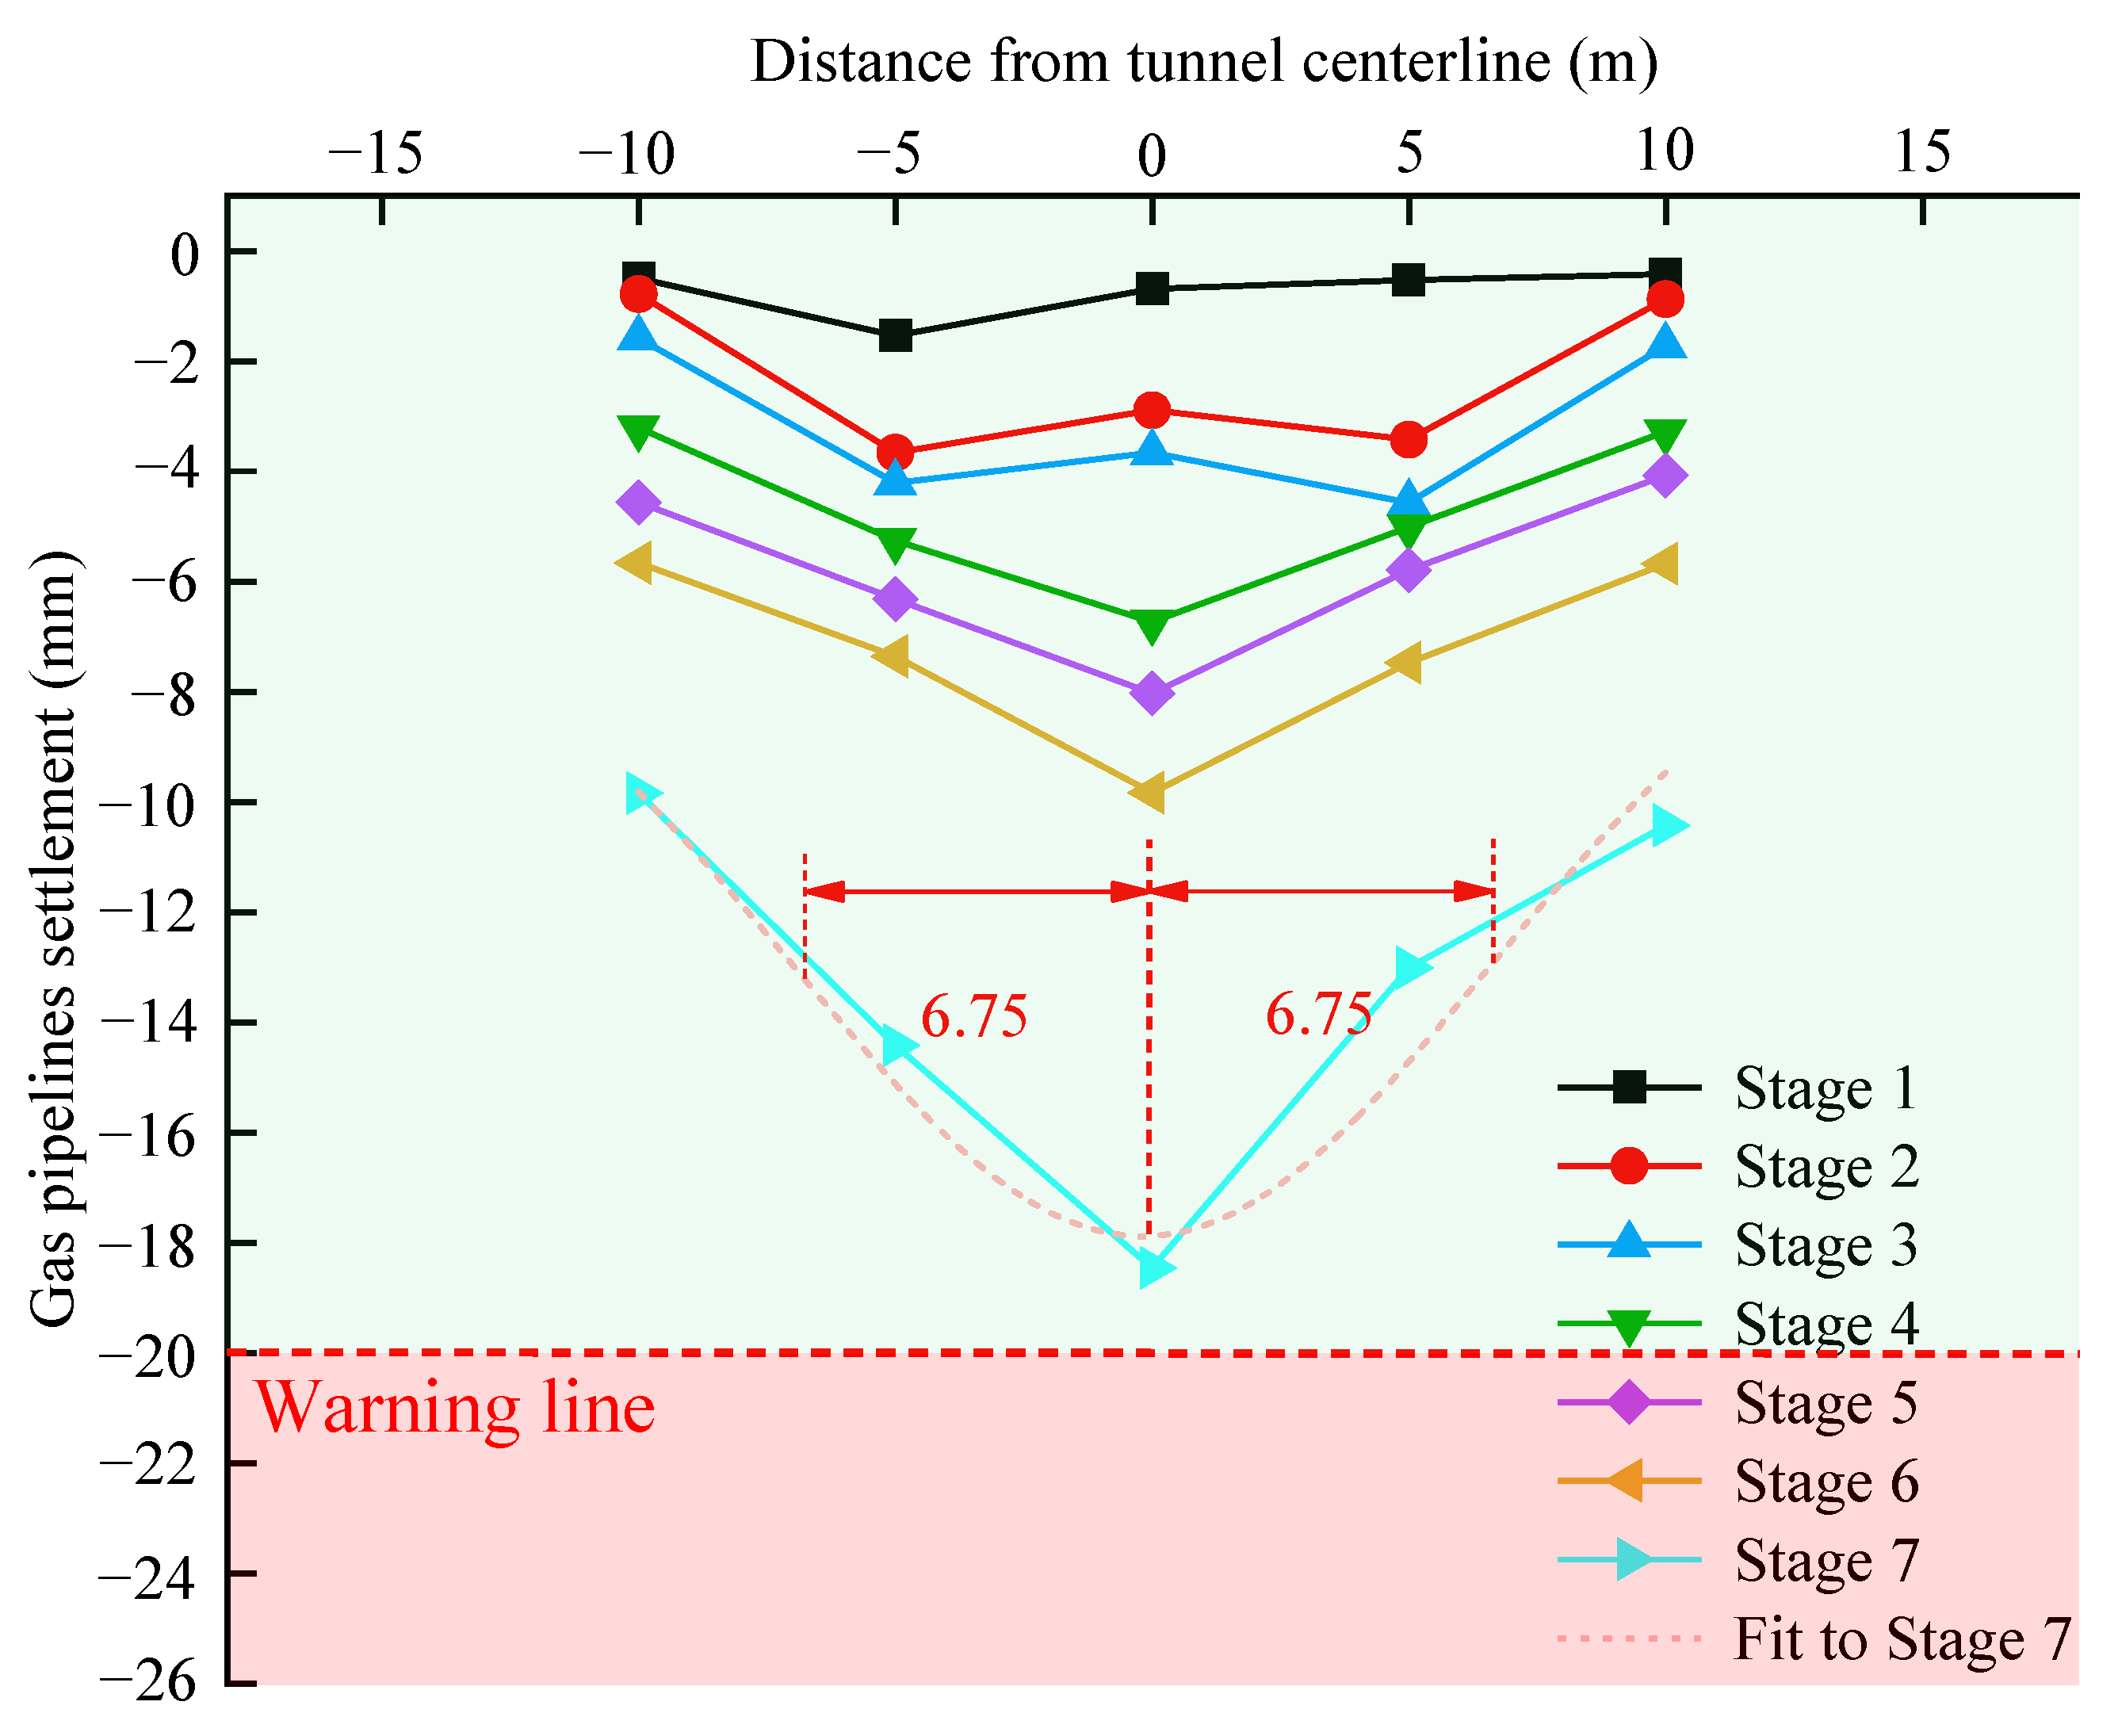
Figure 16 shows the cross-sectional settlement trough of the gas pipeline.
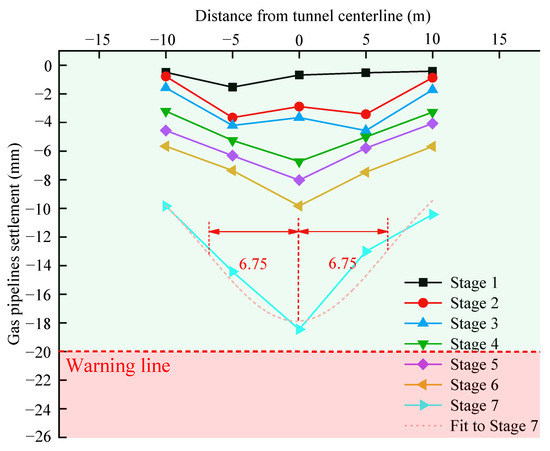
Figure 16.
Cross-sectional settlement trough of the gas pipeline.
After the connection of the No. 1 and No. 2 pilot tunnels, a relatively large settlement appeared on the left side of the gas pipeline, with a relatively small settlement occurring on the right side of the pipeline. With the penetration of the No. 3 pilot tunnel, a significant settlement emerged on the right side of the gas pipeline, which is caused by the upper excavation of soil mass on the right side of the tunnel. However, the soil mass in the middle of the tunnel was not excavated. Therefore, the pipeline settlement at the tunnel vault was slightly less than that settlement on both sides of the tunnel, with the pipeline deformation presenting a “W-like” pattern. After the penetration of the No. 4 pilot tunnel, there appeared continuous settlement on the right side of the pipeline. Also, with some construction having been performed on the soil mass in the middle section of the tunnel, there was an apparent settlement of the middle pipeline. At this time, although the overall deformation of the pipeline still exhibited a “W-like” pattern, it presented a more symmetrical shape than that shape at the previous stage. After the penetration of the No. 5 pilot tunnel, a significant increase in settlement was witnessed in the middle of the pipeline. At this time, the pipeline deformation presented a “V-like” pattern, with a maximum settlement value of 8.03 mm, which accounts for 43.5% of the final settlement value. The reason lies in that, with the excavation of the upper soil mass in the middle of the tunnel, some soil mass support at the tunnel vault was lost, and settlement emerged at the primary support undergoing relatively large loading of surrounding rocks, thus further leading to increased settlement in the middle of the pipeline. With the penetration of the No.6 pilot tunnel, on the basis of the settlement at the previous stage, the pipeline settlement continuously increased, with a maximum settlement value of 9.83 mm, accounting for 53.2% of the value of the final settlement. When the temporary middle partition wall in the tunnel was demolished, and the secondary lining structure was constructed, the pipeline settlement reached a value of 18.46 mm. This is because when the support of the tunnel was removed, the overall structural stiffness of the tunnel dropped, thus resulting in the great settlement of the whole tunnel structure and the upper part of the gas pipeline. At this time, the settlement of the pipeline reached its maximum value, which is less than the deformation control value of 20 mm. Therefore, the influence of the crossing construction of the newly built underground excavation tunnel at the No. 2 entrance and exit of the subway station on the deformation of the existing gas pipeline is within a safe and controllable range. However, it is worth noting that the final pipeline settlement after the completion of the construction is close to the standard of safety control. Therefore, it is suggested that construction quality should be vigorously controlled during the construction process to minimize the impact of human factors on pipeline safety. The width of the transverse settlement trough (L) could be determined according to the Peck formula. i represents the width coefficient of the gas pipeline settlement trough. L is about six times i. Based on the measured data the pipeline settlement trough width coefficient (i) is 6.75 m in the nonlinear fitting. The width of the affected settlement zone (6i) is 40.5 m.
4.2.2. Settlement of Tunnel Vault
Figure 17 shows the settlement duration curve of the vault of a straight-wall arch tunnel. At the early stage of the straight-wall arch tunnel, a slight settlement appeared at the tunnel vault, indicating a slight disturbance in the construction on the soil mass. With the penetration of the No. 2 pilot tunnel on 16 May, significant increases in the vault settlement at the measuring points GDC-1 and GDC-2 were witnessed. When the No. 3 and No. 4 pilot tunnels were connected on June 1st, the vault settlement values of the tunnel fell into a range of 5.3 mm to 11.7 mm. When the No. 5 and No. 6 pilot tunnels were connected on 14 June, continuously increased settlement was witnessed at the tunnel vault, with a maximum settlement value of 14.82 mm there. When the secondary lining structure was constructed on 21 July, significant settlement appeared at the tunnel vault, with the vault settlement during this stage accounting for around 35.1% of the total settlement. Also, the largest settlement was measured at the measuring point GDC-5. The reason lies in that, with the temporary middle partition wall demolished, the tunnel vault lost its support, and the secondary lining structure in the middle of the tunnel did not reach its expected strength. Meanwhile, the measured maximum value of tunnel vault settlement is 22.84 mm, which is less than the specified value of 30 mm according to the control standard of tunnel vault deformation.
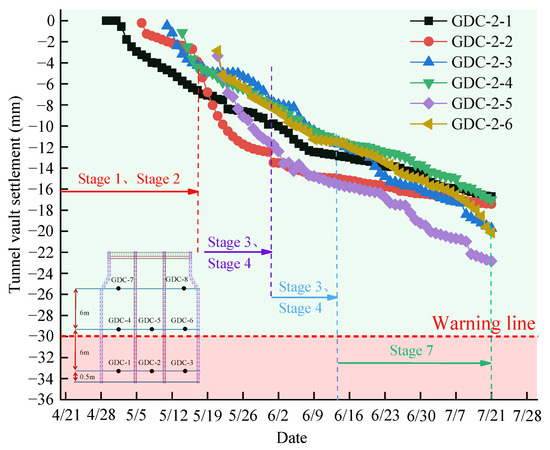
Figure 17.
Settlement duration curve of the vault.
4.3. Comparison of Simulation and Measurement Results
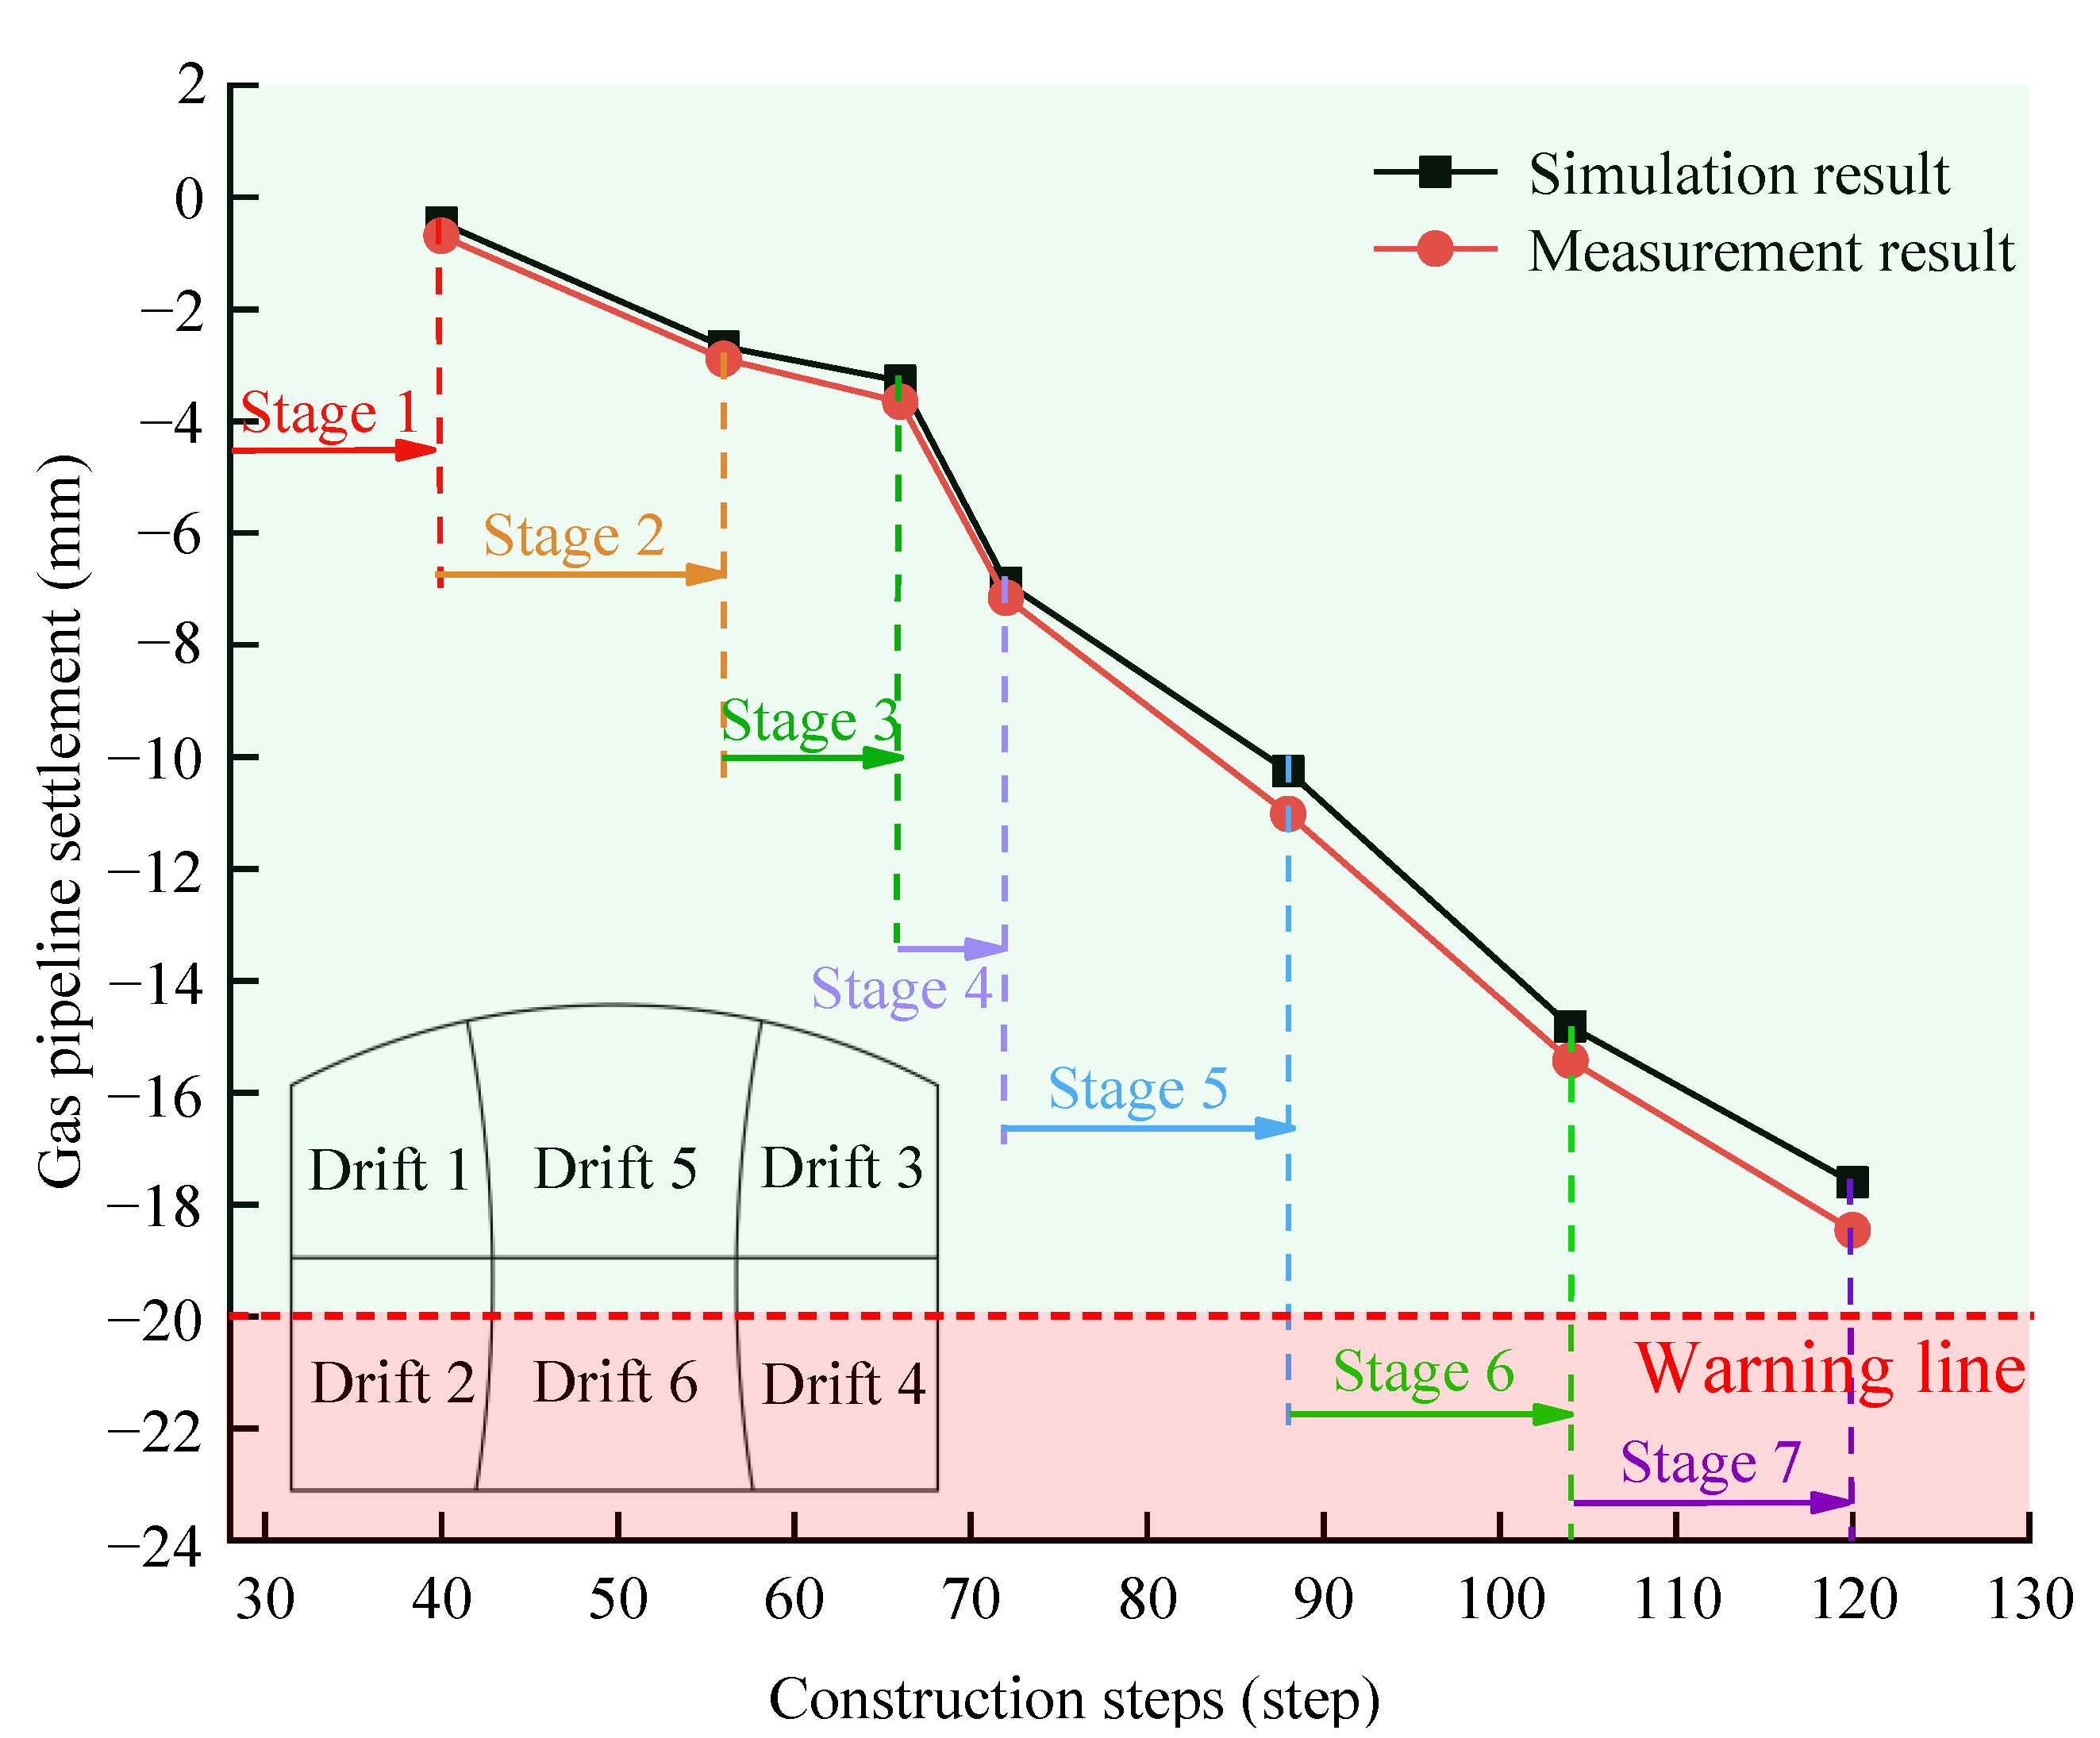
The measured value of the final settlement of the tunnel vault measuring point GDC-2-2 is 17.42 mm, while the simulated value is 15.68 mm, a difference of 10%. The measured value of the final settlement of the measuring point GDC-2-5 is 22.84 mm, and the simulated value is 21.86 mm, with a difference of 4.3%. Figure 18 shows the comparison of simulated and measured settlement results of the gas pipeline with the measuring point GXC-RQ-3 taken as an example. There is a good fitting degree between the two methods of numerical simulation and measured data analysis in terms of the variation pattern of gas pipeline settlement, with less than 10% differences between those values obtained through these two methods during different construction stages. The following pattern can be obtained through both numerical simulation and measured data analysis: the deformation of the gas pipeline during the construction process of a straight-wall arch tunnel crossing the underground gas pipeline at close range primarily presents a pattern of settlement, with significant pipeline settlement at the construction stages of middle pilot tunnels and secondary lining structure. In the numerical simulation, the soil layer was simplified, with an excavation step distance of 6m in each pilot tunnel and a single time of grouting reinforcement, while in the actual construction, the length of grouting reinforcement each time was 10 m. Therefore, the measured data are slightly higher than the simulated data. In the numerical simulation, the procedure of timely construction of secondary lining upon the removal of the middle partition wall with a certain length during the middle partition wall removal and secondary lining construction period was strictly followed, while in the actual construction, there was a time effect with the lagging secondary lining construction.
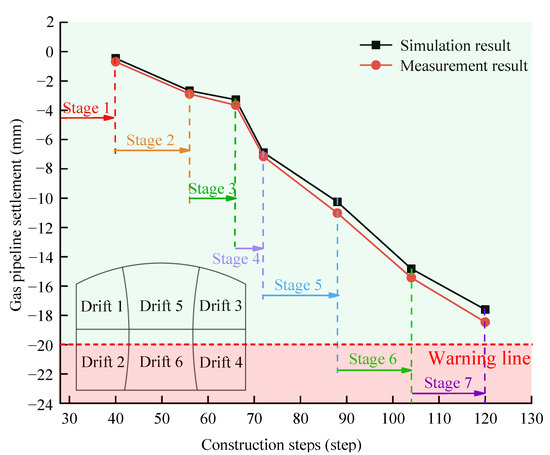
Figure 18.
Comparison between simulation and measurement.
5. Conclusions
This article is based on the No. 2 entrance and exit tunnel project of Zhongshan Road Station of the Hohhot Metro Line 2. Using the methods of numerical simulation and field monitoring, this paper has particularly investigated the influence of straight-wall arch tunnel construction, applying the pre-grouting reinforcement and double-side drift method on the deformation of existing gas pipelines. The main conclusions are as follows:
- (1)
- The application of the advanced grouting reinforcement measure is conducive to the control of gas pipeline settlement, with a broader range of grouting reinforcement bringing about a smaller settlement of the gas pipeline. Using the method of upper semi-section grouting reinforcement to prevent the grouting area from being too close to the gas pipeline, a grouting reinforcement range of 2.0 m was determined in this study, with a calculated maximum value of gas pipeline settlement being 18.23 mm.
- (2)
- The entrance and exit tunnels of the subway station are constructed with a straight-wall arch structural pattern, and the application of a double-side drift method in the construction can reduce the stress concentration of the lining, thus representing an efficient and sustainable method for tunnel construction. A smaller step distance of excavation brings about a smaller settlement of the gas pipeline. Under an excavation step distance of 8 m, the maximum settlement of the gas pipeline reached a value of 23.16 mm, which is higher than the control value. Therefore, it is appropriate to apply an excavation step distance of 6m on site.
- (3)
- With the application of the advanced grouting reinforcement method in the construction of the straight-wall arch tunnel, the use of the double-side drift method in the building of the tunnel body can effectively reduce the influence of crossing construction on the settlement of overlying gas pipeline. The measured maximum settlement of the gas pipeline reached a value of 18.46 mm, with the maximum settlement of the tunnel vault reaching a value of 22.86 mm. Both values are lower than the specified value of the control standard, indicating a successful application of the proposed deformation control measure in this project.
Author Contributions
Conceptualization, X.Z.; writing—original draft preparation, X.Z.; writing—review and editing, X.Z. and C.L.; investigation, C.L. and S.H., data curation, C.L. and S.H.; software, C.L. and S.H.; visualization, C.L.; funding acquisition, X.Z.; resources, Y.X.; supervision, Y.X.; project administration, Y.X. All authors have read and agreed to the published version of the manuscript.
Funding
This research was funded by the Program for Young Talents of Science and Technology in Universities of Inner Mongolia Autonomous Region, grant number NJYT23103 and Fundamental Research Funds for Inner Mongolia University of Science & Technology was funded by 2023QNJS159.
Data Availability Statement
All data generated or analyzed in this study are included in the published article.
Acknowledgments
The authors are grateful to China Railway 20th Bureau Group 4th Engineering Co., Ltd., China for the assistance in providing information on the project.
Conflicts of Interest
The authors declare no conflict of interest.
References
- Lin, C.G.; Huang, M.S.; Nadim, F.; Liu, Z.Q. Tunnelling-induced response of buried pipelines and their effects on ground settlements. Tunn. Undergr. Space Technol. 2020, 96, 103193. [Google Scholar] [CrossRef]
- Klar, A.; Marshall, A.M. Linear elastic tunnel pipeline interaction: The existence and consequence of volume loss equality. Geotechnique. 2015, 65, 788–792. [Google Scholar] [CrossRef]
- Klar, A.; Elkayam, I.; Marshall, A.M. Design oriented linear-equivalent approach for evaluating the effect of tunneling on pipelines. J. Geotech. Geoenviron. 2016, 142, 04015062. [Google Scholar] [CrossRef]
- Yu, J.; Zhang, C.R.; Huang, M.S. Soil–pipe interaction due to tunnelling: Assessment of Winkler modulus for underground pipelines. Comput. Geotech. 2013, 50, 17–28. [Google Scholar] [CrossRef]
- Klar, A. A Fourier-based elastic continuum solution for jointed pipeline response to tunneling. Tunn. Undergr. Space Technol. 2022, 119, 104237. [Google Scholar] [CrossRef]
- Wham, B.P.; Argyrou, C.; O’Rourke, T.D. Jointed pipeline response to tunneling-induced ground deformation. Can. Geotech. J. 2016, 53, 1794–1806. [Google Scholar] [CrossRef]
- Vorster, E.T.; Klar, A.; Soga, K.; Mair, R.J. Estimating the effects of tunneling on existing pipelines. J. Geotech. Geoenviron. 2005, 131, 1339–1440. [Google Scholar] [CrossRef]
- Ni, P.; Mangalathu, S. Fragility analysis of gray iron pipelines subjected to tunneling induced ground settlement. J. Geotech. Geoenviron. 2018, 76, 133–144. [Google Scholar] [CrossRef]
- Wang, J.Q.; An, J.T.; Zhang, S.Y.; Ge, R.Y.; Xie, Q.W.; Chen, Q.S.; Zheng, S.Z.; Ye, M.G. Numerical investigation and prediction of side-by-side tunneling effects on buried pipelines. Sustainability 2023, 15, 353. [Google Scholar] [CrossRef]
- Wang, G.; Fang, Q.; Du, J.M.; Wang, J.; Li, Q.M. Deep learning-based prediction of steady surface settlement due to shield tunnelling. Automat. Constr. 2023, 154, 105006. [Google Scholar] [CrossRef]
- Zhang, Z.G.; Huang, M.S. Boundary element model for analysis of the mechanical behavior of existing pipelines subjected to tunneling-induced deformations. Comput. Geotech. 2012, 46, 93–103. [Google Scholar] [CrossRef]
- Deng, H.S.; Fu, H.L.; Shi, Y.; Huang, Z.; Huang, Q.B. Analysis of asymmetrical deformation of surface and oblique pipeline caused by shield tunneling along curved section. Symmetry 2021, 13, 2396. [Google Scholar] [CrossRef]
- Li, W.; Zhang, C.P.; Zhang, D.L.; Ye, Z.J.; Tan, Z.B. Face stability of shield tunnels considering a kinematically admissible velocity field of soil arching. J. Rock. Mech. Geotech. 2022, 14, 505–526. [Google Scholar] [CrossRef]
- Zhang, C.P.; Han, K.H.; Zhang, D.L. Face stability analysis of shallow circular tunnels in cohesive-frictional soils. Tunn. Undergr. Space Technol. 2015, 50, 345–357. [Google Scholar] [CrossRef]
- Zhang, Z.G.; Zhang, M.X. Mechanical effects of tunneling on adjacent pipelines based on Galerkin solution and layered transfer matrix solution. Soils Found. 2013, 53, 557–568. [Google Scholar] [CrossRef]
- Shi, J.W.; Wang, Y.; Ng, W.C. Numerical parametric study of tunneling-induced joint rotation angle in jointed pipelines. Can. Geotech. J. 2016, 53, 2057–2071. [Google Scholar] [CrossRef]
- Zhao, D.P.; Wang, L.W.; Zhang, B.H.; Wen, S.X.; Li, D.; Wang, D.Y. Study on launch tunnelling parameters of a shield tunnel buried in pebble soil with existing pipelines base on discrete continuous coupling numerical method. Tunn. Undergr. Space Technol. 2022, 129, 104629. [Google Scholar] [CrossRef]
- Jiang, N.; Gao, T.; Zhou, C.B.; Luo, X.D. Effect of excavation blasting vibration on adjacent buried gas pipeline in a metro tunnel. Tunn. Undergr. Space Technol. 2018, 81, 590–601. [Google Scholar] [CrossRef]
- Xia, Y.Q.; Jiang, N.; Zhou, C.B.; Luo, X.D. Safety assessment of upper water pipeline under the blasting vibration induced by Subway tunnel excavation. Eng. Fail. Anal. 2019, 104, 626–642. [Google Scholar] [CrossRef]
- Ma, S.K.; Shao, Y.; Liu, Y.; Jiang, J.; Fan, X.L. Responses of pipeline to side-by-side twin tunnelling at different depths: 3D centrifuge tests and numerical modelling. Tunn. Undergr. Space Technol. 2017, 66, 157–173. [Google Scholar] [CrossRef]
- Ma, S.K.; Liu, Y.; Lv, X.L.; Shao, Y.; Feng, Y. Settlement and load transfer mechanism of pipeline due to twin stacked tunneling with different construction sequences. KSCE. J. Civ. Eng. 2018, 22, 3810–3817. [Google Scholar] [CrossRef]
- Shi, J.W.; Wang, Y.; Ng, W.C. Three-dimensional centrifuge modeling of ground and pipeline response to tunnel excavation. J. Geotech. Geoenviron. 2016, 142, 04016054. [Google Scholar] [CrossRef]
- Marshall, M.A.; Klar, A.; Mair, J.R. Tunneling beneath buried pipes: View of soil strain and its effect on pipeline behavior. J. Geotech. Geoenviron. 2010, 136, 1664–1672. [Google Scholar] [CrossRef]
- Zhang, X.; Cheng, H.; Xu, Y.J.; Li, H.L. A case study on performances of overlying pipelines due to shallow tunnels excavation in water-rich gravel ground. Ain. Shams Eng. J. 2022, 13, 101746. [Google Scholar] [CrossRef]
- Hou, Y.J.; Fang, Q.; Zhang, D.L.; Wong, L.N.Y. Excavation failure due to pipeline damage during shallow tunnelling in soft ground. Tunn. Undergr. Space Technol. 2015, 46, 76–84. [Google Scholar] [CrossRef]
- Li, X.G.; Wang, T.; Yang, Y. An investigation into the tunnel-soil-pipeline interaction by in situ measured settlements of the pipelines. Adv. Civ. Eng. 2020, 2020, 8850380. [Google Scholar] [CrossRef]
- GB 50911-2013; Code for Monitoring Measurement of Urban Rail Transit Engineering. China Architecture & Building Press: Beijing, China, 2013. (In Chinese)
- GB 50652-2011; Code for Risk Management of Underground Works in Urban Rail Transit. China Architecture & Building Press: Beijing, China, 2011. (In Chinese)


Disclaimer/Publisher’s Note: The statements, opinions and data contained in all publications are solely those of the individual author(s) and contributor(s) and not of MDPI and/or the editor(s). MDPI and/or the editor(s) disclaim responsibility for any injury to people or property resulting from any ideas, methods, instructions or products referred to in the content. |
© 2023 by the authors. Licensee MDPI, Basel, Switzerland. This article is an open access article distributed under the terms and conditions of the Creative Commons Attribution (CC BY) license (https://creativecommons.org/licenses/by/4.0/).