
Seismic Risk Assessment of Typical Reinforced Concrete Frame School Buildings in Sri Lanka


Abstract
:1. Introduction
2. Typical Reinforced Concrete Frame School Buildings in Sri Lanka
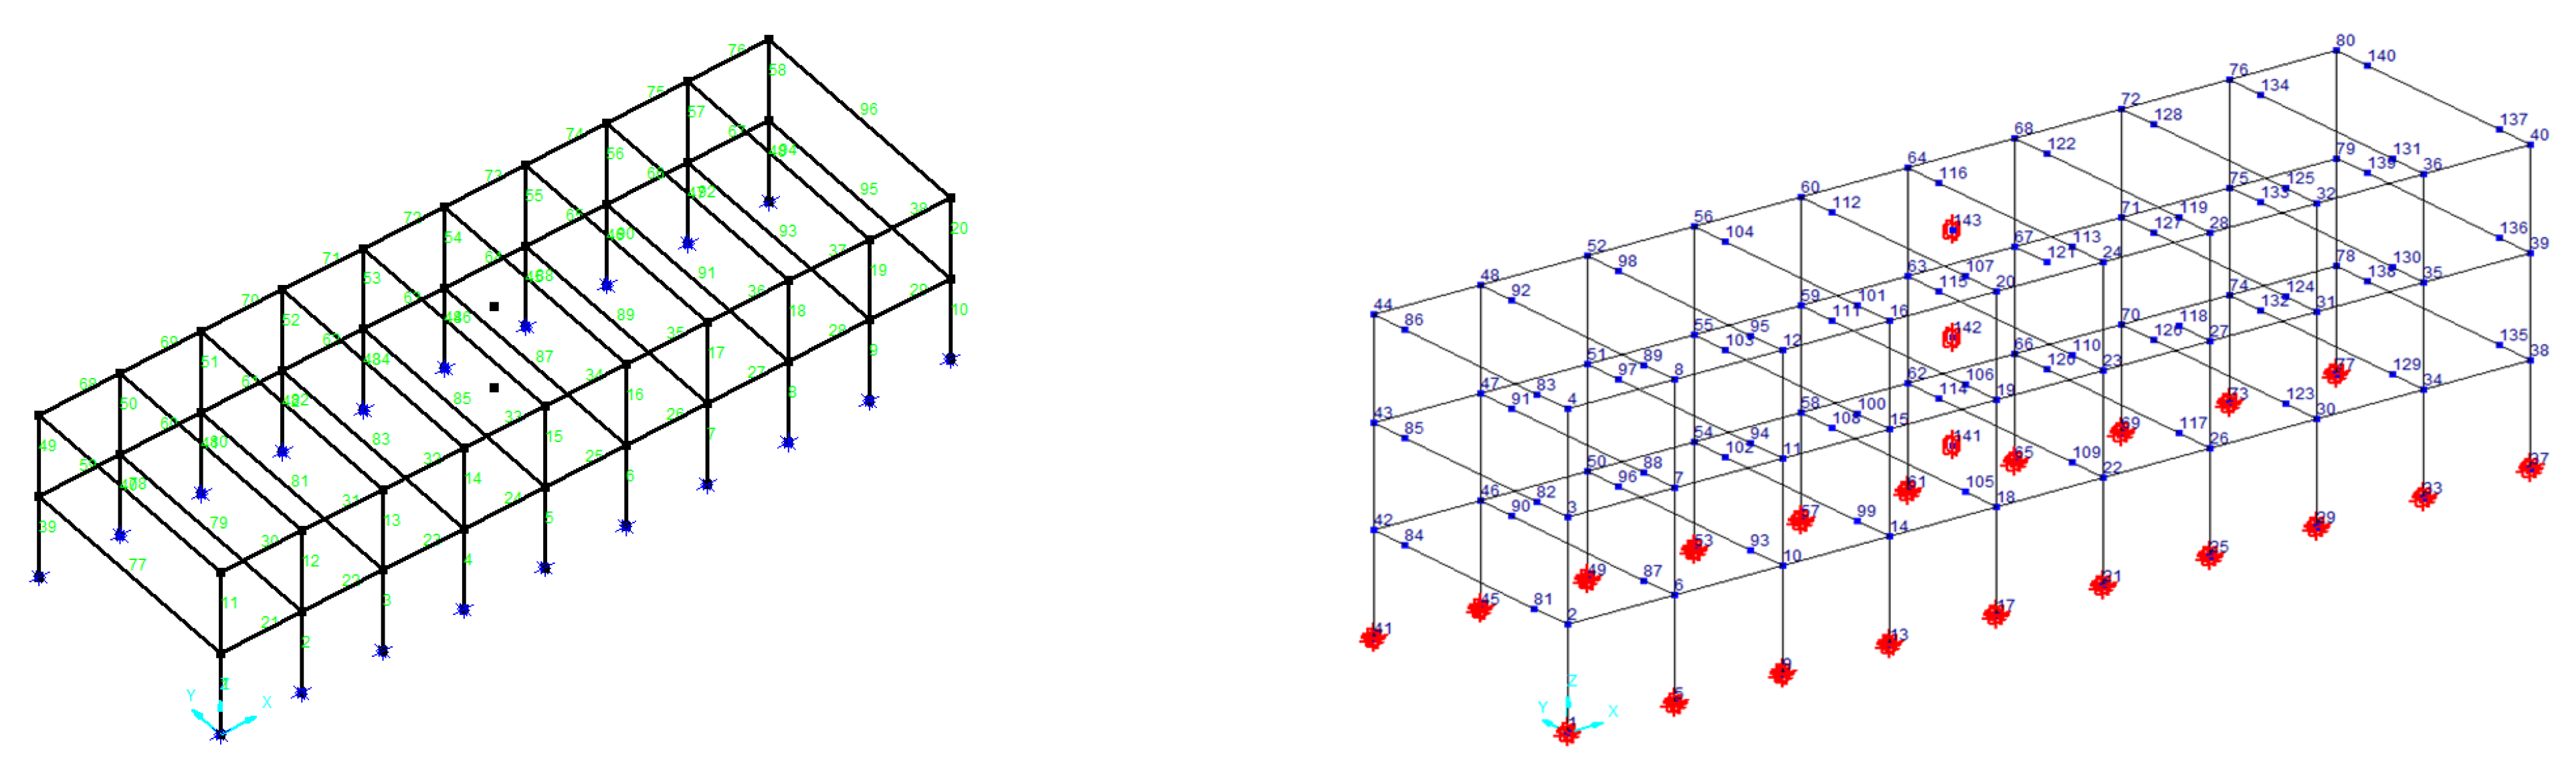
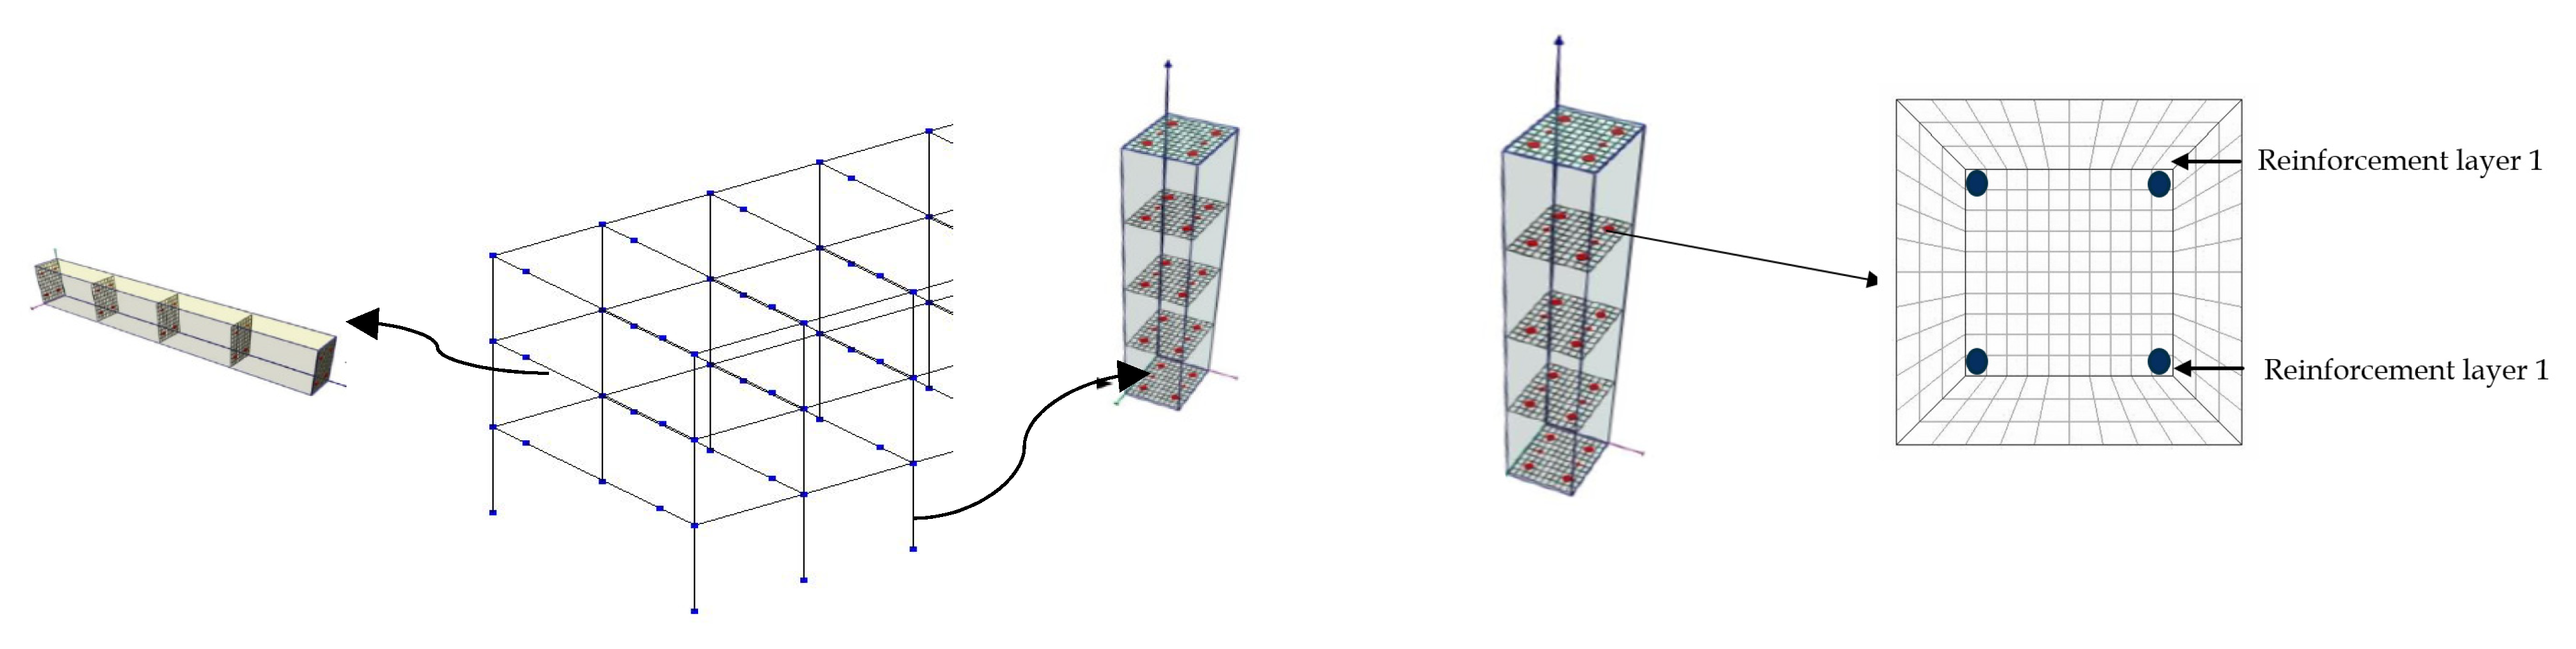
3. Numerical Modelling of School Building
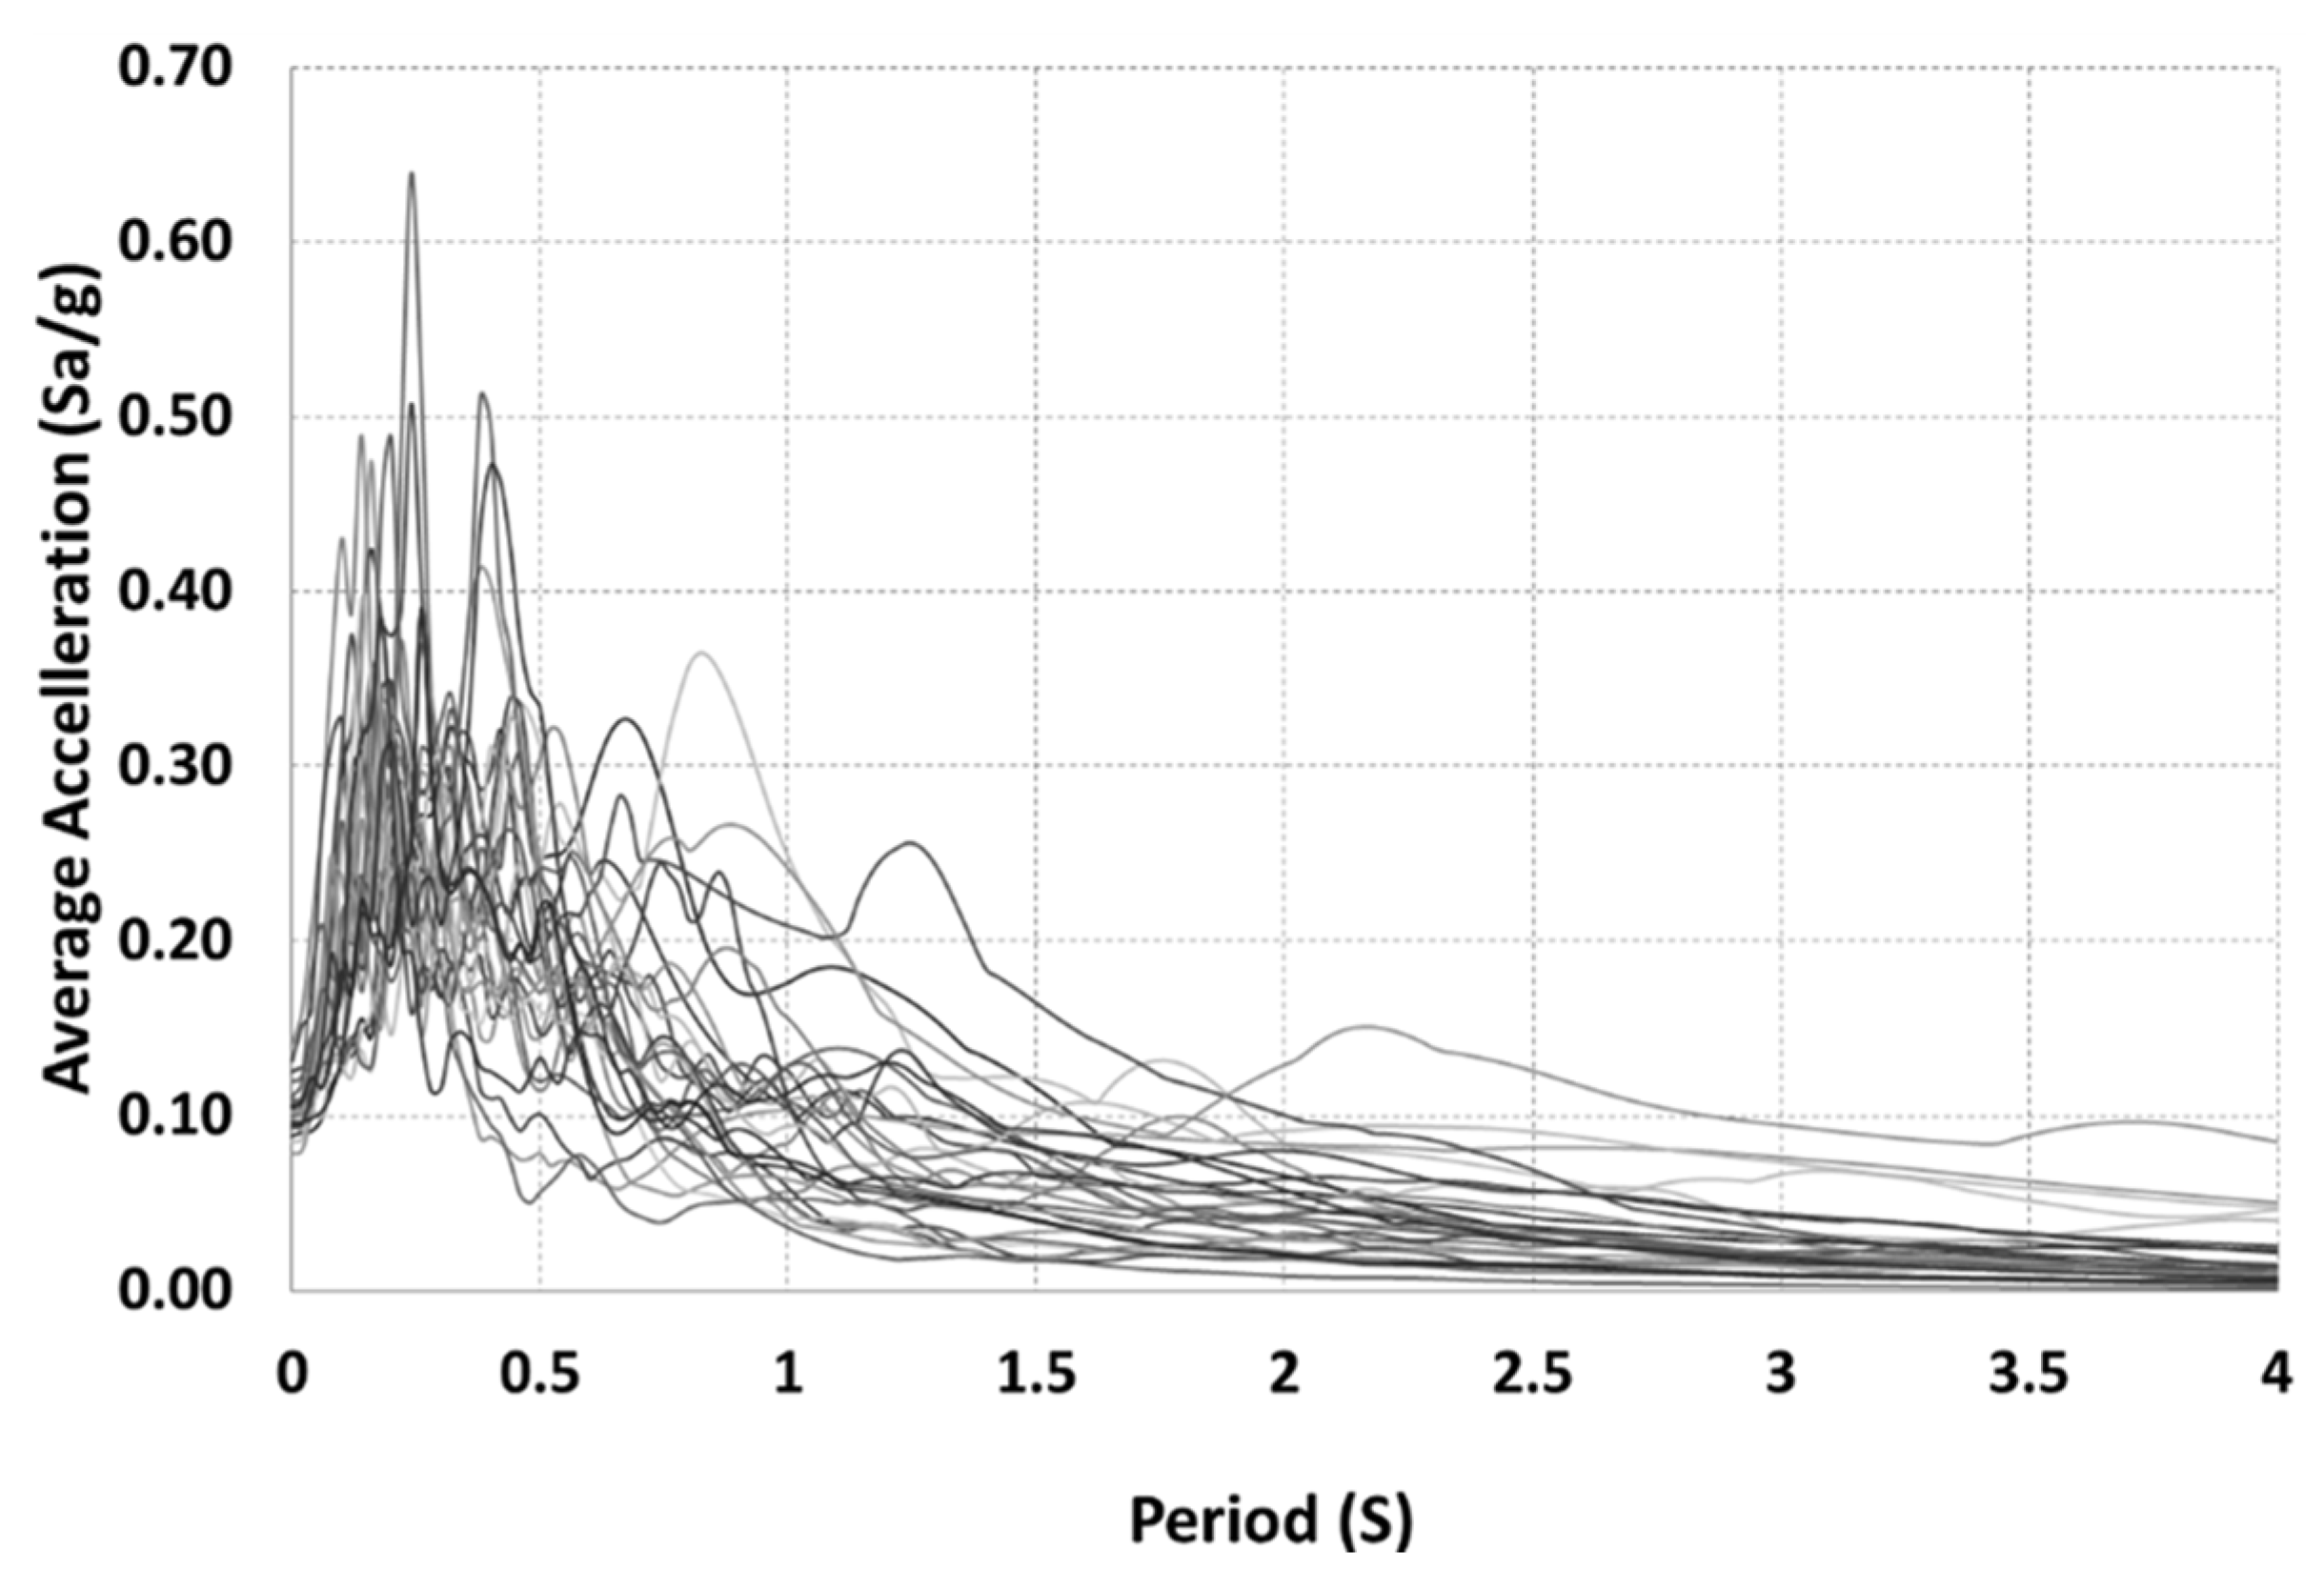
4. Selection of Ground Motion
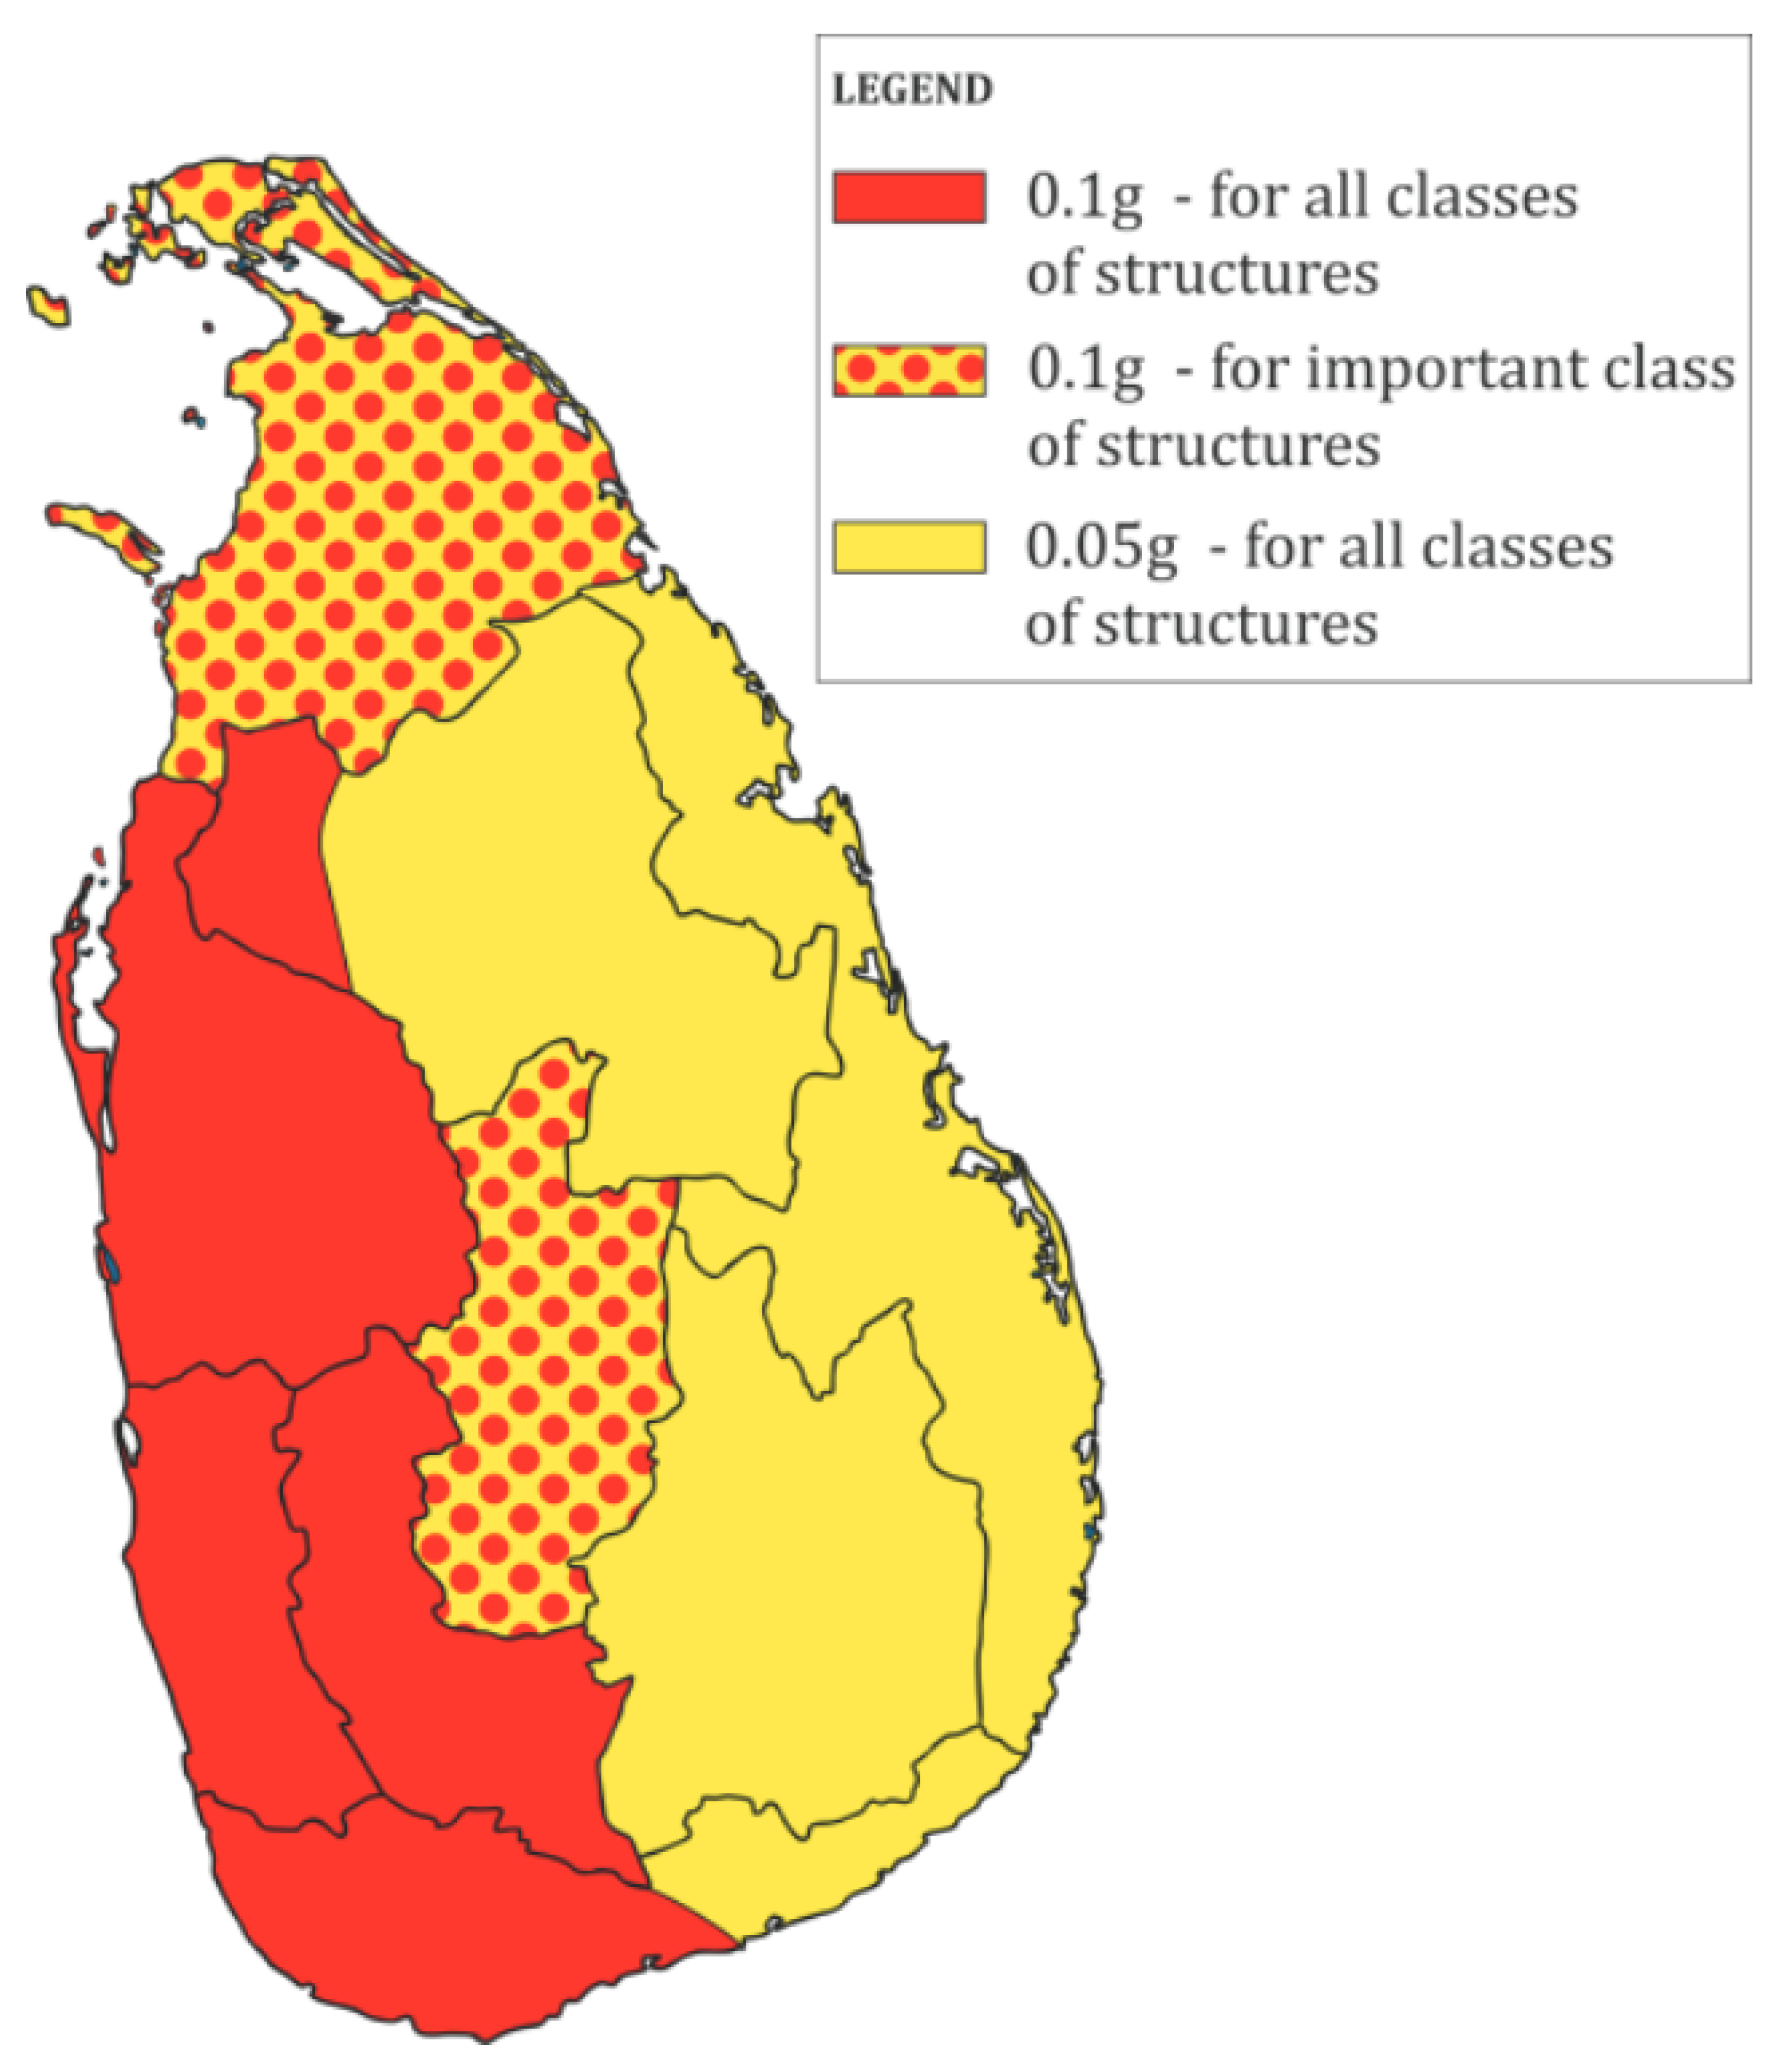
- Consultation of seismic hazard studies and geological reports specific to Sri Lanka to gain insights into the seismic hazard in the region. Sri Lanka’s proximity to the boundary between the Indian and Australian tectonic plates makes it susceptible to earthquakes. In particular, we referred to the study conducted by Venkatesan and Gamage [47], which provided hazard values in terms of peak ground acceleration and elastic spectral acceleration with a 5% damping ratio for return periods of 475, 975, and 2475 years, presented as raster maps. Additionally, we cross-referenced the results with the openquake application [48] and found a good match between the two sources;
- Establishing the specific seismic hazard levels required for our analysis, which, in this instance, were defined as return periods of 475 years;
- Determining the precise locations in Sri Lanka that were the focus of our seismic hazard assessment. According to the study in [47], the region around the capital city, Colombo, exhibits the highest anticipated PGA in rock sites, approximately 0.043 g for a 475-year return period;
- Identifying accelerogram records from earthquakes that align with the established criteria. Our goal was to find records from seismic events that effectively represent the seismic hazard present in Sri Lanka.
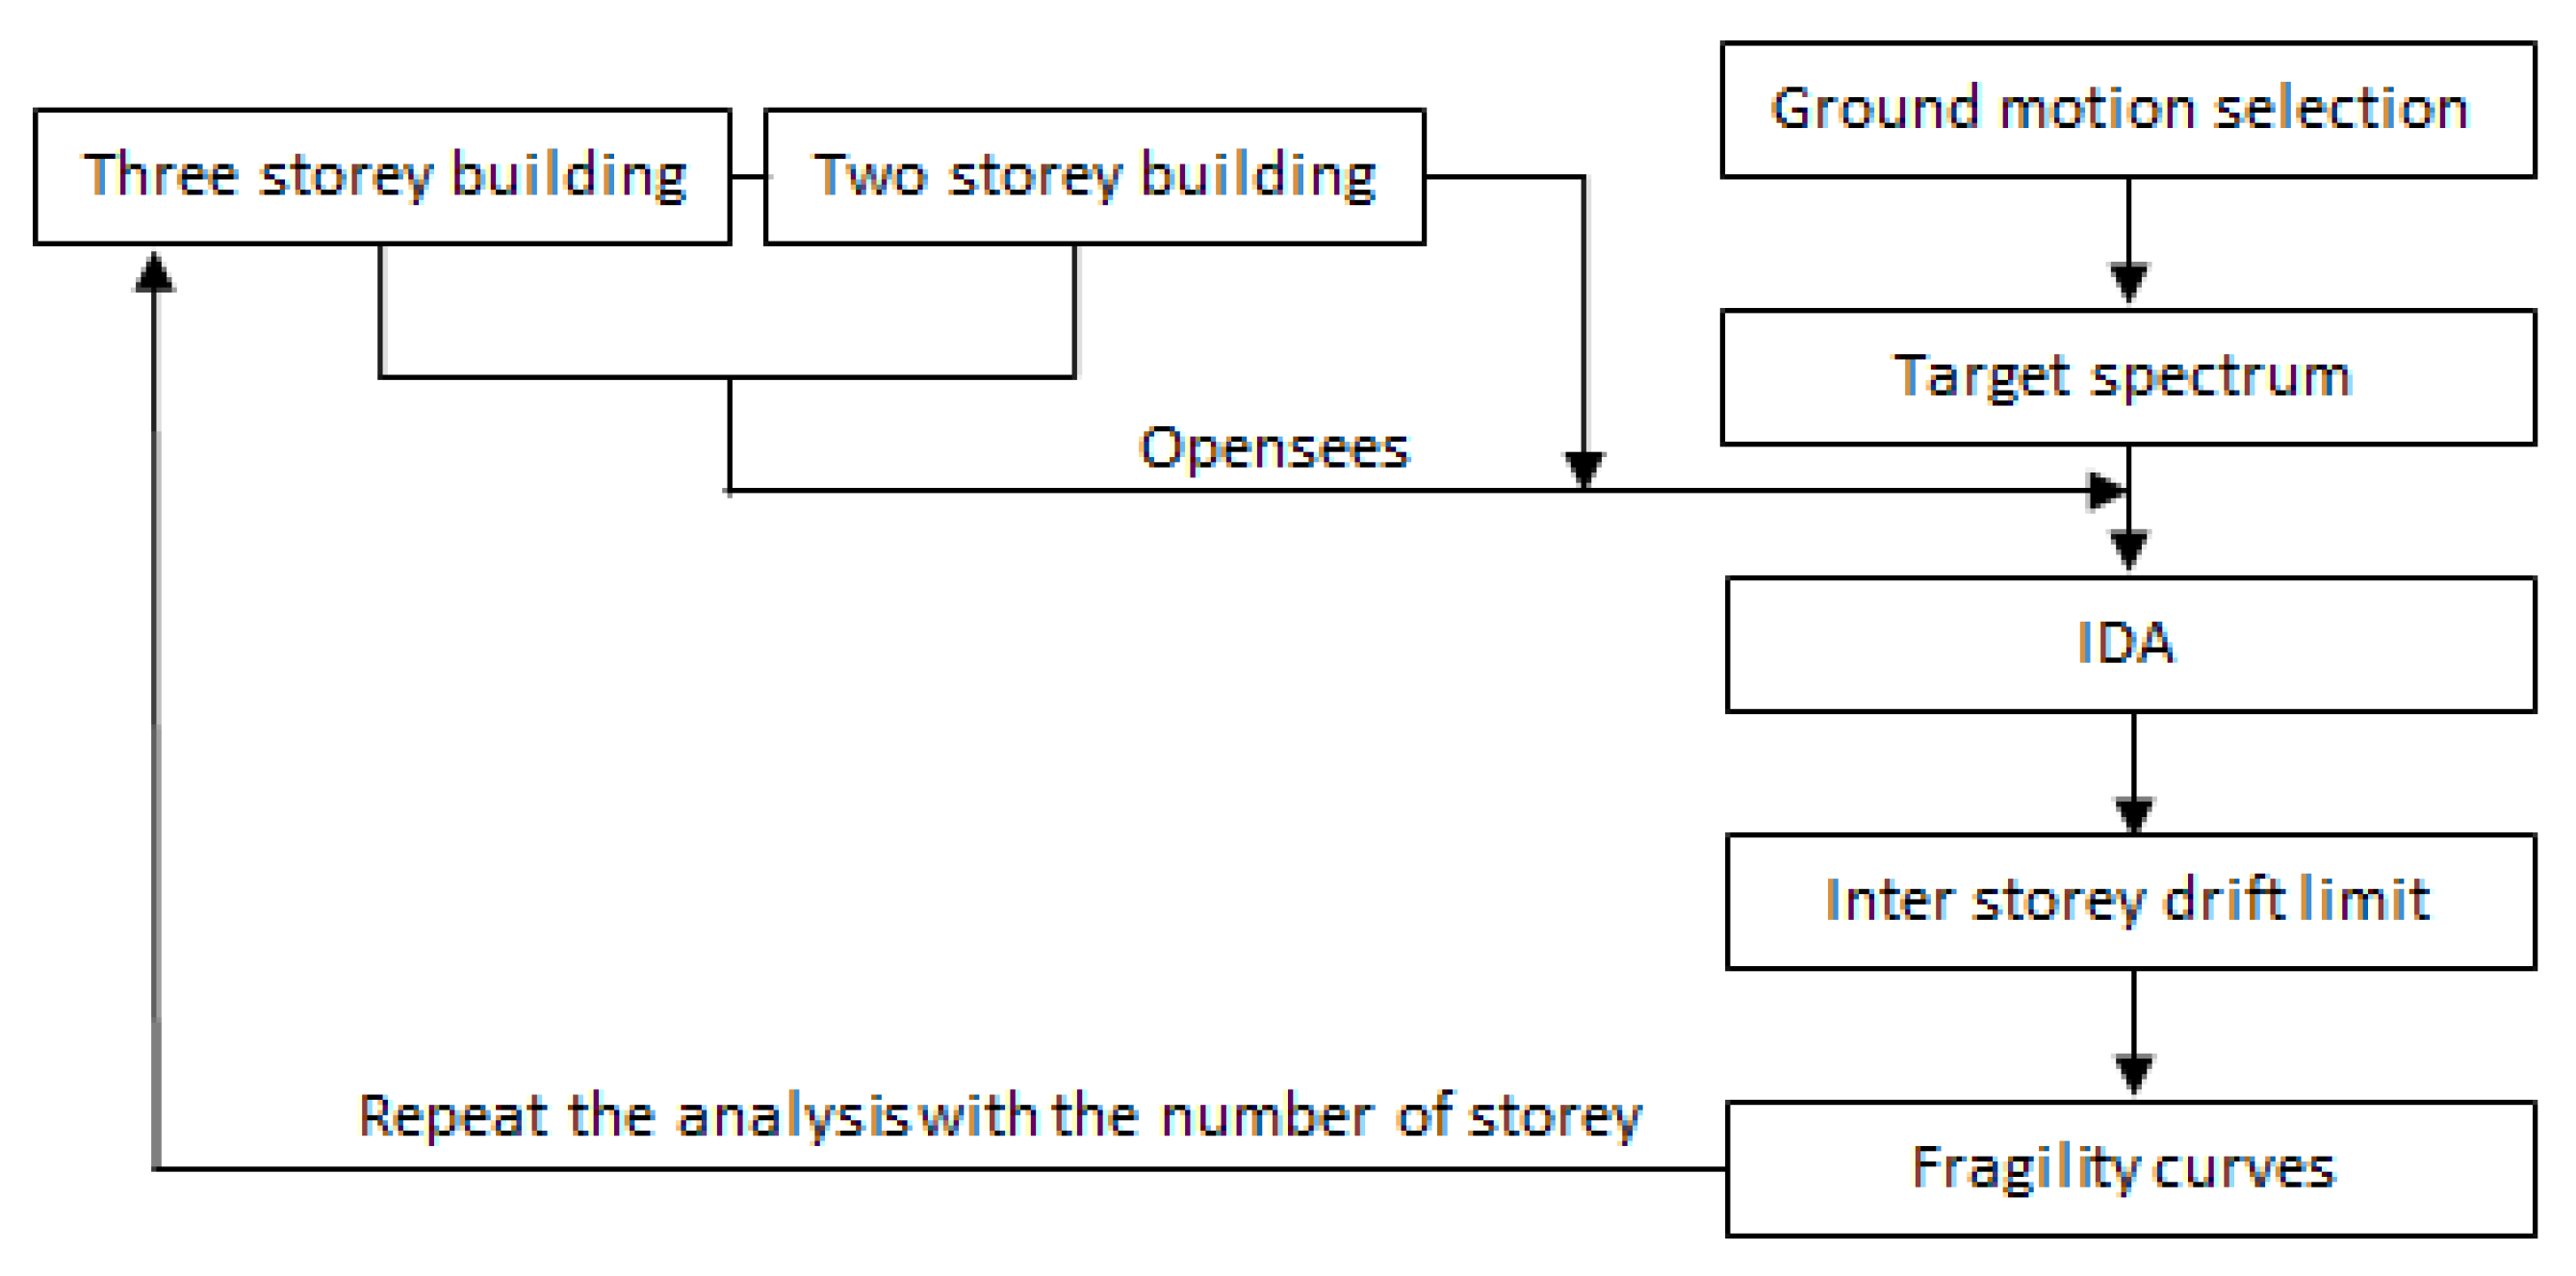
5. Incremental Dynamic Analysis and Performance Levels
- -
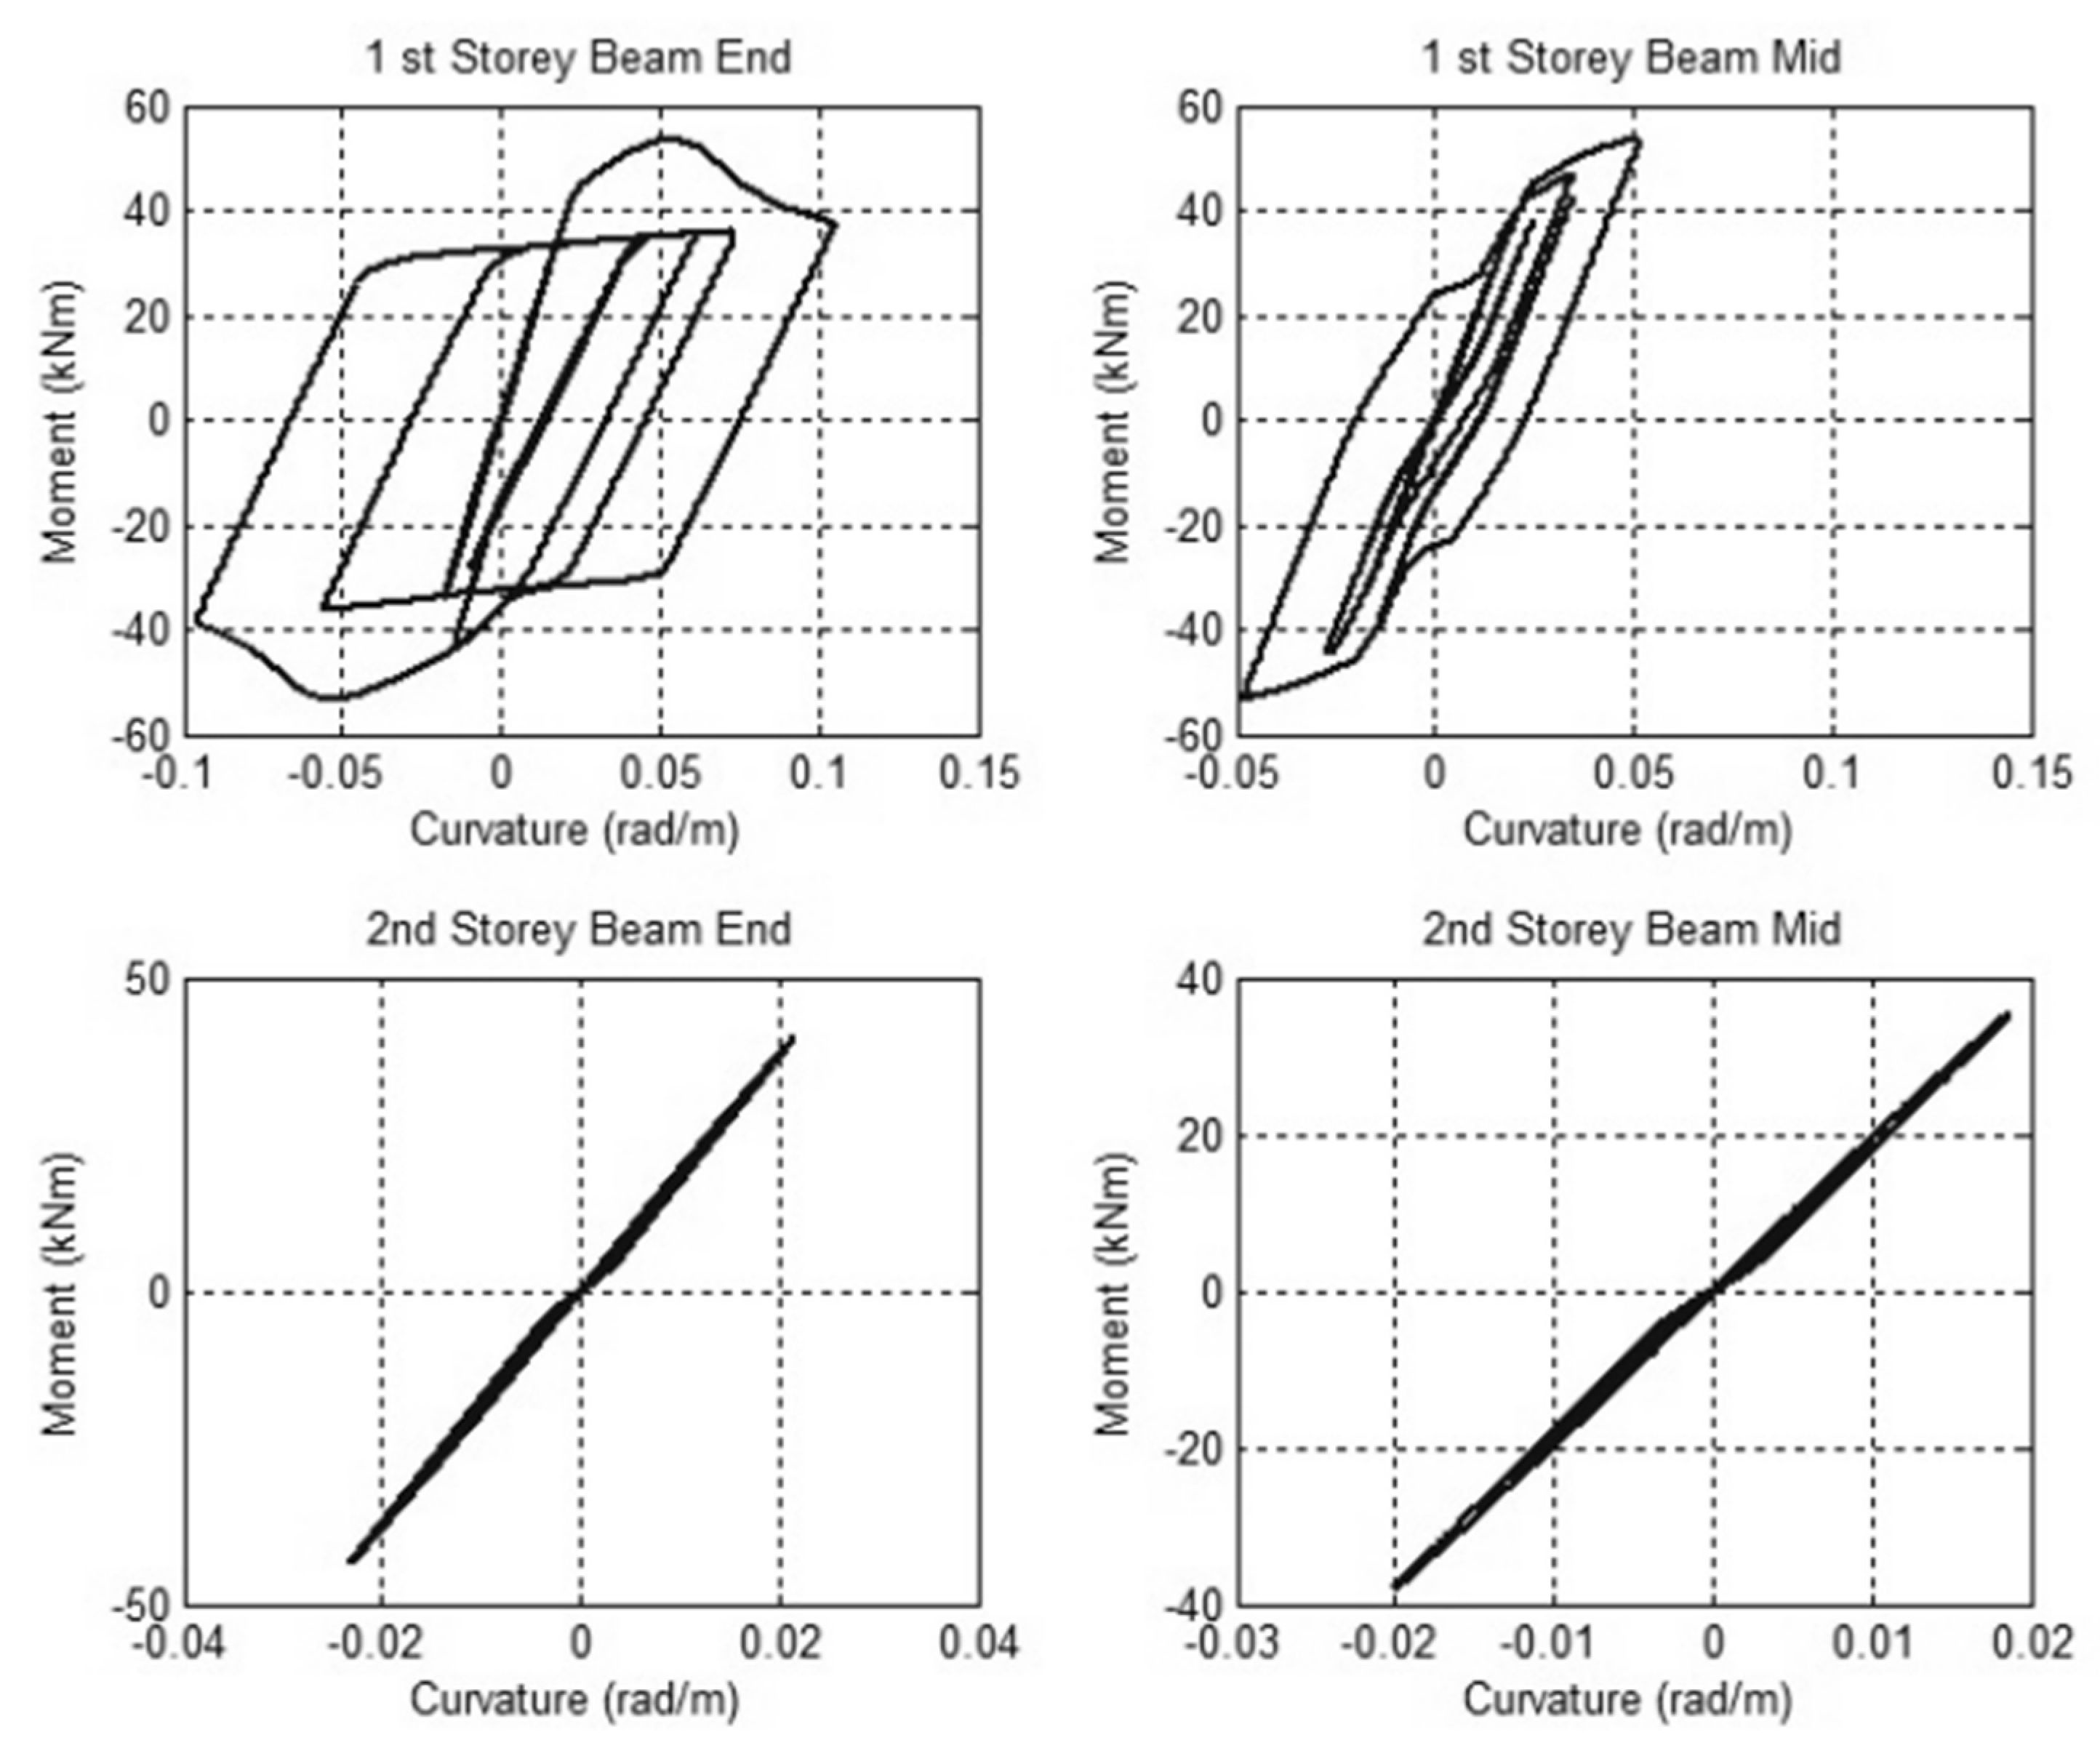
- The ultimate structural failure of both buildings can be attributed to the failure of the first-story beam elements in flexure, primarily due to excessive deformation;
- -
- Because the column spacing is considerably narrower in the longitudinal direction compared to the transverse direction, the resultant beam sections of the longitudinal beams, derived from the gravity design of the frames, exhibit significantly lower strength and stiffness in comparison to the corresponding column sections. In fact, these longitudinal beams are the weakest components within the moment-resisting frames in the longitudinal direction, leading to a concentration of plastic deformations primarily at the first-story beams, as illustrated in Figure 14;
- -
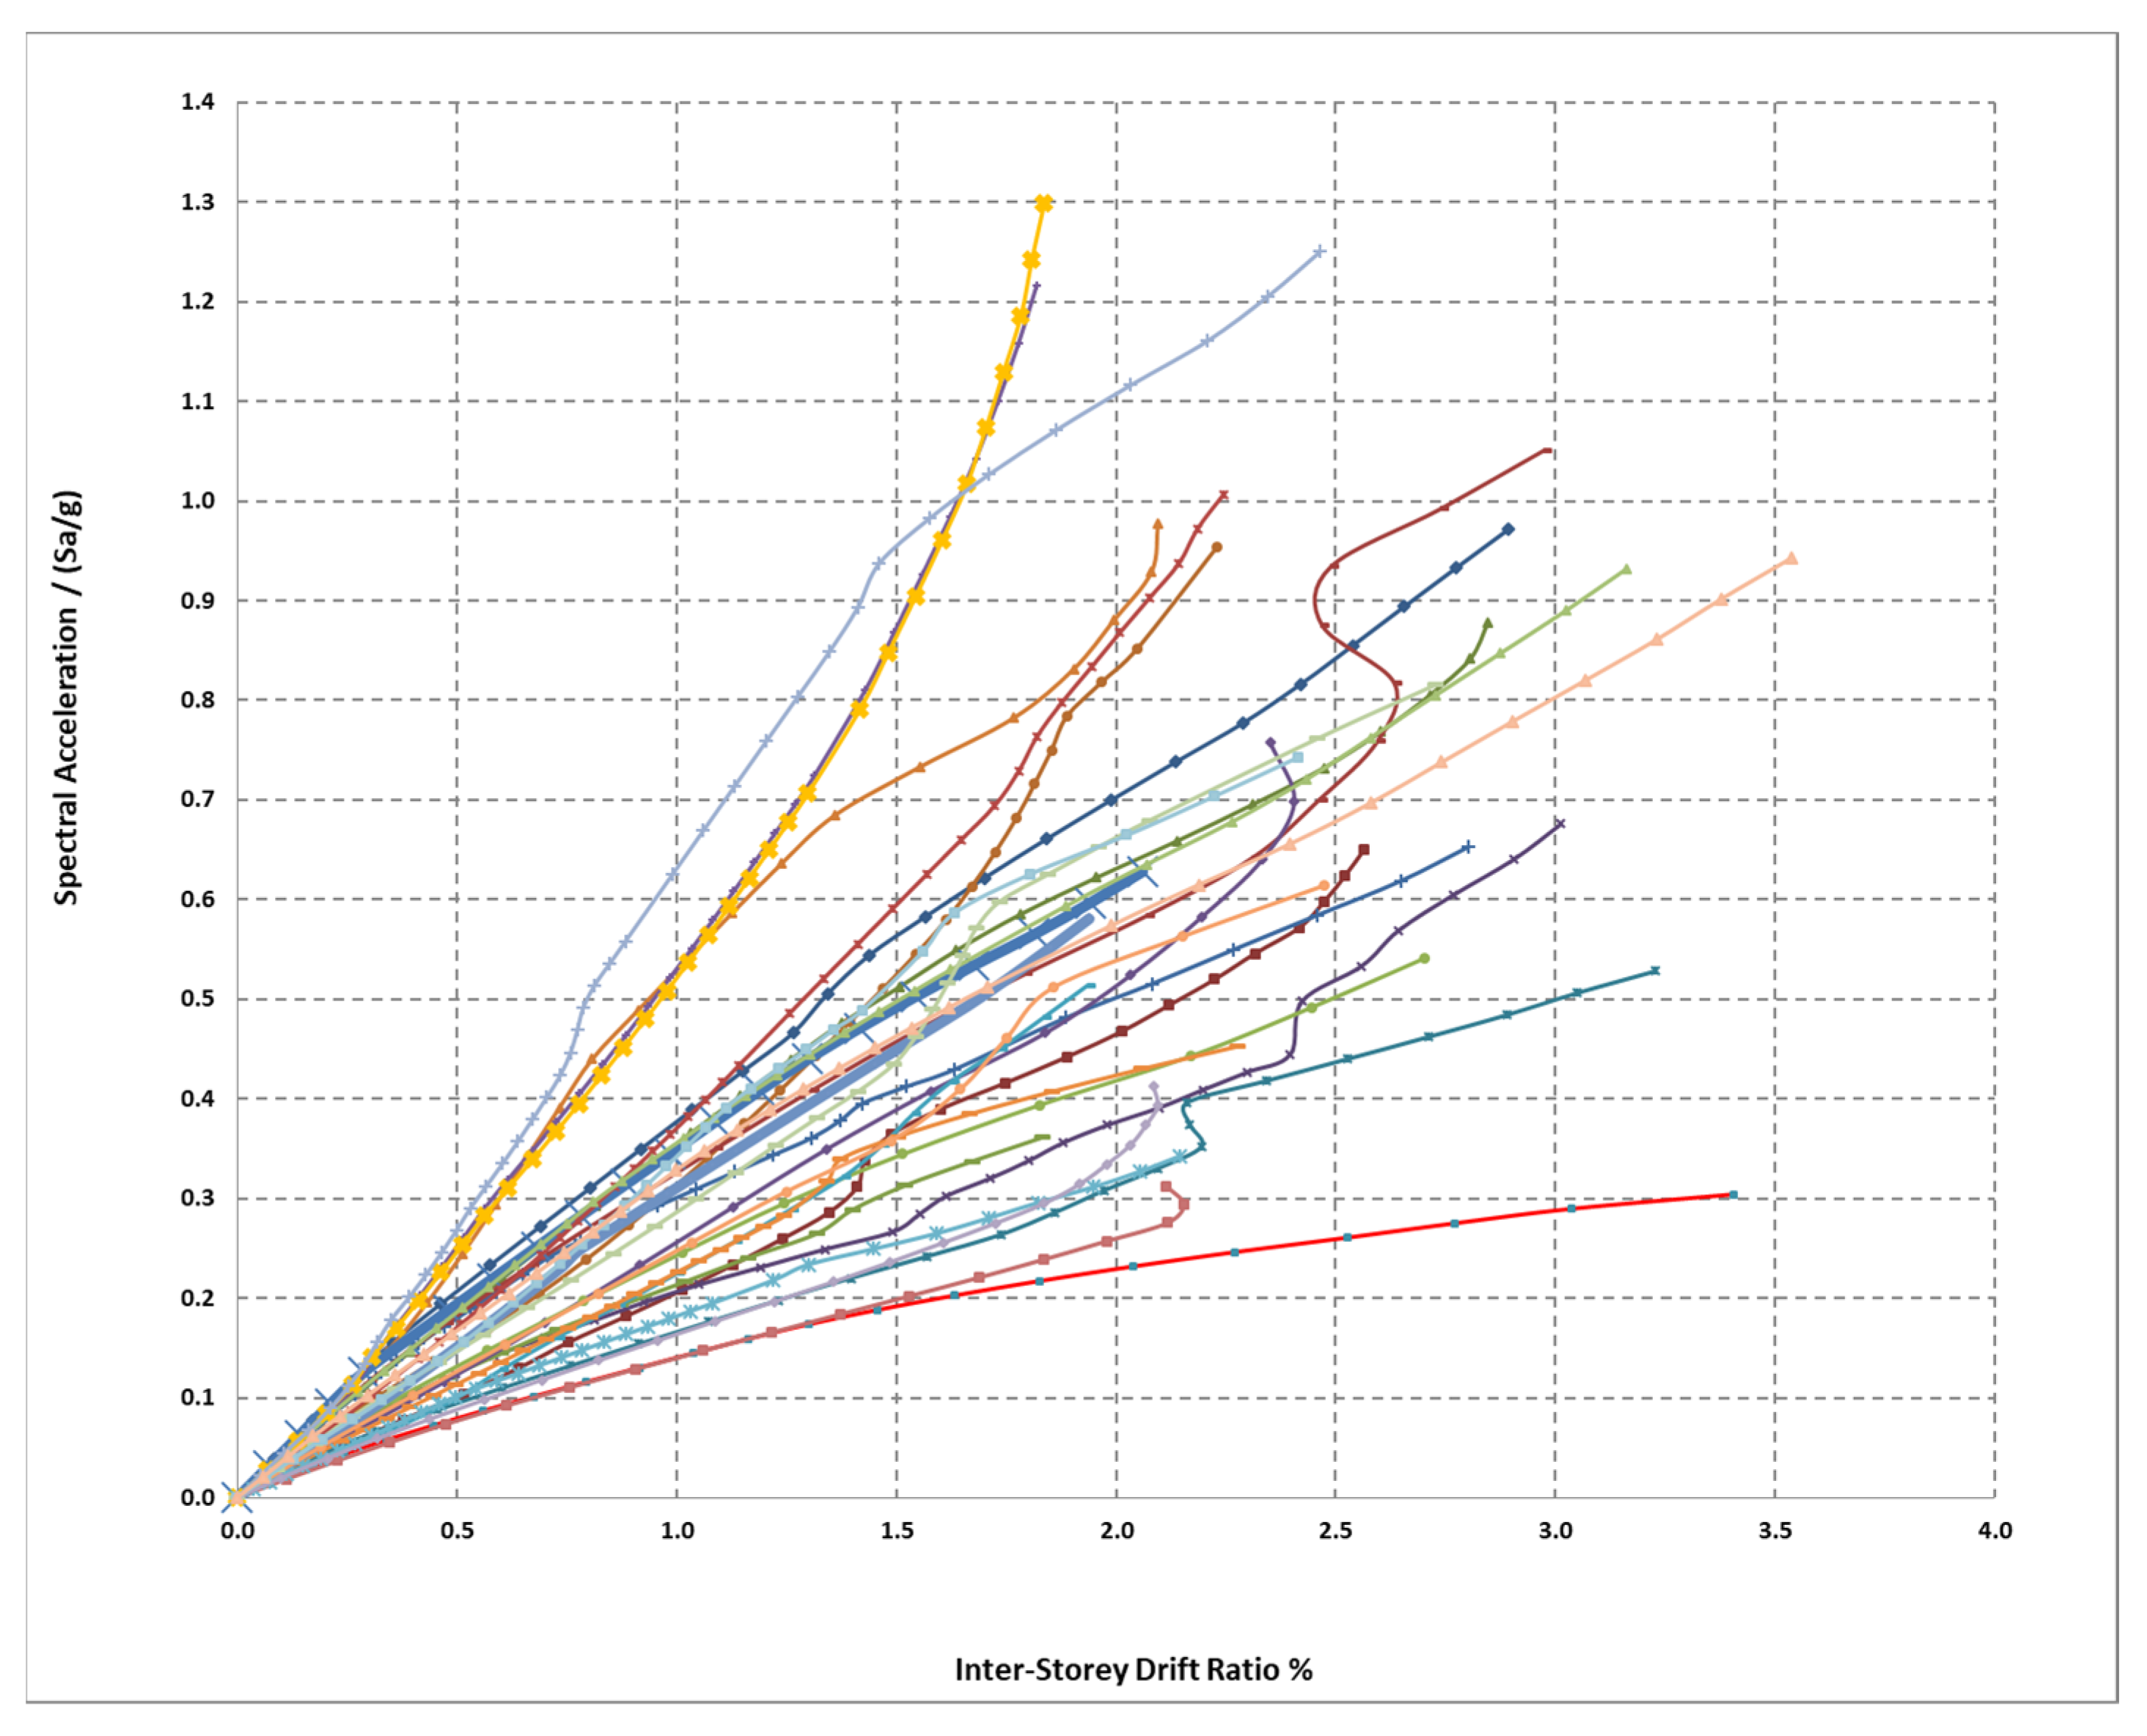
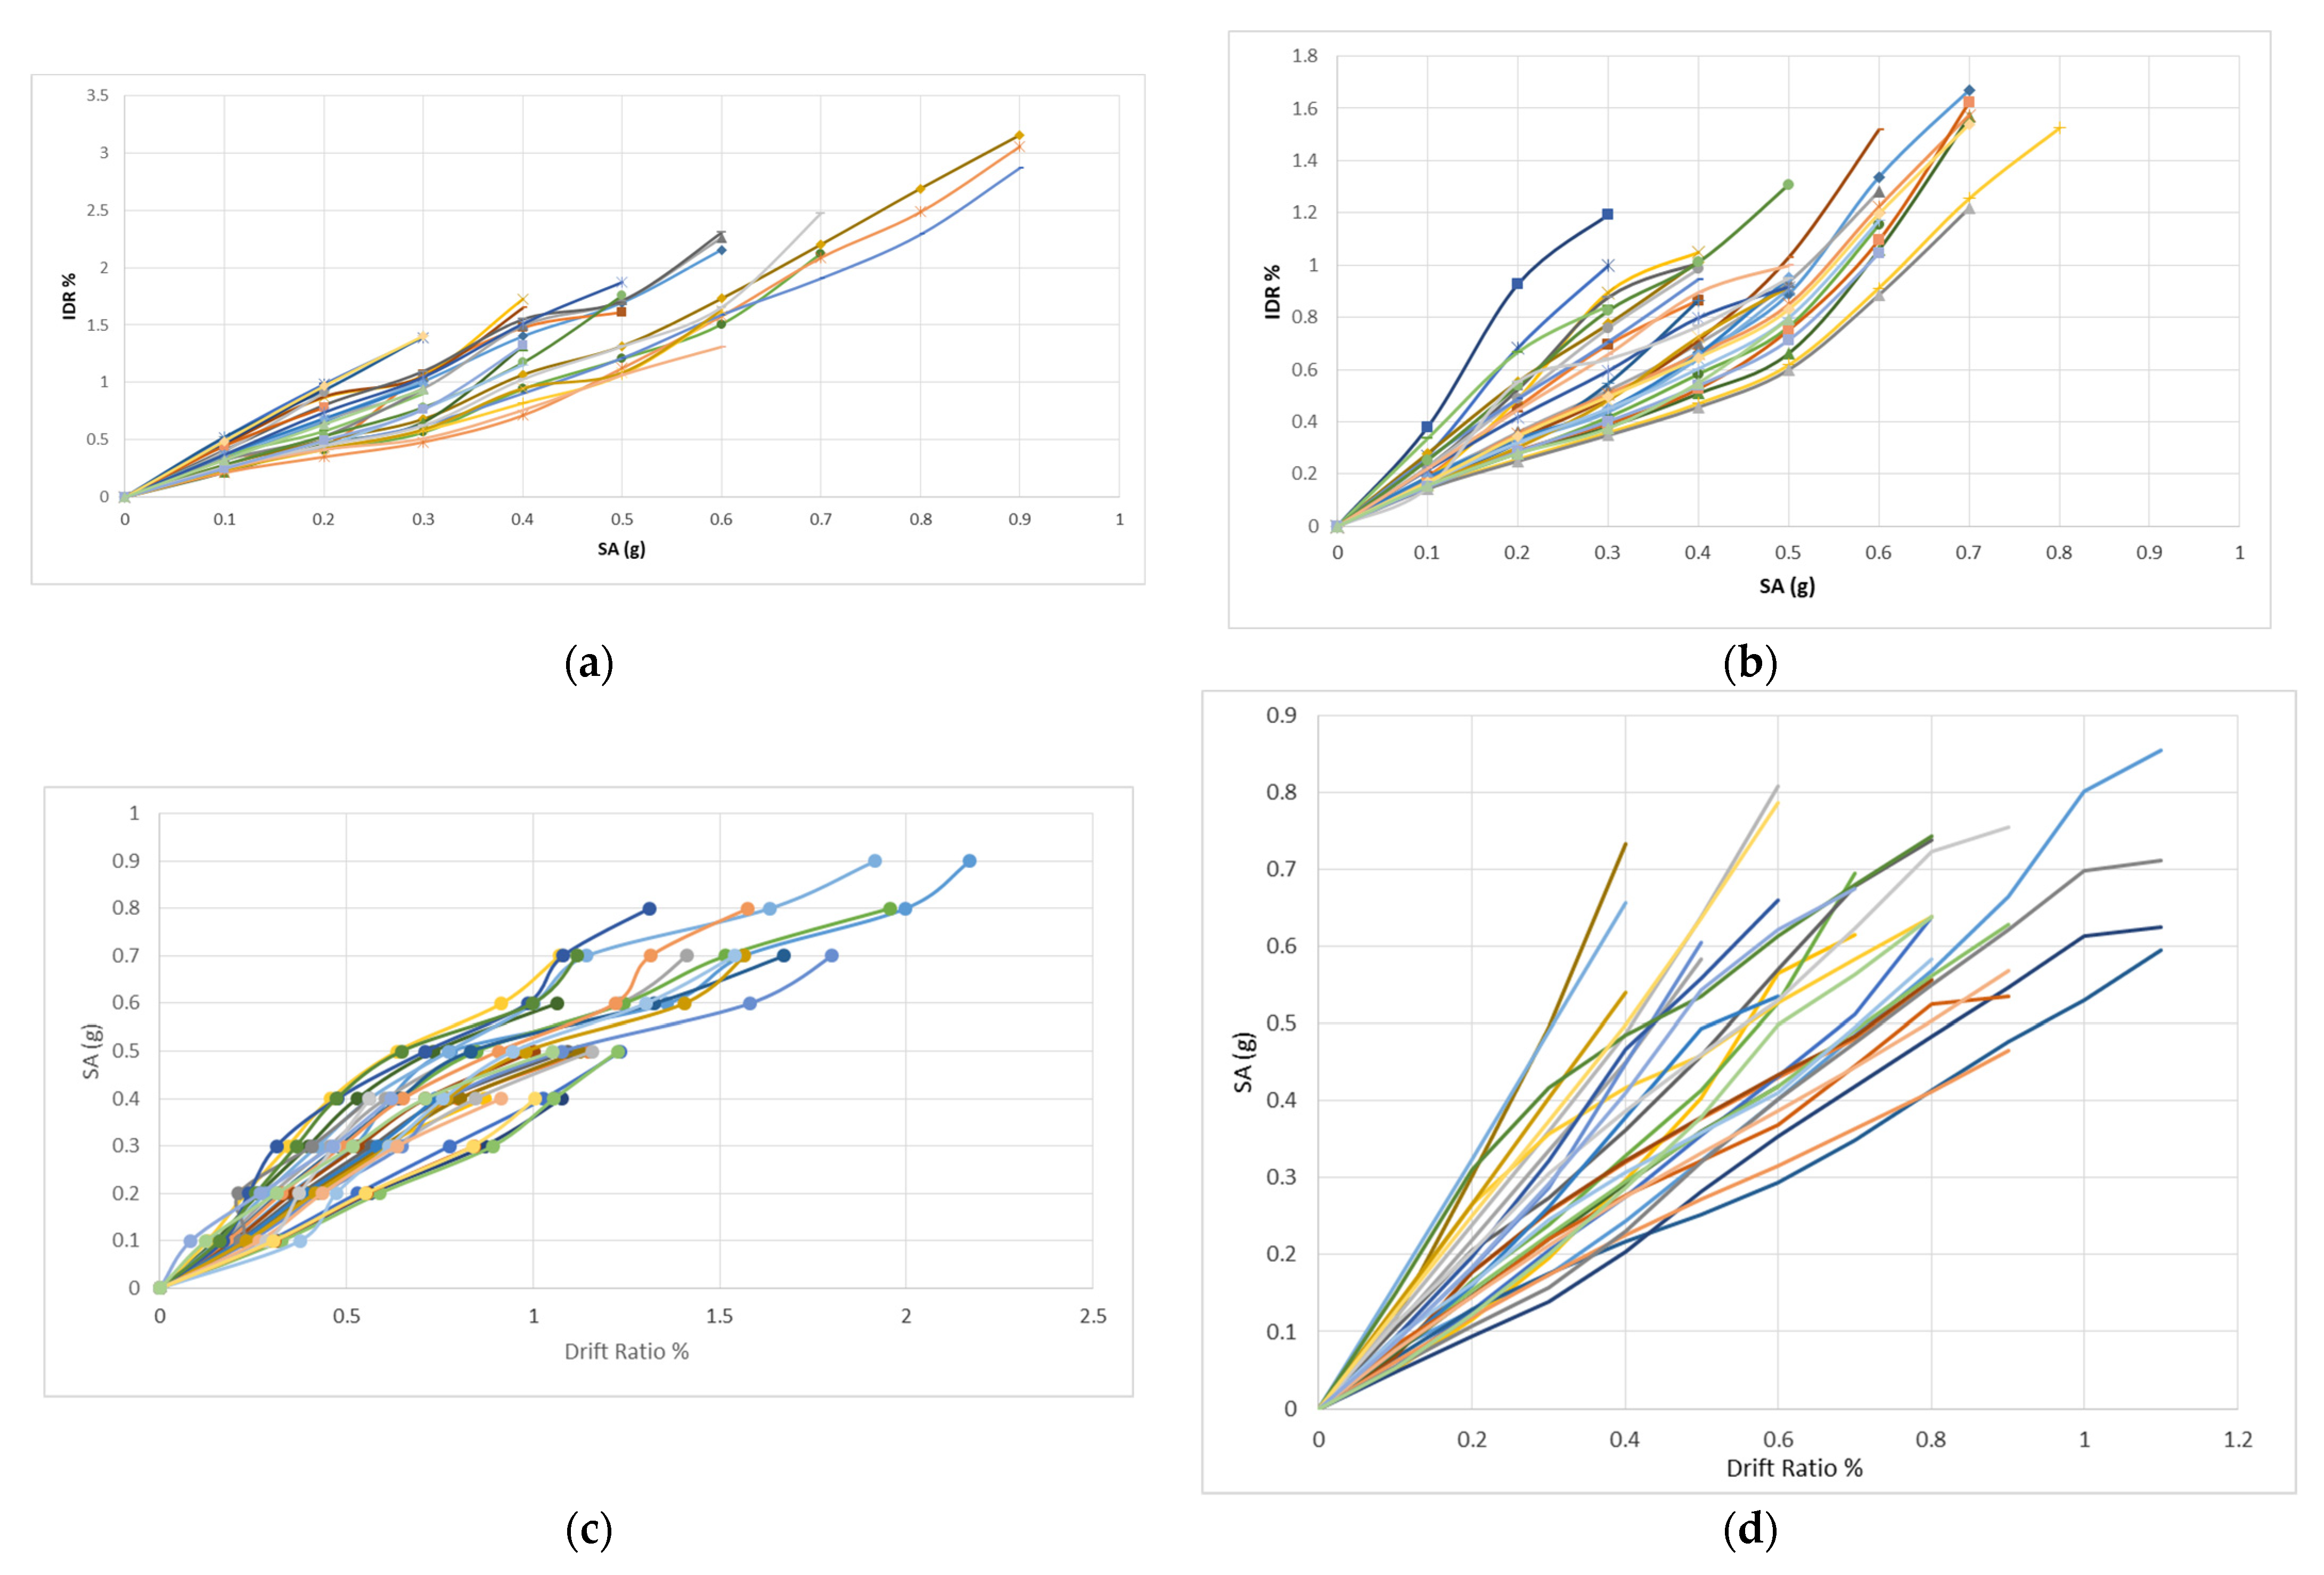
- The points of global failure on the IDA curves for the buildings are associated with a 20% reduction in moment capacity for all first-story beam elements. This reduction is established by utilizing moment-curvature curves derived from the structural analysis. Likewise, the calculated drift ratio values for each earthquake are averaged to provide a normalized result and are presented in Table 2;
- -
- It is noteworthy that the two-story frame exhibits superior resilience and can withstand higher PGA in comparison to the three-story frame;
- -
- These findings underscore the necessity for structural retrofitting in structures of this kind to mitigate the risk of structural collapse during seismic events.
6. Exploring Probabilistic Seismic Demand and Fragility Analysis
- -
- The region around Colombo emerges as the most vulnerable area in the country [47] concerning seismic activities. Colombo is anticipated to experience a maximum expected PGA exceeding 0.043 g in a 475-year return period. In contrast, the rest of the country is exposed to relatively minor ground motions that disperse uniformly across the region, leading to its classification under the low seismicity category. The results presented in Figure 17 and Figure 18 are specifically derived for the most vulnerable location, utilizing the most vulnerable and strategically significant buildings within that area;
- -
- When comparing the pushover curves depicted in Figure 17 and Figure 18 with the established trends for newly designed buildings [50], a noteworthy observation emerges. It becomes evident that the seismic vulnerability of low-ductile RC frames, which were not originally designed to withstand earthquake loads, remains a consistent concern for countries characterized by low-to-medium seismicity, such as Sri Lanka. This finding may also be extended to similar nations like Malaysia and Australia, particularly in regions like Tasmania. It is worth noting that these types of structures constitute the majority of existing school buildings in Sri Lanka. Consequently, evaluating their safety levels becomes a critical consideration for authorities when planning retrofitting measures;
- -
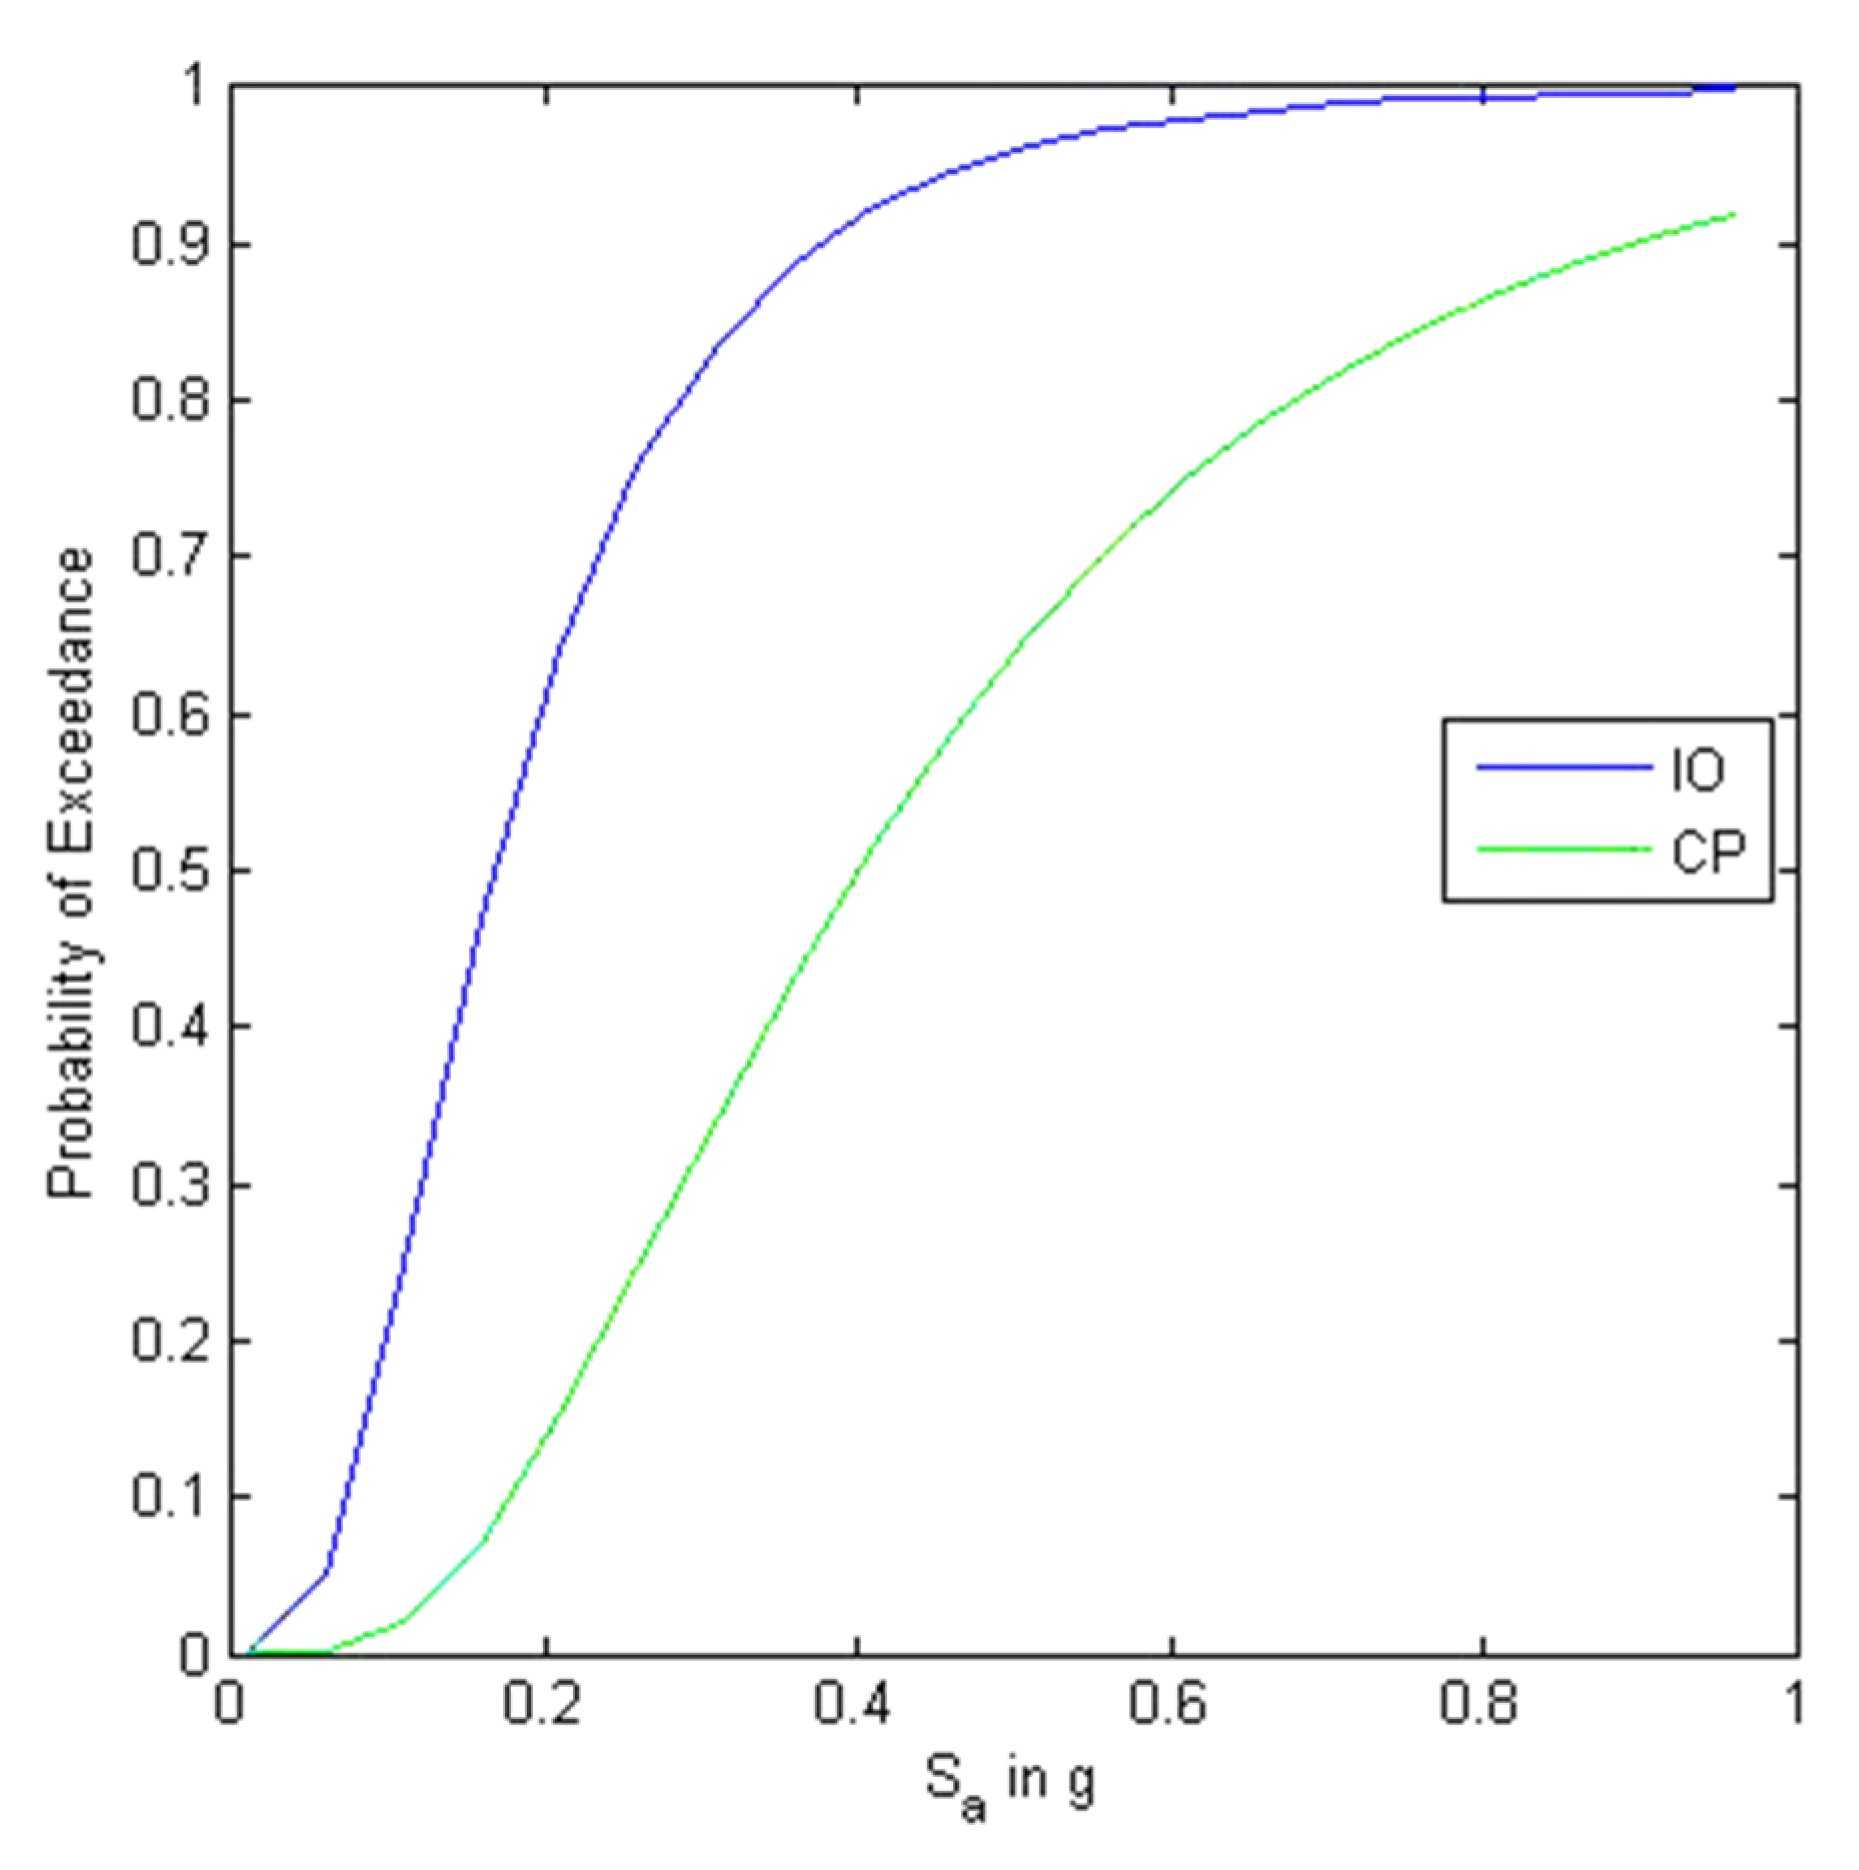
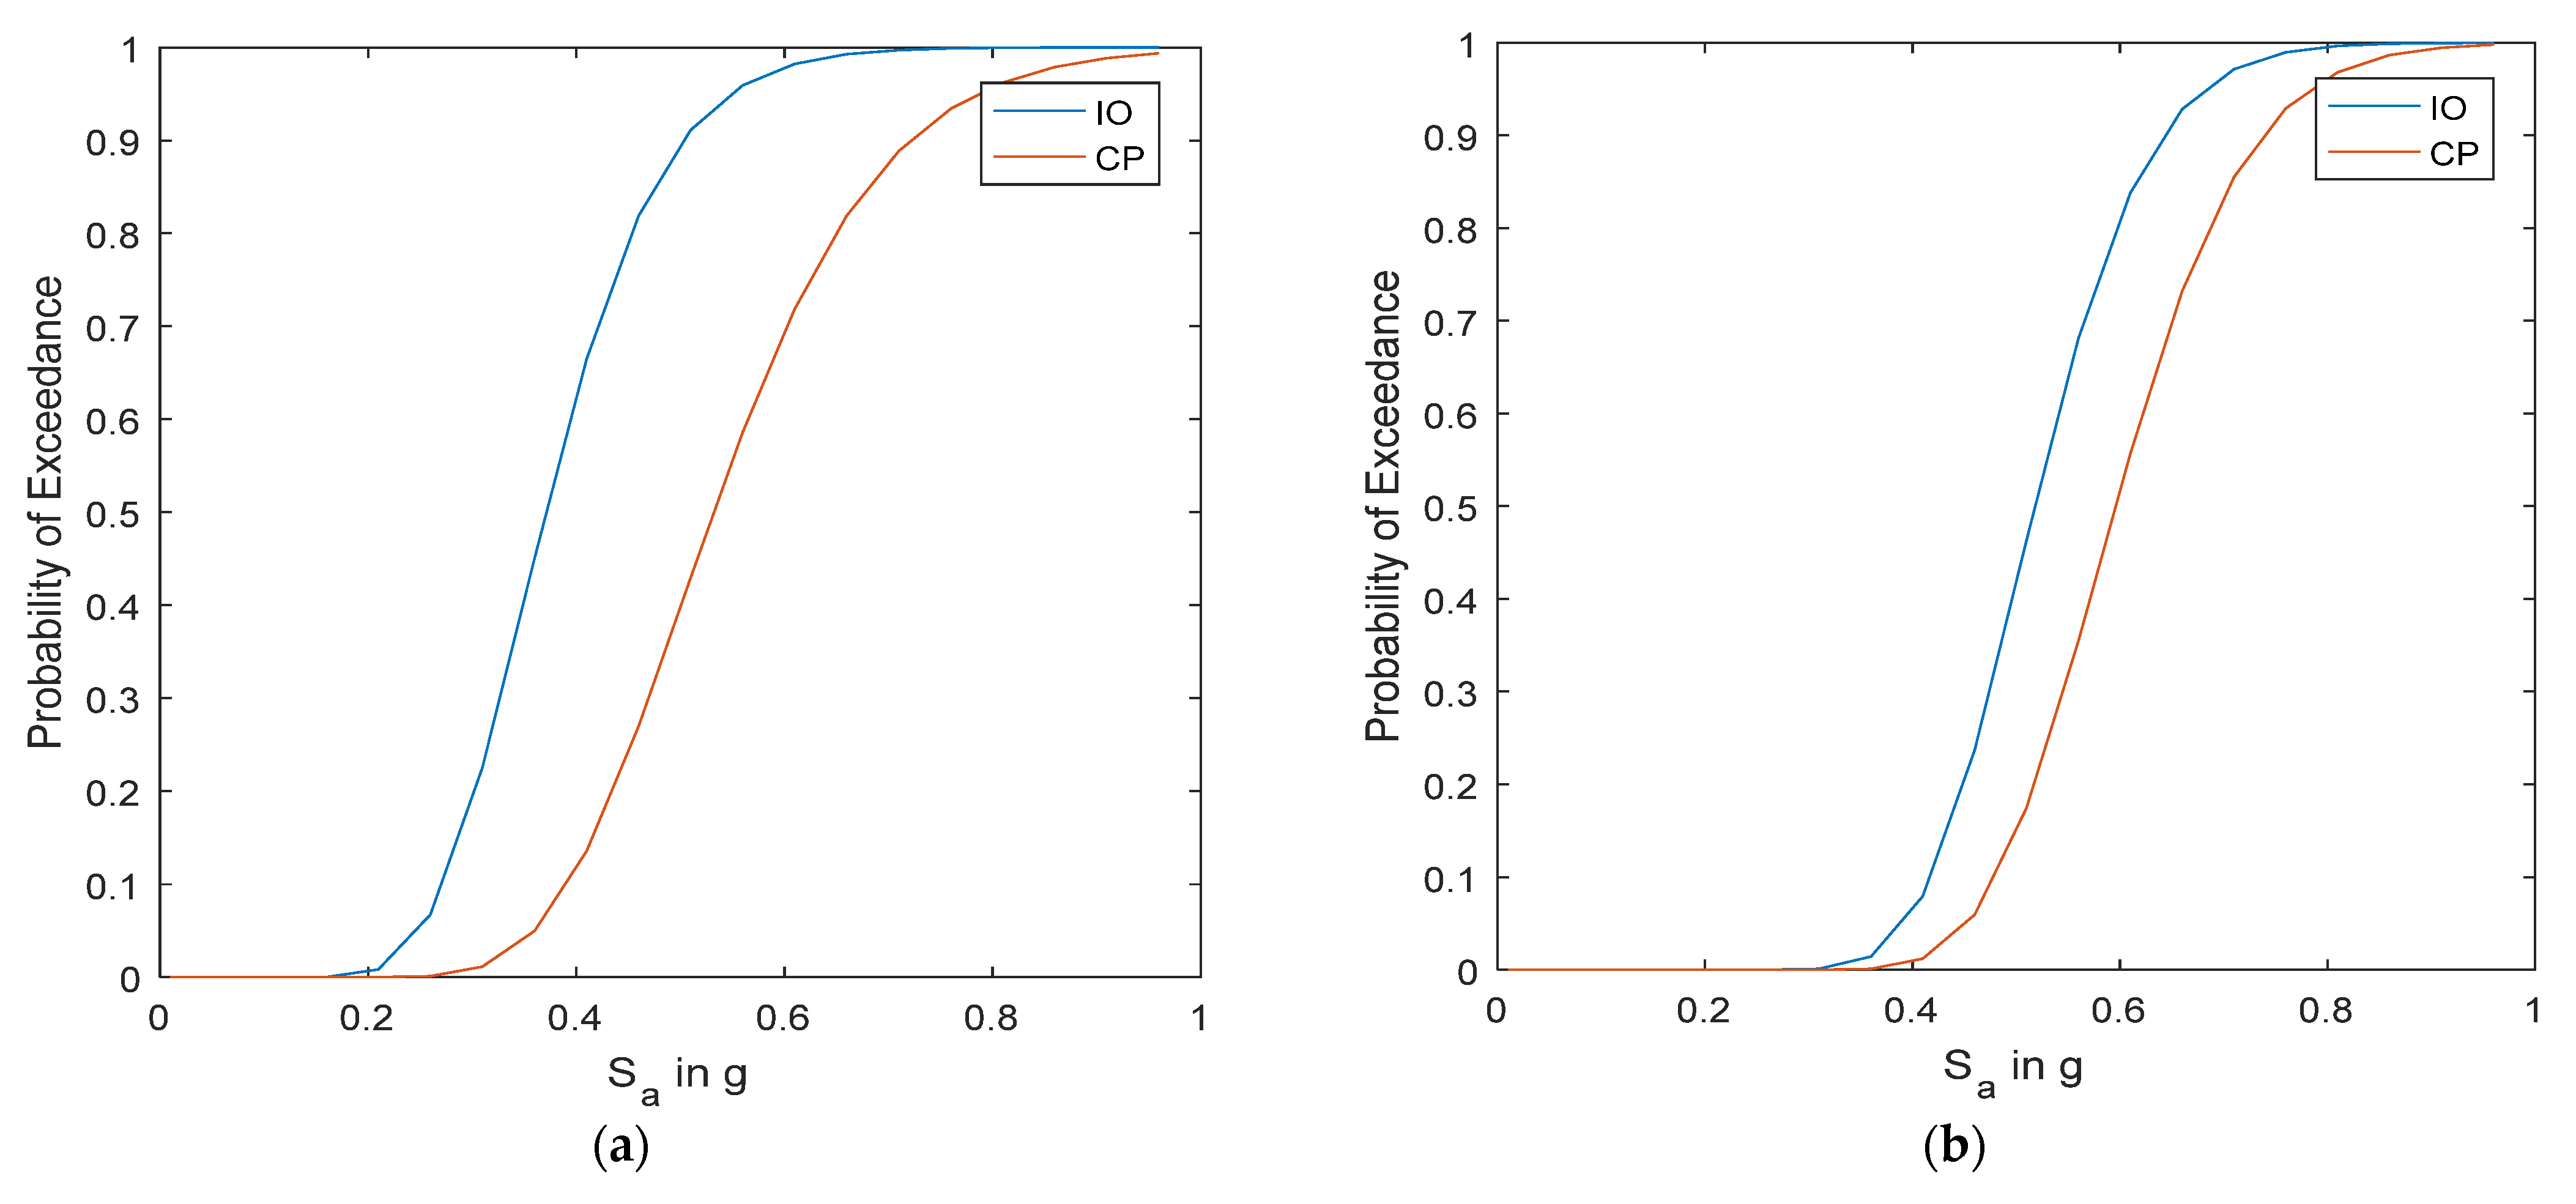
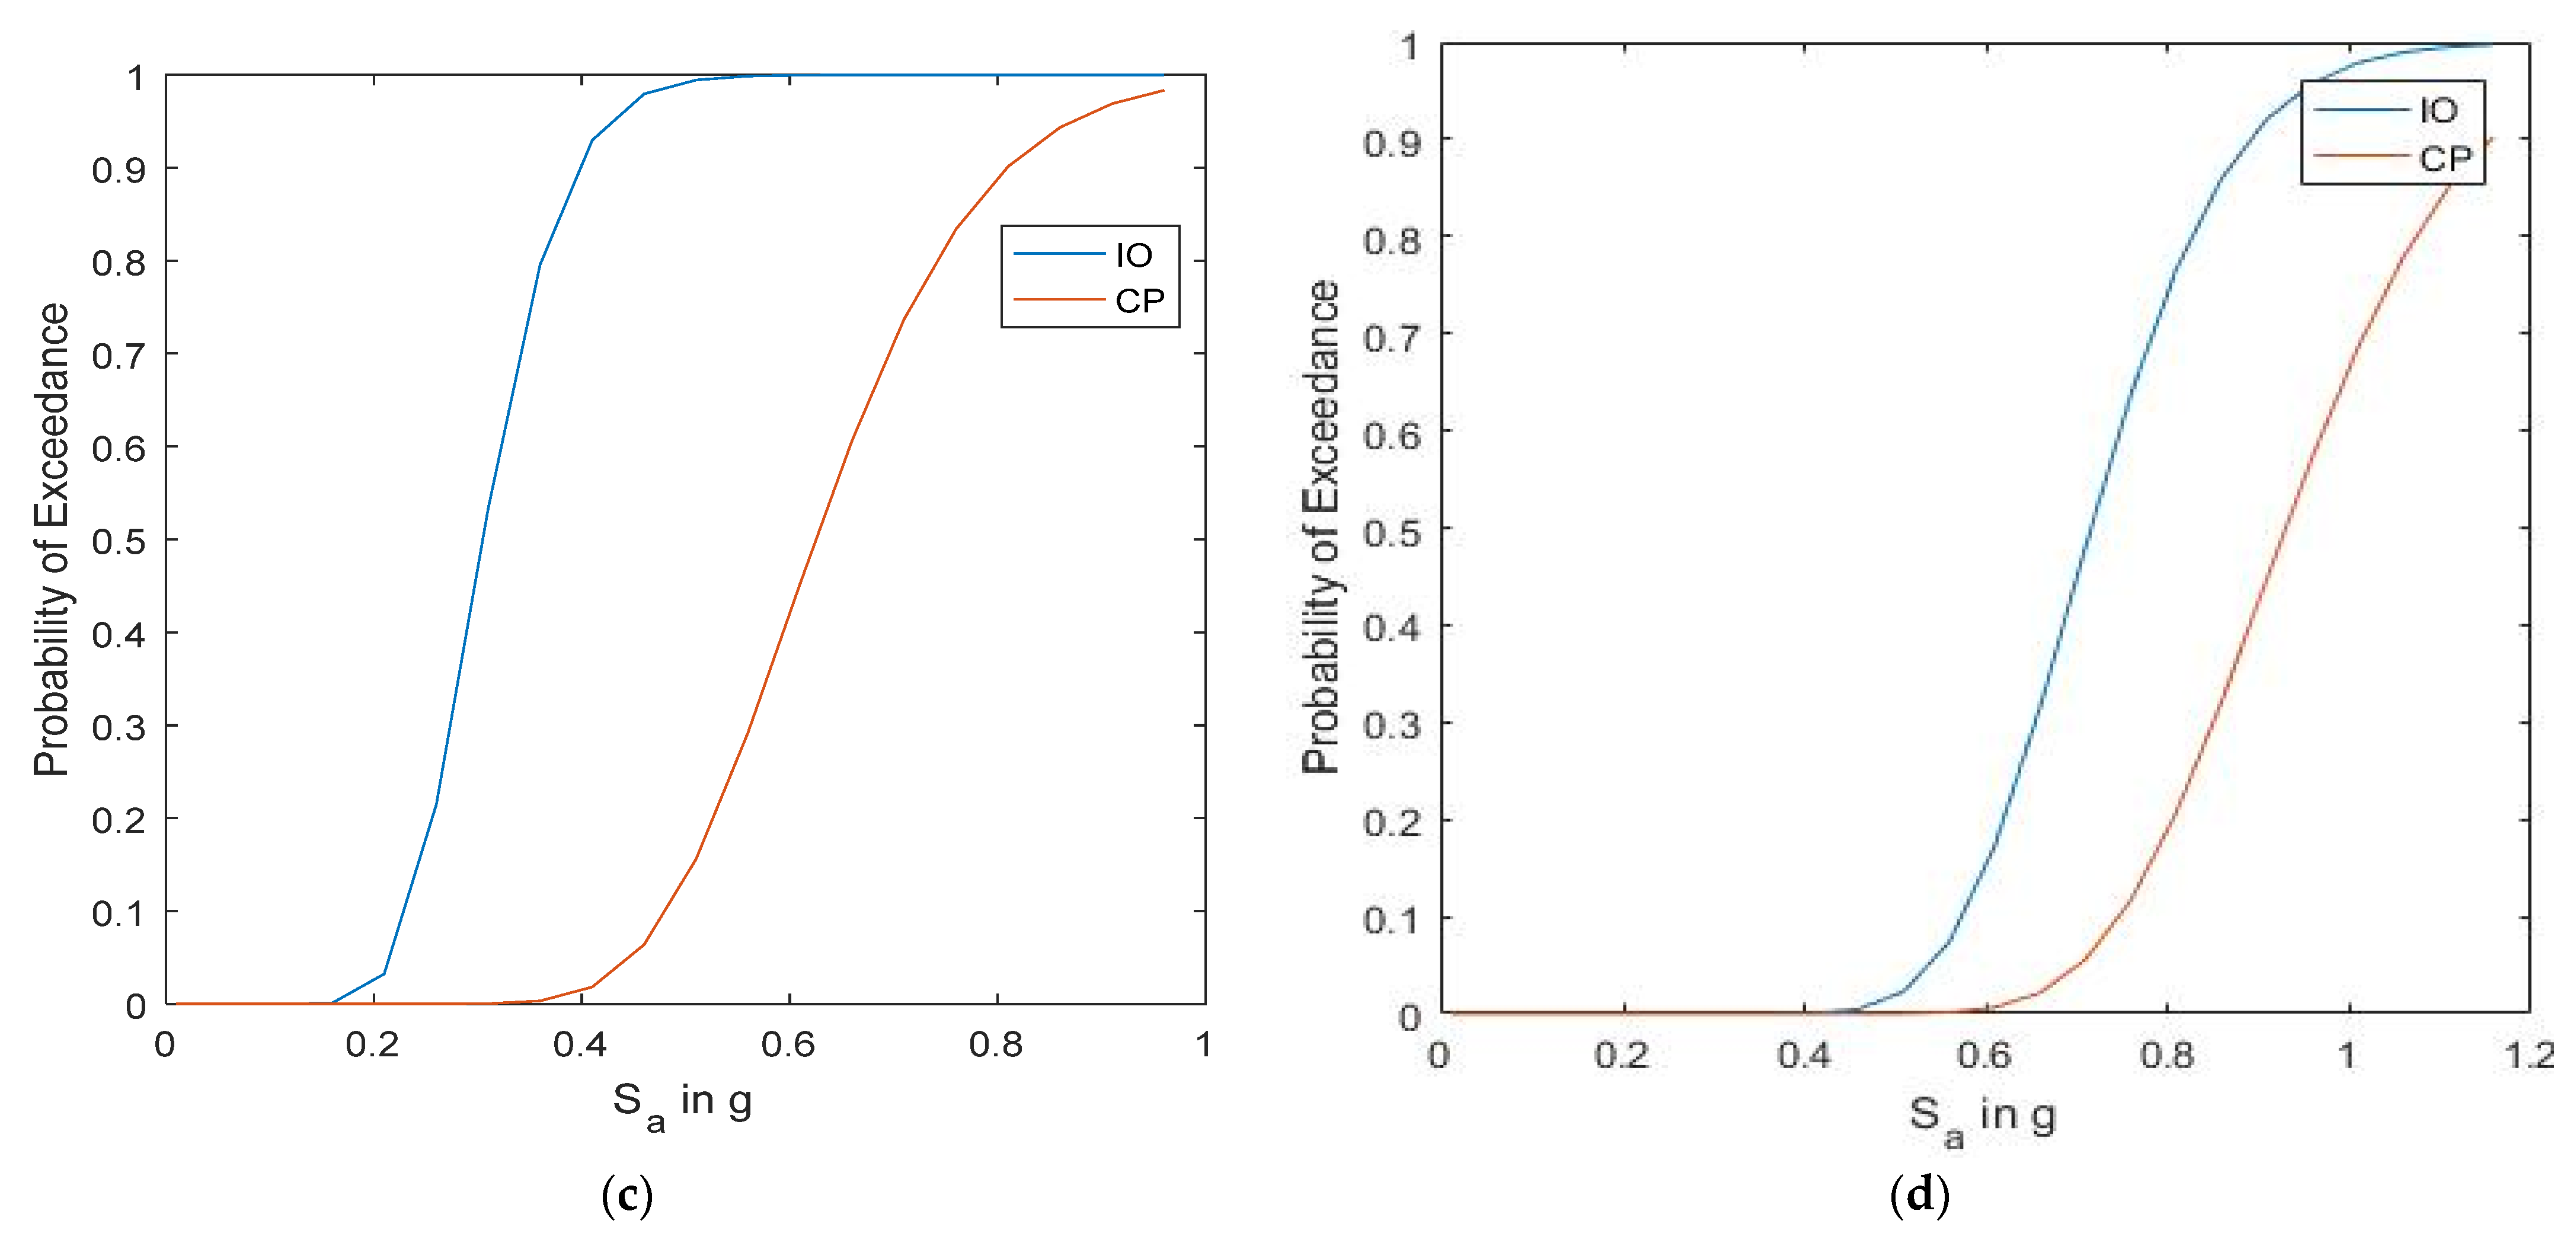
- The distribution of results within the fragility curves suggests that the number of stories only has a marginal impact on damage probabilities. Despite the distinct and unique structural characteristics of each building, there is a general trend of increasing damage probabilities as the number of stories increases. Additionally, it is noteworthy that the disparities between the IO and higher damage cases (CP) are considerably pronounced in both two- and three-story school buildings;
- -
- The observed variation in fragility from two to three stories indicates that the number of stories is not as influential as other parameters for low to mid-rise buildings. In essence, the most influential factors that distinctly characterize or differentiate the fragility curves are the age of construction and outdated design processes. It is important to note that this conclusion holds true for all considered damage cases, including IO and CP;
- -
- It is apparent that the bare frame buildings fully infilled are more vulnerable compared to bare frame typology.
7. Conclusions
- Analysis of the IDA curves reveals a clear vulnerability in the longitudinal direction for both the two- and three-story RC school buildings. This vulnerability is marked by a notable reduction in lateral story stiffness and a diminished moment capacity in the longitudinal beams;
- Furthermore, the significant rotation observed in the beam–column joints at the first-story level ultimately leads to the failure of the longitudinal beams. This failure occurs as plastic hinges form at the junction of the beam and beam–column joint;
- Upon comparing the pushover curves with the well-documented trends in the scientific literature concerning newly designed buildings, a significant observation comes to light. It becomes increasingly apparent that the seismic vulnerability of low-ductile RC frames, initially not intended to withstand earthquake forces, continues to be a persistent concern in regions with low-to-medium seismic activity, such as Sri Lanka;
- In accordance with the design spectrum specific to Sri Lanka, the spectral acceleration values for the first mode periods hover around 0.25 g. Under this level of excitation, the likelihood of achieving the IO and CP performance objectives for two-story school buildings is approximately 75% and 25%, respectively. Meanwhile, for three-story school buildings, these probabilities are approximately 50% and 10%, respectively. Hence, it can be deduced that introducing a section with an increased moment capacity for the longitudinal beams (while still maintaining a moment capacity lower than that of the column in the longitudinal direction) can effectively delay structural failure. This modification would enhance the building’s capacity to withstand more substantial earthquakes and significantly improve its overall seismic performance;
- Despite the individual and distinctive structural attributes of each building, there exists a broad trend of heightened damage probabilities as the number of stories increases. Moreover, it is important to highlight that the disparities between the IO and more severe damage cases such as CP are quite pronounced in both two- and three-story school buildings;
- Of paramount importance, the damage index that approaches the CP performance level is evident in the case of the two-story school building when subjected to an earthquake with a PGA of 0.52 g. Likewise, an IO performance level is attained when the earthquake registers a PGA of 0.33 g. As for the three-story school buildings, the damage index approaches the CP performance level during an earthquake with a PGA of 1.1 g, and an IO performance level is reached at a PGA of 0.35 g;
- A limitation of this research is the relatively small number of buildings included in the study. This limited sample size may not comprehensively represent the diversity of building types and construction techniques found in larger urban contexts. Consequently, this study’s findings and conclusions open the door to more advanced and refined analyses and provide valuable insights into the future direction for assessing these buildings;
- Another limitation of this study is the lack of comprehensive in situ inspections and on-site experimental testing of the selected buildings. This absence impedes the acquisition of a more in-depth understanding of the mechanical properties of the construction materials used in these structures. Consequently, accurately assessing the structural performance and vulnerabilities of the buildings in the study is challenging. Nevertheless, it is worth noting that the mechanical properties employed were based on well-established industry practices during the time of construction. This insight paves the way for potential future developments utilizing non-destructive inspection techniques, which can further enhance our understanding and assessment of these structures.
Author Contributions
Funding
Institutional Review Board Statement
Informed Consent Statement
Data Availability Statement
Conflicts of Interest
References
- Vitanage, P. Seismicity in lineaments–impact on engineering structures; Handbook on Geology and Mineral Resources of Sri Lanka. In Proceedings of the Second South Asia Geological Congress GEOSAS–II, Colombo, Sri Lanka, 19–24 January 1995; pp. 59–62. [Google Scholar]
- Lang, D.H.; Verbicaro, M.I.; Singh, Y.; Prasad, J.S.R.; Diaz, D.W.; Gutièrrez, M. Structural and non-structural seismic vulnerability assessment for schools and hospitals based on questionnaire surveys: Case studies in central America and India. In Proceedings of the 9th US National and 10th Canadian Conference on Earthquake Engineering 2010, Including Papers from the 4th International Tsunami Symposium, Toronto, CA, Canada, 25–29 July 2010; Volume 7, pp. 5875–5884. [Google Scholar]
- Anbazhagan, P.; Murali Krishna, A. Forensic investigation of earthquake induced failures during Sikkim 2011 earthquake, India. In Proceedings of the 15th Asian Regional Conference on Soil Mechanics and Geotechnical Engineering, ARC 2015: New Innovations and Sustainability, Fukuoka, Japan, 9–13 November 2015; pp. 201–206. [Google Scholar]
- Rautela, P.; Joshi, G.C.; Bhaisora, B.; Dhyani, C.; Ghildiyal, S.; Rawat, A. Seismic vulnerability of Nainital and Mussoorie, two major Lesser Himalayan tourist destinations of India. Intl. J. Disaster Risk Red. 2015, 13, 400–408. [Google Scholar] [CrossRef]
- Khan, S.U.; Qureshi, M.I.; Rana, I.A.; Maqsoom, A. Seismic vulnerability assessment of building stock of Malakand (Pakistan) using FEMA P-154 method. SN Appl. Sci. 2019, 1, 1625. [Google Scholar] [CrossRef]
- Ghimire, N.; Chaulagain, H. Seismic vulnerability assessment of reinforced concrete school building in Nepal. Asian J. Civ. Eng. 2021, 22, 249–262. [Google Scholar] [CrossRef]
- Giordano, N.; De Luca, F.; Sextos, A. Analytical fragility curves for masonry school building portfolios in Nepal. Bull. Earthq. Eng. 2021, 19, 1121–1150. [Google Scholar] [CrossRef]
- Praticò, L.; Bovo, M.; Buratti, N.; Savoia, M. Large-scale seismic damage scenario assessment of precast buildings after the May 2012 Emilia earthquake. Bull. Earthq. Eng. 2022, 20, 8411–8444. [Google Scholar] [CrossRef]
- Belleri, A.; Brunesi, E.; Nascimbene, R.; Pagani, M.; Riva, P. Seismic performance of precast industrial facilities following major earthquakes in the Italian territory. J. Perform. Constr. Facil. 2015, 29, 04014135. [Google Scholar] [CrossRef]
- Loporcaro, G.; Cuevas, A.; Pampanin, S.; Kral, M. Monotonic and low-cycle fatigue properties of earthquake-damaged New Zealand steel reinforcing bars. The experience after the Christchurch 2010/2011 earthquakes. Procedia Struct. Integr. 2018, 11, 194–201. [Google Scholar] [CrossRef]
- Mantawy, A.; Anderson, J. Ductility of reinforced concrete frame buildings subjected to the recent New Zealand earthquakes. In Proceedings of the IABSE Conference, Geneva 2015, Structural Engineering: Providing Solutions to Global Challenges–Report, Geneva, Switzerland, 23–25 September 2015; pp. 1701–1708. [Google Scholar]
- Kam, W.Y.; Pampanin, S. The seismic performance of RC buildings in the 22 February 2011 Christchurch earthquake. Struct. Concr. 2011, 12, 223–233. [Google Scholar] [CrossRef]
- Sarrafzadeh, M.; Elwood, K.J.; Dhakal, R.P.; Ferner, H.; Pettinga, D.; Stannard, M.; Maeda, M.; Nakano, Y.; Mukai, T.; Koike, T. Performance of reinforced concrete buildings in the 2016 Kumamoto earthquakes and seismic design in Japan. Bull. N. Z. Soc. Earthq. Eng. 2017, 50, 394–405. [Google Scholar] [CrossRef]
- Torisawa, K.; Horie, K.; Matsuoka, M.; Inoguchi, M.; Yamazaki, F. Analysis of building damage in Uki City due to the 2016 Kumamoto earthquake. In Proceedings of the 29th European Safety and Reliability Conference, ESREL, Hannover, Germany, 22–26 September 2019; pp. 1478–1485. [Google Scholar]
- Bosio, M.; Di Salvatore, C.; Bellotti, D.; Capacci, L.; Belleri, A.; Piccolo, V.; Cavalieri, F.; Lago, B.; Riva, P.; Magliulo, G.; et al. Modelling and Seismic Response Analysis of Non-residential Single-storey Existing Precast Buildings in Italy. J. Earthq. Eng. 2023, 27, 1047–1068. [Google Scholar] [CrossRef]
- Adalier, K.; Aydingun, O. Structural engineering aspects of the 27 June 1998 Adana-Ceyhan (Turkey) earthquake. Eng. Struct. 2001, 23, 343–355. [Google Scholar] [CrossRef]
- Saatcioglu, M.; Mitchell, D.; Tinawi, R.; Gadner, N.J.; Gillies, G.; Ghobarah, A.; Anderson, D.L.; Lau, D. Kocaeli (Turkey) earthquake-damage to structures. Can. J. Civ. Eng. 2001, 28, 715–773. [Google Scholar]
- Sezen, H.; Whittaker, A.S. Seismic performance of industrial facilities affected by the 1999 Turkey earthquake. J. Perform. Constr. Facil. 2006, 20, 28–36. [Google Scholar] [CrossRef]
- Toniolo, G.; Colombo, A. Precast concrete structures: The lessons learned from the L’Aquila earthquake. Struct. Concr. 2012, 13, 73–83. [Google Scholar] [CrossRef]
- Augenti, N.; Parisi, F. Learning from construction failures due to the 2009 L’Aquila, Italy, earthquake. J. Perform. Constr. Facil. 2010, 24, 536–555. [Google Scholar] [CrossRef]
- Ghosh, S.K.; Cleland, N. Observations from the 27 February 2010, earthquake in Chile. PCI J. 2012, 57, 52–75. [Google Scholar] [CrossRef]
- Lauciani, V.; Faenza, L.; Michelini, A. ShakeMaps during the Emilia sequence. Ann. Geophys. 2012, 55, 631–637. [Google Scholar]
- Belleri, A.; Torquati, M.; Riva, P.; Nascimbene, R. Vulnerability assessment and retrofit solutions of precast industrial structures. Earthq. Struct. 2015, 8, 801–820. [Google Scholar]
- Seneviratne, H.N.; Perera, L.R.K.; Wijesundara, K.K.; Dananjaya, R.M.S.; Jayawardena, U. Seismicity around Sri Lanka from historical records and its engineering implications. J. Instit. Eng. Sri Lanka 2020, 80, 47–52. [Google Scholar] [CrossRef]
- Weerasinghe, D.R.; Seneviratne, H.N.; Kurukulasuriya, L.C.; Wijesundara, K.K. Seismic Response of Sri Lanka using DSHA Technique. J. Instit. Eng. Sri Lanka 2020, 80, 33–37. [Google Scholar] [CrossRef]
- Seneviratne, H.N.; Wijesundara, K.K.; Perera, L.R.K.; Dissanayake, P.B.R. A Macro Seismic Hazard Zonation for Sri Lanka. J. Instit. Eng. Sri Lanka 2020, 80, 37–44. [Google Scholar] [CrossRef]
- Cosenza, E.; Manfredi, G.; Ramasco, R. The use of damage functionals in earthquake engineering: A comparison between different methods. Earthq. Eng. Struct. Dyn. 1993, 22, 855–868. [Google Scholar] [CrossRef]
- Bozorgnia, Y.; Bertero, V.V. Evaluation of damage potential of recorded earthquake ground motion. In Proceedings of the 96th Annual Meeting of Seismological Society of America, San Francisco, CA, USA, 17–21 April 2001. [Google Scholar]
- Erberik, M.A.; Elnashai, A.S. Fragility analysis of flat-slab structures. Eng. Struct. 2004, 26, 937–948. [Google Scholar] [CrossRef]
- Martinez, M.E. Performance-Based Seismic Design and Probabilistic Assessment of Reinforced Concrete Moment Resisting Frame Structures. Master’s Thesis, University of Canterbury, Christchurch, New Zealand, 2002. [Google Scholar]
- Vamvatsikos, D.; Cornell, C.A. Incremental dynamic analysis. Earthq. Eng. Struct. Dyn. 2002, 31, 491–514. [Google Scholar] [CrossRef]
- Vamvatsikos, D.; Cornell, C.A. Applied Incremental Dynamic Analysis. Earthq. Spectra 2004, 20, 523–553. [Google Scholar] [CrossRef]
- Vamvatsikos, D.; Cornell, C.A. Direct Estimation of Seismic Demand and Capacity of Multidegree-of-Freedom Systems through Incremental Dynamic Analysis of Single Degree of Freedom Approximation. J. Struct. Eng. 2005, 131, 589–599. [Google Scholar] [CrossRef]
- Marjanishvili, S.M. Progressive analysis procedure for progressive collapse. J. Perf. Constr. Fac. ASCE 2004, 18, 79–85. [Google Scholar] [CrossRef]
- Pretlove, A.J.; Ramsden, M.; Atkins, A.G. Dynamic effects in progressive failure of structures. Int. J. Impact Eng. 1991, 11, 539–546. [Google Scholar] [CrossRef]
- Mazzoni, S.; McKenna, F.; Scott, M.; Fenves, G. Open System for Earthquake Engineering Simulation (OpenSees); User Command Language Manual: Pacific Earthquake Engineering Research Center; University of California: Berkeley, CA, USA, 2006; Available online: http://opensees.berkeley.edu/AddingYourCode.pdf (accessed on 23 February 2023).
- Spacone, E.; Filippou, F.C.; Taucer, F.F. Fiber beam column model for nonlinear analysis of RC frames. I: Formulation. Earthq. Eng. Struct. Dyn. 1996, 25, 711–725. [Google Scholar] [CrossRef]
- Pinho, R.; Bhatt, C.; Antoniou, S.; Bento, R. Modelling of the horizontal slab of a 3D irregular building for nonlinear static assessment. In Proceedings of the 14th World Conference on Earthquake Engineering, Beijing, China, 12–17 October 2008. [Google Scholar]
- Bull, D.K. Understanding the Complexities of Designing Diaphragms in Buildings for Earthquakes. Bull. N. Z. Soc. Earthq. Eng. 2004, 37, 70–88. [Google Scholar] [CrossRef]
- Mpampatsikos, V.; Nascimbene, R.; Petrini, L. A critical review of the R.C. frame existing building assessment procedure according to eurocode 8 and Italian seismic code. J. Earthq. Eng. 2008, 12, 52–82. [Google Scholar] [CrossRef]
- Nascimbene, R. Numerical model of a reinforced concrete building: Earthquake analysis and experimental validation. Period. Polytech. Civ. Engng 2015, 59, 521–530. [Google Scholar] [CrossRef]
- Kent, D.C.; Park, R. Flexural members with confined concrete. ASCE J. Struct. Eng. 1969, 97, 1969–1990. [Google Scholar] [CrossRef]
- Karsan, I.D.; Jirsa, J.O. Behaviour of concrete under compressive loadings. J. Struct. Div. 1969, 95, 2543–2563. [Google Scholar] [CrossRef]
- Demir, A.; Palanci, M.; Kayan, A.H. Evaluation of Supplementary Constraints on Dispersion of EDPs Using Real Ground Motion Record Sets. Arab. J. Sci. Eng. 2020, 45, 8379–8401. [Google Scholar] [CrossRef]
- Demir, A.; Palanci, M.; Kayan, A.H. Probabilistic assessment for spectrally matched real ground motion records on distinct soil profiles by simulation of SDOF systems. Earthq. Struct. 2021, 21, 395–411. [Google Scholar]
- PEER. Pacific Earthquake Engineering Research Center (PEER) Ground Motion Database; University of California: Berkeley, CA, USA, 2006; Available online: https://peer.berkeley.edu/peer-strong-ground-motion-databases (accessed on 10 September 2023).
- Venkatesan, S.; Gamage, P. Development of seismic hazard maps for Sri Lanka. In Proceedings of the 11th Canadian Conference on Earthquake Engineering, Victoria, BC, Canada, 21–24 July 2015. [Google Scholar]
- Global Earthquake Model (GEM) Global Seismic Hazard Map (Version 2018.1). Available online: https://downloads.openquake.org/countryprofiles/LKA.pdf (accessed on 14 September 2023).
- Dananjaya, R.M.S.; Wijesundara, K.K.; Seneviratne, H.N.; Dissanayake, P.B.R. Determination of Response Spectra for Sri Lankan Cities using Finite Difference Method. Engineer 2020, 53, 45–52. [Google Scholar] [CrossRef]
- Karakas, C.C.; Palanci, M.; Senel, S.M. Fragility based evaluation of diferent code based assessment approaches for the performance estimation of existing buildings. Bull. Earthq. Eng. 2022, 20, 1685–1716. [Google Scholar] [CrossRef]
- Cornell, C.; Jalayer, F.; Hamburger, R.; Foutch, D. Probabilistic Basis for 2000 Sac Federal Emergency Management Agency Steel Moment Frame Guidelines. J. Struct. Eng. 2002, 128, 526–533. [Google Scholar] [CrossRef]


| No | Event | Year | Mw | Rjb [km] | Rrup [km] | Vs30 [m/s] | PGA [g] | PGV [cm/] | PGD [cm] |
|---|---|---|---|---|---|---|---|---|---|
| 1 | Whittier Narrows-01 | 1987 | 5.99 | 14.9 | 20.8 | 245 | 0.3 | 37.6 | 4.9 |
| 2 | Irpinia, Italy-01 | 1980 | 6.9 | 22.5 | 22.6 | 561 | 0.22 | 14.2 | 3.2 |
| 3 | Whittier Narrows-01 | 1987 | 5.99 | 4.5 | 17.4 | 368 | 0.3 | 20.9 | 3.1 |
| 4 | Whittier Narrows-01 | 1987 | 5.99 | 18.3 | 23.4 | 267 | 0.33 | 27 | 5 |
| 5 | Loma Prieta | 1989 | 6.93 | 24.3 | 24.6 | 240 | 0.17 | 25.9 | 12.6 |
| 6 | Friuli, Italy-01 | 1976 | 6.5 | 15.0 | 15.8 | 505 | 0.35 | 22 | 4.1 |
| 7 | Kocaeli, Turkey | 1999 | 7.51 | 68.1 | 69.6 | 175 | 0.25 | 40 | 28.4 |
| 8 | Loma Prieta | 1989 | 6.93 | 8.8 | 9.6 | 1428 | 0.41 | 31.6 | 6.3 |
| 9 | Loma Prieta | 1989 | 6.93 | 13.8 | 14.3 | 222 | 0.42 | 38.7 | 7.1 |
| 10 | Loma Prieta | 1989 | 6.93 | 17.9 | 18.3 | 663 | 0.13 | 12.7 | 4.7 |
| 11 | Loma Prieta | 1989 | 6.93 | 79.7 | 79.8 | 584 | 0.23 | 38 | 11.4 |
| 12 | Coalinga-01 | 1983 | 6.36 | 23.8 | 24.0 | 275 | 0.23 | 23.6 | 5.8 |
| 13 | Imperial Valley-06 | 1979 | 6.53 | 22.0 | 22.0 | 242 | 0.35 | 33 | 19 |
| 14 | Kobe, Japan | 1995 | 6.9 | 22.5 | 22.5 | 312 | 0.34 | 27.7 | 9.6 |
| 15 | San Fernando | 1971 | 6.61 | 22.2 | 27.4 | 425 | 0.19 | 5.6 | 0.9 |
| 16 | San Fernando | 1971 | 6.61 | 14.0 | 19.3 | 602 | 0.37 | 16.8 | 1.6 |
| 17 | Northridge-01 | 1994 | 6.69 | 20.1 | 20.7 | 450 | 0.57 | 51.9 | 9 |
| 18 | Chalfant Valley-01 | 1986 | 5.77 | 23.4 | 23.5 | 303 | 0.13 | 8.5 | 2.4 |
| 19 | Tabas, Iran | 1978 | 7.35 | 0.0 | 13.9 | 472 | 0.333 | 20.4 | 11.6 |
| 20 | Duzce, Turkey | 1999 | 7.14 | 9.1 | 9.1 | 338 | 0.11 | 11.2 | 9.8 |
| 21 | Nahanni, Canada | 1985 | 6.76 | 0.0 | 4.9 | 605 | 0.32 | 33 | 6.6 |
| 22 | Parkfield | 1966 | 6.19 | 9.6 | 9.6 | 290 | 0.37 | 21.8 | 3.8 |
| 23 | Corinth, Greece | 1981 | 6.6 | 10.3 | 10.3 | 361 | 0.24 | 23.4 | 11.6 |
| 24 | Spitak, Armenia | 1988 | 6.77 | 24.0 | 24.0 | 344 | 0.2 | 28.6 | 9.7 |
| 25 | Santa Barbara | 1978 | 5.92 | 0.0 | 12.2 | 515 | 0.2 | 16.3 | 3 |
| 26 | Landers | 1992 | 7.28 | 23.6 | 23.6 | 354 | 0.24 | 51.4 | 43.8 |
| 27 | Kozani, Greece-01 | 1995 | 6.4 | 14.1 | 19.5 | 650 | 0.22 | 9.3 | 1.7 |
| 28 | Northern Calif-01 | 1941 | 6.4 | 44.5 | 44.7 | 219 | 0.12 | 6.3 | 1.1 |
| 29 | Superstition Hills-02 | 1987 | 6.54 | 13.0 | 13.0 | 194 | 0.17 | 23.4 | 13 |
| 30 | El Alamo | 1956 | 6.8 | 121.0 | 121.7 | 213 | 0.05 | 6.6 | 5 |
| IO Performance Level | CP Performance Level | |
|---|---|---|
| Inter-story drift ratio (two storys) | 0.80 | 1.75 |
| Inter-story drift ratio (three storys) | 1.03 | 3.43 |
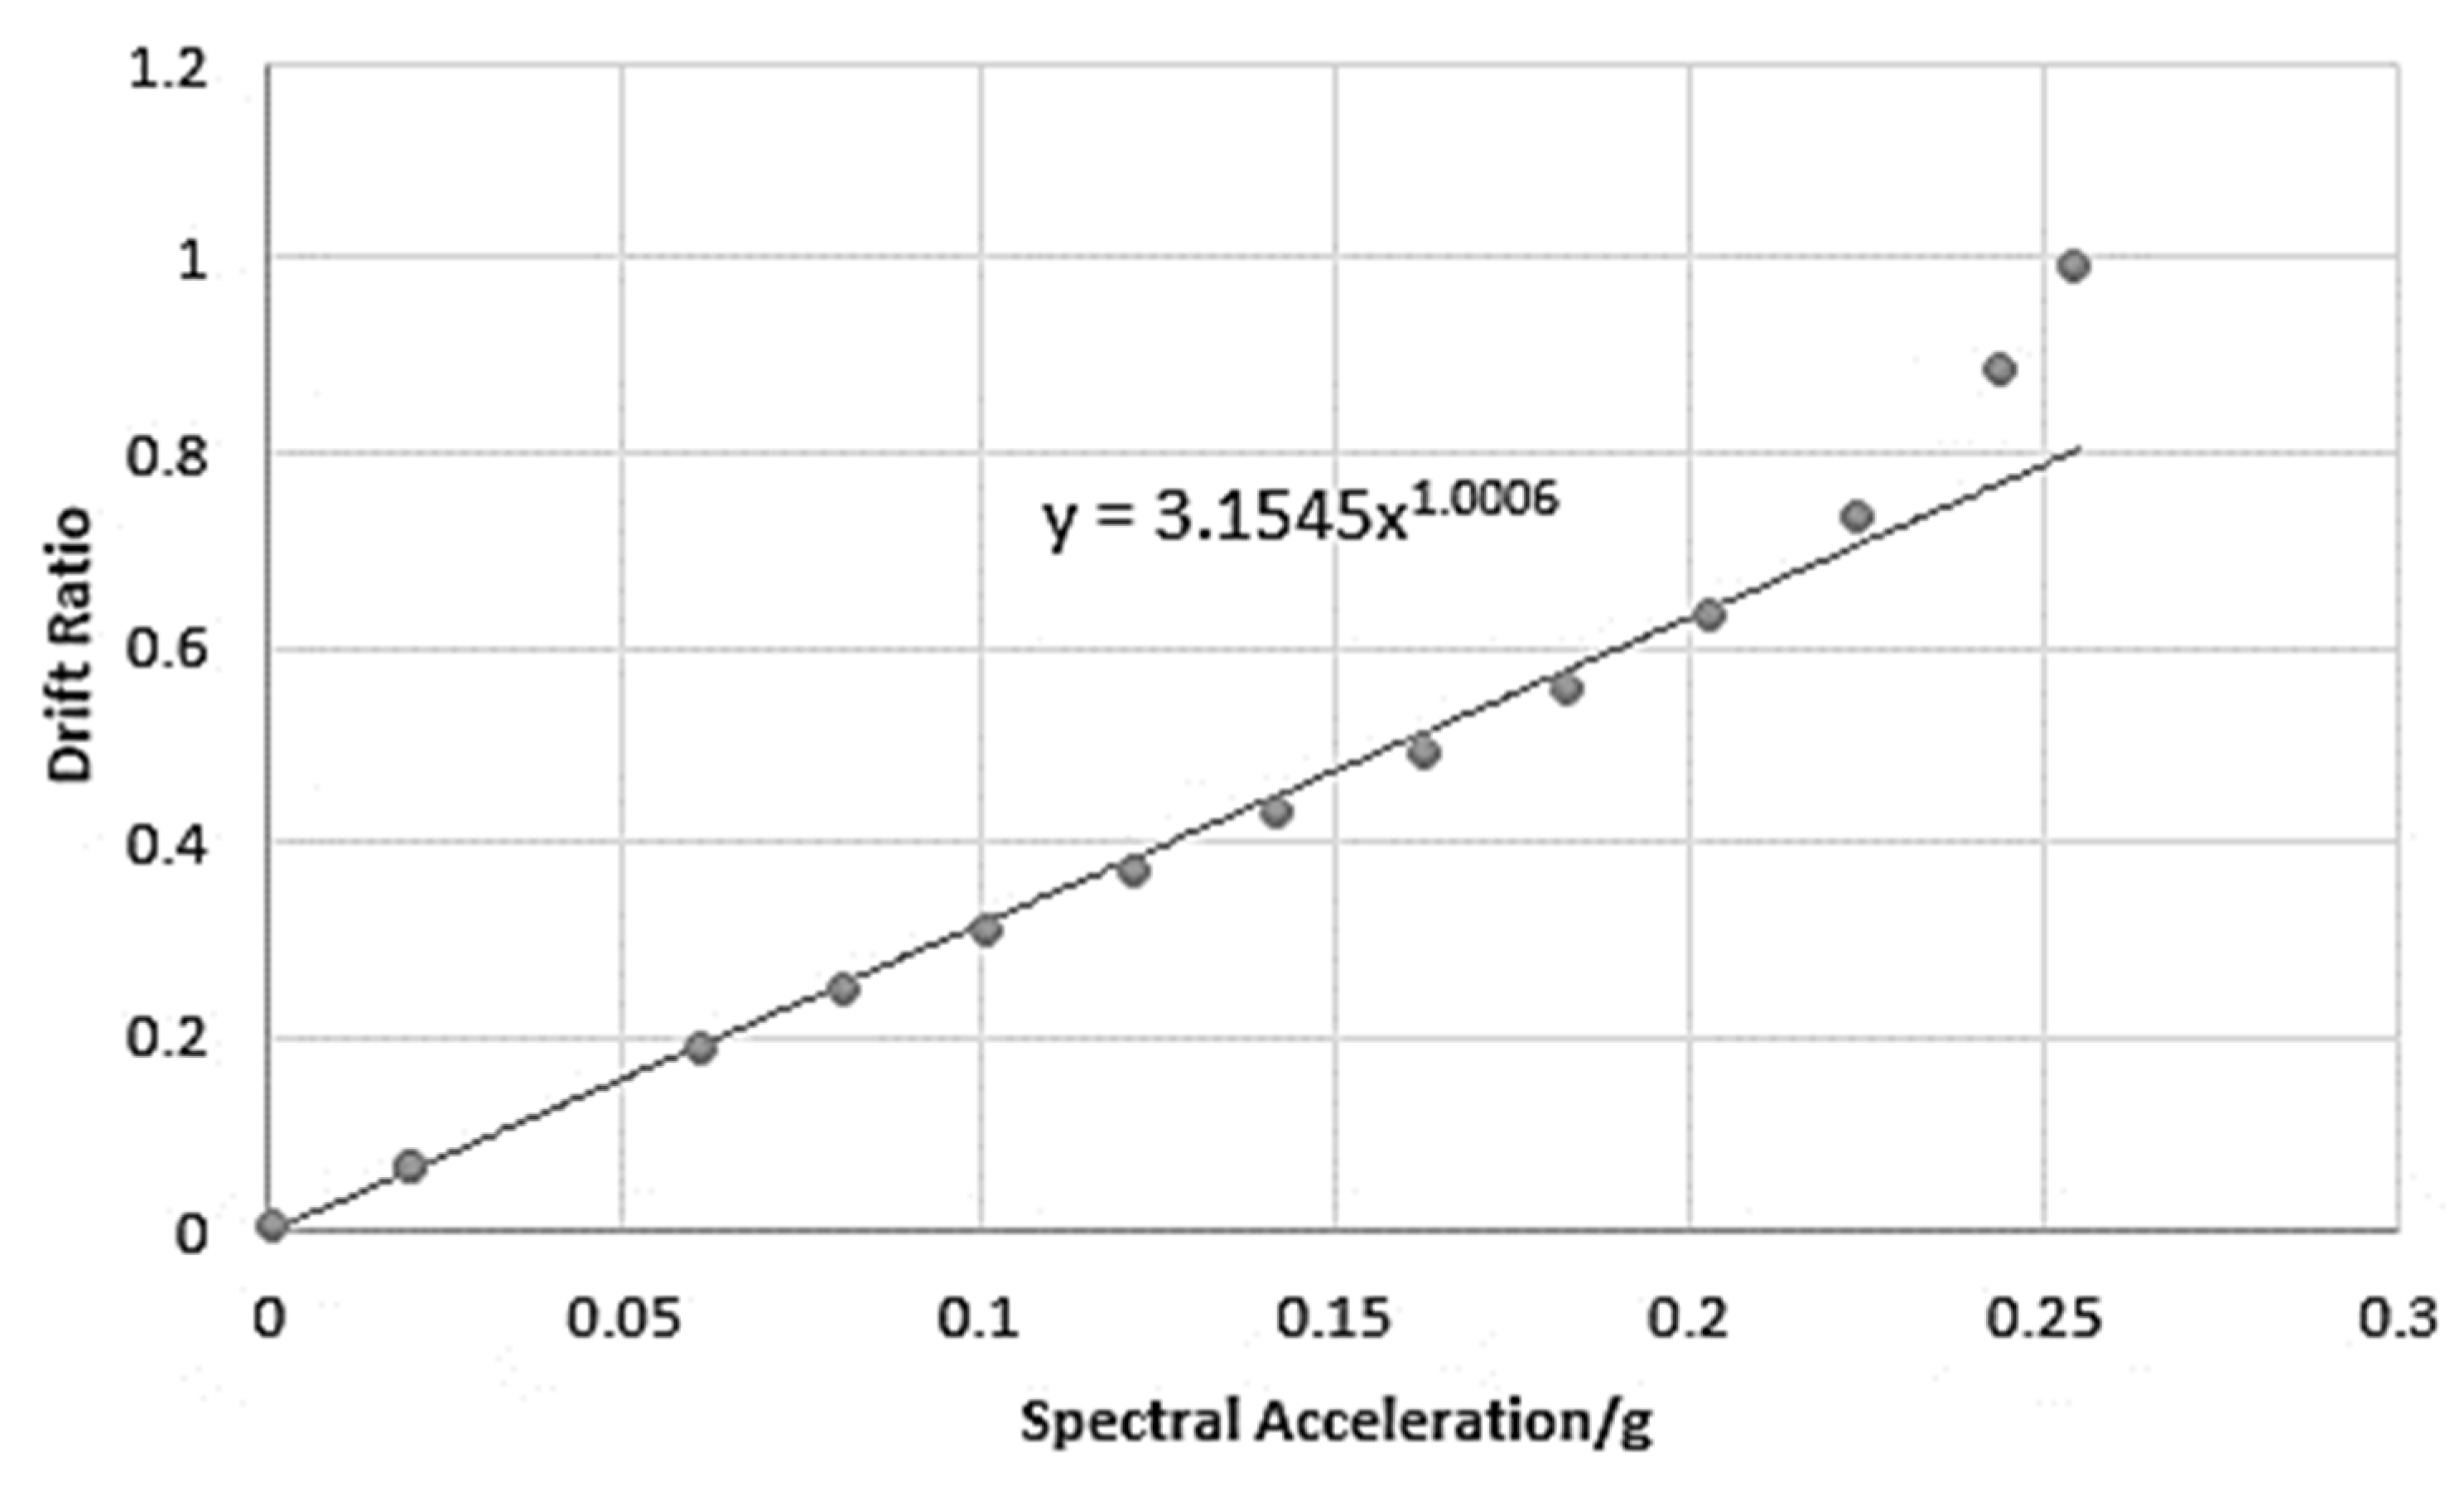
| a | b | |
|---|---|---|
| Two-story building | 3.0776 | 1.2545 |
| Three-story building | 3.1545 | 1.0060 |
Disclaimer/Publisher’s Note: The statements, opinions and data contained in all publications are solely those of the individual author(s) and contributor(s) and not of MDPI and/or the editor(s). MDPI and/or the editor(s) disclaim responsibility for any injury to people or property resulting from any ideas, methods, instructions or products referred to in the content. |
© 2023 by the authors. Licensee MDPI, Basel, Switzerland. This article is an open access article distributed under the terms and conditions of the Creative Commons Attribution (CC BY) license (https://creativecommons.org/licenses/by/4.0/).
Share and Cite
Abeysiriwardena, T.M.; Wijesundara, K.K.; Nascimbene, R. Seismic Risk Assessment of Typical Reinforced Concrete Frame School Buildings in Sri Lanka. Buildings 2023, 13, 2662. https://doi.org/10.3390/buildings13102662
Abeysiriwardena TM, Wijesundara KK, Nascimbene R. Seismic Risk Assessment of Typical Reinforced Concrete Frame School Buildings in Sri Lanka. Buildings. 2023; 13(10):2662. https://doi.org/10.3390/buildings13102662
Chicago/Turabian StyleAbeysiriwardena, Tharindu Malinga, Kushan Kalmith Wijesundara, and Roberto Nascimbene. 2023. "Seismic Risk Assessment of Typical Reinforced Concrete Frame School Buildings in Sri Lanka" Buildings 13, no. 10: 2662. https://doi.org/10.3390/buildings13102662
APA StyleAbeysiriwardena, T. M., Wijesundara, K. K., & Nascimbene, R. (2023). Seismic Risk Assessment of Typical Reinforced Concrete Frame School Buildings in Sri Lanka. Buildings, 13(10), 2662. https://doi.org/10.3390/buildings13102662