Article

Experimental Study on the Flexural Performance of Composite Beams with Corrugated Steel Webs under the Coupled Effect of Chloride Ion Erosion and Sustained Load

1
Research Institute of Highway Ministry of Transport, Beijing 100088, China
2
Key Laboratory of Transportation Industry for Old Bridge Inspection and Reinforcement, Beijing 100088, China
3
School of Civil Engineering, Sun Yat-Sen University, Guangzhou 510275, China
4
Shandong Provincial Communications Planning and Design Institute Group Co., Ltd., Jinan 250101, China
5
School of Civil Engineering, Beijing Jiaotong University, Beijing 100044, China
*
Author to whom correspondence should be addressed.
Buildings 2023, 13(10), 2611; https://doi.org/10.3390/buildings13102611
Submission received: 25 September 2023 / Revised: 10 October 2023 / Accepted: 14 October 2023 / Published: 16 October 2023
(This article belongs to the Special Issue Non-linear Behavior and Design of Steel Structures)

Abstract

:
The steel corrosion of composite beams with corrugated steel webs (CBCSWs) is prone to occur in a chloride environment, and the load can change the rate of steel corrosion, thereby affecting the degradation of the mechanical properties of CBCSWs. In this paper, the flexural behavior of CBCSWs under the coupled effect of chloride ion erosion and sustained load was studied through an accelerated corrosion test and bending failure test. The results showed that, during the accelerated corrosion test, the deflection at the mid-span of the corroded CBCSWs increased more and faster than that of the uncorroded CBCSWs, and the stress of the externally prestressed tendons of the CBCSWs did not change significantly. During the loading failure process, the relative slip between the web and the concrete plates of the corroded CBCSWs had not been fully developed. The ultimate load and ultimate deflection of the corroded CBCSWs were decreased by 41.1% and 17.9%, respectively, compared to those of the CBCSWs before corrosion. The quasi-plane section assumption was still approximately applicable to the corroded CBCSWs. Compared with the uncorroded CBCSWs, the shear lag effect of the top plate of the corroded CBCSWs was more obvious. The externally prestressed tendons of the corroded CBCSWs could not give full play to their performance during the process of loading failure.

1. Introduction

Composite beams use corrugated steel webs instead of concrete webs and adopt an external prestressing system, which can effectively reduce the self-weight of beams [1,2], and the application of composite beams with corrugated steel webs (CBCSWs) in bridge engineering can effectively improve the spanning ability of bridges. Corrugated steel webs have high shear buckling strength and lateral stiffness, which means that it is generally not necessary to set additional stiffeners like flat steel webs, as even the thickness of corrugated steel webs is thinner. The buckling modes of corrugated steel webs are divided into local buckling, global buckling, and interactive buckling, and the post-buckling strength of corrugated steel webs is considerable [3]. Since the corrugated steel webs have no ability to resist axial forces, prestress can be efficiently applied to the top and bottom concrete plates of CBCSWs, and the CBCSWs can facilitate the full utilization of the bending resistance of concrete plates and the shear resistance of corrugated steel webs [3,4].
Currently, many scholars have conducted experimental research, theoretical analysis, and numerical simulation on the mechanical behavior of beams with corrugated webs, which lay a foundation for the engineering application of CBCSWs. For the flexural behavior of beams with corrugated webs, through experiments and finite element analysis, Cheng [5] proposed a semi-empirical formula for calculating the ultimate flexural capacity of CBCSWs. Hu [6] conducted a three-dimensional finite element simulation analysis on the flexural performance of CBCSWs. Chen et al. [7] developed a theoretical calculation model of the bending moment of CBCSWs at the ultimate load. Kim et al. [8] developed the prestressed composite beam with corrugated webs and proposed an analysis method to estimate the flexural behavior of the developed prestressed composite beams. For the shear behavior of beams with corrugated webs, Nikoomanesh and Goudarzi [9] investigated the ultimate shear loading capacity of sinusoidal corrugated web beams. Amani et al. [10] studied the shear strength of corrugated web girders made of EN 1.4162/LDX 2101 stainless steel. Zhou et al. [11] proposed a new theoretical formula to calculate the shear stress in a tapered beam with trapezoidal corrugated steel webs by considering the Resal effect. Su et al. [12] analyzed the shear performance of prismatic and tapered beams with corrugated steel webs under different layouts of external prestressing based on finite element simulations. Kanchanadevi et al. [13] investigated the influence of embedment depth, a concrete dowel with or without reinforcement, and an area of dowel bar reinforcements on the shear resistance of a composite system with corrugated steel webs and concrete flanges through push-out tests. Li et al. [14] analyzed the shear ratio of a single-box, four-cell composite box girder with corrugated steel webs through a numerical simulation procedure. In addition, some researchers have also studied the other behaviors of beams with corrugated webs, including the torsional performance [15,16,17,18,19,20], fatigue performance [1,21,22,23], cyclic behavior [24], shear lag effect [25,26,27,28], dynamic characteristics [29,30,31], creep behavior [32], long-term behavior [3,33], natural frequency [34], distortion effect [35], and so on.
The application of CBCSWs in coastal environments faces some issues caused by chloride ion erosion such as corrosion of steel bars, corrosion of corrugated steel webs, and corrosion of prestressing tendons, etc. However, for CBCSWs, steel corrosion not only affects the durability but also reduces the mechanical performance, seismic resistance, etc. At present, there are no studies on the mechanical performance of corroded CBCSWs. During the service life of CBCSWs, they will be subjected to the effects of various loads, and these loads can cause cracks in the top and bottom plates of CBCSWs and also increase the porosity of concrete, thereby providing more channels for chloride ion erosion in concrete under chloride environments and thus changing the corrosion rate of steel bars in the top and bottom plates [36,37,38]. Consequently, studying the mechanical performance of CBCSWs under the coupled effect of chloride ion erosion and sustained load has significant theoretical value and practical engineering significance. However, to the best of the authors’ knowledge, the influence of the coupled effect of chloride ion erosion and sustained load on the mechanical performance of CBCSWs is still unknown and needs to be explored.
To fill this research gap, through an accelerated corrosion test and bending failure test, this paper investigated the flexural behavior of CBCSWs under the coupled effect of chloride ion erosion and a sustained load. Firstly, based on the results of the accelerated corrosion test, the corrosion characteristics of CBCSWs, as well as the variations in deflection at the mid-span of beams and the stress of externally prestressed tendons during the corrosion process, were analyzed. Then, through the bending failure test, the loading failure characteristics of corroded CBCSWs, the relative slip between the plates and the web, the load–deflection curve at the mid-span, the variations in strain, and the variations in stress of externally prestressed tendons during the loading failure process were investigated.

2. Experimental Program

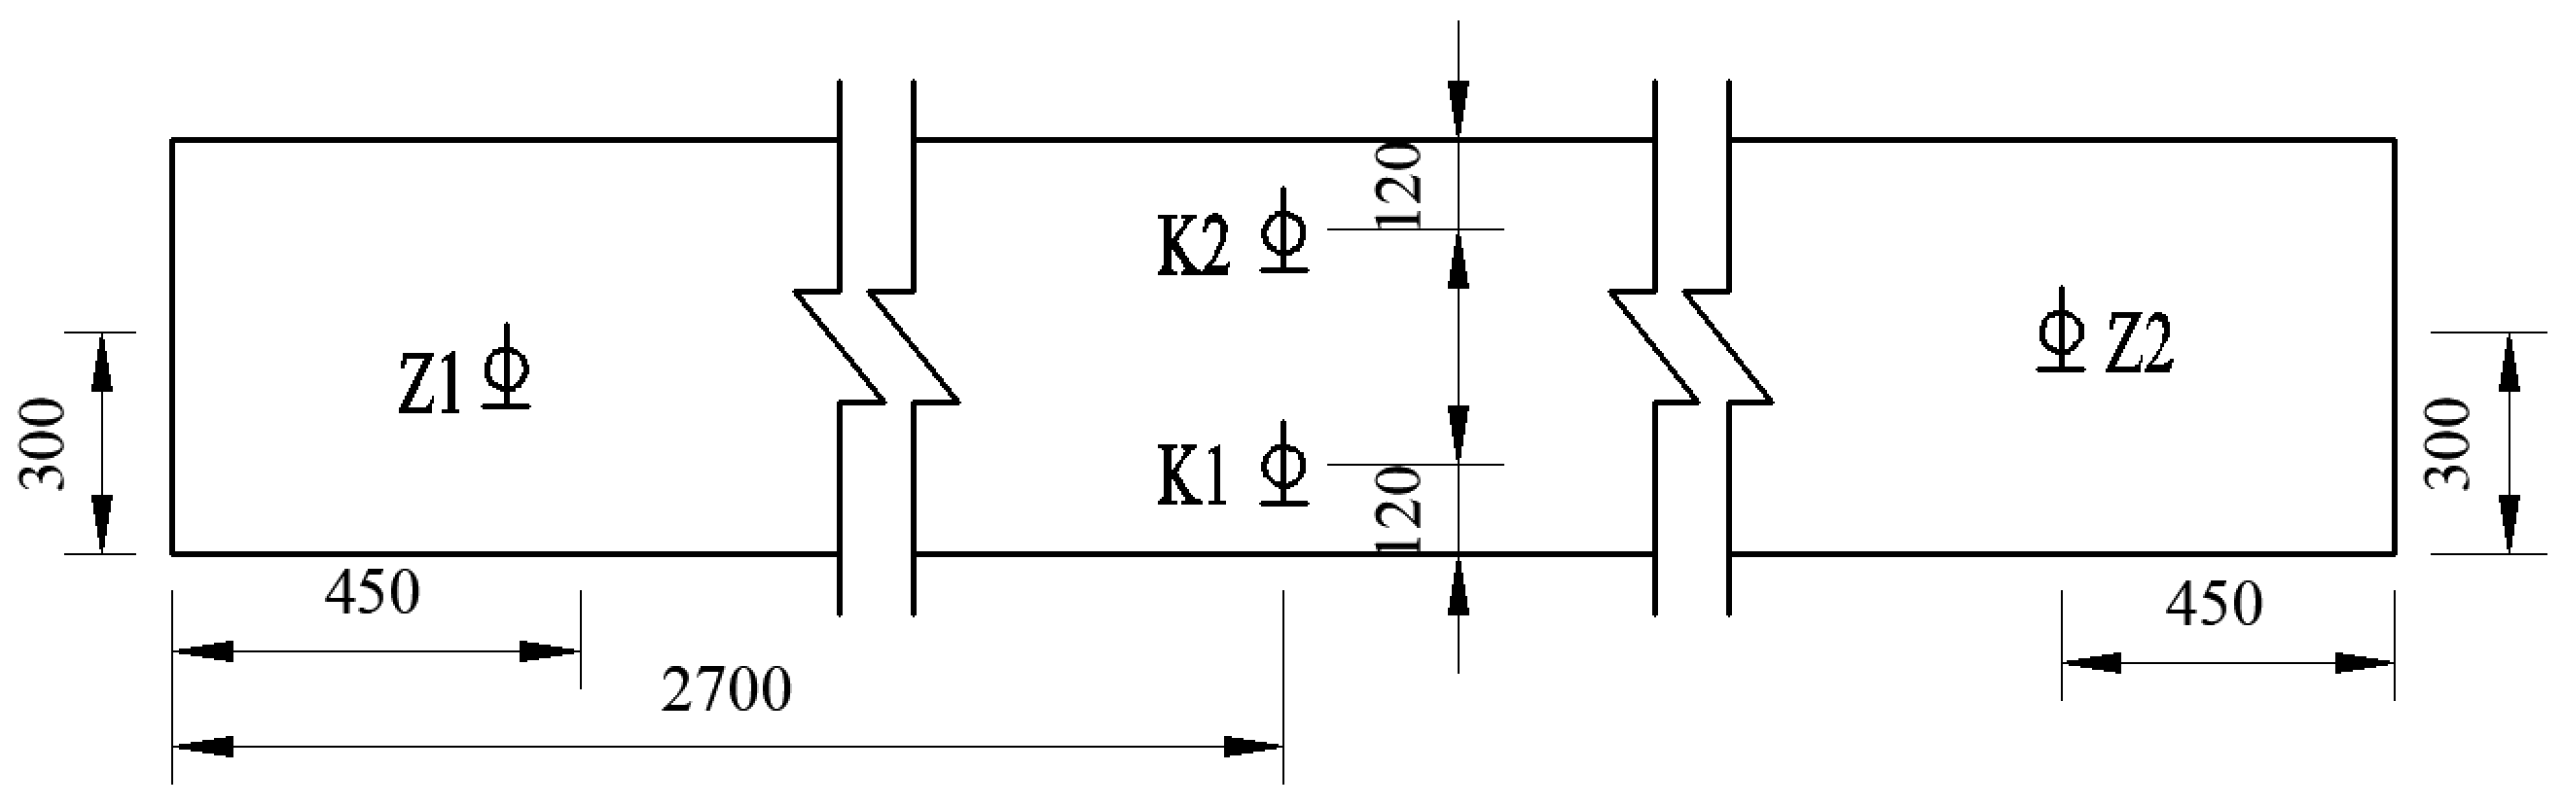
2.1. Design of Beams

Two CBCSWs, labeled as A1 and A2, were designed in the experiment. The two beams had both single-box and single-chamber sections, with a length of 5400 mm, a computed span of 5200 mm, and a height of 450 mm. The top plate of the beams was 1000 mm wide and 75 mm thick, while the bottom plate was 560 mm wide and 75 mm thick. The corrugated steel webs on each side of the beams had a height of 300 mm and a thickness of 3 mm, a wave height of 50 mm, and a wave length of 300 mm. Each beam was equipped with two middle transverse diaphragms and two end transverse diaphragms. As shown in Figure 1, there was a turning block of externally prestressed tendons in every middle transverse diaphragm. Two steel strands (i.e., P1 and P2) with a diameter of 15.24 mm were arranged along the longitudinal folded line of the beams as externally prestressed tendons (Figure 1). The designed tension control stress of externally prestressed tendons was 0.7 fptk (fptk is the standard value of the ultimate tensile strength of prestressed tendons), and the graded tension was carried out by jacks. The sensor displayed the tensile force of the externally prestressed tendons in real time. After the prestress loss was approximately completed, the measured prestress values of the externally prestressed tendons were recorded, and they are listed in Table 1.
The strength grade of concrete was C50, and the mix proportion is listed in Table 2. The corrugated steel webs adopted Q235, while other steel bars were HPB235 with a diameter of 6 mm. The strength and elastic modulus of concrete, steel bars, and steel webs measured by the test are listed in Table 3.

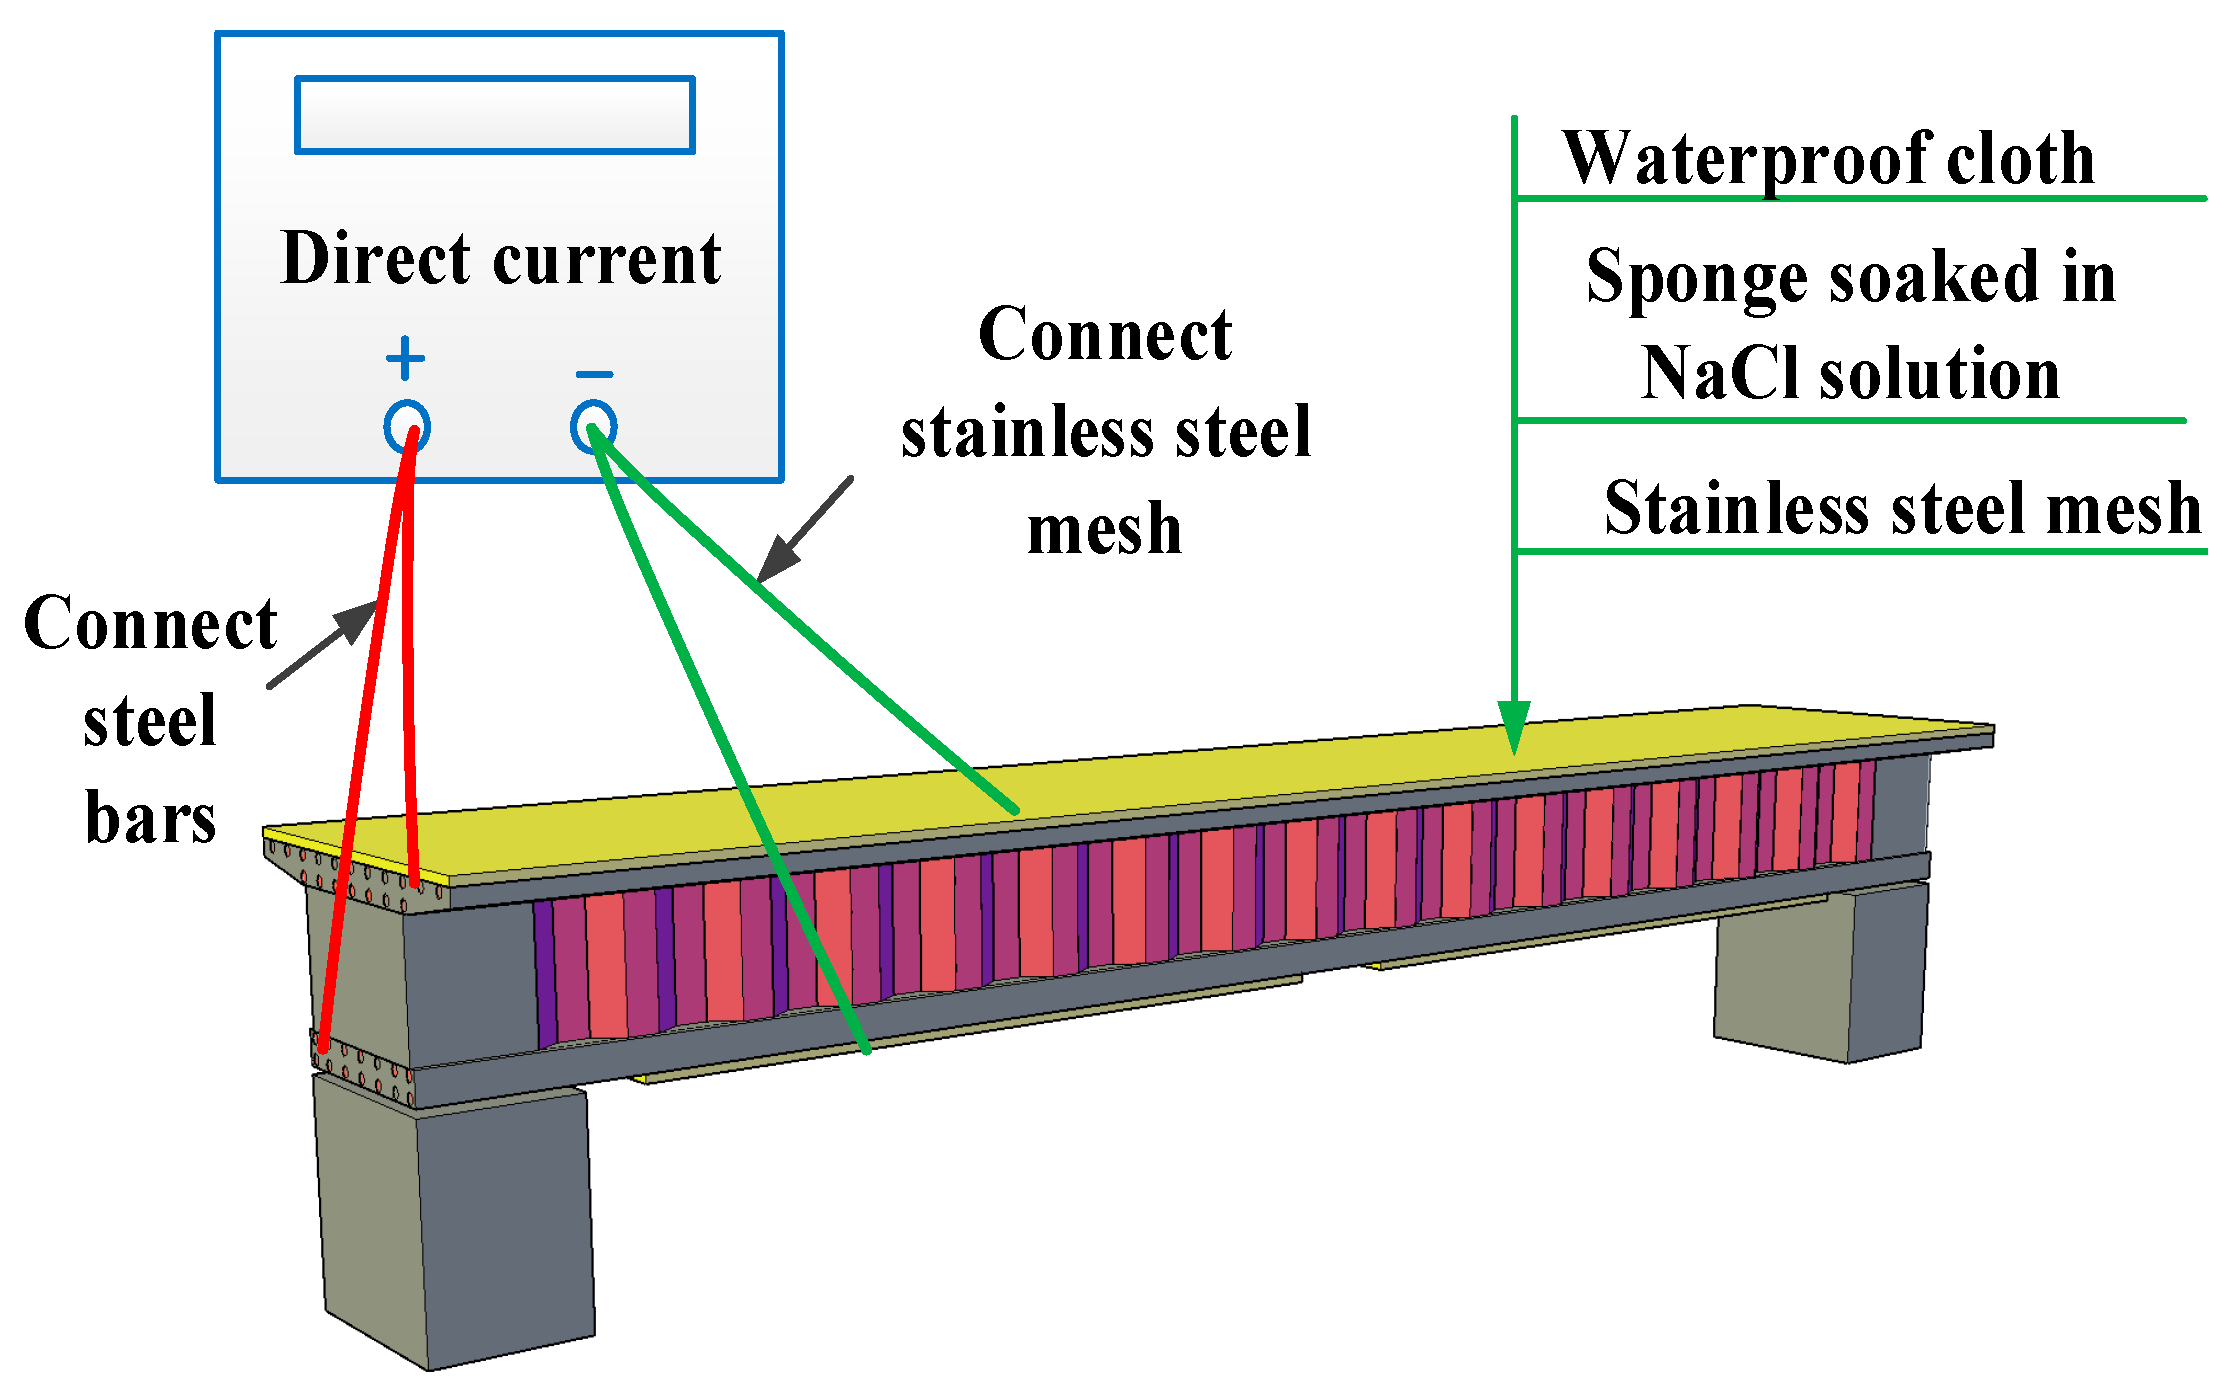
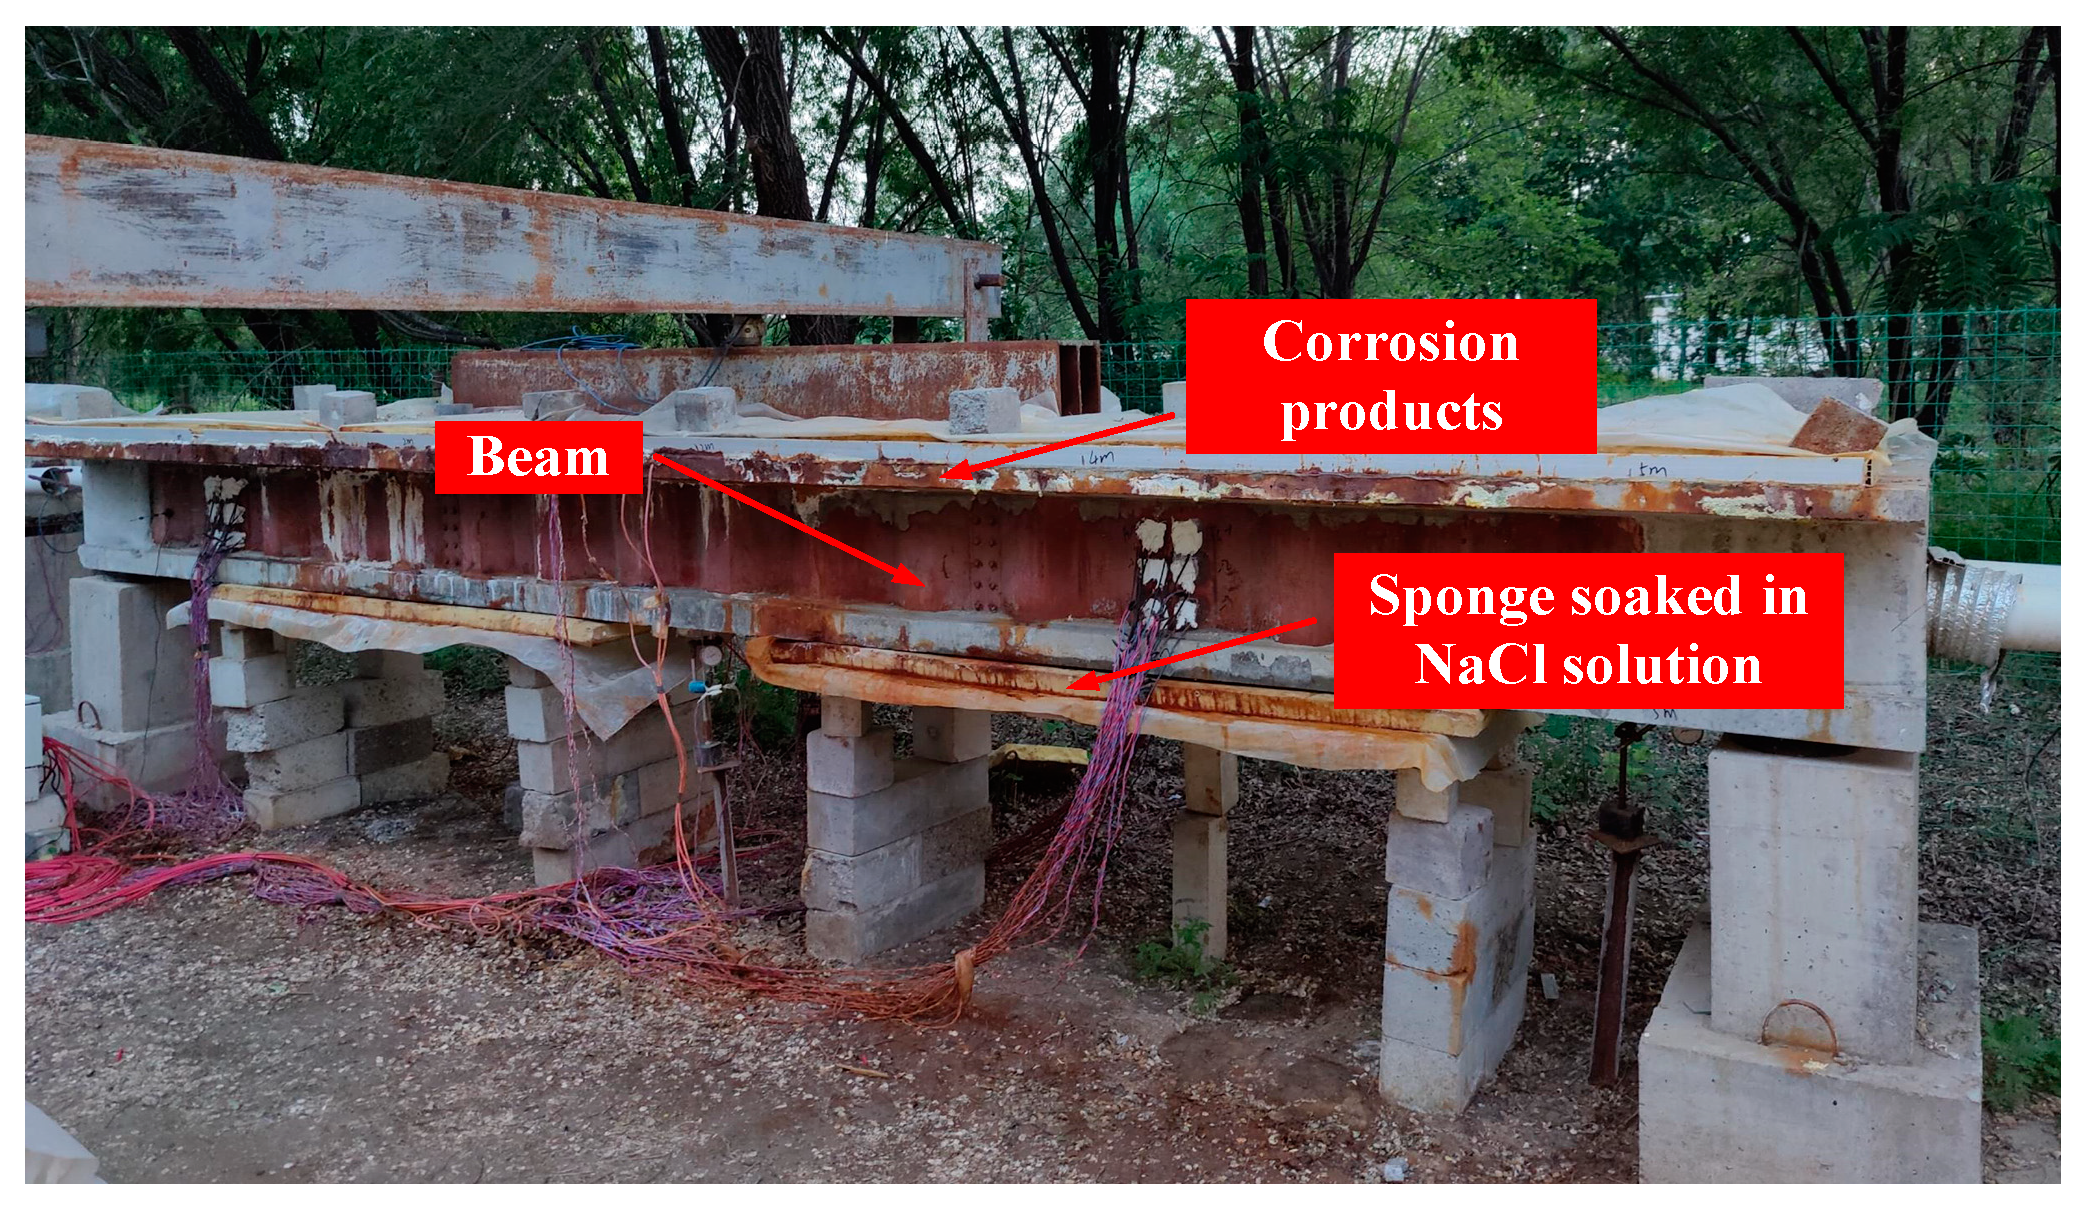
2.2. Accelerated Corrosion Test

In order to make the test conditions more in line with the actual situation, the accelerated corrosion test was carried out on Beam A2 under a sustained load, but the corrosion of externally prestressed tendons was not carried out. Beam A1 was subjected to the same sustained load without an accelerated corrosion test, and for comparison, it was exposed to the natural environment only. The device for applying the sustained load is shown in Figure 2. Based on finite element simulation results, a sustained load of 100 kN was applied to the beams to ensure that the beams remained in the elastic stage during the accelerated corrosion test, and the clump weight as shown in Figure 2a was 20 kN. The value of the sustained load was monitored in real time using a pressure sensor with a maximum range of 200 kN during the accelerated corrosion test. The top and bottom plates of Beam A2 were subjected to a chloride ion drying–wetting cycle and electrochemical corrosion under a sustained load, with a corrosion region of 4500 mm at the mid-span, as shown in Figure 3.
One drying–wetting cycle of chloride ion solution was 14 days, with 7 days in the drying state and 7 days in the wetting state, for a total of 10 cycles, amounting to 140 days. During the wetting stage, the sponge was immersed in 5% NaCl solution and placed tightly against the surface of the beam, as shown in Figure 4. In addition, 5% NaCl solution was regularly replenished to the sponge every day to keep it saturated. The steel bars in the top and bottom plates were connected to the positive pole of the DC power supply with an output voltage of 0–120 V and an output current of 0–3 A, while eight pieces of stainless-steel mesh (Figure 3), of which six were on the top plate and two were on the bottom plate, were connected to the negative pole. The current density was taken as 200 μA/cm2 during the corrosion process. During the drying stage, the beam was exposed to the natural environment after the sponge was removed.
During the corrosion process, the deflections at the supports and mid-span of each beam were measured, and the layout of dial gauges is illustrated in Figure 5. Moreover, the changes in prestress were monitored by using the pre-arranged JMZX-3006 comprehensive tester and pressure sensors. In order to eliminate the influence of temperature on the deflection and prestress, the monitored data were collected at 8:00, 11:30, 14:30, and 17:30 each day.

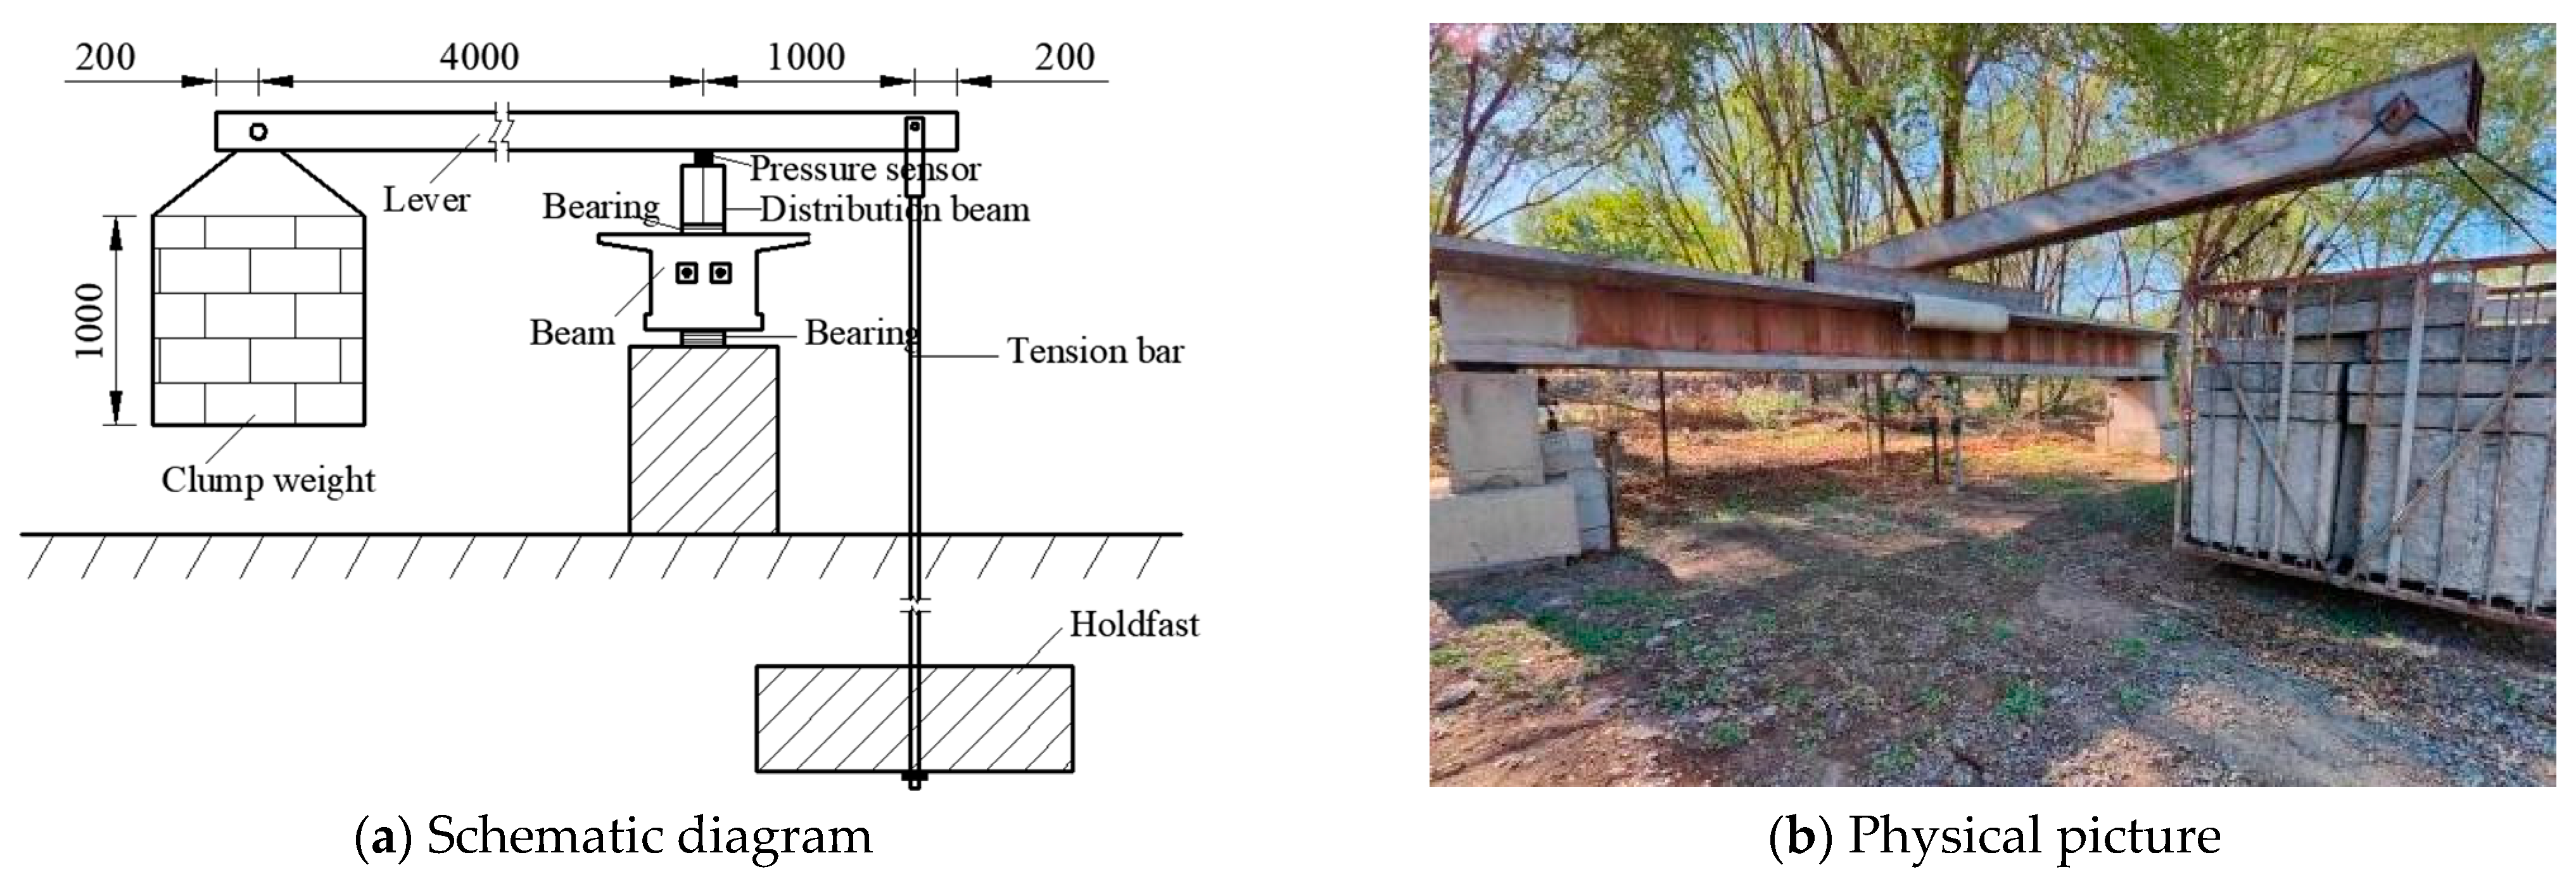
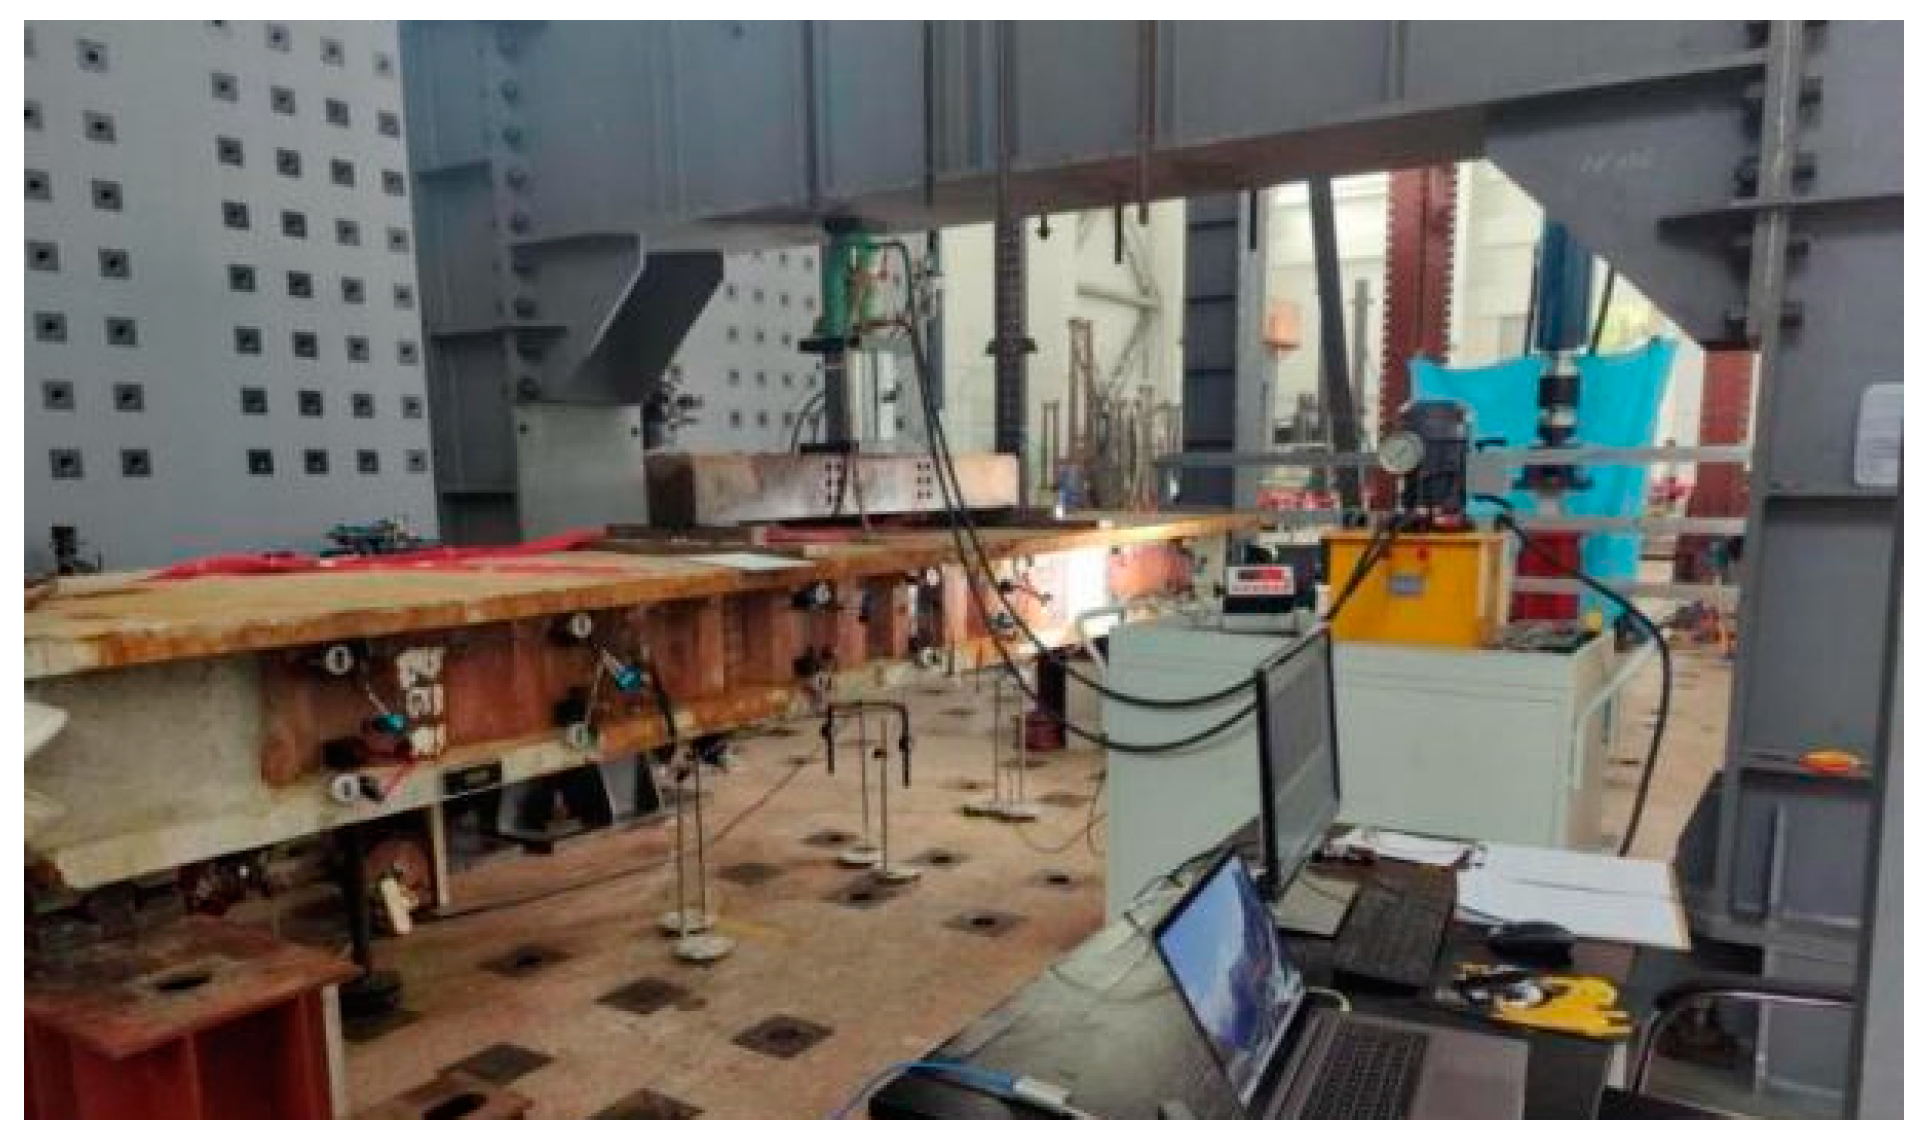
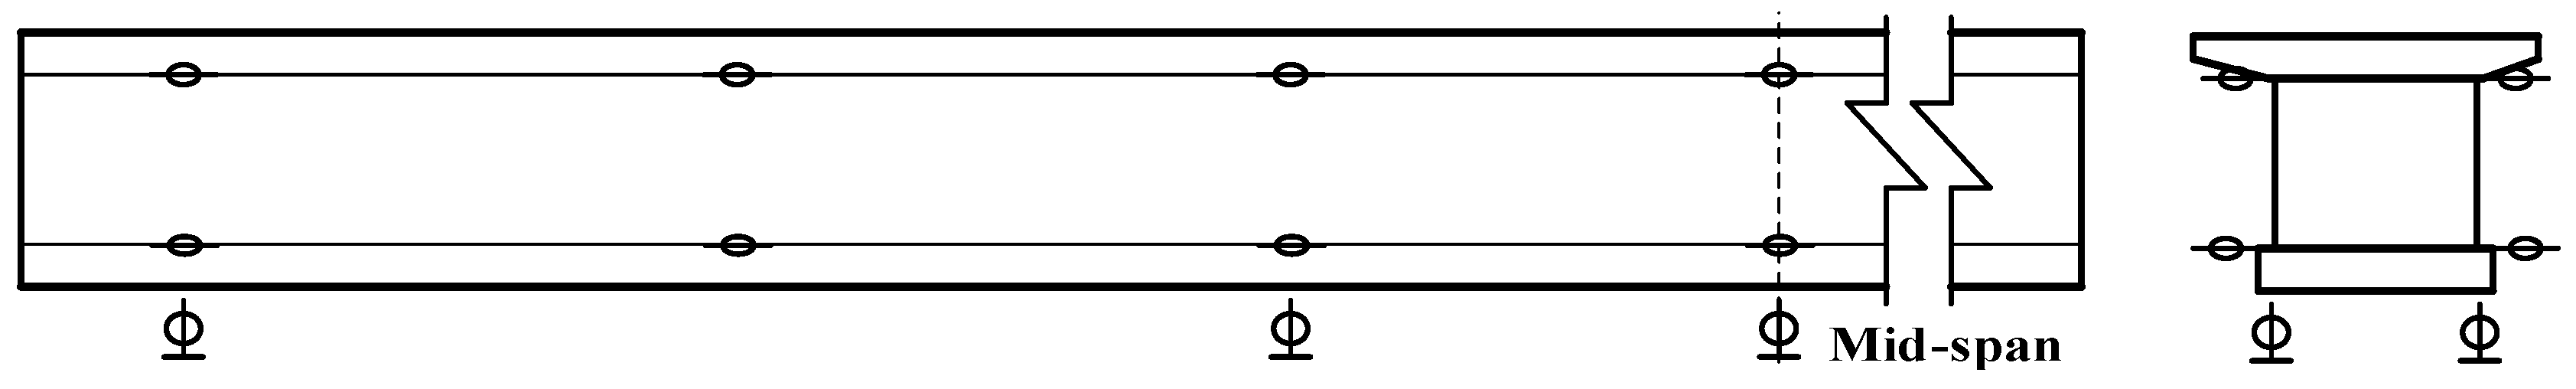
2.3. Bending Failure Test

After the accelerated corrosion test, a manual hydraulic jack with a measuring range of 600 kN was used to apply three-point symmetrical loading to the two beams, as shown in Figure 6. To ensure the free horizontal movement of the beams, a roller bearing with a diameter of 40 mm was provided at one end of the beams.
Firstly, the beams were preloaded with 10 kN for the purpose of eliminating gaps between beams and the loading device, counteracting for the inelastic deformation of various devices such as the reaction frame, supports, and other parts, as well as checking whether or not the equipment was operating normally. After holding the load for 5 min, the beams were slowly unloaded and began the formal loading stage. Gradation loading mode with an increment of 10 kN for 5 min was adopted, and the development of cracks on the surface of each beam was observed. In order to monitor the changes in deflection during loading, the dial gauges with a measuring range of 30, 50, and 100 mm were, respectively, placed at the supports, three-point, and mid-span of each beam. Dial gauges, which had a measured range of 15 mm, were placed at the top plate, supports of the bottom plate, 1/6 (5/6) sections, 1/3 (2/3) sections, and mid-span of the beams to measure the relative slip between the concrete plates and the web, as shown in Figure 7.
To study the changes in prestress of externally prestressed tendons with increasing loads, the prestress was measured using a JMZX-3006 comprehensive tester during loading. Moreover, the strain gauges and triaxial strain rosettes were arranged at the 1/4 section, mid-span, 3/4 section of the top plate, the bottom plate, and the web, which aimed to study the distribution of longitudinal strains along the height and width of the beam, verifying whether the longitudinal strains satisfied the quasi-plane section assumption and measuring the changes in strain of the corrugated steel webs during the loading process, as depicted in Figure 8.

2.4. Mass Loss of Steel Bars

To measure the mass loss of the steel bars in Beam A2, the top and bottom plates were broken with an electric chisel after the bending failure test, and the steel bars were exposed to the outside, as shown in Figure 9. It is clear that the steel bars were significantly corroded.
According to Chinese Standard GB/T 50082 [39], the adhered concrete was scraped with a knife from the corroded longitudinal steel bars and stirrups, and then the steel bars were washed with a 12% hydrochloric acid solution. After that, the steel bars were rinsed with clean water and then treated with saturated limewater for neutralization. Finally, they were rinsed with clean water again, dried, and weighed using the electronic balance with an accuracy of 0.01 g. The mass loss of steel bars can be calculated by Equation (1):
L m = m 0 m m 0 × 100
where Lm is the mass loss of a steel bar (%), and m0 and m are the masses of a steel bar before and after corrosion (g), respectively.

3. Results and Discussion

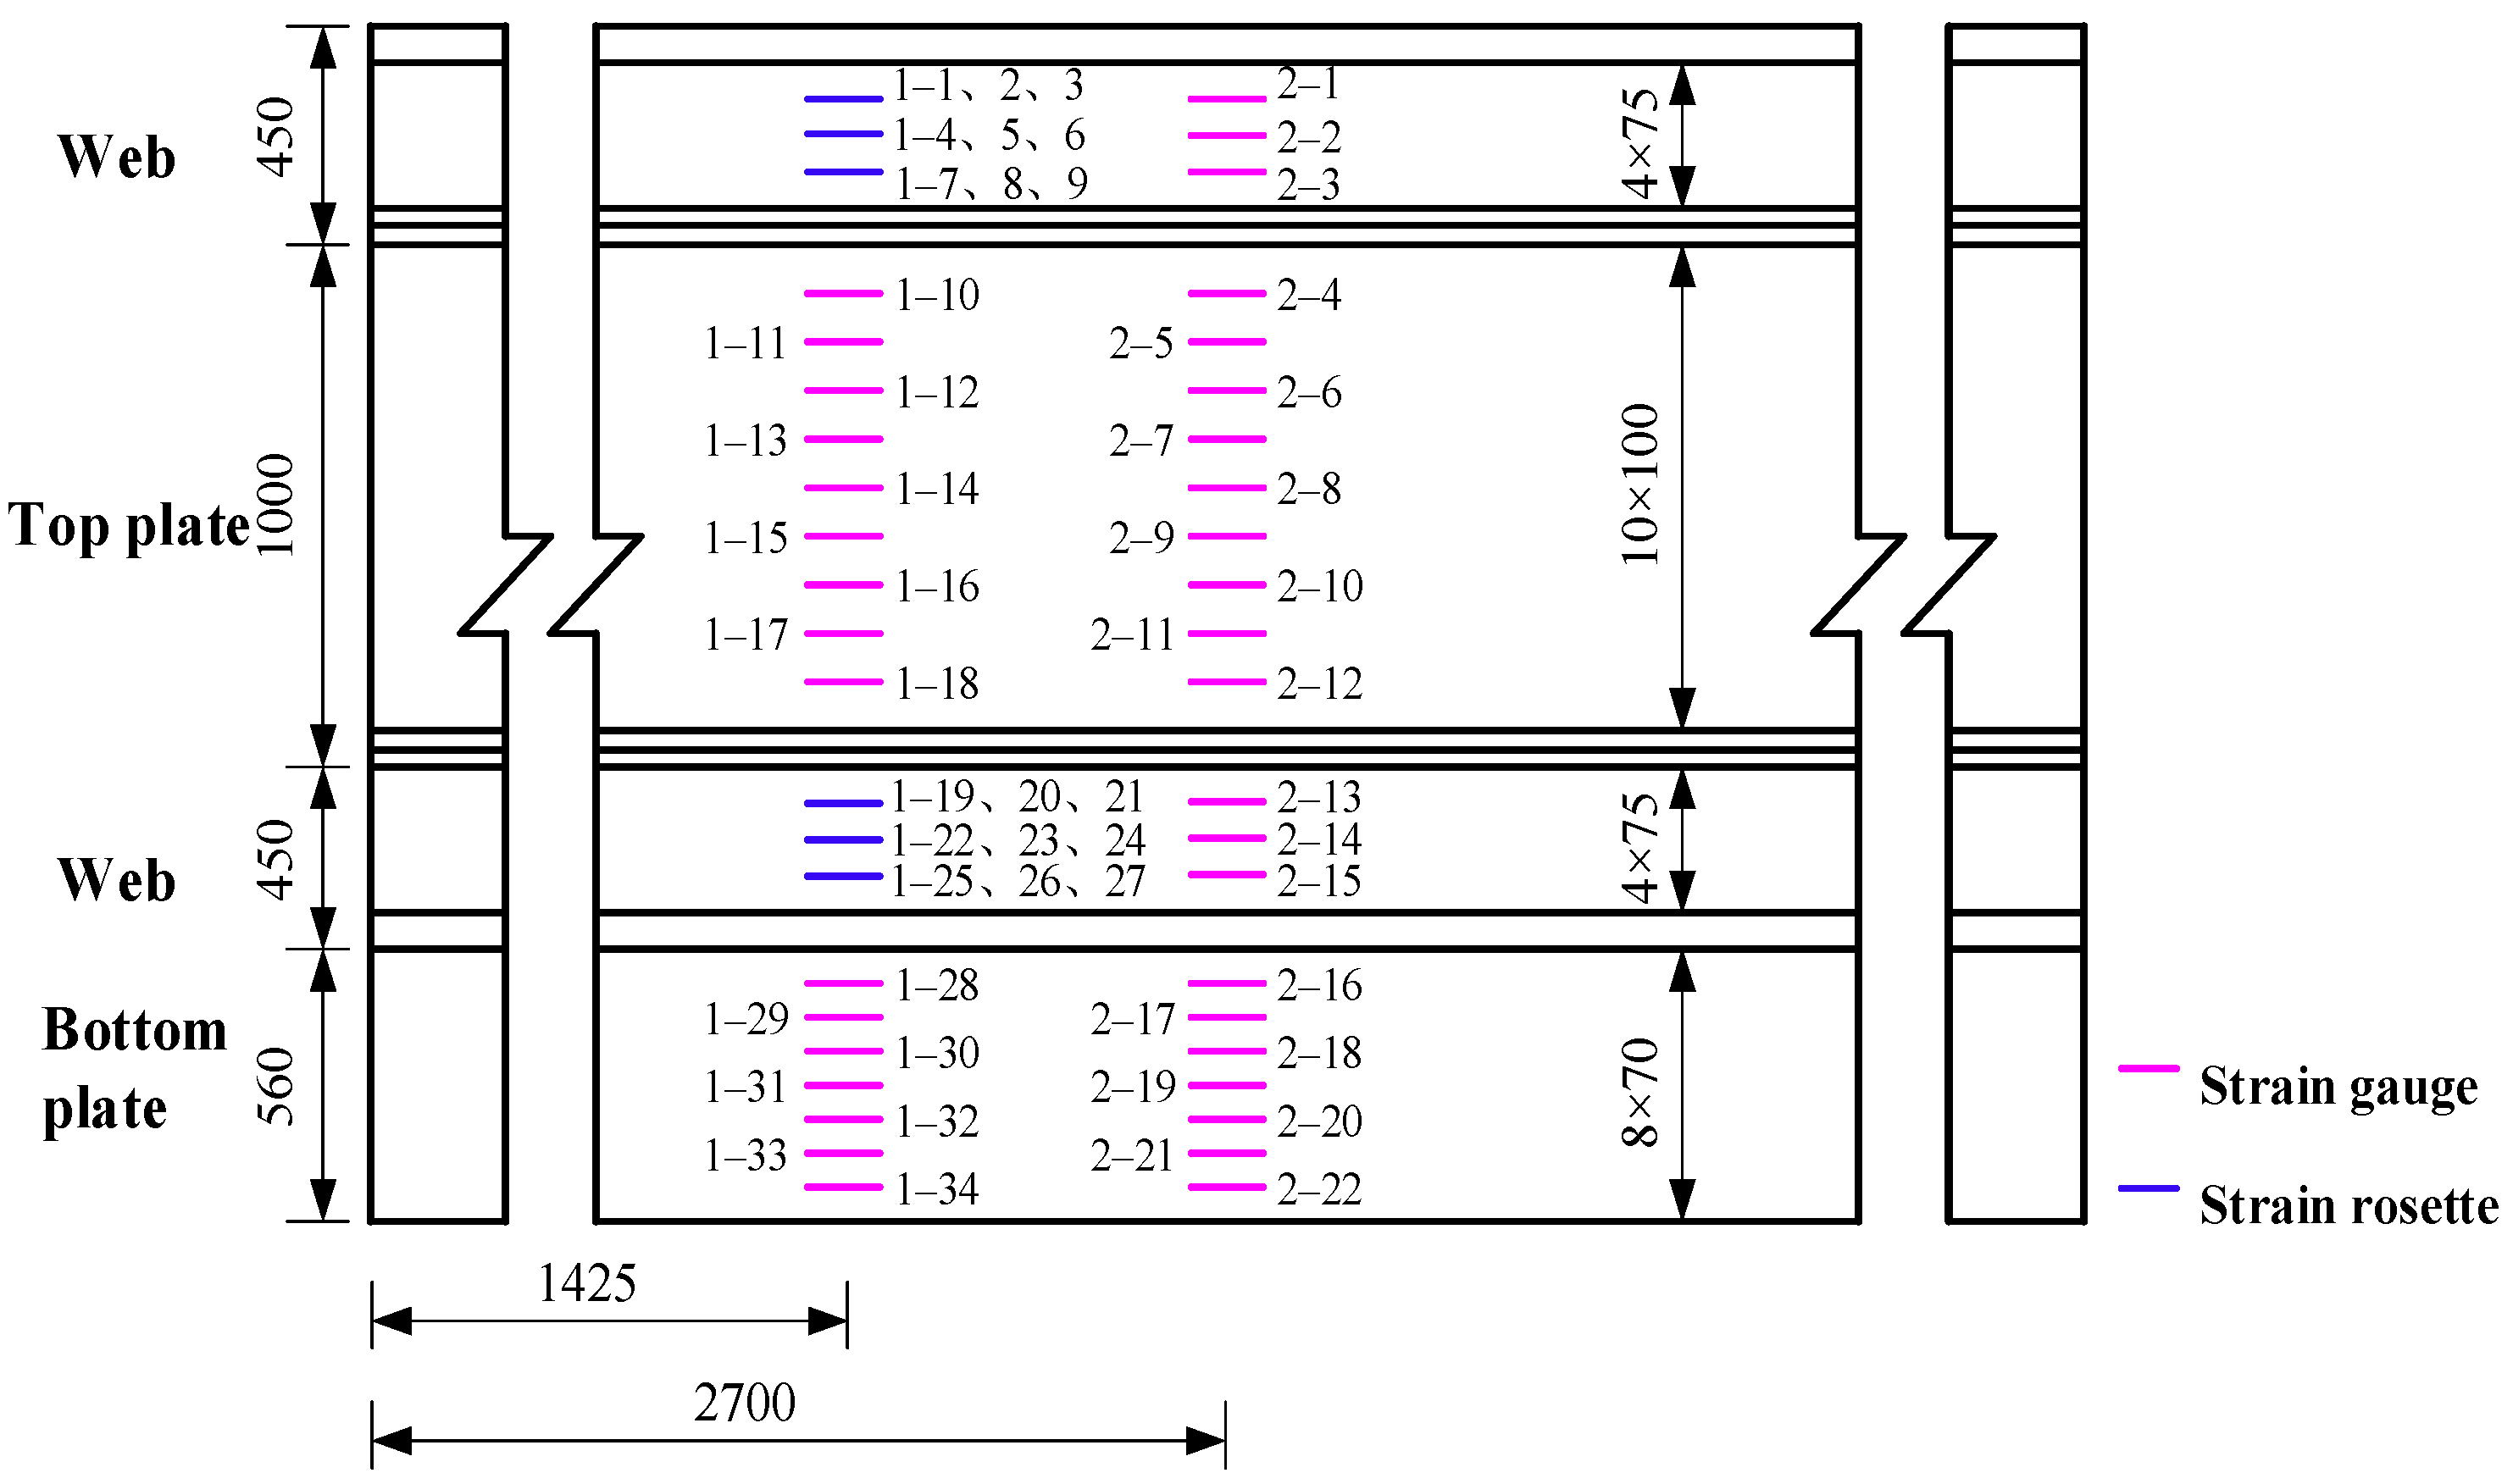
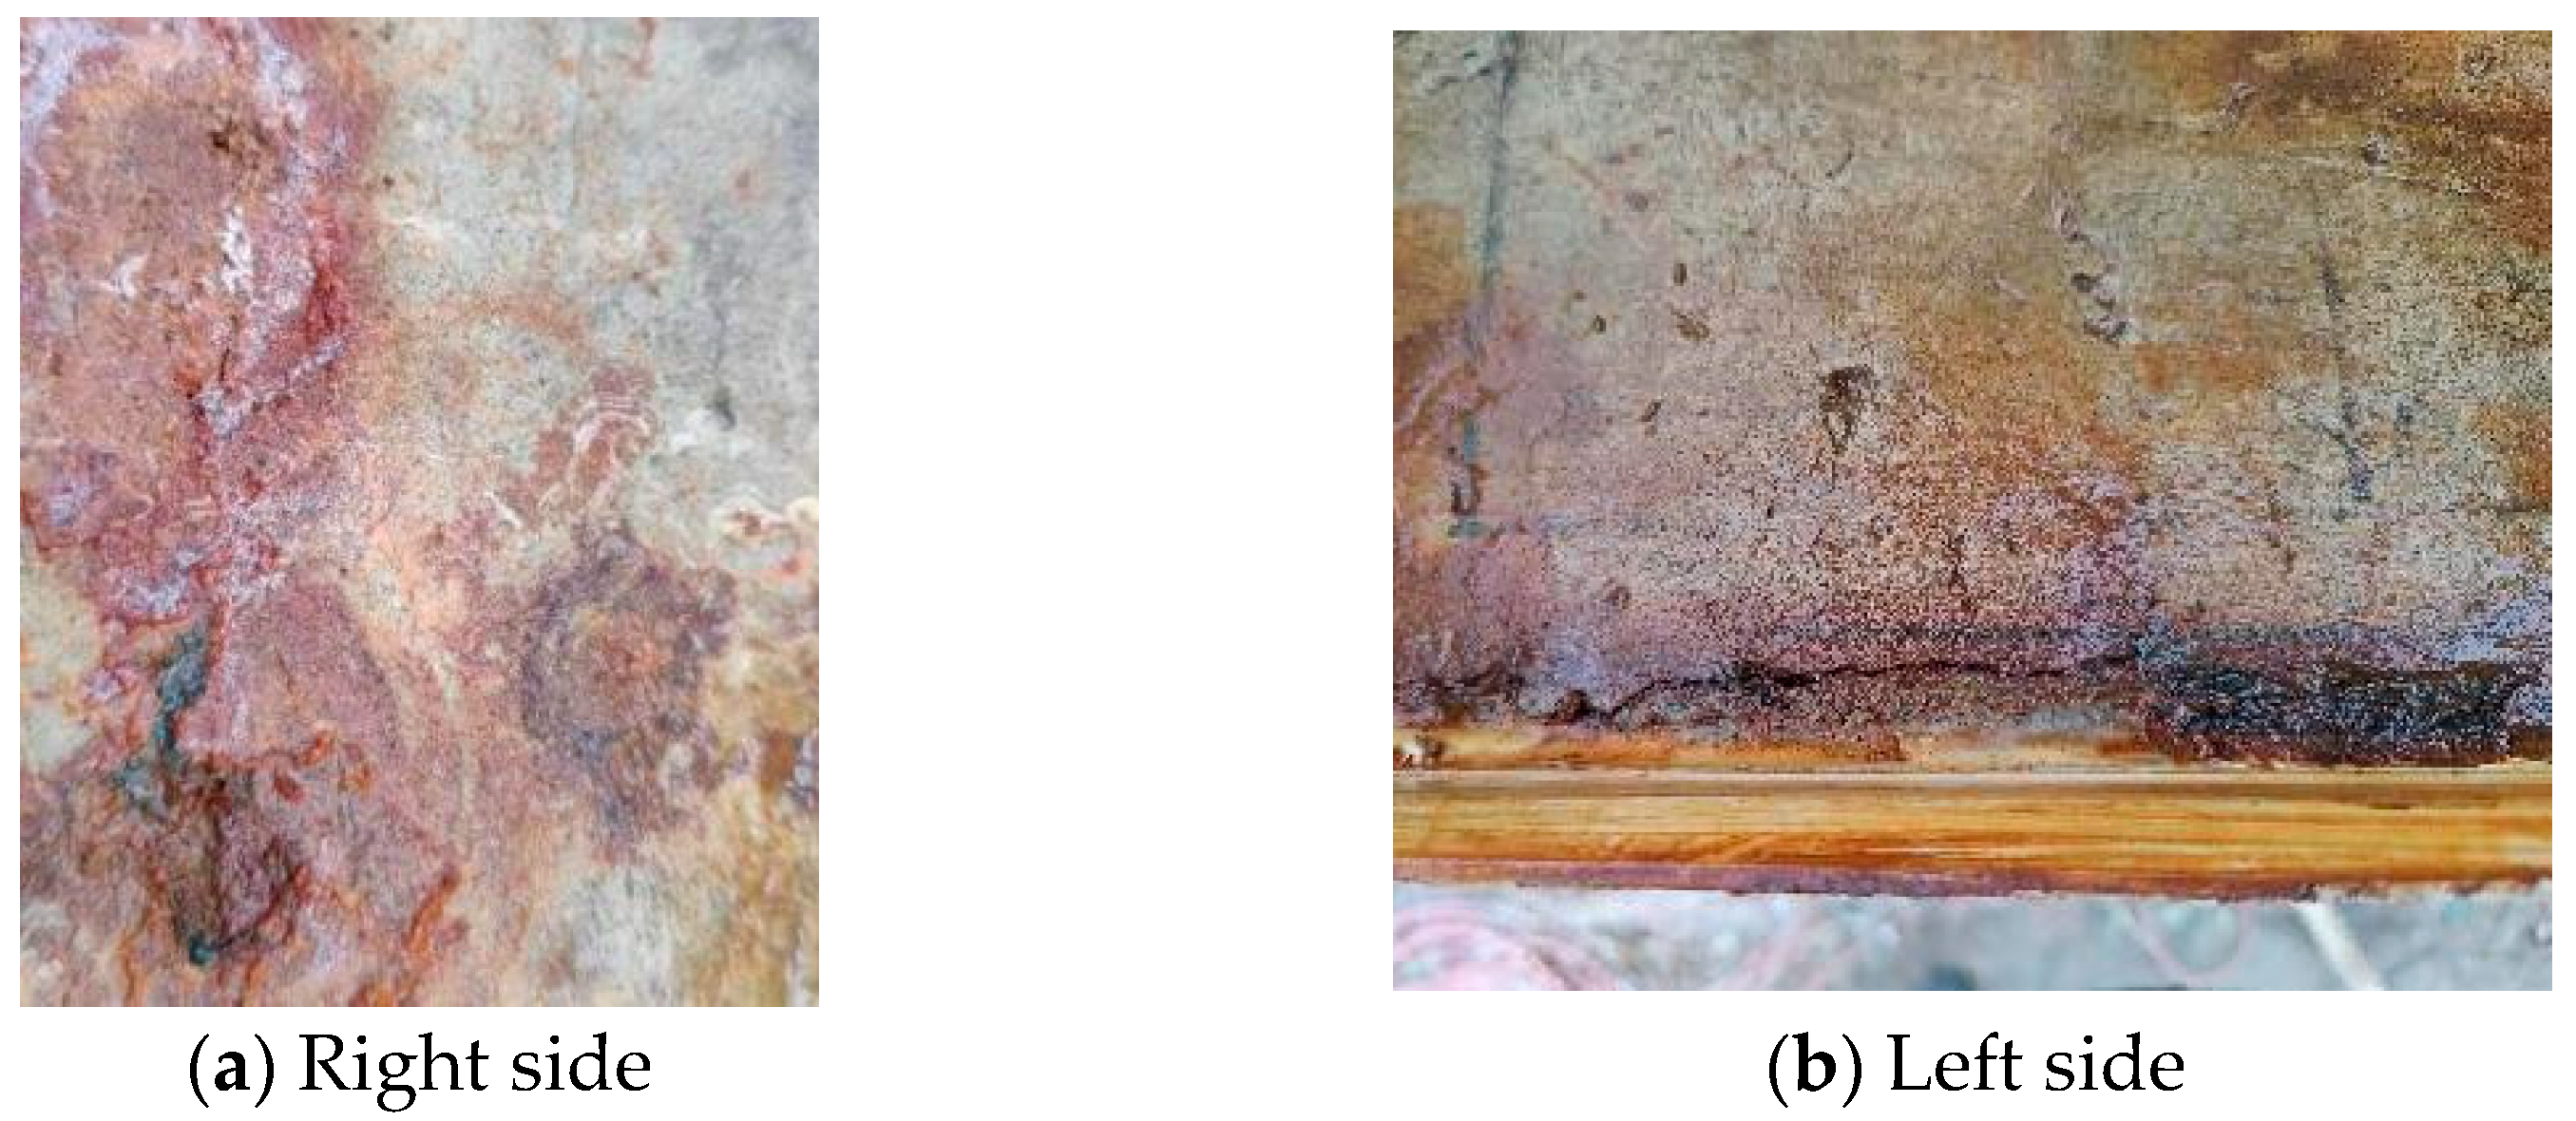
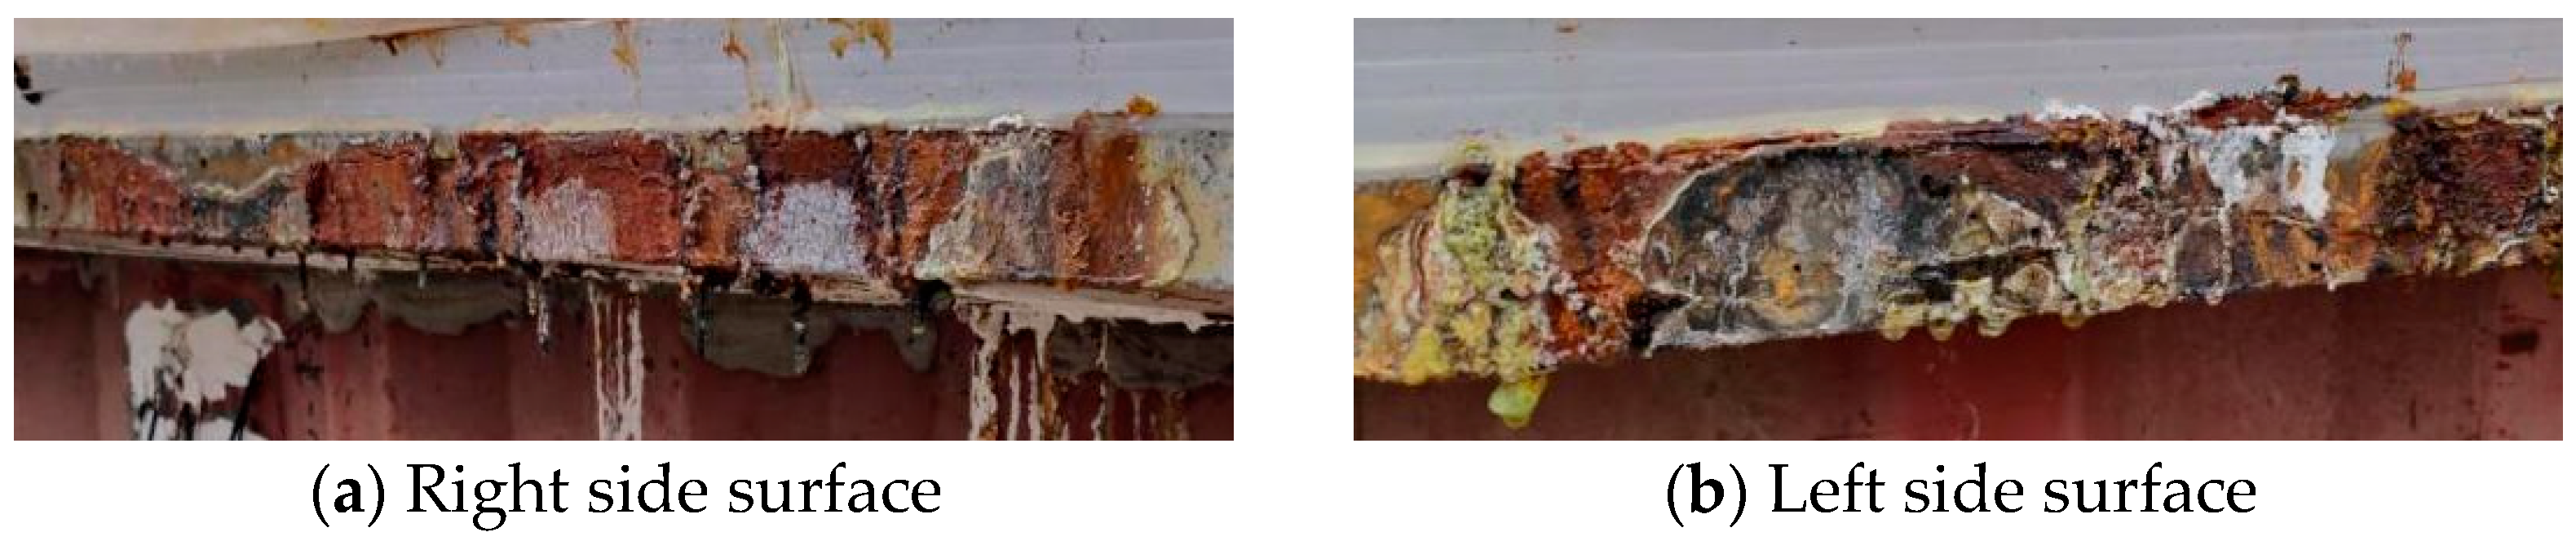
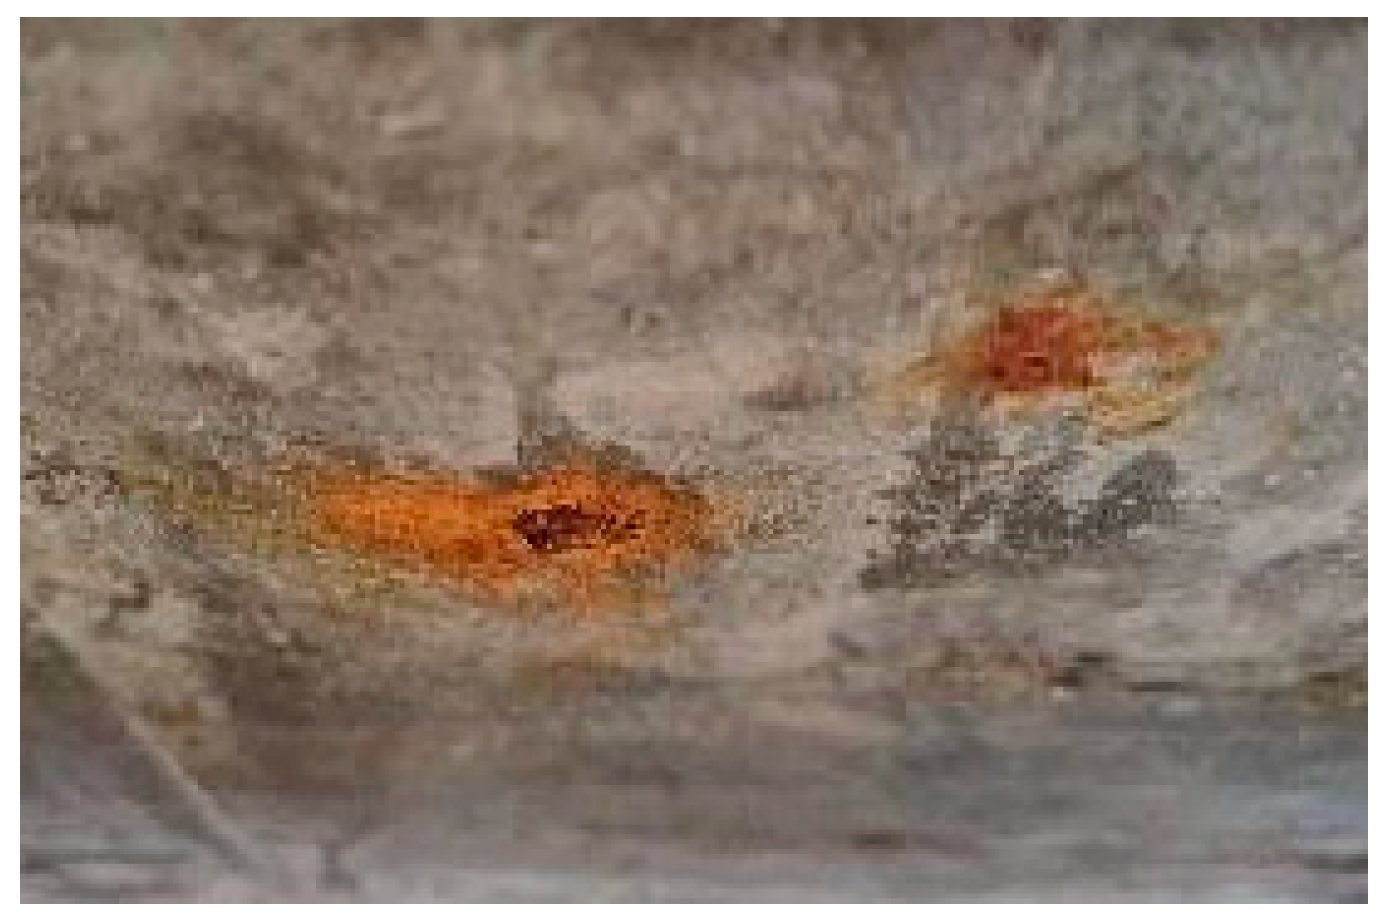
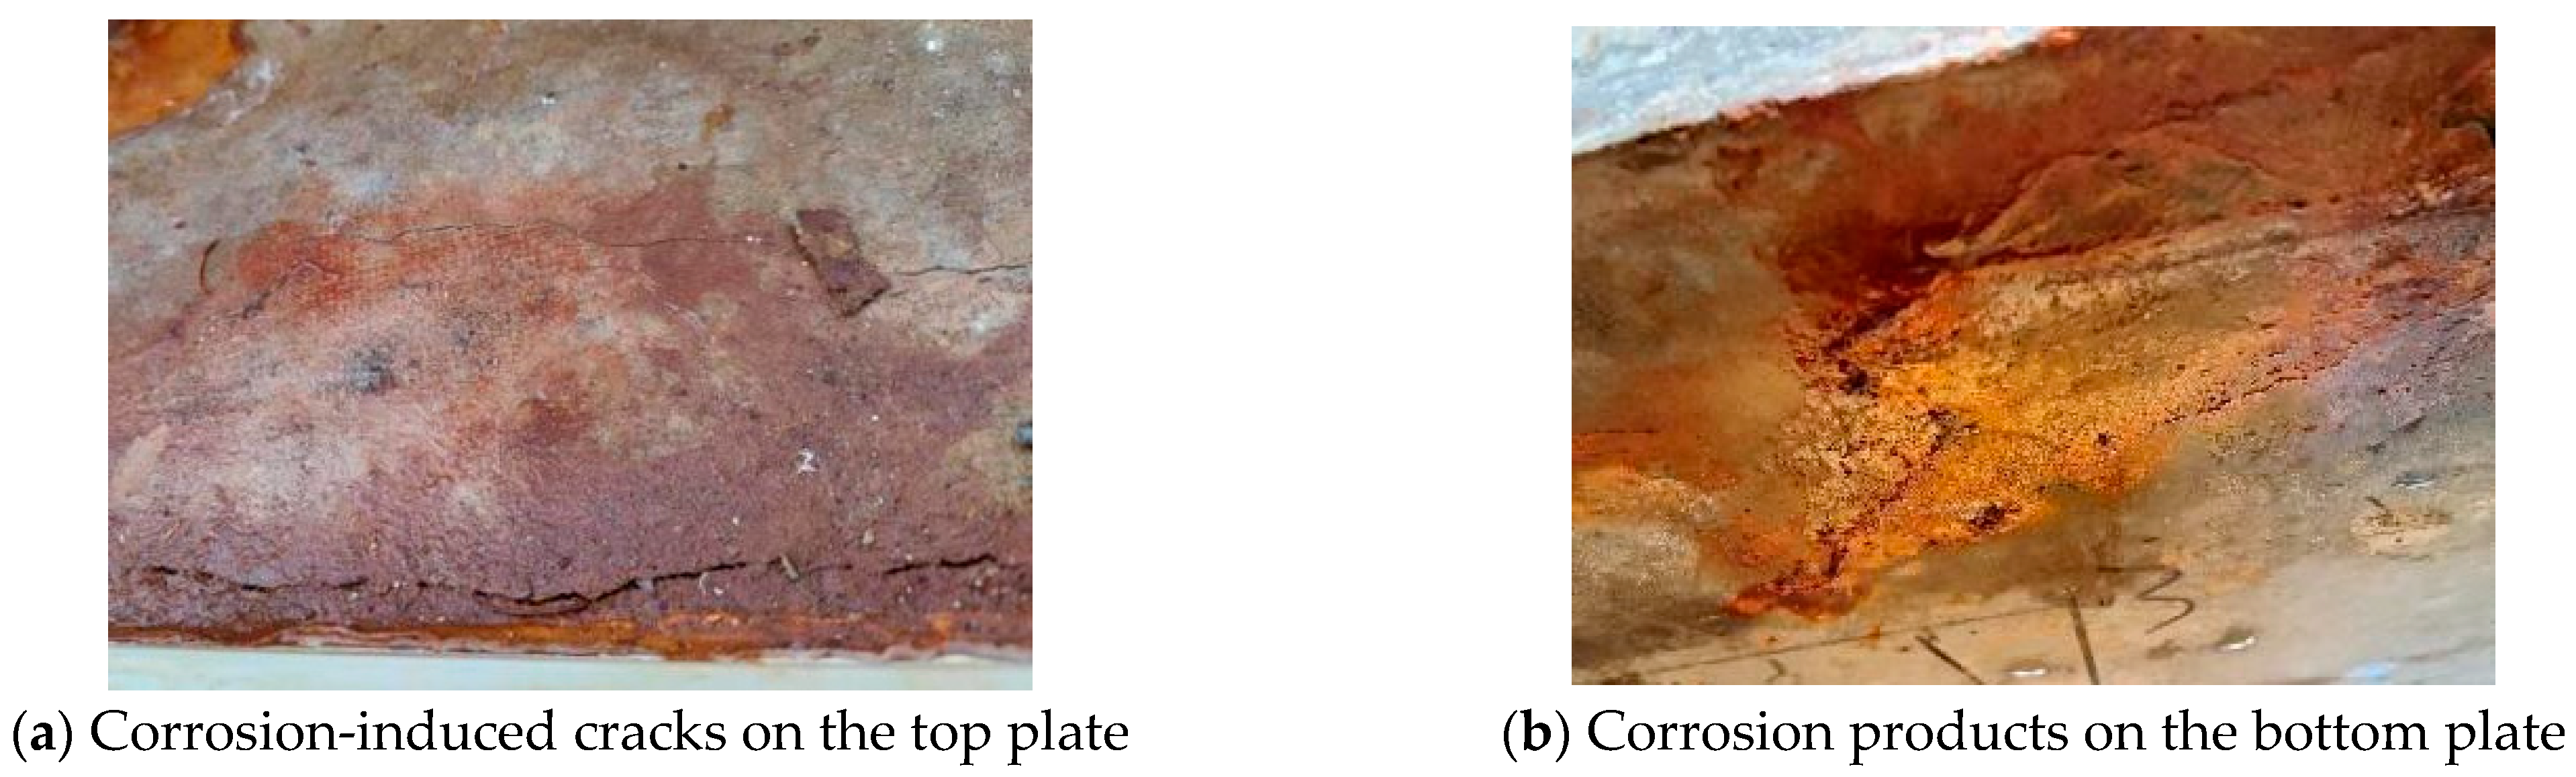
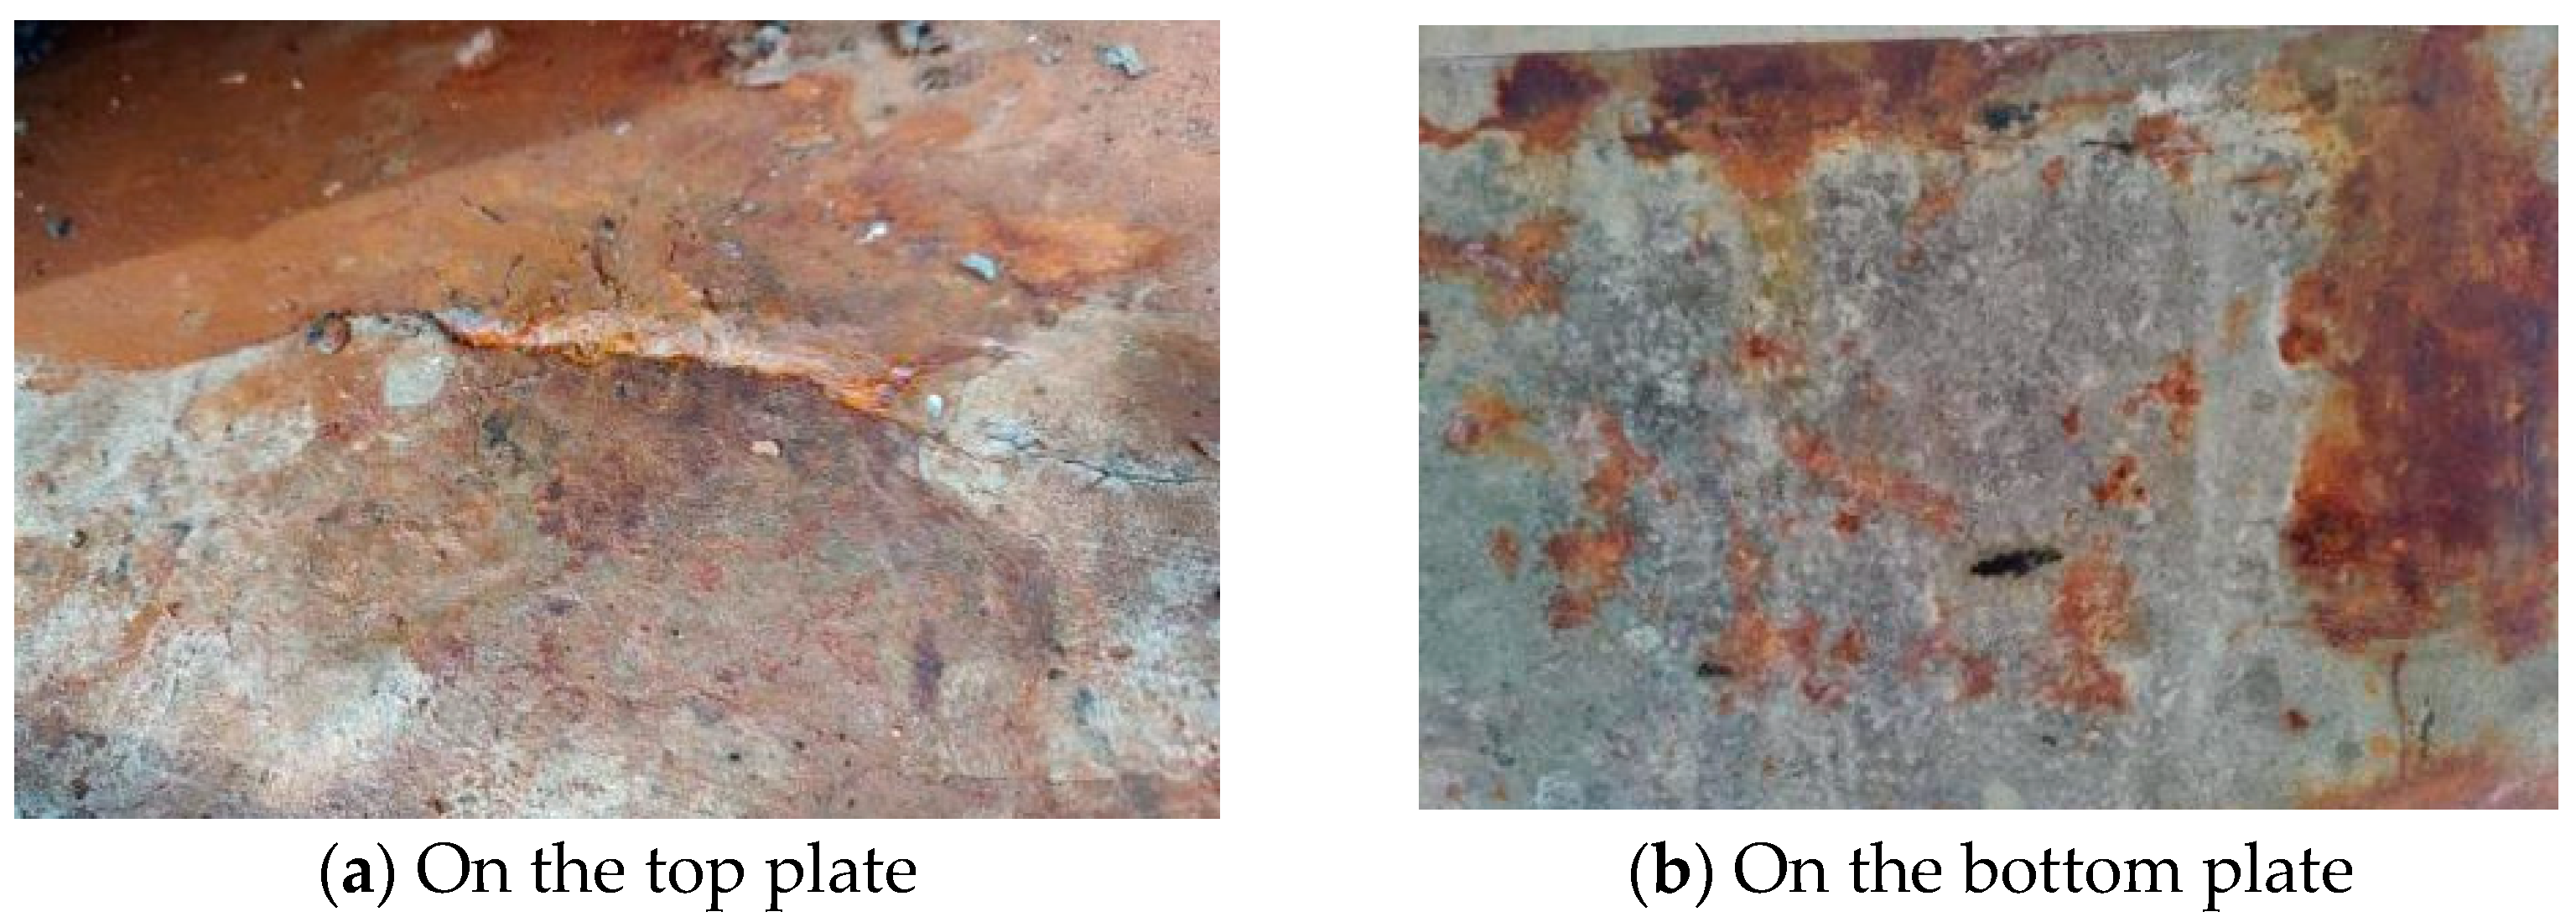
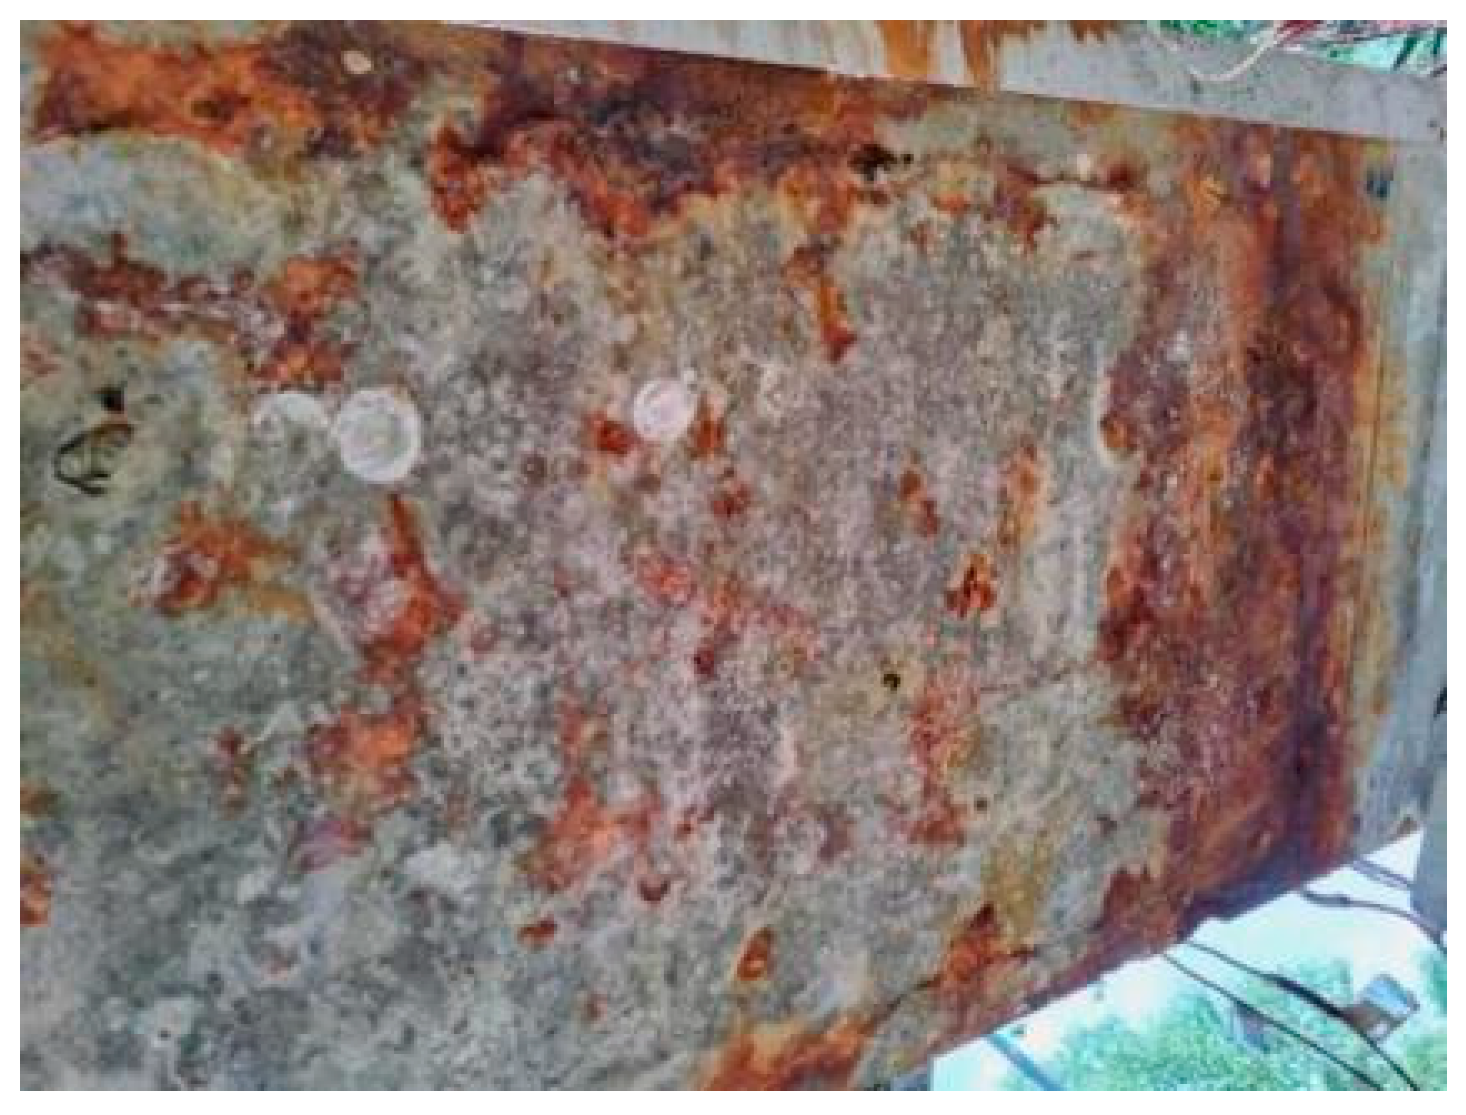
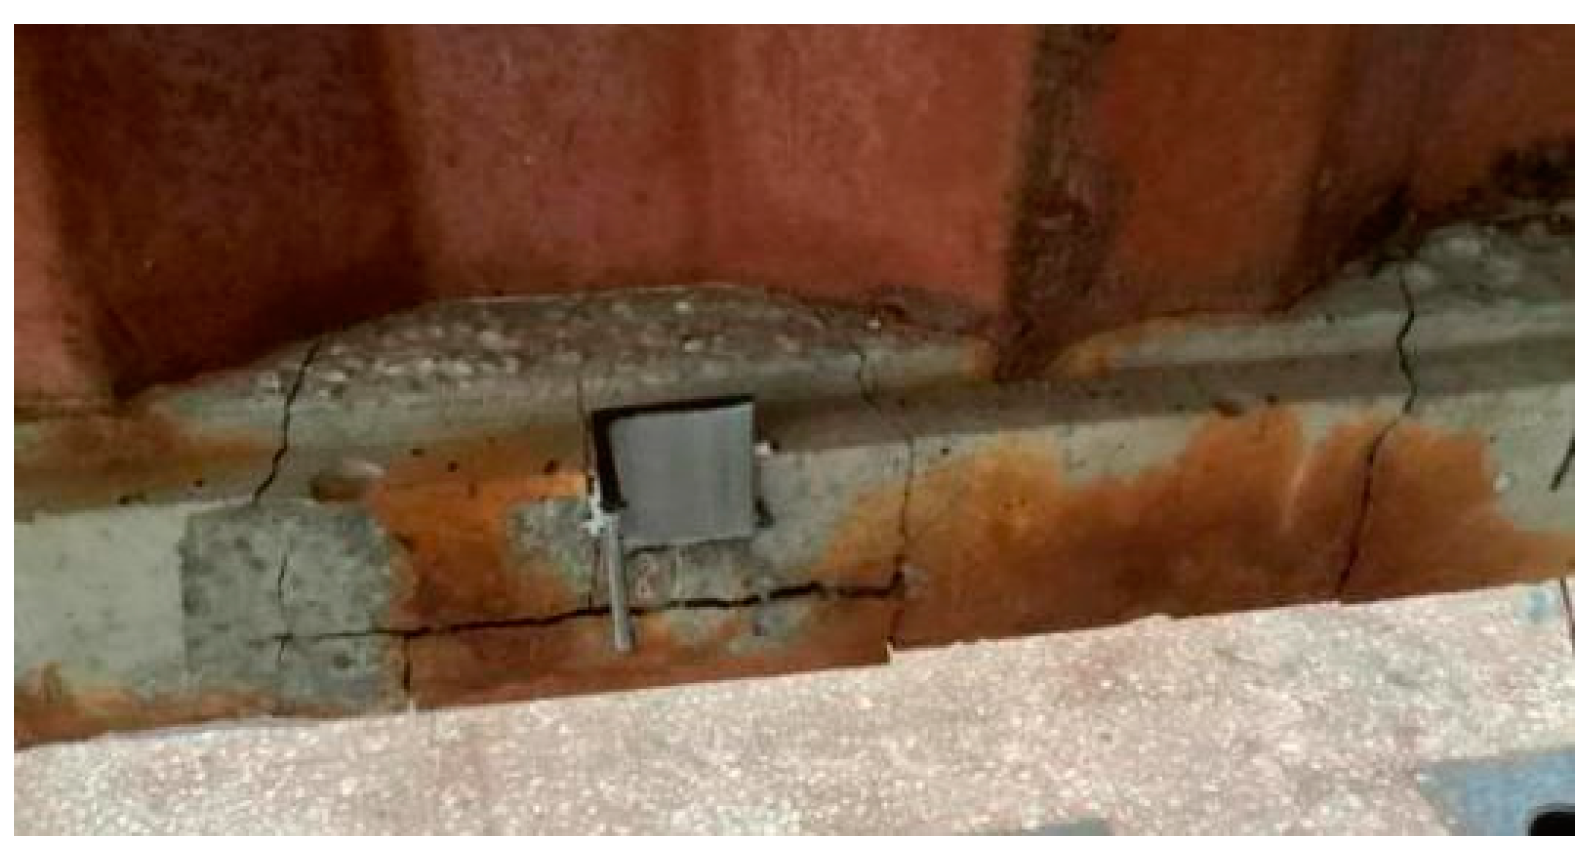
3.1. Phenomena during the Corrosion Process

On the 30th day of the accelerated corrosion test, visible reddish-brown corrosion products were found at the edge of the top plate of Beam A2, and corrosion-induced cracks could also be observed, as shown in Figure 10. This is because there was sufficient oxygen at the edge, resulting in more severe corrosion of the steel bars compared to those in the middle position. Longitudinal corrosion-induced cracks appeared on the side surfaces of the beam, with reddish-brown and yellow corrosion products precipitating from the corrosion-induced cracks, as depicted in Figure 11. Figure 12 shows that the corrosion of the bottom plate is relatively light, with dotted reddish-brown corrosion products observed, compared to the top plate.
After 50 days of the corrosion test, the width of corrosion-induced cracks on the top plate gradually increased, and new corrosion-induced cracks appeared, as illustrated in Figure 13a. The corrosion products on the bottom plate also gradually increased and exhibited a flake distribution, as shown in Figure 13b.
Figure 14 shows the corrosion of Beam A2 on the 80th day of the accelerated corrosion test. The corrosion-induced cracks on the top plate continue to extend and widen. However, there are relatively fewer new cracks. There are multiple transverse corrosion-induced cracks and discontinuous longitudinal ones on the bottom plate, which means the corrosion on the bottom plate progressed significantly.
When the corrosion test reached the 100th day, the longitudinal corrosion-induced cracks on the bottom plate connected into a single one, and the width of the cracks continued to expand, as shown in Figure 15. He et al. [40] also found that, under the coupling of sustained load and chloride corrosion, the width of the corrosion-induced cracks of RC beams increased with corrosion time during the entirety of the experiment, which is consistent with the results of this paper.

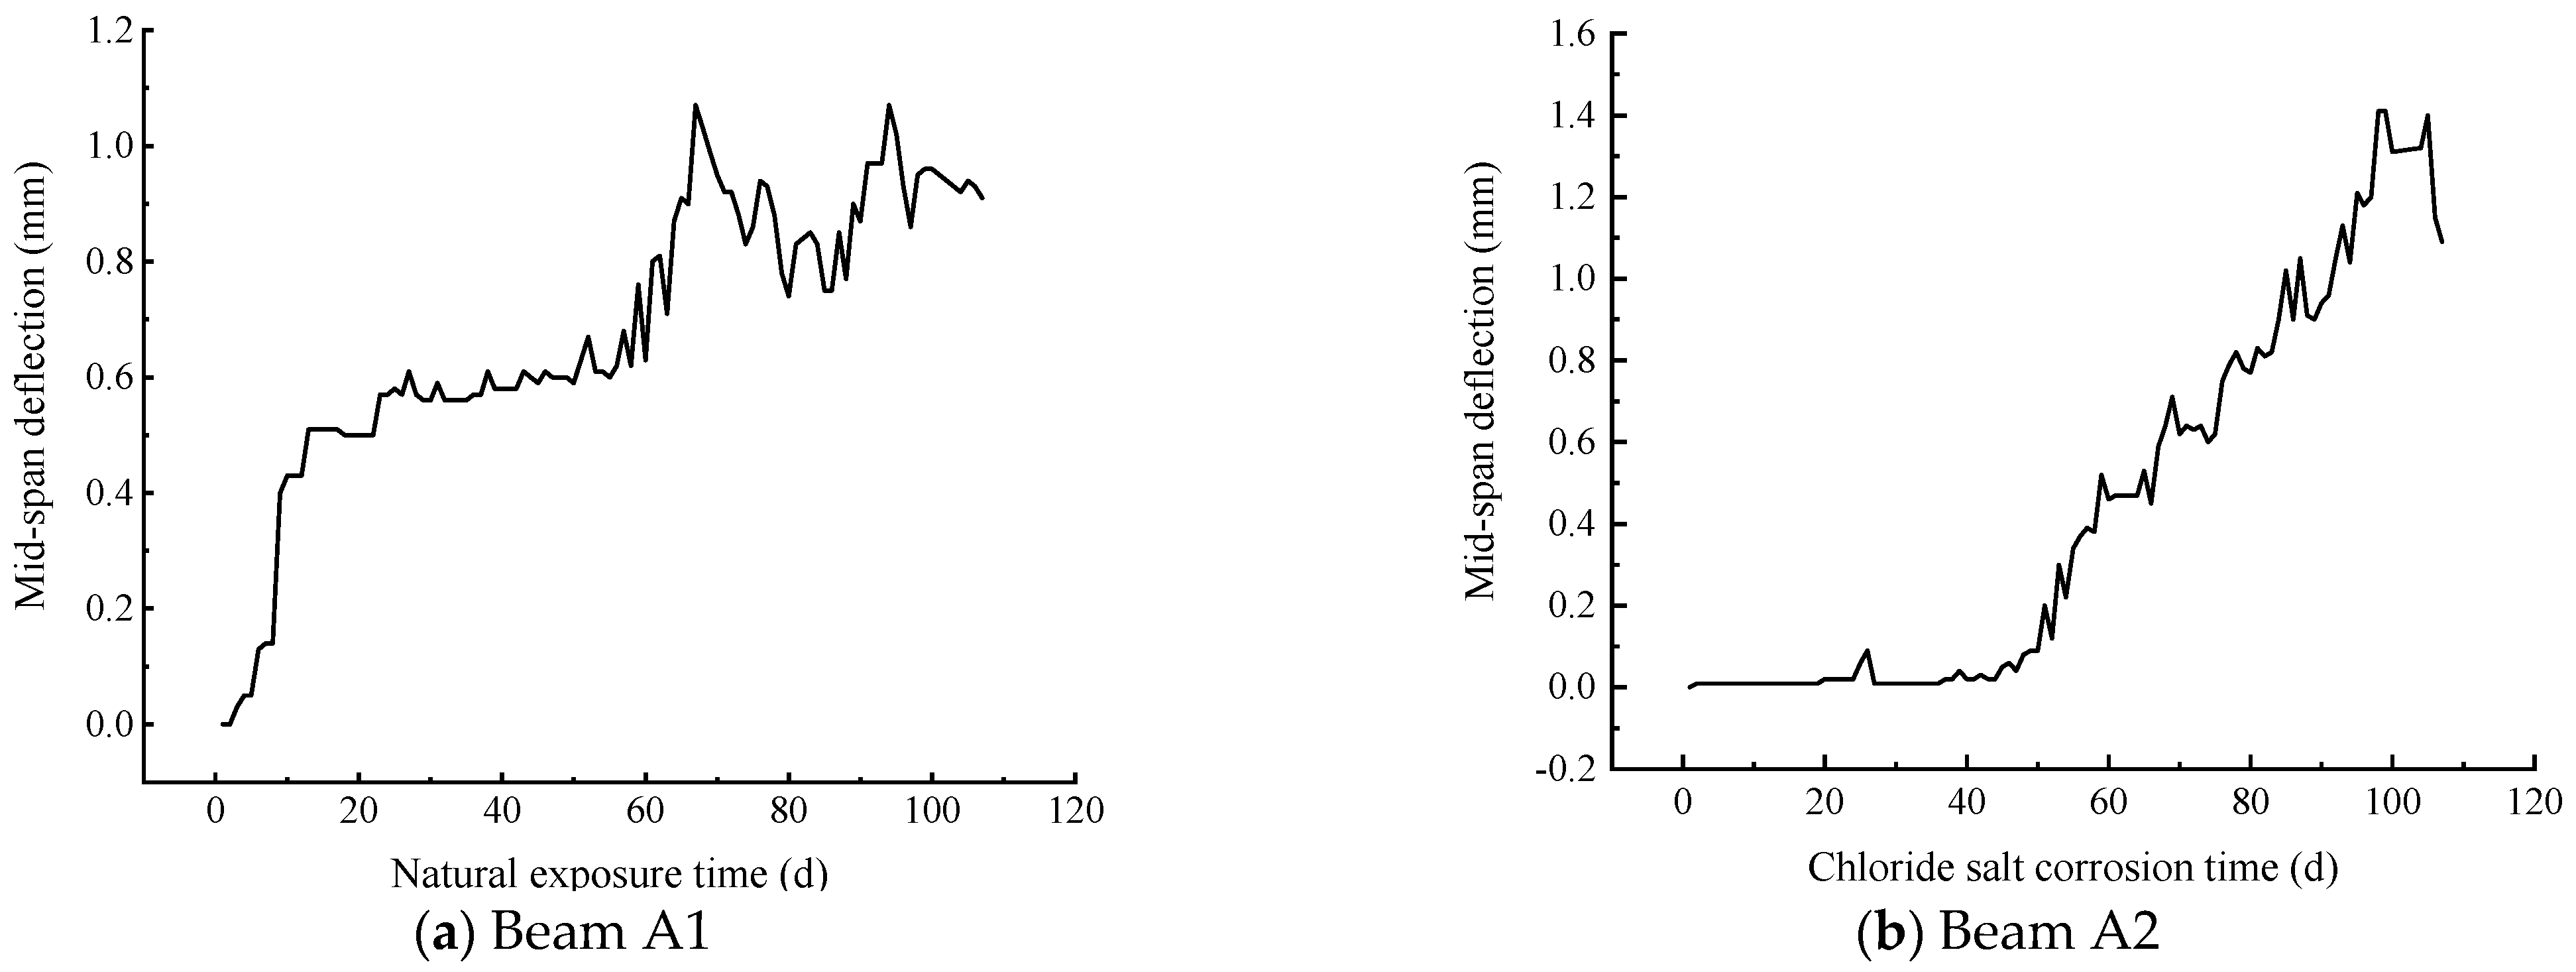
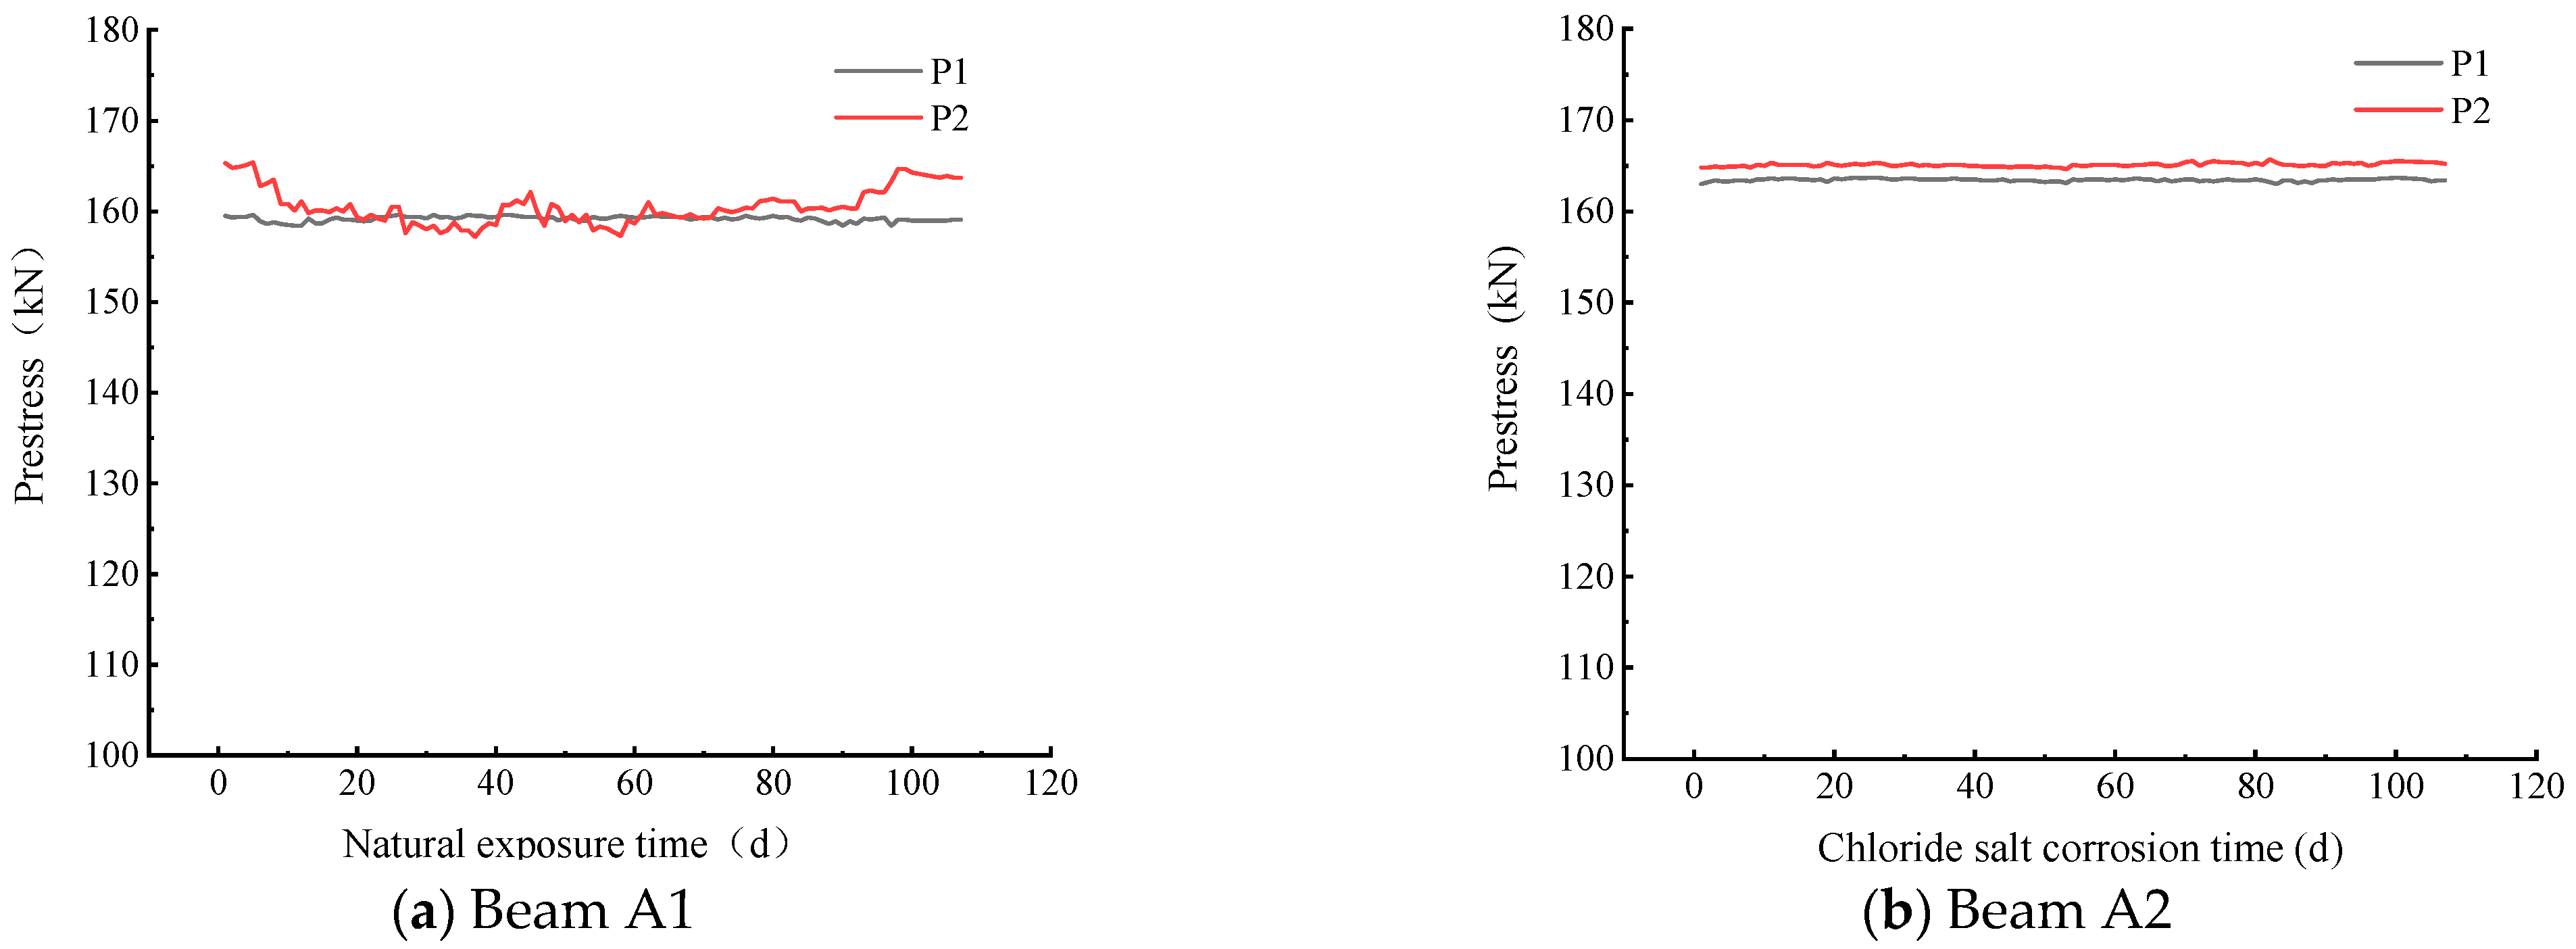
3.2. Variations in Deflection at the Mid-Span and Stress of Externally Prestressed Tendons during the Corrosion Process

The deflection at the mid-span of the two beams during the accelerated corrosion test is shown in Figure 16. From the figure, it can be found that the mid-span deflection of both beams increases with corrosion time, while the increase in deflection at the mid-span of Beam A2 is greater and the growth rate is faster. This is because the steel bars in Beam A2 are corroded, reducing the stiffness of the beam, which makes Beam A2 exhibit larger deflection under the same conditions. Du et al. [41] also found that, due to the corrosion of steel bars, the time-dependent deflection of a corroded beam under loads increases more rapidly than that of a non-corroded beam, which is in line with the results of this paper.
Figure 17 depicts the stress variations in the externally prestressed tendons in two beams during the accelerated corrosion test. It can be seen that, except for P2 of Beam A1, the stress change in the externally prestressed tendons is not significant. Although the stress fluctuation of P2 is relatively larger compared to others, the stress difference before and after the test is only 1.6 kN (0.96%), indicating a small change. This may be due to the short corrosion period of the two beams and the fact that the externally prestressed tendons are independent of the chloride salt corrosion. Moreover, during the accelerated corrosion test, the deflection at the mid-span of the beams is relatively low (less than 1.4 mm), and the beams are in the elastic stage, and the effect of externally prestressed tendons is not obvious, so the stress change is not significant.

3.3. Analysis of Mass Loss of Steel Bars

The average mass loss of stirrups and longitudinal steel bars in the top and bottom plates of Beam A2 is listed in Table 4, which shows that the mass loss of stirrups is higher than that of longitudinal steel bars, and this phenomenon is more obvious in the bottom plate. This result is consistent with the research results of Wang et al. [36]. They found that the average mass loss in short stirrup limbs in the tension zone of corroded beams was approximately 5.0–6.9 times that in longitudinal tensile steel bars, and their maximum mass loss was about 2.8–5.0 times that in longitudinal tensile steel bars. This is because the thickness of concrete cover for stirrups is smaller than that for longitudinal steel bars, which allows Cl and other substances to reach the position of the stirrups first, resulting in earlier and more serious corrosion of the stirrups. Additionally, it can be noticed from Table 4 that the mass loss of longitudinal steel bars in the top plate is significantly higher than that of the bottom plate. This may be due to the fact that water is required to participate in the chemical reactions and acts as the main component of the electrolyte solution during the corrosion process of steel bars; the top plate is more prone to water accumulation than the bottom plate, leading to faster corrosion of the longitudinal steel bars in the top plate.

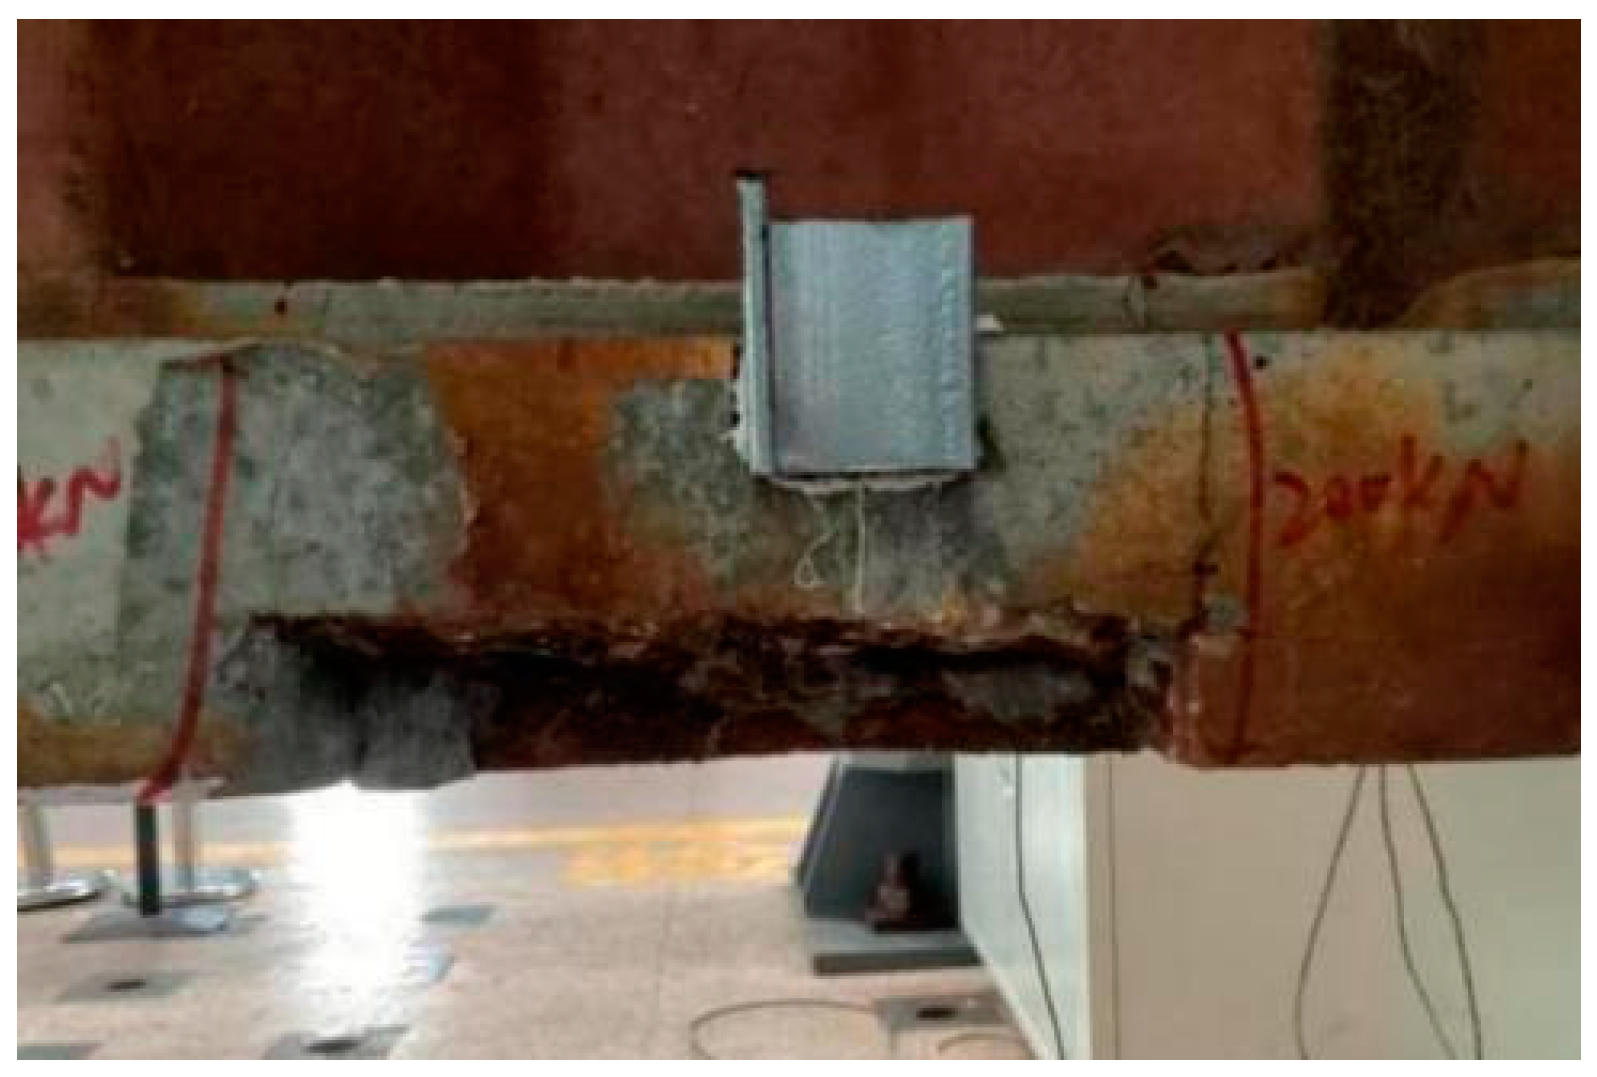
3.4. Loading Failure Process of Beams

(1)
Beam A1
Before the concrete cracking of Beam A1, the load and the mid-span deflection present a linear relationship, and the prestress gradually increases. When the beam is loaded to 130 kN, the prestress increment is 0.7 kN. Beam A1 cracks at 143 kN, with two cracks measuring 0.10 mm in width, and the prestress increments of P1 and P2 are 1.1 kN and 0.9 kN, respectively. The relative slip between the bottom plate and the web at the 2/3 section is the highest, that is, 0.04 mm.
When the load reaches 182 kN, the number of newly added cracks reaches 11, and the cracks show branching phenomenon. The increments of prestress of P1 and P2 are 2.9 kN and 2.2 kN, respectively, which reflects the accelerated growth rate of prestress. Furthermore, the relative slip between the bottom plate and web at the 2/3 section is the largest, which is 0.04 mm.
When the load ranges from 182 kN to 335 kN, new cracks continue to appear on the surface of Beam A1, with a relatively small number of cracks and an obvious development in crack width. When the load is 335 kN, the maximum width of cracks reaches 0.62 mm, and the prestresses of P1 and P2 grow greatly with increments of 20.8 kN and 21.7 kN, respectively. Moreover, the relative slip between the bottom plate and the web at the 2/3 section is the largest, which is 0.18 mm.
When the load is 409 kN, no new cracks appear, and the maximum width of cracks reaches 0.86 mm. The prestresses of P1 and P2 increase rapidly, and the increments of prestress at this time are 54.8 kN and 57.2 kN, respectively. When the load increases to 421 kN, a sound of “dang” is heard, and the load subsequently starts to decrease, which means the failure of Beam A1. Li [42] also confirmed that as the CBCSWs approached failure, the number of cracks at the bottom of the beam no longer increased, but the width and length of the cracks quickly increased, and the deflection also increased rapidly.
(2)
Beam A2
The bottom plate of Beam A2 cracks at 110 kN, resulting in three cracks, and at this time, the changes in prestresses of P1 and P2 are relatively small, with values of 0.7 kN and 1.7 kN, respectively, and the relative slip between the bottom plate and the web at the mid-span section is the largest, which is 0.04 mm.
When the load is 200 kN, a squeaking sound is heard from Beam A2, and the maximum width of cracks is 0.72 mm. At the junction of the bottom plate and the corrugated steel webs, the cracks extend inward from 30° to 45° with the inclined web, as shown in Figure 18. Meanwhile, the prestresses of P1 and P2 increase linearly with increments of 14.1 kN and 17.8 kN, respectively. The relative slip between the bottom plate and the web at the 2/3 section is the largest, which is 0.27 mm.
When Beam A2 is loaded to 235 kN, noticeable movement occurs on both sides of cracks on the bottom plate, and the maximum width of cracks is 1.00 mm. Obvious gaps are observed along the corrugations at the junction of the bottom plate and the web, and the stress cracks intersect with the longitudinal corrosion-induced cracks, as shown in Figure 19.
A snap is heard when the Beam A2 is loaded to 248 kN, then the load begins to decrease, and the concrete starts to spalling at the intersection of stress cracks and longitudinal corrosion-induced cracks, the corroded steel bars are exposed, which indicates that damage occurs to Beam A2, as shown in Figure 20.
Comparison between Beams A1 and A2 reveals that Beam A2 has fewer stress cracks, only 14 of which are concentrated in the third-point region to the mid-span region (i.e., pure bending region), while Beam A1 has relatively more cracks, with 24 in total, including 15 in the third-point region to the mid-span region and the others appearing in the third-point region to the support region. Wang and Xu [43] also confirmed that when beams experienced load failure, with the increase in the mass loss of the steel bars, the number of stress cracks on the surface of the beams decreased, while the average spacing of stress cracks increased. The main reason for this phenomenon is the corrosion of the steel bars in Beam A2, with the mass loss of the steel bars exceeding 7%, causing a reduction in the cohesive force between the steel bars and concrete. Therefore, during the loading failure process, fewer stress cracks occurred on the surface of Beam A2.

3.5. Relative Slip between the Plates and the Web during the Loading Failure Process

The relative slip between the plates and the web on the left side of Beam A1 begins to develop when the Beam A1 is loaded to 29 kN, which occurs at the 1/3 and 1/6 sections, with a value of 0.01 mm. As the load increases, the relative slip at each section increases, but not significantly. When the load reaches 233 kN, the relative slip between the bottom plate and the web at the 1/3 section develops rapidly. When the load is 328 kN, the relative slip between the top plate and the web at the 2/3 section increases obviously. When the load is 368 kN, the relative slip between the top plate and the web at the 2/3 section reaches 0.17 mm, while the relative slip between the bottom plate and the web at the 1/3 section reaches 0.44 mm.
The relative slips between the plates and the web on the right side of Beam A1 begin to develop at 22 kN and 65 kN, respectively, and both occur at the 1/3 section, with a value of 0.01 mm. As the load increases, the relative slip at each section increases. When the load is 368 kN, the relative slip at the 2/3 section is the largest, with 0.17 mm between the top plate and the web and 0.39 mm between the bottom plate and the web.
When Beam A2 is loaded to 50 kN, the relative slip between the top plate and the web on the left side of Beam A2 initially occurs at the left support section, which is 0.01 mm. When the load reaches 200 kN, the maximum relative slip between the top plate and the web at the 1/3 section on the left side is 0.12 mm. The relative slips between the bottom plate and the web on the left side, the top plate and the web on the right side, and the bottom plate and the web on the right side all first develop at the 2/3 section. The maximum relative slip occurs at the 2/3 section when Beam A2 is loaded to 200 kN, reaching 0.27 mm, 0.18 mm, and 0.04 mm, respectively.
When the load is large, the largest relative slip is at the 1/3 section for both beams, as cracks generated by the load mainly concentrate in the mid-span to the 1/3 section. The maximum relative slip at different positions of Beam A1 is approximately larger than that of Beam A2. This is because the bearing capacity of Beam A2 is reduced after the corrosion of the steel bars, and when Beam A2 fails, the load is smaller, and the relative slip between the web and the plates has not been fully developed.

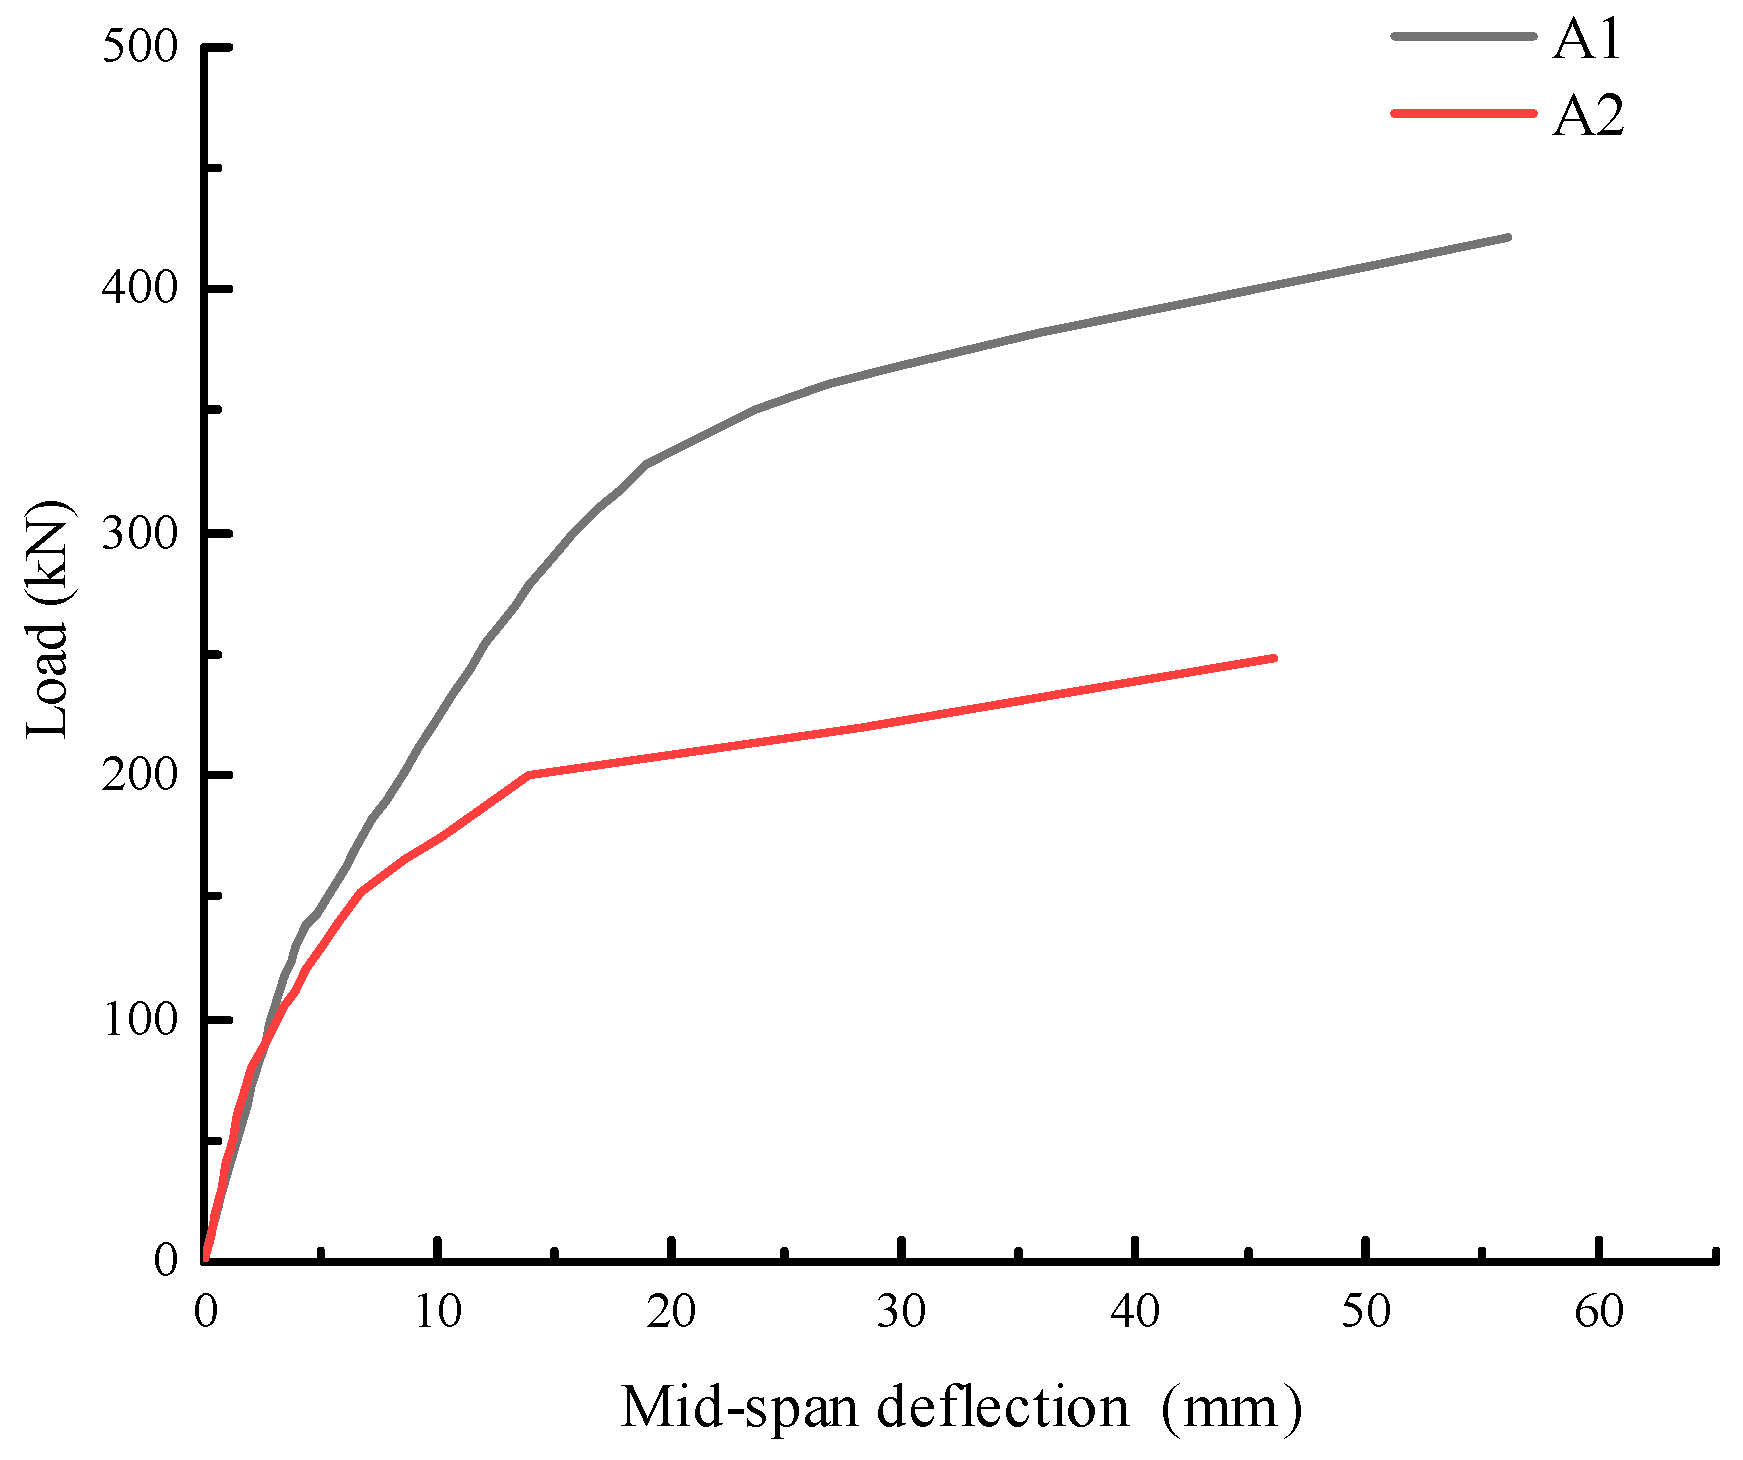
3.6. Load–Deflection Curve at the Mid-Span

The load–deflection curves at the mid-span of Beams A1 and A2 are shown in Figure 21. It can be seen from Figure 21 that the bearing capacity of Beam A2 is obviously degraded due to the coupled effect of the steel corrosion and sustained load, which is in agreement with the results of Li et al. [44], who studied the behavior of RC beams under simultaneous loading and reinforcement corrosion. Before cracking, the deflection at the mid-span of Beams A1 and A2 approximately increases linearly with the increasing load, and the stiffness of Beam A2 is slightly greater than that of Beam A1. Hu [6] also confirmed that the deflection of the CBCSWs had a linear relationship with the load growth in the range of the elastic stage. As the load increases, the bottom plate of Beam A2 cracks, resulting in a decrease in stiffness; thus, Beam A2 has a lower stiffness. When the load reaches 143 kN, Beam A1 cracks, where a distinct turning point can be observed on the load–deflection curve at the mid-span of Beam A1.
The load and mid-span deflection of the beams are shown in Table 5. From Table 5, it can be seen that after the accelerated corrosion test, the yield load and yield deflection of Beam A2 are decreased by 46.2% and 48.2% compared to Beam A1, respectively, while the ultimate load and ultimate deflection of Beam A2 are decreased by 41.1% and 17.9%, respectively.

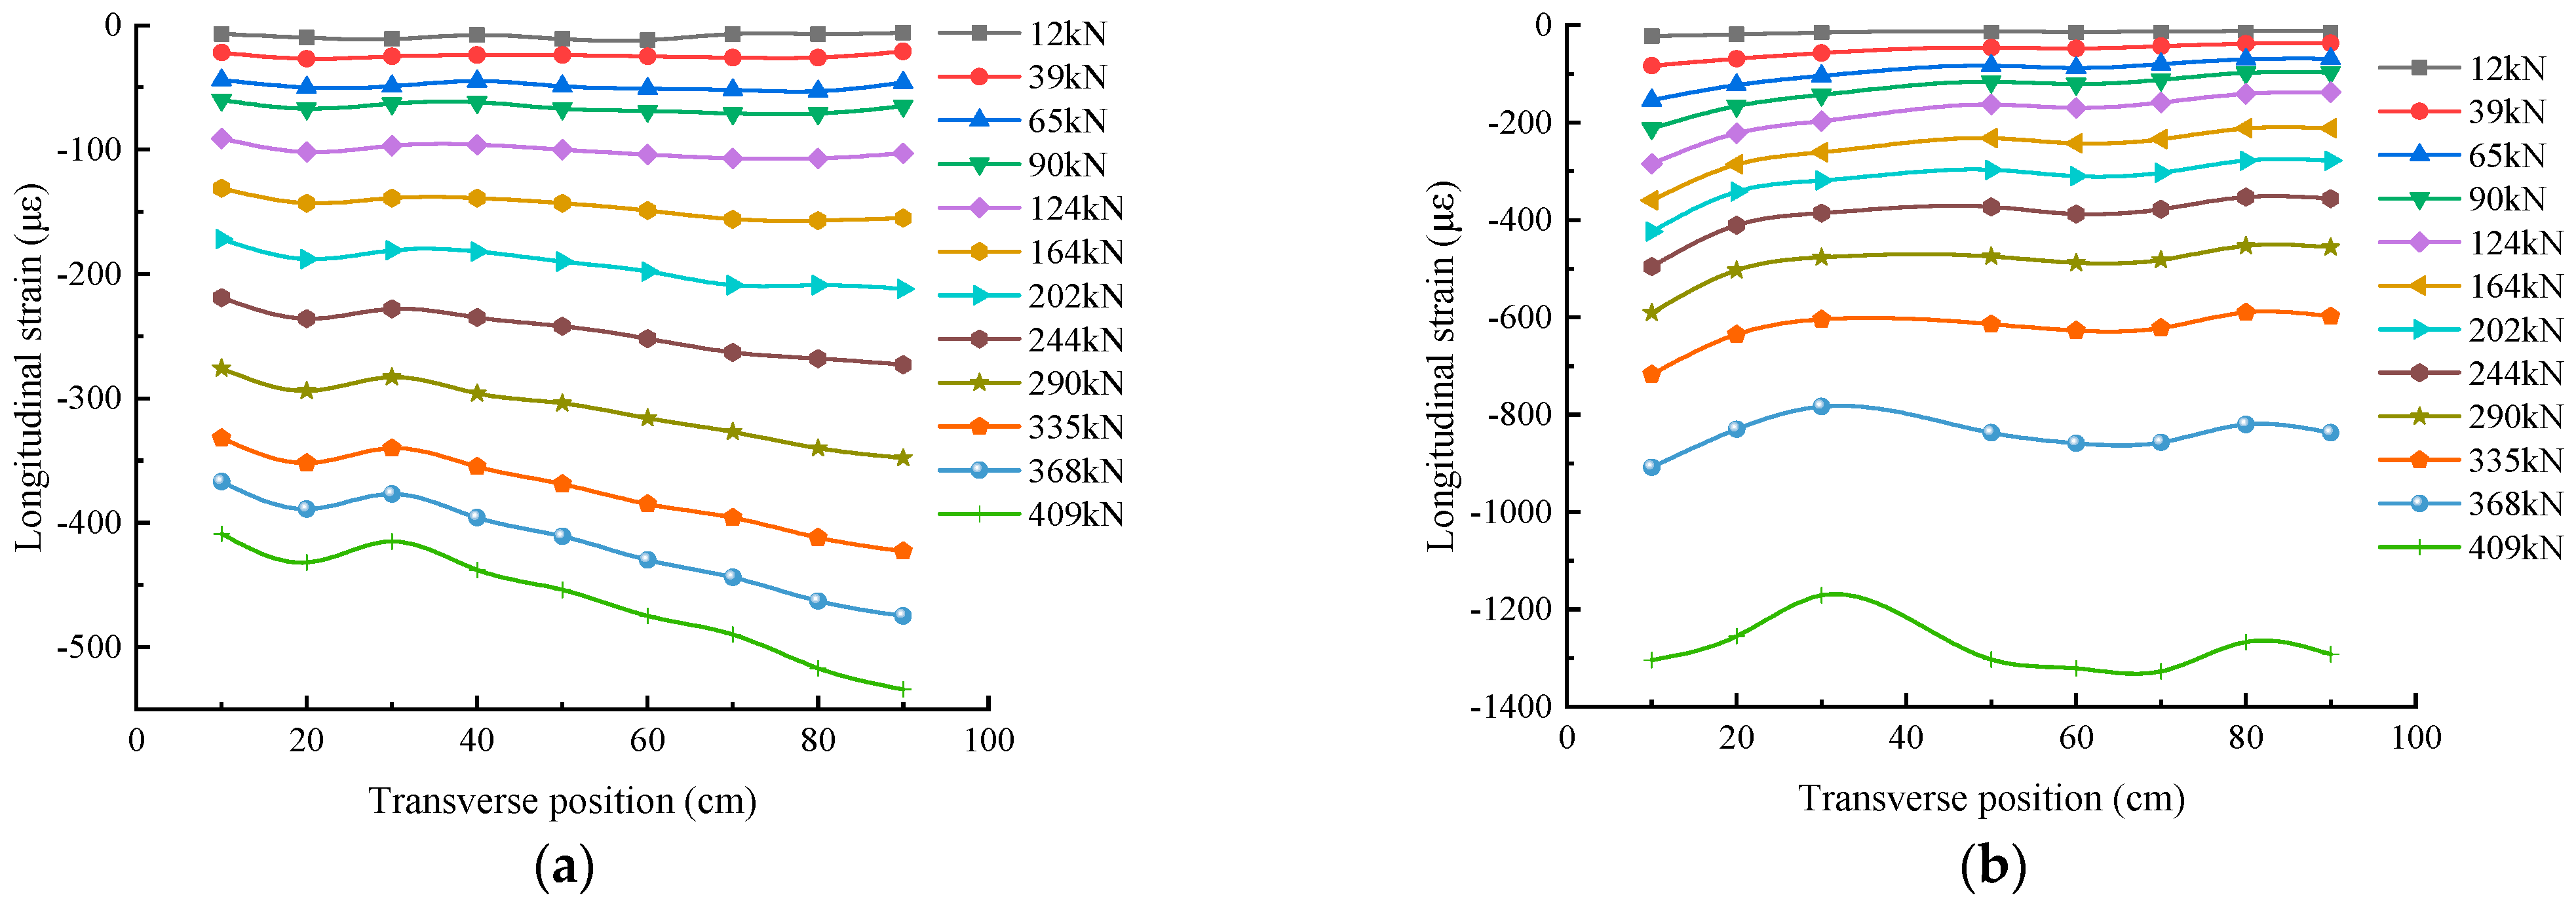
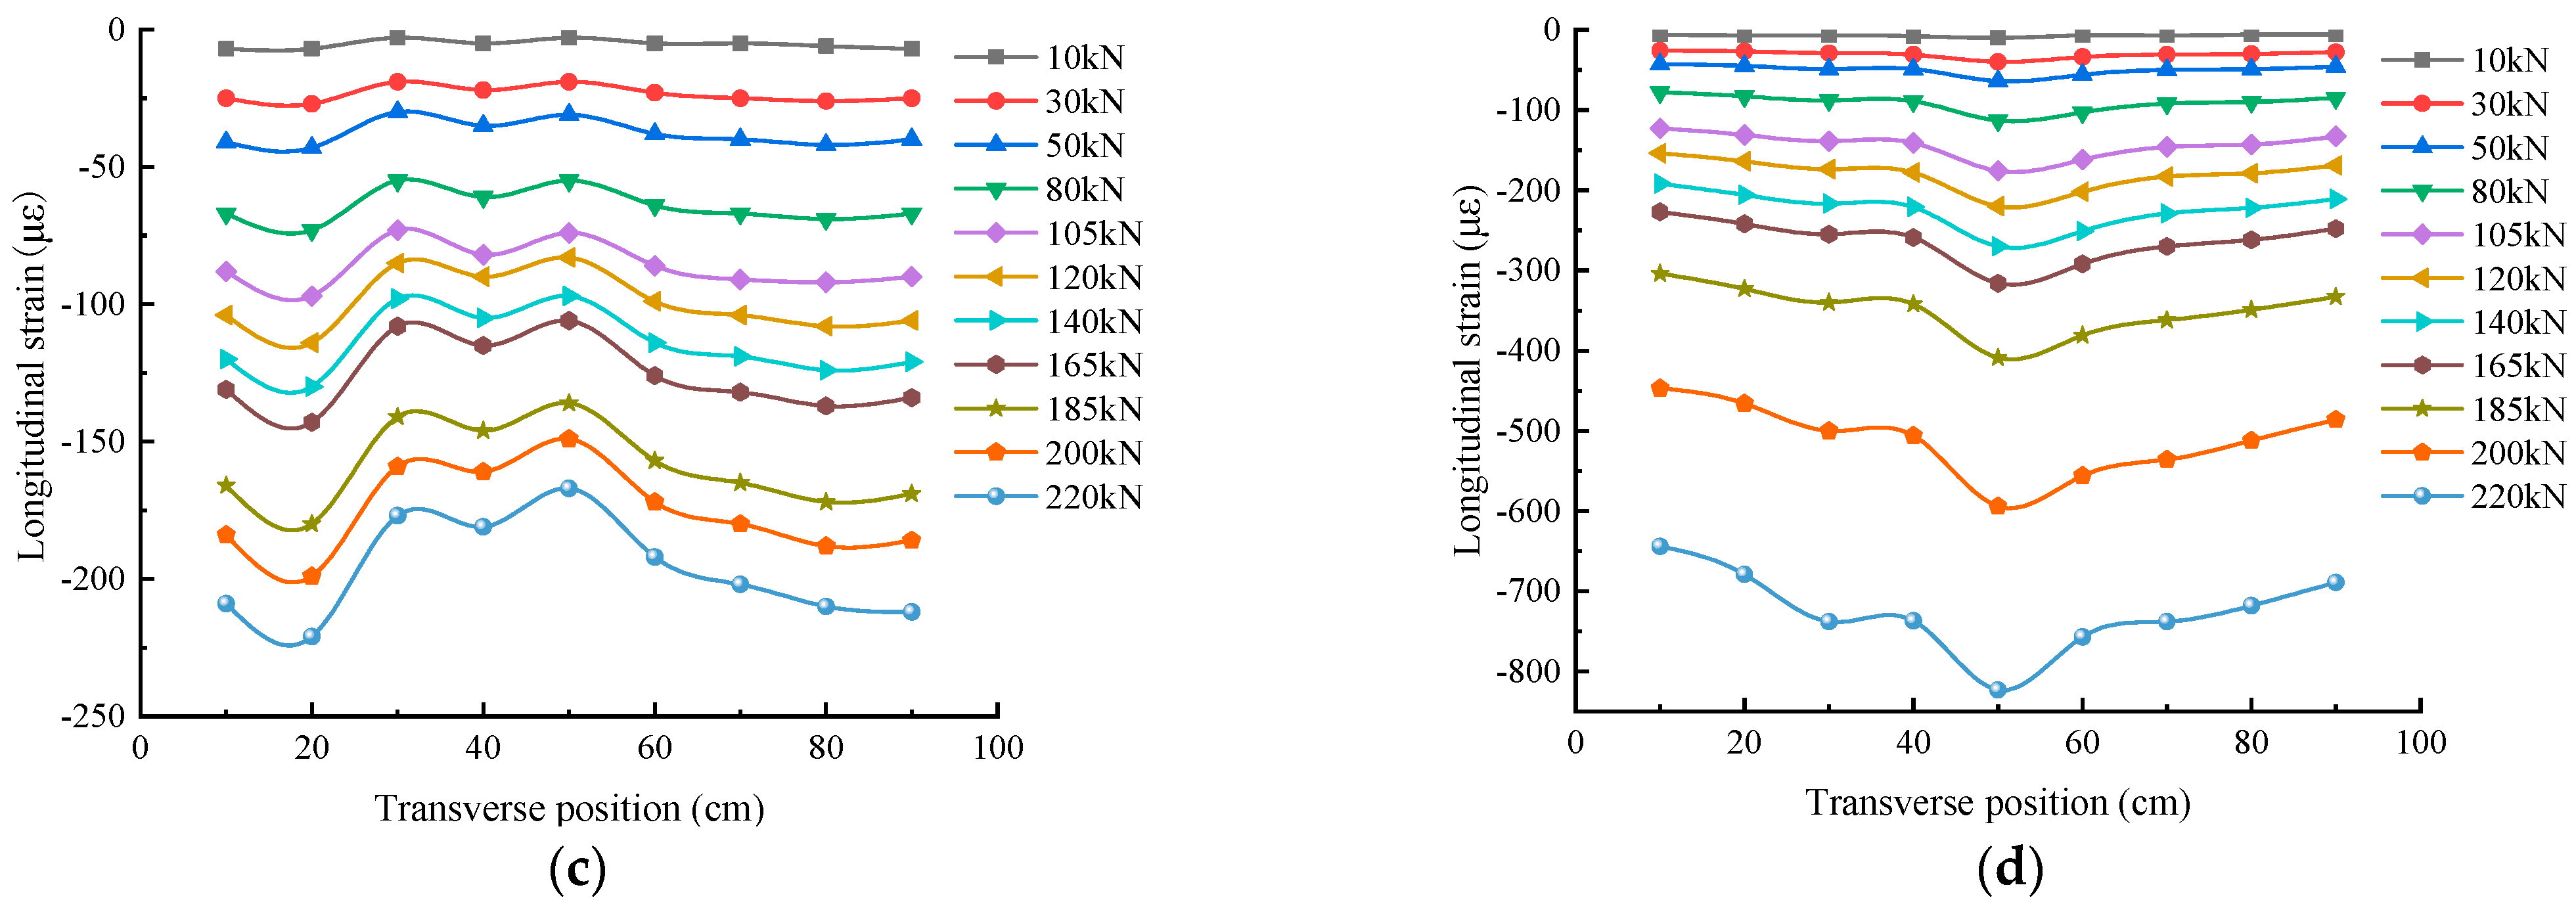
3.7. Strain Variations during the Loading Failure Process

The distribution of longitudinal strains along the height direction of Beams A1 and A2, including the four-point section and mid-span, is shown in Figure 22. Chen [5] proved that the strain distribution of the top and bottom plates of uncorroded CBCSWs conformed to the quasi-plane section assumption through both experimental research and theoretical analysis. Yuan et al. [45] found that the strain distribution of uncorroded CBCSWs was basically consistent with the quasi-plane section assumption when it was subjected to bending load. It can be seen from Figure 22 that the quasi-plane section assumption is still approximately applicable to the corroded CBCSWs. Due to the longitudinal folding effect of corrugated steel webs, the strain within the height range of the web is close to zero, indicating that the corrugated steel webs hardly bear bending moments [45,46]. Therefore, it is feasible to adopt quasi-plane section assumption in engineering calculations that only considers the influence of top and bottom plates on the bending performance of corroded CBCSWs, ignoring the corrugated steel webs.
The shear lag effect is mainly manifested in the uneven distribution of longitudinal compressive stresses along the width direction of flange plates under a load. The distribution of longitudinal strains along the width direction of the top plate of Beams A1 and A2 are depicted in Figure 23.
As shown in Figure 23, for Beam A1, when the load is relatively small, the distribution of longitudinal strains is relatively uniform. After the beam cracks, the longitudinal strains at 20 cm of the four-point section are greater than those at 10 cm and 30 cm, and the longitudinal strains gradually increase from 30 cm to 90 cm at this section. The longitudinal strains at 30 cm and 80 cm of the mid-span section are significantly smaller than those at other positions, and as the load increases, this difference becomes more obvious.
As depicted in Figure 23, for Beam A2, when the load is relatively small, the distribution of longitudinal strains is relatively uniform as well. After the concrete cracks, the longitudinal strains at 20 cm and 80 cm of the four-point section, which is in the web position, are greater than those at other positions, while the longitudinal strains at the middle position of the mid-span section are significantly larger than those at other positions.
Thus, the distribution of longitudinal strains along the width direction of the top plate of Beams A1 and A2 is uneven, indicating the presence of the shear lag effect, which is consistent with the findings of Ma et al. [26], Chen at al. [27], and Ji et al. [28]. Compared with Figure 23a,c, as well as Figure 23b,d, it can also be observed that the load is within the range of 220 kN, and the distribution of longitudinal strains along the width direction of the top plate of corroded CBCSWs is more uneven, that is, the shear lag effect of the top plate of corroded CBCSWs is more obvious.

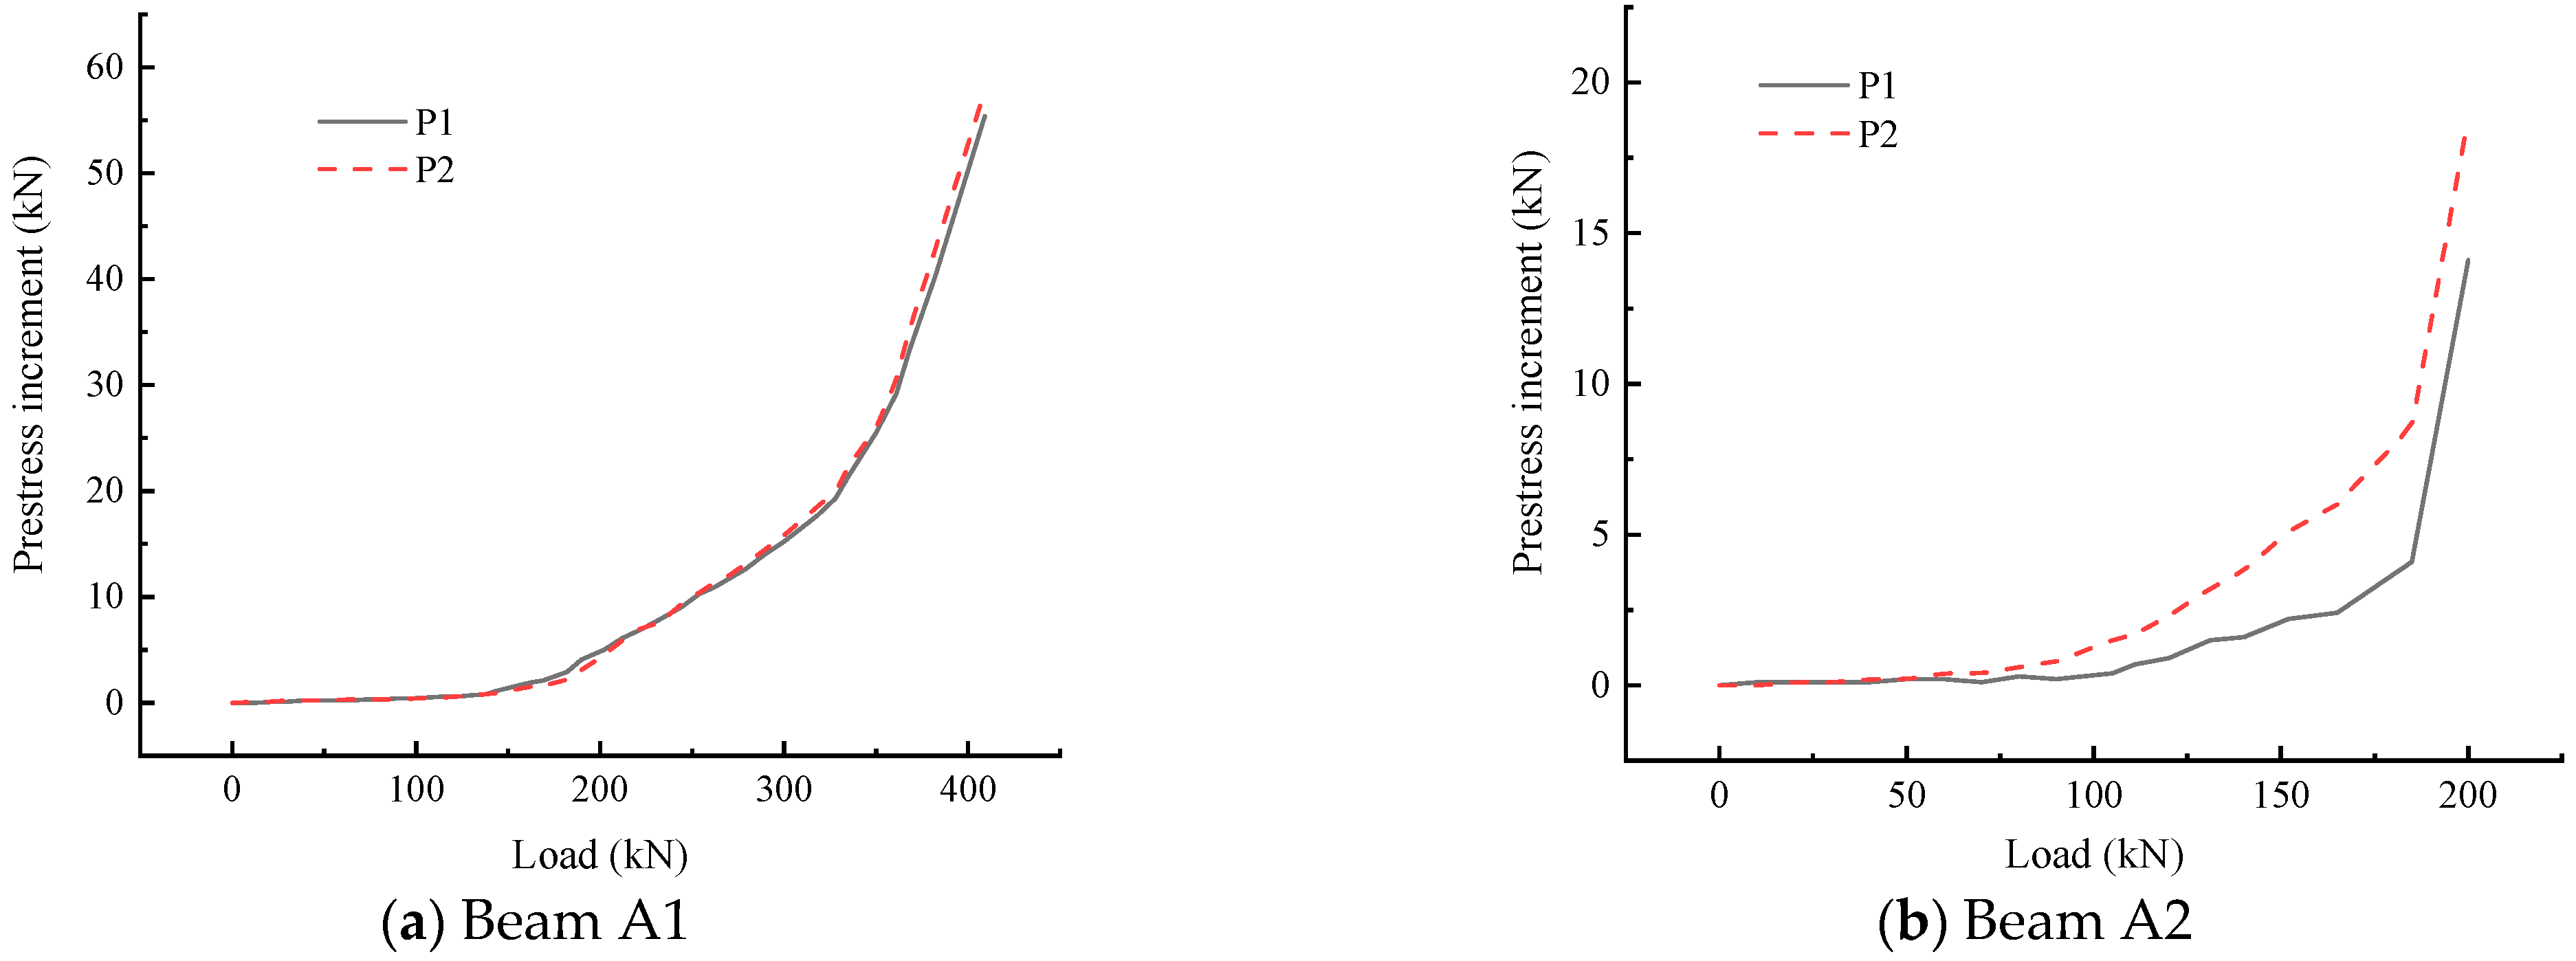
3.8. Stress Change in Externally Prestressed Tendons during the Loading Failure Process

The stress increments of the externally prestressed tendons of Beams A1 and A2 are shown in Figure 24. For Beam A1, the prestress increments of the two externally prestressed tendons are basically consistent, as shown in Figure 24. The change in prestress increment can be divided into three stages with the increase in load. In the first stage, before the plates crack, the curve is almost horizontal, that is, the growth rate of prestress is slow, and its increment is small. Li [42] reached the same conclusion. When the beam is loaded to 143 kN, the stress increments of P1 and P2 are only 1.1 kN and 0.9 kN, respectively. In the second stage, after cracking, the slope of the curve increases, the growth rate of prestress accelerates, and the increment increases. When the beam is loaded to 350 kN, the prestress increments of P1 and P2 are 25.5 kN and 26.0 kN, respectively. After the load reaches 350 kN, which is the third stage, the slope of the curve increases significantly, illustrating a significant increment in prestress. In the research of Li [42], he obtained a similar conclusion. When Beam A1 fails, the prestress increments of P1 and P2 are 55.4 kN and 57.8 kN, respectively, accounting for 35.09% and 35.35% of the initial prestress, respectively, and it can be seen that the externally prestressed tendons are fully utilized when Beam A1 fails.
For Beam A2, the stress increments of the externally prestressed tendons can also be divided into three stages, but there is an obvious difference in the stress increment between the two tendons. In the first stage, before cracking, the curve is almost horizontal with a small prestress increment and a slow increase in increment. When Beam A2 is loaded to 110 kN, the prestress increments of P1 and P2 are only 0.7 kN and 1.7 kN, respectively. Entering the second stage after the plates crack, the slope of the curve increases, which indicates an accelerated increase in prestress. When the load is 185 kN, the prestress increments of P1 and P2 are 4.1 kN and 8.6 kN, respectively. When the load is beyond 185 kN, the slope of the curve increases significantly, demonstrating that the increase in prestress increment speeds up again. While the beam is damaged, the prestress increments of P1 and P2 are 14.1 kN and 18.8 kN, respectively, which are 8.44% and 11.24% of the initial prestress, respectively. It can be found that, compared with Beam A1, Beam A2 fails to fully utilize the performance of externally prestressed tendons when it is damaged.

4. Conclusions

In this paper, the flexural performance of CBCSWs under the coupled effect of chloride ion erosion and sustained load was studied by experiments, and the following main conclusions were obtained:
(1)
During the accelerated corrosion test, the corrosion degree of the top plate of the CBCSWs is higher than that of the bottom plate. The deflection at the mid-span of the CBCSWs shows an increasing trend with the increase in corrosion time. Compared with the uncorroded CBCSWs, the deflection at the mid-span of the corroded CBCSWs increases more and grows faster. During the accelerated corrosion test, there is no obvious change in the stress of the externally prestressed tendons of the CBCSWs. In the CBCSWs, the mass loss of stirrups is higher than that of longitudinal steel bars, and the mass loss of longitudinal steel bars in the top plate is significantly higher than that in the bottom plate.
(2)
Compared with uncorroded CBCSWs, during the loading failure process, the amount of stress cracks in the corroded CBCSWs is reduced. The relative slip between the web and the plates of the corroded CBCSWs does not fully develop during the loading failure process, and the maximum relative slips at different positions are approximately smaller than those of the uncorroded CBCSWs.
(3)
The yield load and yield deflection of corroded CBCSWs decreased by 46.2% and 48.2%, respectively, and the ultimate load and ultimate deflection decreased by 41.1% and 17.9%, respectively, compared to those of the CBCSWs.
(4)
The quasi-plane section assumption is still approximately applicable to the corroded CBCSWs. Compared with the uncorroded CBCSWs, the shear lag effect of the top plate of the corroded CBCSWs is more obvious. The externally prestressed tendons of the corroded CBCSWs cannot give full play to their performance during the process of loading failure.
(5)
The corrosion of corrugated steel webs can affect the mechanical properties of composite beams, and further research regarding the possible influence of corroded corrugated steel webs on the flexural performance, shear performance, and other mechanical properties of composite beams is recommended. Moreover, research into the sound insulation characteristics and the acoustic wave transmission features of the plates of corroded CBCSWs has important scientific value.

Author Contributions

Conceptualization, Q.X. and J.W.; data curation, Z.T., J.S. and B.C.; formal analysis, Q.X.; investigation, Q.X. and J.W.; methodology, Q.X. and J.S.; resources, Q.X., J.W. and J.S.; supervision, Q.X. and J.S.; validation, Z.T. and B.C.; visualization, J.W. and B.C.; writing—original draft, Q.X., J.W., Z.T. and B.C.; writing—review and editing, Z.T. and J.S. All authors have read and agreed to the published version of the manuscript.

Funding

This research was funded by the Basic Research Business Expenses of Central Public Welfare Research Institutes of Research Institute of Highway Ministry of Transport (grant No. 2022-9047) and the Key Laboratory of Transportation Industry for Old Bridge Inspection and Reinforcement (Beijing) (grant No. 76140-42990014).

Data Availability Statement

The data presented in this study are available on request from the corresponding author.

Conflicts of Interest

The authors declare no conflict of interest.

References

  1. Zhou, X.H.; Lin, X.Y.; Tan, D.L.; Lu, W.R.; Yang, L. Fatigue test of composite box beams with corrugated steel webs. China J. Highw. Transp. 2010, 23, 33–38. [Google Scholar]
  2. He, J.; Liu, Y.; Lin, Z.; Chen, A.; Yoda, T. Shear behavior of partially encased composite I-girder with corrugated steel web: Numerical study. J. Constr. Steel Res. 2012, 79, 166–182. [Google Scholar] [CrossRef]
  3. Feng, J.X. Experimental Study for Long-Term Deformation of PC Box Girder with Corrugated Steel Webs Considering Shear Slip and Shear Deformation. Ph.D. Thesis, Beijing Jiaotong University, Beijing, China, 2021. [Google Scholar]
  4. Zhou, X.H.; Kong, X.F.; Hou, J.; Cheng, D.L.; Di, J. Shear mechanical property of composite box girder with corrugated steel webs. China J. Highw. Transp. 2007, 20, 77–82. [Google Scholar]
  5. Cheng, D.L. Research on Bending Property of the Prestressed Concrete Box Girders with Corrugated Steel Webs. Master’s Thesis, Chang’an University, Xi’an, China, 2007. [Google Scholar]
  6. Hu, J. Finite element analysis of composite box beam with corrugated steel web. J. Henan Polytech. Univ. (Nat. Sci.) 2009, 28, 170–174. [Google Scholar]
  7. Chen, Y.; Dong, J.; Tong, Z.; Jiang, R.; Yue, Y. Flexural behavior of composite box girders with corrugated steel webs and trusses. Eng. Struct. 2020, 209, 110275. [Google Scholar] [CrossRef]
  8. Kim, K.S.; Lee, D.H.; Choi, S.M.; Choi, Y.H.; Jung, S.H. Flexural behavior of prestressed composite beams with corrugated web: Part I. Development and analysis. Compos. Part B Eng. 2011, 42, 1603–1616. [Google Scholar] [CrossRef]
  9. Nikoomanesh, M.R.; Goudarzi, M.A. Experimental and numerical evaluation of shear load capacity for sinusoidal corrugated web girders. Thin-Walled Struct. 2020, 153, 106798. [Google Scholar] [CrossRef]
  10. Amani, M.; Al-Emrani, M.; Flansbjer, M. Shear behavior of stainless steel girders with corrugated webs. J. Constr. Steel Res. 2023, 210, 108086. [Google Scholar] [CrossRef]
  11. Zhou, M.; Fu, H.; Su, X.; An, L. Shear performance analysis of a tapered beam with trapezoidally corrugated steel webs considering the Resal effect. Eng. Struct. 2019, 196, 109295. [Google Scholar] [CrossRef]
  12. Su, X.; Zhou, M.; Tanwari, K.A. Shear performance of prismatic and tapered beams with corrugated steel webs under external prestressing force. Thin-Walled Struct. 2022, 180, 109926. [Google Scholar] [CrossRef]
  13. Kanchanadevi, A.; Ramanjaneyulu, K.; Gandhi, P. Shear resistance of embedded connection of composite girder with corrugated steel web. J. Constr. Steel Res. 2021, 187, 106994. [Google Scholar] [CrossRef]
  14. Li, J.; Du, G.; Feng, G.; Feng, Y.; Yan, X.; Liang, Y. Shear analysis and static load test of single-box and multicell composite girders with corrugated steel webs: A case study. J. Civ. Eng. 2020, 47, 556–566. [Google Scholar] [CrossRef]
  15. Di, J.; Zhou, X.H.; You, J.L.; Kong, X.F. Torsional property of prestressed concrete composite beam with corrugated steel webs. J. Chang’an Univ. (Nat. Sci. Ed.) 2009, 29, 58–63. [Google Scholar]
  16. Zhang, Z.; Tang, Y.; Li, J.; Hai, L.T. Torsional behavior of box-girder with corrugated web and steel bottom flange. J. Constr. Steel Res. 2020, 167, 105855. [Google Scholar] [CrossRef]
  17. Mo, Y.L.; Jeng, C.H.; Chang, Y.S. Torsional behavior of prestressed concrete box girder bridges with corrugated steel webs. ACI Struct. J. 2000, 97, 849–859. [Google Scholar]
  18. Ding, Y.; Jiang, K.; Liu, Y. Nonlinear analysis for PC box-girder with corrugated steel webs under pure torsion. Thin-Walled Struct. 2012, 51, 167–173. [Google Scholar] [CrossRef]
  19. Wang, S.B. Experiment on torsion behaviors of pre-stressed concrete composite box girders with corrugated steel webs. Build. Struct. 2012, 42, 121–125. [Google Scholar]
  20. Chen, Y.Y.; Chen, B.C.; Lin, S. Experiment of torsional performance and finite element analysis of PC composite box girder with corrugated steel webs. J. Archit. Civ. Eng. 2011, 28, 106–115. [Google Scholar]
  21. Tu, B.; Cai, S.; Li, J.; Liu, H. Fatigue assessment of a full-scale composite box-girder with corrugated-steel-webs and concrete-filled-tubular flange. J. Constr. Steel Res. 2021, 183, 106768. [Google Scholar] [CrossRef]
  22. Rong, X.; Xie, A.; Zhao, P.; Yang, M.; Bu, J.; Wei, X. Fatigue performance of composite trough-girders with corrugated-steel-webs. J. Constr. Steel Res. 2023, 207, 107974. [Google Scholar] [CrossRef]
  23. Peng, K.; Li, L.F.; Xiao, X.Y.; Pei, B.D.; Hou, J.Q. Experimental and theoretical analysis on fatigue performance of composite box girder with corrugated steel webs. China J. Highw. Transp. 2013, 26, 94–101. [Google Scholar]
  24. Wang, S.; Liu, Y.; He, J.; Xin, H.; Yao, H. Experimental study on cyclic behavior of composite beam with corrugated steel web considering different shear-span ratio. Eng. Struct. 2019, 180, 669–684. [Google Scholar] [CrossRef]
  25. Jiang, R.; Wu, Q.; Xiao, Y.; Peng, M.; Au, F.T.K.; Xu, T.; Chen, X. The shear lag effect of composite box girder bridges with corrugated steel webs. Structures 2023, 48, 1746–1760. [Google Scholar] [CrossRef]
  26. Ma, C.; Liu, S.Z.; Wu, M.Q. Matrix analysis of composite box girder with corrugated steel webs considering shear deformation and shear lag effect. China J. Highw. Transp. 2018, 31, 80–88. [Google Scholar]
  27. Chen, S.S.; Tian, Z.L.; Gui, S.R. Research on shear lag of single-box multi-cell girder with corrugated steel webs. J. Highw. Transp. Res. Dev. 2015, 32, 69–75. [Google Scholar]
  28. Ji, W.; Lin, P.; Liu, S. Deflection calculation and analysis of PC box girder bridges with corrugated steel webs. J. Southwest Jiaotong Univ. 2018, 53, 46–55. [Google Scholar]
  29. Moon, J.; Ko, H.J.; Sung, I.H.; Lee, H.E. Natural frequency of a composite girder with corrugated steel web. Steel Compos. Struct. 2015, 18, 255–271. [Google Scholar] [CrossRef]
  30. Cao, L.; Liu, J.P.; Chen, Y.F. Theoretical and numerical study on the natural frequencies of bridges with corrugated steel webs. Structures 2018, 15, 224–231. [Google Scholar] [CrossRef]
  31. Yang, Z.Y.; Yang, M.; Rong, X.L.; Tian, L.J. Theoretical and numerical study on dynamic characteristics of composite trough girder with corrugated steel webs. J. Bridge Eng. 2021, 26, 04021008. [Google Scholar] [CrossRef]
  32. Li, L.F.; Wang, F.; Liu, Z.C. Study on the creep behavior of externally prestressed composite beam with corrugated steel webs. J. Hunan Univ. (Nat. Sci.) 2008, 35, 1–5. [Google Scholar]
  33. Chen, X.C.; Pandey, M.; Bai, Z.Z.; Au, F.T.K. Long-term behavior of prestressed concrete bridges with corrugated steel webs. J. Bridge Eng. 2017, 22, 04017040. [Google Scholar] [CrossRef]
  34. Li, Q.; Zhou, M. Study on the natural frequency of box girders with corrugated steel webs. J. Constr. Steel Res. 2023, 211, 108123. [Google Scholar] [CrossRef]
  35. Li, L.; Zhou, C.; Wang, L. Distortion analysis of non-prismatic composite box girders with corrugated steel webs. J. Constr. Steel Res. 2018, 147, 74–86. [Google Scholar] [CrossRef]
  36. Wang, J.; Su, H.; Du, J.S. Corrosion characteristics of steel bars embedded in recycled concrete beams under static loads. J. Mater. Civ. Eng. 2020, 32, 04020263. [Google Scholar] [CrossRef]
  37. Wang, J.; Ng, P.L.; Su, H.; Du, J. Meso-scale modelling of stress effect on chloride diffusion in concrete using three-phase composite sphere model. Mater. Struct. 2019, 52, 55. [Google Scholar] [CrossRef]
  38. Wang, J.; Ng, P.L.; Su, H.; Du, J. Influence of the coupled time and concrete stress effects on instantaneous chloride diffusion coefficien. Constr. Build. Mater. 2020, 237, 117645. [Google Scholar] [CrossRef]
  39. GB/T 50082; Standard for Test Methods of Long-Term Performance and Durability of Ordinary Concrete. China Architecture & Building Press: Beijing, China, 2009.
  40. He, S.; Cao, Z.; Liu, W.; Shang, F. Experimental study on long-term performance of reinforced concrete beams under a sustained load in a corrosive environment. Constr. Build. Mater. 2020, 234, 117288. [Google Scholar] [CrossRef]
  41. Du, Y.; Cullen, M.; Li, C. Structural performance of RC beams under simultaneous loading and reinforcement corrosion. Constr. Build. Mater. 2013, 38, 472–481. [Google Scholar] [CrossRef]
  42. Li, T.K. Research on the Ultimate Moment Capacity of Externally Prestressed Composite Beams with Corrugated Steel Webs. Master’s Thesis, Hunan University, Changsha, China, 2015. [Google Scholar]
  43. Wang, J.; Xu, Q. The combined effect of load and corrosion on the flexural performance of recycled aggregate concrete beams. Struct. Concr. 2023, 24, 359–373. [Google Scholar] [CrossRef]
  44. Li, H.; Li, B.; Jin, R.; Li, S.; Yu, J.G. Effects of sustained loading and corrosion on the performance of reinforced concrete beams. Constr. Build. Mater. 2018, 169, 179–187. [Google Scholar] [CrossRef]
  45. Yuan, S.L.; Li, L.; Wu, M.; Wang, Q.Y.; Peng, Z.W. Test of quasi plane assumption and failure of box girders with corrugated steel web. J. Sichuan Univ. (Eng. Sci. Ed.) 2013, 45, 48–52. [Google Scholar]
  46. Wu, W.Q.; Ye, J.S.; Wan, S.; Hu, C. Quasi plane assumption and its application in steel-concrete composite box girders with corrugated steel webs. Eng. Mech. 2005, 22, 177–180. [Google Scholar]
Figure 1. Dimensions and reinforcement diagram of CBCSWs (unit: mm).
Buildings 13 02611 g001
Figure 2. Device for applying the sustained load (unit: mm).
Buildings 13 02611 g002
Figure 3. Schematic diagram of accelerated corrosion test.
Buildings 13 02611 g003
Figure 4. Arrangement of accelerated corrosion test.
Buildings 13 02611 g004
Figure 5. Arrangement of dial gauges (unit: mm).
Buildings 13 02611 g005
Figure 6. On-site loading picture.
Buildings 13 02611 g006
Figure 7. Arrangement of dial gauges during bending failure test.
Buildings 13 02611 g007
Figure 8. Arrangement of strain gauges (unit: mm).
Buildings 13 02611 g008
Figure 9. Corrosion of steel bars embedded in Beam A2.
Buildings 13 02611 g009
Figure 10. Corrosion of the top plate of Beam A2 on the 30th day of the accelerated corrosion test.
Buildings 13 02611 g010
Figure 11. Corrosion products on the side surfaces of Beam A2 on the 30th day of the accelerated corrosion test.
Buildings 13 02611 g011
Figure 12. Corrosion of the bottom plate of Beam A2 on the 30th day of the accelerated corrosion test.
Buildings 13 02611 g012
Figure 13. Corrosion of Beam A2 on the 50th day of the accelerated corrosion test.
Buildings 13 02611 g013
Figure 14. Corrosion-induced cracks of Beam A2 on the 80th day of the accelerated corrosion test.
Buildings 13 02611 g014
Figure 15. Corrosion-induced cracks on the bottom plate of Beam A2 on the 100th day of the accelerated corrosion test.
Buildings 13 02611 g015
Figure 16. Changes in deflection at mid-span of the beams during natural exposure and chloride ion accelerated corrosion.
Buildings 13 02611 g016
Figure 17. Stress variations in externally prestressed tendons during natural exposure and chloride salt corrosion.
Buildings 13 02611 g017
Figure 18. Development of cracks of Beam A2 when the load is 200 kN.
Buildings 13 02611 g018
Figure 19. Development of cracks on Beam A2 when the load is 235 kN.
Buildings 13 02611 g019
Figure 20. Concrete spalling of Beam A2 during loading process.
Buildings 13 02611 g020
Figure 21. Load–deflection curves at mid-span.
Buildings 13 02611 g021
Figure 22. Distribution of longitudinal strains along the height direction.
Buildings 13 02611 g022
Figure 23. Distribution of longitudinal strains along the width direction of the top plate. (a) Distribution of longitudinal strains along the width direction of the top plate at the four-point section of Beam A1. (b) Distribution of longitudinal strains along the width direction of the top plate at the mid-span section of Beam A1. (c) Distribution of longitudinal strains along the width direction of the top plate at the four-point section of Beam A2. (d) Distribution of longitudinal strains along the width direction of the top plate at the mid-span section of Beam A2.
Buildings 13 02611 g023aBuildings 13 02611 g023b
Figure 24. Stress changes in externally prestressed tendons during the loading failure process.
Buildings 13 02611 g024
Table 1. Design parameters of test beams.
Beam LabelConcrete TypeWeb TypePrestressing TendonsMeasured Prestress/kNExperimental Environment
P1P2
A1C50Corrugated steel webs15.24159.5155.5Natural exposure
A2C50Corrugated steel webs15.24163.7165.2Chloride ion drying-wetting cycle + electrochemical corrosion
Table 2. Mix proportion of concrete (unit weight: kg/m3).
CementSandCoarse AggregateWaterPolycarboxylate
Superplasticizer
47861011851723.59
Table 3. Mechanical properties of materials (unit: MPa).
ConcreteSteel BarsSteel Webs
Elastic Modulus28-Day Cube Compressive StrengthElastic ModulusYield StrengthUltimate StrengthElastic ModulusYield StrengthUltimate Strength
3.43 × 10451.62.12 × 105243.0384.32.08 × 105242.1403.2
Table 4. Mass loss of steel bars in A2 beam.
Position Top PlateBottom Plate
Stirrups 16.43%13.33%
Longitudinal steel bars12.39%7.71%
Table 5. The load and mid-span deflection of the beams at yield and failure.
Beam LabelYield Load (kN)Yield Deflection (mm)Ultimate Load (kN)Ultimate Deflection (mm)
A1332.942042156.07
A217910.3724846.01
Disclaimer/Publisher’s Note: The statements, opinions and data contained in all publications are solely those of the individual author(s) and contributor(s) and not of MDPI and/or the editor(s). MDPI and/or the editor(s) disclaim responsibility for any injury to people or property resulting from any ideas, methods, instructions or products referred to in the content.

