Abstract
The demand for renewable resources in building construction is increasing, and wheat straw is an excellent option due to its superior environmental performance compared to traditional insulation materials. However, the hygrothermal properties of chopped wheat straw insulation have remained largely unexplored. At the moment, blown-in straw is only blown in vertically, although horizontal blowing would be more efficient depending on the situation. This study investigates the effect of different blowing techniques on the thermal properties of chopped wheat straw insulation, focusing on the difference between vertical and horizontal blowing techniques. In-situ-measured thermal conductivities were compared with design values used in energy balances. In addition, the long-term hygrothermal behavior of chopped wheat straw insulation treated with flame retardants was investigated. The methodology included heat flow plate measurements, needle probe measurements and laboratory measurements using the hot plate method. The results show that there is no significant difference in thermal performance between the blowing techniques. The measured thermal conductivities were lower than expected, challenging the current general normative moisture surcharge on the thermal conductivity of natural fiber insulation. The addition of the flame retardant had no noticeable effect on the hygrothermal properties of the chopped straw. Chopped wheat straw can be regarded as a highly ecological insulation material with great potential for the future.
1. Introduction
The use of environmentally sustainable building elements is becoming increasingly important in the context of the current climate crisis. The urgency of addressing climate change and its impacts is demonstrated by the United Nations Sustainable Development Goal No. 13, which calls for immediate action to combat these issues, along with the European Green Deal. Within this broader context, there is a growing need to implement sustainability in the construction industry and to use building materials with low primary energy consumption in their manufacture [1]. Sustainable construction aims to reduce environmental impact throughout the whole life cycle. Achieving this goal involves various strategies, including the selection of environmentally friendly building materials, the utilization of renewable energy sources, and a reduction in overall energy consumption. It is crucial that our “built environment” meets both current requirements and those of the future generations.
The use of biomass waste as a substitute for traditional materials appears to be a viable solution to address pollution issues, reduce CO2 emissions and promote the development of energy-efficient, cost-effective and durable building materials [2,3]. One of the agricultural wastes that is produced in large quantities and is available in most parts of Europe is wheat straw. Straw, a renewable by-product of grain production, offers a low primary energy content and minimal environmental impact. It is biodegradable and can be seamlessly returned to the natural cycle.
Many studies have focused on wheat straw as a by-product. Liu et al. investigated wheat straw as an aggregate and geopolymer as a binder and showed that such a novel kind of bio-insulation material exhibits satisfactory thermal and mechanical performances, allowing it to be applied as a thermal insulation material in building, especially focusing on prefabricated buildings [4]. Researchers also focus on the usage of earth mixed with bio-based materials [5]. Agave and wheat straw fibers in hybrid boards with different compositions and densities are an environmentally friendly material that can contribute to energy-efficient building insulation [6]. Date palm tree leaves and wheat straw fibers demonstrate low thermal conductivity, excellent sound absorption, and potential suitability for building insulation and soundproofing applications [7].
When pure, untreated wheat straw is used, there are currently two options: straw bales and chopped straw for blow-in insulation. Straw bales have been proven in numerous studies to be cost-effective and energy efficient as insulation materials that are easy to handle [8,9,10]. Typically installed between wooden frame structures, straw bales have demonstrated their capacity to serve as effective thermal and moisture buffer materials [2]. Moisture buffering materials are able to absorb and release moisture through interaction with the environment, which is strongly influenced by the hygrothermal properties of the material [11]. Active moisture management through hygroscopic building materials can reduce the energy demand and stabilize the indoor climate of buildings [12].
While straw bales may require thicker layers than conventional insulation materials such as extruded polystyrene (XPS) or expanded polystyrene (EPS) to achieve similar insulation performance, their low embodied emissions make them an environmentally friendly alternative building material [13]. The usage of blow-in insulation in timber frame construction, even though still not as studied as the usage of straw bales, is gaining traction, with materials such as wood fiber and chopped straw experiencing a surge in popularity [14]. The main advantage of this insulation type over the usage of straw bales is the ability to prefabricate. The focus of production shifts from the job site to the factory. All timber components can be manufactured here with great care and expertise, on time and at low cost. This allows the straw to be blown into prefabricated wooden frames, whereas straw bale construction usually involves long and tedious manual labor.
In order to ensure the continuous improvement of manufacturing processes, it is imperative to address concerns regarding the orientation of straw fibers during horizontal blowing. Previous studies have indicated that vertically oriented straw bales and similar elements exhibit higher thermal conductivities compared to those with a horizontal or random orientation [15,16]. The OIB (Vienna, Austrian Institute for Building Technology) provides specifications for the manufacturing process of blow-in insulation in Austria, which must be properly executed. This procedure only allows blow-in for vertical wall elements [17]. Although horizontal blowing is sometimes more efficient for the factory production of building components, research on the effectiveness of this approach is currently lacking.
According to ÖNORM B6015-2, a higher thermal conductivity is attributed to natural fibers by adding 20% due to their moisture characteristics and it is generally assumed that a condition of 80% humidity is reached in their steady state [18]. Current research suggests that a higher moisture content and, therefore, higher thermal conductivity could be due to latent heat effects during measurements with a plate-measuring device [19], which do not occur under real conditions. For this reason, measurements of the thermal conductivity under real conditions are of great importance.
Striking a balance between ecological building practices, the use of renewable and biodegradable materials, and fire safety requirements presents a formidable challenge, as these aspects often appear contradictory. Optimizing the fire properties of organic building materials frequently requires the incorporation of flame retardants, which can impact the moisture behavior of blow-in insulation. Flame retardants may elevate the concentration of salts, leading to hygroscopic effects that hinder the material’s ability to absorb and release moisture [8]. The long-term consequences of such effects can include mold growth and the deterioration of insulation material. Therefore, the inclusion of flame retardants demands careful consideration, taking into account their potential ramifications [9].
To address these research gaps, this study investigated the following research questions:
- What is the difference in the thermal conductivity due to the blowing technology (horizontal and vertical)?
- What difference occurs between real-life measurements of the thermal conductivity and measurements in laboratory experiments?
- Does the addition of a flame retardant affect the hygrothermal properties of chopped straw?
2. Materials and Methods
The following investigations were carried out to answer the research questions:
- In situ measurement and calculation of the U-value and thermal conductivity of the different blow-in technologies.
- Needle probe measurement of the thermal conductivity on the in situ test bench.
- Sampling of the in situ measurement and investigation of the thermal conductivity in the laboratory.
- In situ hygrothermal long-term measurement of the straw insulation with flame retardants.
2.1. Investigation of Different Chopped Straw Blow-In Techniques
The test stand is located on the premises of the Technical University, Science Center, Vienna, and was erected in the year 2020. The outdoor test rig for in situ measurements is designed to perform measurements in real environments, allowing data to be collected under natural conditions and providing real-world insights in addition to laboratory measurements. It stands in a mostly unprotected area where it is exposed to the climatic conditions of south-eastern Vienna.
A timber-framed exterior wall was constructed for the tests and installed in this outdoor test facility (Figure 1). The outer wall measured 2.09 × 2.18 m, was made of a solid spruce timber frame with 0.20 × 0.06 m beams and was oriented to the east.
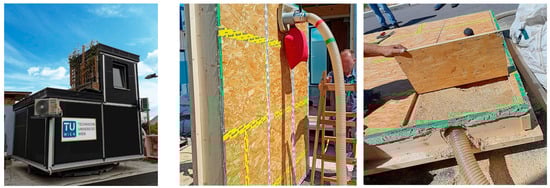
Figure 1.
Outdoor test stand in Vienna (left), vertical blowing technology (middle), horizontal blowing technology (right).
The investigated building material was untreated wheat straw with a fiber length between approx. 5 and 30 mm. The straw was installed using a conventional blowing machine, without the need for additional blowers. This means that the prepared straw was blown and compacted into the respective component through a long hose using air from a nozzle. The processing speed varies from approximately 5.5 m3 to 10 m3 per hour, at a density of 90 to 105 kg/m3. During compaction tests in accordance with EN 15101-1 [20], the volume of the insulation increased by up to 3%, but remained permanently stable. This property is retained by the straw used here throughout its entire service life due to its special fiber processing and structure.
The outer wall has three cavities, each filled using a different blowing method: one filled horizontally, one filled vertically, and one filled vertically with used straw. The straw already used was removed from another construction of a research project and blown in again. Different measurements are taken on all three samples. The vertical element represents the standard blowing technology, while the other two methods and the influence on their hygrothermal characteristics are unexplored.
As shown in Figure 2, the wall element was internally clad with an airtight glued oriented strand board (OSB) with a thickness of 0.019 m. Spruce squared lumber with dimensions of 0.20 × 0.06 m was placed between the individual compartments in the insulation layer. The outside of the wall was clad in a 0.02 m thick diffusion-open wood fiber board with a windproof membrane. Normally, a ventilated façade is used for such a structure. However, due to the air flow not significantly affecting the measurements, it was omitted in this case. A heat flow plate was installed on the inner surface and temperature sensors were placed on both surfaces.
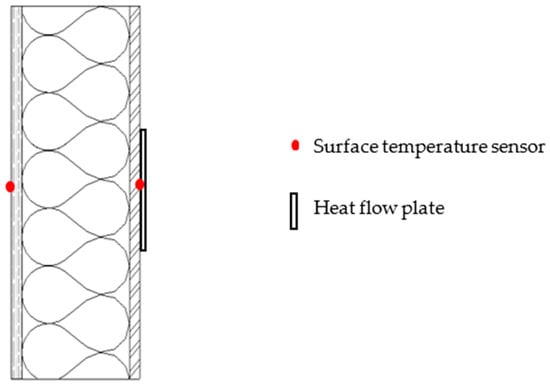
Figure 2.
Examined wall structure, vertical section.
2.1.1. Measurement Technique
Two air conditioners, RAV-GM301ATP-E from Toshiba, were used for conditioning inside the outdoor test stand. The indoor air temperature was maintained between 21 °C and 23 °C throughout the experiments, while the relative humidity was maintained at approximately 60%. PT1000 sensors from RS Components were utilized to measure the internal and external surface temperatures. The heat-flow-measuring plates, type 8, with dimensions of 250 mm × 250 mm × 1.5 mm, were provided by Phymeas.
Data recording and storage were carried out using the Keysight 34980A (HP34980A) switch system/data logger. Measurements were taken and stored at 10 min intervals.
Furthermore, thermal conductivity measurements were conducted using the needle probe THERM 2227-2 from Ahlborn.
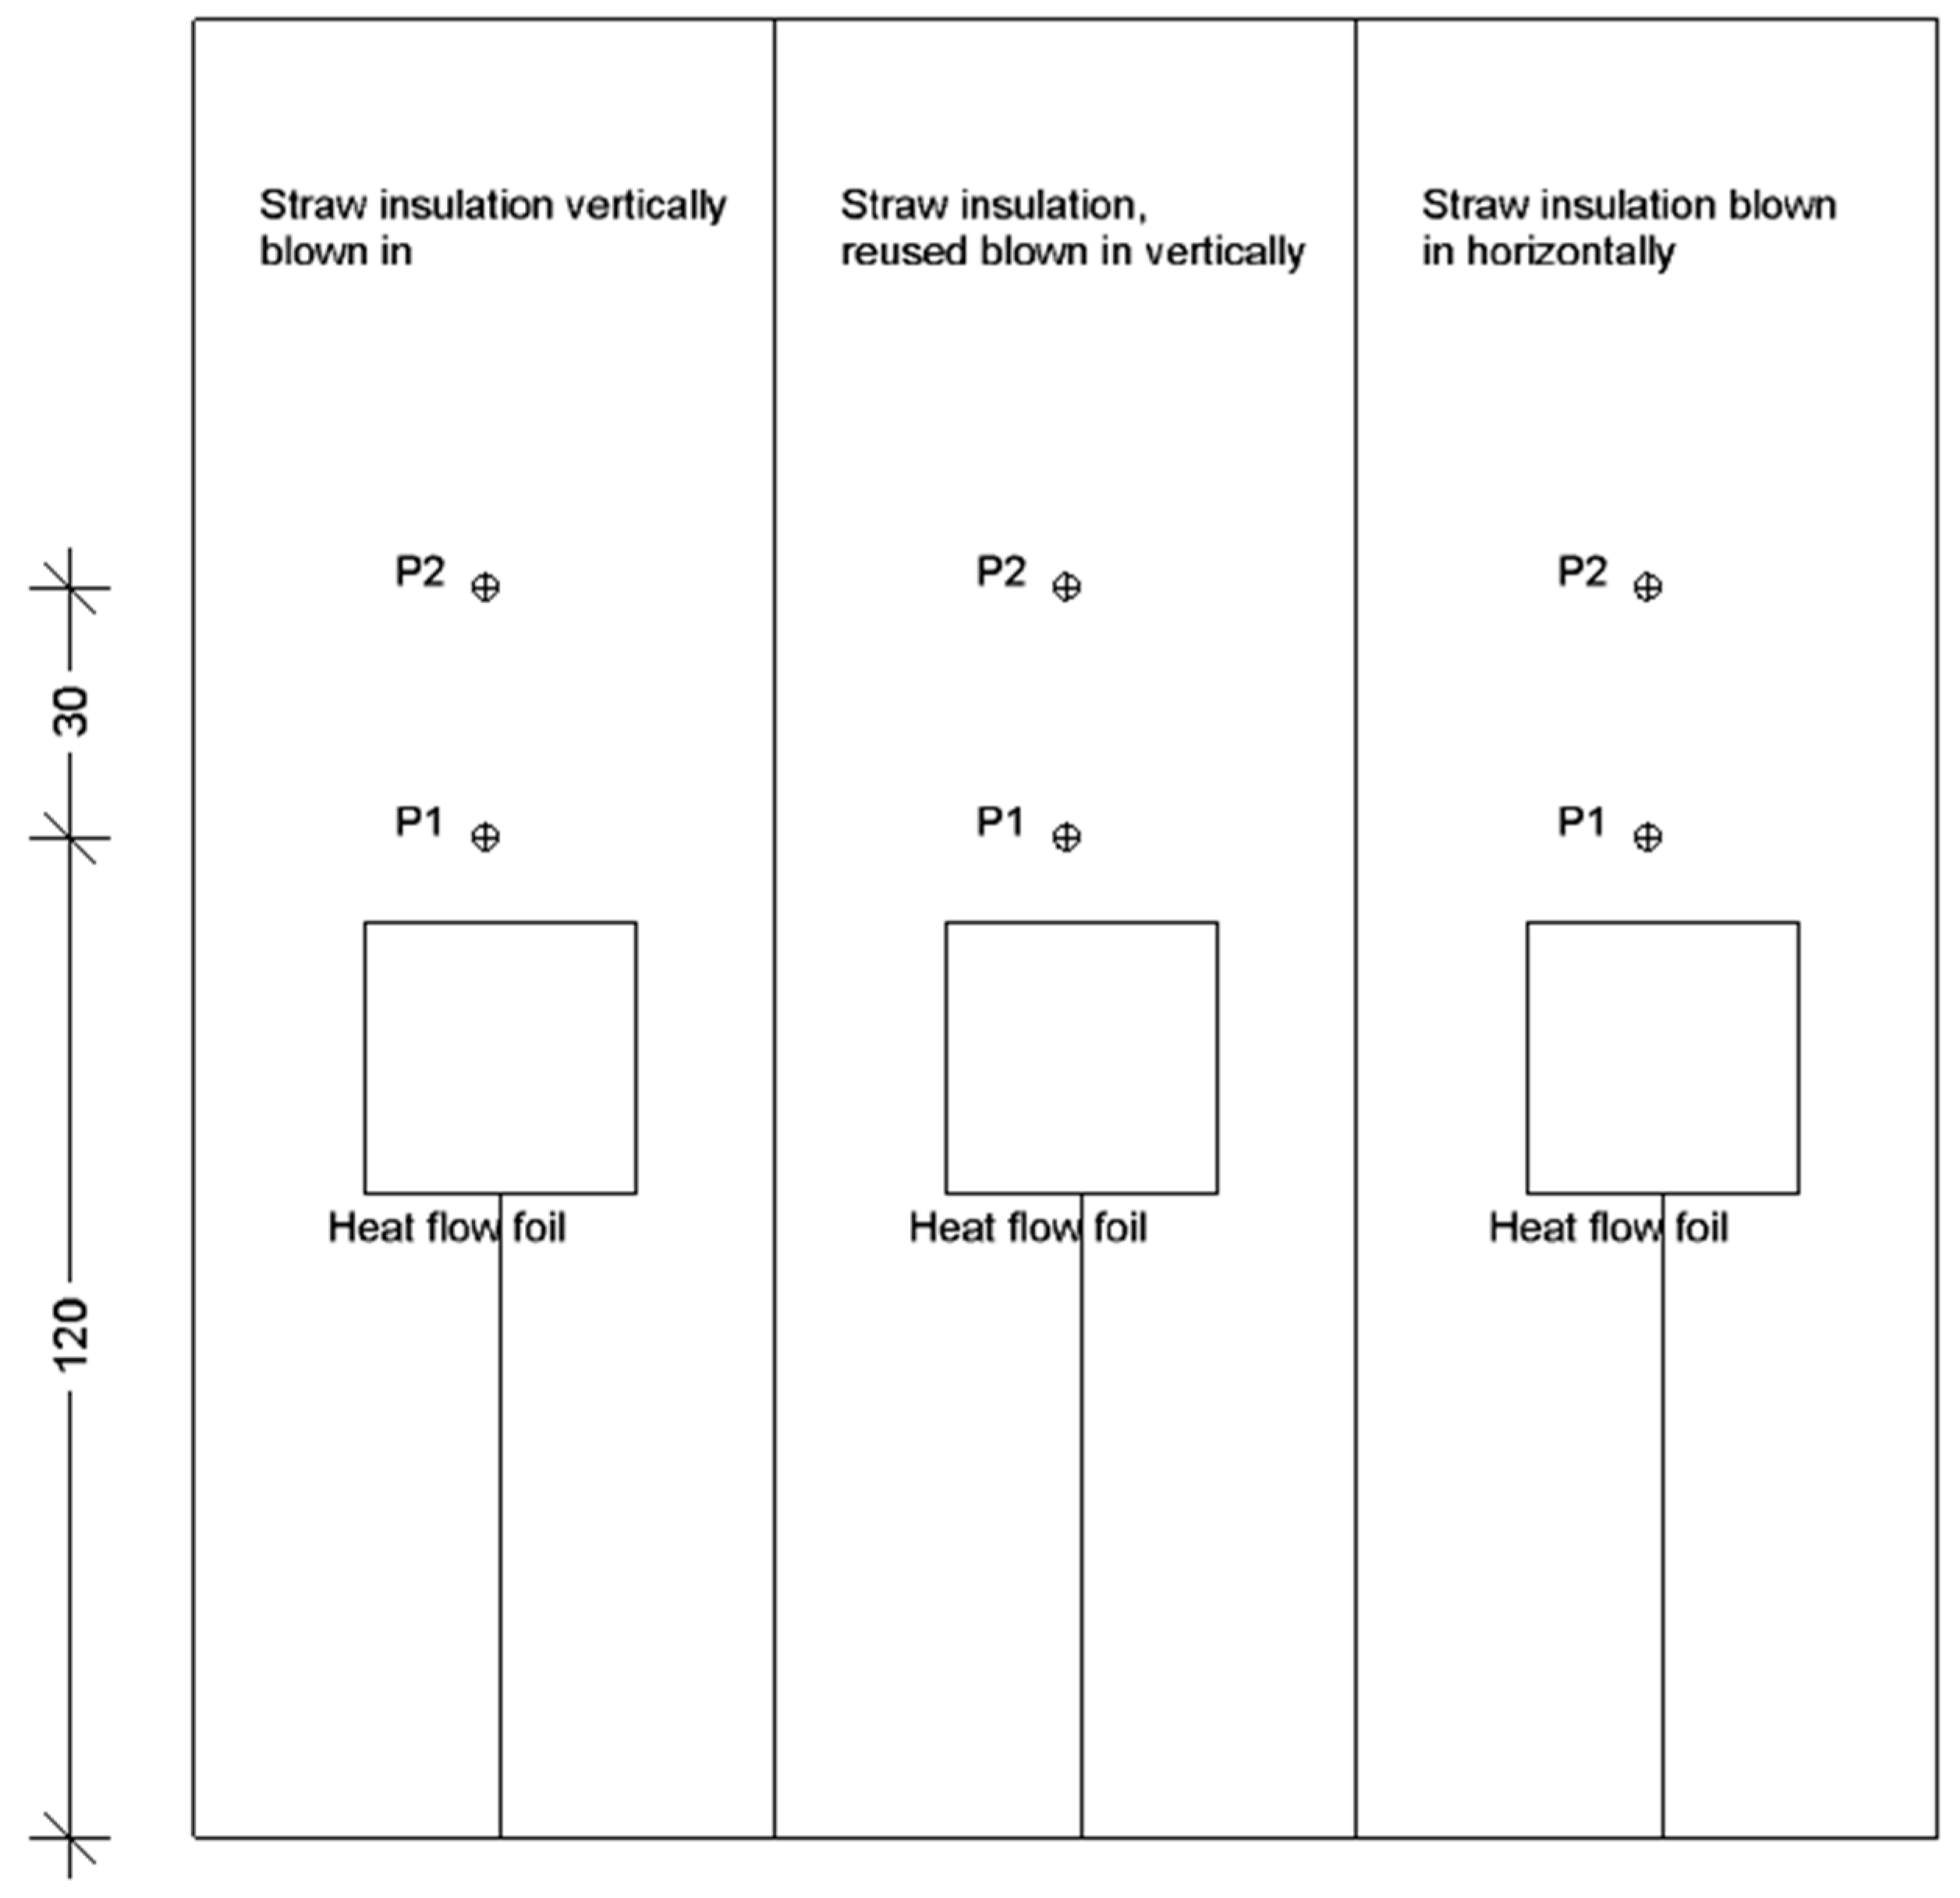
Figure 3 displays the positions of the measuring points, where measurements were performed with the needle probe at two points per compartment, labeled as P1 and P2, respectively. The lower edge of the heat flux plates was situated at a height of 0.4 m from the floor, with the surface temperature sensors positioned in the center of the heat flux plate.
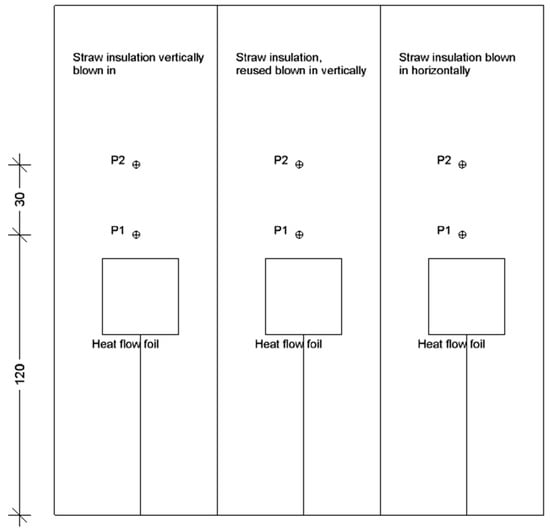
Figure 3.
Position of the measuring points (dimensions displayed in cm).
2.1.2. Determination of the Thermal Insulation Properties by Means of Heat Flow Measurement
The in situ determination of U-values is the subject of ongoing research [21]. In addition to the three ISO 9869-1 criteria [22], a number of other criteria have been added in an attempt to determine a steady state as accurately as possible. The measured data were filtered in an Excel spreadsheet according to these criteria in order to obtain only the data that met these criteria. The filter method using temperatures is based on [23]. Normally, this method is used to measure U-values, but in this case, it is used to calculate thermal conductivity from measured values.
- The temperature difference between indoor air and outdoor air must be greater than 15 K. A high temperature difference is recommended for appropriate results in lightweight constructions [24].
- The surface temperature difference between the inside and outside of the façade must be greater than 15 K.
- The surface temperature difference between the inside and outside of the façade must be greater than 15 K on average over the last 24 h.
- In order to ensure that the thermal conditions were relatively constant [22], the temperature difference between the inside air and the outside air must not have fluctuated more than 2 K in the last 24 h.
- To meet the requirement of [22], that solar radiation has no effect on the measurements, the surface temperatures of the interior and exterior façade surfaces must not have fluctuated by more than 2 K in the last 24 h.
- The calculated R-value must not differ by more than ±5% from that of the previous 24 h (thermal resistance) [22].
The thermal conductivity of the straw insulation layer was determined from the data to enable a direct comparison of values without the influence of the other layers.
Equation (1) is taken from ISO 9869-1 and is part of the Average Method for the in situ measurement of thermal resistance and thermal transmittance [22]. First, the thermal conductance Λ, expressed in the unit W/(m2·K), of the entire wall structure was calculated:
The symbol q represents the heat flux (in W/m2). represents the interior surface temperature of the building element and shows the exterior surface temperature, both in degrees Celsius. Fourier’s Law states that the rate of heat transfer (q ) through a material is directly proportional to the temperature difference across the material (Δ ) and inversely proportional to the thermal resistance () of the material [25].
Next, the thermal resistance (-value) in m2·K/W of the entire wall structure l was calculated using:
This value is derived from the reciprocal of the thermal conductance () calculated in Equation (1). It serves as a critical metric for assessing the overall insulating capacity of the wall assembly.
To calculate the overall thermal conductivity , (thickness of the wall in meters) was divided by :
This equation illustrates how quickly heat is conducted through the wall assembly, considering both its thermal resistance (-value) and thickness.
Now that the thermal conductivity of the entire structure is known, the thermal conductivities of the OSB board and DHF board were proportionally subtracted from -total to obtain :
2.1.3. Needle Probe Measurement of Thermal Conductivity
A needle probe is a thermal measuring device used to determine the thermal conductivity of a material and is similar to the transient hot-wire method. It consists of a heat-resistant wire whose tip is inserted into the sample. A temperature difference is created between the needle probe and the sample by heating the wire. The temperature changes are continuously recorded throughout the process and are incorporated into the calculation of thermal conductivity. It is particularly suitable for loose-fill insulation materials.
In this investigation, small holes were drilled from the inside to measure the thermal conductivity within the insulation layer. Material inhomogeneity, incorrect calibration, and environmental factors such as pressure and humidity can introduce sources of error into the results. To minimize these errors, measurements were taken at two positions, respectively, and at different timings. The measurements were taken over a four-month period at approximately one-month intervals.
2.1.4. Sampling and Examination in the Laboratory
The following measurements were made in the laboratory to determine the differences between the measurements on real exterior walls and the laboratory measurements.
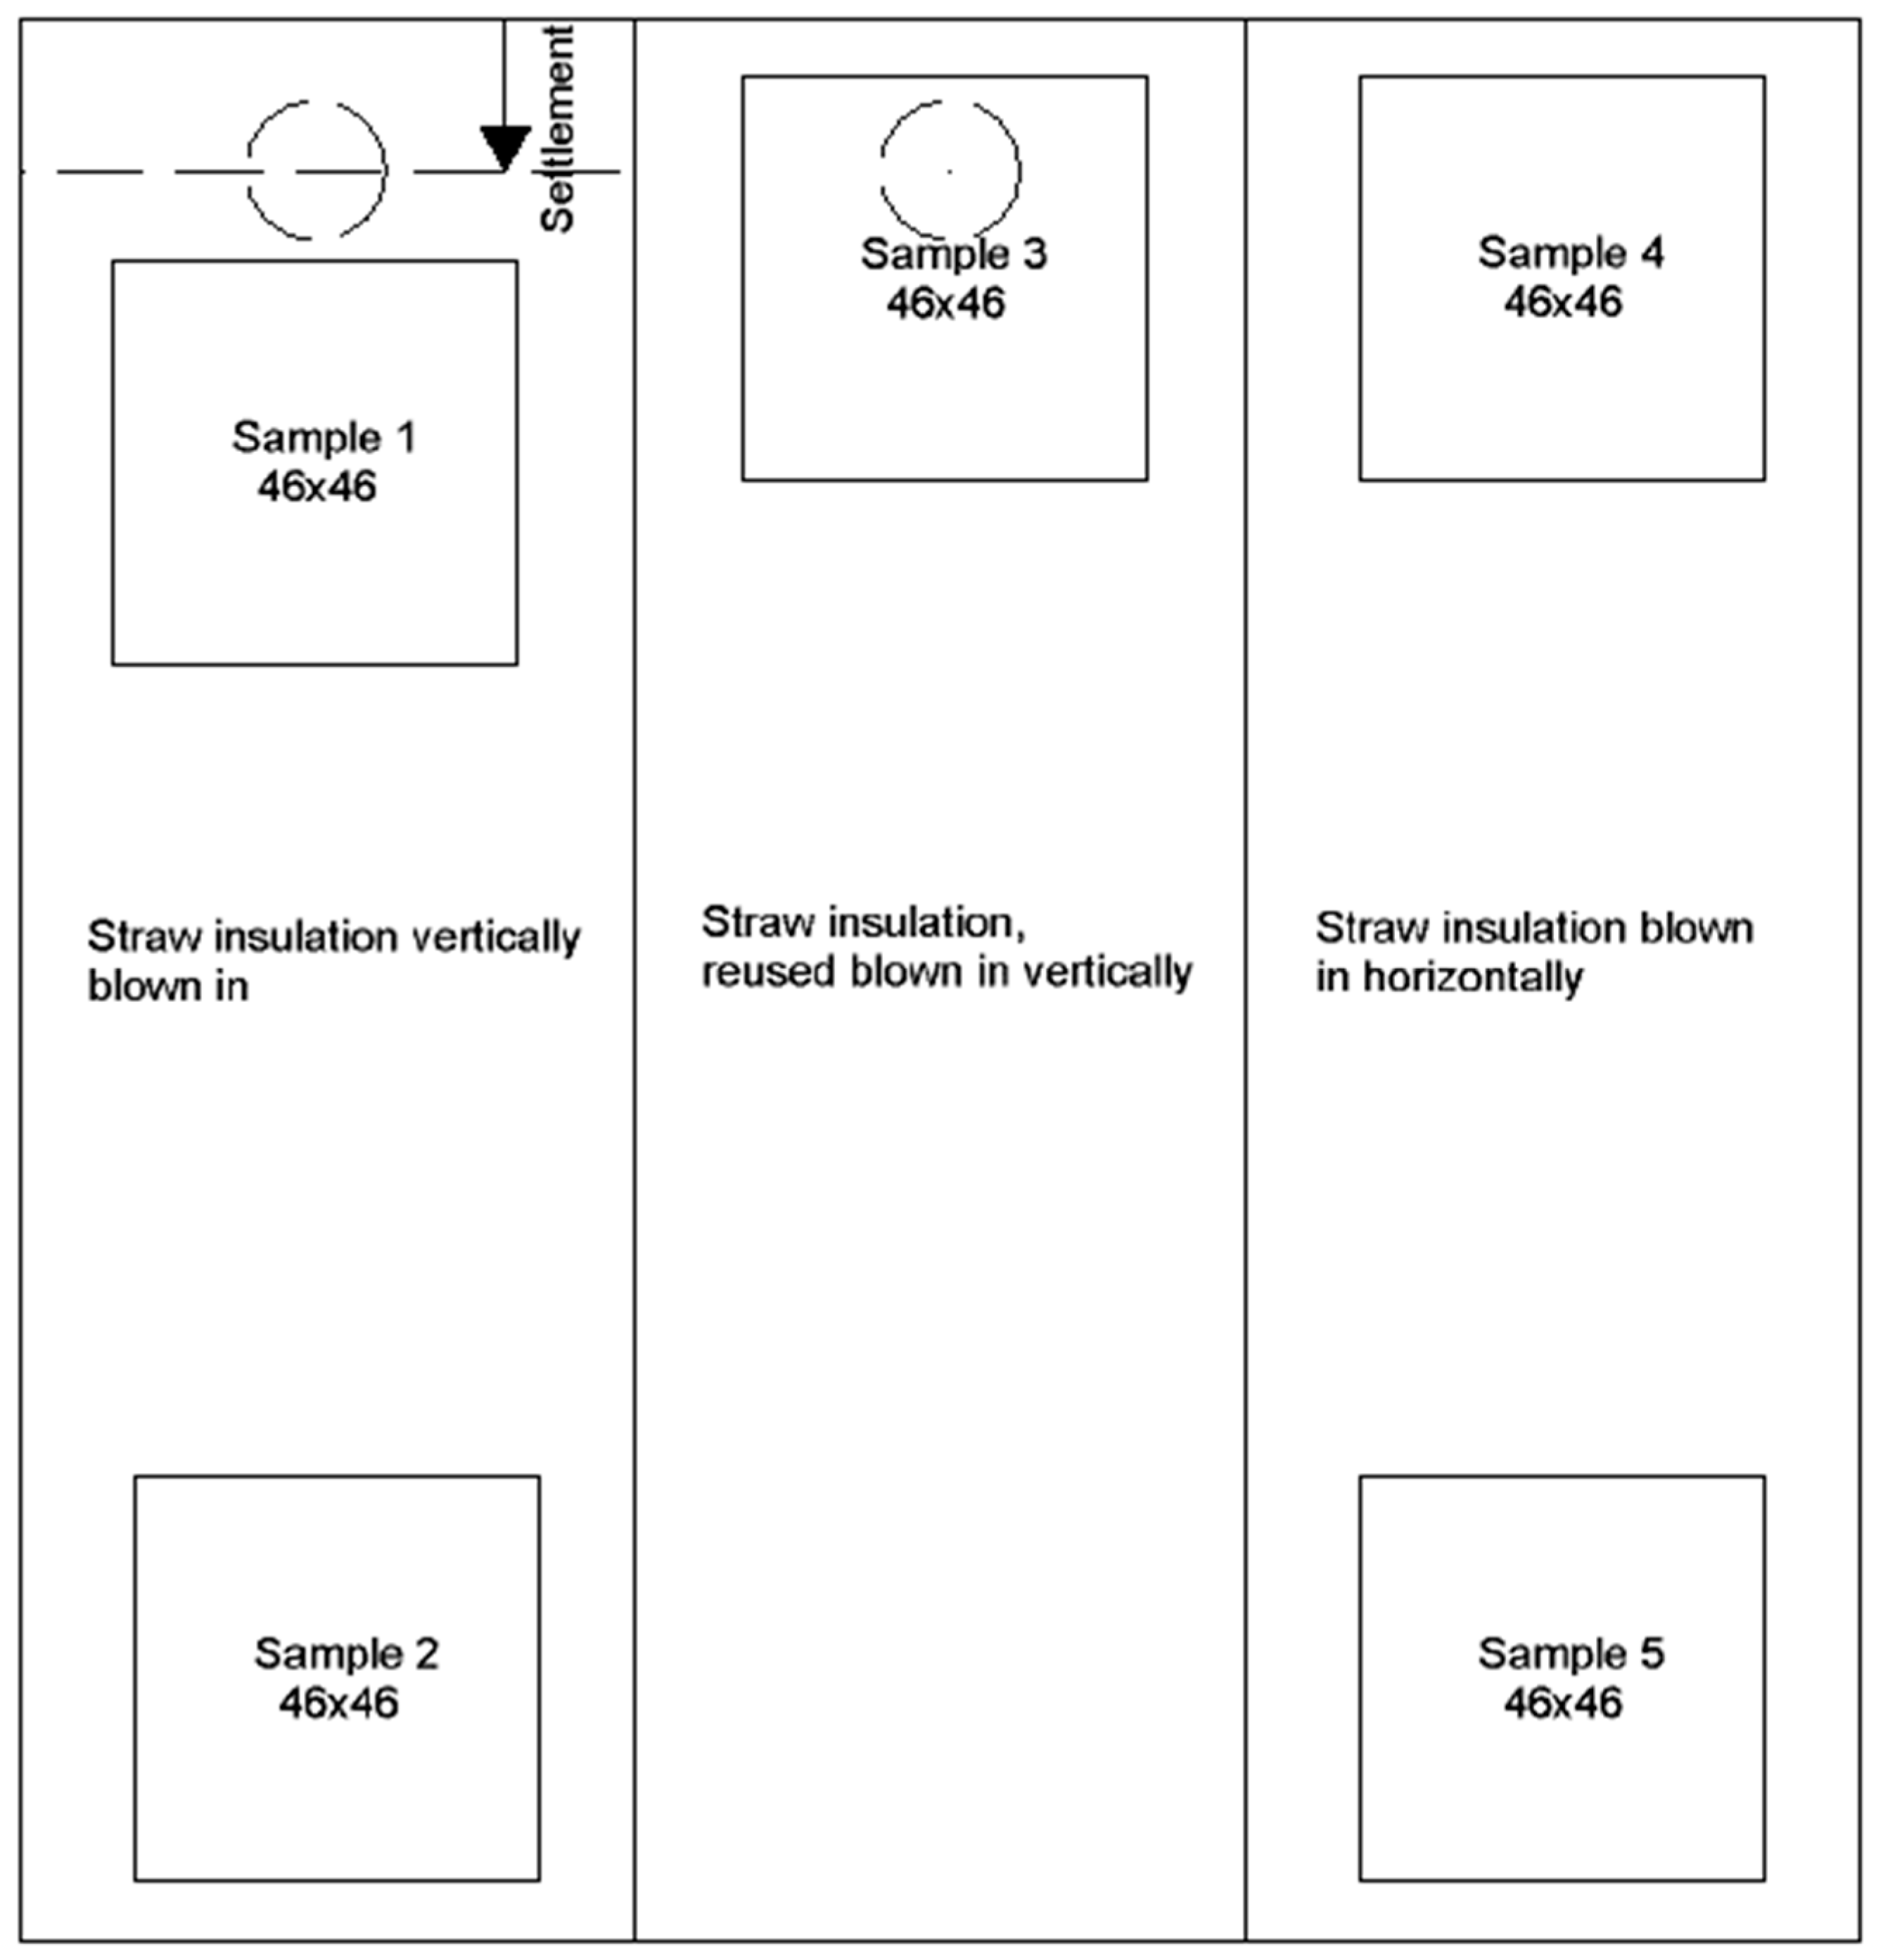
The samples were directly taken from the test wall using special sheet metal frames (Figure 4), accurately reflecting the actual insulation situation. The location of each sampling point is shown in Figure 5. The sampling procedure was specified by the OIB (Austrian Institute for Building Technology).
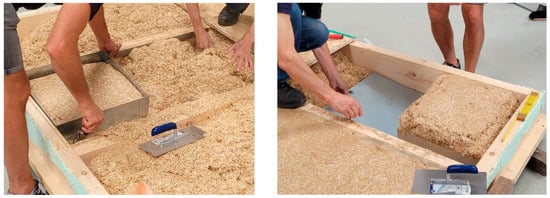
Figure 4.
Sampling by means of sheet metal frame.
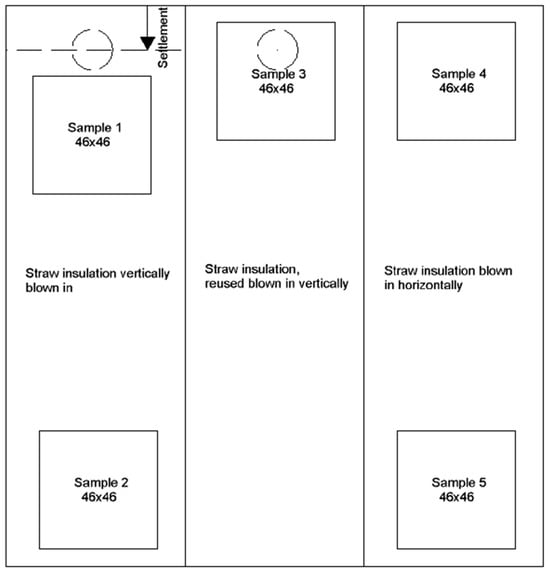
Figure 5.
Position and dimension of the samples taken.
A total of five specimens with the dimensions of 460 × 460 × 100 mm were examined. As the primary focus of this study is on the difference between conventionally blown straw and straw blown into a horizontal wall element, only one sample was taken from the reused straw, while two samples were taken from each of the others. To obtain a comprehensive range of measurement results and capture the greatest variation in layer density, one sample was taken from the top and another from the bottom.
For preparation, the specimens were dried at 65 °C until reaching constant weight. The thermal conductivity was measured using a single-plate device measuring 500 × 500 mm, following the EN 1946-2 [26] standards (Guarded Hot-Plate).
2.2. Investigation of the Hygrothermal Influence of a Flame Retardant
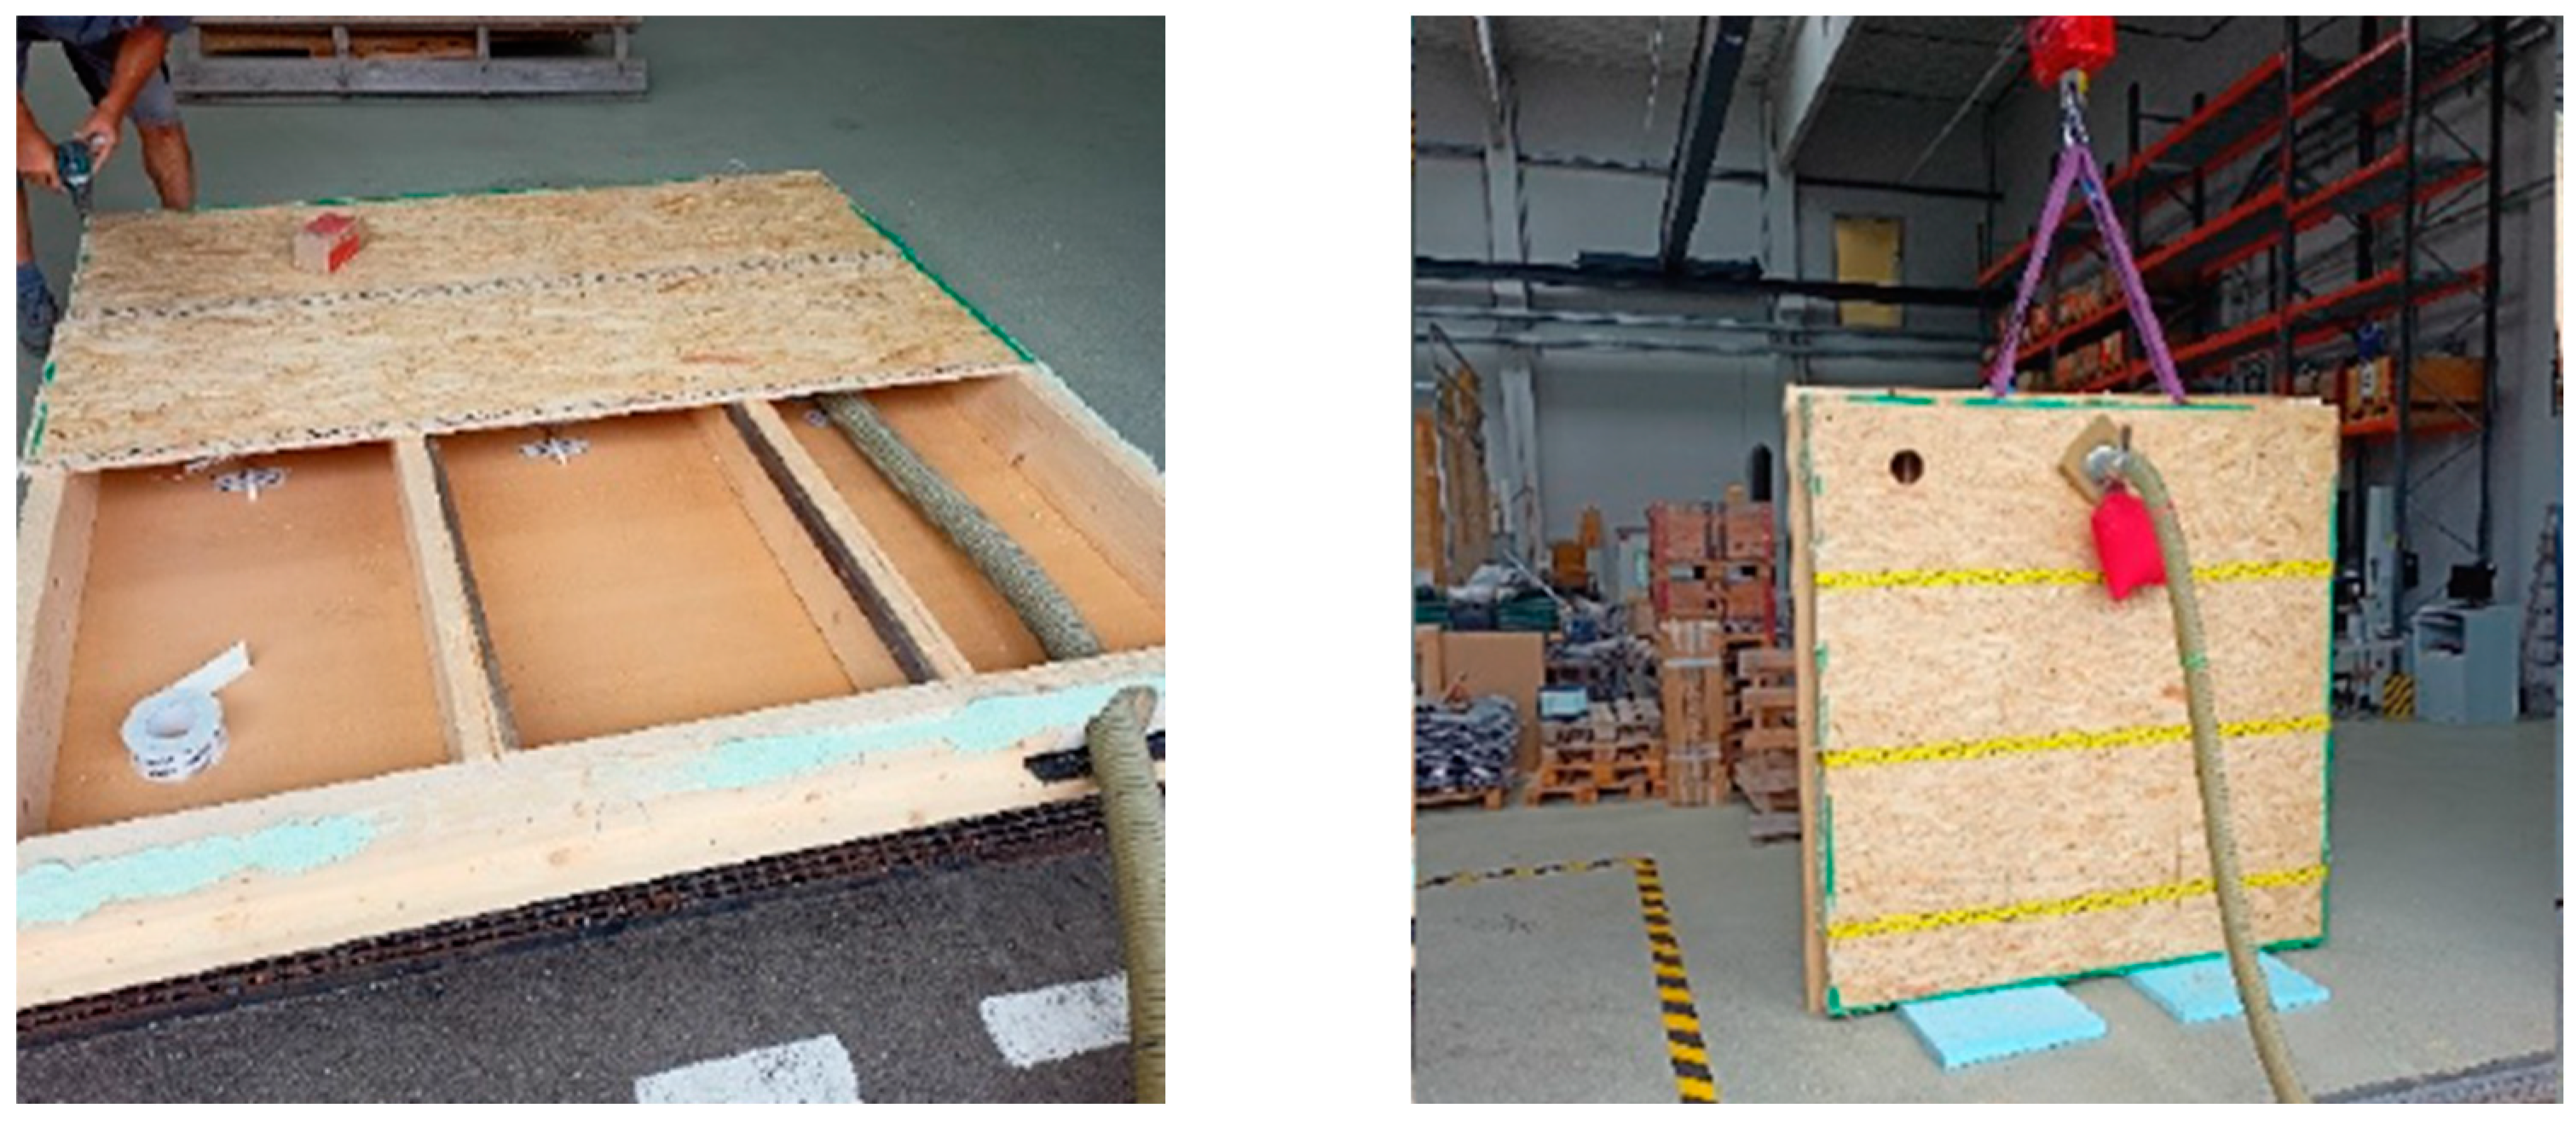
The in situ measurements were conducted on the same wall element used in the initial investigation, this time filled with blow-in straw treated with the flame retardant MK46—an aqueous solution containing various acidic organic and inorganic compounds or salts. The flame retardant was added in an “Eirich Intensive Mixer” equipped with a battery-powered spray pump. The functionality of the mixture was tested as part of a research project called “Urban Straw” [27]. To investigate the variation in hygrothermal properties resulting from the treated straw, both horizontal and vertical wall elements were used for the blowing process. One compartment was filled with straw in a horizontal position, while the two remaining compartments were filled in a vertical position. Figure 6 shows the exterior wall elements before blowing in the flame-retardant-treated straw, in both horizontal and vertical positions.
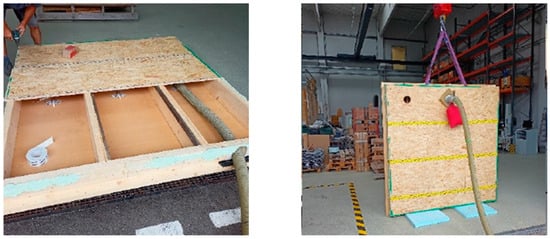
Figure 6.
Horizontal position before blowing in (left) and vertical position before blowing in (right).
Sensors were installed to determine the thermal conductivity and were compared to those used with untreated straw. Additionally, moisture behavior was observed by placing relative humidity sensors in the insulation layer.
To prevent potential structural damage caused by condensation, a simulation was conducted using the Archiphysik software. The simplified verification procedure following the ÖNORM B 8110-2:2020-01-01 was applied.
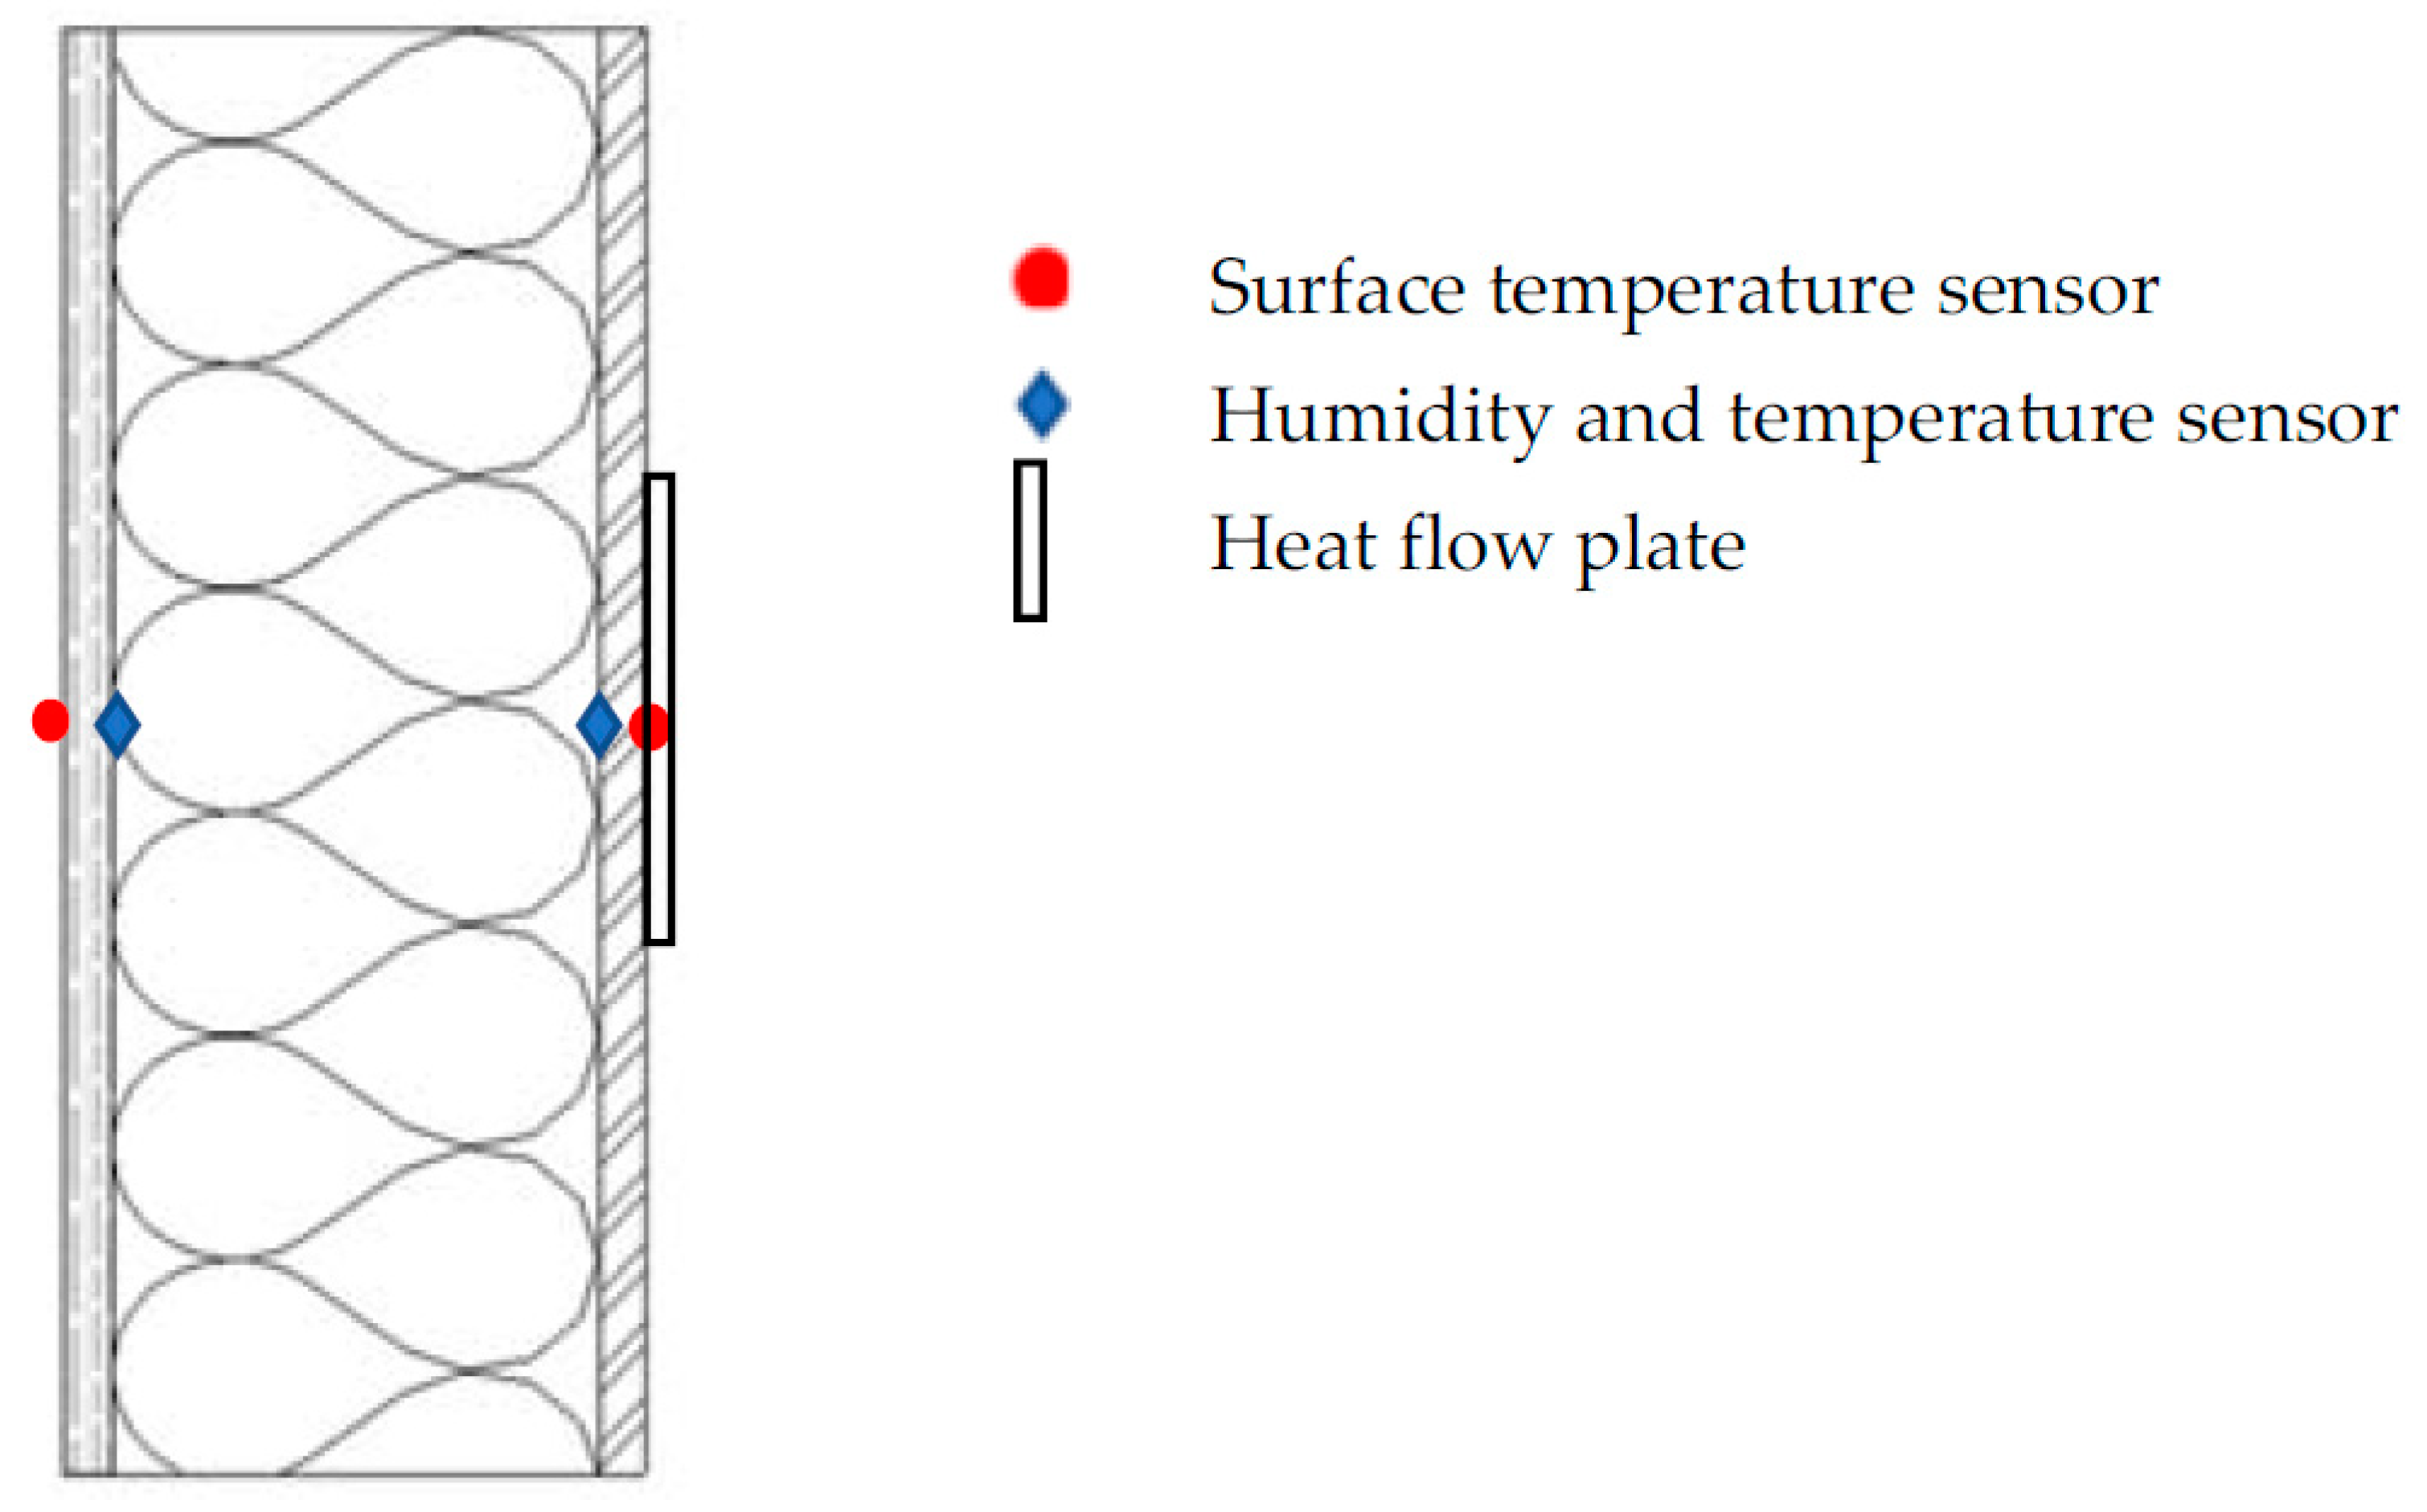
During the in situ measurements, two temperature and two humidity sensors were installed at the boundary layers inside each compartment of the component. For temperature and humidity measurements, Retronic HC2A-S3 sensors were used, which have a measurement accuracy of ±0.8% for the relative humidity and ±0.1 K for the temperature. The sensors are protected by a probe housing and measure the relative air humidity of their location. Additionally, two temperature sensors were placed on the inner and outer surface, and a heat flow foil was applied on the inner surface of the component. The positions of the sensors are illustrated in Figure 7. The same measurement technology as in the initial investigations was used, and the indoor conditions were set up in a similar manner. Furthermore, a temperature and humidity sensor from Retronic was integrated into the component.
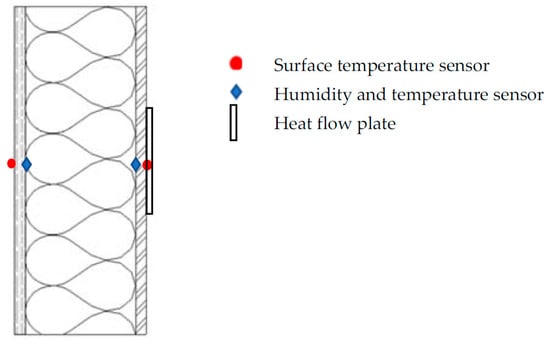
Figure 7.
Arrangement of the sensors.
3. Results and Discussion
3.1. Impact of Different Blowing Techniques on the Thermal Conductivity of Untreated Chopped Straw
Measurements were taken over the course of a full year, from summer 2021 to summer 2022, covering an entire winter period. During the cold season, the thermal insulation properties are particularly relevant, as they provide the temperature difference necessary to calculate the insulation properties.
3.1.1. Results of the Heat Flow Measurement
Table 1 presents the mean value of the determined thermal conductivity by means of the heat flow measurements.

Table 1.
Mean values of the thermal conductivity of chopped straw (heat flow measurement).
The result of the mean value of the vertical blown-in specimen is 0.0408 and of the horizontal blown-in specimen is 0.0401 W/mK. The differences between the values are very small. The mean value differs by only 1.6%. The measurement inaccuracies of the measuring instruments provided by the manufacturer are partly dependent on the prevailing temperature and have been calculated, resulting in a combined uncertainty of 8.9%. This implies that the measured values can deviate from the actual values by up to 8.9%. Consequently, no significant difference in thermal conductivity, depending on the blowing technique, can be observed.
The results of the two different blowing techniques are so close that a preference for one method is not justified. If there are advantages in individual cases, the preferred method should be used.
3.1.2. Determination of the Thermal Insulation Properties Using Needle Probe Measurements
The measurement of the thermal conductivity by means of the needle probe yielded the following results, as shown in Table 2.
Table 2.
Thermal conductivity measured with the needle probe at two points for each compartment.
Table 3 shows the statistical values for the thermal conductivity measured with the needle probe. The mean value, the median and the standard deviation as well as their quotient and difference were calculated.
Table 3.
Statistical values of the thermal conductivity measured with the needle probe.
The mean value of the vertical blown-in specimen is 0.0447 W/mK, of the vertical re-used specimen is 0.0471 W/mK and the horizontal blown-in specimen 0.0463 W/mK.
The needle probe measurements in Table 2 also confirm that there is no significant difference between the different blowing techniques.
None of the three variants deviate from each other in mean or median by more than 5%. The measurement accuracy of the needle probe is ±0.001 W/(mK) per measurement, which means that a deviation of 0.002 W/(mK) can occur when comparing two measurement results due to the measuring device. However, the difference in statistical values among all three variants never exceeds 0.002 W/(mK).
As a result, the findings of both measurement methods are consistent with each other. The conclusion that the position of the wall element, whether vertical or horizontal, has no significant influence on the thermal performance of the insulation material is supported by the results of both measurements. Additionally, the reused straw showed similar results in the second measurement.
3.1.3. Results of the Laboratory Experiments
Table 4 contains the values measured in the laboratory for the samples taken from the outdoor test rig, such as thermal conductivity, installation thickness, raw density at 23 °C and 50% relative humidity, and moisture content after measurement. The moisture content was measured gravimetrically in the laboratory. The samples are from the wall element of the first test of the untreated straw with different blowing techniques. The exact positions are shown in Figure 5. The boundary conditions for the conversion to the dry state are from λ10,g to λ10,dry according to ETA-17/0559 from “ISO-Stroh” [28] with the moisture conversion coefficient fu = 0.574 kg/kg and mass-specific moisture content u23,50 = 0.075 kg/kg.
Table 4.
Thermal conductivity of the samples taken in the laboratory with the single-plate instrument.
Table 5 shows that the thermal conductivity of the straw blown in the upright position is 11% higher than that of the straw blown in horizontally. However, it is important to note that the two results for the samples of horizontal straw already differ by 24%, which indicates that this difference cannot solely be attributed to the blowing technique.
Table 5.
Comparison of the average values of thermal conductivity for the different positions, measured with the single-plate instrument.
The assumption that the horizontal position of the outer wall element during the injection results in poorer thermal insulation properties is also not supported by this measurement.
It is known that air has lower thermal conductivity compared to straw, making air pockets within the insulation desirable. Increasing the straw density reduces the presence of air pockets between the straw particles, thereby reducing heat transfer through convection and conduction, which, in turn, enhances the insulating effect of the material. However, if the density is increased excessively, the thermal conductivity also increases as the compressed air in the voids becomes more conductive.
A previous study [16] demonstrated a relationship between density and thermal conductivity, depicted as a curve that initially decreases and then rises again. Up to a density of approximately 65 kg/m3, the insulating properties improve, and beyond that point, the thermal conductivity increases with density. However, these laboratory measurements (Table 4) revealed a different relationship between density and thermal conductivity. In the results shown, samples with higher density, such as positions 3 and 5, exhibited the best insulating performance. It is worth noting that the previous study only measured up to a density of 85 kg/m3, and further research is needed to understand the implications of higher densities, as these findings seem to differ.
3.2. Difference in the Thermal Conductivity Using Different Measurement Methods
The design value of the thermal conductivity is usually obtained by multiplying λ10,dry with the normative factor Fm(23.80). This design value is usually used in energy balances to calculate the U-value. The results of the measured and calculated thermal conductivities of chopped straw are shown in Table 6. It is shown that a general addition of 20% to the λ10,dry does not agree with the values measured in situ.
Table 6.
Comparison of thermal conductivity using different measurement methods.
3.3. Impact of a Flame Retardant on Hygrothermal Properties of Chopped Straw
3.3.1. Comparison of Thermal Conductivity of Horizontal and Vertical Blown-In Straw
The following table shows the thermal conductivities of untreated straw and straw treated with a flame retardant (Table 7). As in the first test, this was determined by means of heat flow measurement (U-value).
Table 7.
Mean values of the thermal conductivity of the untreated straw and treated straw (heat flow measurement).
In Table 7, the quotients of lying to standing show that the differences in the mean value (1.7% and 3%) are relatively small.
The measurement inaccuracy of the measuring devices here is 9.6%; thus, no significant difference between lying and standing blown-in straw in terms of its thermal properties can be determined from the measurements.
Table 8 compares the differences in the thermal conductivity of the untreated and the treated straw. The thermal conductivity is higher for the treated straw in both the upright and lying positions. The mean value of the vertical element is higher by 1% and the mean value of the horizontal element is higher by 6%. It is important to note that the measurements were conducted during two different winter periods, leading to varying temperatures and humidity levels. Additionally, the sum of the measurement inaccuracies of both measurements is 18.5%. Therefore, the measurement results do not show a clear difference, and the small deviation can be attributed to the measurement inaccuracy and external influences. The investigation revealed no evidence that the flame retardant leads to a measurably higher thermal conductivity due to an increased salt concentration.
Table 8.
Comparison of the differences between the mean values of the thermal conductivity of the treated and untreated chopped straw insulation (heat flow measurement).
3.3.2. Long-Term Hygrothermal Behavior of Straw Constructions with Flame Retardants
Considering the fact that flame retardants can influence the hygroscopic properties of the treated straw, the present study aimed to examine whether this leads to moisture-related issues.
Both sensors are located within the insulation layer, with one adjacent to the outer planking and the other adjacent to the inner planking.
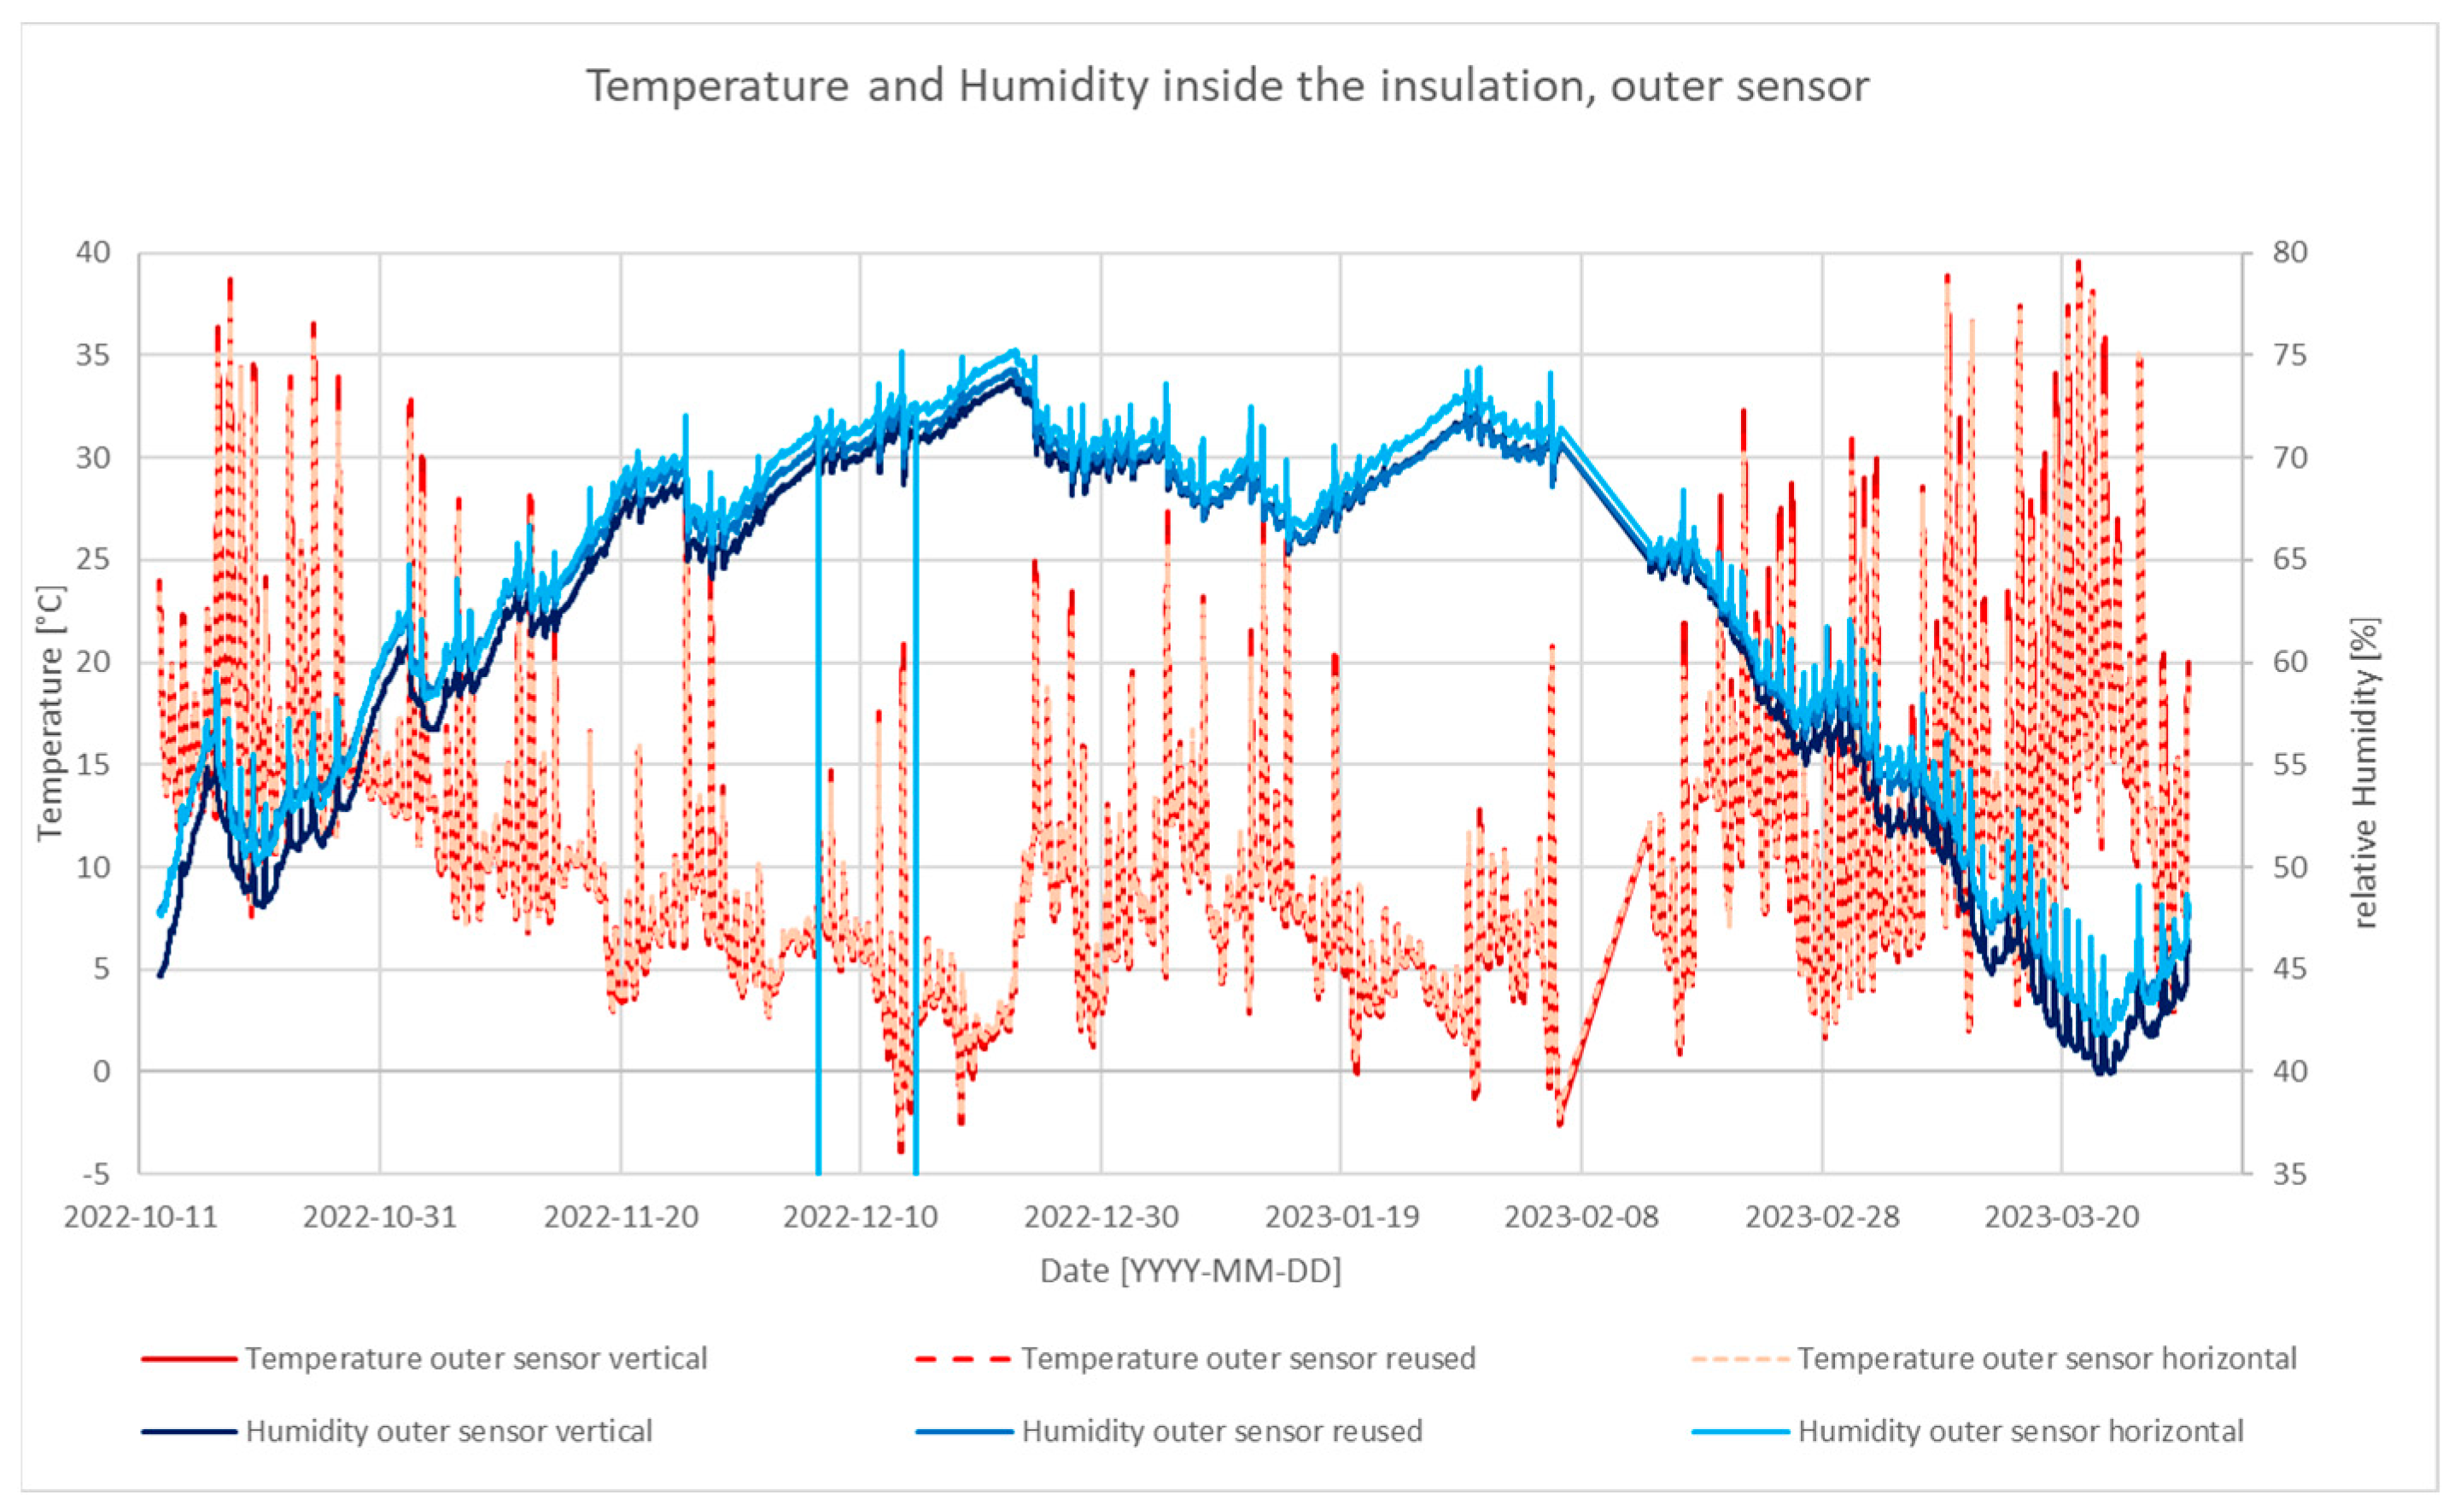
The temperature and humidity curves of the two sensors for each compartment of the wall element are presented in the following diagrams. The inner sensor (Figure 8) never reaches a relative humidity value above 55% in all three compartments, while the outer sensor (Figure 9) consistently exceeds 70%.
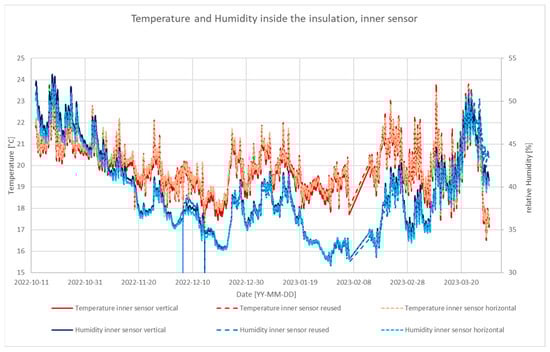
Figure 8.
Temperature and relative humidity inside the insulation, inner sensor, one winter period.
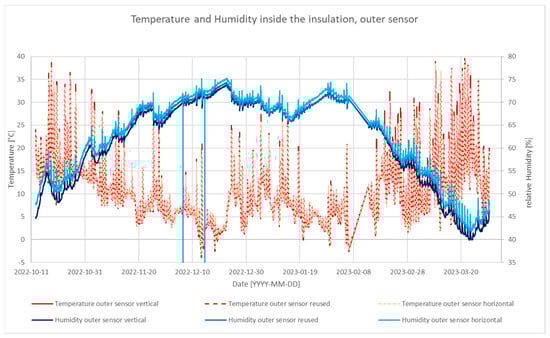
Figure 9.
Temperature and relative humidity inside the insulation, outer sensor, one winter period.
A relative humidity of 70% over an extended period is considered a critical value for mold growth in building materials [29,30]. Natural insulation materials made from organic substances, such as lignocellulosic materials, carry a higher risk of pest infestation compared to inorganic or synthetic insulation materials. Nevertheless, using bio-based insulation materials from an ecological perspective is desirable. However, it is crucial to ensure that the chosen material does not pose an increased risk of mold infestation. In some cases, a fungicidal treatment of the material may be necessary to prevent this.
Despite the higher risk of infestation with organic insulation materials, they possess the advantage of being able to temporarily absorb and buffer high moisture levels [26].
According to research conducted by the Fraunhofer Institute for Building Physics, the three primary growth criteria for fungi are substrate, humidity, and temperature over a specific period. They present these criteria in relation to each other using an isopleth system. The critical condition arises when the temperature remains continuously above 20 °C with humidity exceeding 70% for an extended period (several days). However, in our case, the critical condition is only reached for a few hours, indicating that the structure is functional in terms of mold growth.
As 100% relative humidity is never reached, it is assumed that no condensation occurs in the entire component. To verify this, an additional simulation was conducted using the Archiphysik program. The structure was simulated in the program with the same component layers and material parameters as built in the test rig. These data were obtained from the manufacturers, and the measured thermal conductivity was used for the insulation layer.
First, the measured and simulated U-values were compared to check whether the simulation model corresponds to the real structure. Then, according to ÖNORM B 8110-2:2020-01-01, the simplified verification procedure was conducted to ensure the prevention of damage-causing amounts of condensate inside the building component. The calculations show that there is no condensate formation, meaning that the verification is fulfilled.
4. Conclusions
All of the tests carried out have consistently shown that there is no deterioration in the thermal insulation properties of the blow-in technology in horizontally positioned wall elements compared with conventional blow-in technology in vertically positioned wall elements. Horizontal blowing can lead to a simplification of the working process, and, thus, to greater efficiency on the construction site or in prefabrication.
This observation could be due to the hypothesis that the fibers exhibit fluid-like behavior when blown in the air and the general flow behavior is very turbulent. There was also no apparent difference in the orientation of the fibers when the module was opened.
Further investigations would be interesting here; for example, two wall elements could be built with a glass front and filmed during the blow-in and analyzed afterwards.
Although it was expected that re-blowing would cause the straw chaff to have a finer microstructure, resulting in higher thermal conductivity, i.e., poorer insulating properties, the needle probe measurement for the re-blown straw showed similar thermal conductivity to the new straw. In the case of the heat flow measurement, it was not possible to obtain comparable values due to the middle position. Here, further investigations with other measurement methods would be interesting to support the hypothesis that it has similar insulating properties as the unused straw.
Both blow-in technologies lead to better results than the data sheet indicates. In ETA-18/0305 [18], the design value of thermal conductivity for blow-in straw is given as λ = 0.058 (W/m*K), while the results of this study show better values by about 0.01 (W/m*K). This may be due to the fact that the general moisture allowance of 20% is not justified. Further research in this area is highly relevant for all bio-based insulation materials.
The correlation of density and thermal conductivity shows different results in our case in comparison to those in the compared study [16]. However, the measurements of the study only went up to 85 kg/m3. Since there are not yet many studies on chopped straw, further in situ and laboratory tests would be interesting to analyze this relationship more precisely.
The recommendations for further research include more in situ and laboratory measurements of chopped straw in general, as well as detailed investigations of the different hygrothermal behavior of biobased insulation materials. This could lead to more widespread use of these energy-efficient, low-emission building materials.
Author Contributions
Conceptualization, T.S. and H.F.; methodology, T.S.; validation, T.S.; writing—original draft preparation, T.S.; writing—review and editing, H.F.; visualization, T.S.; supervision, A.K.; project administration, A.K. All authors have read and agreed to the published version of the manuscript.
Funding
This research was part of the natuREbuilt project and was funded by the Austrian Research Promotion Agency (FFG) under the COIN funding program. FFG grant number 881230. The APC was funded by Open Access Funding by TU Wien.
Data Availability Statement
Data will be made available on request.
Acknowledgments
We would like to express our gratitude to the DPM Group and the manufacturers ISO-Stroh for their partnership and contribution to this research project. The authors acknowledge TU Wien Bibliothek for financial support through its Open Access Funding Programme.
Conflicts of Interest
The authors declare no conflict of interest.
References
- Linh, D.; Salomone, R.; Nguyen, Q.T. Circular bio-based building materials: A literature review of case studies and sustainability assessment methods. Build. Environ. 2023, 244, 110774. [Google Scholar]
- Cintura, E.; Nunes, L.; Esteves, B.; Faria, P. Agro-industrial wastes as building insulation materials: A review and challenges for Euro-Mediterranean countries. Ind. Crops Prod. 2021, 171, 113833. [Google Scholar] [CrossRef]
- Paiva, A.; Pereira, S.; Sá, A.; Cruz, D.; Varum, H.; Pinto, J. A contribution to the thermal insulation performance characterization of corn cob particleboards. Energy Build. 2012, 45, 274–279. [Google Scholar] [CrossRef]
- Liu, L.; Zou, S.; Li, H.; Deng, L.; Bai, C.; Zhao, X.; Wang, S.; Li, N. Experimental physical properties of an eco-friendly bio-insulation material based on wheat straw for buildings. Energy Build. 2019, 201, 19–36. [Google Scholar] [CrossRef]
- Labat, M.; Magniont, C.; Oudhof, N.; Aubert, J.E. From the experimental characterization of the hygrothermal properties of straw-clay mixtures to the numerical assessment of their buffering potential. Build. Environ. 2016, 97, 69–81. [Google Scholar] [CrossRef]
- Ali, M.; Alabdulkarem, A.; Nuhait, A.; Al-Salem, K.; Almuzaiqer, R.; Bayaquob, O.; Salah, H.; Alsaggaf, A.; Algafri, Z. Thermal Analyses of Loose Agave, Wheat Straw Fibers and Agave/Wheat Straw as New Hybrid Thermal Insulating Materials for Buildings. J. Nat. Fibers 2021, 18, 2173–2188. [Google Scholar] [CrossRef]
- Ali, M.; Alabdulkarem, A.; Nuhait, A.; Al-Salem, K.; Iannace, G.; Almuzaiqer, R. Characteristics of Agro Waste Fibers as New Thermal Insulation and Sound Absorbing Materials: Hybrid of Date Palm Tree Leaves and Wheat Straw Fibers. J. Nat. Fibers 2022, 19, 6576–6594. [Google Scholar] [CrossRef]
- Cascone, S.; Rapisarda, R.; Cascone, D. Physical properties of straw bales as a construction material: A review. Sustainability 2019, 11, 3388. [Google Scholar] [CrossRef]
- Sun, C.; Gu, J.; Dong, Q.; Qu, D.; Chang, W.; Yin, X. Developments in the Built Environment Are straw bales better insulation materials for constructions? A review. Dev. Built Environ. 2023, 15, 100209. [Google Scholar] [CrossRef]
- Zhou, Y.; Trabelsi, A.; El Mankibi, M. A review on the properties of straw insulation for buildings. Constr. Build. Mater. 2022, 330, 127215. [Google Scholar] [CrossRef]
- Brambilla, A.; Sangiorgio, A. Moisture buffering of building materials. Moisture Build. 2021, 99–128. [Google Scholar] [CrossRef]
- Kreiger, B.K.; Srubar, W.V. Moisture buffering in buildings: A review of experimental and numerical methods. Energy and Buildings 2019, 202, 109394. [Google Scholar] [CrossRef]
- Koh, C.H.; Kraniotis, D. A review of material properties and performance of straw bale as building material. Constr. Build. Mater. 2020, 259, 120385. [Google Scholar] [CrossRef]
- Marktanteil von Dämmstoffen aus Nachwachsenden Rohstoffen Steigt. Umfrage zum Einsatz Biobasierter Baustoffe. 2021. Available online: https://www.bba-online.de/news/marktanteil-von-daemmstoffen-aus-nachwachsenden-rohstoffen-waechst/ (accessed on 10 April 2023).
- Sabapathy, K.A.; Gedupudi, S. Straw bale based constructions: Measurement of effective thermal transport properties. Constr. Build. Mater. 2019, 198, 182–194. [Google Scholar] [CrossRef]
- Vėjelienė, J. Processed Straw as Effective Thermal Insulation for Building Envelope Constructions. Eng. Struct. Technol. 2012, 4, 96–103. [Google Scholar] [CrossRef]
- Deutsches Institut für Bautechnik. Europäische Technische Bewertung ETA-17/0559; Deutsches Institut für Bautechnik: Berlin, Germany, 2011. [Google Scholar]
- ÖNORM B6015-2; Bestimmung der Wärmeleitfähigkeit mit dem Plattengerät Teil 2: Ermittlung des Nennwertes und des Bemessungswertes der Wärmeleitfähigkeit für Homogene Baustoffe. Austrian Standards Institute: Wien, Austria, 2009.
- Zirkelbach, D.; Tieben, J.; Tanaka, E.; Pfabigan, N.; Andresen, N.; Bachinger, J.; Nusser, B. ThermNat—Building Components with Insulation from Sustainable Raw Materials: Focus (Hygro-)Thermal Conditions; ThermNat: Holzkirchen, Germany; Wien, Austria; Dresden, Germany, 2023. [Google Scholar]
- ÖNORM EN 15101-1; Thermal Insulation Products for Buildings—In-Situ Formed Loose Fill Cellulose (LFCI) Products—Part 1: Specification for the Products before Installation. Austrian Standards Institute: Wien, Austria, 2019.
- Anders, S.; Iravani, A.; Hoffmann, C.; Geissler, A.; Voss, K. In-Situ U-Wert-Messung—Teil 1: Vergleich von Verfahren und Einflüsse in Heizkammerversuchen. Bauphysik 2023, 45, 1–10. [Google Scholar] [CrossRef]
- ISO 9869-1; Thermal insulation—Building elements—In-Situ Measurement of Thermal Resistance and Thermal Transmittance—Part 1: Heat Flow Meter Method. International Organization for Standardization: Geneva, Switzerland, 2014; pp. 1–11.
- Tudiwer, D. Influences of Living Wall Systems on Thermal Protection, Summery Overheating and Hydrothermal Comfort; Technical University Vienna: Vienna, Austria, 2019. [Google Scholar]
- O’Hegarty, R.; Kinnane, O.; Lennon, D.; Colclough, S. In-Situ U-value monitoring of highly insulated building envelopes: Review and experimental investigation. Energy Build. 2021, 252, 111447. [Google Scholar] [CrossRef]
- Incropera, F.P.; Dewitt, D.P. Fundamentals of Heat and Mass Transfer; John Wiley & Sons: New York, NY, USA, 1998. [Google Scholar]
- EN 1946-2; Thermal Performance of Building Products and Components—Specific Criteria for the Assessment of Laboratories Measuring Heat Transfer Properties—Part 2: Measurements by the Guarded Hot Plate Method. European Committee for Standardization: Brussels, Belgium, 1999.
- Schubert, P.; Korjenic, A.; Fischer, H.; Kirchengast, I. URBAN STRAW—Brandschutztechnische Konditionierung von Einblas-Stroh zur Gebäudedämmung der Urbanen Gebäudeklassen 4 und 5; STADT der Zukunft: Wien, Austria, 2023. [Google Scholar]
- Teil, A.; Bewertungsstelle, T.; Bauprodukts, H. Europäische Technische Bewertung ETA-17/0559; Deutsches Institut für Bautechnik: Berlin, Germany, 2011; No. 305. [Google Scholar]
- Grimm, R. Schimmel im Gebäude: Was Wächst da Eigentlich? 2018. Available online: https://www.baustoffwissen.de/baustoffe/baustoffknowhow/forschung_technik_trends/was-ist-schimmel-mikroorganismen-naehrstoffe-baustoffe-umweltbundesamt-pilze-bakterien-milben/ (accessed on 18 May 2023).
- Jan Küver, R.M.; Peterschewski, J. Untersuchungen zum Verhalten von Konventionellen und Ökologischen Dämmstoffen Gegenüber Mikrobiellem Befall unter Verschiedenen Klimatischen Bedingungen und Bewertung der Mikrobiellen Kontamination für die Wohnhygiene und Effizienz der Energieeinsparung; Fraunhofer IRB: Stuttgart, Germany, 2004. [Google Scholar]


Disclaimer/Publisher’s Note: The statements, opinions and data contained in all publications are solely those of the individual author(s) and contributor(s) and not of MDPI and/or the editor(s). MDPI and/or the editor(s) disclaim responsibility for any injury to people or property resulting from any ideas, methods, instructions or products referred to in the content. |
© 2023 by the authors. Licensee MDPI, Basel, Switzerland. This article is an open access article distributed under the terms and conditions of the Creative Commons Attribution (CC BY) license (https://creativecommons.org/licenses/by/4.0/).