Abstract
Ensuring good indoor air quality in the spaces within educational centres is essential for the health and academic performance of students. In this sense, studying the evolution of health pollutants and their relationship with the environmental parameters of indoor humidity and temperature presents a challenge for the design of more efficient and comfortable buildings with a lower risk of virus infection. In this work, the relationship between pollution levels and SARS-CoV-2 virus infections in the academic year 2021/22 is shown, comparing the pollution values measured on-site with the value of the official measuring stations of the Community of Madrid. In addition, the impact of ventilation measures implemented during this period is assessed, aiming to establish guidelines for ensuring a safer and healthier school environment. It was found that during winter months, when there is less outdoor ventilation, pollution levels exceeded the recommended limits, according to reference regulations. This highlights the need for interior conditioning strategies in educational spaces. Thus, this multidimensional approach, considering both airborne pollutants and weather conditions, provides a comprehensive perspective on indoor air quality in school buildings in the central area of a metropolitan city, such as the Community of Madrid.
1. Introduction
Sustainability is nowadays a major concern for the building and civil engineering industries, which have been embracing three major performance assessment criteria: (a) environmental; (b) economic; and (c) social [1]. Regarding buildings’ life-cycle social assessment [2], there are several performance evaluation categories, namely: (i) Accessibility; (ii) Adaptability; (iii) Health and Comfort; (iv) Impacts on the Neighbourhood; (v) Maintenance and Maintainability; and (vi) Safety and Security. Concerning the (iii) Health and Comfort category, Santos et al. [3] assessed the indoor air quality (IAQ) and thermal characteristics of three Portuguese schools for higher education, making use of numerical simulation models, instead of in situ measurements.
In another research work about the same educational buildings, Santos et al. [4] performed a more complete social performance evaluation, where, besides the above-mentioned sub-criteria (thermal characteristics and IAQ), three additional buildings’ characteristics were evaluated, specifically: acoustic, visual comfort and spatial. It was concluded that one of the evaluated school buildings had a much better IAQ, i.e., smaller indoor CO2 concentration above the external environment, due to increased natural ventilation (larger windows’ area) and a consequent higher air renewal rate.
There are several studies showing how poor IAQ in classrooms has a negative impact on student learning [5]. More specifically, it has been corroborated that low IAQ levels decrease school performance [6] and can have harmful effects on the physical and mental health of students, because of prolonged periods of time spent inside school buildings [7,8]. In Spain, many educational centres are outdated and do not have support systems and controlled indoor air renewal, which makes it difficult to establish efficient ventilation and appropriate thermal comfort conditions [9]. For this reason, the development of studies aimed at guaranteeing the well-being of students and improving their academic performance is of vital importance today [10]. In this regard, following the experiences of the SARS-CoV-2 (Severe Acute Respiratory Syndrome Coronavirus 2) pandemic that affected the world in 2020, multiple research projects have been launched that have tried to address this issue from different application perspectives [11].
Firstly, from a practical point of view, Harvard University established a guide that compiled measures to improve ventilation in classrooms and prevent contagion [12]. In the Spanish case, this guide was considered for its application together with the guidelines established by the Ministry of Health to minimise infections in the classroom [13]. In these guidelines, among other things, natural or forced ventilation of rooms and periodic monitoring of the concentration of carbon dioxide in the environment were recommended. In general terms, as shown in simulation studies by Na et al. [8] and Chen et al. [14], the establishment of effective cross-ventilation flows allows the indoor air in classrooms to be renewed and the level of pathogens in the environment to be reduced. In this regard, multiple studies have shown that without effective ventilation, CO2 concentrations in excess of 1500 ppm can be reached [15,16], which can lead to breathing difficulties for students, as well as headaches, fatigue and reduced ability to concentrate and learn [17].
On the other hand, although CO2 is not responsible for SARS-CoV-2 infection, it is an effective indicator of indoor air renewal rate [18]. Thus, by setting maximum CO2 concentrations as a function of occupancy rate, a rough idea of IAQ and the associated risk to students can be established [19]. Other studies have established a direct relationship between the value of fine particulate matter (PM) in the air and the risk of viral infection indoors [12]. In line with this idea, Ramalho et al. observed that airborne dust particles from Saharan winds contributed directly to the spread of respiratory diseases [20]. Thus, the higher the exposure to PM 2.5 and PM 10, the higher the long-term mortality risk. The European Union (EU) and the World Health Organisation (WHO) have taken this into account by setting daily and annual maximum values for exposure to PM 2.5 and PM 10, as shown in Table 1.

Table 1.
Limit values for PM 2.5 and PM 10 [21,22].
Thus, as stated by Tikul et al., microparticles are strong pollutants that contribute to the toxicity of cities, and they recorded a strong correlation between health problems and the concentration of ambient PM 2.5 in the city of Chiang Mai (Thailand), where students had great difficulty maintaining attention in the classroom [10]. Other studies have corroborated how in large cities, despite the incorporation of natural ventilation systems in schools, having a highly polluted outdoor environment can increase the concentration of fine particles in the classroom and can be harmful, making it necessary to use filtration systems [23]. In this sense, architectural design that considers effective ventilation based on quantified and reliable data, together with the use of simulation software, is crucial to obtaining effective and economical strategies to improve student health in schools [24].
Formaldehyde (HCHO) is another of the most abundant pollutants in the indoor classroom environment and has been classified as carcinogenic by the International Agency for Research on Cancer (IARC) [25]. Concern about this indoor pollutant has increased as a result of the increased use of hydroalcoholic gels since the COVID-19 pandemic [26]. Yu et al. demonstrated that short-term exposure to HCHO causes respiratory tract irritation and eye reddening, while prolonged exposure can lead to asthma and even cancer [27]. In general terms, HCHO concentration is directly related to temperature and relative humidity and is inversely proportional to the age of the building and outdoor air exchange [28,29]. In this regard, it is worth noting the study carried out in France by Hu et al. where a decrease of more than 25% in the concentration of formaldehyde in classrooms was observed if windows were opened regularly and the abusive use of cleaning products was controlled [30].
The main goal of this research is to study the evolution of CO2, PM 2.5, PM 10 and HCHO parameters in a typical school in the Community of Madrid during a complete academic year. In this way, the aim is to establish a relationship between the values determined for these pollutants with the environmental conditions of ambient temperature and relative humidity, as well as with the pollution values determined by the reference measurement stations of the Madrid City Council. The intention is to show in detail, and with the support of various statistical analyses, the correlation between the contagions produced during the course and these pollutants. Thus, we analyse the possible causes, as well as preventive measures that can be extrapolated from this case study to other schools located in large urban centres.
2. Methodology
This section describes both the building under study and the process of taking measurements for data collection and subsequent analysis.
2.1. Contextualisation and Description of the Educational Establishment
Currently, the Community of Madrid has a population exceeding 6.75 million inhabitants in an area of 604.45 km2 [31] and has become one of the European metropolitan areas with the highest mortality rate attributed to pollution. The education centre used as a reference for this research is located in the Carabanchel district, in the San Isidro neighbourhood (Madrid, Spain) with a population density of 183.55 inhabitants/km2. Regarding the origin of PM 2.5 suspended particles, these would be attributed to road traffic (55% of total emissions), industrial activities (35.9%) and airport traffic (0.9%), with the remaining sources of the emission classified as “unknown” [32]. On the other hand, the city also has a high source of CO2 emissions into the atmosphere and PM 10 particles of natural origin, which include wind-transported silt-sized sediments. Finally, the ageing of the Carabanchel district and the lack of renovation of the building stock significantly contribute to increasing the concentration of formaldehyde in the environment.
According to current regulations [33], the metropolitan area of the Community of Madrid is characterised by a temperate type C climate. All the classrooms in the building have the same orientation of windows to the east and access on the west side. In order to carry out the monitoring and periodic follow-up of the evolution of pollutants in its interior, periodic data have been collected in two classrooms located on the third floor of the building. The distribution and measurement points can be seen in Figure 1a, where the data were collected at a height of 1.2 m. In Figure 1a, it can be seen that Classroom 1 is a large space that provides access to an outdoor terrace and is ventilated at four distinct points: the entrance door to the classroom, the access door to the terrace and the classroom windows on both sides of the building, whose orientation is east–west, thus ensuring a continuous flow of fresh air. On the other hand, Classroom 2, adjacent to the previous one and with independent access through the hall, has four windows on the east side and, on the west side, only the access door to the classroom. Figure 1b shows an image of the building studied. In addition, Table 2 shows some of the most relevant data for this research regarding the configuration of the classrooms studied.
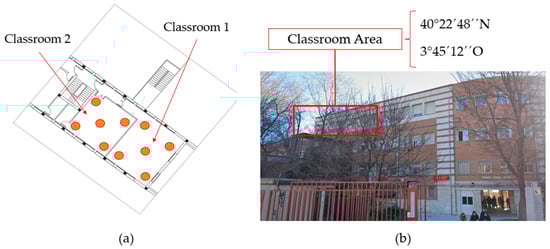
Figure 1.
(a) Classrooms under study and locations of monitoring equipment (orange circles), (b) exterior image of the building.
Table 2.
Characteristics of the studied classrooms.
Neither of the two classrooms included in this study had forced ventilation systems, making it necessary to open doors and windows to establish indoor air renewal flows. The Spanish Regulation of Thermal Installations in Buildings (RITE) [34] establishes that classrooms must have an indoor air quality type IDA-2, which implies a renewal flow of 12.5 dm3/s and maximum CO2 concentrations of 500 ppm above the concentration in the outside air. However, the necessary hygrothermal conditions to meet these requirements were not met throughout the course due to the climatic and pandemic requirements.
2.2. Collection and Analysis of Experimental Data
Figure 2a shows a detail of the measuring equipment used for periodic data collection (Temtop M2000 2nd model), with records taken between 8:00 a.m. and 02:00 p.m. at a frequency of one measurement per minute. This measuring equipment uses laser scattering sensors to irradiate airborne particles, and then collects the scattered light to obtain the light change curve over time. The microprocessor calculates the equivalent particle diameter and the number of particles with different diameters per unit volume. This Temtop M2000 2nd equipment has allowed real-time data capture of PM 2.5, PM 10, CO2 and HCHO particles, as well as being equipped with a thermo-hygrometer to monitor indoor temperature and humidity conditions. During the measurement process, the recommendations of the European Commission were followed, as set out in the EMEP/EEA air pollutant emission inventory guidebook—’the Guidebook’, which establishes the methodology for data collection and time series consistency [35].
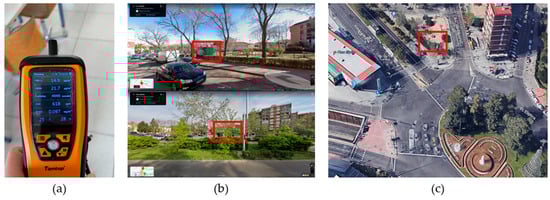
Figure 2.
(a) Temtop M2000 2nd measuring equipment used for indoor data collection; (b) Farolillo measuring station; (c) Plaza Elíptica measuring station.
On the other hand, in the case of suspended particles PM 2.5 and PM 10, the values of the two meteorological stations closest to the educational centre under study were compiled daily. Thus, in the case of the Community of Madrid, these stations are Plaza Elíptica (Figure 2b) and Farolillo (Figure 2c), with the latter measuring only PM 10 particles. These stations were equipped with a microbalance system to analyse the amount of pollutants in the air and report their data periodically with a frequency of one measurement per hour. In this way, by collecting these values, it was possible to establish differences between the measurements provided by official sources and the actual measurements taken in situ.
It should be noted that the values of CO2, HCHO, temperature and humidity were taken as univariable, so that their comparison was carried out in relation to the values established by the different applicable regulations. The measuring equipment located inside the classroom was distributed in such a way that it did not interrupt the teaching activity, avoiding areas of direct radiation and with the clear objective of determining the state of the air at the height of the working plane. Once the data from the stations in the city of Madrid had been collected, they were exported to an Excel spreadsheet to be organised together with the values collected in the classroom; this process was carried out during the eight months of the school year in which the measurements were collected. The data were then exported to SPSS version 29.0 software for statistical analysis of the results.
3. Results and Discussion
In this section, the results obtained for the different parameters evaluated in this research are presented in an organised manner, including a critical discussion of the values presented in each analysis.
3.1. Indoor Hygrothermal Conditions
Firstly, Figure 3 and Figure 4 show the descriptive values for interior humidity and room temperature in the classrooms studied. These graphs have been made with the help of Box-Plot diagrams that allow us to visualise the monthly average evolution of these parameters throughout the academic year.
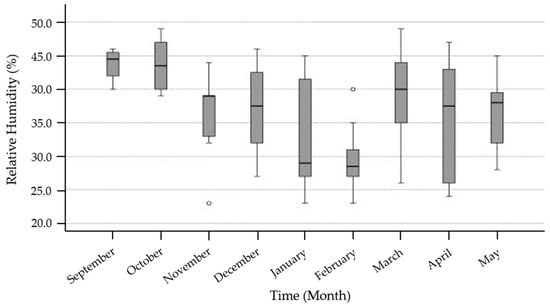
Figure 3.
Evolution of indoor relative humidity throughout the academic year.
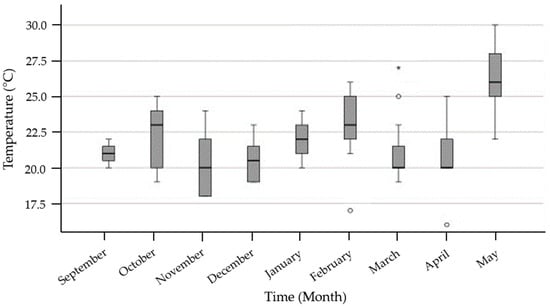
Figure 4.
Evolution of the indoor temperature throughout the academic year.
The relative humidity values established in the RITE as recommended for occupied rooms are set between 40.0 and 50.0% in winter and 45.0 and 60.0% in summer [34]. Thus, if we look at Figure 3, except for the months of September and October, the average relative humidity values collected throughout the academic year were below the recommended minimum.
After analysing Figure 4, it can be seen that in the winter months of November (mean temperature 20.0 °C) and December (mean temperature 20.5 °C), the indoor temperature in the classrooms studied did not meet the minimum values recommended by the current standard of 21–23 °C in winter conditions [34]. Similarly, in the month of May (mean temperature 26.3 °C), the temperature exceeded the maximum recommended by the standard of 25 °C. This shows how the need for ventilation caused by COVID-19 reduced the thermal comfort in the classrooms, even though each classroom was equipped with a 10 kW heat pump air-conditioning unit.
In view of the results, it is possible to reflect on the need to incorporate forced ventilation systems inside these educational buildings to improve student comfort. Likewise, as Varela et al. have shown, a commitment to energy rehabilitation of the façade by means of external thermal insulation systems (ETICS) would be very beneficial and would have a positive impact on improving the indoor thermal comfort and quality of life of the inhabitants of the Carabanchel district (Madrid) [36]. The average annual values of 21.9 °C temperature and 36.5% relative humidity are below the minimum recommended for the interior of educational centres.
3.2. CO2 Concentration Measurements
In this section we first show the average evolution of CO2 in the interior of the classrooms analysed during the academic year. These values are shown with the help of a Box-Plot diagram in Figure 5. When interpreting these results, it is necessary to point out that the usual average values for outdoor atmospheric CO2 range between 420 ppm and 450 ppm, depending on whether the environment is rural or urban [34]. For the specific case of this study, it is considered appropriate to use the upper limit of 450 ppm, since the school is located in the central area of the Community of Madrid, being an urban centre with a high population density and vehicle traffic. Likewise, at indoor CO2 concentrations 300 ppm higher than outdoor atmospheric CO2, it is understood that indoor air quality may be compromised and affect student performance [37].
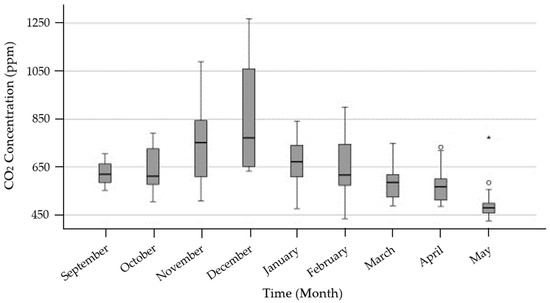
Figure 5.
Indoor CO2 concentration evolution during the academic year.
First, Figure 5 shows how the average CO2 value inside the classrooms was higher than 450 ppm in all months. These elevated average CO2 levels, despite having natural ventilation flows to the outside, are due to the high atmospheric pollution in the city, with many buildings adjacent to the educational centre with fuel oil or gas boilers and high permanent vehicular traffic. Likewise, there is an upward trend in CO2 levels in the period September–December, and then decreases in the period January–May. This trend has a clear explanation in the closing of windows in winter during class time and ventilation between sessions, which contributed to increasing the indoor temperature and thus CO2 levels, since as Zhang et al. have established, the human CO2 emission rate increases by approximately 3.5% when the temperature increases by 1 °C [37]. On the other hand, particularly alarming are the maximum values above 1000 ppm reached in the months of November and December, which far exceed the recommended maximum value of 750 ppm indoor concentration.
Table 3 presents a more generalised analysis with a grouping of the daily measurements by quarterly assessments, corresponding to the usual academic year of Vocational Training in Spain. In this way, a univariate test is presented, where the mean difference between the CO2 concentrations of each assessment compared to the mean outdoor CO2 value set at 450 ppm is established.
Table 3.
Test for difference of means at 99.5% confidence for CO2 concentration.
Thus, in the analysis by academic evaluations, it can be seen that the first evaluation period, corresponding to the winter months, showed a higher average indoor CO2 concentration. In fact, the value obtained for the mean difference (287 ppm) is close to the maximum permitted value of 300 ppm above the outdoor CO2 concentration. Table 3 shows how indoor air quality decreases in the colder months when ventilation was less pronounced. However, it is necessary to highlight that, as a limitation of this study, the evolution of CO2 in the outdoor environment could not be monitored. Knowing these outdoor values would be of great utility for interpreting the results in order to implement efficient natural ventilation systems. Otherwise, with high levels of atmospheric CO2, ventilation measures without prior purification of the air blown in could be harmful and counterproductive.
3.3. Concentration Measurements of Suspended Particulate Matter PM 2.5 and PM 10
The analysis of suspended particles is fundamental to understand viral propagation through the air. Thus, first of all, the monthly daily evolution over the course of the year for PM 2.5 and PM 10 is shown in Figure 6 and Figure 7.
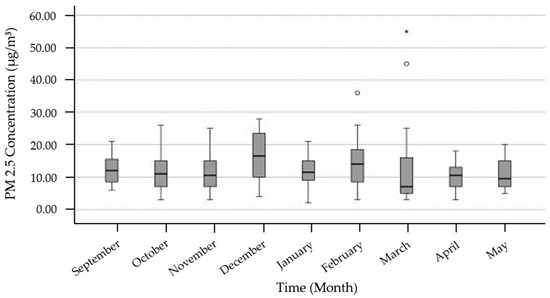
Figure 6.
PM 2.5 concentration trend over the academic year.
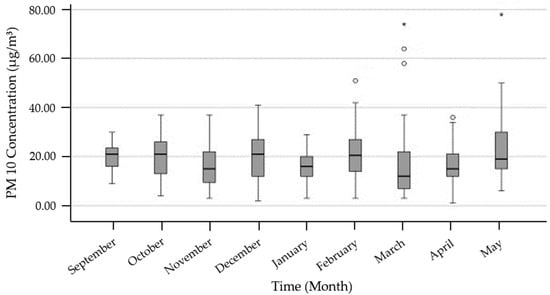
Figure 7.
PM 10 concentration trend over the academic year.
It can be seen that both the mean concentration values obtained for PM 2.5 in Figure 6 and for PM 10 in Figure 7 maintained a constant tendency throughout the course of the year of around 10 µg/m3 and 20 µg/m3, respectively. However, when analysing the annual evolution, the most critical months correspond to December, February and March. The increase in concentration during the month of December is associated with the Christmas holiday period and the increase in vehicle traffic. In addition, a continuous trend was observed throughout the school year, with concentration peaks occurring in the first hour of the school day, corresponding to the arrival of students and workers, and during the last hour of the school day at dismissal time when there was a greater traffic flow. Similarly, the increase in suspended particulate concentration during February and March is due to the wave of haze from Morocco that affected the Community of Madrid at that time, leading to severe asthma episodes and an increase in viral contamination. This wind of haze took place in the first week of February 2022 and in mid-March of the same year.
Thus, although the WHO sets the maximum permitted 24 h air pollutant concentration at 15 µg/m3 for PM 2.5 and 45 µg/m3 for PM 10, the students involved in this study were frequently subjected to episodes wherein the average concentration exceeded these recommended health limits. Concentrations of PM 2.5 were higher than 30 µg/m3 in February and 40 µg/m3 in March, which are high risk levels for people with respiratory diseases. Likewise, PM 10 exceeded the concentration of 60 µg/m3 on more than one occasion, which affected the normal course of classes.
Next, the results measured in situ in the classroom were cross-checked with the values collected from the official measuring stations of the Community of Madrid (Farolillo and Plaza Elíptica). Firstly, as shown in Table 4, the normality test was performed for the measurements of suspended particulate matter taken in each of the three school evaluation periods studied. In Table 4, the Kolmogorov–Smirnov–Lilliefors test (for sample size n > 30) and the Shapiro–Wilk test (for sample size n < 30) were performed.
Table 4.
Normality test for suspended particulate matter concentration by school evaluation periods.
From the analysis of Table 4, it can be seen that only the period comprising the first assessment complies with the assumptions of normality for PM 10 and PM 2.5, i.e., they had a significance level α > 0.05. Similarly, the second and third assessments did not meet the assumption of normality for at least one of the analysed measurement stations (i.e., they had a significance level of at least α < 0.05). This initial analysis justifies the application of the different analysis tests (parametric or non-parametric) used in this section. For ease of interpretation, PM 2.5, for which only two measurement stations are available, will be studied first, followed by PM 10, with three measurement stations.
Thus, in Table 5 and Table 6, the comparative study between the values collected by the Plaza Elíptica station and the values measured in situ for PM 2.5 particles is carried out. In the case of the first evaluation, which complies with the assumptions of normality, a parametric comparison of means is performed using Student’s t-test (Table 5). On the other hand, the second and third assessments did not meet the normality test, so a non-parametric study was performed using the Mann–Whitney U test, comparing medians instead of mean values (Table 6).
Table 5.
Independent samples test for PM 2.5 in the first assessment.
Table 6.
Mann–Whitney test and descriptive statistics for PM 25 in the second and third assessments.
In the analysis presented in Table 5, the homogeneity of variances is rejected, as well as the hypothesis that the means behave in the same way (Welch = −3.75; p-Value < 0.001). In this way, we proceeded to a descriptive analysis, verifying that the mean value determined for the concentration of PM 2.5 inside the school was significantly higher than that collected at the nearest measuring station (Plaza Elíptica). These mean values for the first evaluation were 15.25 µg/m3 for the school, compared to 10.34 µg/m3 at the official reference station.
On the other hand, Table 6 does not show statistically significant differences between medians in the second evaluation (U = 1274.5; p-Value = 0.087), nor in the third evaluation (U = 269.5; p-Value = 0.238). For this reason, Table 6 also includes a descriptive study of the medians determined for the two measurement points analysed, the educational centre and Plaza Elíptica. In this sense, the median concentration of PM 2.5 in these school periods is significantly higher at the school than at the reference station, being 20% and 18% higher for the second and third evaluations, respectively.
Hence, the results show that in the school period analysed, in the first evaluation, the maximum permitted values for exposure to PM 2.5 set by the WHO were exceeded by 15 µg/m3, with the average values of the other evaluations being very close to this limit. This alarming situation reflects the reality of the educational centres in the area, with an ageing building stock that is inefficiently ventilated, keeping the air polluted for long periods of time.
In the following, we proceed with the analysis of PM 10 particulate matter, including in Table 7 the analysis for the first evaluation and in Table 8 the study corresponding to the second and third evaluations. In this way, the analysis in Table 7 is carried out using an ANOVA table, since it was verified in Table 4 that the assumptions of normality were fulfilled for this school period. On the other hand, in Table 8 the non-parametric study is carried out using the Kruskal–Wallis test for comparison with more than one assumption, since for these larger particles, the measurement data from two stations close to the school (Farolillo and Plaza Elíptica) were available.
Table 7.
PM 10 ANOVA for the first evaluation period and post hoc test for multiple comparisons.
Table 8.
Kruskal–Wallis test for PM 10 in the second and third evaluation periods and pairwise comparisons of stations.
In Table 7, it can be seen that there are statistically significant differences between the daily measurement of PM 10 in the centre and at least one of the reference stations in the Community of Madrid (F = 3.403; p-Value = 0.036). For this reason, a post hoc test of multiple comparisons between in situ measurements and those obtained from the Plaza Elíptica station (which turned out to be the only statistically significant comparison) has been presented in Table 7. Thus, it was found that during the first evaluation, the daily monitoring of the classroom showed an average concentration of 21.4 µg/m3, compared to the 16.5 µg/m3 measured by the station.
Table 8 shows that there are statistically significant differences in medians when comparing at least one pair of measurement stations during the third evaluation (H = 6.212; p-Value = 0.045). For this reason, a post hoc test was performed to check this effect from an analytical point of view. Table 8 shows that during the period corresponding to the third evaluation, the stations of the Community of Madrid presented statistically significant differences between medians with the values measured in situ (Plaza Elíptica, p-Value = 0.054; and Farolillo, p-Value = 0.028). These differences amounted to 19 µg/m3 for the concentration at the school, compared to 15 µg/m3 for the median of the reference measurement centres.
As for PM 2.5, the values collected for PM 10 were on average higher than those collected by the reference measurement centres. For this reason, it was decided to construct 95% confidence intervals for the school period analysed in each quarter and considering the value of suspended particulate matter measured in situ. These results are presented in Table 9.
Table 9.
Confidence intervals for PM 2.5 and PM 10 during the course.
It can be seen in Table 9 that, although the average values sometimes did not exceed the maximum permitted by the WHO at 24 h, if the upper limits of the intervals are observed, in the case of PM 2.5, the value of 15 µg/m3 was exceeded in two evaluations. Furthermore, this type of airborne particulate matter is more harmful to health and causes more respiratory problems than PM 10 particles [38], which, although they did not exceed the WHO limit, also had concentrations above 15 µg/m3 on average over the whole school year. Figure 8 shows a graph with the daily evolution of PM 2.5 and PM 10, together with the number of SARS-CoV-2 virus infections during the same period in the Community of Madrid.
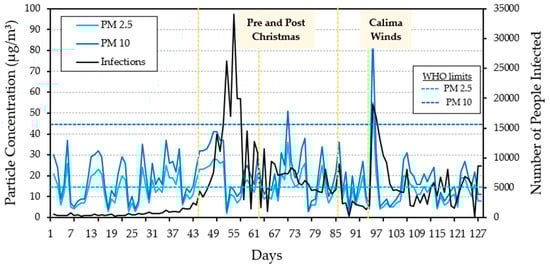
Figure 8.
Daily evolution of the concentrations of PM 2.5 and PM 10 during the school period Sep–May and number of infected people in Madrid due to SARS-CoV-2 virus.
Figure 8 shows that, in general terms, the trend in the evolution of suspended particles was similar to that of the number of COVID-19 infections. However, it is true that during the Christmas period, due to the festive season, the number of infections shot up. The effect of the haze can be seen in the graph with point values for PM 10 measured at 87 µg/m3 inside the classroom, which doubles the maximum value permitted by the WHO and highlights the vulnerability of the current building stock to this type of situation, which is repeated annually.
Analysis of the Effect of Hygrothermal Conditions on PM 2.5 and PM 10
The aim of this section is to check whether there is an effect of ambient temperature and relative humidity on the evolution of suspended particulate matter. Some studies in the literature show the importance of controlling these hygrothermal parameters to obtain good indoor air quality, with the concentration of PM 2.5 and PM 10 increasing as the values of these comfort-related variables increase [39,40]. Thus, first, the normality, homoscedasticity and independence of the values collected during the course were tested, and the results obtained for the normality test are presented in Table 10.
Table 10.
Normality test for the effect of hygrothermal conditions on PM 2.5 and PM 10.
Table 11 determines the strength of this correlation in the daily measurements of PM 2.5 and PM 10, together with the effect of relative humidity and indoor temperature analysed individually and combined. This study has been carried out monthly rather than by evaluations, as the correlation obtained in this case was higher and better accuracy is obtained.
Table 11.
Analysis of interactions between particle concentration and hygrothermal effects.
After analysing Table 11, it can be seen that all the factors included were statistically significant and showed a correlation with the particulate matter measurements. These results make physical sense, as the values measured in situ in the classroom correspond to the same conditions of ventilation and student concentration. On the other hand, the temperature factor showed the highest correlation for both PM 2.5 (p-Value = 0.685) and PM 10 (p-Value = 0.738), values much higher than those obtained when analysing the effect of relative humidity. This effect has already been corroborated by other researchers, who have demonstrated a positive correlation between temperature and the accumulation of atmospheric pollutants, especially in buildings located in urban areas with high traffic flow [10,41].
3.4. Measurements of HCHO Concentration
The last parameter analysed in this study was the evolution of the concentration of formaldehyde (HCHO). The monitoring of this atmospheric agent has experienced a growing interest among the scientific community as a result of the widespread use of hydroalcoholic gels in classrooms. This sanitary measure, in principle beneficial for sanitising and reducing viral contagion, leads to an increase in HCHO concentration in inadequately ventilated spaces [42]. Figure 9 shows the evolution of this parameter over the academic year under study with the help of a Box-Plot diagram.
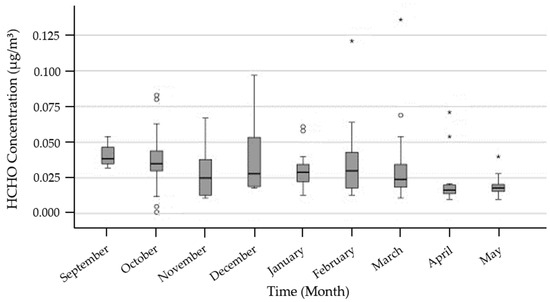
Figure 9.
Evolution of formaldehyde concentration over the academic year.
To discuss Figure 9, it is useful to consider the maximum permissible exposure values for HCHO set by the Scientific Committee for Occupational Exposure Limits (SCOEL), which were published by the European Commission in 2016. These values are set at a maximum exposure of 0.3 ppm in 8 h and 0.6 ppm in short exposure periods, which is equivalent to 0.37 μg/m3 and 0.74 μg/m3, respectively [43]. Thus, when analysing Figure 9, it can be seen that in general terms the average values remained below the maximum permitted, although it is true that in all months there were specific situations that exceeded the optimal exposure range for health. In the specific case of the school studied, these values were the consequence of the repeated use of hydroalcoholic gel in interiors and other cleaning products. Therefore, in line with other studies, hand washing with toilet soap and the use of non-alcohol-based products is considered more favourable, as these solutions, which are increasingly used after the COVID-19 pandemic, may be carcinogenic in the long term [44].
Table 12 shows the results obtained for the daily average for each of the three evaluations.
Table 12.
Analysis of the average evolution of HCHO in each school evaluation period.
The overall analysis by evaluations in Table 12 shows that, although the maximum permitted values were not exceeded, concentrations very close to 0.37 μg/m3 were obtained in both the first and third evaluations, thus requiring a reduction in the use of hydroalcoholic solutions to minimise health risks to students. These results are in line with those obtained by other researchers [45].
4. Critical Discussion and Implications of the Obtained Results
In recent decades, the construction industry has been striving to develop new solutions and eco-friendly designs to advance towards the European sustainability targets for buildings included in the 2030 Agenda [46]. Some of these initiatives are based on the design of climatically functional buildings using passive bioclimatic systems [47]; other studies focus on the development of new, more sustainable building materials produced under circular economy criteria [48], while another large number of studies seek to optimise the design of the urban environment by showing the possibilities of construction systems such as green façades [49], green roofs [50] or water-reserved roofs [51], among many others.
Hence, the current climate emergency and the growing concern about the deterioration of the urban and rural environment are shaping the course of building research in the attempt to mitigate the ecological impact of buildings and considering their economic and social context [52]. In this sense, large European cities are suffering a progressive increase in their average temperature (heat island effect) [53], while increasing their pollution levels and decreasing air quality [54] and experiencing increasingly frequent violent weather events such as acid rain, floods, droughts or heat waves [55].
This research is a clear example of the need to rehabilitate and refurbish the ageing building stock, highlighting the damage caused to students’ health by deficiencies in the current design of some urban educational centres. In the specific case of Spain, 60% of existing housing was built before the 1980s and is still in use without having undergone any refurbishment [56]. This implies that more than half of today’s buildings were built without taking into consideration any standards that include relevant issues such as the design of air renewal systems or effective thermal insulation. For this reason, in order to improve the IAQ of existing schools located in the urban centre of the city of Madrid, it is necessary to promote a retrofitting initiative taking into consideration some relevant aspects such as those included in Figure 10.
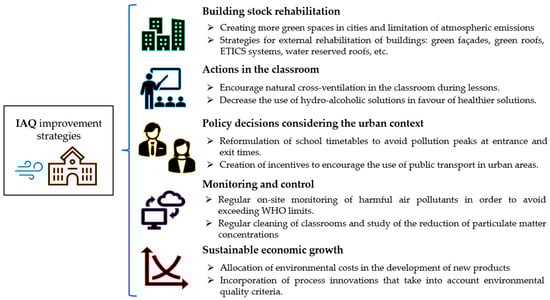
Figure 10.
Schematic compilation of possible alternatives for improving indoor air quality in schools.
However, until actions such as those shown in Figure 10 are implemented, teachers and school management teams are the key actors in improving IAQ in classrooms. In view of the results obtained in this research, it is clear that in-situ measurements are necessary to carry out a critical analysis of the air situation in occupied classrooms, using the values obtained by the reference centres as a guide and initial information. In addition, the need to promote more effective and regular ventilation practices is highlighted, in order to reduce a double risk linked to a decrease in academic performance and, worse still, the appearance of respiratory diseases in students.
Finally, it is necessary to appreciate the increases in danger generated by the increment in suspended dust. For this reason, concentrations of harmful gases for health, formation of stale air, increased risk of diseases and other key points linked to IAQ can be effectively mitigated by establishing an efficient ventilation system equipped with soundproofing systems and professional filters, including IR filters, located at the entrance and exit of the classrooms.
5. Conclusions
In this work, a monitoring of the IAQ of two classrooms belonging to an educational centre located in the urban centre of the city of Madrid was carried out during a complete academic year. Measurements of the daily evolution of airborne particles harmful to health such as CO2, PM 10, PM 2.5 and HCHO, as well as a control of the hygrothermal comfort parameters of relative humidity and ambient temperature, were collected during the monitoring. It was also possible to visualise the trend in the number of SARS-CoV-2 virus infections and the concentration of suspended particles detected in the classroom, yielding alarming results that call for an urgent renovation of the current building stock. The most relevant conclusions that can be drawn from this work are as follows:
- The lack of refurbishment of the school centre since its foundation in the 1970s has been reflected in a decrease in hygrothermal comfort, with relative humidity values below those recommended by the RITE regulations and an indoor temperature lower than recommended in winter and higher in summer.
- Regarding CO2 concentration, during the school period of the first evaluation, values close to the maximum permissible level of 700 ppm were recorded, sometimes exceeding 1000 ppm inside the classroom.
- In the analysis of PM 2.5 particles, values close to the maximum recommended by the WHO of 15 μg/m3 were observed during the months studied, although it was only exceeded in specific situations. PM 10 particles showed a behaviour close to 20 μg/m3 on average during the academic year. For both types of suspended particles, statistically significant differences were observed between the values measured in situ and those obtained from the two reference stations available in the Community of Madrid, highlighting the need for regular monitoring in the classroom.
- In line with other studies, a strong correlation has been observed between the evolution of hygrothermal conditions in the classroom and the concentration of PM 2.5 and PM 10 suspended particulate matter, which underlines the importance of energy retrofitting of the building.
- Finally, high formaldehyde concentration values were found in the classroom. On average, values of 0.34 μg/m3 were obtained during the period corresponding to the third evaluation, very close to the risk concentration set at 0.37 μg/m3 for this type of space.
The main limitation of this work has been the impossibility of monitoring a larger number of classrooms in the building in order to make a comparison between different orientations, room volumes and student concentrations, which would have enriched the analysis of the results. On the other hand, a limitation of the measurements is the absence of data corresponding to NOX concentrations, CO concentrations (whose high volumes of accumulation in cities can promote diseases such as Parkinson’s) and the lack of measurements outside school hours. As future lines of work, we propose that a CFD simulation model be carried out based on the data obtained and use different constructive solutions to establish strategies to improve the IAQ in the monitored classrooms. At the same time, we intend that a numerical analysis be carried out to establish statistical models that describe the behaviour of the air throughout the normal academic year under different assumptions about particle concentrations and environmental conditions.
Author Contributions
Conceptualization, A.L.M. and J.P.D.V.; methodology, A.L.M. and J.P.D.V.; software, A.L.M.; validation, A.L.M., J.P.D.V. and D.F.; formal analysis, A.L.M.; investigation, A.L.M. and J.P.D.V.; resources, A.L.M. and D.F.; data curation, A.L.M.; writing—original draft preparation, A.L.M., D.F. and A.Z.-B.; writing—review and editing, D.F., P.S. and A.Z.-B.; visualization, A.Z.-B.; supervision, J.P.D.V. and D.F. All authors have read and agreed to the published version of the manuscript.
Funding
This research received no external funding.
Data Availability Statement
Not applicable.
Acknowledgments
The authors would like to thank the students and teachers at the school involved in the study for their willingness and for the facilities offered to carry out this research work.
Conflicts of Interest
The authors declare no conflict of interest.
References
- EN 15643; Sustainability of Construction Works—Framework for Assessment of Buildings and Civil Engineering Works. CEN—European Committee for Standardisation: Brussels, Belgium, 2021.
- EN 16309 + A1; Sustainability of Construction Works—Assessment of Social Performance of Buildings—Calculation Methodology. CEN—European Committee for Standardisation: Brussels, Belgium, 2014.
- Santos, P.; Gervasio, H.; Pereira, A.; Simoes da Silva, L.; Bettencourt, A. Comparative life cycle social assessment of buildings: Health and comfort criterion. Matériaux Tech. 2017, 104, 601. [Google Scholar] [CrossRef]
- Santos, P.; Carvalho Pereira, A.; Gervásio, H.; Bettencourt, A.; Mateus, D. Assessment of health and comfort criteria in a life cycle social context: Application to buildings for higher education. Build. Environ. 2017, 123, 625–648. [Google Scholar] [CrossRef]
- Stafford, T.M. Indoor air quality and academic performance. J. Environ. Econ. Manag. 2015, 70, 34–50. [Google Scholar] [CrossRef]
- Kabirikopaei, A.; Lau, J.; Nord, J.; Bovaird, J. Identifying the K-12 classrooms’ indoor air quality factors that affect student academic performance. Sci. the Total Environ. 2021, 786, 147498. [Google Scholar] [CrossRef]
- Kosonen, R.; Tan, F. The effect of perceived indoor air quality on productivity loss. Energy Build. 2004, 36, 981–986. [Google Scholar] [CrossRef]
- Na, H.; Choi, H.; Kim, H.; Park, D. Optimizing indoor air quality and noise levels in old school classrooms with air purifiers and HRV: A CONTAM simulation study. J. Build. Eng. 2023, 73, 106645. [Google Scholar] [CrossRef]
- Rodríguez, D.; Urbieta, I.R.; Velasco, A.; Campano-Laborda, M.A.; Jímenez, E. Assessment of indoor air quality and risk of COVID-19 infection in Spanish secondary school and university classrooms. Build. Environ. 2022, 226, 109717. [Google Scholar] [CrossRef] [PubMed]
- Tikul, N.; Hokpunna, A.; Chawana, P. Improving indoor air quality in primary school buildings through optimized apertures and classroom furniture layouts Author links open overlay panel. J. Build. Eng. 2022, 62, 105324. [Google Scholar] [CrossRef]
- Greenhalgh, T.; Jimenez, J.L.; Prather, K.A.; Tufekci, Z.; Fisman, D.; Schooley, R. Ten scientific reasons in support of airborne transmission of SARS-CoV-2. Lancet 2021, 397, 1603–1605. [Google Scholar] [CrossRef] [PubMed]
- Harvard, C. Guía en 5 Pasos Para Medir la Tasa de Renovación en Las Aulas. 2020. Available online: https://alara.es/guia-para-medir-la-tasa-de-renovacion-de-aire-en-aulas/ (accessed on 15 February 2023).
- Evaluación del Riesgo de la Transmisión de SARS-CoV- Mediante Aerosoles. Medidas de Prevención y Recomendación. 2020. Available online: https://www.mscbs.gob.es/profesionales/saludPublica/ccayes/alertasActual/nCov/documentos/COVID19_Aerosoles.pdf (accessed on 15 November 2022).
- Chen, Y.H.; Tu, Y.P.; Sung, S.Y.; Weng, W.C. A comprehensive analysis of the intervention of a fresh air ventilation system on indoor air quality in classrooms. Atmos. Pollut. Res. 2022, 13, 101373. [Google Scholar] [CrossRef]
- Stabile, L.; Frattolillo, A.; Dell’Isola, M.; Massimo, A.; Russi, A. Air Permeability of Naturally Ventilated Italian Classrooms. Energy Procedia 2015, 78, 3150–3155. [Google Scholar] [CrossRef]
- Schibuola, L.; Scarpa, M.; Tambani, C. Natural Ventilation Level Assessment in a School Building by CO2 Concentration Measures. Energy Procedia 2016, 1101, 257–264. [Google Scholar] [CrossRef]
- Bogdanovica, S.; Zemitis, J.; Bogdanovics, R. The Effect of CO2 Concentration on Children’s Well-Being during the Process of Learning. Energies 2020, 13, 6099. [Google Scholar] [CrossRef]
- Azuma, K.; Kagi, N.; Yanagi, U.; Osawa, H. Effects of low-level inhalation exposure to carbon dioxide in indoor environments: A short review on human health and psychomotor performance. Environ. Int. 2018, 121, 51–56. [Google Scholar] [CrossRef] [PubMed]
- Poirier, B.; Guyot, G.; Woloszyn, M.; Geoggroy, H.; Ondarts, M.; Gonze, E. Development of an assessment methodology for IAQ ventilation performance in residential buildings: An investigation of relevant performance indicators. J. Build. Eng. 2021, 43, 103140. [Google Scholar] [CrossRef]
- Ramalho, O.; Wyart, G.; Mandin, C.; Blondeau, P.; Cabanes, P.A.; Leclerc, N.; Mullot, J.U.; Boulanger, G.; Redaelli, M. Association of carbon dioxide with indoor air pollutants and exceedance of health guideline values. Build. Environ. 2015, 93, 115–124. [Google Scholar] [CrossRef]
- World Health Organization. Calidad del Aire Ambiente (Exterior) y Salud. Available online: https://www.who.int/es/news-room/fact-sheets/detail/ambient-(outdoor)-air-quality-and-health (accessed on 15 March 2023).
- Air Quality in Europe—2020 Report. European Environment Agency. Available online: https://www.eea.europa.eu/publications/air-quality-in-europe-2020-report (accessed on 15 February 2023).
- Rivas, I.; Viana, M.; Moreno, T.; Bouso, L.; Pandlfi, M.; Alvarez-Pedrerol, M.; Forns, J.; Alastuey, A.; Sunyer, J.; Querol, X. Outdoor infiltration and indoor contribution of UFP and BC, OC, secondary inorganic ions and metals in PM2.5 in schools. Atmos. Environ. 2015, 196, 129–138. [Google Scholar] [CrossRef]
- Mukhtar, A.; Yusoff, M.Z.; Ng, K.C. The potential influence of building optimization and passive design strategies on natural ventilation systems in underground buildings: The state of the art. Tunn. Undergr. Space Technol. 2019, 92, 103065. [Google Scholar] [CrossRef]
- IARC, W. Formaldehyde, 2-Butoxyethanol and 1-tert-Butoxypropan-2-ol. IARC Monogr. Eval. Carcinog. Risks Hum. 2006, 88, 39–325. [Google Scholar]
- Brdarić, D.; Kovač-Andrić, E.; Šapina, M.; Kramarić, K.; Lutz, N.; Perković, T.; Egorov, A. Indoor air pollution with benzene, formaldehyde, and nitrogen dioxide in schools in Osijek, Croatia. Air Qual. Atmos. Health 2019, 12, 963–968. [Google Scholar] [CrossRef]
- Yu, L.; Wang, B.; Cheng, M.; Yang, M.; Gan, S.; Fan, L.; Wang, D.; Chen, W. Association between indoor formaldehyde exposure and asthma: A systematic review and meta-analysis of observational studies. Indoor Air 2020, 30, 682–690. [Google Scholar] [CrossRef] [PubMed]
- Parthasarathy, S.; Maddalena, R.L.; Russel, M.L.; Apte, M.G. Effect of Temperature and Humidity on Formaldehyde Emissions in Temporary Housing Units. J. Air Waste Manag. Assoc. 2011, 61, 689–695. [Google Scholar] [CrossRef] [PubMed]
- Qin, D.; Guo, B.; Zhou, J.; Cheng, H.; Chen, X. Indoor air formaldehyde (HCHO) pollution of urban coach cabins. Sci. Rep. 2020, 10, 332. [Google Scholar] [CrossRef]
- Hu, D.; Tobon, Y.; Agostini, A.; Grosselin, B.; Chen, Y.; Robin, C.; Yahyaoui, A.; Colin, P.; Mellouki, A.; Daële, V. Diurnal variation and potential sources of indoor formaldehyde at elementary school, high school and university in the Centre Val de Loire region of France. Sci. Total Environ. 2022, 811, 152271. [Google Scholar] [CrossRef]
- Madrid: Población Por Municipios y Sexo. 2022. Available online: https://www.ine.es/jaxiT3/Datos.htm?t=2881 (accessed on 15 November 2022).
- Khomenko, S.; Cirach, M.; Pereira-Barboza, E.; Mueller, N.; Barrera-Gómez, J.; Rojas-Rueda, D.; Hoogh, K.; Hoek, G.; Nieuwenhuijsen, M. Premature mortality due to air pollution in European cities: A health impact assessment. Lancet Planet. Health 2021, 5, e121–e134. [Google Scholar] [CrossRef]
- Real Decreto 314/2006; Ministerio de Vivienda: Código Técnico de la Edificación (in Spanish). Madrid, Spain. 2016. Available online: https://www.codigotecnico.org/pdf/Documentos/HE/DccHE.pdf (accessed on 1 September 2023).
- Real Decreto 238/2013; Ministerio de Industria, Energía y Turismo: Reglamento de Instalaciones Térmicas en los Edificios (RITE) (in Spanish). Madrid, Spain. 2013. Available online: https://www.boe.es/buscar/doc.php?id=BOE-A-2013-3905 (accessed on 1 September 2023).
- European Environment Agency. EMEP/EEA Air Pollutant Emission Inventory Guidebook; European Environment Agency (EEA): Luxembourg, 2019; ISSN 1977-8449.
- Varela Luján, S.; Viñas, C.; Rodríguez, A.; Aguilera, P.; González, M. Experimental comparative study of the thermal performance of the façade of a building refurbished using ETICS, and quantification of improvements. Sustain. Cities Society 2019, 51, 101713. [Google Scholar] [CrossRef]
- Zhang, X.; Zhao, C.; Zhang, T.; Xie, J.; Liu, J.; Zhang, N. Association of indoor temperature and air quality in classrooms based on field and intervention measurements. Build. Environ. 2023, 229, 109925. [Google Scholar] [CrossRef]
- Das, K.; Chatterjee, N.D.; Jana, D.; Bhattacharya, R.K. Application of land-use regression model with regularization algorithm to assess PM2.5 and PM10 concentration and health risk in Kolkata Metropolitan. Urban Clim. 2023, 49, 101473. [Google Scholar] [CrossRef]
- Lewis, S.L.; Russel, L.M.; McKinsey, J.A.; Harris, W.J. Small contributions of dust to PM2.5 and PM10 concentrations measured downwind of Oceano Dunes. Atmos. Environ. 2023, 294, 119515. [Google Scholar] [CrossRef]
- Lin, Z.; Lawrence, W.R.; Gong, W.; Lin, L.; Hu, J.; Zhu, S.; Meng, R.; He, G.; Xu, X.; Liu, T.; et al. The impact of mortality underreporting on the association of ambient temperature and PM10 with mortality risk in time series study. Heliyon 2023, 9, e14648. [Google Scholar] [CrossRef]
- Lu, C.; Xu, H.; Meng, W.; Hou, W.; Zhang, W.; Shen, G.; Cheng, H.; Wang, X.; Wang, X.; Tao, S. A novel model for regional indoor PM2.5 quantification with both external and internal contributions included. Environ. Int. 2020, 145, 106124. [Google Scholar] [CrossRef]
- Malayeri, M.; Bahri, M.; Haghighat, F.; Shah, A. Impact of air distribution on indoor formaldehyde abatement with/without passive removal material: A CFD modeling. Build. Environ. 2022, 212, 108792. [Google Scholar] [CrossRef]
- INSHT. NTP 590: Prevención de la Exposición a Formaldehído; Ministerio de Trabajo y Asuntos Sociales: Madrid, Spain, 2001. [Google Scholar]
- Figueroa, D.; Nishio, S.; Yamazaki, R.; Ohta, E.; Hamaguchi, S.; Utsumi, M. Recognition of hand disinfection by an alcohol-containing gel using two-dimensional imaging in a clinical setting. J. Hosp. Infect. 2023, 135, 157–162. [Google Scholar] [CrossRef] [PubMed]
- Aodah, A.H.; Bakr, A.A.; Booq, R.Y.; Rahman, M.J.; Alzahrani, D.A.; Alsulami, K.A.; Alshaya, H.A.; Alsuabeyl, M.; Alyamani, E.; Twafik, E.A. Preparation and evaluation of benzalkonium chloride hand sanitizer as a potential alternative for alcohol-based hand gels. Saudi Pharm. J. 2021, 29, 807–814. [Google Scholar] [CrossRef]
- Mikulić, D.; Slijepčević, S.; Buturac, G. Energy renovation of multi apartment buildings: Contributions to economy and climate changes. Energy Build. 2020, 224, 110247. [Google Scholar] [CrossRef]
- Elaouzy, Y.; El Fadar, A. Sustainability of building-integrated bioclimatic design strategies depending on energy affordability. Renew. Sustain. Energy Rev. 2023, 179, 113295. [Google Scholar] [CrossRef]
- Zaragoza-Benzal, A.; Ferrández, D.; Atanes-Sánchez, E.; Saíz, P. Study of the hygroscopic properties of environmentally friendly lightened composites through waste recovery. Constr. Build. Mater. 2023, 404, 133219. [Google Scholar] [CrossRef]
- Bakhshoodeh, R.; Ocampo, C.; Oldham, C. Impact of ambient air temperature, orientation, and plant status on the thermal performance of green façades. Energy Build. 2023, 296, 113389. [Google Scholar] [CrossRef]
- Zambrano-Prado, P.; Pons-Gumí, D.; Tobos-Chavero, S.; Parada, F.; Josa, A.; Gabarrell, X.; Rieradevall, J. Perceptions on barriers and opportunities for integrating urban agri-green roofs: A European Mediterranean compact city case. Cities 2021, 114, 103196. [Google Scholar] [CrossRef]
- Yang, W.; Wang, Z.; Zhao, X. Experimental investigation of the thermal isolation and evaporative cooling effects of an exposed shallow-water-reserved roof under the sub-tropical climatic condition. Sustain. Cities Soc. 2015, 14, 293–304. [Google Scholar] [CrossRef]
- Borrás, J.G.; Lerma, C.; Mas, A.; Vercher, J.; Gil, E. Contribution of green roofs to energy savings in building renovations. Energy Sustain. Dev. 2022, 71, 212–221. [Google Scholar] [CrossRef]
- Susca, T.; Zanghirella, F.; del Fatto, V. Building integrated vegetation effect on micro-climate conditions for urban heat island adaptation. Lesson learned from Turin and Rome case studies. Energy Build. 2023, 295, 113233. [Google Scholar] [CrossRef]
- Belias, E.; Licina, D. Influence of outdoor air pollution on European residential ventilative cooling potential. Energy Build. 2023, 289, 113044. [Google Scholar] [CrossRef]
- Laino, E.; Iglesias, G. Extreme climate change hazards and impacts on European coastal cities: A review. Renew. Sustain. Energy Rev. 2023, 184, 113587. [Google Scholar] [CrossRef]
- Monzón-Chavarrías, M.; López-Mesa, B.; Resende, J.; Corvacho, H. The nZEB concept and its requirements for residential buildings renovation in Southern Europe: The case of multi-family buildings from 1961 to 1980 in Portugal and Spain. J. Build. Eng. 2021, 34, 101918. [Google Scholar] [CrossRef]
Disclaimer/Publisher’s Note: The statements, opinions and data contained in all publications are solely those of the individual author(s) and contributor(s) and not of MDPI and/or the editor(s). MDPI and/or the editor(s) disclaim responsibility for any injury to people or property resulting from any ideas, methods, instructions or products referred to in the content. |
© 2023 by the authors. Licensee MDPI, Basel, Switzerland. This article is an open access article distributed under the terms and conditions of the Creative Commons Attribution (CC BY) license (https://creativecommons.org/licenses/by/4.0/).