Abstract
The demand for cement is increasing every day worldwide. To meet this demand, natural resources are rapidly being depleted. The excessive consumption of natural resources encourages researchers to conduct studies on the use of waste materials instead of cement. Marble waste is one of the major natural wastes abundantly generated worldwide. It has been evaluated that there is a gap in the literature regarding a study comparing the effects of different cooling regimes on cementitious composites with a marble powder (MP) replacement that has been exposed to high temperatures. In this study, waste marble powder (MP) was used as a replacement for cement at percentages of 5%, 10%, 15%, 20%, and 25% by mass. The water-to-binder ratio was kept constant at 0.5 for all mixture groups. Subsequently, the prepared cementitious composites were exposed to high temperatures (300 °C, 600 °C, and 800 °C) and subjected to air- and water-cooling regimes. Within the scope of this study, unit weight (Uw), ultrasonic pulse velocity (UPV), flexural strength (ffs), compressive strength (fcs), and mass loss tests were conducted. Additionally, a microstructure analysis was carried out using scanning electron microscopy (SEM) to examine the effect of MP replacement and the cooling regime. When examining the results of the samples tested in the laboratory, it was observed that the mortar with 5% MP replacement exhibited better mechanical properties compared with the others. In general, it can be said that the mechanical properties of samples cooled in air after exposure to high temperatures were better than those of samples cooled in water. As a result of this study, it was determined that MP replacement could positively contribute to the resistance of cementitious composites to high temperatures. Additionally, the use of a significant amount of waste MP can lead to savings in cement usage and significant reductions in CO2 emissions.
1. Introduction
The construction sector stands out as one of the industries benefiting the most from technological advancements. Due to technological developments in the sector, the production of ready-mix concrete is increasing day by day. However, this situation brings about specific issues. Some of these issues include increased raw material consumption in concrete production, depletion of nonrenewable resources, and increased CO2 emissions due to higher cement consumption [1,2]. The depletion of raw material resources and the escalation of environmental pollution have prompted researchers to conduct various studies for the sustainability of the construction industry. In some studies, the usability of industrial waste has been investigated in cementitious composites, geopolymers, asphalt coatings, and road base and subbase layers, either as aggregates or binders [3,4,5,6,7,8,9].
Significant amounts of waste are generated during the production of marble, which has been one of the most widely used building materials since ancient times. Approximately 30% of marble is wasted during processing, leading to substantial waste generation [10]. Waste marble in the form of dust causes significant environmental damages such as air pollution, clogging of sewage systems, obstruction of aquifer soil pores, disruption of vegetation cover, and threats to human health [11,12]. These environmental impacts have prompted researchers to investigate the utilization of waste marble powder in cementitious composites. In some studies, it has been reported that the incorporation of marble powder yields positive results in the properties of cementitious composites [13,14,15].
Aliabdo et al. [10] investigated using marble powder (MP) in cement and concrete production. MP was incorporated into mixtures in two different ways, as a replacement for sand and cement, up to a proportion of 15%. Overall, they reported that the inclusion of MP in concrete mixtures as a cement or sand replacement gradually improved concrete’s physical and mechanical properties, particularly at lower water/cement ratios. Vardhan et al. [16] replaced cement with MP at proportions of 10%, 20%, 30%, 40%, and 50%. The study examined MP-substituted cement pastes’ setting behavior, soundness, flowability, strength development, and microstructure properties. It was determined that MP can be used up to a substitution rate of 10% without adversely affecting mixture properties. Singh et al. [17] investigated the influence of dried waste marble slurry, used as a substitute for cement, on concrete’s fresh and hardened properties. They found that using dried waste marble slurry with up to a 15% substitution rate led to enhanced mechanical properties for concrete.
Additionally, they reported that marble slurry improved the compactness and uniformity of the concrete structure, acting as a filler and reducing drying shrinkage. Siddique et al. [18] conducted a study on the supplementary cementitious behavior of raw marble slurry and calcined marble slurry. The study explored compressive strength, microstructure analysis, and physicomechanical properties. Mixtures prepared with calcined marble slurry exhibited higher compressive strength than those prepared with raw marble slurry. Substituting up to 10% of calcined marble slurry led to a 7% increase in 28-day compressive strength. Additionally, a 10% substitution rate of calcined marble slurry reduced porosity by about 7.5%.
Structures are exposed to various external factors such as wind, earthquakes, and fires throughout their service life. Fire is one of the most significant external factors threatening structures’ safety [19]. Structures can be directly or indirectly affected by high temperatures. The design stage should involve considering the resistance characteristics of structures to fire. The construction materials used in a structure are crucial in its fire resistance. Concrete is the most commonly preferred building material in construction. Therefore, understanding the performance of concrete during a fire is of utmost importance. When subjected to high temperatures, concrete undergoes various physical and chemical changes such as color alteration, strength loss, cracking, and fragmentation. This situation has led researchers to investigate the effects of aggregate type, cement type and dosage, fiber materials, supplementary cementitious materials (SCMs), and cooling regimes on cementitious composites exposed to high temperatures [20,21,22,23,24].
The use of supplementary cementitious materials (SCMs) in concrete or mortar is becoming more widespread day by day [25,26,27,28]. These materials contribute to saving cement usage and help reduce environmental pollution. SCMs provide positive contributions to the physical and mechanical properties of cementitious composites. When SCM-incorporated mortars are exposed to high temperatures, they can exhibit different characteristics than those without SCM. Yamanel et al. [29] replaced MP with cement at proportions of 5%, 10%, 15%, and 20% and investigated the effect of high temperatures (300 °C, 600 °C, and 900 °C) on cement mortars. The study concluded that substituting MP for cement positively contributes to the workability and resistance against high temperatures of fresh mortar. Jiang et al. [30] replaced waste glass powder with cement at proportions of 10%, 20%, and 30%. The mechanical properties after exposure to the ambient temperature and high temperatures (800 °C, 1000 °C, and 1200 °C), as well as the physical properties of fresh cement pastes, were examined. The results showed that waste glass powder substitution increased workability and extended the setting time.
Marble powder (MP) is known to cause significant environmental pollution. Therefore, it is believed that efforts to manage MP should be intensified. One of the waste disposal methods is to use it as a substitute for cement in mortar. Despite numerous studies in the literature on this topic, there is a limited amount of research focusing on the effects of different cooling regimes on the mechanical and microstructural properties of cement mortars containing MP and exposed to high temperatures. In addition, as far as the authors know, no article compares MP-added mortars exposed to high temperatures and cooled in air and water, which motivated this study. Finally, it is thought that more research should be conducted on the disposal of this waste material (MP), which is released in very high amounts. This study is aimed at investigating the impact of various cooling regimes on MP-substituted mortars. For this reason, cement mortars were prepared with substitutions of 5%, 10%, 15%, 20%, and 25% MP for cement. These mortar mixtures were cured in water for 28 days and then subjected to high temperatures. The cement mortars were exposed to temperatures of 300 °C, 600 °C, and 800 °C in a high-temperature furnace, followed by cooling in air and water. After the cooling process, the unit weight (Uw), ultrasonic pulse velocity (UPV), flexural strength (ffs), compressive strength (fcs), and mass losses of the samples were determined.
Additionally, the samples were tested under laboratory conditions (20 °C), and the effects of high temperature on the mortar samples were compared and evaluated. Lastly, microstructural (SEM) analyses were conducted on reference (0% MP) and 10% MP-substituted mortar samples tested under laboratory conditions (20 °C) and after exposure to 600 °C. By examining the effects of different cooling regimes on MP-substituted mortar, this study aims to contribute to a better understanding of the behavior of these materials under high-temperature conditions.
2. Experimental Program
In this section, the materials used in the production of MP-substituted cementitious composites exposed to high temperatures (CEM I 42.5 R, MP, water, and sand), the mixing ratios (5%, 10%, 15%, 20%, and 25% MP replacement of cement by weight), and the applied tests (unit weight, ultrasonic pulse velocity, compressive strength, flexural strength, mass loss, and microstructural analyses) are presented in detail.
2.1. Materials
In cement mortars, CEM I 42.5 R Portland cement (PC) and marble powder (MP) were used as binder materials. Table 1 presents the physical and chemical properties of PC and MP. After sieving, MP was utilized from the portion that remained below the 75-micron (No. 200) sieve. Standard sand defined by EN 196-1 [31] was used as aggregate in the mortar mixtures. Tap water was used as mixing water. CEM I 42.5 R cement is a type of pure cement. This type of cement is preferred in many experimental studies in the literature. In addition, since it was thought that the pure cement type (CEM I 42.5 R) should be chosen to better see pozzolanic materials’ effect on cement-based composites, it was deemed appropriate to use this type of cement in this study. As mentioned in the introduction, a considerable amount of MP is released into nature as a waste material. Therefore, with the thought that this material should be disposed of, the authors decided to use it within the scope of this study. When additional cementitious materials such as MP are substituted for cement, they reduce the mortar matrix’s Ca(OH)2 density. When the Ca(OH)2 density decreases, the strength loss of cementitious composites is reduced, especially at high temperatures. When the temperature reaches around 500 °C, Ca(OH)2, which constitutes a large part of the material, begins to break down, and significant decreases in strength are observed. For this reason, it was thought that the effect of MP on the properties of cementitious composites exposed to high temperatures should be investigated.

Table 1.
Physical and chemical properties of PC and MP.
2.2. Mixture Proportions
In cement mortars, the amounts of sand, water, and binder were kept constant, and the mortars were prepared in accordance with EN 196-1 [31]. As a substitute for PC, MP was incorporated at different proportions (5%, 10%, 15%, 20%, and 25%). The quantities of materials used in the mortar mixtures and their corresponding codes are presented in Table 2. Fresh mortar mixtures were compacted and poured into molds with dimensions of 40 × 40 × 160 mm in two layers. After 24 h, the samples were removed from the molds and cured in a water curing tank for 28 days.
Table 2.
Mortar mix proportions.
2.3. Test Procedure
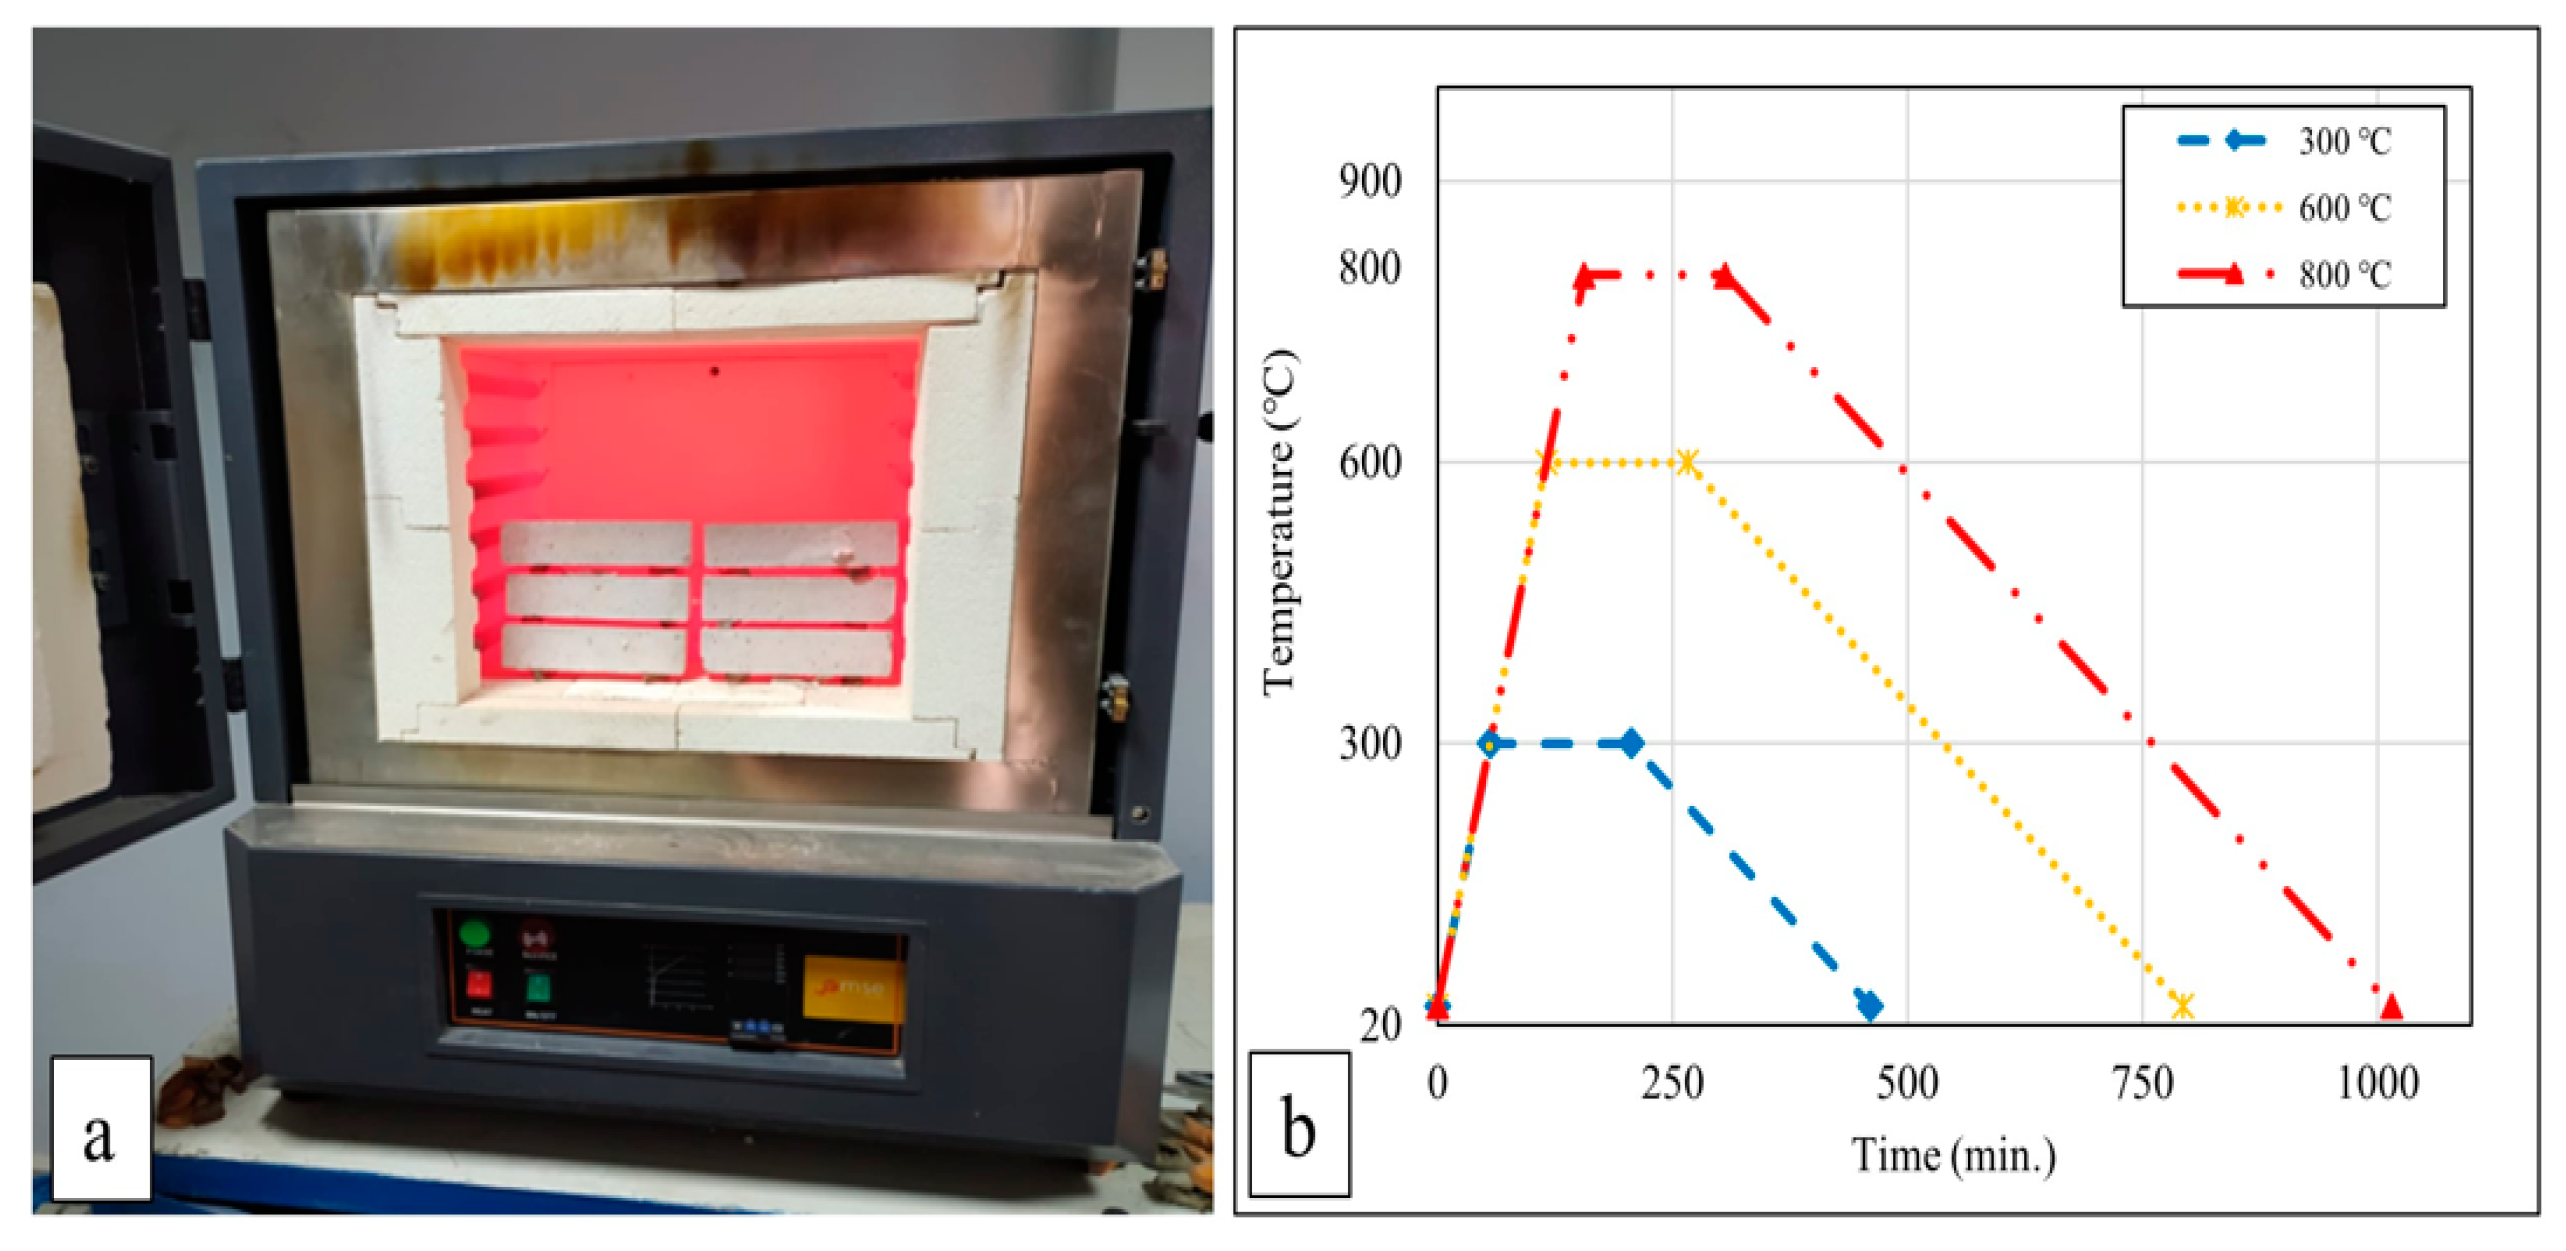
After 28 days of curing, the mortar samples were initially dried in an oven at 105 ± 5 °C for 24 h. Subsequently, the mortar samples were exposed to temperatures of 300 °C, 600 °C, and 800 °C. These target temperatures were determined considering the literature’s most commonly used high-temperature values [21,32,33,34]. When studies on the behavior of cement-based composites at high temperatures are examined, the following can be observed: if the temperature rises above 300 °C, decreases in strength begin to be seriously noticed [35], and when it reaches around 500 °C, calcium hydroxide (Ca(OH)2), which constitutes a large part of the hydrated products of concrete, begins to break down [36]. It has also been reported in studies that the calcium silicate hydrate (C-S-H) phase begins to decompose at 600 °C and that the C-S-H phase completely decomposes above 800–900 °C [37]. For this reason, it was thought that cementitious composites should be exposed to temperatures of 300 °C, 600 °C, and 800 °C within the scope of this study. The oven’s heating rate was set to 5 °C/min, and once the oven reached the target temperatures, the samples were subjected to these temperatures for 2 h and 30 min. At the end of this period, the samples underwent two different cooling regimes: cooling with air and with water. The oven’s heat source was turned off during air cooling, allowing the samples to reach ambient temperature. The temperature during air cooling decreased at an approximate rate of 1.1 °C/min. For water cooling of the samples exposed to high temperatures, water was directly sprayed onto them as they were removed from the oven. Figure 1a,b illustrate the oven and the heating–cooling regime used in this study. The furnace shown in Figure 1a can reach temperatures of up to 1400 °C. The samples were exposed to high temperatures in this furnace. The graph in Figure 1b shows the heating–cooling regimes of the samples. The furnace reached temperatures from 20 °C to 300, 600, and 800 °C at a constant rate, increasing by 5 °C per minute. The graph demonstrates that it was kept at these temperatures for 2 h and 30 min and then cooled down to 20 °C at a rate of 1.1 °C per minute.
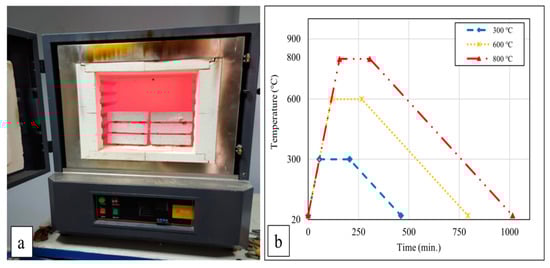
Figure 1.
Furnace (a) and heating–cooling regime (b).
The mortar samples’ unit weight (Uw) measurements were conducted according to the ASTM C642-13 [38] standard. One commonly used nondestructive testing method to determine the quality of mortars is the ultrasonic pulse velocity (UPV) test. The UPV measurements of the mortars were performed with a precision of 0.10 s following the ASTM C 597-16 [39] standard. The concrete quality classes based on UPV values are shown in Table 3 [40,41]. The flexural and compressive strengths of the prismatic mortar samples with dimensions of 40 × 40 × 160 mm were determined per EN 196-1 [31]. In the flexural strength (ffs) test, the specimens were tested at a loading rate of 50 ± 10 N/s. After the ffs test, the samples were split into two parts for the compressive strength (fcs) test. The loading rate of the fcs test apparatus was 2400 ± 200 N/s.
Table 3.
Quality of concrete as a function of the ultrasonic pulse velocity [40].
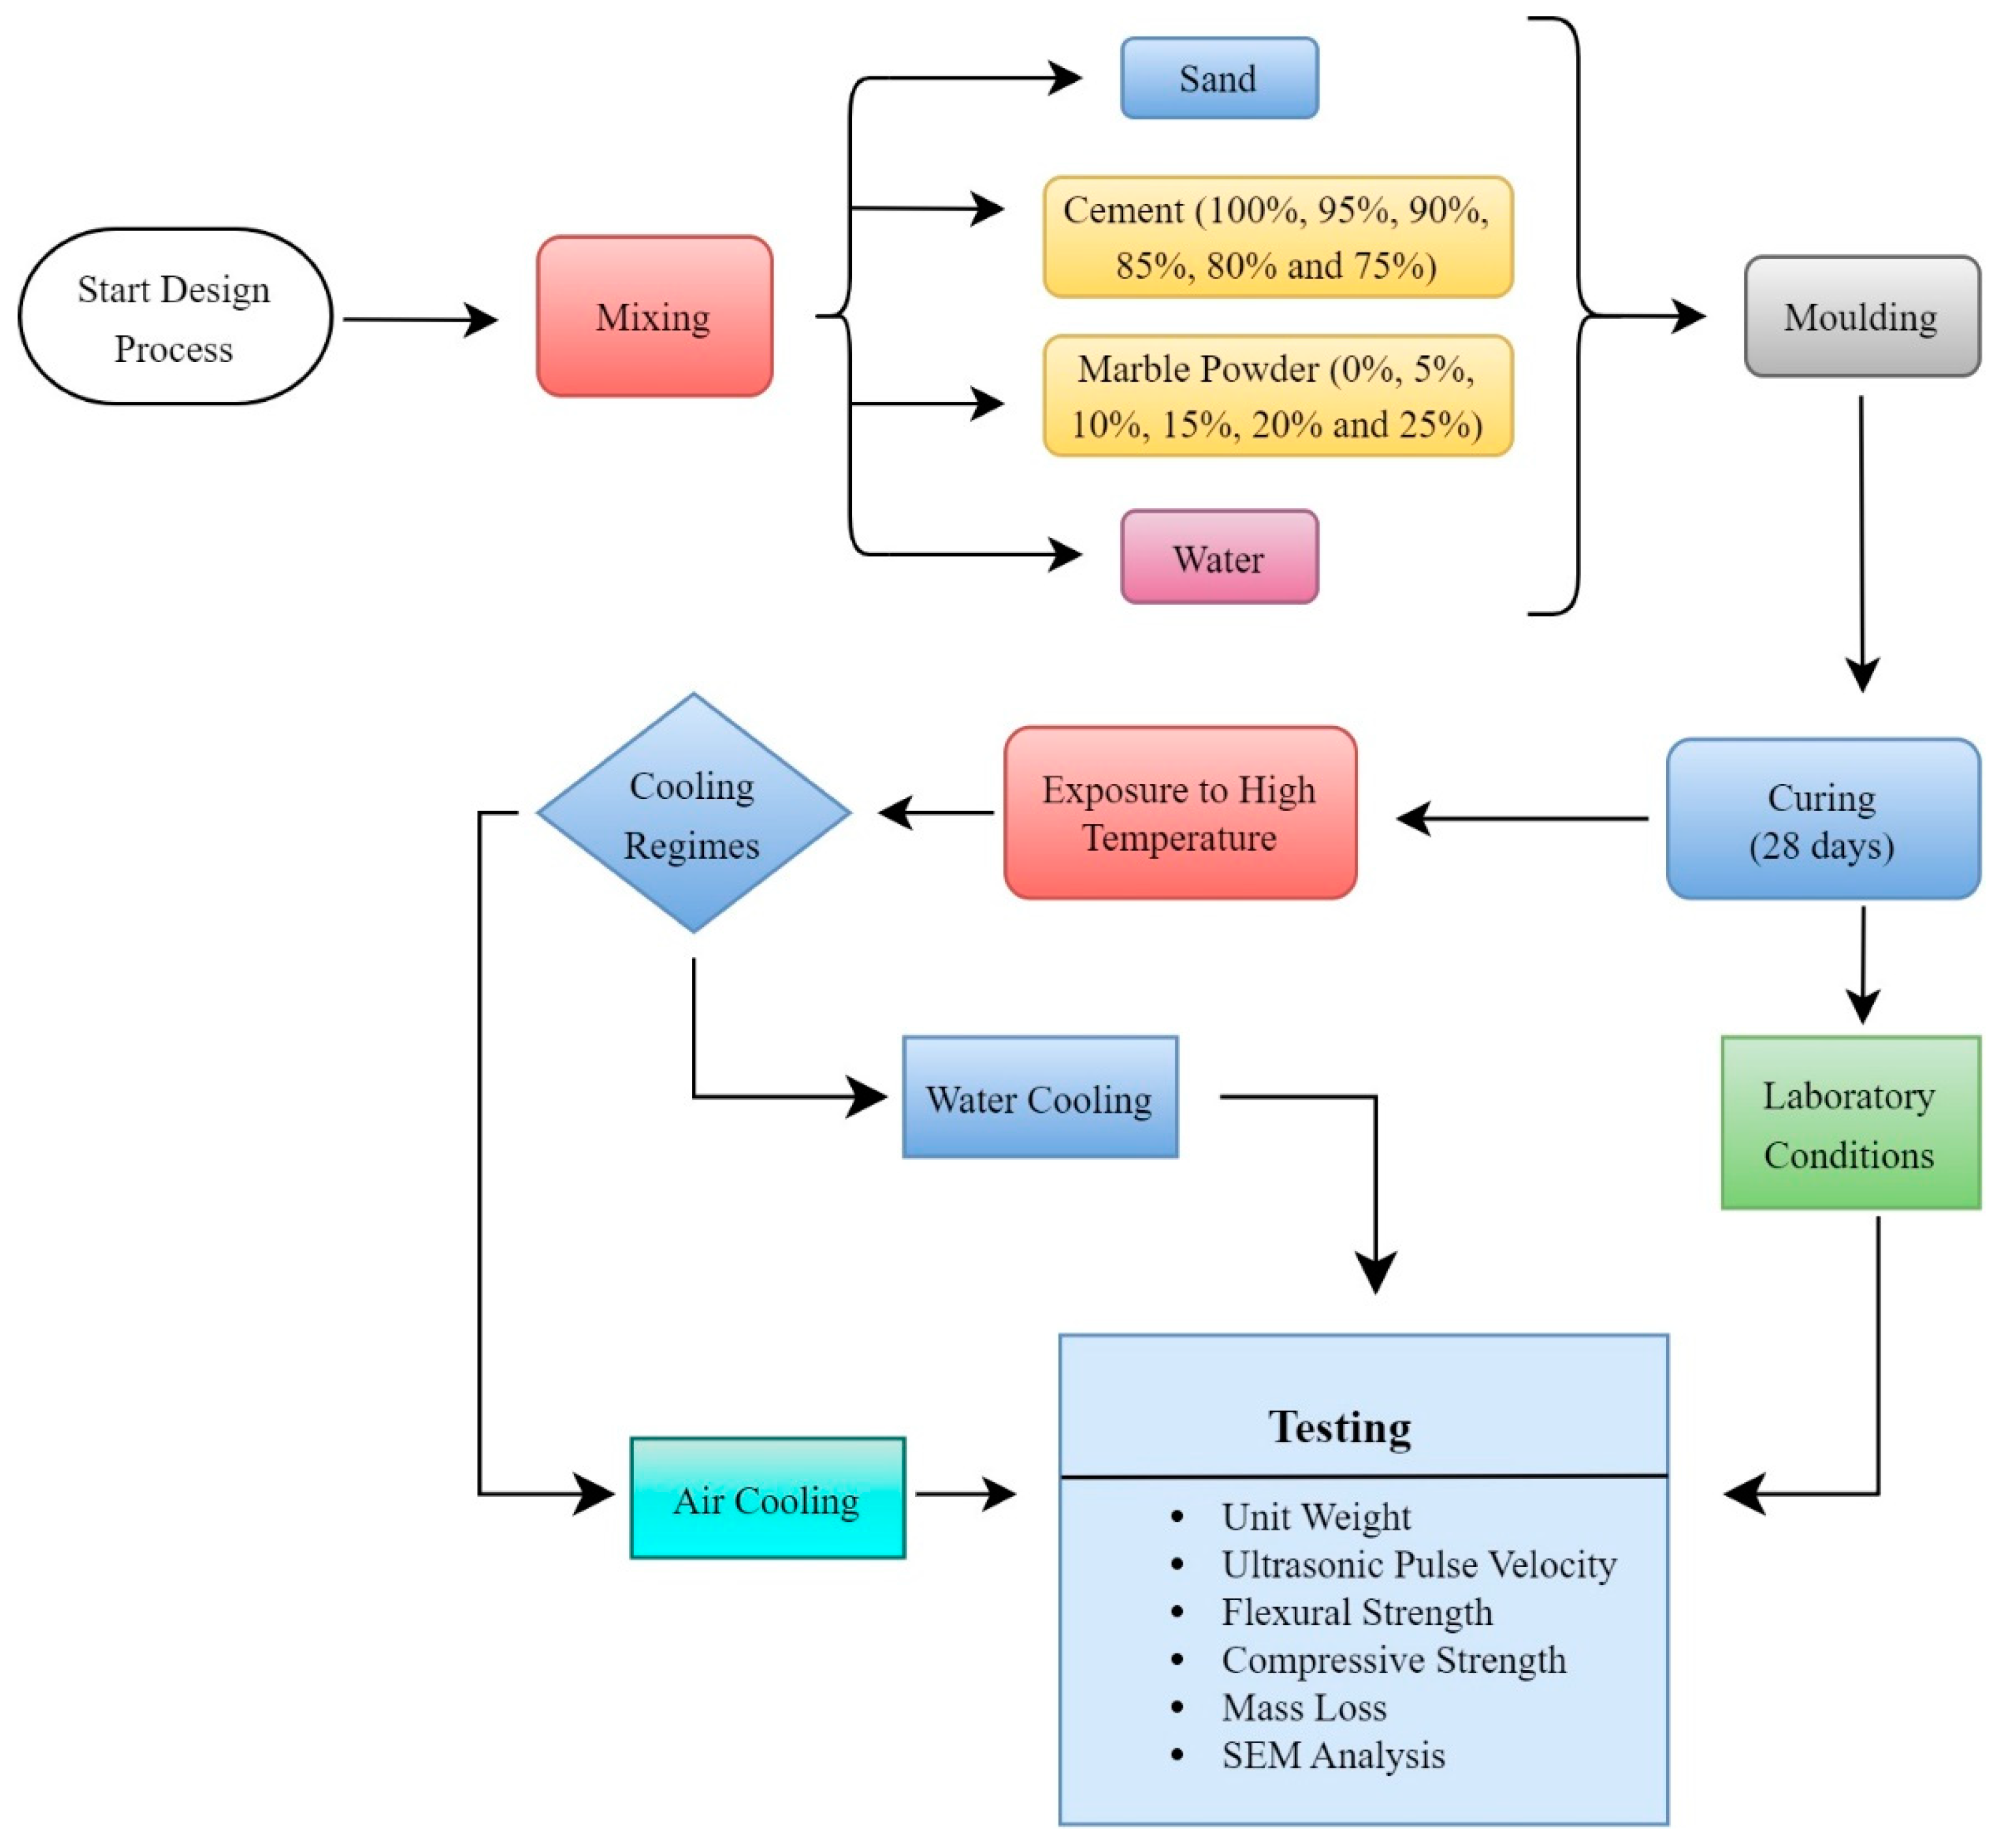
While measuring the mass losses of the samples, their masses were recorded before exposure to high temperatures and after the high-temperature and cooling regimes. Mass losses were calculated based on these measurements. Before conducting experiments on the samples cooled with water after exposure to high temperatures, these samples were dried for 24 h in an oven at a temperature of 105 ± 5 °C. The microstructure analysis of the mortar samples was conducted using a Zeiss EVO 40XP SEM device on small specimens obtained after the compressive strength test. The workflow diagram of the test procedure is shown in Figure 2. In Figure 2, the mixing, molding, and curing of the materials and the subsequent experimental studies are visually explained with a workflow diagram. In the presented workflow chart, it can be seen that after curing, some of the samples were tested under laboratory conditions, some were tested via cooling in air after being exposed to high temperatures, and the other parts were tested via cooling with water after being exposed to high temperatures.
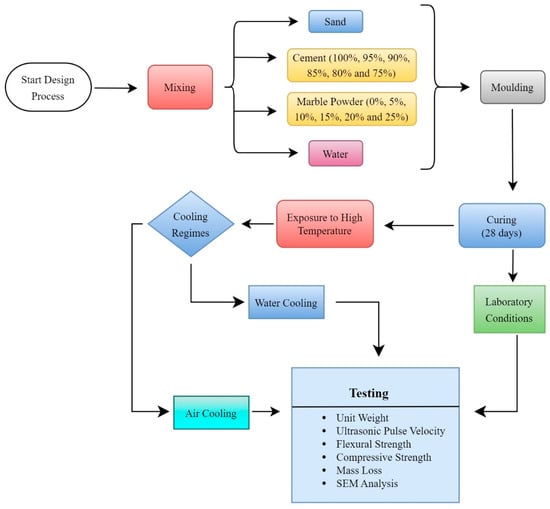
Figure 2.
Mixture design procedure and experimental flowchart.
3. Results and Discussion
3.1. Unit Weight
This section presents the mortar samples’ Uw (unit weight) findings. In the first part, the samples tested in the laboratory environment (20 °C) were compared with those air-cooled after high-temperature exposure. In the second part, the samples tested in the laboratory environment (20 °C) were compared with the water-cooled samples after high-temperature exposure. In the third part, the samples air-cooled and water-cooled after exposure to high temperatures were compared.
3.1.1. The Uw Findings for the Samples Air-Cooled after High-Temperature Exposure
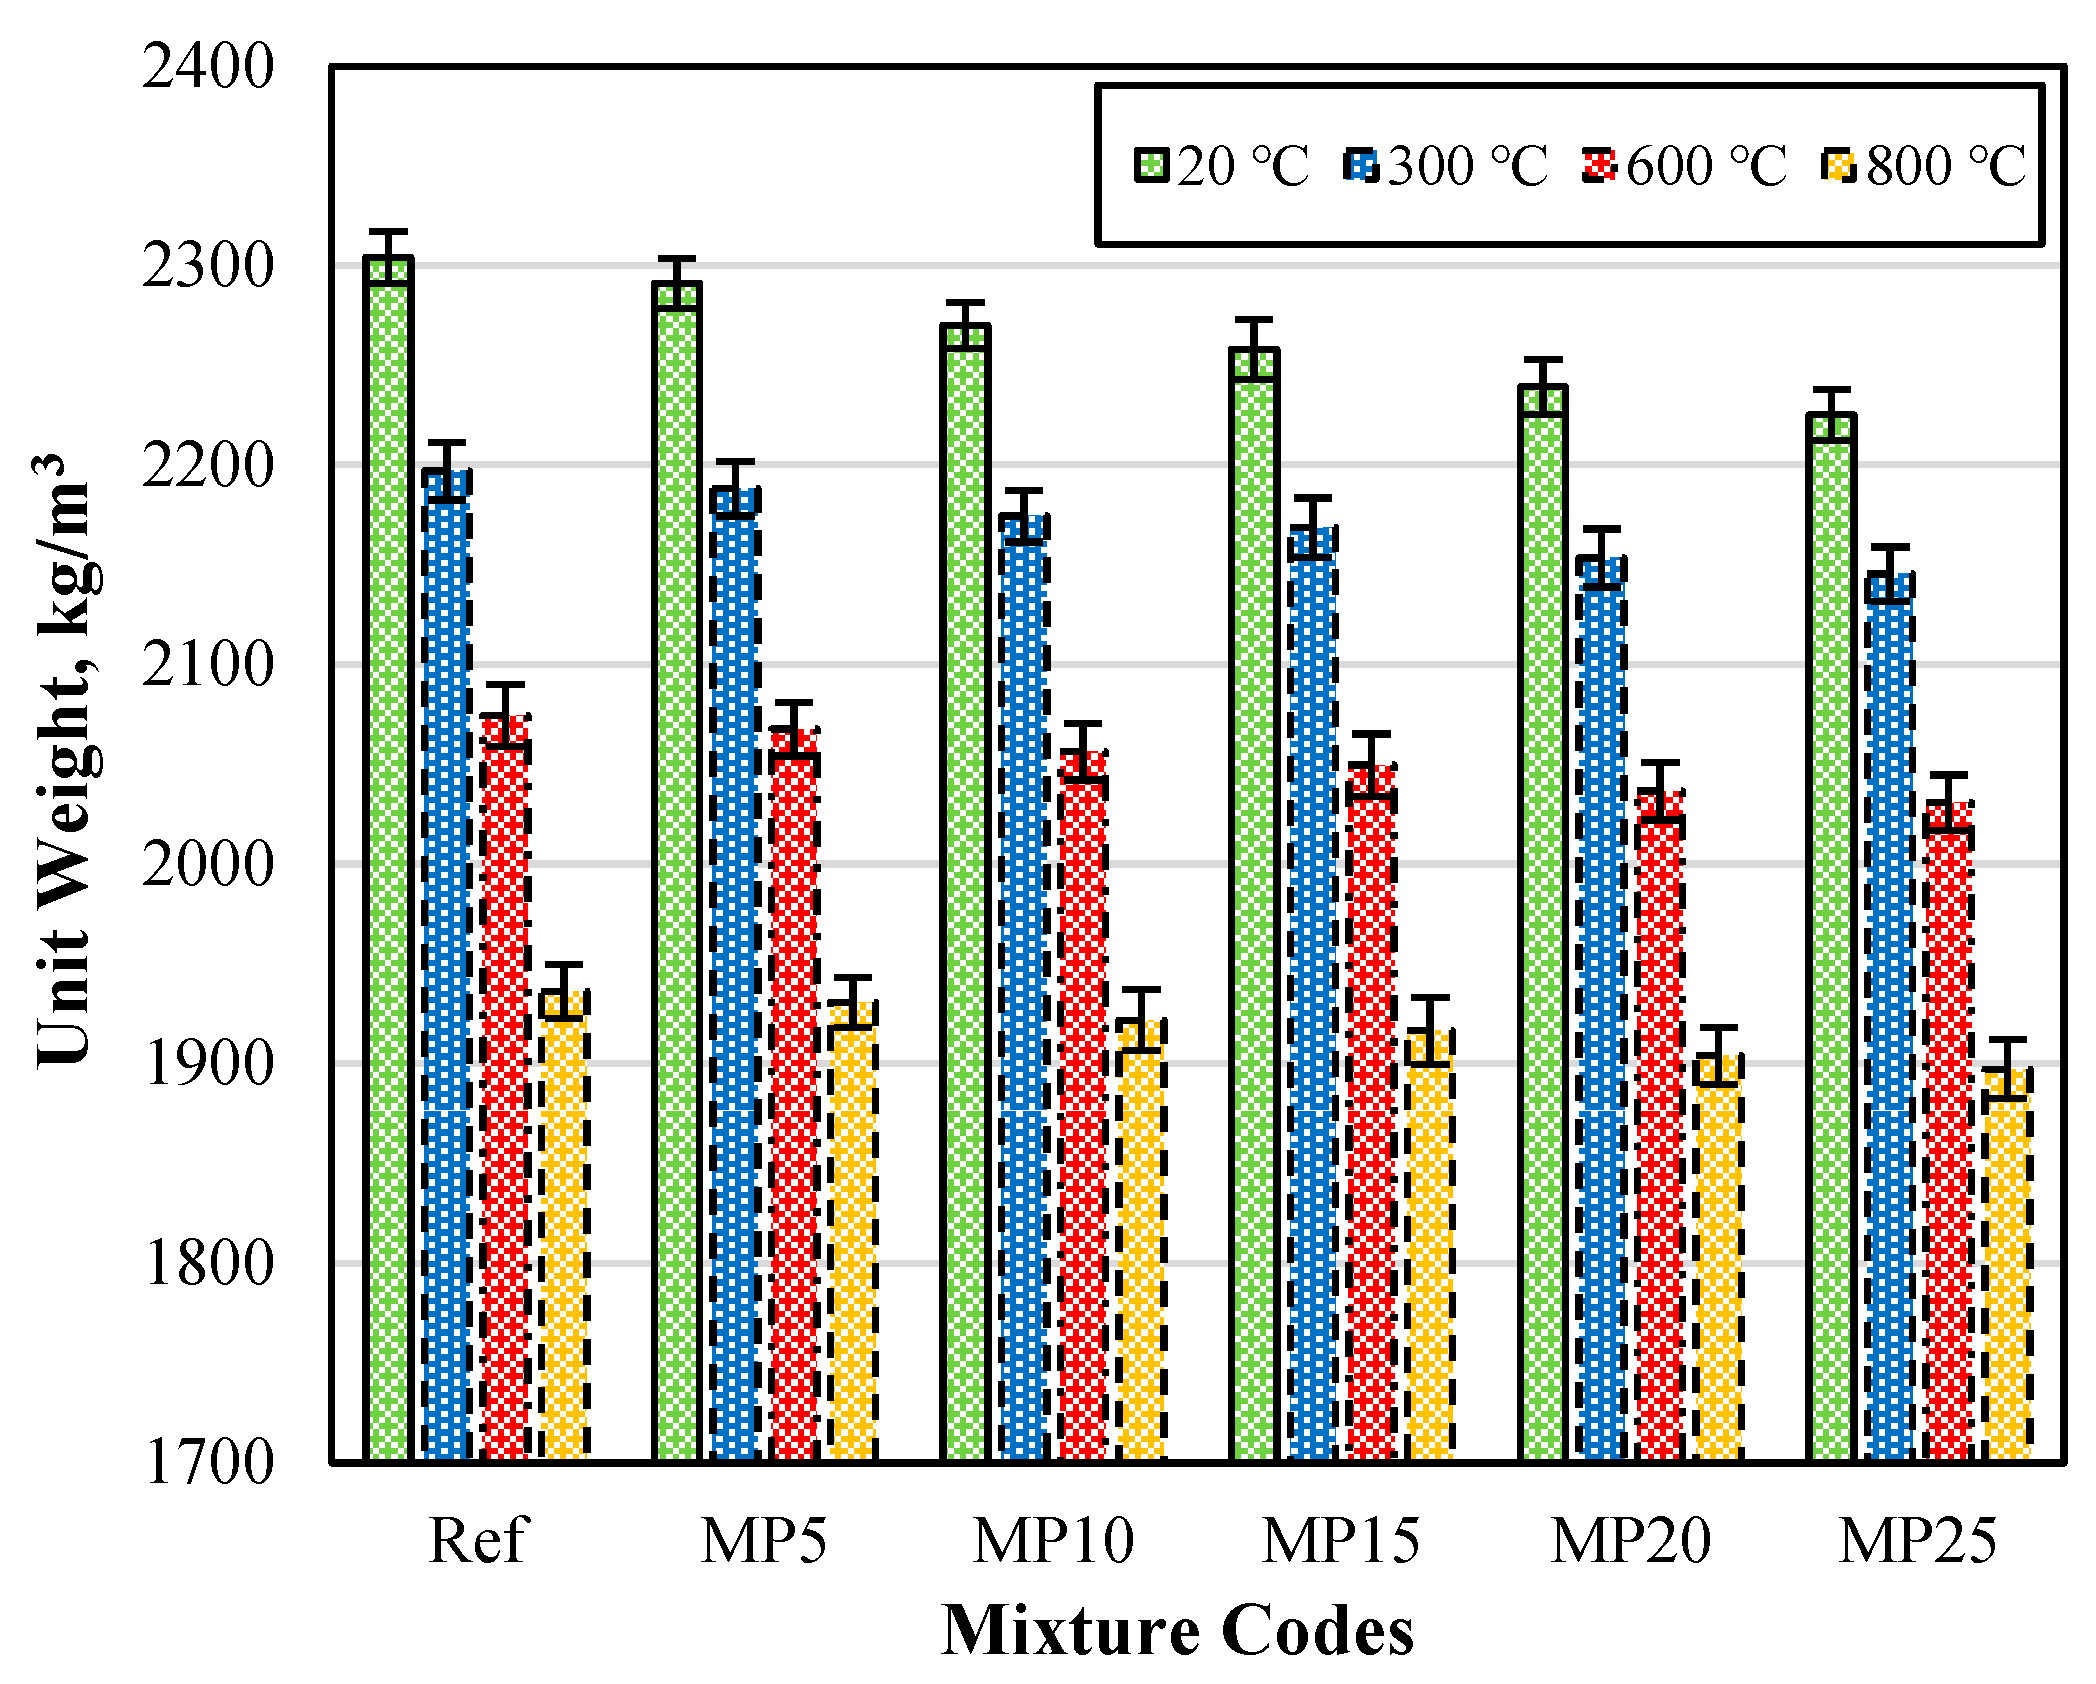
The Uw (unit weight) values of the samples air-cooled after exposure to high temperatures are presented in Figure 3. When examining the Uw values of the mortar samples tested in the laboratory environment (20 °C), it can be observed that they vary between 2304 kg/m3 and 2225 kg/m3. It was evident that as the MP substitution ratio increases in the mixtures, the Uw values decrease. This can be attributed to the lower specific gravity of MP compared with cement [29,42]. Upon analyzing Figure 3, it was observed that the Uw values decrease as the temperature increases. The Uw values of the samples subjected to temperatures of 20 °C, 300 °C, 600 °C, and 800 °C varied in the ranges of 2304–2225 kg/m3, 2197–2145 kg/m3, 2075–2031 kg/m3, and 1936–1897 kg/m3, respectively.
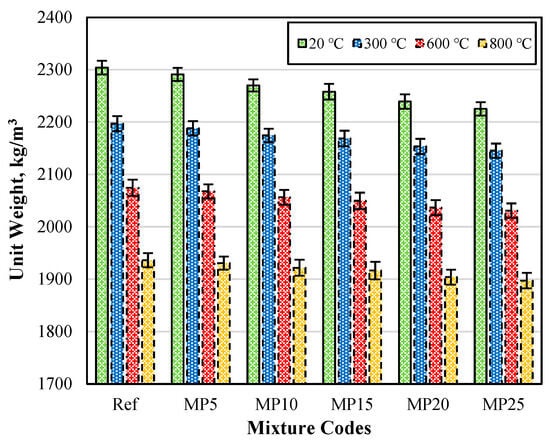
Figure 3.
The Uw values of the samples air-cooled after high-temperature exposure.
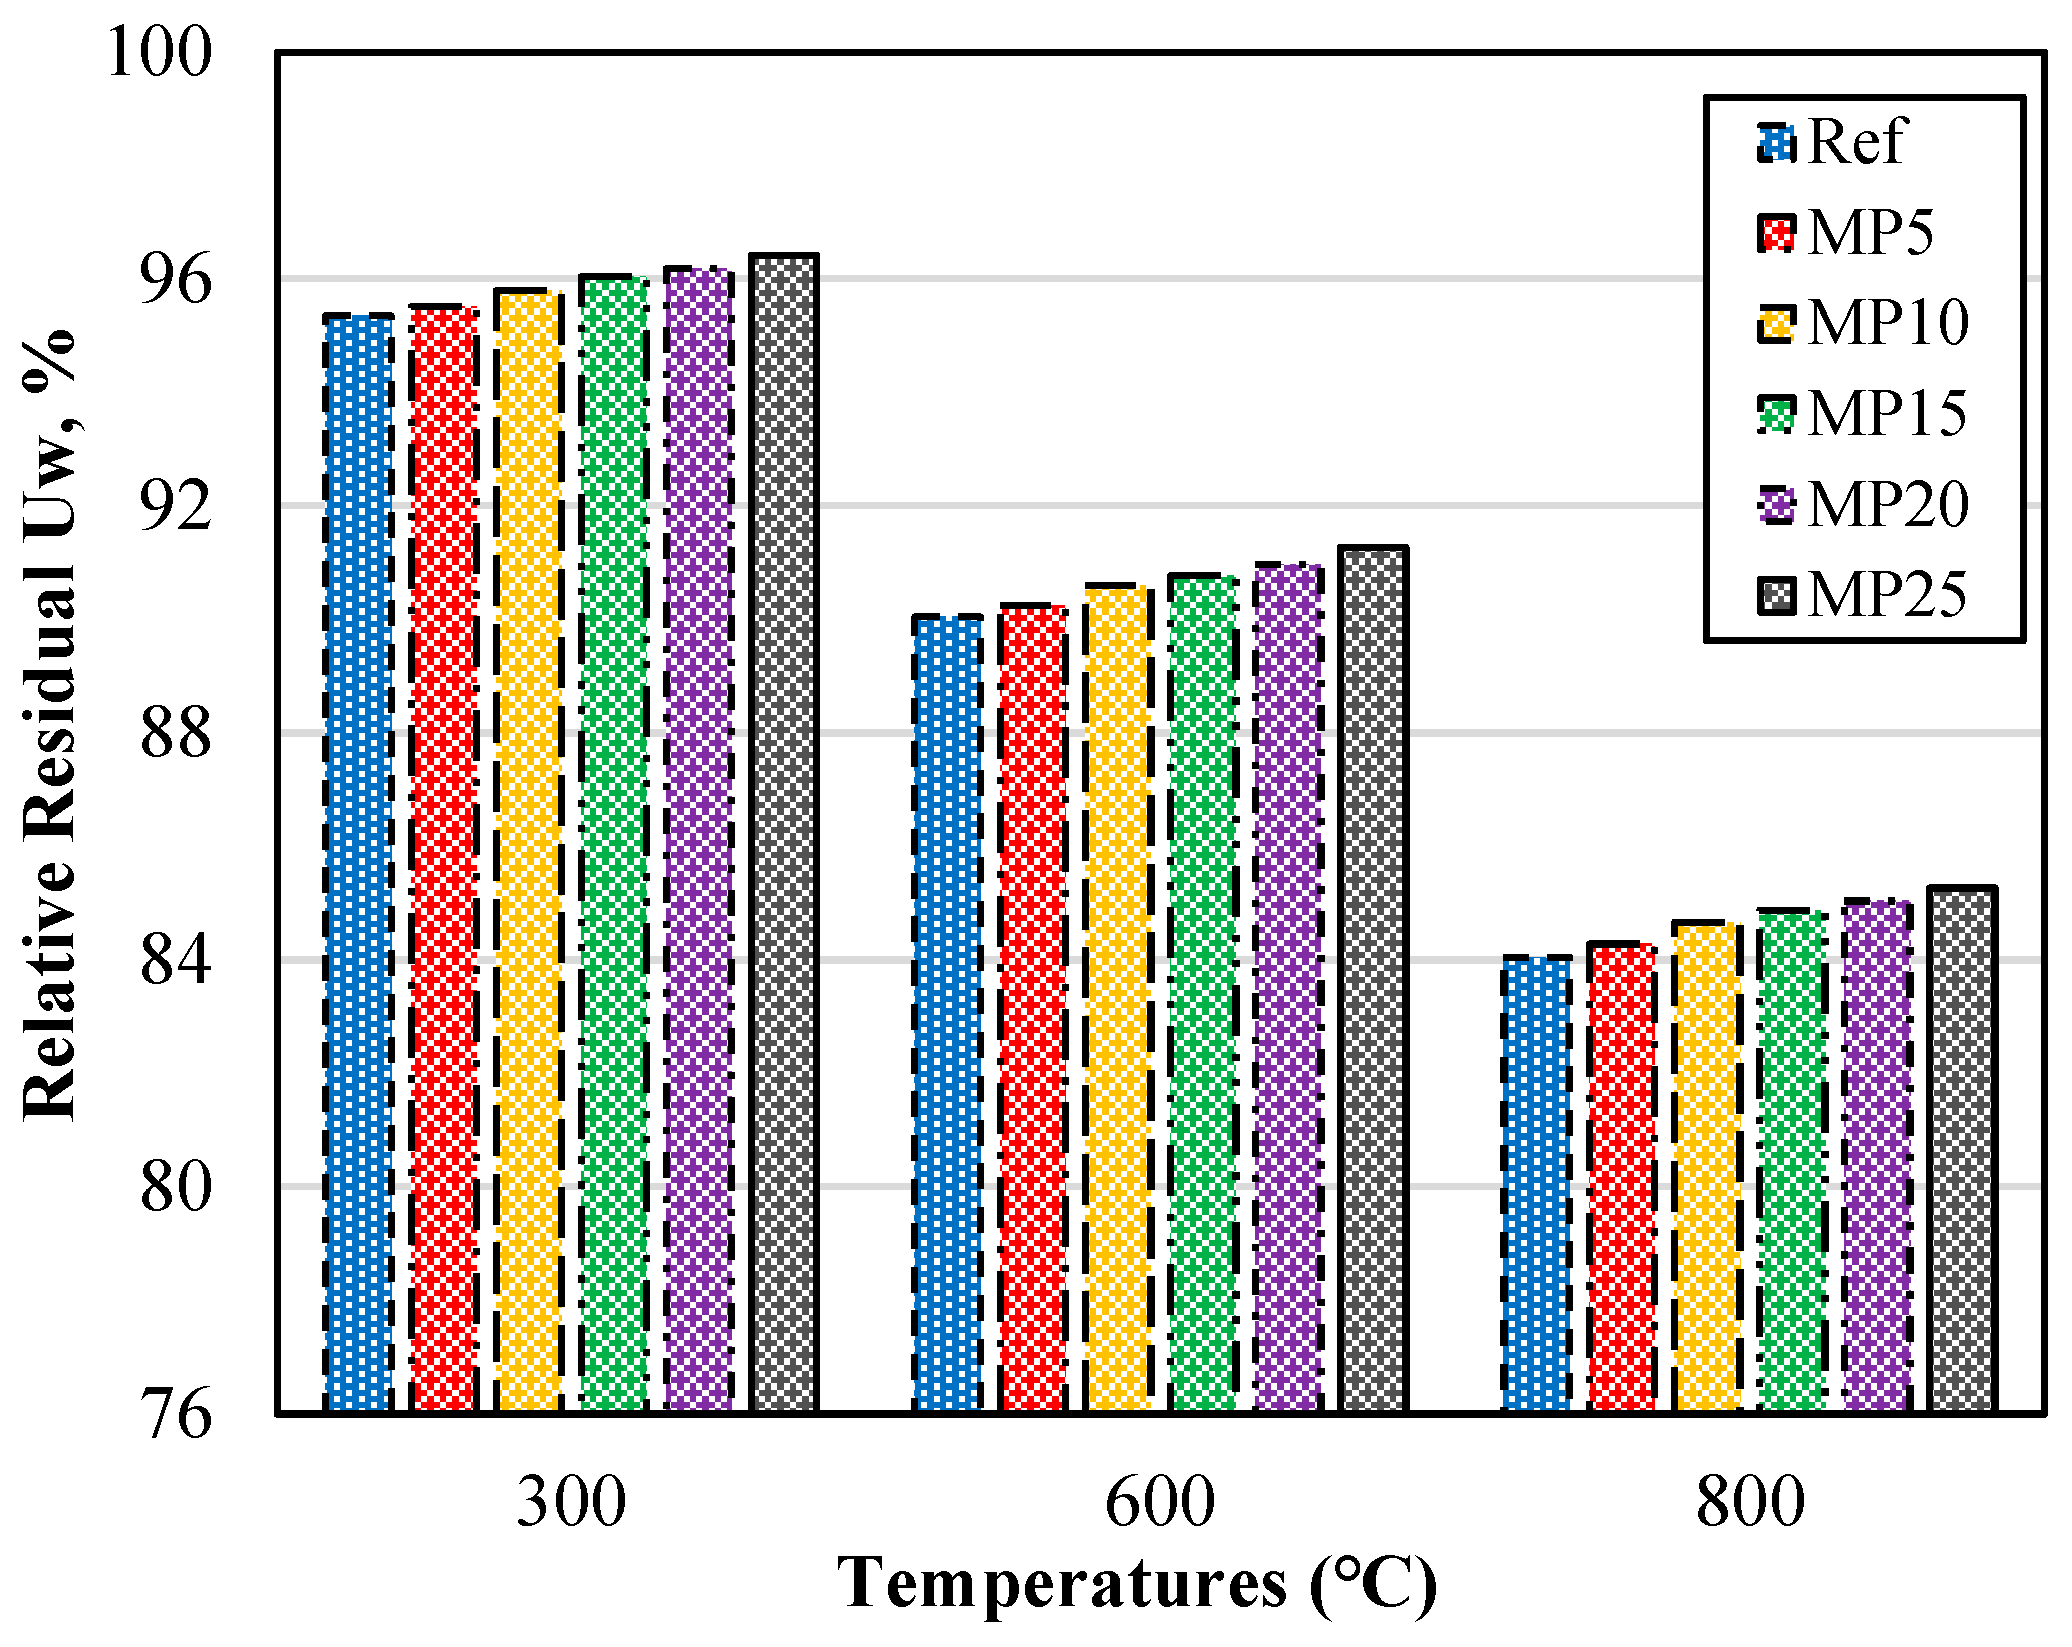
The relative residual Uw percentages of the samples exposed to high temperatures are presented in Figure 4 as a percentage of the Uw values of the samples tested at laboratory conditions (20 °C). The relative residual Uw percentages showed a decrease as the temperature values increased. For the mortar samples exposed to temperatures of 300, 600, and 800 °C, the relative residual Uw percentages were 95.35–96.42%, 90.04–91.27%, and 84.04–85.27%, respectively.

Figure 4.
Relative residual Uw of mortars with air cooling.
The decrease in the relative residual Uw values of the samples after exposure to 300 °C can be attributed to the evaporation of capillary water between the layers of the mortar matrix. As the temperature exceeds 300 °C, the decrease in Uw values can be attributed to the dissociation of cement components due to the high-temperature effect and the evaporation of bound water in these components. Regardless of the temperature, the relative residual Uw values increased as the MP substitution ratio increased. This phenomenon can be related to the potential pozzolanic reaction of MP and the lower content of calcium hydroxide (CH) in MP-based mortars at higher temperatures [43].
3.1.2. The Uw Findings for Samples Cooled with Water after Exposure to High Temperatures
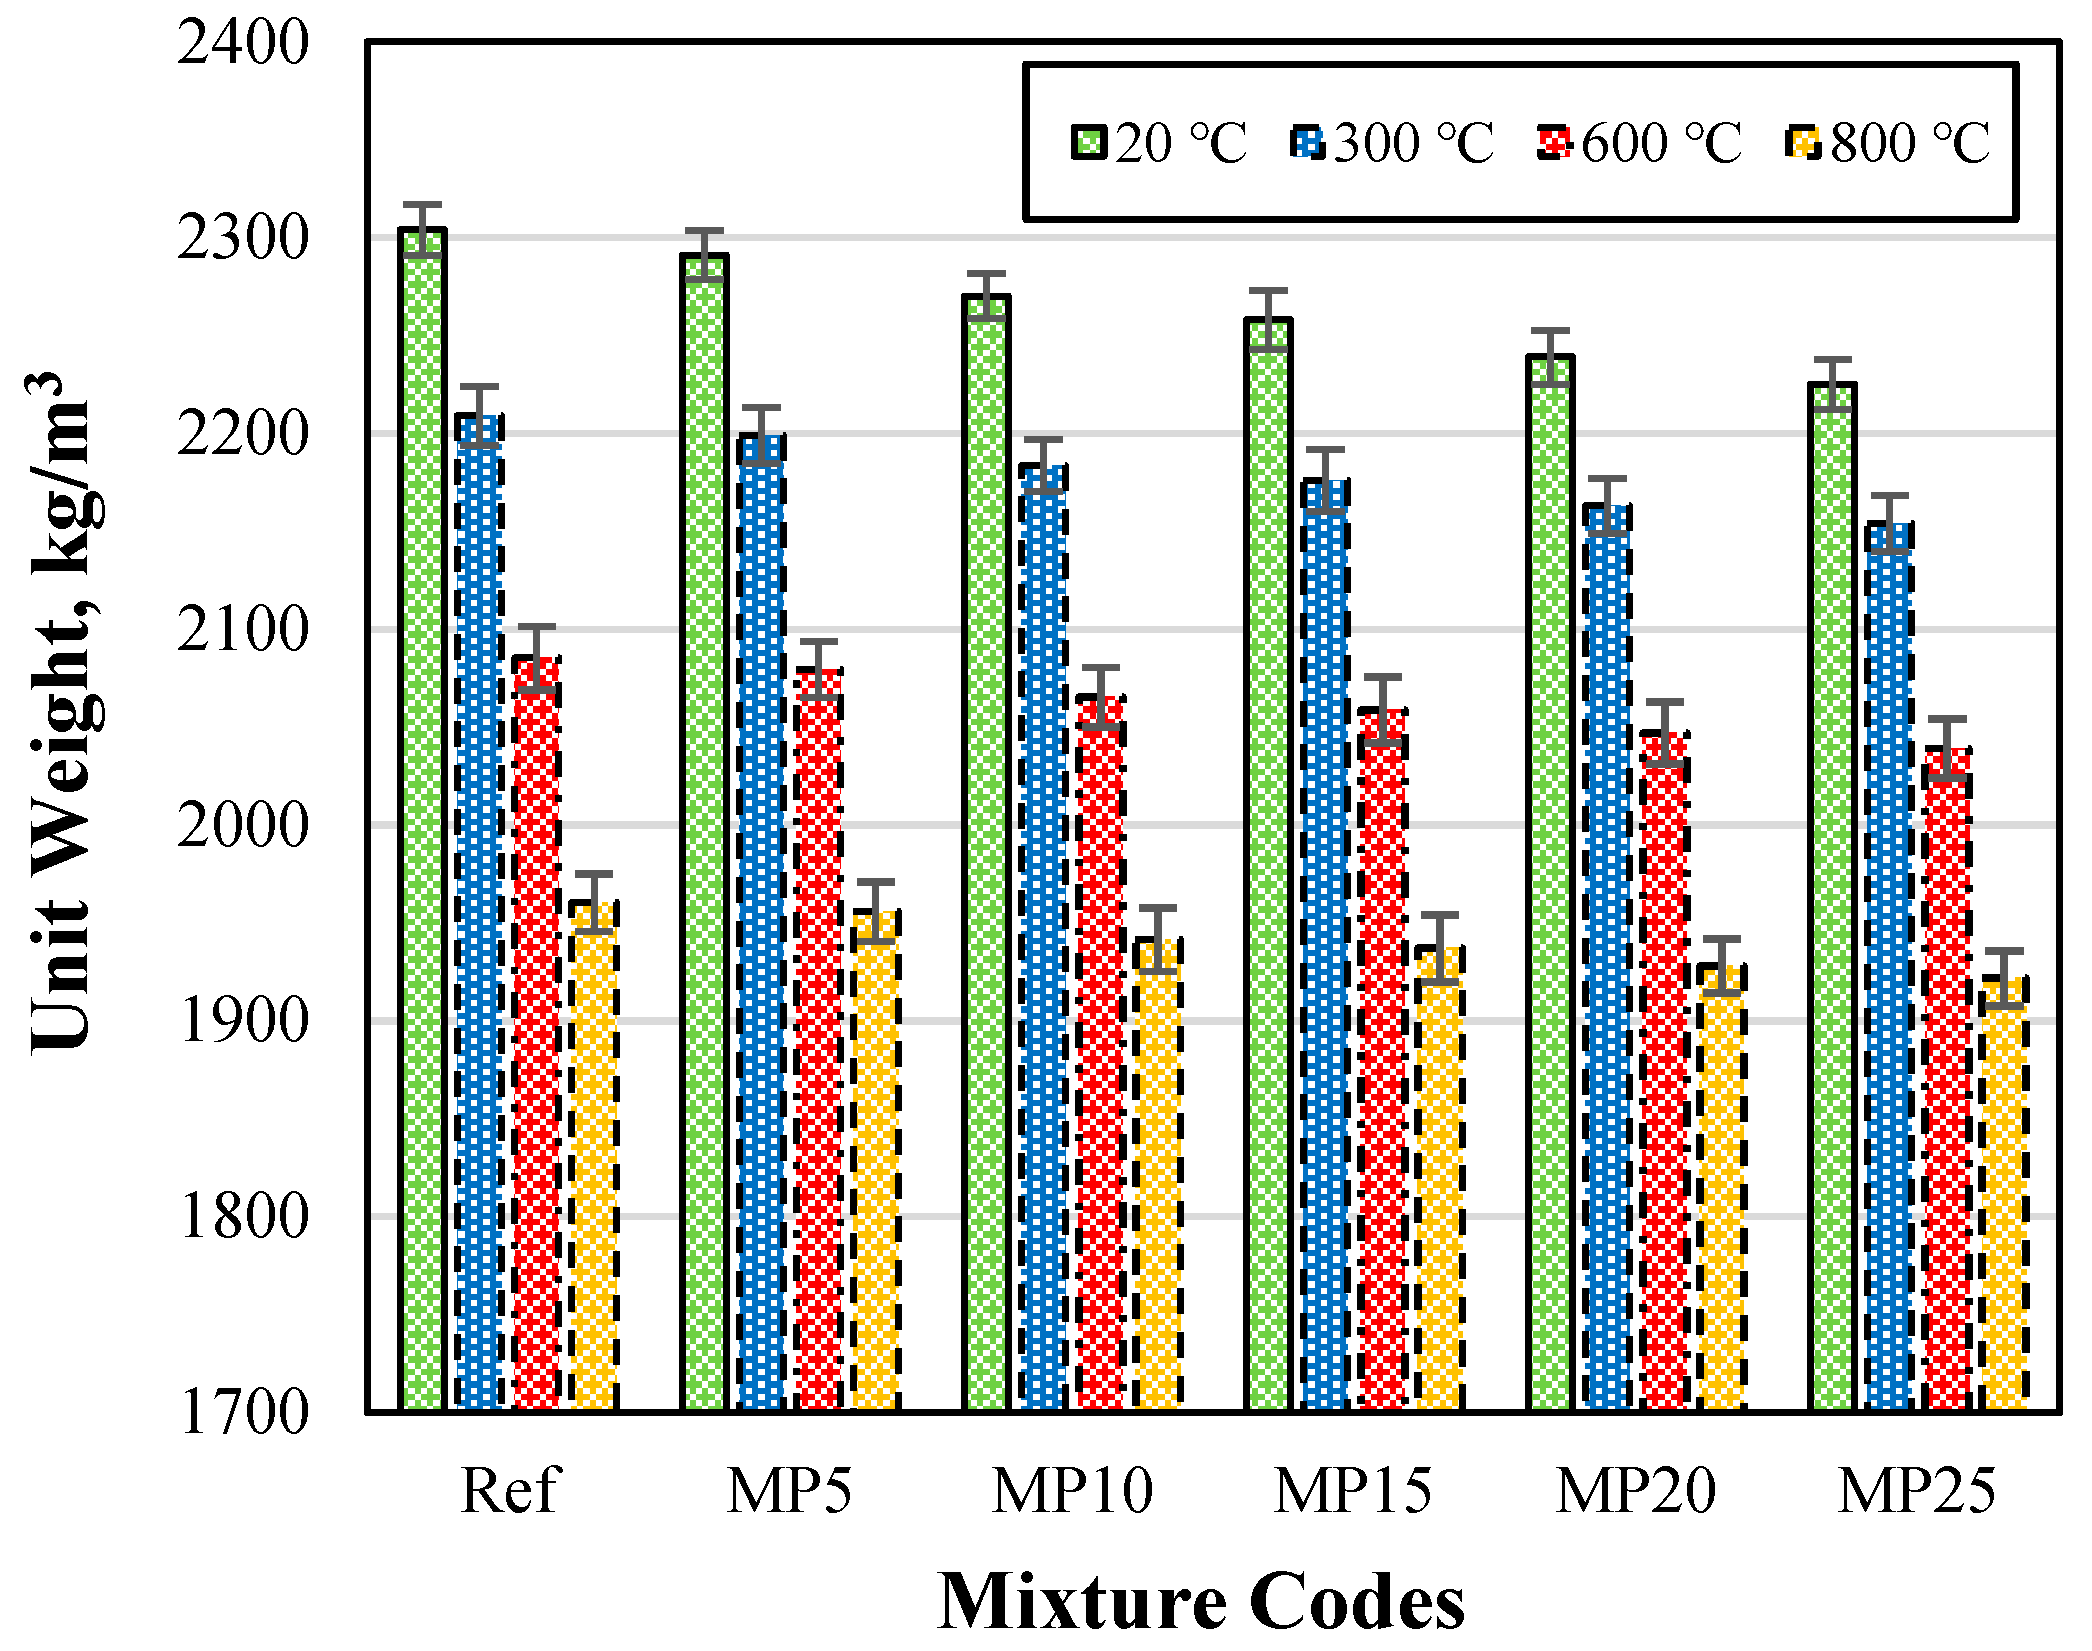
The Uw values of samples cooled with water after exposure to high temperatures are presented in Figure 5. The Uw values of mortar samples cooled with water after high-temperature exposure were lower than those of samples tested in the laboratory environment (20 °C). After exposure to temperatures of 300 °C, 600 °C, and 800 °C, the Uw values of the samples were in the ranges of 2154–2209 kg/m3, 2039–2085 kg/m3, and 1922–1960 kg/m3, respectively.
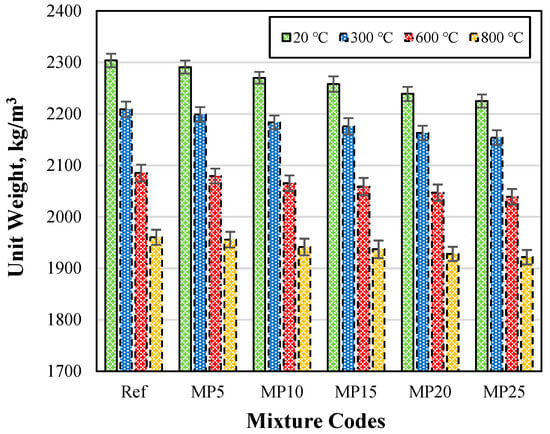
Figure 5.
The Uw values of samples cooled with water after exposure to high temperatures.
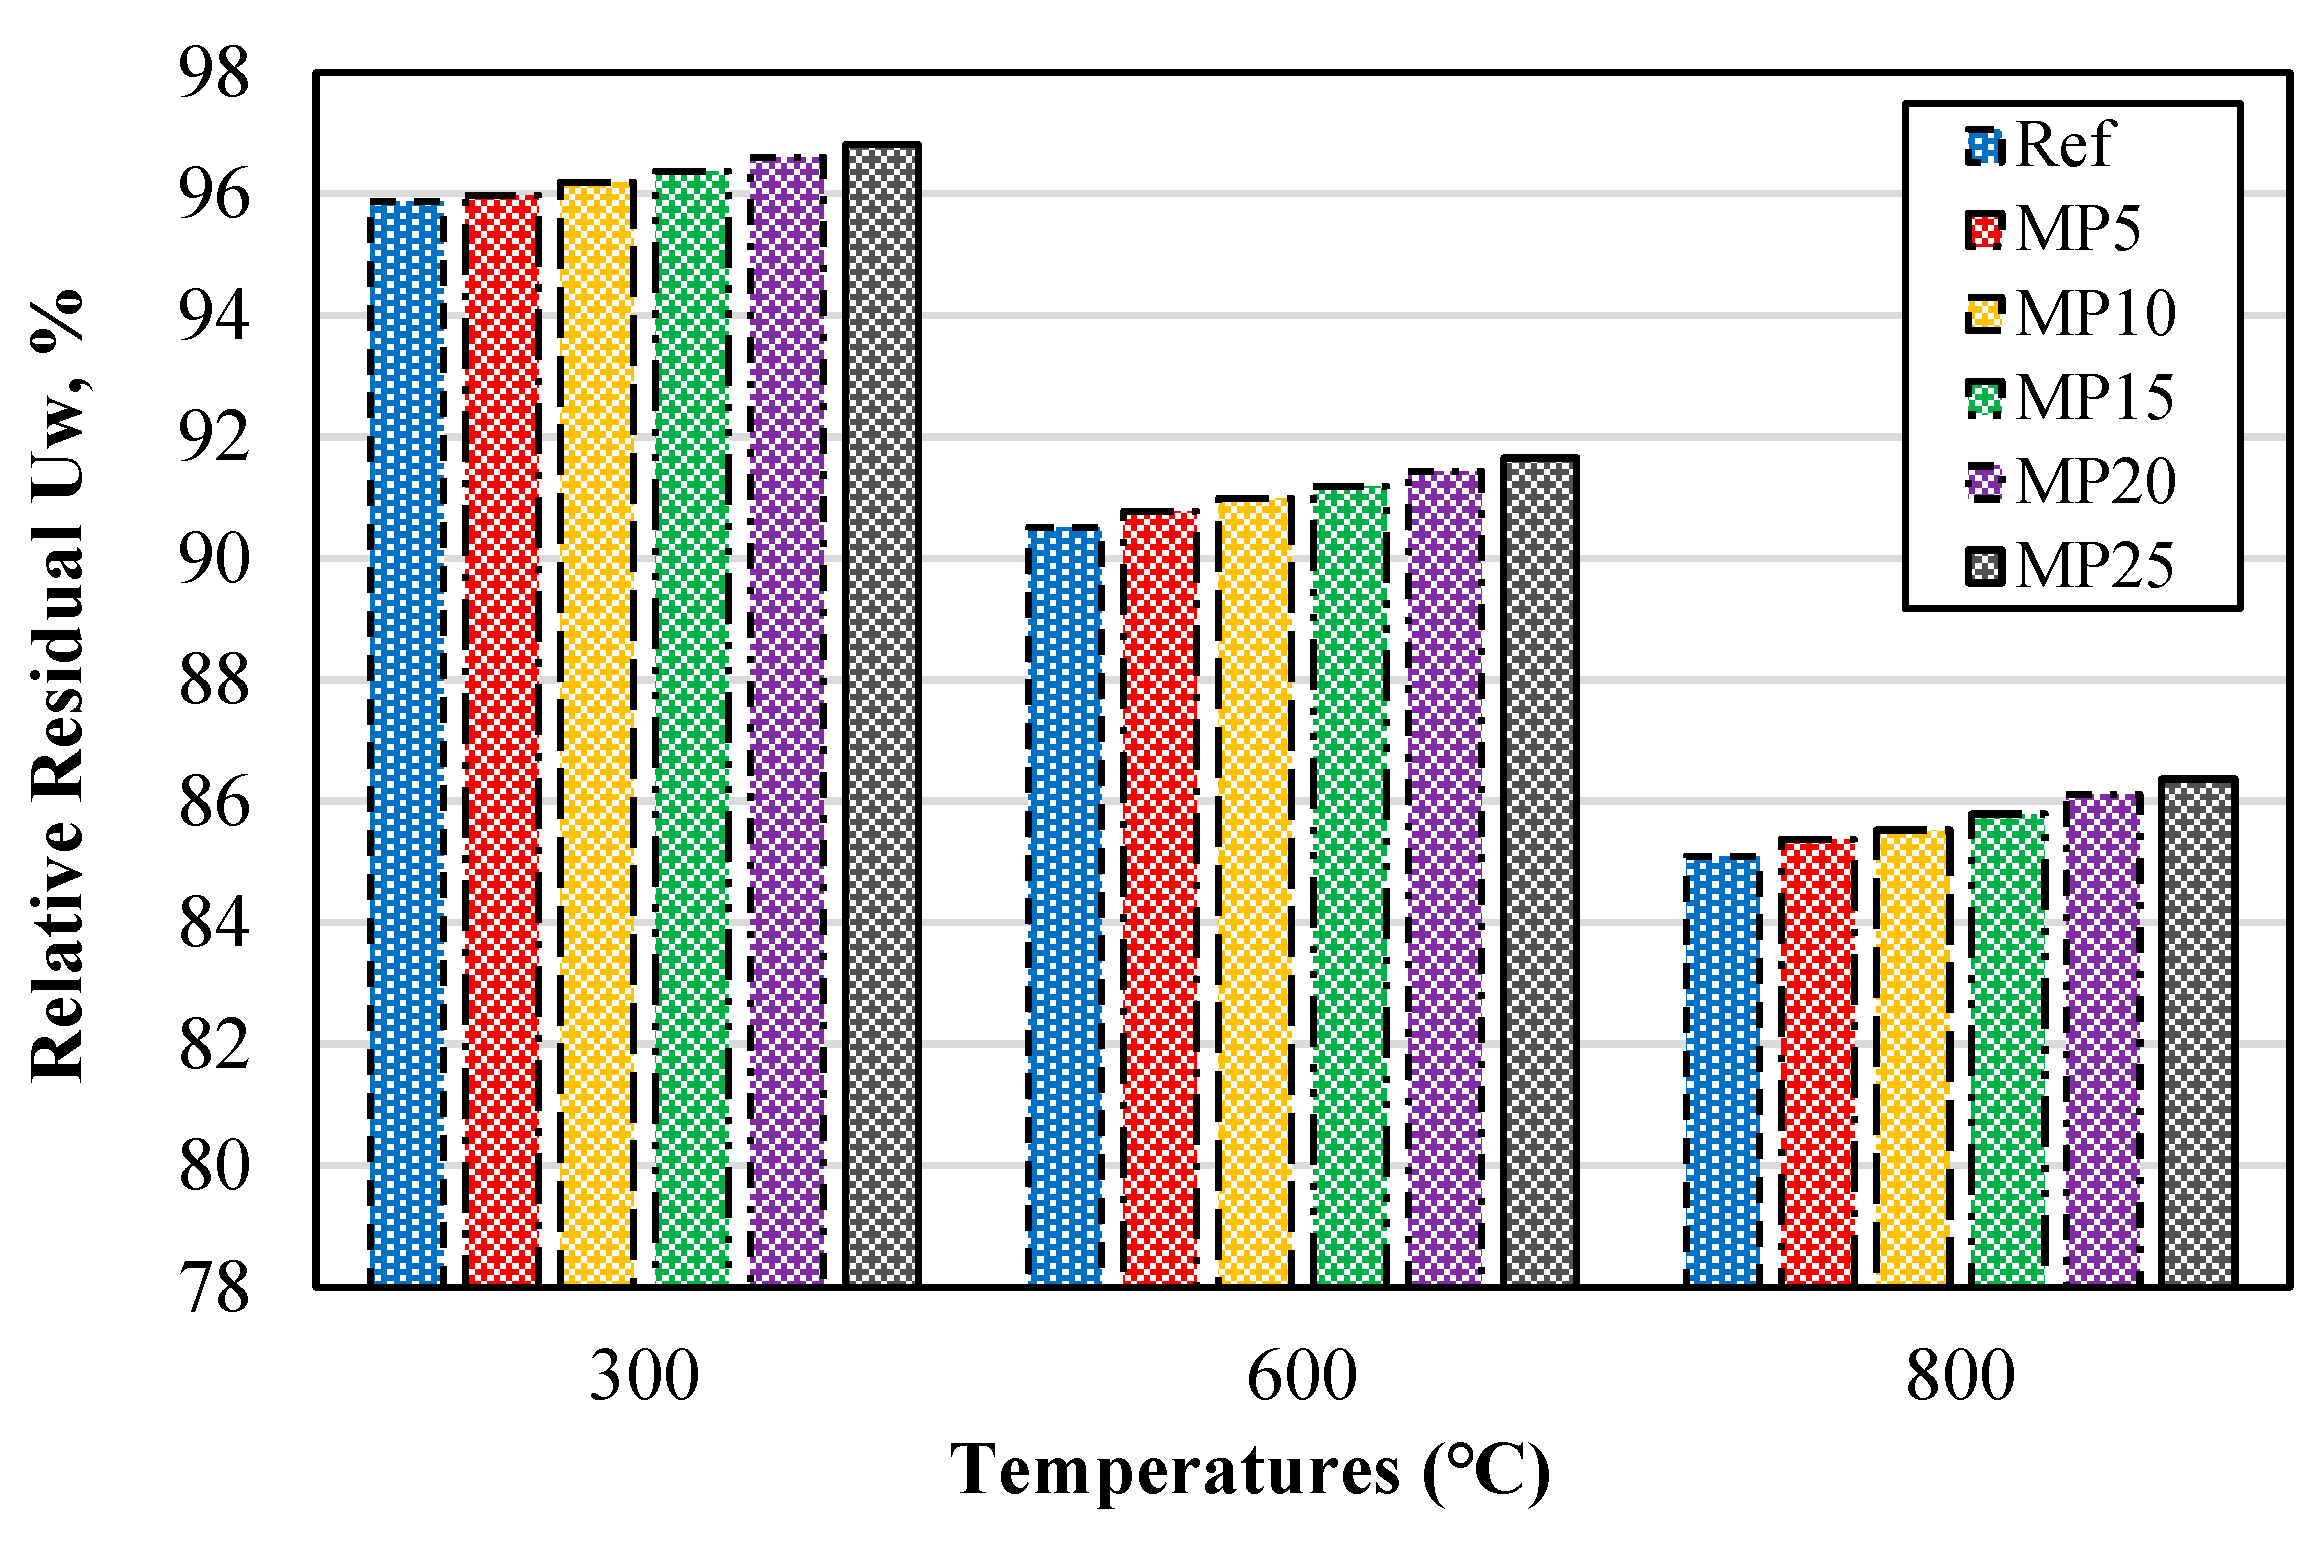
The relative residual Uw percentages of samples exposed to high temperatures are presented in Figure 6. The relative residual Uw percentages decreased as the temperature increased. These results exhibited a similar trend to those observed in samples cooled in air. For the mortar samples exposed to temperatures of 300 °C, 600 °C, and 800 °C, the relative residual Uw percentages were found to be in the ranges of 95.87–96.81%, 90.51–91.65%, and 85.09–86.37%, respectively.
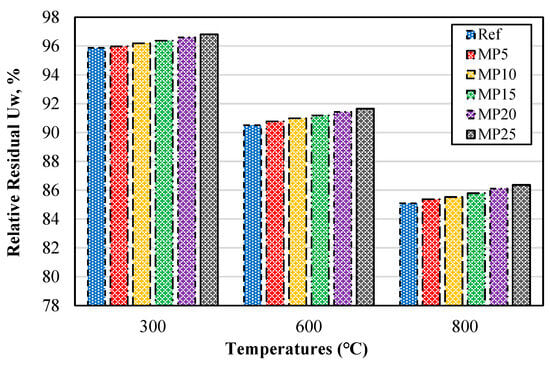
Figure 6.
Relative residual Uw of mortars with water cooling.
Similar to the samples cooled in air, it was observed that regardless of the temperature, an increase in the MP substitution rate resulted in higher relative residual Uw values. The reason for the higher relative residual Uw values of MP-blended mortars compared with reference mortars is attributed to the pozzolanic reaction of MP and the fact that MP-blended mortars contain a lower amount of Ca(OH)2 compared with reference mortars [43]. A similar trend in the Uw values of samples cooled with water was also observed in the study conducted by Alakara et al. [37].
3.1.3. Comparison of Uw Findings for Samples Cooled in Air and Water after High-Temperature Exposure
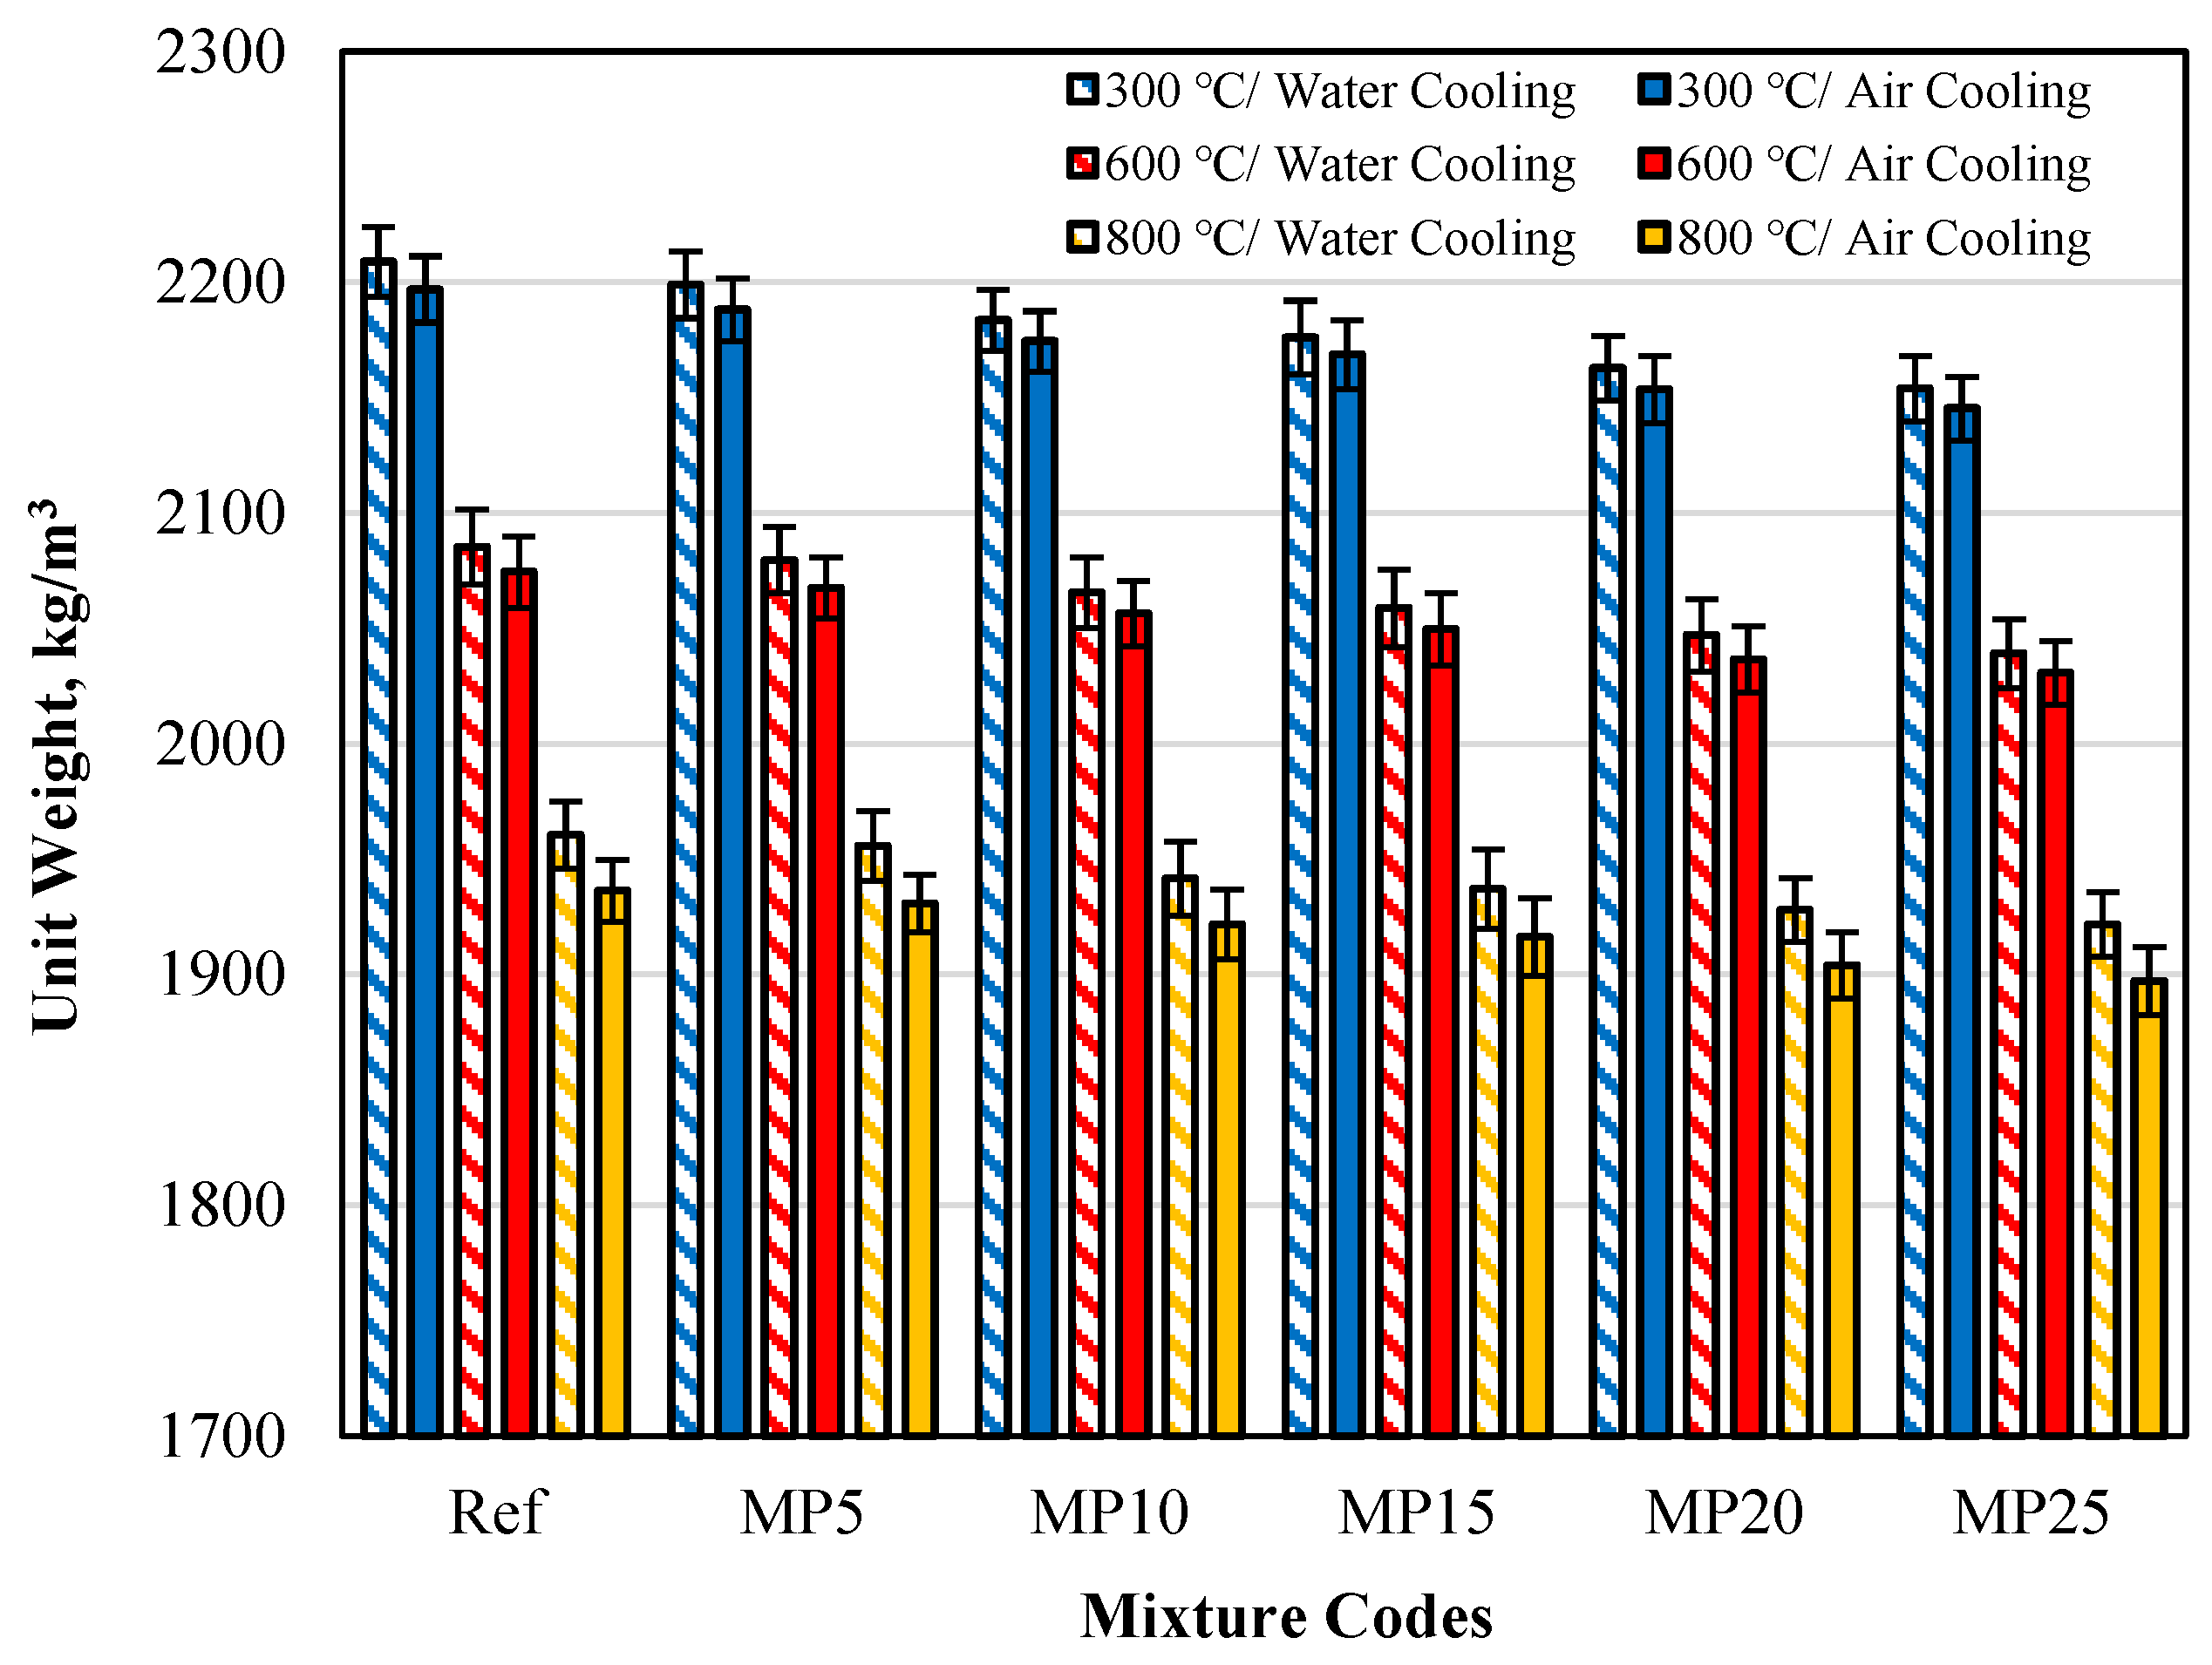
The unit weights of samples cooled in air and water after high-temperature exposure are presented in Figure 7. It can be observed that the measured Uw results for both cooling regimes were lower than those of the samples tested in the laboratory environment (20 °C).
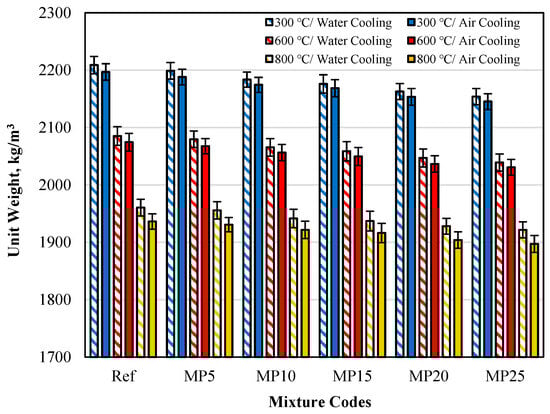
Figure 7.
The Uw values of samples cooled in air and water after high-temperature exposure.
The Uw values of samples cooled in the air were higher than those cooled in water. This phenomenon has been expressed in similar studies in the literature as follows: The CH (calcium hydroxide) present in mortar samples undergoes dehydration and converts to CaO (calcium oxide) after high-temperature exposure. When the samples are cooled with water, CaO undergoes rehydration. Rehydration of CaO binds water and increases the mass of the sample. Therefore, when the samples are cooled with water, the mass losses are lower than in air cooling, resulting in higher Uw values [23]. The obtained results align with the study conducted by Alakara et al. [37].
3.2. Ultrasonic Pulse Velocity (UPV)
3.2.1. The UPV Findings for Air-Cooled Samples
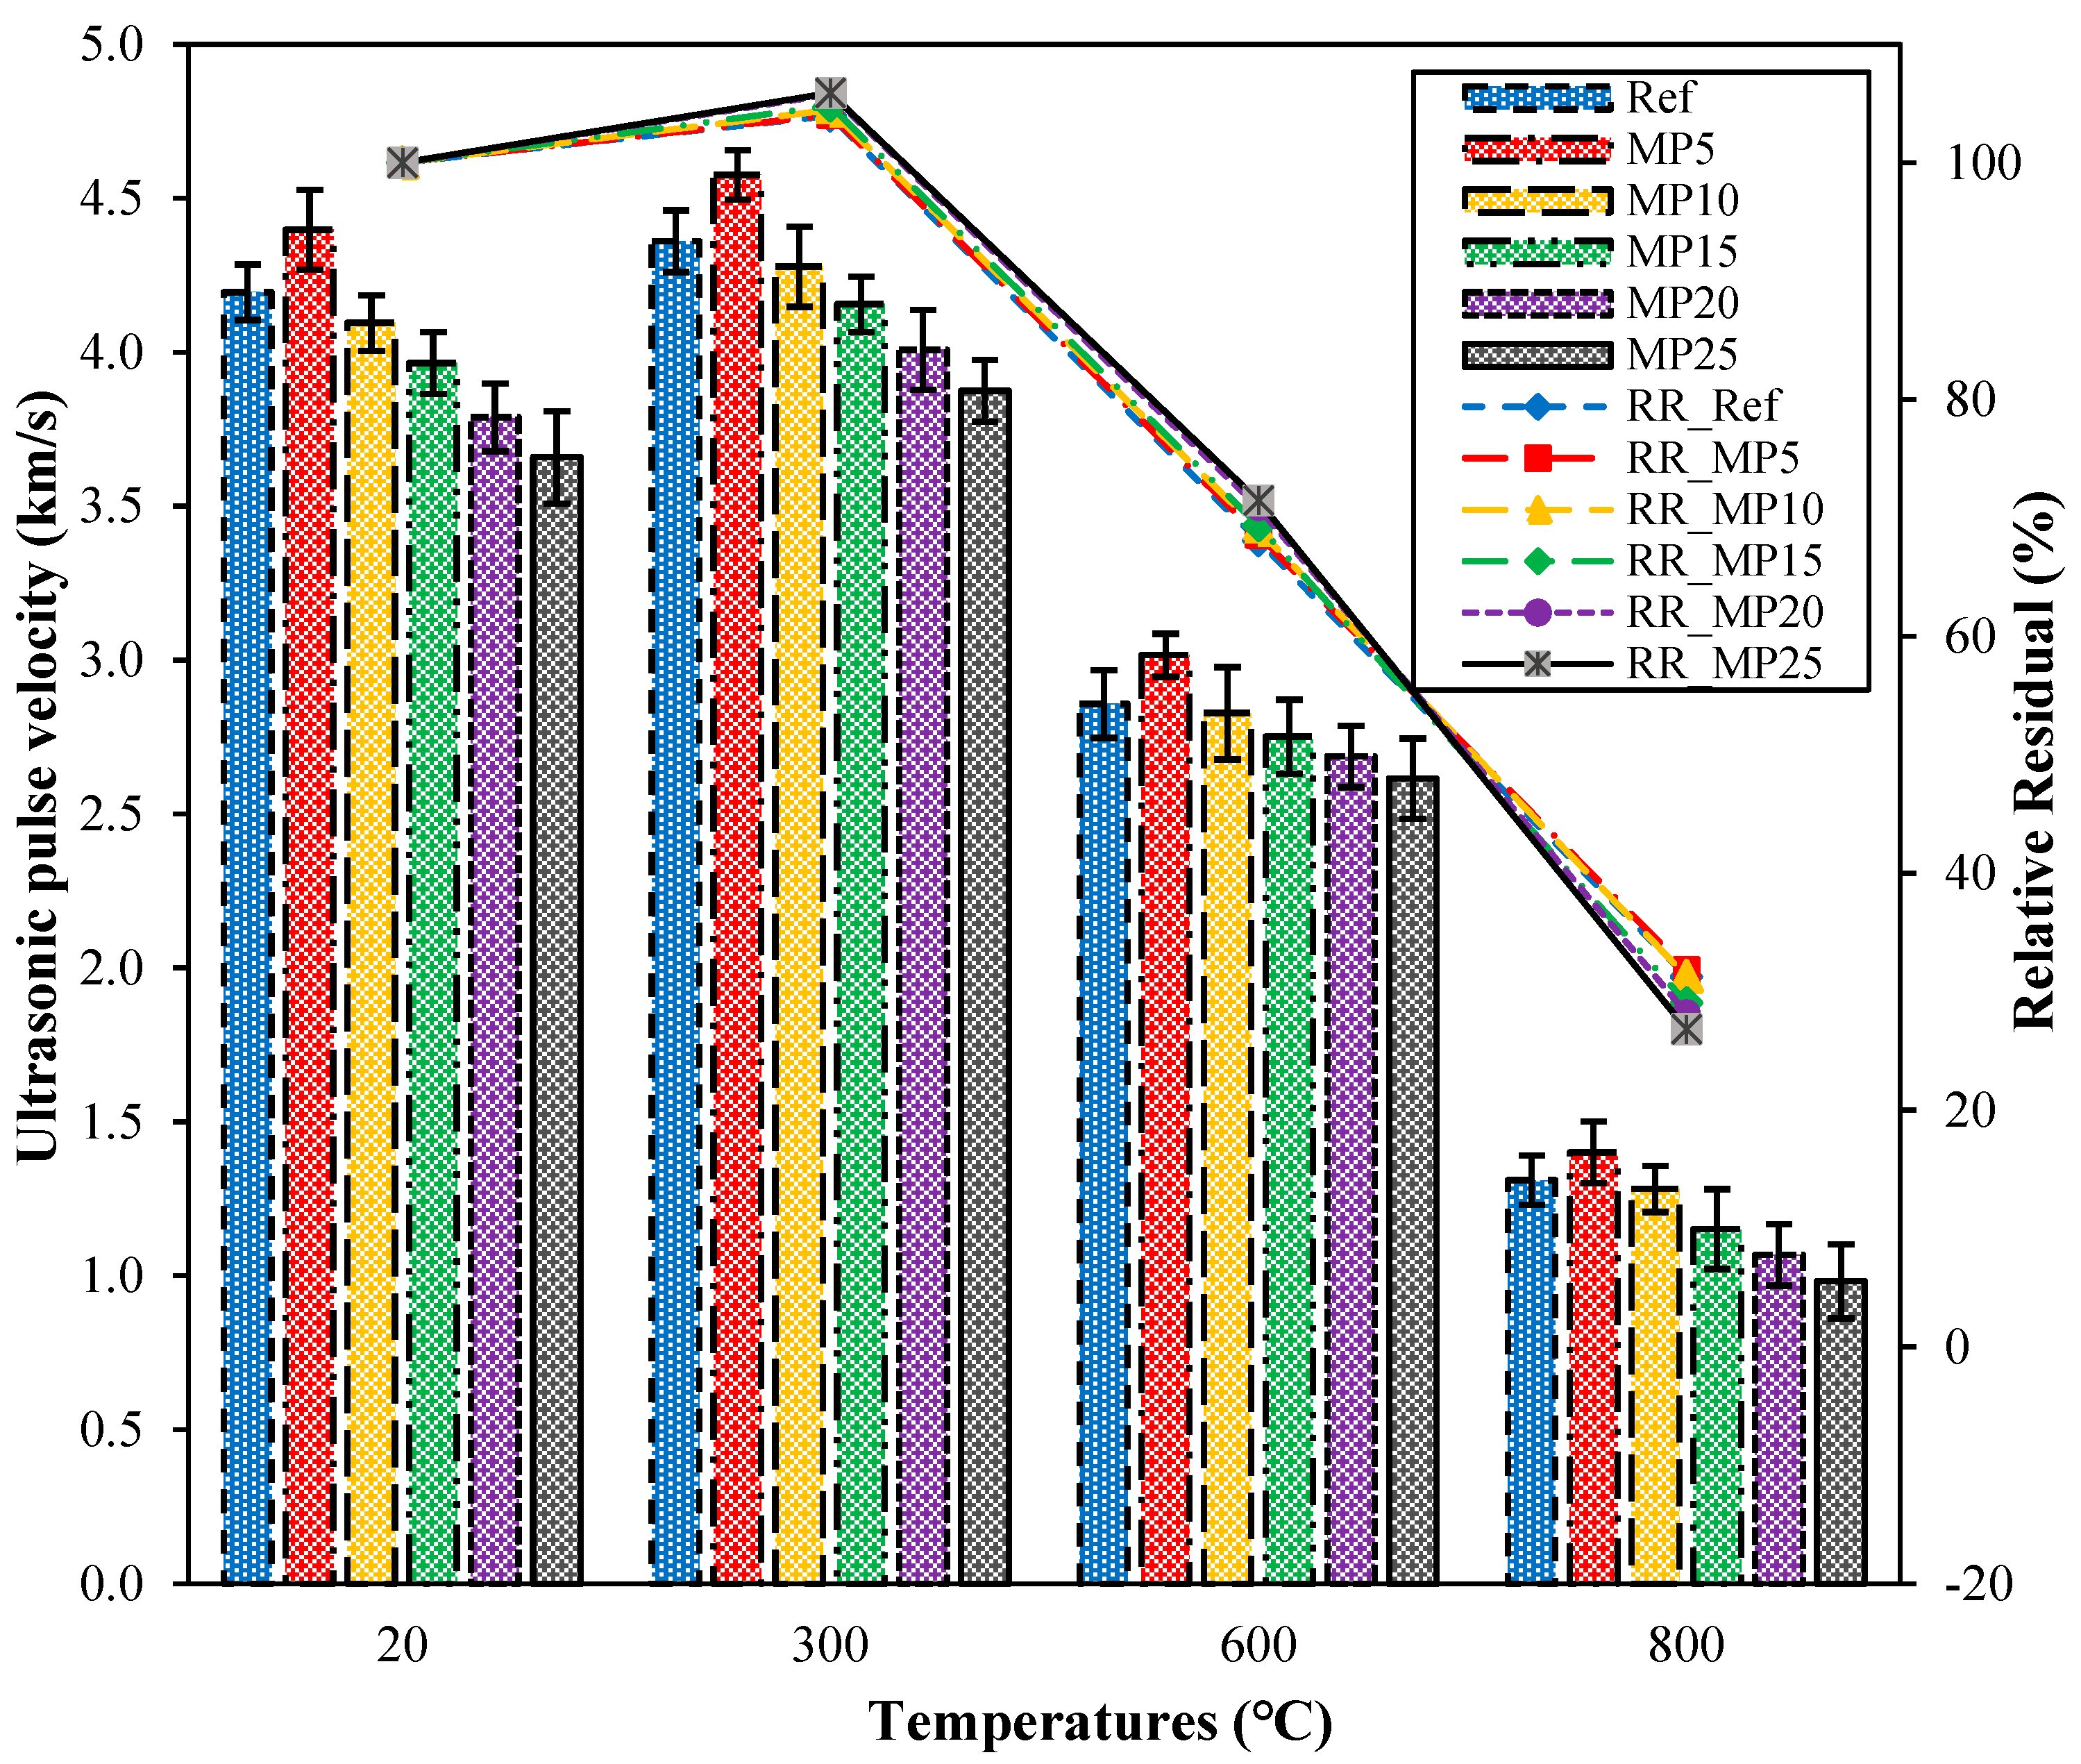
The UPV test is a nondestructive testing method used to assess the quality of concrete. It is sensitive to deterioration events in mortar samples, including internal cracking and other forms of degradation caused by thermal treatments [44]. The UPV values of samples cooled in the air after high-temperature exposure and their relative residual UPV values are presented in Figure 8. Upon examination of the UPV values, it can be observed that the UPV values of samples tested at laboratory conditions (20 °C) range from 4.40 km/s to 3.66 km/s. The quality of the samples tested in the laboratory environment is classified as “good”, according to Whitehurst’s classification provided in Table 3 [40]. The highest UPV values were obtained from samples coded as MP5, while the lowest UPV values were obtained from samples coded as MP25. After exposure to 300 °C temperature and subsequent air cooling, the UPV values of the samples increased compared with those of samples tested in laboratory conditions. The UPV values of samples exposed to 300 °C and cooled in air ranged from 4.58 km/s to 3.88 km/s, with relative residual values ranging from 103.96% to 105.90%. As the temperature increased, the UPV values decreased significantly compared with those of samples tested in the laboratory environment. The relative residual UPV values of samples exposed to temperatures of 600 °C and 800 °C ranged from 68.10% to 71.47% and 26.84% to 31.86%, respectively. It is known that around 500 °C, calcium hydroxide (Ca(OH)2), a significant component of the hydration products of concrete/mortar, begins to break down, and the degradation of the C-S-H phase starts after 600 °C [36,45]. As a result, the mortar matrix acquired a porous structure, leading to a decrease in UPV values. Samples exposed to temperatures of 600 °C and 800 °C fall into the weak and very weak categories, respectively, according to the classification by Whitehurst [40].
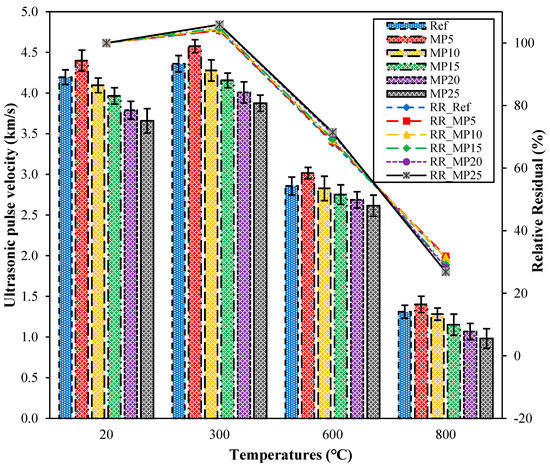
Figure 8.
The UPV values of air-cooled samples.
3.2.2. The UPV Findings for Water-Cooled Samples
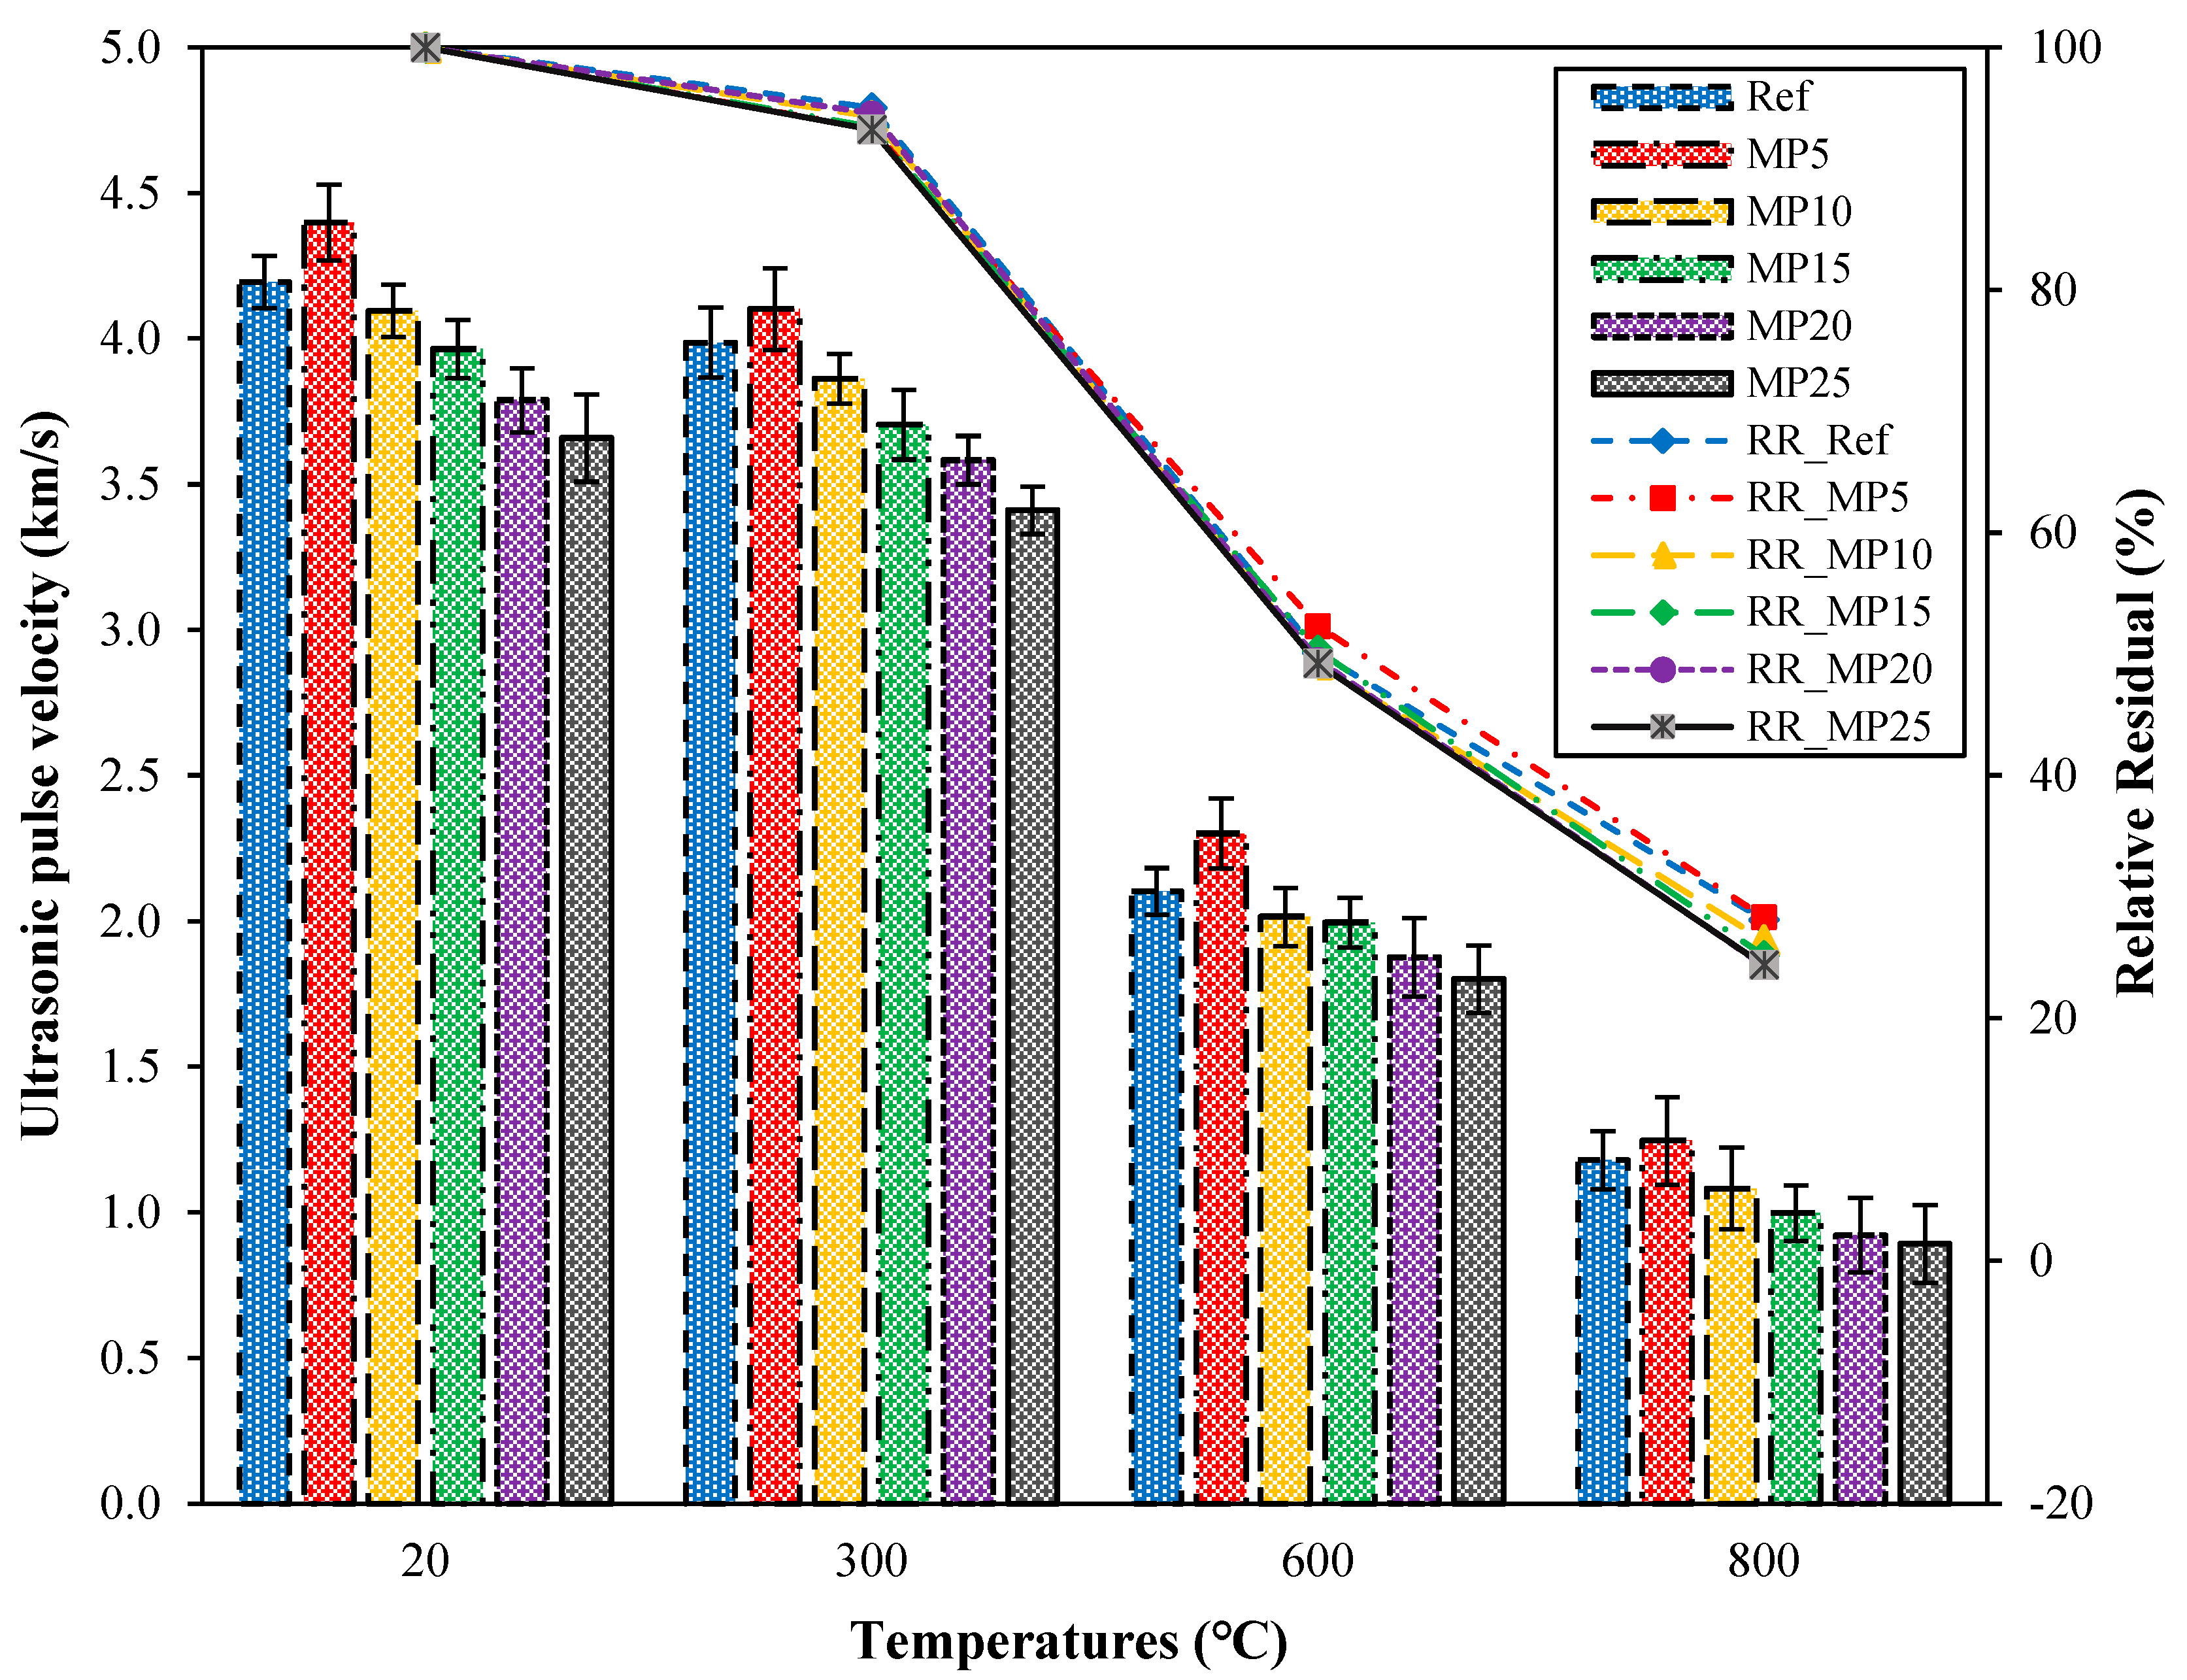
The UPV values and relative residual UPV values of samples cooled with water after high-temperature exposure are presented in Figure 9. Upon examination of the UPV values, it can be observed that similar to the samples cooled in air, the highest UPV values were obtained from samples coded as MP5, while the lowest UPV values were obtained from samples coded as MP25. After high-temperature exposure, the UPV values of all samples decreased compared with those of samples tested at laboratory conditions. The UPV values of samples exposed to temperatures of 300 °C, 600 °C, and 800 °C and cooled with water ranged from 4.10 km/s to 3.41 km/s, 2.30 km/s to 1.80 km/s, and 1.25 km/s to 0.89 km/s, respectively. According to the classification by Whitehurst [40], the mortar samples exposed to temperatures of 300 °C, 600 °C, and 800 °C fall into the “good,” “weak,” and “very weak” categories, respectively. The relative residual values for samples exposed to temperatures of 300 °C, 600 °C, and 800 °C ranged from 93.22% to 95.02%, 49.21% to 52.22%, and 24.31% to 28.33%, respectively. The sudden decrease in UPV values after temperatures exceed 300 °C can be explained by the breakdown of the hydration elements of cement and the rapid deterioration of the C-S-H phase due to sudden cooling. The decrease in UPV values with an increase in the MP replacement ratio might be related to the insufficient hydration of MP beyond a certain replacement ratio [37].
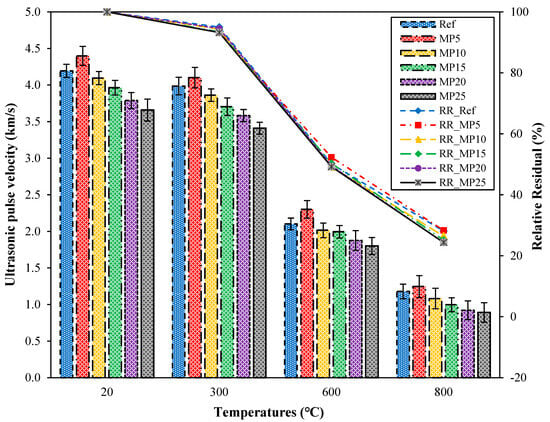
Figure 9.
UPV values of water-cooled samples.
3.2.3. Comparison of UPV Findings for Samples Cooled in Air and Water
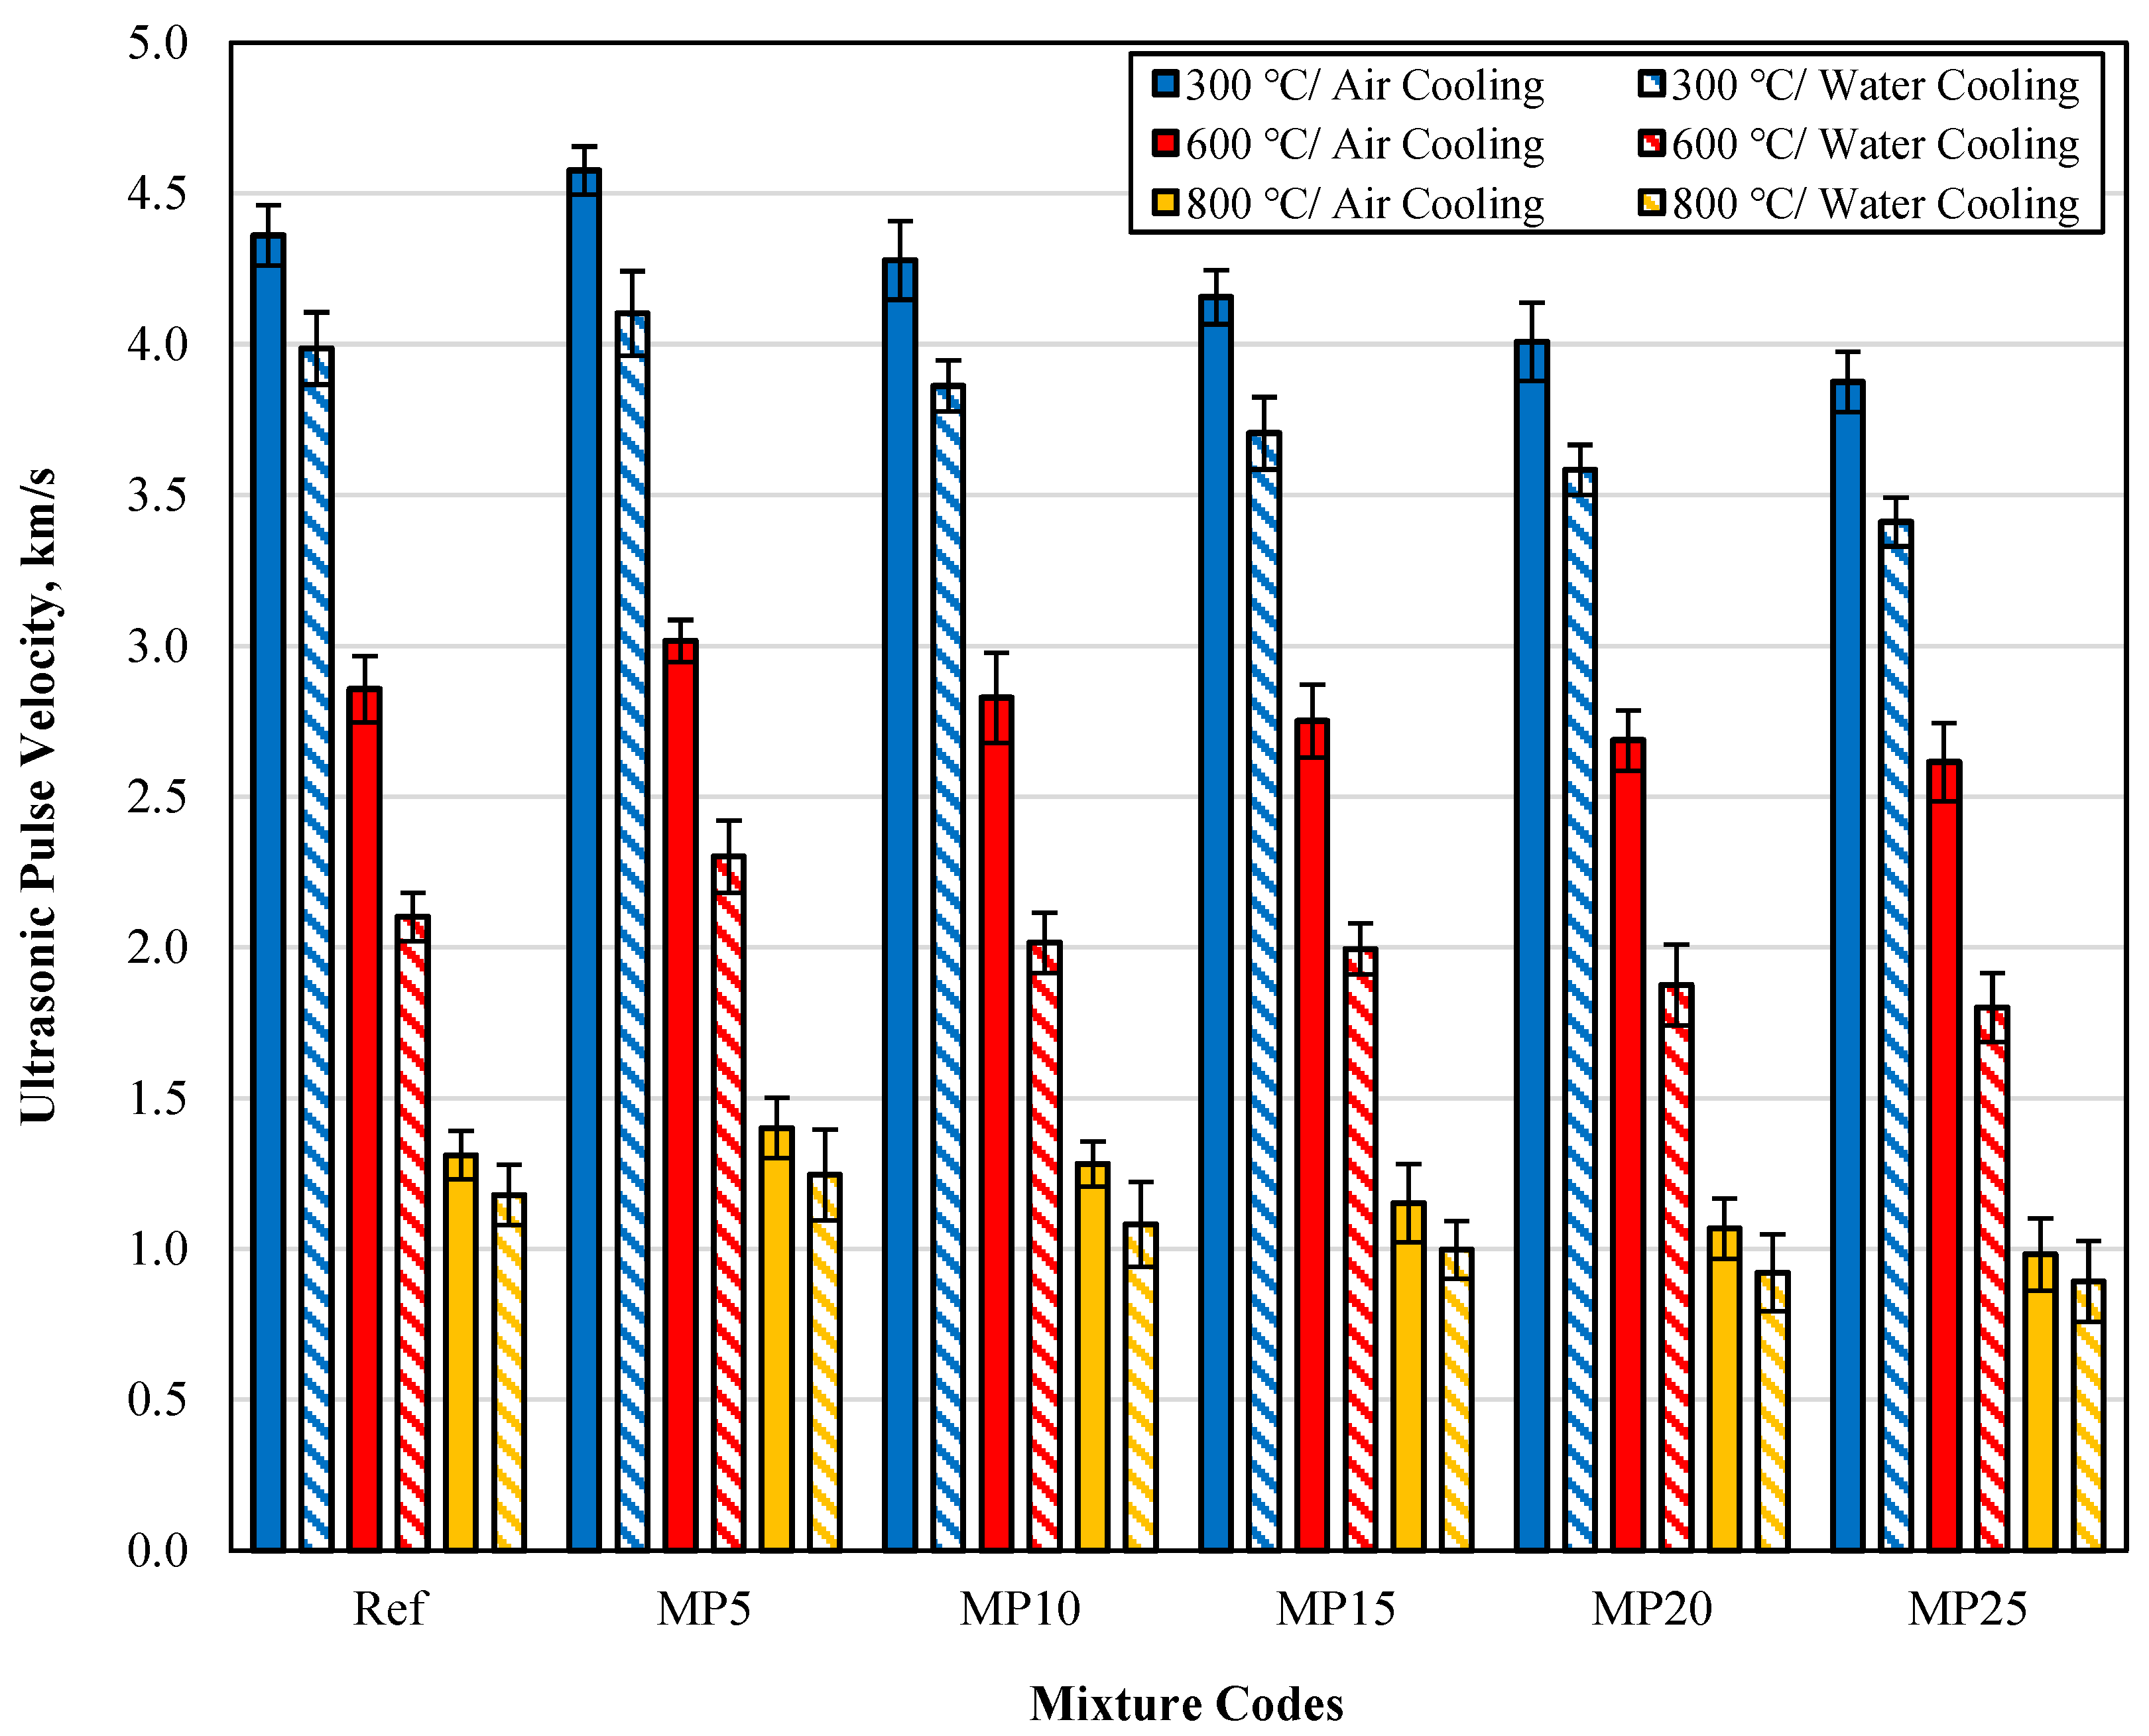
The UPV results of samples cooled in air and water after high-temperature exposure are presented in Figure 10. The UPV values of samples cooled with water were lower than those of samples cooled in the air. This decrease was particularly noticeable in samples exposed to temperatures of 600 and 800 °C. The lower UPV values of samples cooled with water compared with those cooled in the air can be attributed to the rapid cooling of the samples with water after high-temperature exposure, leading to increased porosity and deterioration of the C-S-H phase [37]. Looking at the percentage change in UPV values between samples cooled in air and water, it can be observed that the UPV loss was at lower levels for samples exposed to 300 °C temperature. In the literature, it has been reported that samples exposed to temperatures around 200 °C experience a decrease in pore volume due to the evaporation of free water, leading to a strengthening of the composite [46,47]. The lower UPV losses for samples exposed to 300 °C temperature can be attributed to this phenomenon. It has been reported that microcracks begin to spread in cement paste and aggregates between 450 and 600 °C [48]. Topcu and Demir [49] have also reported that the breakdown of the C-S-H gel at temperatures above 450 °C reduces the speed of sound wave propagation and hence decreases UPV values. These conditions mentioned in the literature can explain the significant decrease in UPV values observed for samples exposed to temperatures of 600 and 800 °C. Overall, the UPV findings for samples cooled in air and water are consistent with the findings of previous literature studies [50,51]. Additionally, it has been reported that UPV results are related to pore structure and sample density and that there is a relationship between mechanical properties and UPV results [17,52].

Figure 10.
The UPV values of samples cooled in air and water after high-temperature exposure.
3.3. Compressive Strength
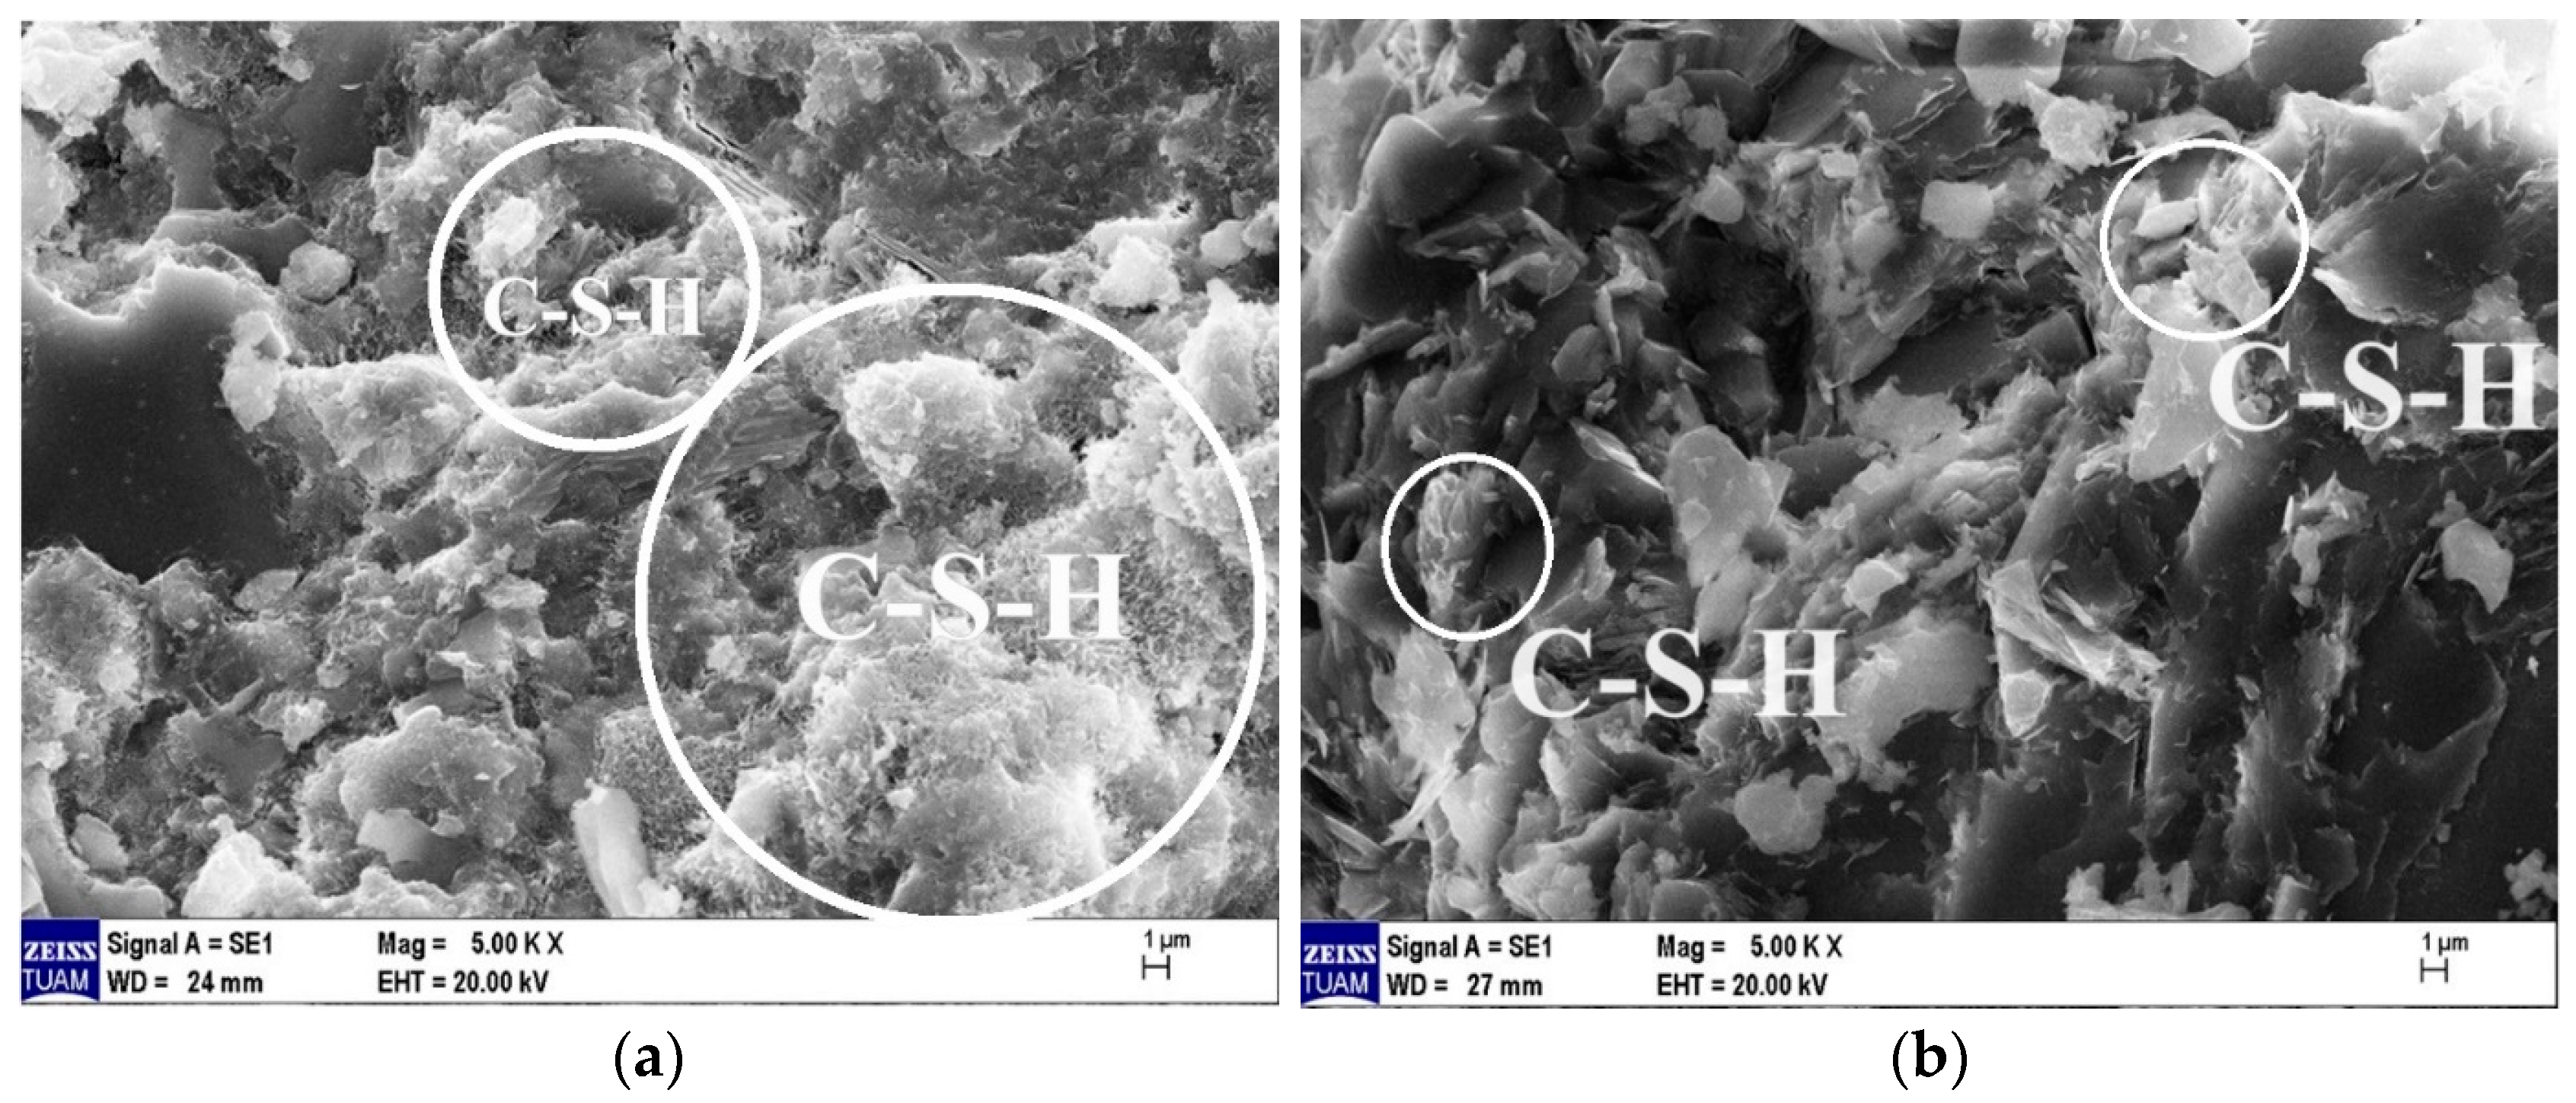
3.3.1. The fcs Values of the Samples Air-Cooled after High-Temperature Exposure
The compressive strength (fcs) results of samples cooled in the air after exposure to high temperatures and the relative residual fcs results compared with those of samples tested in the laboratory environment are presented in Figure 11. When examining the fcs results of samples tested in the laboratory environment (20 °C), it can be observed that all mixture groups have fcs values above the minimum fcs value (42.5 MPa) specified in EN 196-1 [31]. The highest fcs value was obtained from MP5-coded mortars. The fcs value of MP5-coded mortars was 5.16% higher than that of Ref-coded mortars. With the increase in the MP replacement ratio, the fcs values decreased. The strength loss that occurs with the increase in MP content can be attributed to the significant reductions in C3S and C2S, which are responsible for strength. This phenomenon is commonly known as the dilution of pozzolanic reactions. The obtained results are consistent with the literature [29,53]. When the mortar samples were cooled in the air after being exposed to 300 °C temperature, an increase in fcs values between 3.50% and 8.98% was observed compared with those of samples tested in the laboratory environment. Alakara et al. [37] attributed this increase to the evaporation of free water in the cement paste. Dias et al. [54] attributed the increase in fcs values at 300 °C to the thermal drying and dehydration of the cement paste. The obtained results are also consistent with the studies conducted by Yamanel et al. [29] and Alani et al. [55]. When the mortar samples were exposed to temperatures of 600 °C and 800 °C, significant decreases in fcs values were recorded. The fcs values of samples exposed to 600 °C temperature range between 24.29 and 33.79 MPa, while those of samples exposed to 800 °C temperature range between 12.86 and 18.17 MPa. The relative residual fcs results for samples exposed to temperatures of 600 °C and 800 °C varied between 53.69% and 60.10% and 28.56% and 32.33%, respectively. The highest and lowest fcs values for all temperature ranges were obtained from MP5- and MP25-coded mortars, respectively. The reason for the decrease in fcs values as the temperature increases can be explained as follows: Around 550 °C, Ca(OH)2, which constitutes a significant portion of the hydrate products, starts to break down, and aggregates begin to deteriorate after this temperature [36,56]. At around 600 °C, the calcium silicate hydrate (C-S-H) phase degrades [57]. The C-S-H phase completely disintegrates above 800 to 900 °C [45,58].
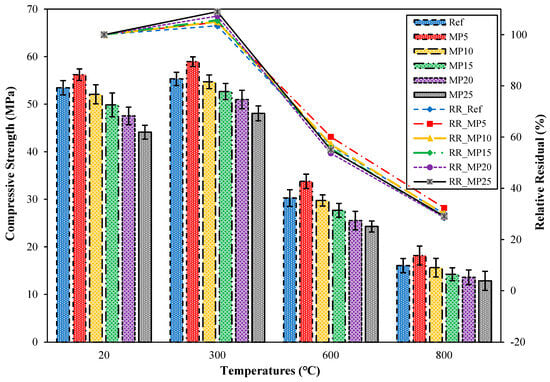
Figure 11.
The fcs values of air-cooled samples.
3.3.2. The fcs Values of the Samples Water-Cooled after High-Temperature Exposure
The fcs values of the samples water-cooled after high-temperature exposure are presented in Figure 12.
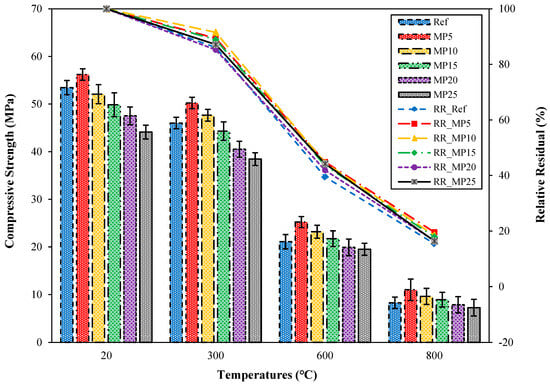
Figure 12.
The fcs values of the water-cooled samples.
When examining the fcs results in Figure 12, it was noted that there was a significant decrease in fcs values when the samples were cooled with water after exposure to high temperatures. The fcs results of samples cooled with water after exposure to 300 °C temperature ranged between 38.45 MPa and 50.23 MPa. These samples’ relative residual fcs values ranged between 85.23% and 91.51%. Alakara et al. [37] suggested that the reason for this decrease in fcs values could be due to the rapid reaction of CaO, which dissociates from Ca(OH)2 after high-temperature exposure, with water, resulting in stresses and cracks in the cement paste. The fcs values of samples cooled with water after exposure to temperatures of 600 °C and 800 °C were 19.52–25.23 MPa and 7.25–11.01 MPa, respectively. These samples’ relative residual fcs values ranged between 39.49% and 44.89% for 600 °C temperature and 15.46% and 19.59% for 800 °C temperature. For all temperature ranges, the highest and lowest fcs values for samples cooled with water were obtained from MP5- and MP25-coded mortars, respectively. Similar decreases in fcs values observed in samples cooled with water have also been reported in the studies by Yüzer et al. [59] and Karahan [60].
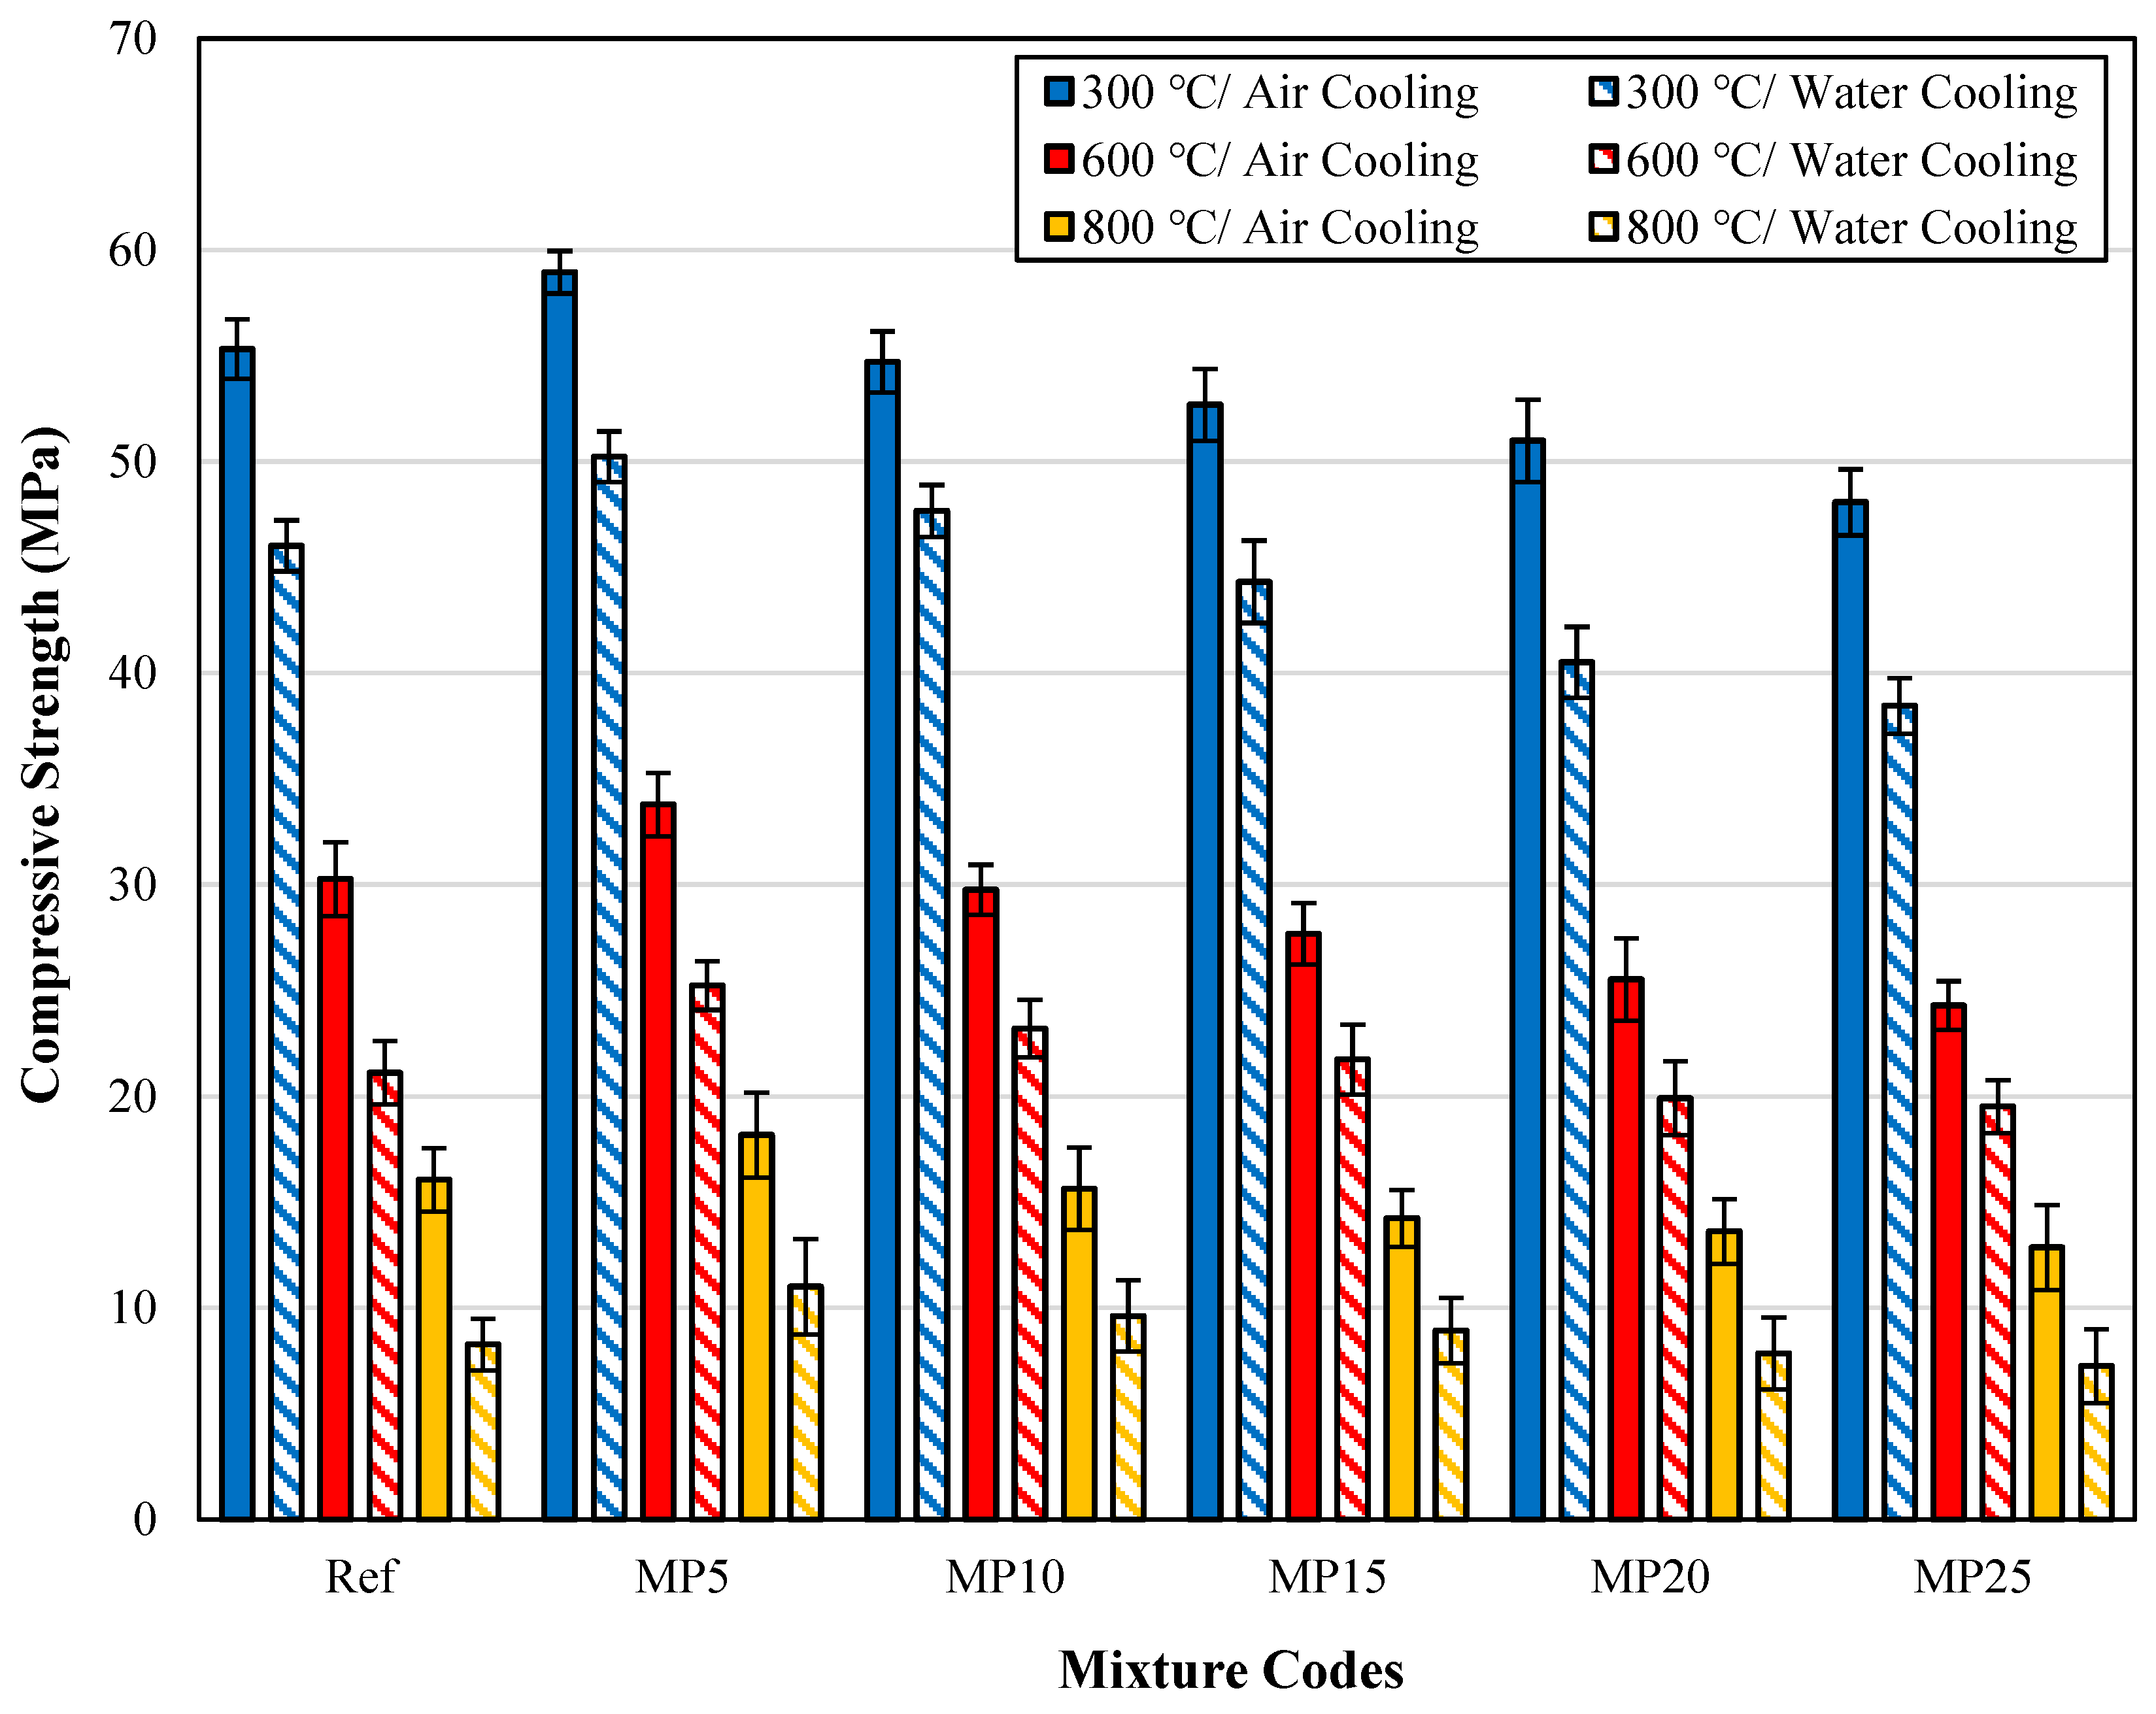
3.3.3. Comparison of fcs Findings for Samples Cooled in Air and Water after High-Temperature Exposure
The fcs findings for samples cooled in air and water after high-temperature exposure are presented in Figure 13.

Figure 13.
The fcs findings for samples cooled in air and water.
When examining the effect of cooling regimes on strength losses, it was observed that the strength loss of mortars cooled with water is higher than that of those cooled in air. After exposure to temperatures of 300 °C, 600 °C, and 800 °C, the fcs values of samples cooled with water showed decreases of approximately 12.89% to 20.54%, 19.64% to 30.25%, and 37.29% to 48.50%, respectively, compared with those of samples cooled in air. The decrease in fcs values was particularly pronounced after exposure to 600 °C temperature. It is seen that the fcs values of the 5%, 10%, and 15% MP-substituted mortars after being exposed to high temperatures of 300, 600, and 800 °C are higher than those of the Ref-coded mortars. Additionally, when the relative residual strength (RRS) graphs are examined, the RRS percentages of Ref-coded mortars are lower than those of MP-substituted mortars. This means that the strength loss of MP-substituted mortars is lower than that of reference mortars. This can be attributed to decreased Ca(OH)2 content in the mortar matrix as the MP substitution rate increases [37]. As mentioned before, the hydrated elements in the cement matrix break down after reaching 500 °C. As a result of the decrease in the density of the Ca(OH)2 structure, which is most damaged at high temperatures, in the mortar matrix, increases in RRS percentages were obtained as MP substitution increased. The findings obtained are also compatible with the literature [29]. Karahan [60] demonstrated that fcs values of samples rapidly cooled with water are lower than those of samples cooled in air. In another study by Abadel et al. [61] investigating the effect of cooling regimes on fcs values, higher rates of strength loss were observed in samples cooled with water. Yüzer et al. [59] suggested using alternative cooling methods instead of water for cooling samples after exposure to high temperatures.
3.4. Flexural Strength
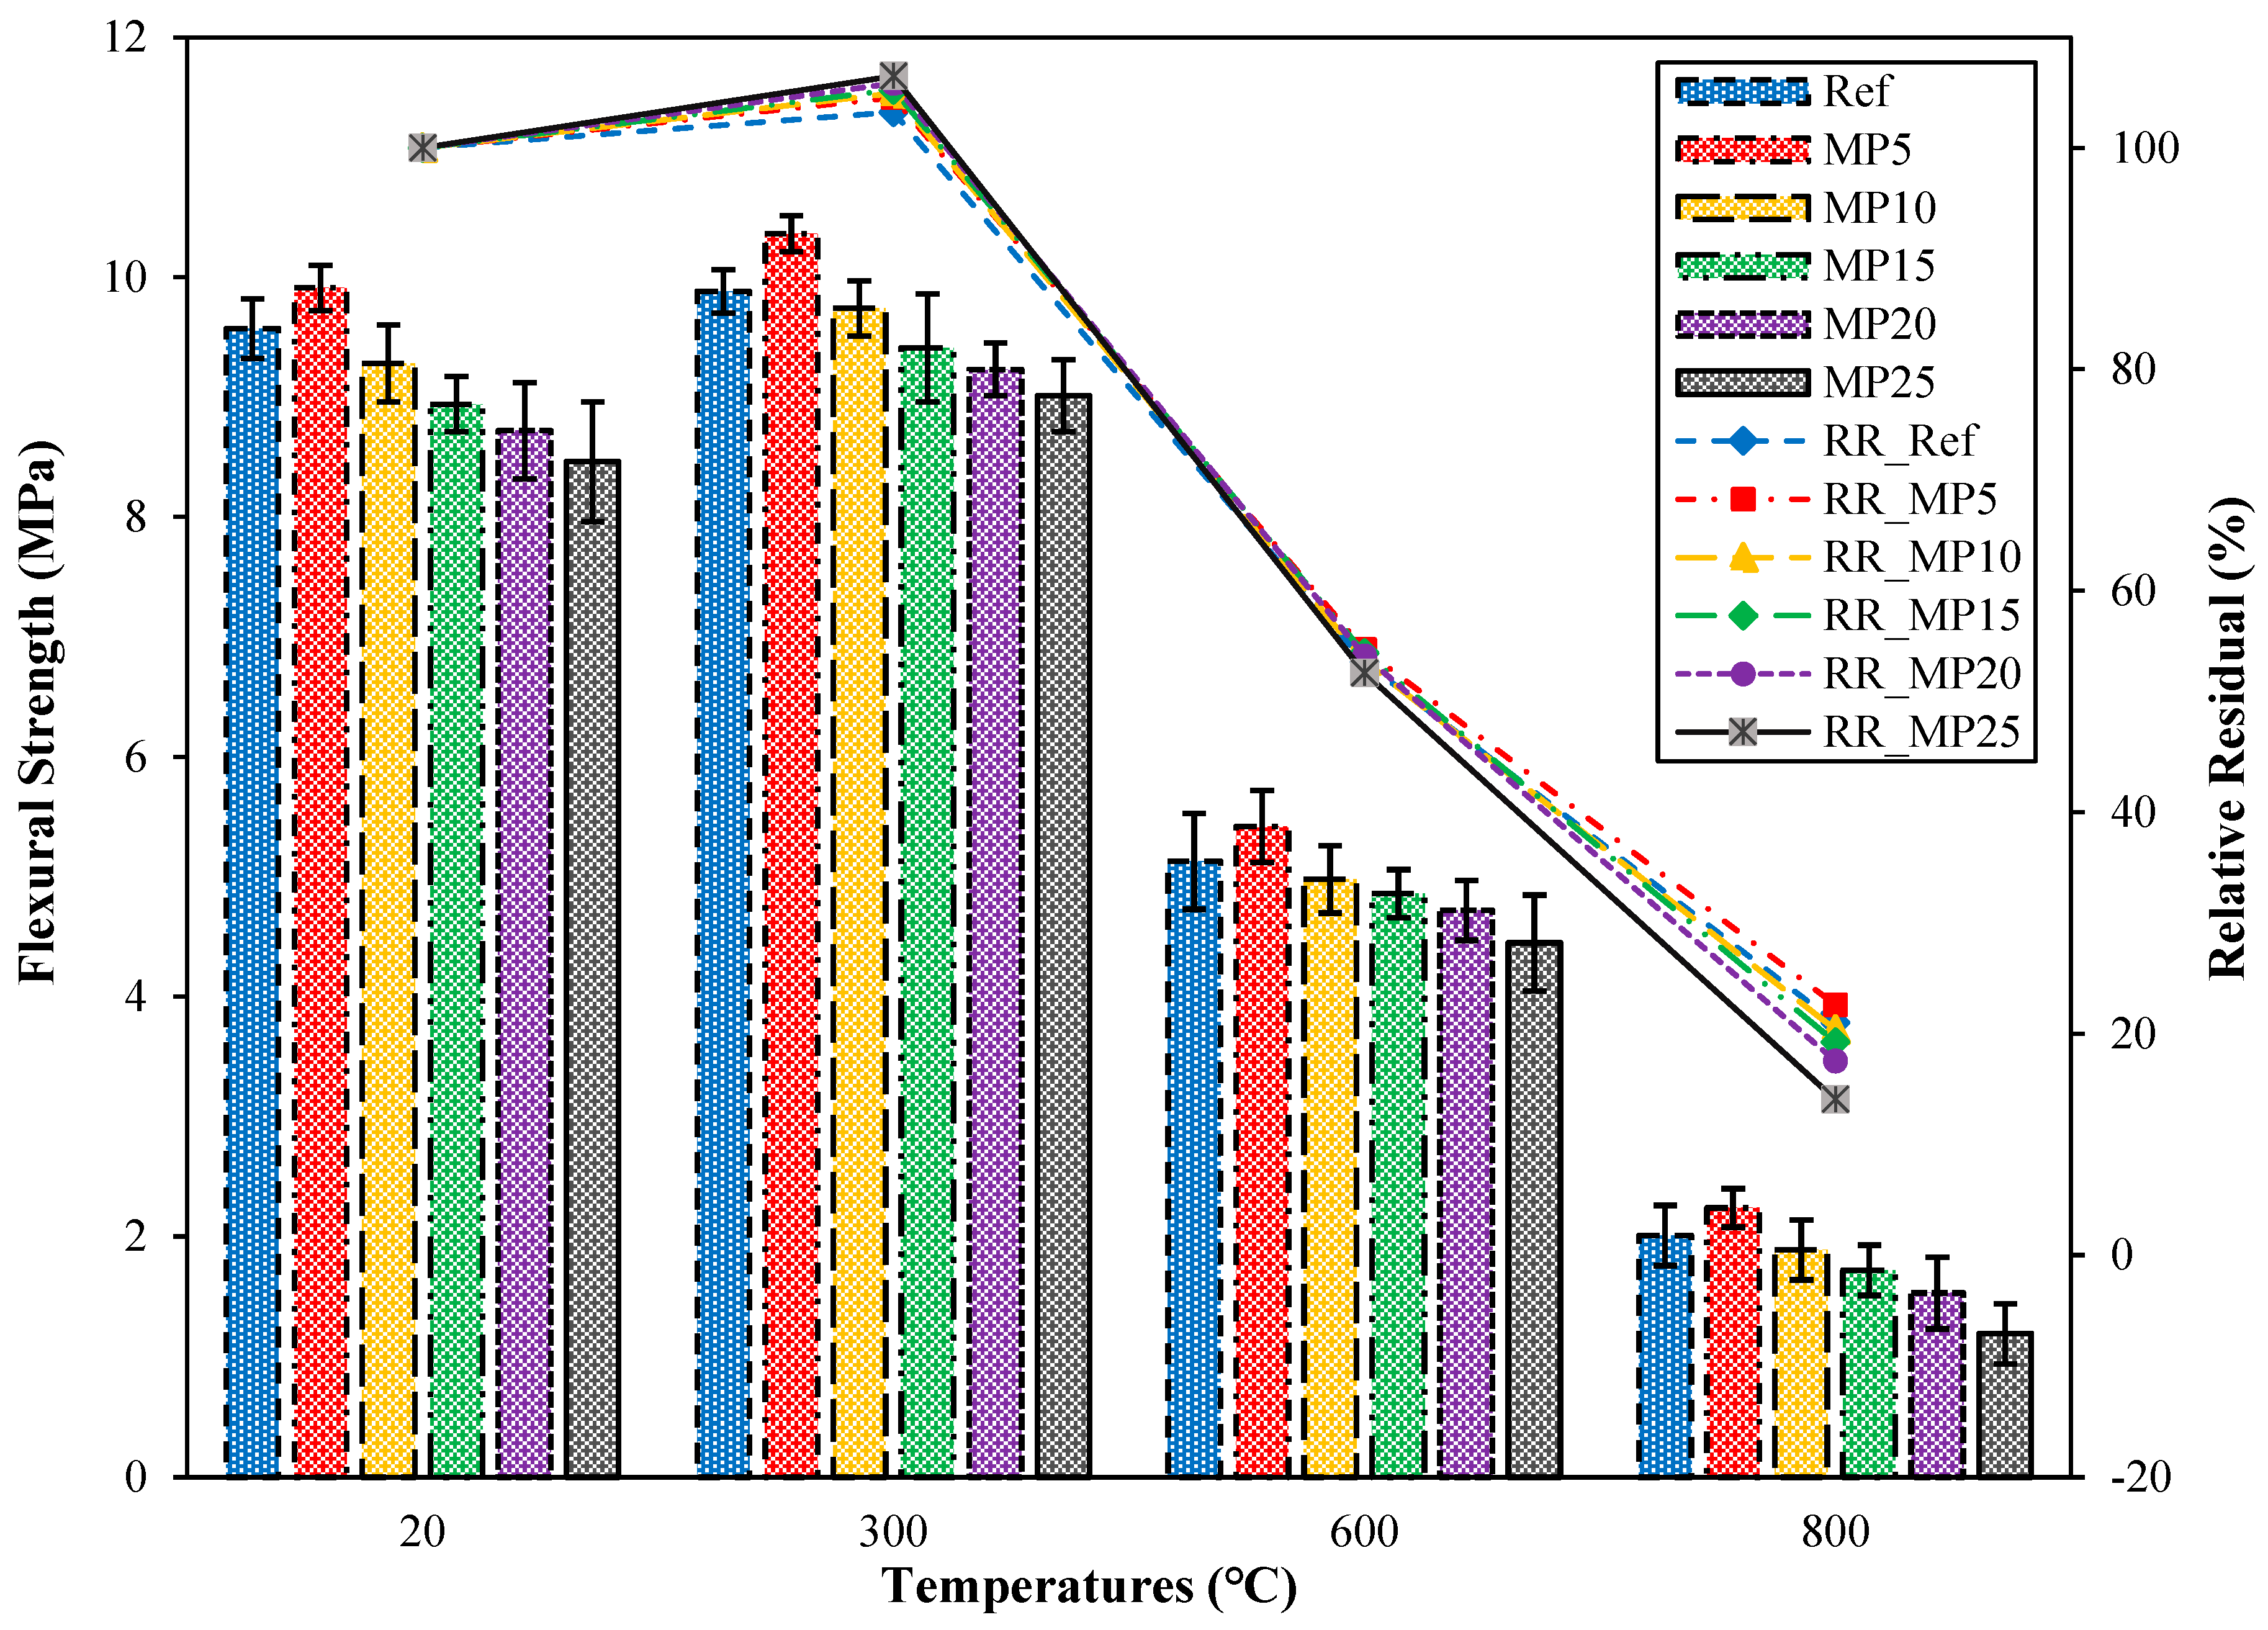
3.4.1. The ffs Values of the Samples Air-Cooled after High-Temperature Exposure
The flexural strength (ffs) findings for mortar samples cooled in the air after exposure to high temperatures and their relative residual ffs findings compared with those of samples tested in the laboratory environment (20 °C) are presented in Figure 14. When examining the ffs findings for samples tested in the laboratory environment (20 °C), it was observed that the highest ffs value was obtained from MP5-coded mortars, and the lowest ffs value was obtained from MP25-coded mortars. The ffs value of MP5-coded mortars was 3.55% higher than that of Ref-coded mortars. Comparing the obtained ffs findings with the literature, it has been reported that the ffs values increase when MP is substituted up to a specific ratio, and the ffs results decrease with an increasing substitution ratio [29,62,63]. The results obtained are consistent with the literature. After exposure to 300 °C, the ffs values of samples cooled in air ranged between 9.01 MPa and 10.36 MPa, and these values showed an increase of approximately 3.24% to 6.50% compared with those of samples tested in the laboratory environment. The increases observed here exhibited a similar trend to the increase in fcs values. As mentioned in the section interpreting the fcs findings, the increase in ffs values can also be attributed to the evaporation of free water in the cement paste. A similar phenomenon has been noted in a study by [35] Sarıdemir and Yıldırım [64]. As the temperature to which the samples are exposed reached 600 °C and 800 °C, the ffs values of the samples ranged between 4.45 MPa and 5.42 MPa and 1.19 MPa and 2.24 MPa, respectively. The relative residual ffs results for samples exposed to temperatures of 600 °C and 800 °C varied between 52.60% and 54.70% and 14.07% and 22.60%, respectively. The decrease in ffs values of samples exposed to temperatures above 600 °C can be attributed to the breakdown and deterioration of C-S-H, which is one of the hydration products, different expansions of aggregate and paste, excessive shrinkage, and the disintegration of the interfacial zone [65,66].

Figure 14.
The ffs values of the air-cooled samples.
3.4.2. The ffs Values of the Samples Water-Cooled after High-Temperature Exposure
The ffs findings for samples cooled in water after exposure to high temperatures and their relative residual ffs findings are presented in Figure 15. When samples exposed to high temperatures were cooled in water, significant decreases in ffs values were observed. The ffs values of samples cooled in water exhibited a similar trend to the decrease in fcs values for these samples. After exposure to 300 °C, the ffs values of samples cooled in water ranged between 6.87 MPa and 9.23 MPa, and their relative residual ffs values showed a decrease of approximately 18.79% to 2.91% compared with those of samples tested in the laboratory environment. The reason for this decrease can be attributed to the rapid cooling of samples after high-temperature exposure, resulting in additional stresses and cracks in the cement paste, as mentioned in the section interpreting the fcs findings [37]. The decreases in ffs values were particularly pronounced at temperatures above 300 °C, which could result from the decomposition of hydrated products at higher temperatures [67]. Samples exposed to 600 °C and 800 °C were determined to exhibit ffs values ranging between 2.94 MPa and 4.86 MPa and 1.08 MPa and 1.98 MPa, respectively. Their relative residual ffs values for temperatures of 600 °C and 800 °C varied between 34.75% and 49.04% and 14.11% and 19.98%, respectively. Similar decreases in ffs values for mortar samples cooled in water have been reported in a study by Karahan et al. [23].
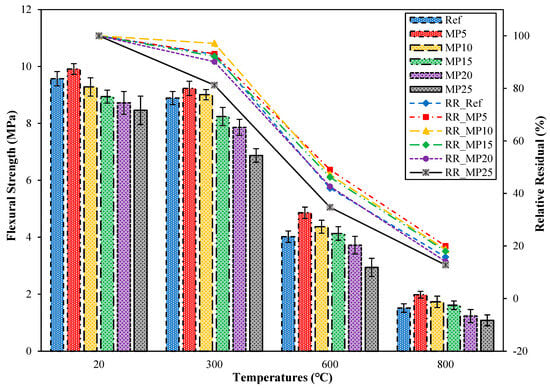
Figure 15.
The ffs values of the water-cooled samples.
3.4.3. Comparison of ffs Findings for Samples Cooled in Air and Water
The ffs values of samples cooled in air and water are presented in Figure 16. When the effect of cooling regimes on ffs findings is evaluated, it was determined that the strength loss of mortar samples cooled in water was higher than in air. A similar situation was observed in the fcs values as well. After exposure to 300 °C, 600 °C, and 800 °C, the ffs values of samples cooled in water decreased by approximately 7.49% to 23.75%, 10.35% to 33.93%, and 6.40% to 24.88%, respectively, compared with those of samples cooled in air. A study by Karahan et al. [23] investigating the effect of the cooling regime found that the loss of ffs in samples cooled in water is higher than that of those cooled in air. A similar observation was reported by Husem [68]. When samples are rapidly cooled in water, the additional stresses and cracks formed in the cement paste matrix result in lower ffs values for these samples than those cooled in air.

Figure 16.
The ffs findings for samples cooled in air and water.
3.5. Mass Loss
3.5.1. The Mass Loss Values of the Air-Cooled Samples
The weight losses of samples exposed to high temperatures and cooled in air are presented in Figure 17. It was observed across all mixture groups that as the temperature increases, the weight losses also increase. However, as the mixtures’ MP substitution ratio increases, weight loss decreases were identified. The weight losses of samples exposed to 300 °C, 600 °C, and 800 °C and cooled in air varied between 3.58% and 4.65%, 8.73% and 9.96%, and 14.73% and 15.96%, respectively. When the weight losses of MP25-coded mortars at 300 °C, 600 °C, and 800 °C were compared with those of Ref-coded mortars, reductions of 23.01%, 12.35%, and 7.71% were observed, respectively.
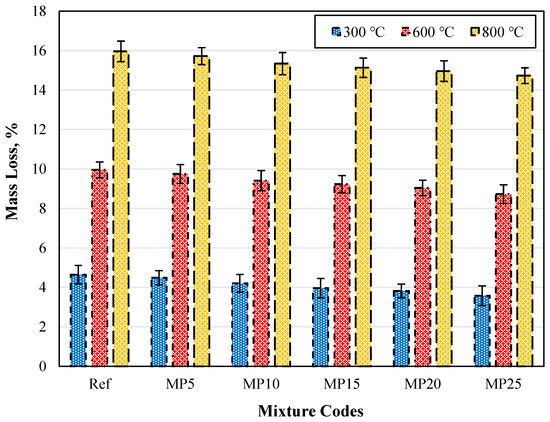
Figure 17.
The mass loss values of the air-cooled samples.
The weight loss increased with temperature. Generally, the weight loss occurring when mortar specimens are exposed to temperatures around 200 °C is due to the evaporation of water that can vaporize and the release of free water in capillary pores. The weight loss around 400 °C results from the decomposition of carboaluminate hydrates, which eliminates water in chemical bonds. At 400 °C, all capillary water in the mortar matrix is lost. When the temperature exceeds 600 °C, breakdowns in the C-S-H gels are observed. When mortar specimens are subjected to high temperatures, hydration products like calcium hydroxides are initially affected, followed by the degradation of C-S-H gels [37]. Using mineral additives in cementitious composites has been reported to increase resistance to high temperatures as these additives convert calcium hydroxides into C-S-H gels, which would be the first to deteriorate [69].
3.5.2. The Mass Loss Values of the Water-Cooled Samples
The mass losses of water-cooled samples exposed to high temperatures are presented in Figure 18. When the specimens are cooled with water after exposure to high temperatures, an increase in weight loss, similar to what was observed in air-cooled specimens, can be seen. For all temperature levels, the highest weight loss was observed in the Ref-coded mortars, while the lowest was in the MP25-coded mortars. After exposure to temperatures of 300 °C, 600 °C, and 800 °C, the weight losses of water-cooled specimens ranged from 3.19% to 4.13%, 8.35% to 9.49%, and 13.63% to 14.91%, respectively. When comparing the weight losses of MP25-coded mortars at 300 °C, 600 °C, and 800 °C with those of the Ref-coded mortars, reductions of approximately 22.76%, 12.01%, and 8.58% were observed, respectively. In conclusion, as with the air-cooled specimens, it was determined that an increase in the MP substitution ratio leads to decreased weight losses.
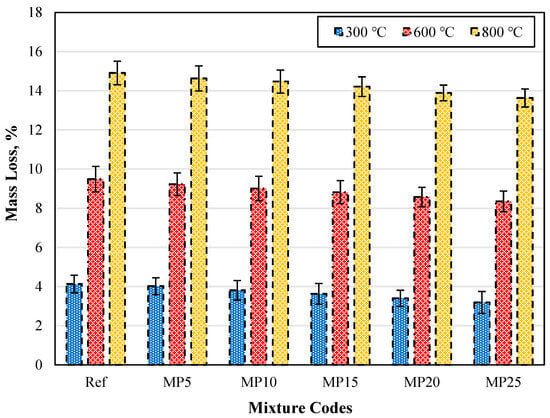
Figure 18.
The mass loss values of the water-cooled samples.
3.5.3. Comparison of Mass Loss Findings for Samples Cooled in Air and Water
The mass losses of specimens cooled in air and water are shown in Figure 19. Upon examining the values in the graph, it can be observed that the mass losses of specimens cooled in water are lower than those of specimens cooled in air. The mass losses of specimens cooled in water, compared with those of specimens cooled in air, are lower by percentages ranging from 8.33% to 11.18%, 4.25% to 5.33%, and 5.67% to 7.47% for temperature values of 300 °C, 600 °C, and 800 °C, respectively.
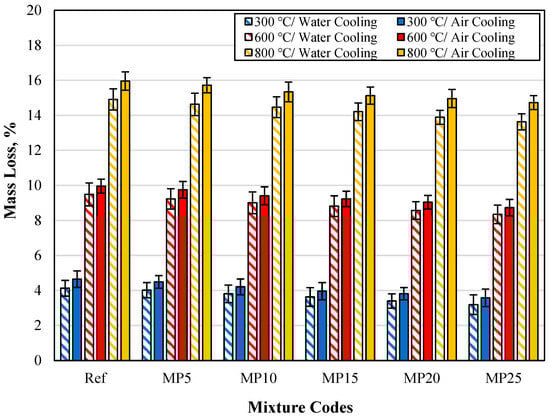
Figure 19.
The mass loss findings for samples cooled in air and water.
The lower mass losses of specimens cooled in water compared with those of specimens cooled in air can be attributed to the fact that the cementitious matrix regains some of the lost water during the water-cooling process. Karahan et al. [23] explained this phenomenon by stating that the rehydration of CaO formed due to the dehydroxylation of CH (calcium hydroxide) in the cementitious matrix after high-temperature exposure can occur during water cooling. Consequently, when the specimen is cooled in water, CaO is hydrated by water, and the rehydration of CaO binds water, increasing the specimen’s mass. The observation that the mass losses of specimens cooled in water are lower than those of specimens cooled in air aligns with findings from previous studies in the literature [50,70].
3.6. Microstructural Analyses
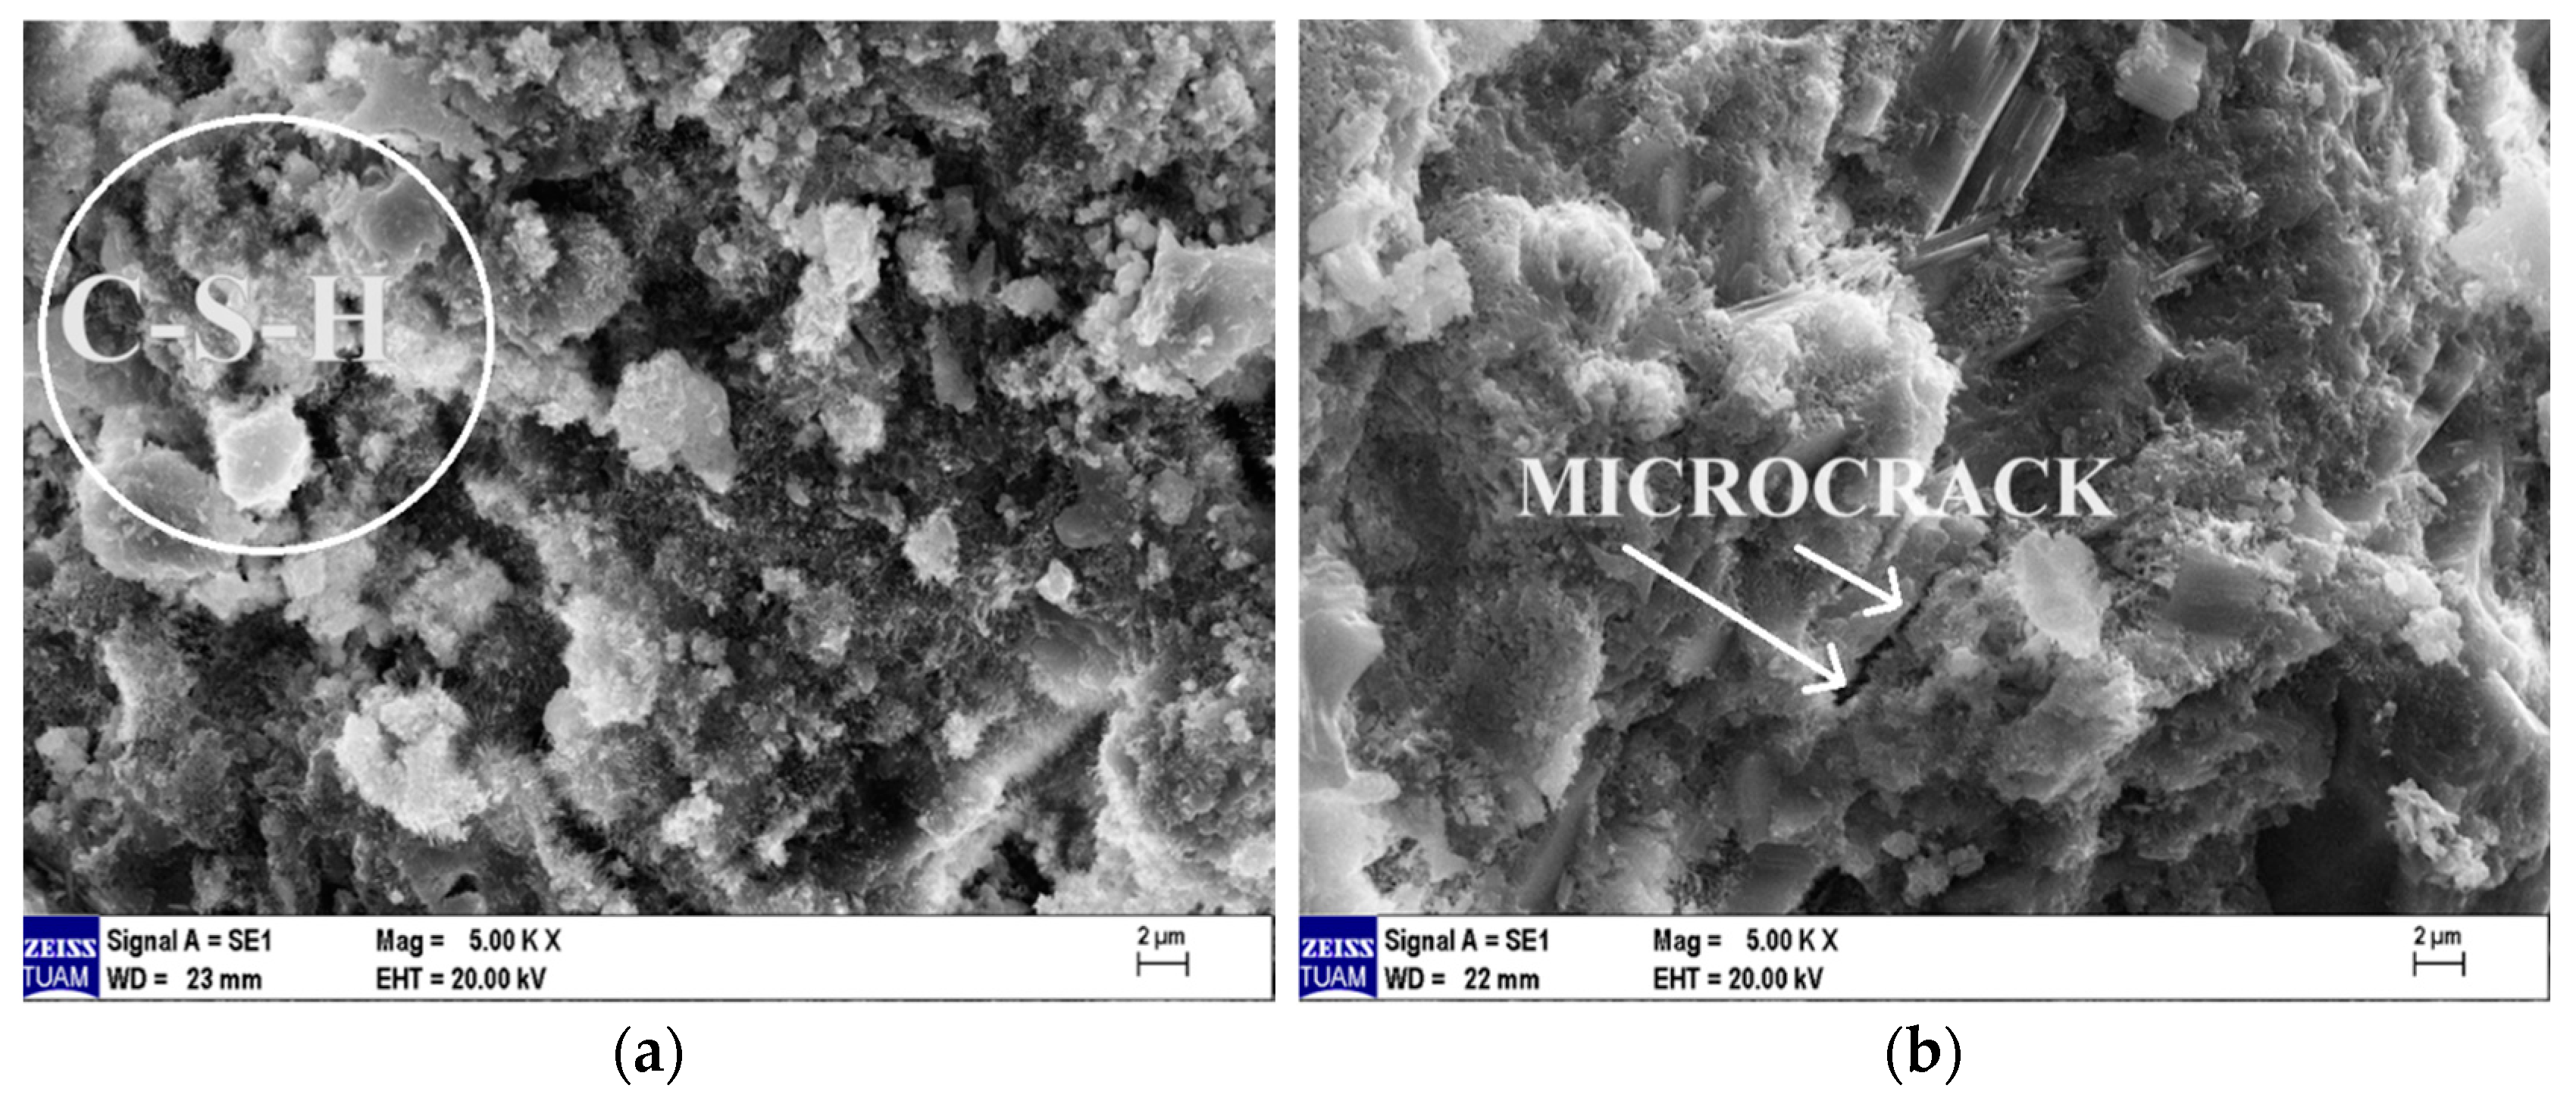
Microstructural analyses of the Ref- and MP10-coded specimens after testing in the laboratory environment (20 °C) and at a high temperature of 600 °C were carried out using scanning electron microscopy (SEM). SEM images of the Ref- and MP10-coded specimens tested in the laboratory environment are presented in Figure 20a and Figure 20b, respectively. When comparing the SEM images of the Ref- and MP10-coded specimens, it can be observed that the Ref-coded specimens have a higher density of C-S-H (calcium silicate hydrate) and a greater number of hydrated elements. C-S-H gels cover the entire surface in a network-like structure in the Ref-coded specimens. On the other hand, the C-S-H density in the MP10-coded specimens is lower. This phenomenon can be associated with the slower development of hydration in pozzolanic materials [71].

Figure 20.
SEM images of samples in a laboratory environment. (a) Ref, (b) MP10.
The SEM images of the Ref- and MP10-coded specimens after they were subjected to the high temperature of 600 °C and air-cooled are presented in Figure 21a and Figure 21b, respectively. When comparing these SEM images with the ones shown in Figure 20, it can be observed that the C–S–H gel structure deteriorated after the high-temperature exposure, which is particularly evident in Figure 21b, where it can be seen that microcracks have formed. These SEM images confirm the deterioration in mechanical properties. It can be noted that the C–S–H gel structure in Figure 21a is relatively better preserved compared with that in Figure 21b. Additionally, microcracks are more clearly visible in Figure 21b.

Figure 21.
SEM images of samples cooled in air after 600 °C high-temperature exposure. (a) Ref, (b) MP10.
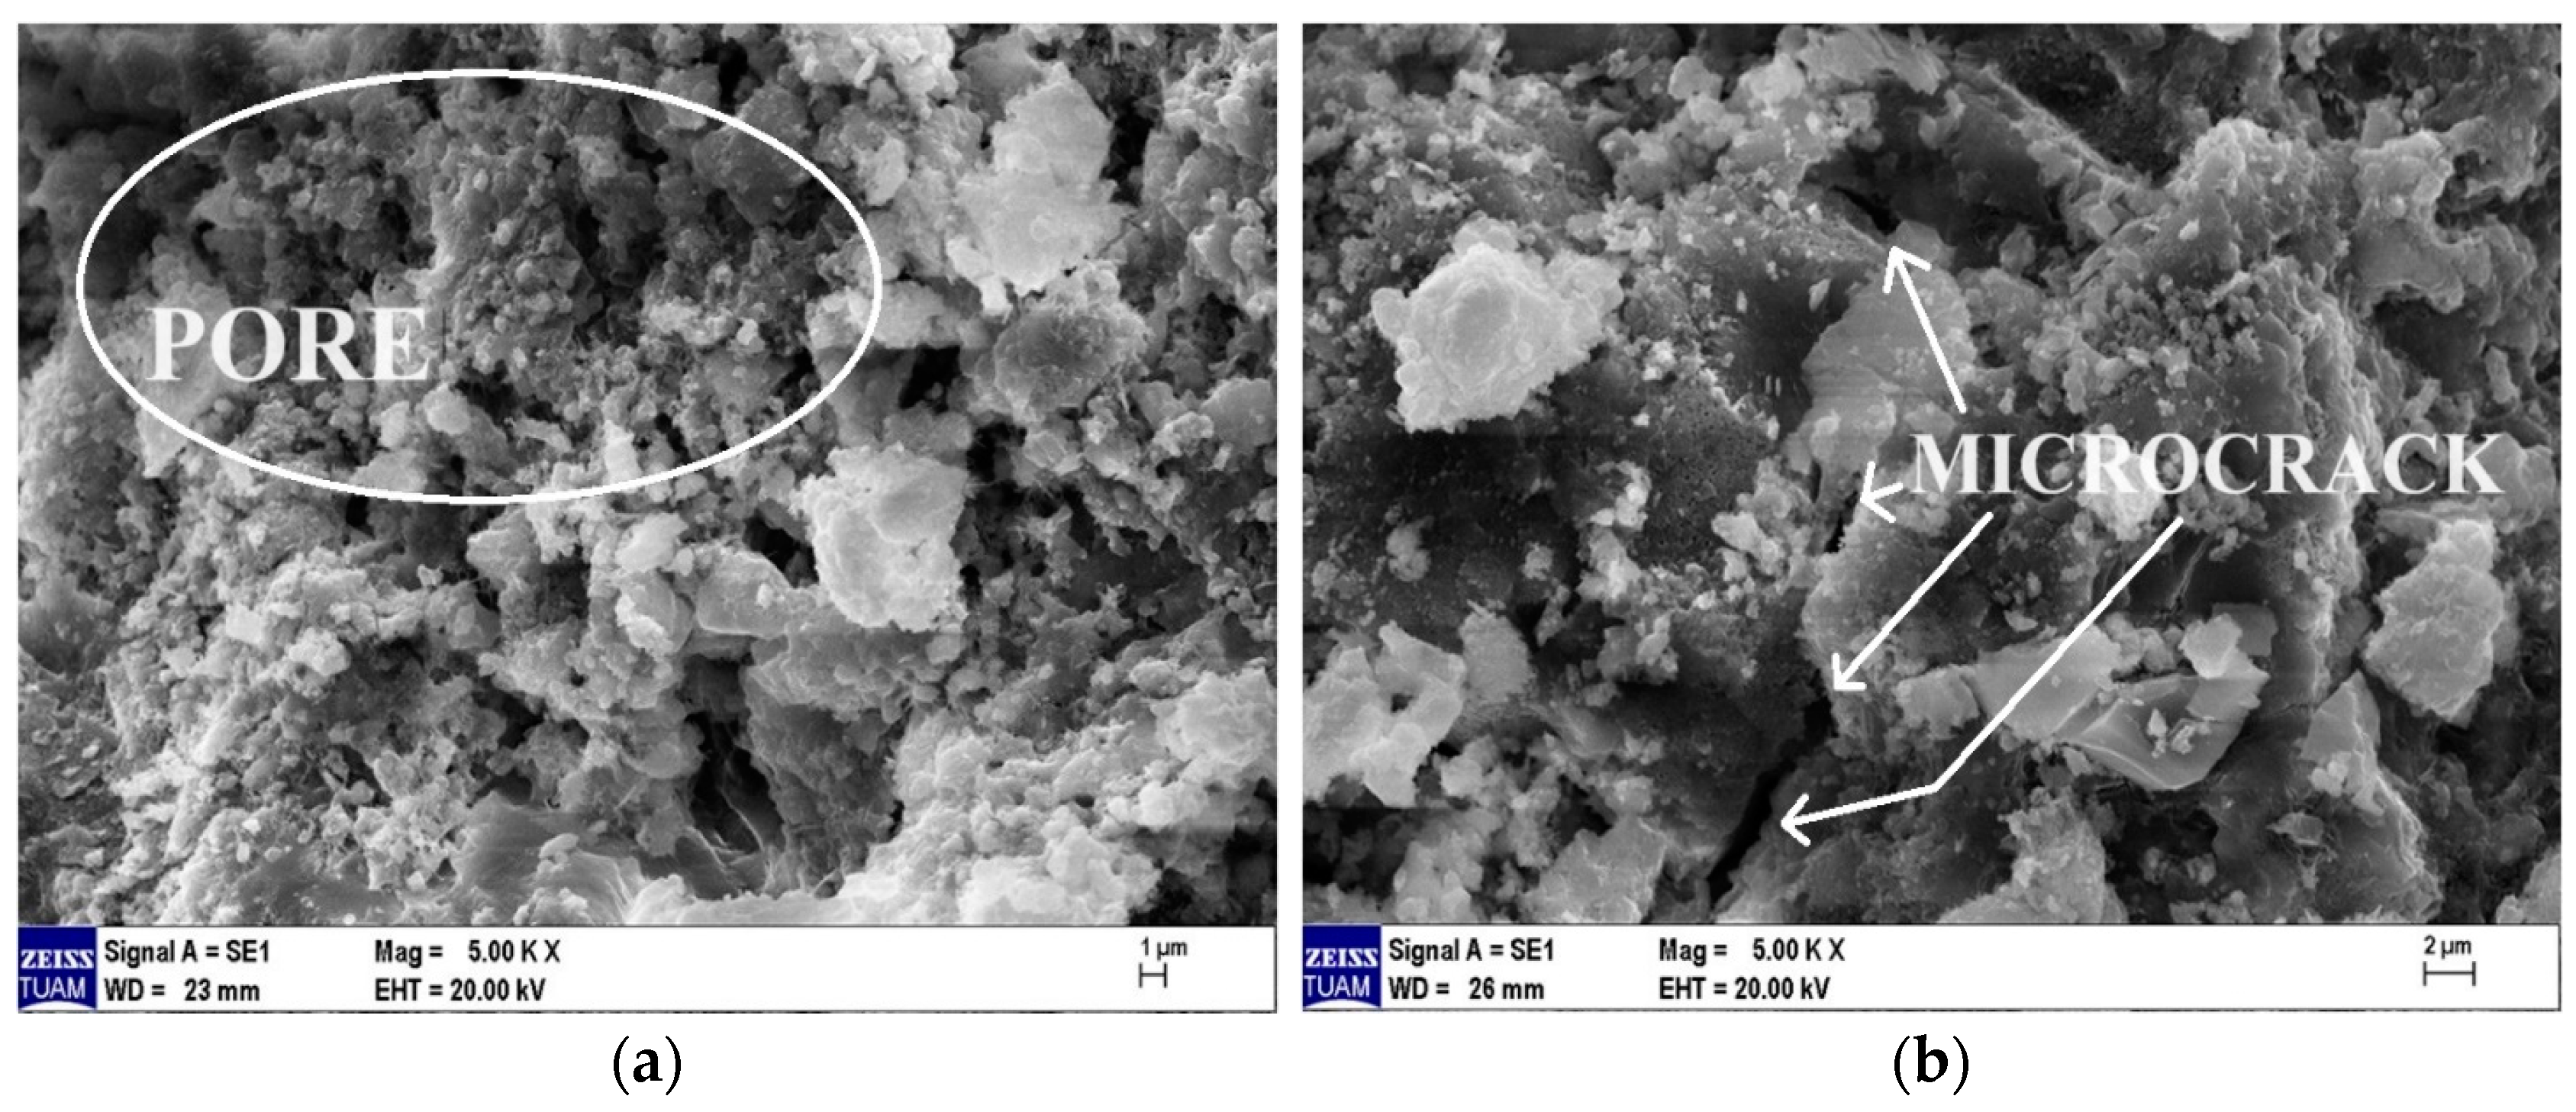
The SEM images of the Ref- and MP10-coded specimens after they were exposed to the high temperature of 600 °C and cooled with water are provided in Figure 22a and Figure 22b, respectively. When comparing these images in Figure 22 with the SEM images of the specimens tested in the laboratory environment shown in Figure 20, it can be stated that the C–S–H gel structure significantly deteriorated after high-temperature exposure, with an increase in microcracks and pore density. When comparing the SEM images of specimens cooled with water (Figure 22) with those of specimens cooled in the air (Figure 21), it is evident that the C–S–H structure is further damaged in the specimens cooled with water, and the number of pores and crack widths in the specimen matrix have increased. In conclusion, it can be said that the specimens exposed to high temperatures and cooled with water are more deformed than those cooled in the air.

Figure 22.
SEM images of samples cooled in water after 600 °C high-temperature exposure. (a) Ref, (b) MP10.
4. Conclusions
This study investigates the effects of high temperature and cooling regimes on the physical, mechanical, and microstructural properties of cementitious composites containing 5%, 10%, 15%, 20%, and 25% replacements with marble powder (MP). The cementitious composites were subjected to measurements of water absorption (Uw), ultrasonic pulse velocity (UPV), compressive strength (fcs), flexural strength (ffs), and mass loss after exposure to high temperature. Microstructural analyses were also conducted using scanning electron microscopy (SEM). The obtained results from the study are as follows:
- With an increase in the replacement percentage of MP, Uw values decreased. This can be attributed to the lower specific gravity of MP compared with cement. The Uw values of specimens cooled in water were higher than those of specimens cooled in air. This is because, after high-temperature exposure, the dehydration of calcium hydroxide (CH) results in its conversion to CaO, which undergoes rehydration during water cooling.
- UPV values decreased with an increase in the MP replacement percentage. This decrease might be attributed to reduced hydrated elements due to higher MP content, leading to a more porous cement matrix. The UPV values of specimens cooled in air are higher than those of specimens cooled in water. Rapid water cooling induces additional stress and cracks in the cement matrix, making the specimens more porous. Consequently, the UPV values of specimens cooled in water are lower than those of specimens cooled in air.
- The results obtained from fcs and ffs showed a similar trend. The best mechanical properties were observed in specimens with 5% MP replacement. As the replacement percentage increases, a deterioration in mechanical properties is observed. The fcs and ffs values of specimens cooled in water were lower than those of specimens cooled in air. This deterioration became more pronounced with an increase in the exposure temperature. The reduced mechanical properties of specimens cooled in water can be attributed to the additional stress and cracks induced by rapid cooling.
- The mass losses of all specimens increased with higher temperatures. This is attributed to the breakdown of hydrated elements with increasing temperature. An increase in the MP replacement percentage results in decreased mass losses. The mass losses of specimens cooled in air were higher than those of specimens cooled in water. This is due to the dehydration of CH into CaO after temperature exposure, followed by rehydration of CaO during water cooling. Rehydrated CaO absorbs water, increasing the mass of the specimen.
In conclusion, using MP in cementitious mixes significantly enhanced the physical, mechanical, and microstructural properties of cementitious materials exposed to high temperatures. As the MP replacement percentage increases, notable reductions in mass loss are identified. Furthermore, not only does the substitution of MP for cement have the potential to mitigate environmental pollution associated with MP disposal and lead to savings in cement consumption, it is also anticipated that using MP as a substitute for cement could decrease CO2 emissions and energy costs. Future research could explore the effects of alternative cooling methods beyond air and water cooling on MP-incorporated mixes exposed to high temperatures. In another study, the effect of MP particle size on the strength and durability properties of cementitious composites exposed to high temperatures can be examined. Decreasing the particle size would improve hydration and significantly contribute to the strength properties of the composites.
Author Contributions
Conceptualization, O.S. and I.D.; methodology, O.S. and I.D.; validation, O.S.; investigation, O.S. and İ.R.B.; resources, O.S. and İ.R.B.; writing—original draft preparation, O.S. and İ.R.B.; writing—review and editing, O.S., I.D. and İ.R.B.; supervision, O.S. and I.D. All authors have read and agreed to the published version of the manuscript.
Funding
This research received no external funding.
Institutional Review Board Statement
Not applicable.
Informed Consent Statement
Not applicable.
Data Availability Statement
Not applicable.
Conflicts of Interest
The authors declare no conflict of interest.
References
- Habert, G.; Bouzidi, Y.; Chen, C.; Jullien, A. Development of a depletion indicator for natural resources used in concrete. Resour. Conserv. Recycl. 2010, 54, 364–376. [Google Scholar] [CrossRef]
- Khan, E.U.; Khushnood, R.A.; Baloch, W.L. Spalling sensitivity and mechanical response of an ecofriendly sawdust high strength concrete at elevated temperatures. Constr. Build. Mater. 2020, 258, 119656. [Google Scholar] [CrossRef]
- Demir, İ.; Güzelkücük, S.; Sevim, Ö. Effects of sulfate on cement mortar with hybrid pozzolan substitution. Eng. Sci. Technol. Int. J. 2018, 21, 275–283. [Google Scholar] [CrossRef]
- Sun, Y.; Wang, K.Q.; Lee, H.S. Prediction of compressive strength development for blended cement mortar considering fly ash fineness and replacement ratio. Constr. Build. Mater. 2021, 271, 121532. [Google Scholar] [CrossRef]
- Kanagaraj, B.; Anand, N.; Andrushia, A.D.; Lubloy, E. Investigation on engineering properties and micro-structure characteristics of low strength and high strength geopolymer composites subjected to standard temperature exposure. Case Stud. Constr. Mater. 2022, 17, e01608. [Google Scholar] [CrossRef]
- Alakara, E.H.; Nacar, S.; Sevim, O.; Korkmaz, S.; Demir, I. Determination of compressive strength of perlite-containing slag-based geopolymers and its prediction using artificial neural network and regression-based methods. Constr. Build. Mater. 2022, 359, 129518. [Google Scholar] [CrossRef]
- Sevim, O.; Alakara, E.H.; Demir, I.; Bayer, I.R. Effect of magnetic water on properties of slag-based geopolymer composites incorporating ceramic tile waste from construction and demolition waste. Arch. Civ. Mech. Eng. 2023, 23, 107. [Google Scholar] [CrossRef]
- Altiok, M.; Alakara, E.H.; Gündüz, M.; Ağaoğlu, M.N. A multi-objective genetic algorithm for the hot mix asphalt problem. Neural Comput. Appl. 2023, 35, 8197–8225. [Google Scholar] [CrossRef]
- Danish, A.; Öz, A.; Bayrak, B.; Kaplan, G.; Aydın, A.C.; Ozbakkaloglu, T. Performance evaluation and cost analysis of prepacked geopolymers containing waste marble powder under different curing temperatures for sustainable built environment. Resour. Conserv. Recycl. 2023, 192, 106910. [Google Scholar] [CrossRef]
- Aliabdo, A.A.; Abd Elmoaty, M.; Auda, E.M. Re-use of waste marble dust in the production of cement and concrete. Constr. Build. Mater. 2014, 50, 28–41. [Google Scholar] [CrossRef]
- Rana, A.; Kalla, P.; Csetenyi, L.J. Sustainable use of marble slurry in concrete. J. Cleaner Prod. 2015, 94, 304–311. [Google Scholar] [CrossRef]
- Varadharajan, S.; Jaiswal, A.; Verma, S. Assessment of mechanical properties and environmental benefits of using rice husk ash and marble dust in concrete. Structures 2020, 28, 389–406. [Google Scholar] [CrossRef]
- Corinaldesi, V.; Moriconi, G. Influence of mineral additions on the performance of 100% recycled aggregate concrete. Constr. Build. Mater. 2009, 23, 2869–2876. [Google Scholar] [CrossRef]
- Aydın, E. Effects of elevated temperature for the marble cement paste products for better sustainable construction. J. Polytech. 2019, 22, 259–267. [Google Scholar]
- Parmar, S.; Das, S.K. Effect of marble slurry as a partial substitution of ordinary Portland cement in lean concrete mixes. Struct. Concr. 2021, 22, E514–E527. [Google Scholar] [CrossRef]
- Vardhan, K.; Goyal, S.; Siddique, R.; Singh, M. Mechanical properties and microstructural analysis of cement mortar incorporating marble powder as partial replacement of cement. Constr. Build. Mater. 2015, 96, 615–621. [Google Scholar] [CrossRef]
- Singh, M.; Srivastava, A.; Bhunia, D. An investigation on effect of partial replacement of cement by waste marble slurry. Constr. Build. Mater. 2017, 134, 471–488. [Google Scholar] [CrossRef]
- Siddique, S.; Jang, J.G.; Gupta, T. Developing marble slurry as supplementary cementitious material through calcination: Strength and microstructure study. Constr. Build. Mater. 2021, 293, 123474. [Google Scholar] [CrossRef]
- Khaliq, W.; Khan, H.A. High temperature material properties of calcium aluminate cement concrete. Constr. Build. Mater. 2015, 94, 475–487. [Google Scholar] [CrossRef]
- Karakoç, M.B. Effect of cooling regimes on compressive strength of concrete with lightweight aggregate exposed to high temperature. Constr. Build. Mater. 2013, 41, 21–25. [Google Scholar] [CrossRef]
- Baradaran-Nasiri, A.; Nematzadeh, M. The effect of elevated temperatures on the mechanical properties of concrete with fine recycled refractory brick aggregate and aluminate cement. Constr. Build. Mater. 2017, 147, 865–875. [Google Scholar] [CrossRef]
- Gökçe, H.S. High temperature resistance of boron active belite cement mortars containing fly ash. J. Cleaner Prod. 2019, 211, 992–1000. [Google Scholar] [CrossRef]
- Karahan, O.; Durak, U.; İlkentapar, S.; Atabey, İ.İ.; Atiş, C.D. Resistance of polypropylene fibered mortar to elevated temperature under different cooling regimes. Rev. Constr. 2019, 18, 386–397. [Google Scholar] [CrossRef]
- Sevim, O.; Demir, I.; Alakara, E.H.; Bayer, İ.R. Experimental Evaluation of New Geopolymer Composite with Inclusion of Slag and Construction Waste Firebrick at Elevated Temperatures. Polymers 2023, 15, 2127. [Google Scholar] [CrossRef]
- Baran, Y.; Gökçe, H.S.; Durmaz, M. Physical and mechanical properties of cement containing regional hazelnut shell ash wastes. J. Cleaner Prod. 2020, 259, 120965. [Google Scholar] [CrossRef]
- Wong, C.L.; Mo, K.H.; Alengaram, U.J.; Yap, S.P. Mechanical strength and permeation properties of high calcium fly ash-based geopolymer containing recycled brick powder. J. Build. Eng. 2020, 32, 101655. [Google Scholar] [CrossRef]
- Arif, R.; Khitab, A.; Kırgız, M.S.; Khan, R.B.N.; Tayyab, S.; Khan, R.A.; Tayyab, S.; Khan, R.A.; Anwar, W.; Arshad, M.T. Experimental analysis on partial replacement of cement with brick powder in concrete. Case Stud. Constr. Mater. 2021, 15, e00749. [Google Scholar] [CrossRef]
- Sevim, O.; Demir, İ.; Alakara, E.H.; Guzelkucuk, S.; Bayer, İ.R. The Effect of Magnetized Water on the Fresh and Hardened Properties of Slag/Fly Ash-Based Cementitious Composites. Buildings 2023, 13, 271. [Google Scholar] [CrossRef]
- Yamanel, K.; Durak, U.; İlkentapar, S.; Atabey, İ.İ.; Karahan, O.; Duran, C. Influence of waste marble powder as a replacement of cement on the properties of mortar. Rev. Constr. 2019, 18, 290–300. [Google Scholar] [CrossRef]
- Jiang, X.; Xiao, R.; Bai, Y.; Huang, B.; Ma, Y. Influence of waste glass powder as a supplementary cementitious material (SCM) on physical and mechanical properties of cement paste under high temperatures. J. Cleaner Prod. 2019, 340, 130778. [Google Scholar] [CrossRef]
- TS EN 196-1; Methods of Testing Cement–Part 1: Determination of Strength. Turkish Standards Institution: Ankara, Turkey, 2016.
- Nematzadeh, M.; Dashti, J.; Ganjavi, B. Optimizing compressive behavior of concrete containing fine recycled refractory brick aggregate together with calcium aluminate cement and polyvinyl alcohol fibers exposed to acidic environment. Constr. Build. Mater. 2018, 164, 837–849. [Google Scholar] [CrossRef]
- Khattab, M.; Hachemi, S.; Al Ajlouni, M.F. Evaluating the physical and mechanical properties of concrete prepared with recycled refractory brick aggregates after elevated temperatures’ exposure. Constr. Build. Mater. 2021, 311, 125351. [Google Scholar] [CrossRef]
- Gao, F.; Ji, Y.; Zhang, L.; Zhang, Z.; Xue, Q. High temperature resistance of a phase change cementitious material at elevated temperatures. Constr. Build. Mater. 2021, 292, 123456. [Google Scholar] [CrossRef]
- Mijowska, E.; Horszczaruk, E.; Sikora, P.; Cendrowski, K. The effect of nanomaterials on thermal resistance of cement-based composites exposed to elevated temperature. Mater. Today Proc. 2018, 5, 15968–15975. [Google Scholar] [CrossRef]
- Georgali, B.; Tsakiridis, P.E. Microstructure of fire-damaged concrete. A case study. Cem. Concr. Compos. 2005, 27, 255–259. [Google Scholar] [CrossRef]
- Alakara, E.H.; Sevim, O.; Demir, I.; Şimşek, O. Experimental study on firebrick powder-based cementitious composites under the effect of elevated temperature. J. Build. Eng. 2022, 61, 105277. [Google Scholar] [CrossRef]
- ASTM C642-13; Standard Test Method for Density, in Absorption, and Voids in Hardened Concrete. ASTM International: West Conshohocken, PA, USA, 2013.
- ASTM C597-16; Standard Test Method for Pulse Velocity Through Concrete. ASTM International: West Conshohocken, PA, USA, 2016.
- Whitehurst, E. Soniscope tests concrete structures. J. Am. Concr. Inst. 1951, 47, 433–444. [Google Scholar]
- Qasrawi, H.Y. Concrete strength by combined nondestructive methods simply and reliably predicted. Cem. Concr. Res. 2000, 30, 739–746. [Google Scholar] [CrossRef]
- Seghir, N.T.; Mellas, M.; Sadowski, Ł.; Żak, A. Effects of marble powder on the properties of the air-cured blended cement paste. J. Cleaner Prod. 2018, 183, 858–868. [Google Scholar] [CrossRef]
- Sarıdemir, M.; Çelikten, S.; Yıldırım, A. Mechanical and microstructural properties of calcined diatomite powder modified high strength mortars at ambient and high temperatures. Adv. Powder Technol. 2020, 31, 3004–3017. [Google Scholar] [CrossRef]
- Hiremath, P.N.; Yaragal, S.C. Performance evaluation of reactive powder concrete with polypropylene fibers at elevated temperatures. Constr. Build. Mater. 2018, 169, 499–512. [Google Scholar] [CrossRef]
- Arioz, O. Retained properties of concrete exposed to high temperatures: Size effect. Fire Mater. 2009, 33, 211–222. [Google Scholar] [CrossRef]
- Al-Mutairi, N.; Terro, M.; Al-Khaleefi, A.L. Effect of recycling hospital ash on the compressive properties of concrete: Statistical assessment and predicting model. Build. Environ. 2004, 39, 557–566. [Google Scholar] [CrossRef]
- Ibrahim, R.K.; Ramyar, K.; Hamid, R.; Raihan Tah, M. The effect of high temperature on mortars containing silica fume. J. Appl. Sci. 2011, 11, 2666–2669. [Google Scholar] [CrossRef]
- AzariJafari, H.; Amiri, M.J.T.; Ashrafian, A.; Rasekh, H.; Barforooshi, M.J.; Berenjian, J. Ternary blended cement: An eco-friendly alternative to improve resistivity of high-performance self-consolidating concrete against elevated temperature. J. Cleaner Prod. 2019, 223, 575–586. [Google Scholar] [CrossRef]
- Topcu, I.B.; Demir, A. Effect of fire and elevated temperatures on reinforced concrete structures. Bull. Chamber Civ. Eng. 2002, 16, 34–36. [Google Scholar]
- Awal, A.A.; Shehu, I.A.; Ismail, M. Effect of cooling regime on the residual performance of high-volume palm oil fuel ash concrete exposed to high temperatures. Constr. Build. Mater. 2015, 98, 875–883. [Google Scholar] [CrossRef]
- Kara, İ.B.; Arslan, M. Effects of plasticizer and antifreeze on concrete at elevated temperatures and different cooling regimes. Rev. Constr. 2020, 19, 347–357. [Google Scholar]
- Benaicha, M.; Jalbaud, O.; Alaoui, A.H.; Burtschell, Y. Correlation between the mechanical behavior and the ultrasonic velocity of fiber-reinforced concrete. Constr. Build. Mater. 2015, 101, 702–709. [Google Scholar] [CrossRef]
- Mashaly, A.O.; El-Kaliouby, B.A.; Shalaby, B.N.; El–Gohary, A.M.; Rashwan, M.A. Effects of marble sludge incorporation on the properties of cement composites and concrete paving blocks. J. Cleaner Prod. 2015, 112, 731–741. [Google Scholar] [CrossRef]
- Dias, W.P.S.; Khoury, G.A.; Sullivan, P.J.E. Mechanical properties of hardened cement paste exposed to temperatures up to 700 C (1292 F). ACI Mater. J. 1990, 87, 160–166. [Google Scholar]
- Alani, S.; Hassan, M.S.; Jaber, A.A.; Ali, I.M. Effects of elevated temperatures on strength and microstructure of mortar containing nano-calcined montmorillonite clay. Constr. Build. Mater. 2020, 263, 120895. [Google Scholar] [CrossRef]
- Wang, W.; Lu, C.; Li, Y.; Li, Q. An investigation on thermal conductivity of fly ash concrete after elevated temperature exposure. Constr. Build. Mater. 2017, 148, 148–154. [Google Scholar] [CrossRef]
- Xie, J.; Zhang, Z.; Lu, Z.; Sun, M. Coupling effects of silica fume and steel-fiber on the compressive behaviour of recycled aggregate concrete after exposure to elevated temperature. Constr. Build. Mater. 2018, 184, 752–764. [Google Scholar] [CrossRef]
- Hertz, K.D. Concrete strength for fire safety design. Mag. Concr. Res. 2005, 57, 445–453. [Google Scholar] [CrossRef]
- Yüzer, N.; Aköz, F.; Öztürk, L.D. Compressive strength–color change relation in mortars at high temperature. Cem. Concr. Res. 2004, 34, 1803–1807. [Google Scholar] [CrossRef]
- Karahan, O. Residual compressive strength of fire-damaged mortar after post-fire-air-curing. Fire Mater. 2011, 35, 561–567. [Google Scholar] [CrossRef]
- Abadel, A.; Elsanadedy, H.; Almusallam, T.; Alaskar, A.; Abbas, H.; Al-Salloum, Y. Residual compressive strength of plain and fiber reinforced concrete after exposure to different heating and cooling regimes. Eur. J. Environ. Civ. Eng. 2022, 26, 6746–6765. [Google Scholar] [CrossRef]
- Gurumoorthy, N. Influence of marble dust as a partial replacement of cement in concrete. Int. J. Eng. Res. Technol. 2014, 4, 740–743. [Google Scholar]
- Ali, M.M.; Hashmi, S.M. An experimental investigation on strengths characteristics of concrete with the partial replacement of cement by marble powder dust and sand by stone dust. Int. J. Sci. Res. Dev. 2014, 2, 360–368. [Google Scholar]
- Sarıdemir, M.; Yıldırım, A. Effect of elevated temperatures on properties of high strength mortars containing ground calcined diatomite with limestone sand. J. Build. Eng. 2022, 56, 104748. [Google Scholar] [CrossRef]
- Nasr, D.; Pakshir, A.H.; Ghayour, H. The influence of curing conditions and alkaline activator concentration on elevated temperature behavior of alkali activated slag (AAS) mortars. Constr. Build. Mater. 2018, 190, 108–119. [Google Scholar] [CrossRef]
- Ameri, F.; Shoaei, P.; Zahedi, M.; Karimzadeh, M.; Musaeei, H.R.; Cheah, C.B. Physico-mechanical properties and micromorphology of AAS mortars containing copper slag as fine aggregate at elevated temperature. J. Build. Eng. 2021, 39, 102289. [Google Scholar] [CrossRef]
- Alarcon-Ruiz, L.; Platret, G.; Massieu, E.; Ehrlacher, A. The use of thermal analysis in assessing the effect of temperature on a cement paste. Cem. Concr. Res. 2005, 35, 609–613. [Google Scholar] [CrossRef]
- Husem, M. The effects of high temperature on compressive and flexural strengths of ordinary and high-performance concrete. Fire Saf. J. 2006, 41, 155–163. [Google Scholar] [CrossRef]
- Sarshar, R.; Khoury, G.A. Material and environmental factors influencing the compressive strength of unsealed cement paste and concrete at high temperatures. Mag. Concr. Res. 1993, 45, 51–61. [Google Scholar] [CrossRef]
- Jacques, K.T.J.; Zengyao, W.; Shoude, W.; Shifeng, H.; Xin, C. The influence of different fine aggregate and cooling regimes on the engineering properties of sulphoaluminate cement mortar after heating. Case Stud. Constr. Mater. 2023, 18, e01866. [Google Scholar] [CrossRef]
- Sevim, O.; Alakara, E.H.; Guzelkucuk, S. Fresh and Hardened Properties of Cementitious Composites Incorporating Firebrick Powder from Construction and Demolition Waste. Buildings 2023, 13, 45. [Google Scholar] [CrossRef]


Disclaimer/Publisher’s Note: The statements, opinions and data contained in all publications are solely those of the individual author(s) and contributor(s) and not of MDPI and/or the editor(s). MDPI and/or the editor(s) disclaim responsibility for any injury to people or property resulting from any ideas, methods, instructions or products referred to in the content. |
© 2023 by the authors. Licensee MDPI, Basel, Switzerland. This article is an open access article distributed under the terms and conditions of the Creative Commons Attribution (CC BY) license (https://creativecommons.org/licenses/by/4.0/).