Article

Mechanical and Deformation Performance of Masonry Walls with Low-Strength Mortar Retrofitting Using Spray-on Polyurethane Coating

1
College of Civil Engineering, Huaqiao University, Xiamen 361021, China
2
Key Laboratory for Structural Engineering and Disaster Prevention of Fujian Province, Huaqiao University, Xiamen 361021, China
3
CITIC General Institute of Architectural Design and Research Co., Ltd., Wuhan 430010, China
*
Author to whom correspondence should be addressed.
Buildings 2023, 13(10), 2470; https://doi.org/10.3390/buildings13102470
Submission received: 29 August 2023 / Revised: 18 September 2023 / Accepted: 27 September 2023 / Published: 28 September 2023

Abstract

:
This study aimed to investigate the feasibility and effectiveness of spray-on polyurethane coating as a seismic strengthening method for rural masonry buildings. Three masonry wall specimens were tested under cyclic lateral loading, including a control specimen, a single-side strengthened specimen, and a double-side strengthened specimen. Digital image correlation (DIC) techniques were used to evaluate full-field strain, crack width, and failure progression in a non-contact manner. The seismic performances were compared in terms of failure mode, hysteretic behavior, skeleton curve, deformation performance, energy dissipation capacity, and stiffness degradation. Results indicated that a spray-on polyurethane coating effectively delayed the onset and progression of cracks, postponing the peak load and slowing strength and stiffness degradation. Compared to the unstrengthened specimen, the bearing capacity, ultimate displacement, and cumulative energy dissipation of the single-side strengthened specimen increased by 20%, 60%, and 514%, respectively. Compared to the single-side strengthened specimen, the double-side strengthened specimen BW-D exhibited improved integrity, deformation capacity, and energy dissipation capacity. Its ultimate displacement and cumulative energy dissipation increased by 28% and 10%, respectively.

1. Introduction

Masonry structures, among the oldest forms of construction, are prevalent worldwide. However, many masonry structures, particularly those in rural areas, suffer from defects such as poor construction quality and lack of effective seismic measures. These deficiencies make them susceptible to damage or collapse during earthquakes, resulting in significant casualties and economic losses [1,2,3]. For this reason, numerous methods for strengthening masonry structures have been developed and improved, including ferrocement overlay retrofitting [4,5,6,7], external bonded fiber reinforced polymer (FRP) [8,9,10,11], near-surface mounted (NSM) technique [12,13,14,15,16], textile-reinforced mortars (TRM) [17,18,19,20,21], ultra-high ductile concrete [22], and polymer mortar and steel strips [23,24]. While the effectiveness of these strengthening schemes was confirmed in the past, their complexity and excessive cost make them unsuitable for rural areas lacking professional design and construction personnel. Therefore, it is necessary to further develop a low-cost strengthening scheme with simplified details.
Polyurethane, a high-strength polymer, exhibits properties such as high extensibility, energy absorption, cost-effectiveness, and rapid gelling and curing [25]. Due to these attractive characteristics, researchers have initiated investigations into the effectiveness of spray-on polyurethane coatings for protecting masonry structures against blast effects.
The Air Force Research Laboratory [26,27] at the Tyndall Air Force Base conducted a series of blast tests on polymer-coated reinforced masonry walls. The results demonstrated that the polyurethane coating could absorb and dissipate blast energy through elastic–plastic deformation. Moreover, it was effective in reducing damage caused by the dispersion of debris. Hrynyk and Myers [28] conducted out-of-plane loading tests on infilled frame walls strengthened with polyurea material and demonstrated the protective effect of polyurethane on masonry structures against mild explosions. Given these results, it is therefore reasonable to infer that this strengthening scheme may also be effective in enhancing seismic performance of masonry structures. Moreover, this method, which utilizes a hand-held spray gun, is accessible and does not require specialized tools or professional technicians. However, there is limited research on the seismic performance of masonry walls strengthened with polyurethane coating, and further investigation is necessary to verify its effectiveness in improving the seismic performance of masonry structures.
The primary aim of this study was to experimentally evaluate the effectiveness of spray-on polyurethane coatings in reinforcing seismically-deficient masonry walls. For this purpose, monotonic tensile tests and shear bond strength tests were performed on polyurethane samples. Additionally, one unstrengthened masonry wall and two masonry walls strengthened with spray-on polyurethane coating were subjected to in-plane low cyclic loading. The damage characteristics, hysteretic behavior, skeleton curves, strength and stiffness degradation, deformation properties, and energy dissipation capacity of three walls were analyzed and compared. The results demonstrate the potential of spray-on polyurethane coatings to enhance the seismic performance of masonry structures and provide valuable insights for future research and practical applications.

2. Polyurethane Elastomer Mechanical Properties

A common commercial polyurethane material composed of an isocyanate solution and a hydroxyl compound solution was used in this study. Monotonic tensile tests and shear bond strength tests were conducted to further understand the basic mechanical properties of polyurethane elastomers.

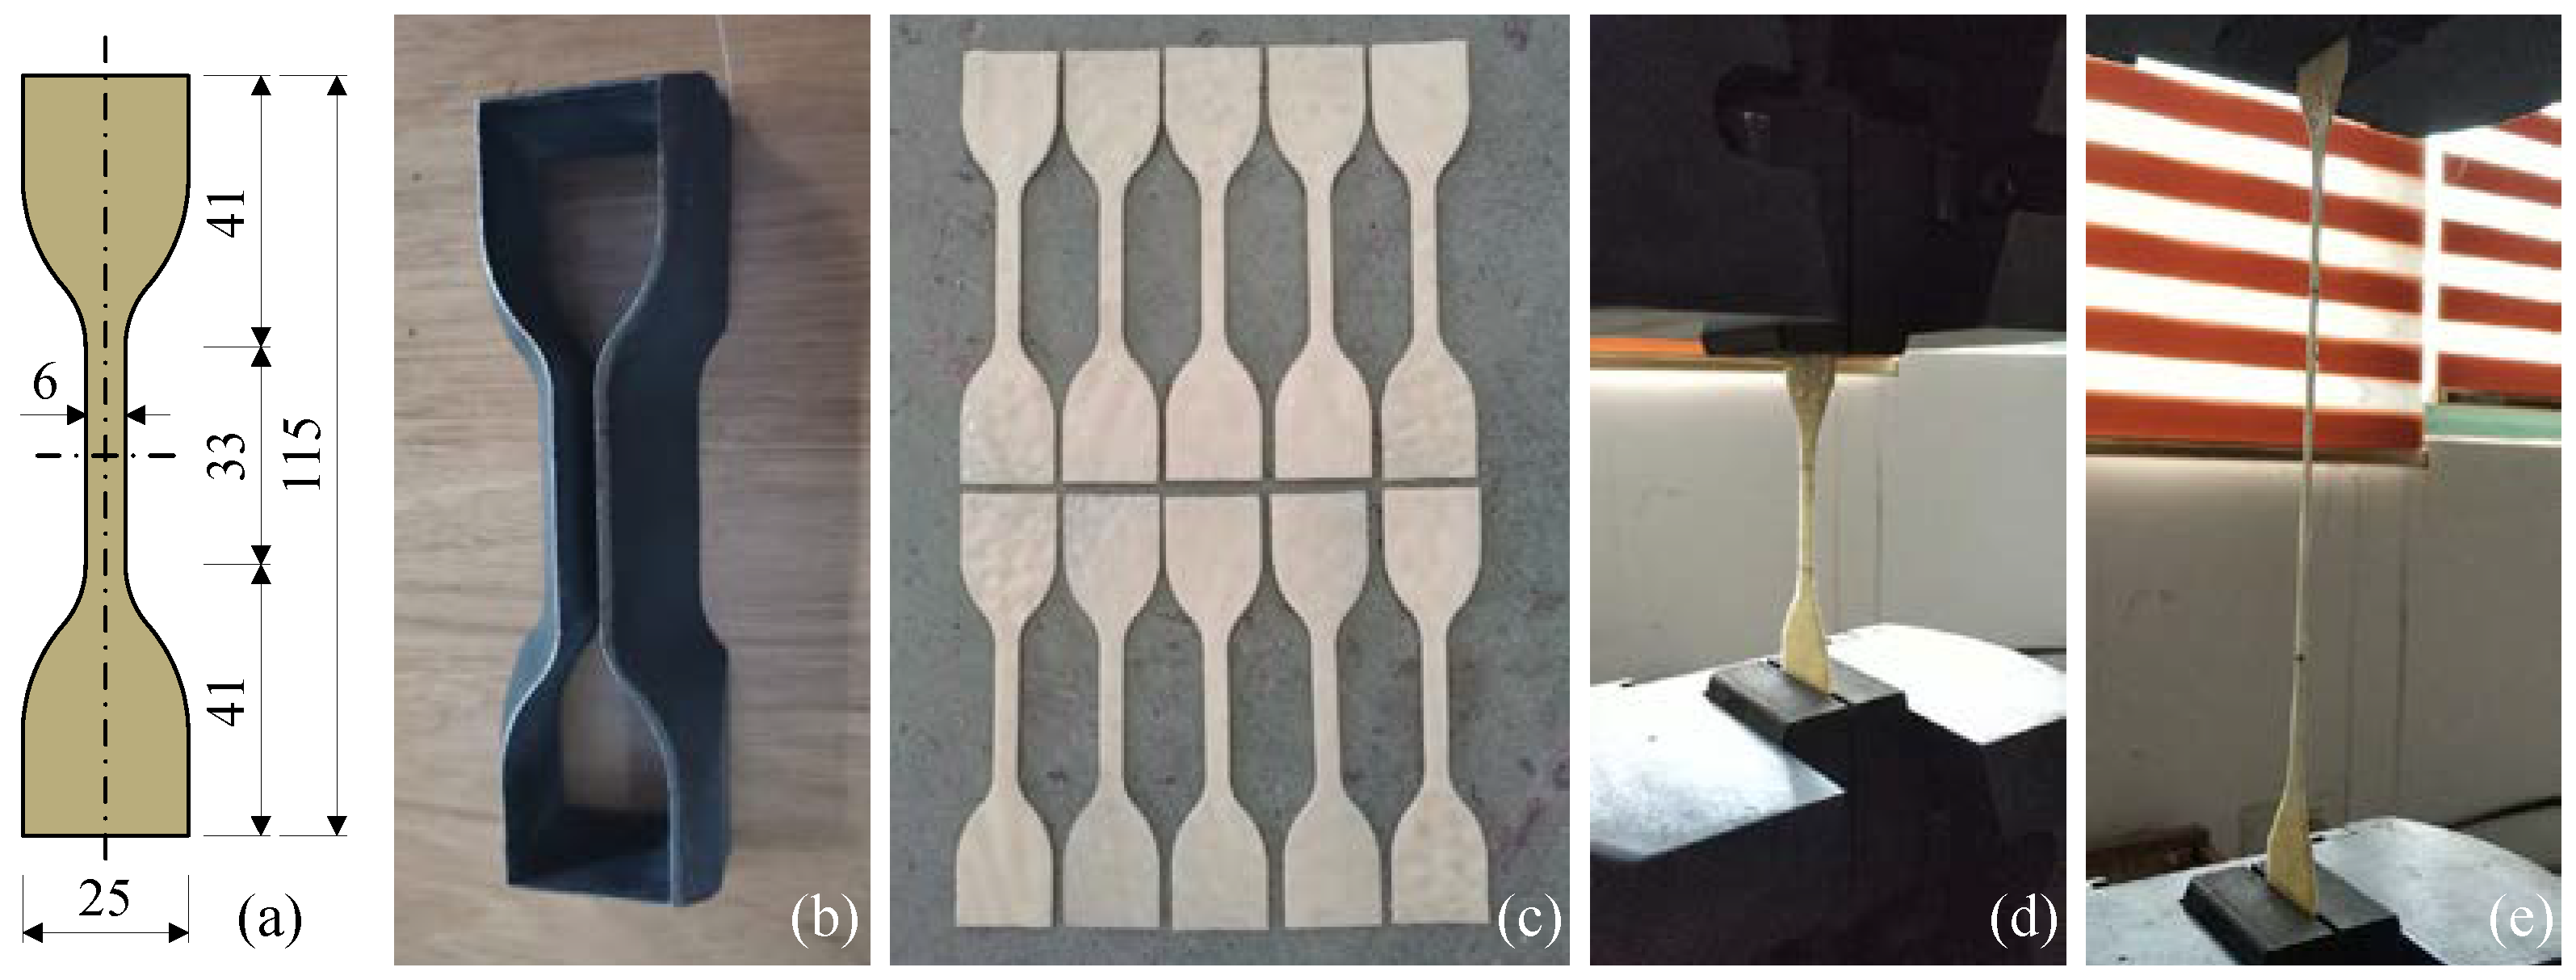
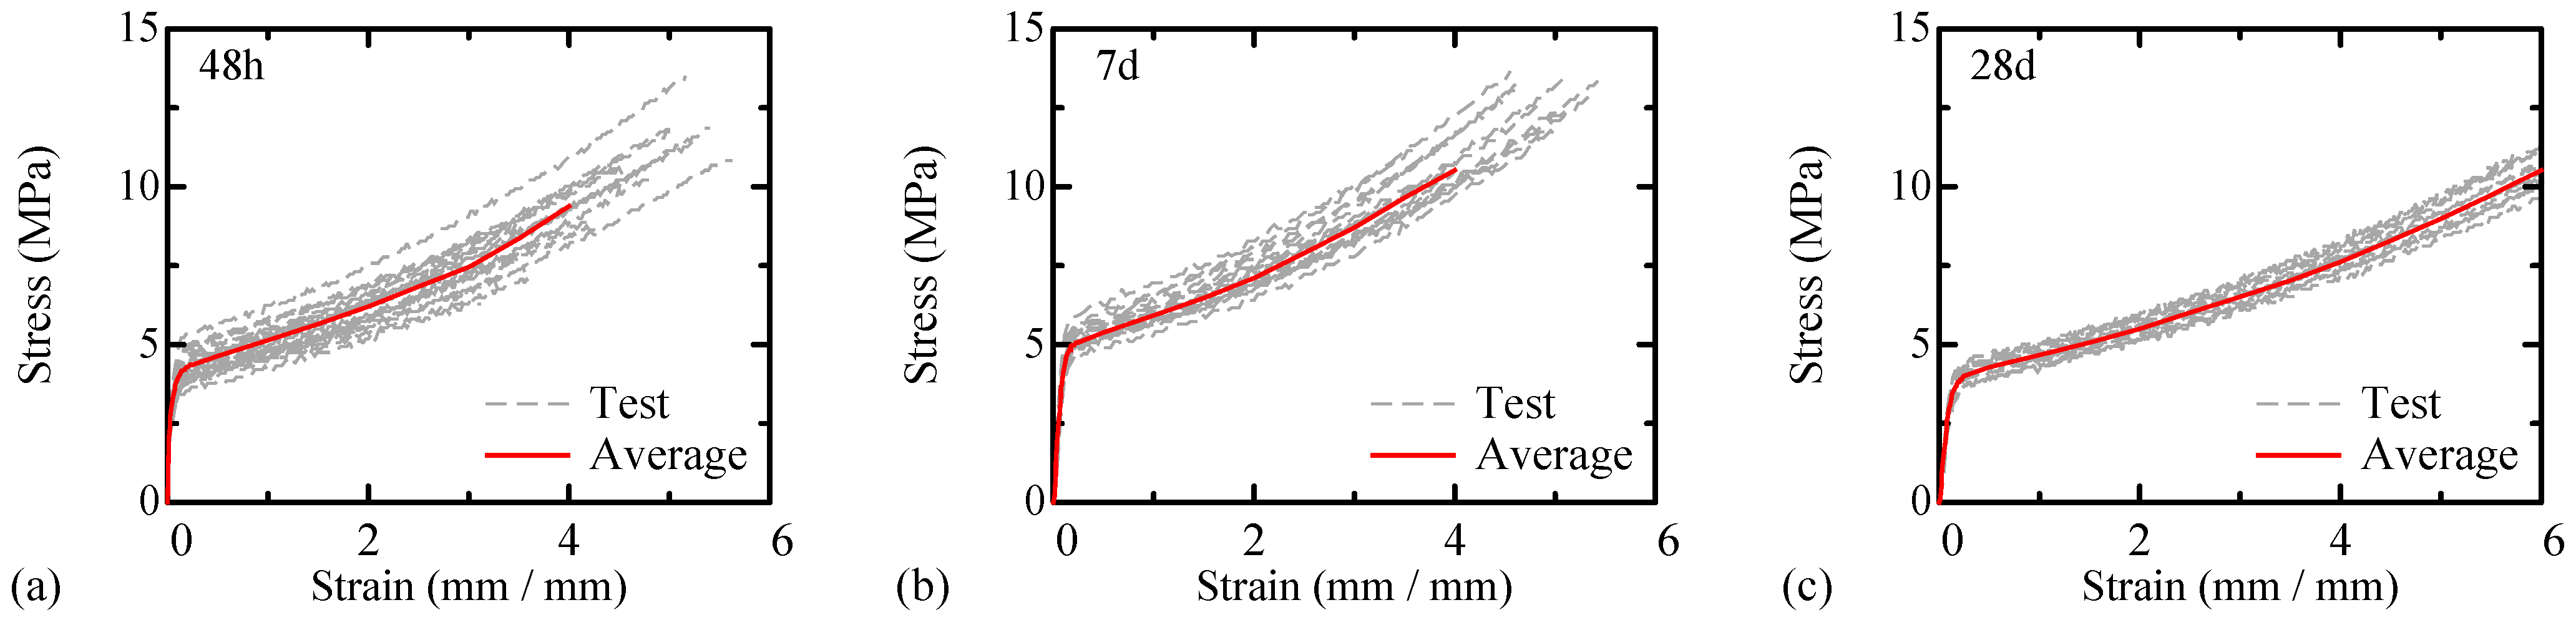
2.1. Monotonic Tensile Test

To determine the tensile stress–strain relationship of a polyurethane elastomer, a series of uniaxial tensile tests were conducted. Figure 1 illustrates the characteristics of the test coupons and their morphology during the early and late stages of the tensile test. The coupons were prepared from a polyurethane sheet using a specialized cutter (Figure 1b), and their thickness was measured at two ends and the center, yielding values ranging from 1.1 to 2.3 mm with an average of 1.6 mm. Monotonic tensile tests were performed on 36 coupons divided into three groups at ages of 2, 7, and 28 days using an MTS servo-hydraulic universal testing machine. The loading process was displacement-controlled at a rate of 250 mm/min in accordance with GB/T 528-2009 [29]. The polyurethane elastomer exhibited excellent extensibility during tensile testing, as evidenced by its ability to stretch to several times its original length without fracturing (Figure 1e).
Figure 2 presents the tensile stress–strain curves of polyurethane coupons at different ages, with test results and corresponding coefficients of variation (COV) summarized in Table 1. The tensile stress–strain curves can be simplified into two linear segments: an elastic segment and a hardening segment, with the stiffness of the latter being approximately 3% of the elastic modulus. The average values of the elastic modulus, tensile strength, and elongation at fracture for all coupons were 45.2 MPa, 11.7 MPa, and 5.5, respectively. Within the test range, the elastic modulus of the test coupons decreased with increasing age, while tensile strength and elongation at fracture showed little change with increasing age. These results demonstrate that the material properties of polyurethane are predictable, making it convenient for design and engineering applications. The polyurethane elastomer exhibited a low elastic modulus and high elongation, with no significant change in fracture tensile stress as a function of age.

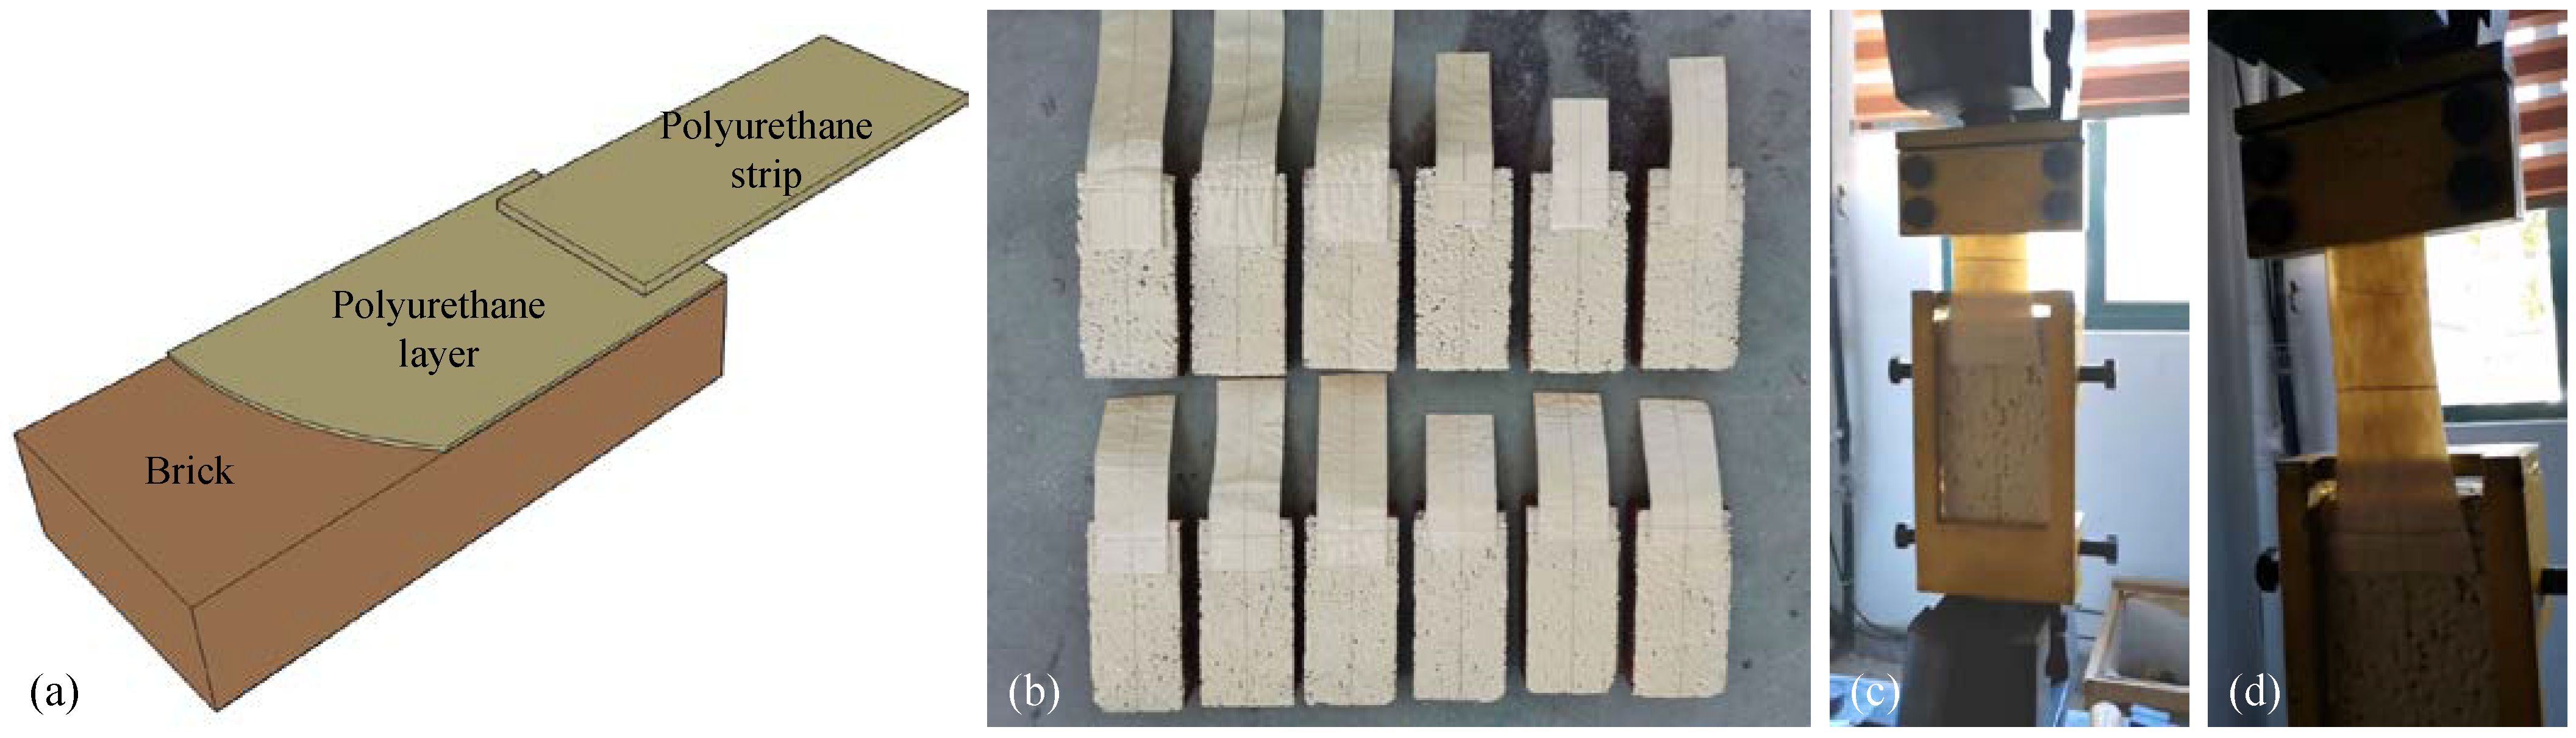
2.2. Shear Bond Strength Test

To confirm the bond strength between the polyurethane coating and the brick, twelve shear bond tests were conducted. The test specimen, as shown in Figure 3a,b, consisted of a brick with a polyurethane coating on its upper surface and a polyurethane strip extending beyond the brick. After curing for 24 h, the specimens were connected to a pre-manufactured connecting device and tested using an MTS servo-hydraulic universal testing machine. Figure 3c,d show photographs of the specimen at early and late stages of loading. During loading, the polyurethane strip visibly deformed while there was almost no deformation at the interface between the brick and polyurethane. As a result, interfacial bond-slip curve data could not be measured as expected. However, the bond between the polyurethane and brick was sufficient, as indicated by the final failure mode being the polyurethane fracture.

3. Experiment Program
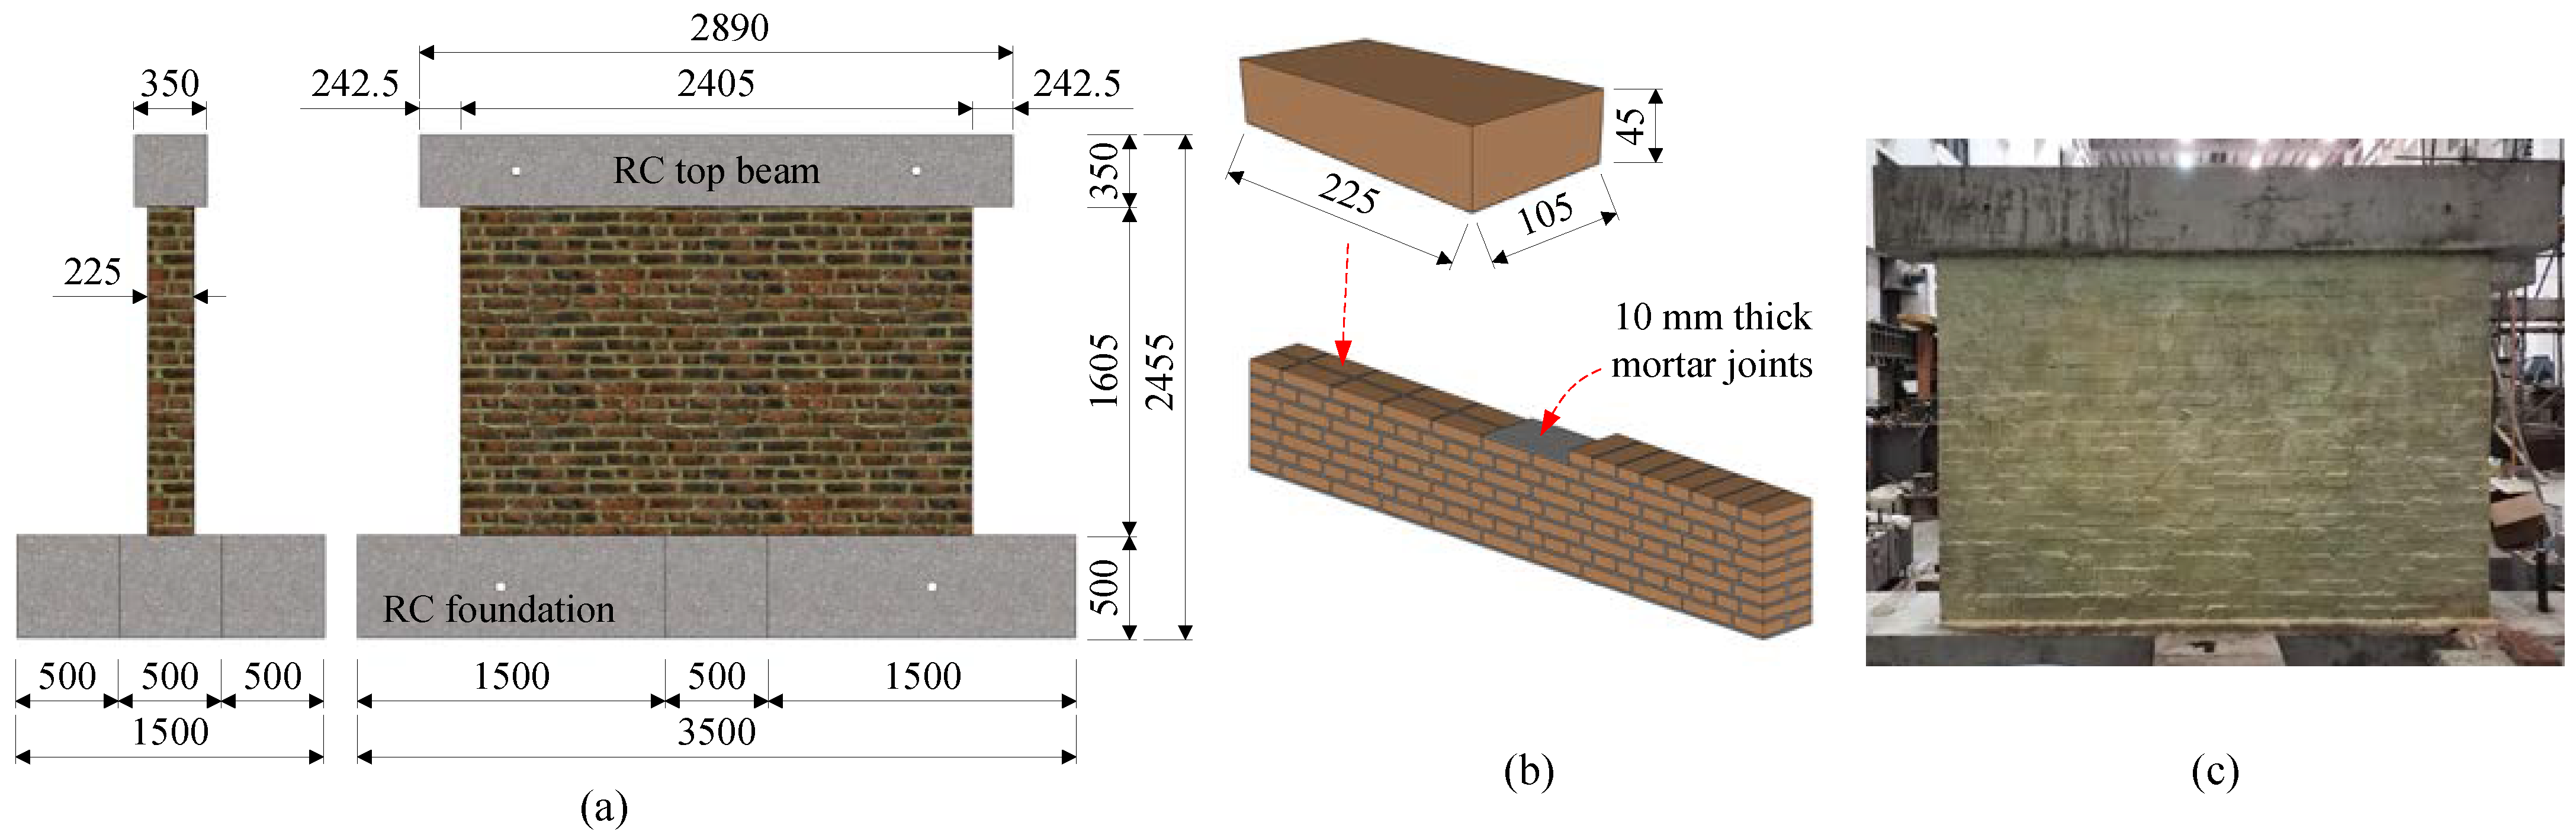
3.1. Test Specimens

A comprehensive experimental investigation was conducted by testing three specimens: an unreinforced clay brick masonry wall (BW-U), a polyurethane single-side spraying reinforced wall (BW-S), and a polyurethane double-side spraying reinforced wall (BW-D). The description of the specimens and variables is listed in Table 2. The geometric dimensions, brick bonding patterns, and construction method of the three specimens were identical, as shown in Figure 4. The walls measured 1605 × 2405 × 225 mm (height × length × thickness), with aspect (height to length) and slenderness (height to thickness) ratios of 1.50 and 7.13, respectively. All three masonry walls were constructed in an English Bond pattern by the same masonry worker using burnt clay bricks of size 225 × 105 × 45 mm and cement mortar, as shown in Figure 4b. English Bond, a pattern formed by laying alternate courses of stretchers and headers, is commonly adopted in rural areas of China.
The wall panels were cured for 28 days under laboratory conditions. Subsequently, specimens BW-S and BW-D were strengthened using a three-step procedure. First, loose and excess mortar were removed from the joints, and the wall panel surfaces were cleaned. Second, any insufficient mortar at the joint was filled using cement mortar. Finally, the uncured polyurethane elastomer was uniformly sprayed onto the wall panel surfaces using a handheld spray gun. The high viscosity of the uncured polyurethane ensured a reliable adhesion to the bricks. Three surfaces, including one surface of BW-S and two surfaces of BW-D, were sprayed with polyurethane three times to ensure uniform thickness (Figure 4c). Post-testing measurements showed that the thickness of the polyurethane coating on the wall panels ranged from 3 mm to 4 mm.

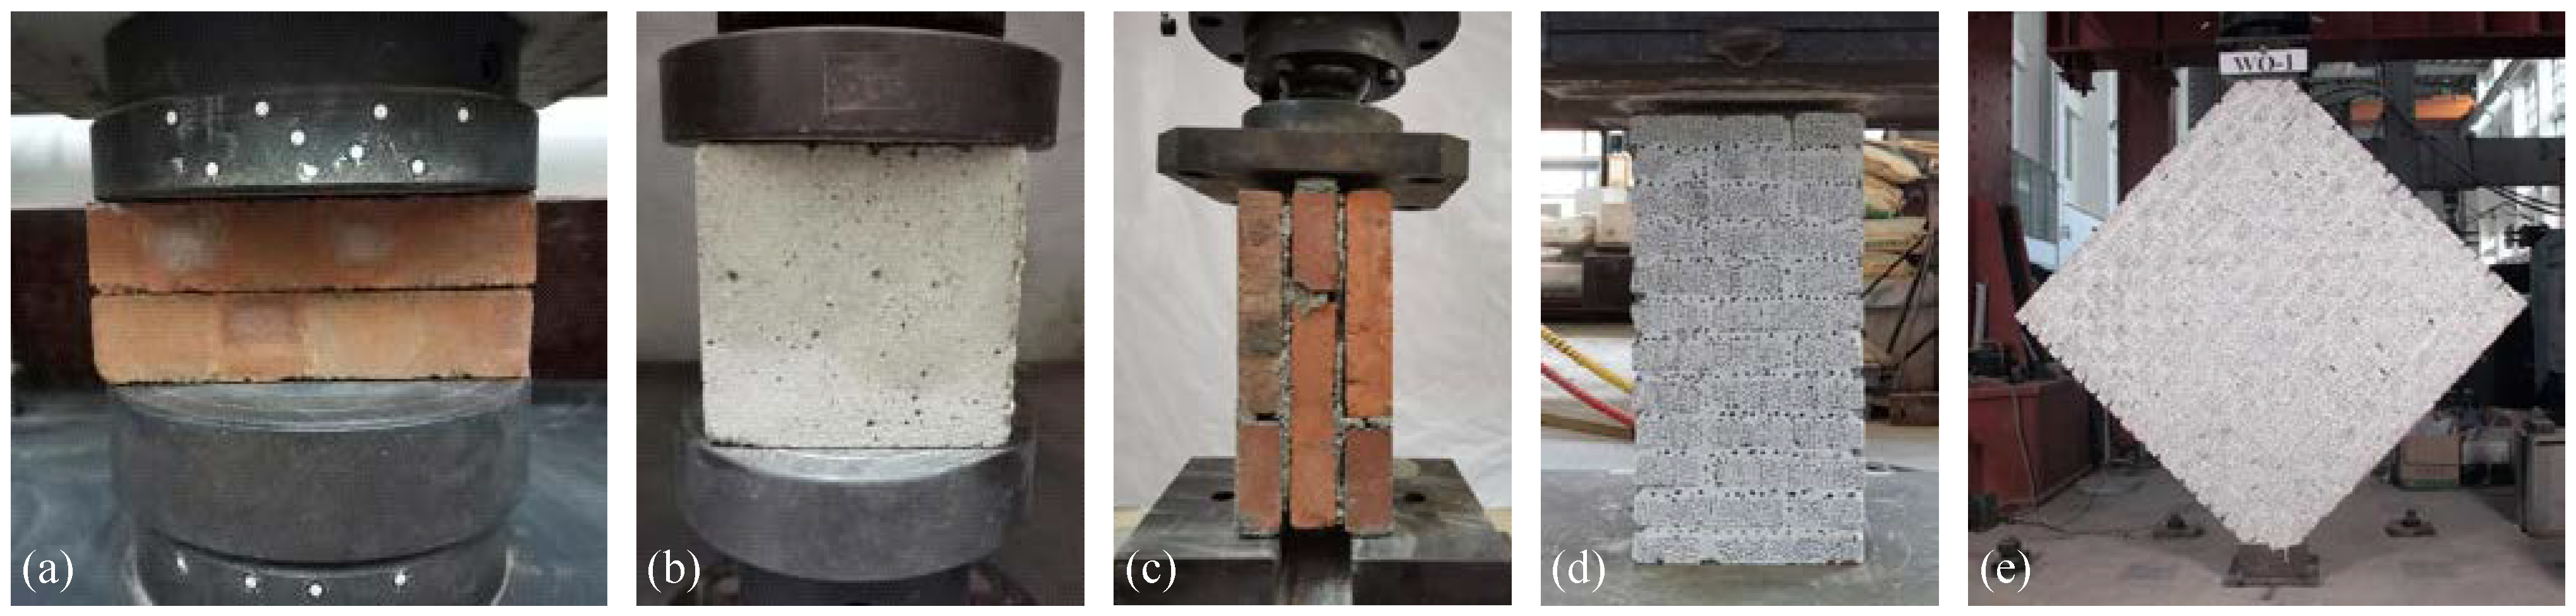
3.2. Mechanical Characterization of The Materials

The materials used to build the wall panels, including burnt clay bricks, cement, and sand, were from the same supplier in the same batch. Mechanical properties of the bricks, mortar, and masonry elements were characterized through several laboratory tests (Figure 5), with results and corresponding COV summarized in Table 3. Ten compression tests were conducted on burnt clay bricks in accordance with GB/T 2542-2012 [30], yielding an average compressive strength of 26.4 MPa (COV 9.4%) after eliminating an abnormal data point. The mortar used in the wall panel construction was mixed in a ratio of 1:11:2.1 (cement/sand/water). Six 70.5 mm mortar cubes were subjected to compression tests in accordance with JGJ/T 70-2009 [31], yielding an average compressive strength of 2.3 MPa (COV 2.9%).
Further experimental tests, including shear bond strength, compression, and shear tests, were conducted to characterize the mechanical properties of the masonry elements. Nine specimens were constructed and tested in accordance with GB/T 50129-2011 [32] to measure the shear bond strength between mortar joints and bricks (Figure 5c), yielding an average shear bond strength of approximately 0.13 MPa (COV 63.2%). Six compression tests were performed on 340 × 225 × 705 mm (width × length × height) masonry prisms in accordance with GB/T 50129 (Figure 5d), resulting in an average compressive strength of 4.1 MPa (COV 17.9%). Two diagonal compression tests were conducted to measure the shear behavior of the masonry wall panels (see reference [33] for details), with an average shear strength of 0.17 MPa (COV 1.8%) calculated in accordance with the method described in [34].

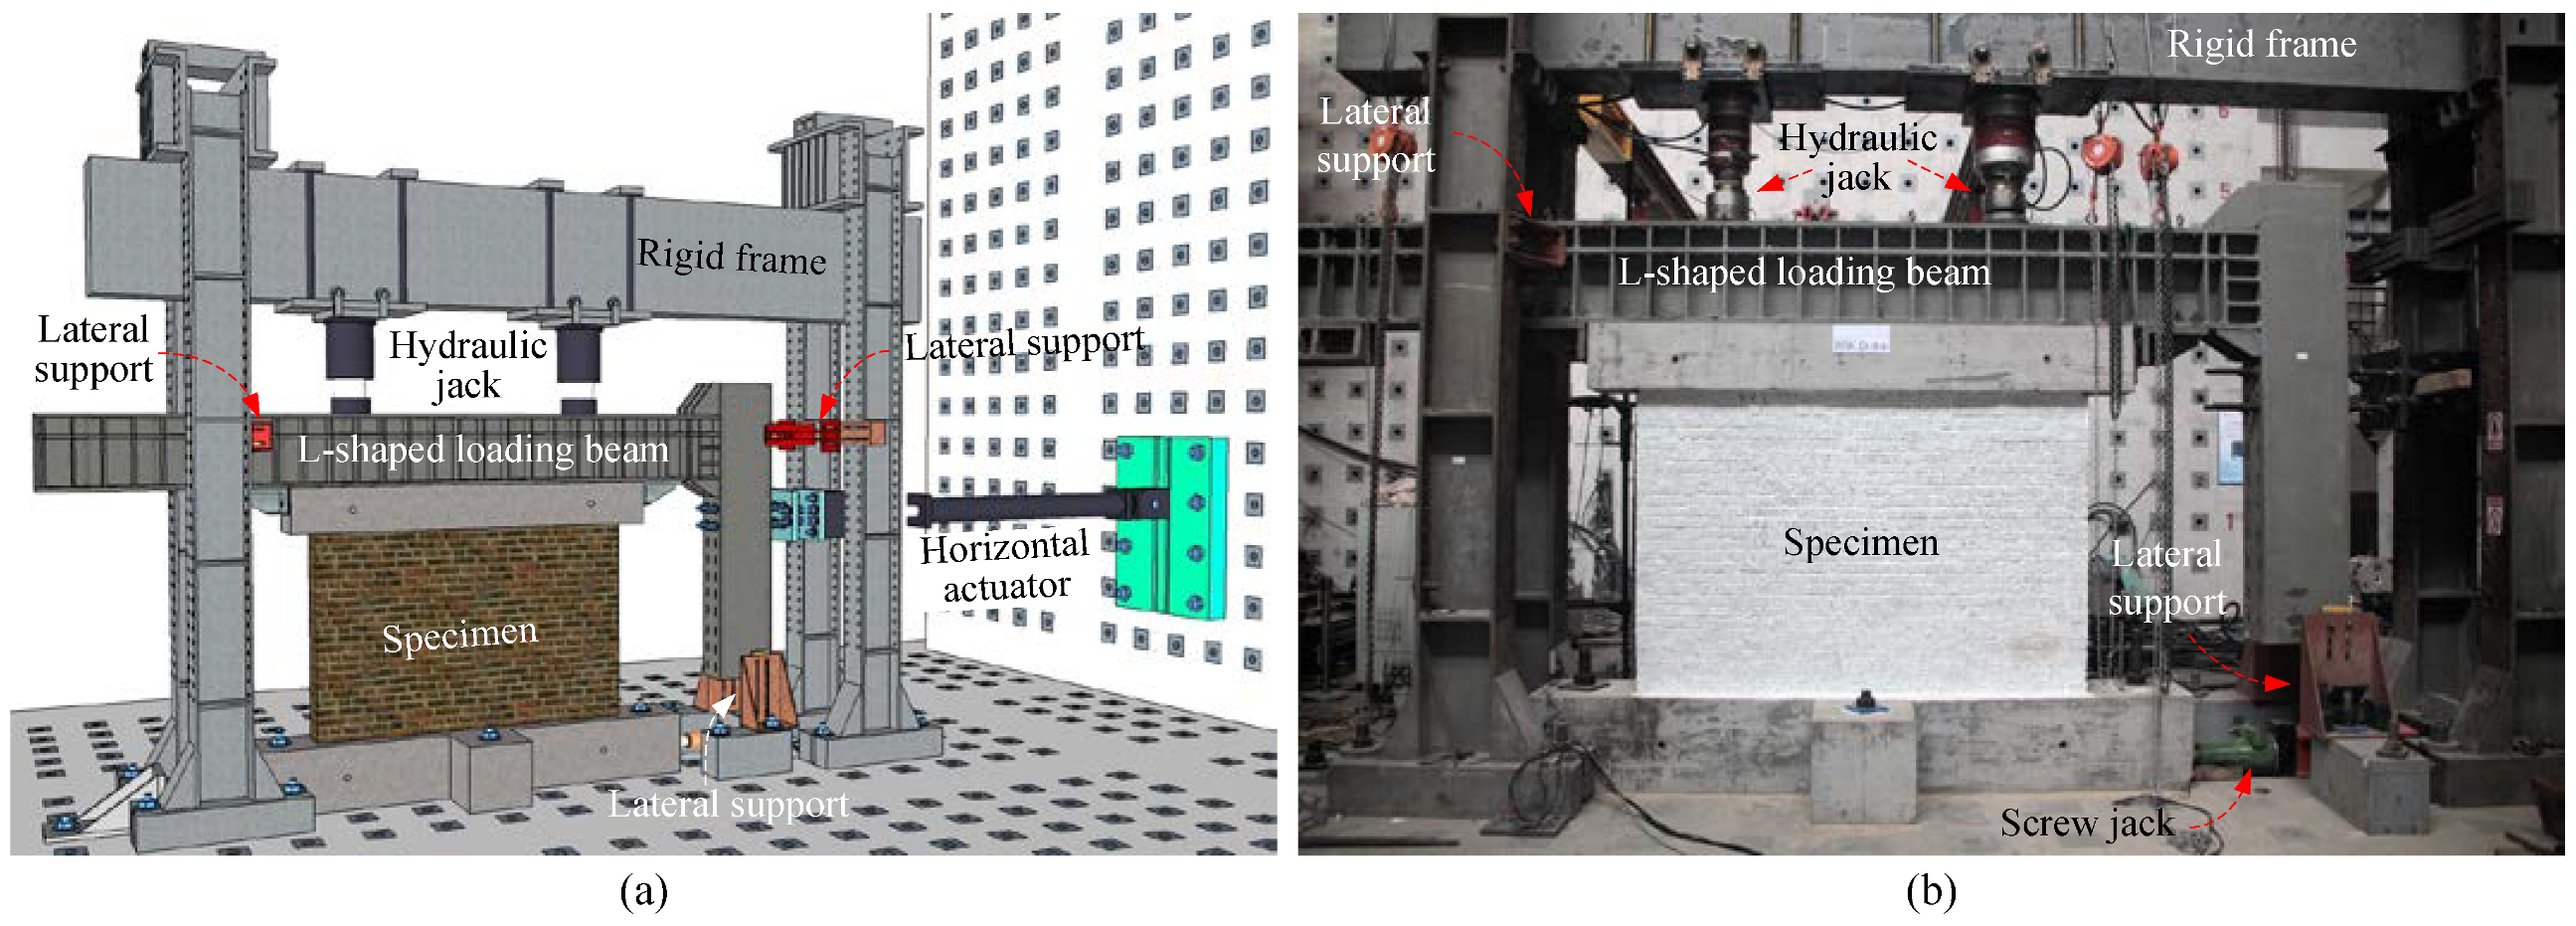
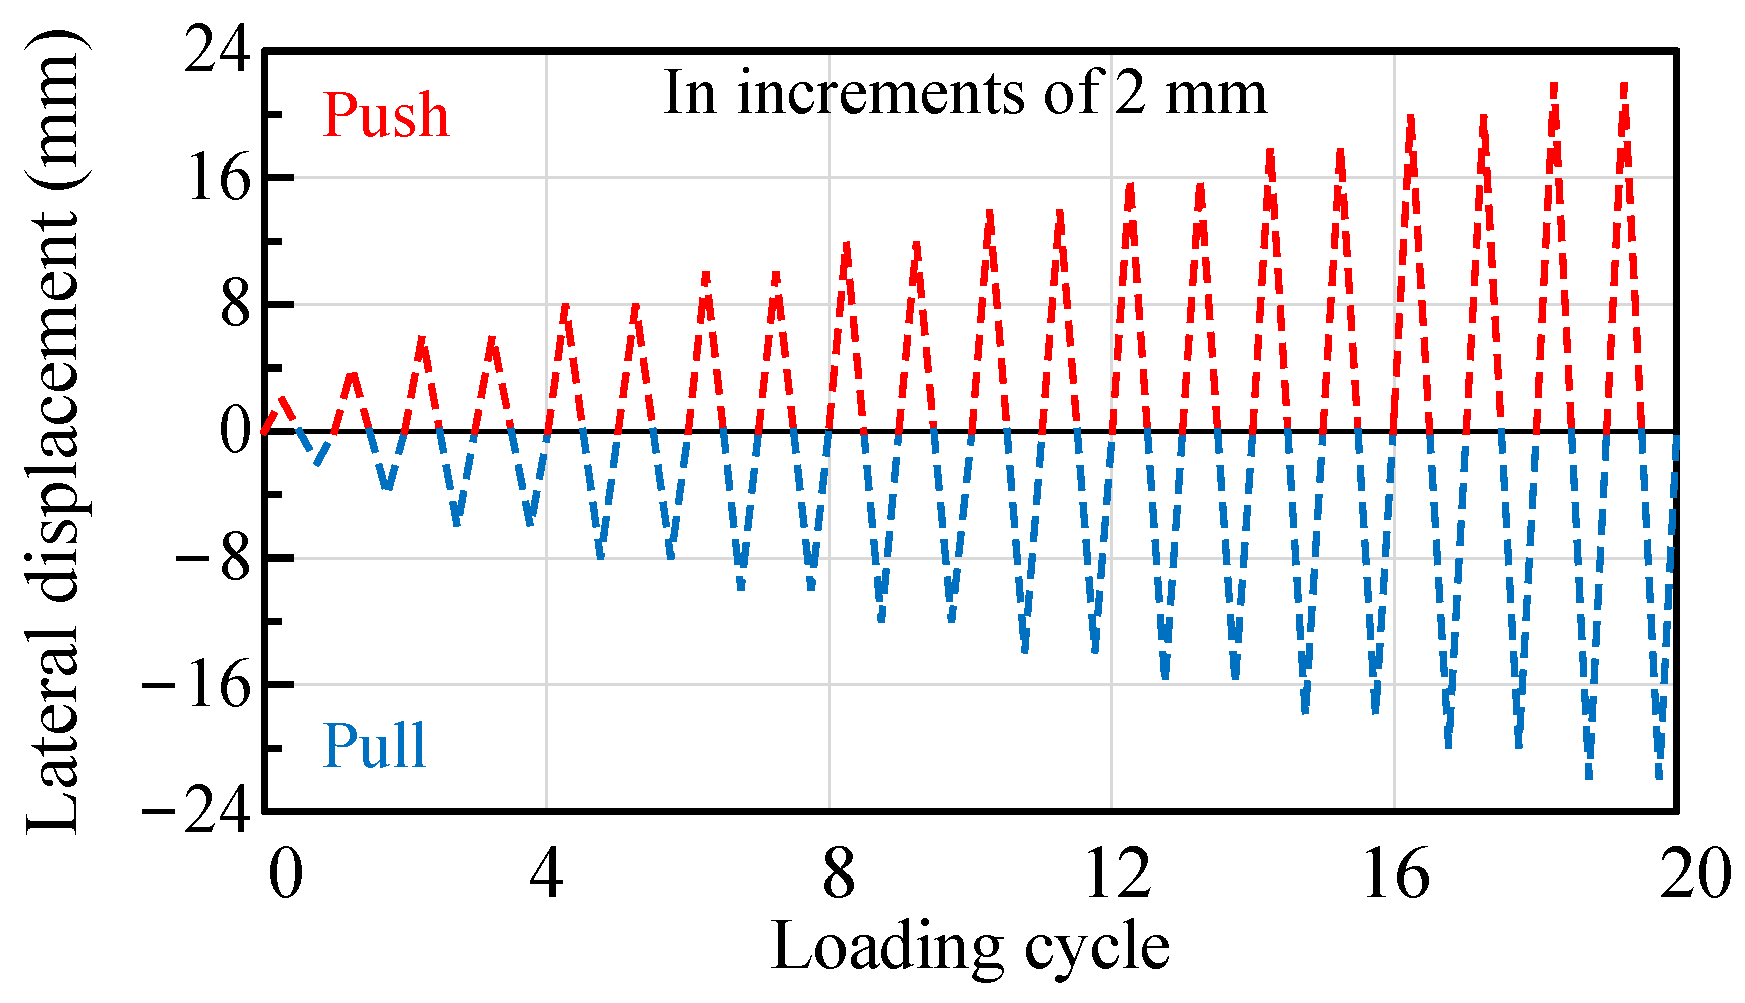
3.3. Test Setup, Instrumentation, and Loading Protocol

Figure 6 presents a schematic representation and photograph of the experimental test setup for the masonry wall panel. A rigid L-shaped loading beam was installed above the specimen and firmly connected to the top beam using bolts and angle steel. This loading beam was used to transmit lateral and vertical loads to the specimen. A constant pre-compression load of 162.5 kN was applied to the loading beam using two vertical hydraulic jacks, subjecting the masonry wall panel to a vertical compressive stress of approximately 0.6 MPa. The lateral load was applied using a 1000 kN capacity MTS servo-controlled hydraulic actuator firmly connected to the loading beam. The height of the lateral loading point from the wall base was 1624 mm, slightly different from the masonry wall height (1605 mm) due to the unsuitable location of bolt holes in the loading beam.
All specimens were subjected to an in-plane lateral cyclic loading applied at a height of 1624 mm under a constant vertical pre-compressive prestress of 0.6 MPa using the experimental setup described above. As shown in Figure 7, the lateral loading was controlled with the lateral drift at the loading point, with applied lateral drift levels increasing from 2 mm at fixed increments of 2 mm. One cycle was repeated at each drift level of 2 mm and 4 mm, with two cycles repeated at other drift levels. Testing was terminated when the post-peak lateral load-carrying capacity decreased below 80% of the peak load.
Three linear variable differential transducers (LVDTs) were used to record the lateral slippage and rotation of the foundation, while a laser Doppler displacement meter (LDDM) measured the lateral displacement of the top beam (Figure 8a). The strain and displacement fields of the wall panel were measured using the digital image correlation (DIC) method, a non-contact technique for extracting full-field deformation or motion measurements by acquiring, storing, and analyzing images of an object [35].
The DIC measurement system used in this study consisted of a high-resolution camera, an illumination system, a DIC controller, a high-performance computing facility, and professional post-processing software (Figure 8b). Prior to testing, a random black speckle pattern was applied to the specimen surface after removing dust and painting it white to improve image contrast. A smooth sequence of images was captured during testing at a frequency of 1 Hz until termination. These images were post-processed using VIC-2D professional analysis software, Version 6, to extract full-field deformation data and to analyze the deformation development and failure mechanism.

4. Experimental Results and Discussion

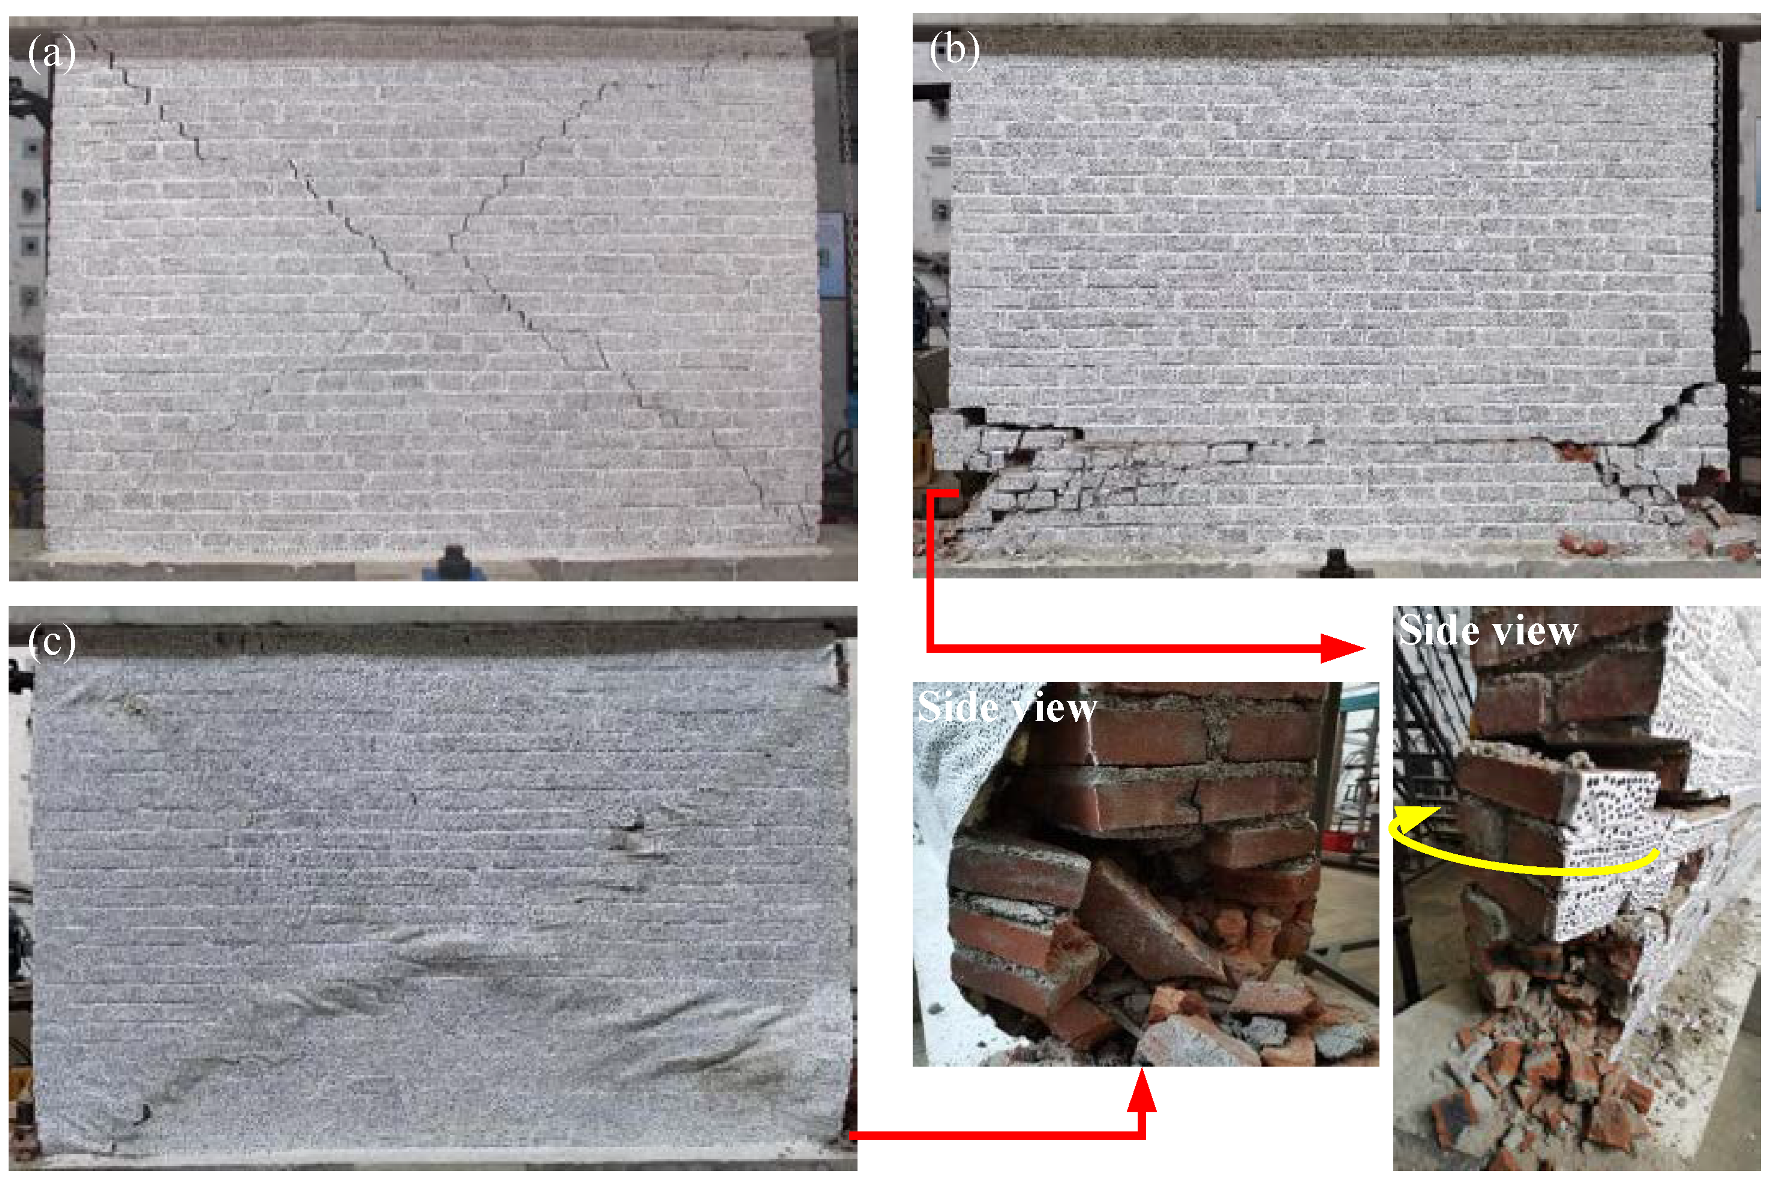
4.1. Experimental Observations and Failure Mechanisms

The formation and development of cracks and damage mechanisms in the three specimens were compared to visually verify the effectiveness of the proposed polyurethane spraying, seismic strengthening scheme. Figure 9 displays the Von Mises strain contours, obtained through surface component analysis, of the specimens at the yielding, peak load, ultimate, and termination stages. The definitions of yielding and ultimate stages are provided in Section 4.3. The termination stage is reached when the lateral load is reduced to zero after completing the last drift cycle level. Figure 9 also depicts the corresponding lateral drift for the specimens at these stages. Lateral drift, denoted by Δ, is calculated as the difference between the lateral displacement of the specimen’s top loading beam and its foundation.
In the control specimen BW-U (Figure 9a), an interfacial crack between the foundation and wall panel was observed at a drift of 0.60 mm with a corresponding lateral load of approximately 132.6 kN. In subsequent drift levels, this interfacial crack propagated from the lower corner toward the middle along the upper surface of the foundation. At a drift of 3.74 mm, a minor shear crack was initiated in the middle of the wall panel, and peak strength (275.6 kN) was simultaneously reached. With increasing drift levels, the shear crack widened and proliferated toward its respective opposite corners, resulting in a rapid decrease in bearing capacity. The diagonal shear crack passed through the wall panel along mortar joints and divided it into two independent elements at a drift of 8.07 mm, with post-peak lateral load dropping to 80% of peak lateral load.
In the specimen BW-S, strengthened by single-side polyurethane spraying (Figure 9b), a horizontal crack was initiated at the bottom of the wall panel on the first bed joint at a drift of 0.43 mm. In subsequent drift levels, a crack initiated at the bottom middle of the wall panel and extended obliquely upward along mortar joints. The panel reached its peak strength (325.5 kN) at a drift of 7.85 mm. As testing proceeded, sliding cracks formed at the fifth bed joint followed by the crushing and splitting of bricks at the bottom corner due to the sliding and rocking behavior of the upper wall panel, resulting in decreased bearing capacity. At a drift of 12.54 mm, sliding and rocking mechanisms were fully developed and post-peak lateral load decreased to 80% of the peak strength.
In the specimen BW-D, strengthened by double-side polyurethane spraying (Figure 9c), a double diagonal shear failure mode was observed. Compared to the unstrengthened specimen BW-U, more smeared cracks and more ductile behaviors were observed in the specimen BW-D. Peak strength (303.8 kN) was reached at a drift of 5.88 mm during which principle diagonal shear cracks had not yet penetrated the entire wall surface and several major shear cracks were concentrated at the lower part of the wall panel. As drift level increased, the formation and widening of diagonal shear cracks and crushing at lower corners were observed, resulting in decreased bearing capacity. Post-peak strength decreased to 80% of peak strength at a drift of 16.49 mm, about twice the corresponding drift of the specimen BW-U. These observations clearly indicate that strengthening using double-side polyurethane spraying retarded the development of shear cracks and effectively improved the deformation capacity of the masonry wall.
The final failure modes of the three specimens are shown in Figure 10. In the specimen BW-U, critical diagonal shear cracks running across the entire wall surface divided the wall panel into four parts, with the splitting of a few bricks observed at the lower corners. In comparison, the specimen BW-D exhibited a slower damage process and ductile behavior due to the confinement of the masonry with the polyurethane coating. More smeared cracks and the severe crushing of bricks in the lower corner were observed in the specimen BW-D, with greater lateral drift sustained (over double that of BW-U). Additionally, most crushed bricks were covered or stuck with polyurethane coating to prevent them from falling, thereby avoiding loss of life caused by falling bricks during earthquakes. The specimen BW-S, as shown in Figure 10b, failed via sliding and rocking behavior rather than the anticipated double diagonal shear failure. This unexpected failure mode could be attributed to the disparity in stiffness and strength between the reinforced and unreinforced sides, leading to a propensity for vertical torsion of the wall panel under lateral loading and a reduction in the shear bond strength of bed mortar joints. The overall shear capacity enhancement provided by the polyurethane coating also played a role in this unanticipated failure mode. Notably, even the single-side polyurethane coating was somewhat effective in preventing bricks from separating from the wall and falling.

4.2. Hysteretic Response

Figure 11 shows the lateral load versus lateral drift relationships of the specimens. The specimens were in an elastic state before cracking, with lateral load–drift hysteretic curves increasing approximately linearly. At larger lateral drifts, residual deformation and degradation in stiffness and strength were observed due to the formation and development of cracking and the crushing of bricks in the corners.
The bearing capacity of the unreinforced specimen BW-U decreased rapidly at a small drift (1.56 mm), exhibiting obvious brittle characteristics and weak energy dissipation capacity. In comparison, the strengthened specimens BW-S and BW-D showed more stable hysteretic behavior, with more gradual strength degradation, higher bearing capacity, and greater displacement capacity. Furthermore, the specimen BW-D showed maximum deformation and energy dissipation capacity, with its hysteretic loops being the plumpest. This outstanding response indicated that the seismic performance of masonry walls could be effectively improved via double-side polyurethane spraying.

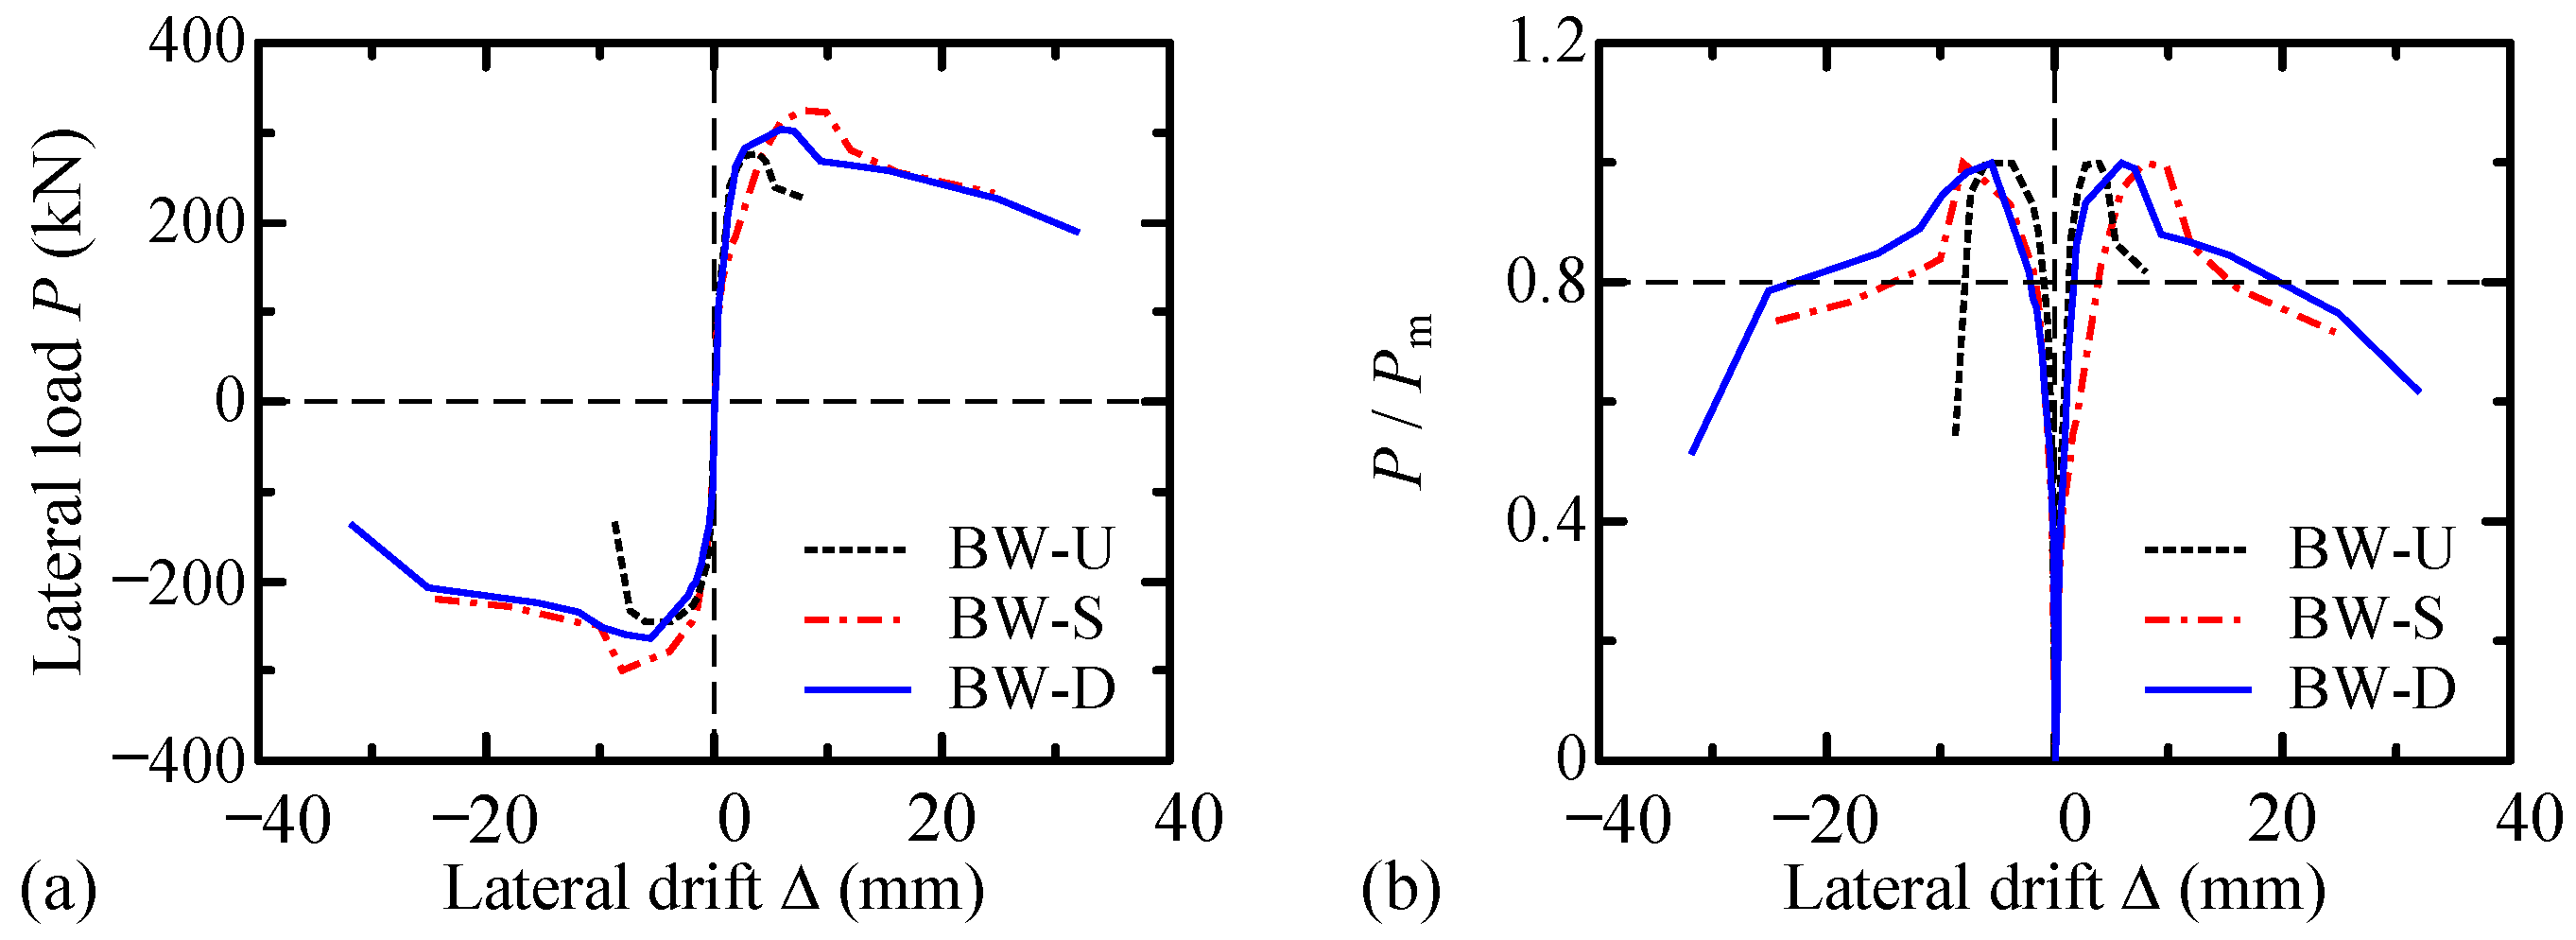
4.3. Envelopes and Mechanical Performance

Figure 12 shows the envelope lateral load–drift response for all three tested specimens. No significant difference was observed in envelop curves before cracking due to similar initial secant stiffness. It can be concluded that the small elastic modulus of polyurethane would not significantly improve initial stiffness of wall panel, thus avoiding unexpected consequences caused by changes in shear distribution in masonry walls on the same floor due to improvement in stiffness of strengthened wall panels. In addition, the bearing capacity of the specimen BW-U degraded rapidly after reaching maximum bearing capacity. In contrast, post-peak load of specimens BW-S and BW-D decreased slowly, with a certain bearing capacity (like 80% of peak strength) still maintained under large lateral drift.
Table 4 summarizes experimental results to show the influence of strengthening schemes on the seismic performance of masonry walls. The yield drift (Δy) is defined as 4/3 times the drift ratio corresponding to 0.75Pm in the ascending branch of the P-Δ curve [36], where Pm is the peak lateral load. Δm is the lateral drift corresponding the peak load Pm. The ultimate drift (Δu) is defined as the drift when the lateral load drops to 0.8Pm.
From the results, the specimens BW-S and BW-D showed significant improvements in lateral load capacity and displacement capacity. The average peak load (Pm) and ultimate drift (Δu) in the push and pull directions of the unstrengthened specimen BW-U were 260.6 kN and 8.0 mm, respectively. For the specimen BW-S, the average Pm and Δu were 312.2 kN and 12.9 mm, respectively, which increased by 19.8% and 60.3% compared to the specimen BW-U. The average Pm and Δu of the specimen BW-D were found to be 9.1% and 105.5% higher than that of the specimen BW-U, respectively. In addition, the drift corresponding to the peak load of specimens BW-S and BW-D increased by about 109.0% to 51.0% compared to the specimen BW-U, respectively. It can be concluded that the proposed strengthening scheme of spraying polyurethane can significantly improve the deformation capacity of masonry walls, including peak corresponding displacement and ultimate displacement. In addition, peak bearing capacity can also be improved to a certain extent, ranging from 7.9% to 21.7%, as far as the test results of this study are concerned.

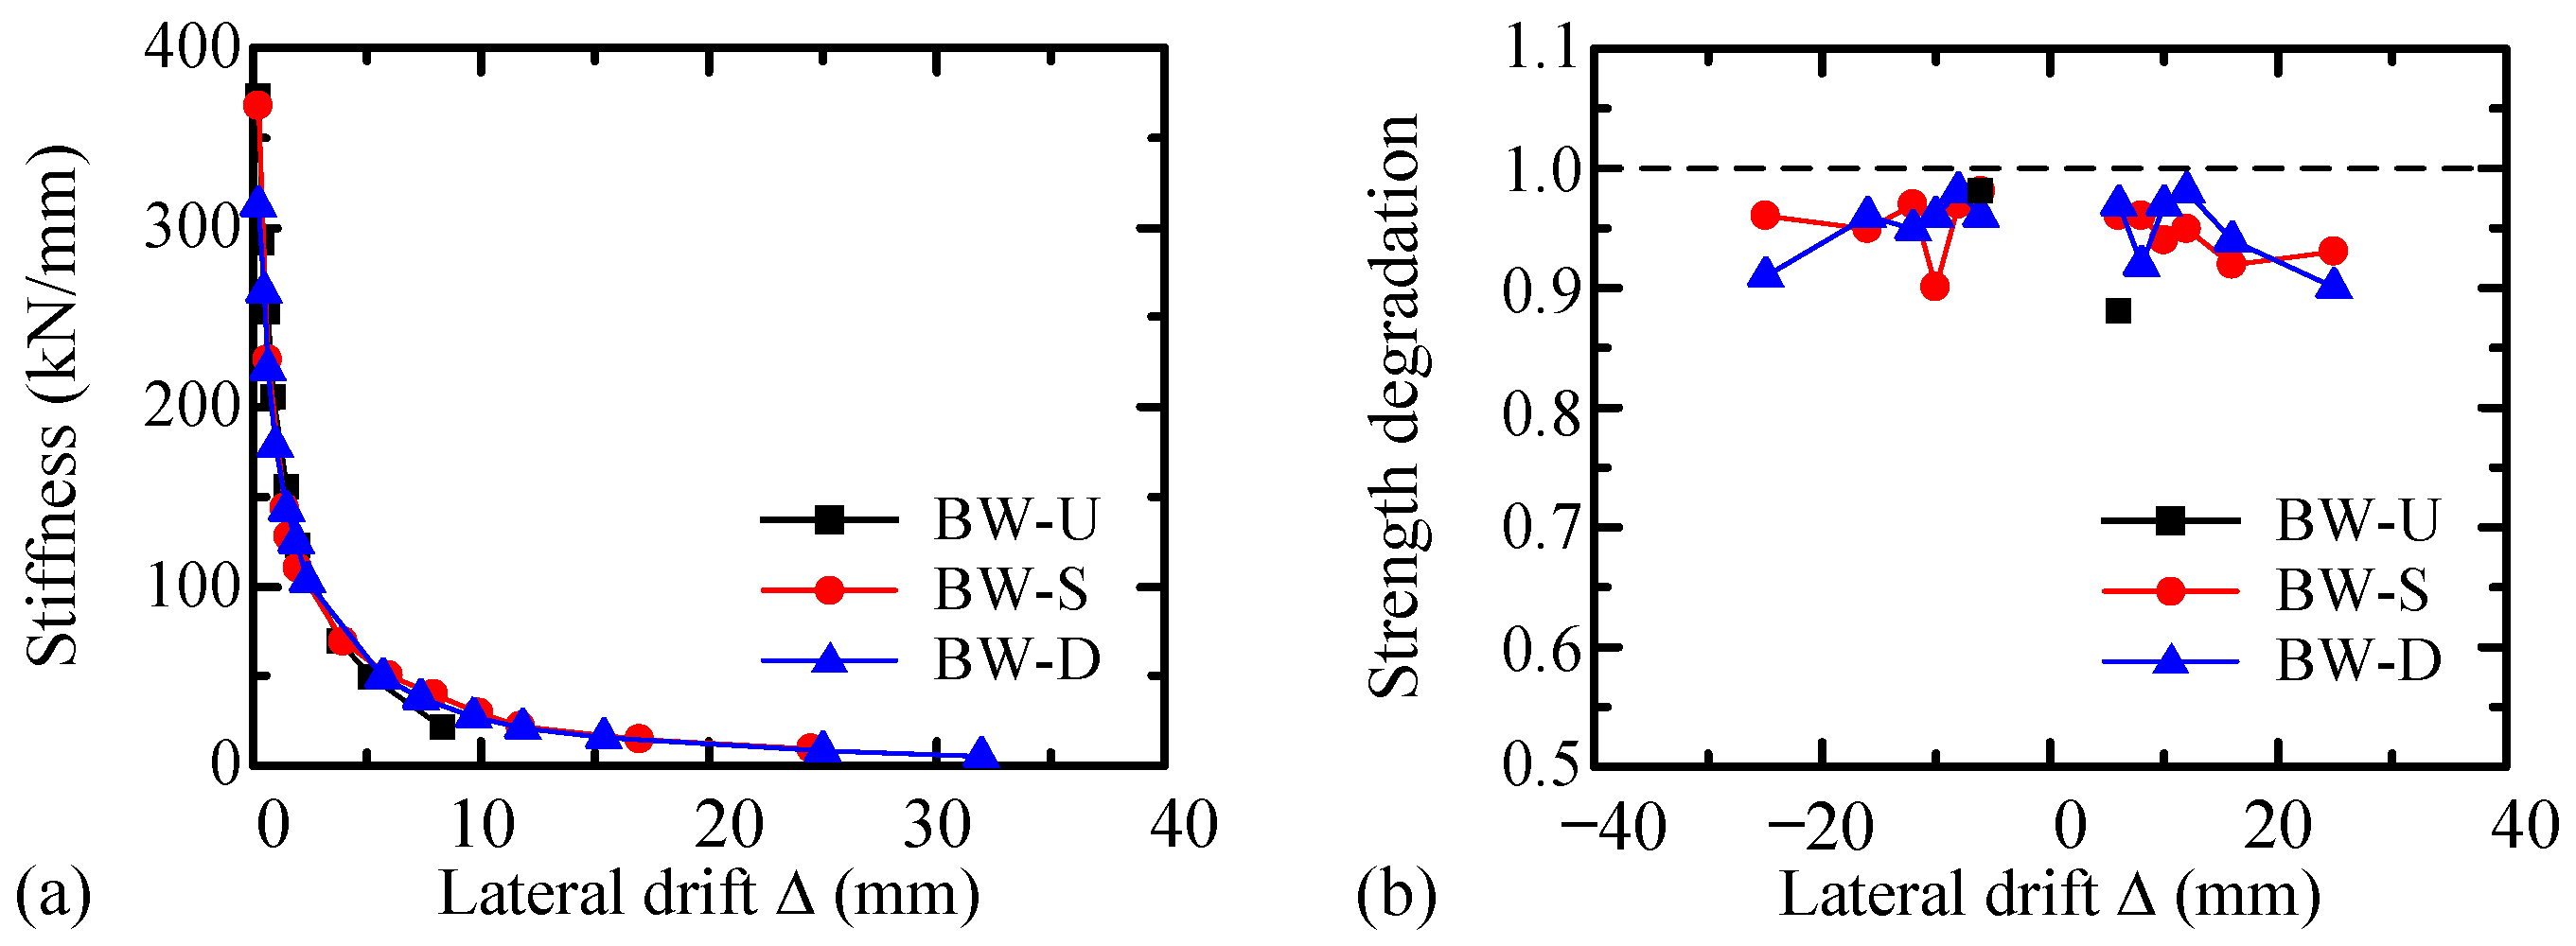
4.4. Stiffness and Strength Degradation

The secant stiffness was used to assess the stiffness degradation of masonry walls. It is calculated as the slope of the line connecting the peak load points in both directions of the first hysteretic loop at a specific lateral drift level. The variation of the secant stiffness versus the lateral drift level is illustrated in Figure 13a. The initial stiffness (K1st) was determined as the secant stiffness at the first lateral drift level (i.e., Δ = ±2 mm) and is presented in Table 4. All three specimens had comparable initial stiffness and exhibited similar degradation trends in the initial loading phase (Δ < 4 mm). However, in the subsequent loading phase (Δ > 4 mm), the strengthened walls showed a more gradual stiffness decay. This indicates that the proposed strengthening method did not significantly increase the initial stiffness of the masonry walls, thus avoiding potential catastrophic effects due to an intensified seismic response. Additionally, this method ensured that the strengthened walls retained some level of stiffness under large drifts, reducing the risk of complete collapse and associated severe consequences.
The strength degradation coefficient (λ) represents the strength loss between cycles with the same drift level and is essential for discussing experimental results. Figure 13b illustrates its variation with lateral drift. Due to the premature brittle failure of the specimen BW-U, lateral loading was only repeated at the ±6 mm drift level. Consequently, only one set of strength degradation coefficients for the specimen BW-U (0.88 and 0.98 in the positive and negative directions, respectively) was obtained. The strengthened walls exhibited more stable hysteretic loops, with λ consistently above 0.9. However, the strength of the specimens BW-S and BW-D decreased significantly at drifts of −10 mm and 8 mm, respectively, due to the formation of critical cracks in the wall. This resulted in abnormally low values of λ, with BW-S and BW-D having values of 0.9 and 0.92, respectively. With these two exceptions, λ of the strengthened walls decreased gradually with increasing lateral drift. Overall, BW-D had a higher value of λ than BW-S.

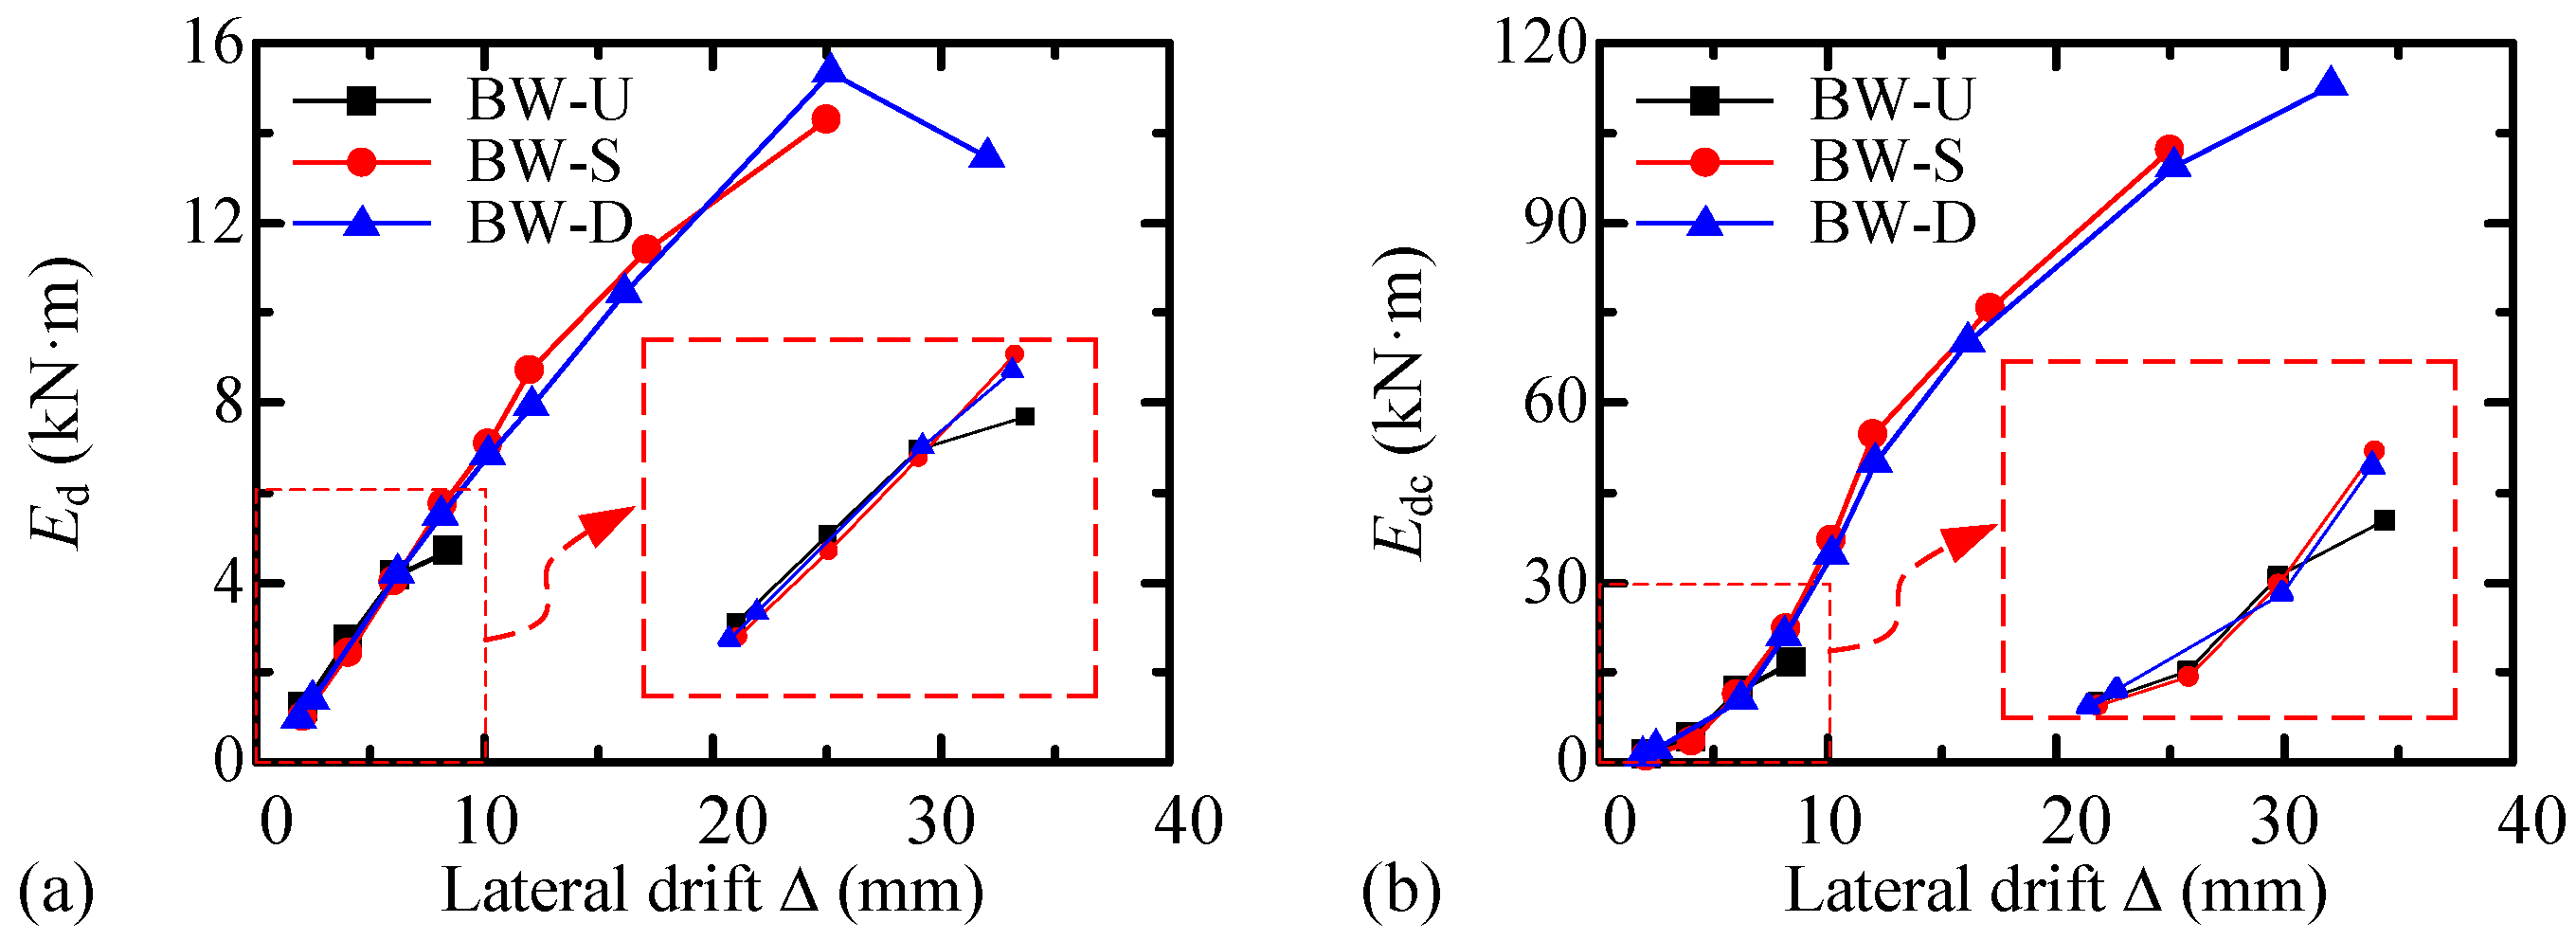
4.5. Energy Dissipation Capacity

The energy dissipation, Ed, of each load cycle can be calculated using the area enclosed by the P-Δ curve of that cycle. Figure 14a illustrates the variation of Ed of the first cycle for each drift level. Initially, Ed was similar for all specimens and increased linearly with lateral drift. However, the specimens BW-U and BW-D exhibited reduced Ed in the final cycle due to significant strength degradation. Furthermore, for safety reasons, their tests were terminated when the load was unloaded to zero, instead of when the drift dropped to zero. This resulted in an incomplete hysteresis loop, which also contributed to the decrease in Ed.
Figure 14b displays the cumulative energy dissipation, Edc, of specimens at different drift levels, calculated as the sum of the energy dissipation (Ed) of each previous single load cycle. The unstrengthened specimen BW-U failed brittlely with fewer loading cycles, thus exhibiting the lowest Edc of 16.6 kNm. Benefiting from the significant improvement in deformation capacity, the final Edc of the strengthened specimens BW-S and BW-D were 6.1 and 6.8 times that of BW-U, respectively (Table 4). At the same drift, the Edc of BW-S and BW-D were nearly equal. Since BW-D experienced larger lateral drifts, its final cumulative energy dissipation was slightly larger than that of BW-S.

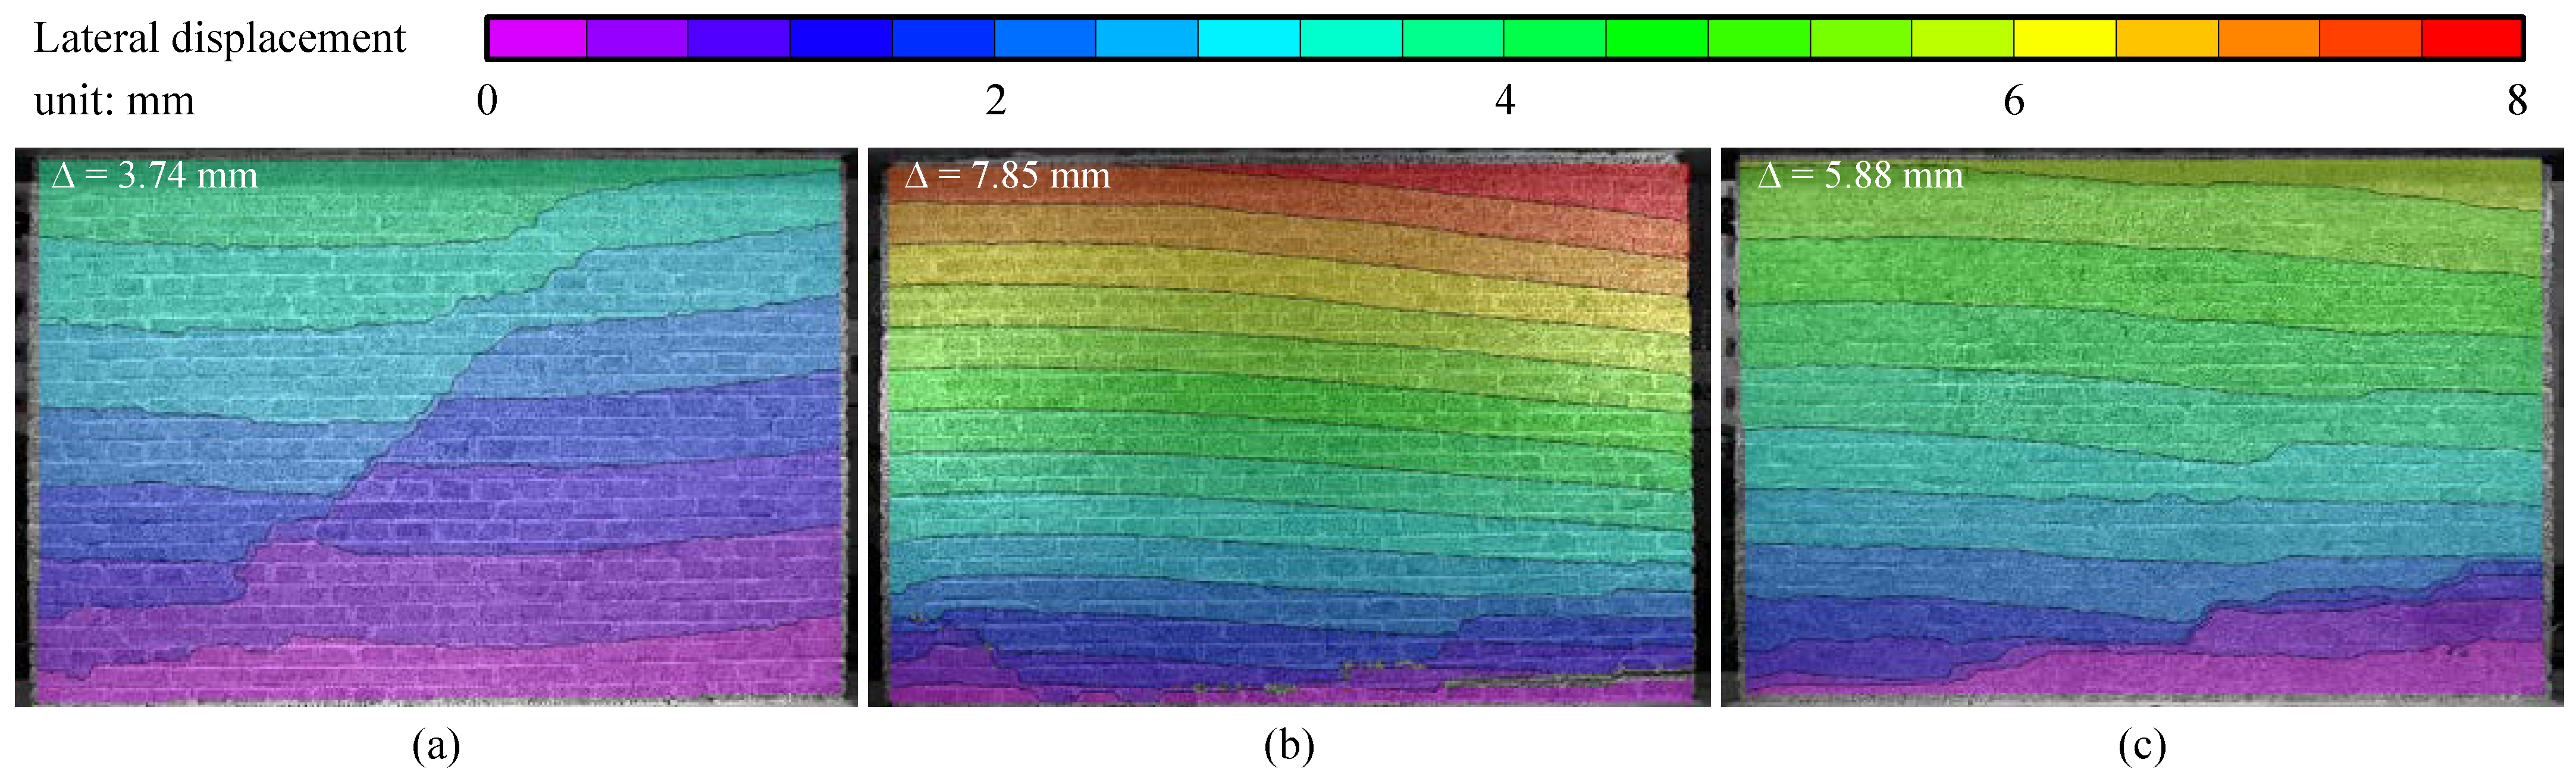
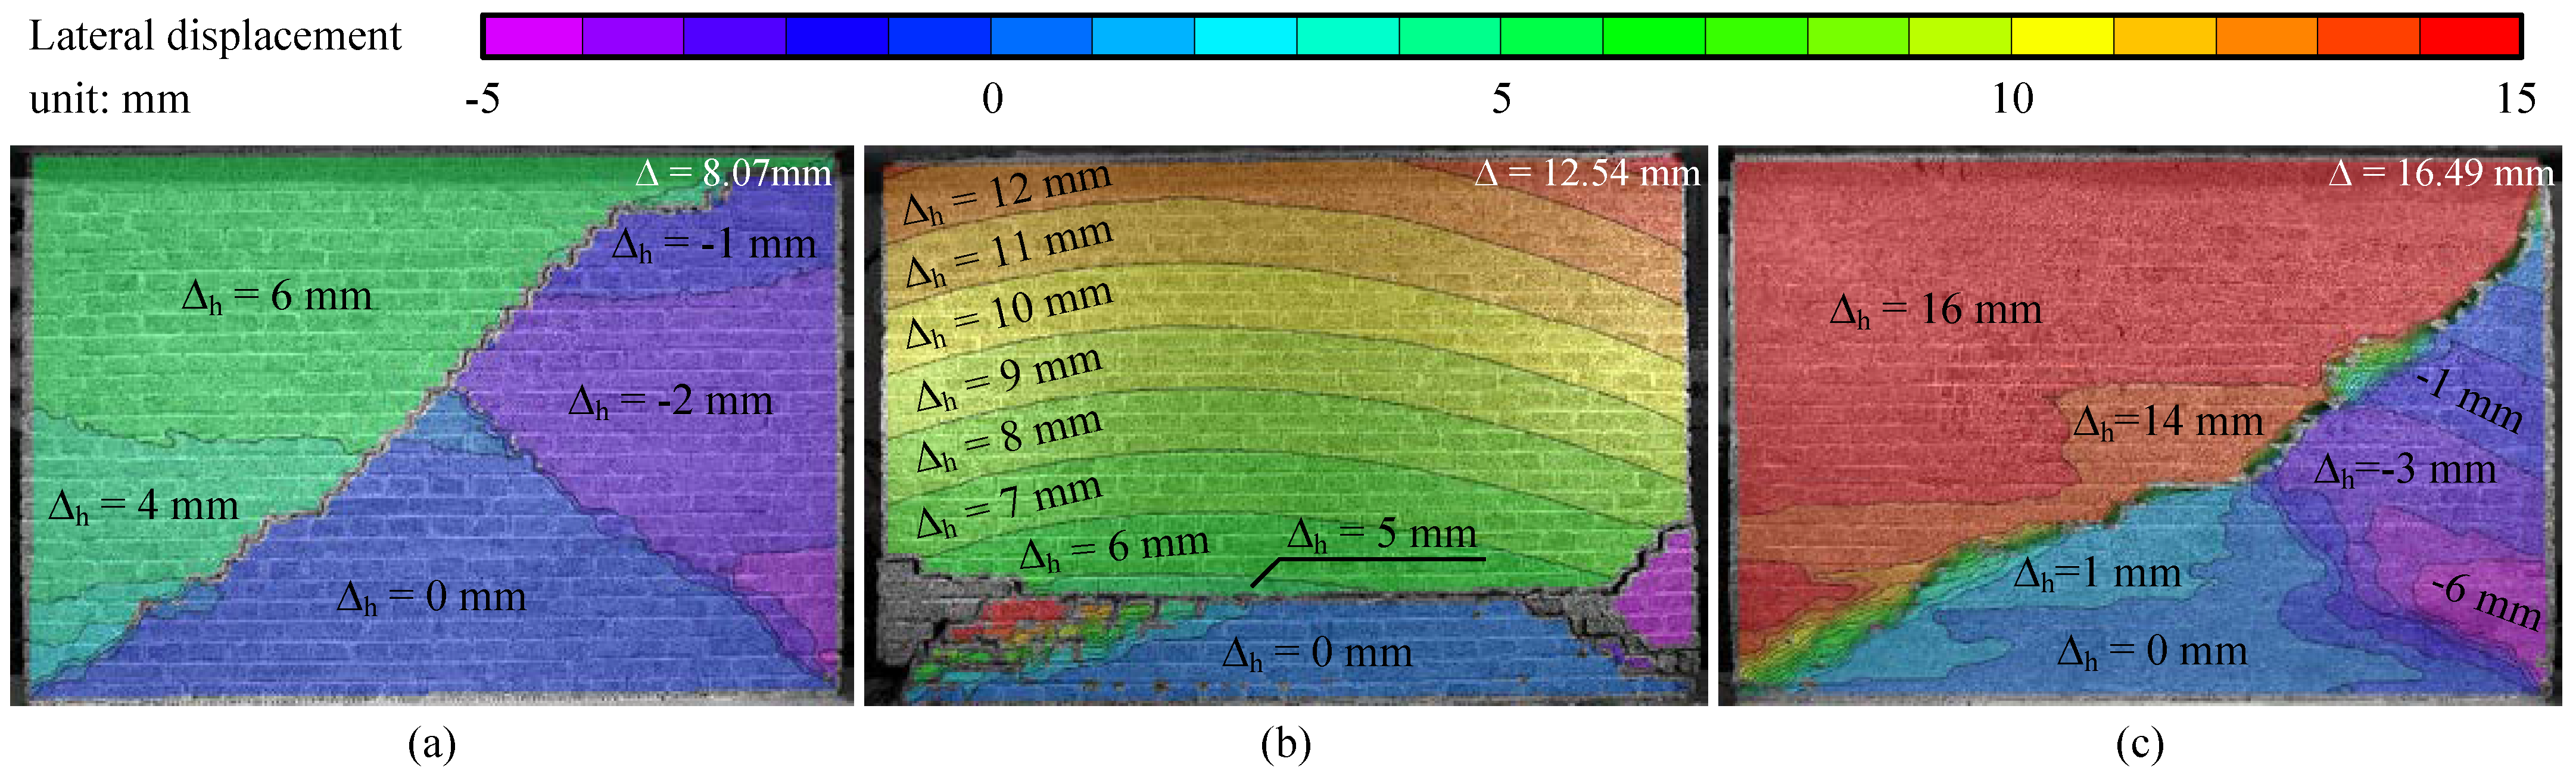
4.6. Full-Field Lateral Displacement Analysis

By employing digital image correlation (DIC) technology, the in-plane displacement of any point on the wall surface can be precisely determined, allowing for the generation of a contour diagram that depicts the full-field displacement of wall surface. The deformation characteristics of the wall surface, including crack width and sliding displacement, can be thoroughly examined by analyzing the distribution of color blocks representing varying lateral displacements.
Figure 15 displays the full-field lateral displacement (Δh) contour of specimens at peak load. For the unstrengthened specimen BW-U, a diagonal crack appeared in the middle of the wall at peak load, as indicated by the different lateral displacements at the same wall height (Figure 15a). The average crack width was determined to be approximately 0.4 mm by calculating the difference in lateral displacements in the regions on either side of the crack. In contrast, the strengthened specimens BW-S and BW-D showed uniform increases in lateral displacement with increasing wall height (Figure 15b,c), indicating no obvious cracks appearing despite exhibiting larger Δm.
Figure 16 displays the full-field lateral displacement contour of specimens at the ultimate state. For BW-U, further development and widening of critical diagonal cracks resulted in a decrease in lateral load. The maximum and average widths of the critical diagonal cracks were approximately 8 mm and 6 mm at the ultimate state, respectively. Although shear failure also occurred in BW-D, the crack width ranged from 16 to 19 mm, significantly larger than that of BW-U. This may be attributed to the stretching of the polyurethane coating connecting the two sides of the crack, providing a greater tensile force to resist crack opening and delaying strength degradation. In BWS, the fifth and sixth courses of bricks exhibited lateral displacements of 0 mm and 5 mm, respectively, indicating a sliding displacement of 5 mm at the fifth bed mortar joint. The contour plots of lateral displacement above the sliding line were arcuate and evenly distributed, suggesting that the upper wall panel also exhibited rocking behavior. The lateral drift due to the rocking behavior was about 7 mm. Both sliding and rocking behaviors were observed in BWS at the ultimate state.
In general, the analysis demonstrated that spraying polyurethane on masonry walls enhanced their structural integrity and ductility by delaying critical shear cracks and providing tensile resistance to crack growth. This resulted in a later peak load and a more gradual decrease in post-peak load.

5. Conclusions

This study assessed the feasibility and efficiency of enhancing the seismic performance of masonry structures using spray-on polyurethane coating. Three full-scale masonry walls were subjected to cyclic lateral loading after evaluating polyurethane’s material properties. The study concluded the following:
  • The feasibility of application was confirmed through monotonic tensile tests and shear bond strength tests on polyurethane samples. These tests demonstrated that high elongation and adequate shear bond strength with brick masonry can be achieved using hand-held spray guns. This suggests that the implementation of spray-on polyurethane coating technology is straightforward and accessible, without significant technical barriers;
  • The cyclic lateral loading tests revealed that the spray-on polyurethane coating can significantly delay the initiation and progression of cracks in masonry walls, thereby enhancing their deformation and energy dissipation capacity. Compared to the unstrengthened specimen BW-U, the drift corresponding to the peak load and ultimate state of the single-side strengthened specimen BW-S increased by 109% and 60%, respectively. Moreover, cumulative energy dissipation increased by 514%;
  • The application of polyurethane coating has been found to increase the load-bearing capacity of the specimen without compromising its lateral stiffness. Compared to the specimen BW-U, the peak load of the specimen BW-S increased by approximately 20%;
  • The double-side strengthened specimen, BW-D, exhibited improved integrity, deformation capacity, and energy dissipation capacity compared to its single-side strengthened counterpart, BW-S. Specifically, BW-D’s ultimate displacement and cumulative energy dissipation saw an increase of 28% and 10%, respectively.
In summary, the findings of this study suggest that spray-on polyurethane coating could be a promising technique for enhancing the seismic performance of masonry structures. Its ease of application makes it an especially attractive option for seismic reinforcement efforts in rural areas.

Author Contributions

Writing—original draft preparation and formal analysis, H.C.; conceptualization, methodology, and writing—review and editing, Y.L.; test conduction and draft editing, Y.T.; draft review and editing, Q.H. All authors have read and agreed to the published version of the manuscript.

Funding

This research was funded by the National Natural Science Foundation of China (No. 51878304 and 52378157), the Natural Science Foundation of Fujian Province for Distinguished Young Scholar (No. 2020J06020), and the Natural Science Foundation of Fujian Province (No. 2022J01288).

Data Availability Statement

Some or all data, models, or codes generated or used during the study are available from the corresponding author upon request.

Conflicts of Interest

The funders had no role in the design of the study; in the collection, analyses, or interpretation of data; in the writing of the manuscript; or in the decision to publish the results.

References

  1. Pan, Y.; Wang, X.; Guo, R.; Yuan, S. Seismic Damage Assessment of Nepalese Cultural Heritage Building and Seismic Retrofit Strategies: 25 April 2015 Gorkha (Nepal) Earthquake. Eng. Fail. Anal. 2018, 87, 80–95. [Google Scholar] [CrossRef]
  2. Yön, B. Identification of Failure Mechanisms in Existing Unreinforced Masonry Buildings in Rural Areas after April 4, 2019 Earthquake in Turkey. J. Build. Eng. 2021, 43, 102586. [Google Scholar] [CrossRef]
  3. Bilgin, H.; Shkodrani, N.; Hysenlliu, M.; Baytan Ozmen, H.; Isik, E.; Harirchian, E. Damage and Performance Evaluation of Masonry Buildings Constructed in 1970s during the 2019 Albania Earthquakes. Eng. Fail. Anal. 2022, 131, 105824. [Google Scholar] [CrossRef]
  4. Ashraf, M.; Khan, A.N.; Naseer, A.; Ali, Q.; Alam, B. Seismic Behavior of Unreinforced and Confined Brick Masonry Walls Before and After Ferrocement Overlay Retrofitting. Int. J. Archit. Herit. 2012, 6, 665–688. [Google Scholar] [CrossRef]
  5. Xu, T.; Guo, Z.; Chai, Z.; Ye, Y.; Wang, L.; Hou, W.; Liu, Y. Experimental Study on Seismic Behavior of Stone Masonry Walls Strengthened with Steel-Meshed Modified Cement Mortar. J. Build. Struct. 2016, 37, 120–125. (In Chinese) [Google Scholar]
  6. Ma, P.; Xin, R.; Yao, J. Assessment of Failure Mode and Seismic Performance of Damaged Masonry Structures Retrofitted with Grout-Injected Ferrocement Overlay Reinforcement (GFOR). Constr. Build. Mater. 2021, 305, 124778. [Google Scholar] [CrossRef]
  7. Hasnat, A.; Das, T.; Ahsan, R.; Alam, A.T.; Ahmed, H. In-Plane Cyclic Response of Unreinforced Masonry Walls Retrofitted with Ferrocement. Case Stud. Constr. Mater. 2022, 17, e01630. [Google Scholar] [CrossRef]
  8. Shrive, N.V. The Use of Fibre Reinforced Polymers to Improve Seismic Resistance of Masonry. Constr. Build. Mater. 2006, 20, 269–277. [Google Scholar] [CrossRef]
  9. Mahmood, H.; Ingham, J.M. Diagonal Compression Testing of FRP-Retrofitted Unreinforced Clay Brick Masonry Wallettes. J. Compos. Constr. 2011, 15, 810–820. [Google Scholar] [CrossRef]
  10. Reboul, N.; Mesticou, Z.; Si Larbi, A.; Ferrier, E. Experimental Study of the In-Plane Cyclic Behaviour of Masonry Walls Strengthened by Composite Materials. Constr. Build. Mater. 2018, 164, 70–83. [Google Scholar] [CrossRef]
  11. Corradi, M.; Castori, G.; Sisti, R.; Borri, A.; Pesce, G.L. Repair of Block Masonry Panels with CFRP Sheets. Materials 2019, 12, 2363. [Google Scholar] [CrossRef] [PubMed]
  12. Konthesingha, K.M.C.; Masia, M.J.; Petersen, R.B.; Mojsilovic, N.; Simundic, G.; Page, A.W. Static Cyclic In-Plane Shear Response of Damaged Masonry Walls Retrofitted with NSM FRP Strips—An Experimental Evaluation. Eng. Struct. 2013, 50, 126–136. [Google Scholar] [CrossRef]
  13. Ye, Y.; Guo, Z.; Liu, Y.; Wang, L. Flexural Behavior of Stone Beams Reinforced with Prestressed NSM CFRP Bars. Constr. Build. Mater. 2014, 54, 466–476. [Google Scholar] [CrossRef]
  14. Al-Jaberi, Z.; Myers, J.J.; ElGawady, M.A. Pseudo-Static Cyclic Loading Comparison of Reinforced Masonry Walls Strengthened with FRCM or NSM FRP. Constr. Build. Mater. 2018, 167, 482–495. [Google Scholar] [CrossRef]
  15. Eslami, A.; Zahedi, A.; Mirabi Banadaki, H. In-Plane Seismic Behavior of NSM Strengthened Adobe Walls: Experimental Evaluation of Different Reinforcements. Eng. Struct. 2021, 246, 113016. [Google Scholar] [CrossRef]
  16. Soleymani, A.; Najafgholipour, M.A.; Johari, A.; Jowkar, S. In-Plane Shear Strengthening of Traditional Unreinforced Masonry Walls with near Surface Mounted GFRP Bars. Constr. Build. Mater. 2023, 367, 130362. [Google Scholar] [CrossRef]
  17. Garcia-Ramonda, L.; Pelá, L.; Roca, P.; Camata, G. In-Plane Shear Behaviour by Diagonal Compression Testing of Brick Masonry Walls Strengthened with Basalt and Steel Textile Reinforced Mortars. Constr. Build. Mater. 2020, 240, 117905. [Google Scholar] [CrossRef]
  18. Ivorra, S.; Torres, B.; Baeza, F.J.; Bru, D. In-Plane Shear Cyclic Behavior of Windowed Masonry Walls Reinforced with Textile Reinforced Mortars. Eng. Struct. 2021, 226, 111343. [Google Scholar] [CrossRef]
  19. Torres, B.; Ivorra, S.; Javier Baeza, F.; Estevan, L.; Varona, B. Textile Reinforced Mortars (TRM) for Repairing and Retrofitting Masonry Walls Subjected to in-Plane Cyclic Loads. An Experimental Approach. Eng. Struct. 2021, 231, 111742. [Google Scholar] [CrossRef]
  20. Meriggi, P.; Caggegi, C.; Gabor, A.; de Felice, G. Shear-Compression Tests on Stone Masonry Walls Strengthened with Basalt Textile Reinforced Mortar (TRM). Constr. Build. Mater. 2022, 316, 125804. [Google Scholar] [CrossRef]
  21. Garcia-Ramonda, L.; Pelà, L.; Roca, P.; Camata, G. Cyclic Shear-Compression Testing of Brick Masonry Walls Repaired and Retrofitted with Basalt Textile Reinforced Mortar. Compos. Struct. 2022, 283, 115068. [Google Scholar] [CrossRef]
  22. Dong, F.; Wang, H.; Jiang, F.; Xing, Q.; Yu, J. In-Plane Shear Behavior of Masonry Panels Strengthened with Ultra-High Ductile Concrete (UHDC). Eng. Struct. 2022, 252, 113609. [Google Scholar] [CrossRef]
  23. Liu, X.; Guo, Z.; Hu, Y.; Li, G. Study on Shear Behavior of Stone Masonry Joints Strengthened with Polymer Mortar. J. Earthq. Eng. Eng. Vib. 2010, 30, 106–111. (In Chinese) [Google Scholar]
  24. Yao, X.; Guo, Z.-X.; Basha, S.H.; Huang, Q. Innovative Seismic Strengthening of Historic Masonry Walls Using Polymer Mortar and Steel Strips. Eng. Struct. 2021, 228, 111507. [Google Scholar] [CrossRef]
  25. Somarathna, H.M.C.C.; Raman, S.N.; Mohotti, D.; Mutalib, A.A.; Badri, K.H. The Use of Polyurethane for Structural and Infrastructural Engineering Applications: A State-of-the-Art Review. Constr. Build. Mater. 2018, 190, 995–1014. [Google Scholar] [CrossRef]
  26. Davidson, J.S.; Porter, J.R.; Dinan, R.J.; Hammons, M.I.; Connell, J.D. Explosive Testing of Polymer Retrofit Masonry Walls. J. Perform. Constr. Facil. 2004, 18, 100–106. [Google Scholar] [CrossRef]
  27. Davidson, J.S.; Fisher, J.W.; Hammons, M.I.; Porter, J.R.; Dinan, R.J. Failure Mechanisms of Polymer-Reinforced Concrete Masonry Walls Subjected to Blast. J. Struct. Eng. 2005, 131, 1194–1205. [Google Scholar] [CrossRef]
  28. Hrynyk, T.D.; Myers, J.J. Out-of-Plane Behavior of URM Arching Walls with Modern Blast Retrofits: Experimental Results and Analytical Model. J. Struct. Eng. 2008, 134, 1589–1597. [Google Scholar] [CrossRef]
  29. GB/T 528-2009; Rubber, Vulcanized or Thermoplastic—Determination of Tensile Stress-Strain Properties. Standards Press of China: Beijing, China, 2009. (In Chinese)
  30. GB/T 2542-2012; Test Methods for Wall Bricks. Standards Press of China: Beijing, China, 2012. (In Chinese)
  31. JGJ/T 70-2009; Standard for Test Method of Basic Properties of Construction Mortar. China Architecture & Building Press: Beijing, China, 2009. (In Chinese)
  32. GB/T50129-2011; Standard for Test Method of Basic Mechanics Properties of Masonry. Standards Press of China: Beijing, China, 2011. (In Chinese)
  33. Tian, Y.; Huang, Q.; Liu, Y.; Liu, Y. Experimental Study on Diagonal Compression Performance of Sprayed Polyurethane Elastomer Brick Masonry Wall. Earthq. Resist. Eng. Retrofit. 2022, 44, 79–87. (In Chinese) [Google Scholar]
  34. Shabdin, M.; Zargaran, M.; Attari, N.K.A. Experimental Diagonal Tension (Shear) Test of Un-Reinforced Masonry (URM) Walls Strengthened with Textile Reinforced Mortar (TRM). Constr. Build. Mater. 2018, 164, 704–715. [Google Scholar] [CrossRef]
  35. Schreier, H.W.; Orteu, J.-J.; Sutton, M.A. Image Correlation for Shape, Motion and Deformation Measurements: Basic Concepts, Theory and Applications; Springer: Boston, MA, USA, 2009. [Google Scholar]
  36. Liu, Y.; Guo, Z.; Liu, X.; Chicchi, R.; Shahrooz, B. An Innovative Resilient Rocking Column with Replaceable Steel Slit Dampers: Experimental Program on Seismic Performance. Eng. Struct. 2019, 183, 830–840. [Google Scholar] [CrossRef]
Figure 1. Monotonic tensile test: (a) schematic representation of the test coupon; (b) cutter for preparing test coupons; (c) photograph of the test coupons; (d) photograph of the test coupon before testing; and (e) photograph of the test coupon before failure.
Buildings 13 02470 g001
Figure 2. Stress–strain curves of test coupons at ages of (a) 2 days; (b) 7 days; and (c) 28 days.
Buildings 13 02470 g002
Figure 3. Shear bond strength test: (a) schematic of specimen; (b) specimen photograph; (c) pre-test photograph; and (d) pre-failure photograph.
Buildings 13 02470 g003
Figure 4. Details of masonry wall: (a) dimensions, (b) brick bonding patterns, and (c) wall panel surface after spraying polyurethane (all dimensions in mm).
Buildings 13 02470 g004
Figure 5. General view of the specimens for (a) compression tests (brick), (b) compression tests (mortar cube), (c) shear bond strength tests (masonry), (d) compression tests (masonry), and (e) shear tests (masonry).
Buildings 13 02470 g005
Figure 6. Typical experimental test setup: (a) schematic representation and (b) photograph.
Buildings 13 02470 g006
Figure 7. Adopted loading protocol.
Buildings 13 02470 g007
Figure 8. Instrumentation: (a) arrangement of LVDTs and LDT and (b) DIC measurement.
Buildings 13 02470 g008
Figure 9. Crack patterns and damage mechanisms of specimens obtained from DIC analysis: (a) BW-U; (b) BW-S; and (c) BW-D.
Buildings 13 02470 g009
Figure 10. Final failure modes: (a) BW-U; (b) BW-S; and (c) BW-D.
Buildings 13 02470 g010
Figure 11. Lateral load versus lateral drift relationships: (a) BW-U; (b) BW-S; and (c) BW-D.
Buildings 13 02470 g011
Figure 12. Envelopes of lateral load versus lateral drift curves: (a) P-Δ curves and (b) P/Pm-Δ curves.
Buildings 13 02470 g012
Figure 13. Comparison of stiffness and strength of specimens: (a) stiffness degradation and (b) strength degradation.
Buildings 13 02470 g013
Figure 14. Energy dissipation: (a) energy dissipation per load cycle, Ed, and (b) cumulative energy dissipation, Edc.
Buildings 13 02470 g014
Figure 15. Contour plots of full-field lateral displacement at peak load for specimens: (a) BW-U; (b) BW-S; and (c) BW-D.
Buildings 13 02470 g015
Figure 16. Contour plots of full-field lateral displacement at ultimate state for specimens: (a) BW-U; (b) BW-S; and (c) BW-D.
Buildings 13 02470 g016
Table 1. Mechanical properties of test coupons.
Sample Groups aNo. of CouponsElastic ModulusTensile StrengthElongation at Fracture
Mean (MPa)COV (%)Mean (MPa)COV (%)MeanCOV (%)
I1063.010.5%11.38.4%5.07.3%
II844.814.1%12.411.2%4.713.1%
III1129.39.1%11.59.4%6.67.1%
Overall29 b45.234.0%11.710.0%5.517.0%
a Groups I, II, and III correspond to coupons aged 2, 7, and 28 days, respectively. b Data from seven test coupons were lost due to unexpected mechanical failures.
Table 2. Parameters of specimens.
Specimen IDDescriptionStrengthening Details
TechniquePolyurethane Thickness
MW-UControl----
MW-SStrengthenedSingle-side spraying3~4 mm
MW-DStrengthenedDouble-side spraying3~4 mm
Table 3. Material properties.
Material PropertiesNo. of SamplesMean (MPa)COV (%)
Brick
Compressive strength926.379.4
Mortar
Compressive strength62.272.9
Masonry
Shear bond strength90.1363.2
Compressive strength64.0817.9
Shear strength20.171.8
Table 4. Summary of experimental results.
SpecimenΔy (mm)Δm (mm)Δu (mm)Pm (kN)K1stEdc, final
PushPullPushPullPushPullPushPull(kN/mm)(kNm)
BW-U1.480.963.853.748.077.99275.6245.5122.416.6
BW-S4.461.767.858.0112.5413.21325.5298.8125.0102.0
BW-D2.022.115.885.5816.4916.52303.8264.8109.9112.7
Disclaimer/Publisher’s Note: The statements, opinions and data contained in all publications are solely those of the individual author(s) and contributor(s) and not of MDPI and/or the editor(s). MDPI and/or the editor(s) disclaim responsibility for any injury to people or property resulting from any ideas, methods, instructions or products referred to in the content.

