Abstract
Different loading conditions cause different tensile stress patterns in masonry structures. Several studies related to masonry behavior use indirect tensile tests to obtain that value, where the splitting test from ASTM-C-1006 is usually employed. In this paper, an experimental analysis of the tensile strength of hollow concrete blocks is reported. Different locations of the rod from the ASTM-C-1006 splitting test were analyzed. The tensile strength was evaluated in four different ways, placing the rod: (1) in the transversal direction over the gross area, (2) in the transversal direction over the net area, (3) in the longitudinal direction, and (4) 200 mm from the central region of the block in the longitudinal direction. The obtained results were compared with the tensile strength values measured from the direct tensile test in the longitudinal direction. In addition, an axial compressive test was performed to characterize the blocks, and a discussion about the tensile/compression ratio is shown. The experimental results from the splitting tests show that for each configuration setup, the tensile stress is different. The main result was that the splitting test over the net area with the rod positioned in the longitudinal direction can overestimate the tensile strength by more than 21% of the one over the gross area.
1. Introduction
Masonry structures of hollow concrete blocks (HCB) have been widely built around the world due to their multiple advantages in the construction industry [1,2,3,4]. The physical and mechanical parameters of the HCB masonry have been studied for years, either as macro models of the different elements that constitute them, i.e., the mortar and the blocks, or by assemblages such as prisms, wallettes, and full-scale walls.
There are experimental results related to the axial compressive behavior in masonry prisms and wallettes [1,5,6,7], diagonal compression in wallettes, and confined masonry walls under cyclic lateral loads [8,9]. However, experimental results about the tensile strength of masonry units are limited, not only in the number of studies but also in the number of experimental samples. Mojsilović, N. [10] performed direct tensile tests in two series of hollow clay blocks (x- and y-directions) (Figure 1), while in previous research, the authors [11] also carried out direct tensile tests in the x- and y-directions but for HCBs. Haach, V.G et al. [12] developed an indirect test to determine the tensile strength, but their results were compared with another indirect tensile test. Almeida, J.C et al. [13,14] obtained the softening behavior of different clay blocks by applying an indirect tensile test. Santhakumar, A.R. and S. Ashok [15] suggested an experimental method to test tensile strength of brick masonry. McBurney, J.W [16] also, obtained the tensile strength of bricks. On the other hand, Barbosa, C.S. and J.B. Hanai [17] tested hollow concrete blocks and cylinders made with the block material in order to obtain the mechanical properties and structural behavior in compression and tension. In some studies [1,4,10,12,18], where various masonry elements such as prisms and walletes were tested, the tensile strength of masonry units could be a decisive parameter to describe its behavior under several loading conditions. The differential displacements induced by seismic loads are the main source of tensile stresses in masonry walls, particularly in walls of unreinforced concrete blocks, which are the most vulnerable under these seismic actions [19].
In previous research [11,20] state-of-the-art study was presented about the tensile strength determination in masonry units in accordance with the specialized literature. The splitting test results of HCBs with a compressive strength of 28.83 MPa were reported as evaluated over the net area. In the present investigation, the splitting test is carried out in two directions (x and y) (Figure 1). The block has a compressive strength of 11.62 MPa over the net area (see Table 1), and the geometrical properties of the sampled two-core HCB are shown in Figure 2. Experimental reports of the splitting tensile strength of HCB by other studies [17,21,22,23,24,25] are also discussed here.

Table 1.
Averages values from the compressive tests.
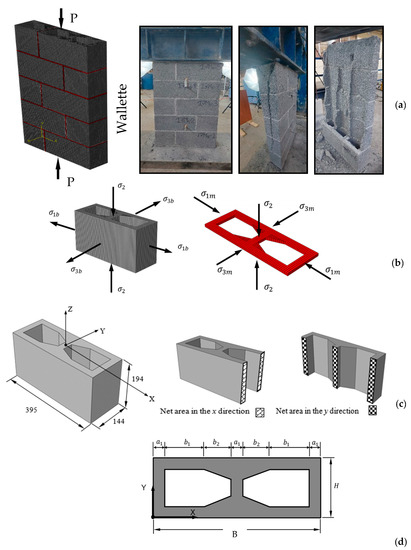
Figure 2.
(a) Failure patterns of HCB masonry in wallets under compressive stresses. (b) Stress state induced in the HCB and the mortar due to the different deformation characteristics of both materials. (c) Different types of net areas in the HCB (the dimensions are in mm). (d) Geometric parameters of the HCB (the mean values of these dimensions are in Table 2); the depth of the HCB is called Z.

Figure 1.
Splitting tests applied to the blocks (a) in the x-direction (longitudinal) over the gross area, (b) in the x-direction over the net area, (c) in the y-direction (transversal), and (d) 200 mm from the central region of the block in the y-direction. (e) Guidelines of ASTM C-1006-13 [26].
Figure 1.
Splitting tests applied to the blocks (a) in the x-direction (longitudinal) over the gross area, (b) in the x-direction over the net area, (c) in the y-direction (transversal), and (d) 200 mm from the central region of the block in the y-direction. (e) Guidelines of ASTM C-1006-13 [26].

ASTM C-1006-13 [26] proposes a splitting test as an indirect method to determine the tensile strength of the masonry units. In the standard test, two cylindrical steel rods are used to transfer a compressive load to the HCB on a small region, inducing tensile stresses that produce a vertical crack, splitting the HCB into two pieces. Experimental results of the tensile strength of masonry units have been reported in a few studies [10,11,12,13,14,15,16,17].
The ASTM C-1006-13 establishes a symmetric system to apply the load to the specimen (Figure 1e) [26]. It is reasonable to think that the splitting load must be applied in the net section of the block when it coincides with its symmetry plane. When the block has two cores with a central web (Figure 1b), the positioning of the load to evaluate the splitting strength in the x-direction (Figure 1a,b) becomes dubious. Applying the load over the gross area in this type of block (Figure 1a) complies with the intention of the standard, avoiding an additional bending effect due to the inclined plane generated by the boundary condition between the block and the steel plate (Figure 1b) [17]. Hence, the tensile strength has been determined over the gross area (Figure 1a) in the following investigations [21,22,23] and over the net area (Figure 1b) in the references [17,27]. In other studies, the load is applied over the gross area, and then the tensile strength is computed over the gross and net areas [24,25], obtaining two values for the splitting strength for the same loading position.
It is known that the tensile strength of the HCB controls the behavior of a masonry wall before the first diagonal cracking occurs under lateral loads. The vertical cracking failure mode of prisms and wallettes under axial compression is the principal failure mode of the HCB masonry (Figure 2a). The vertical cracking, in general, is controlled by the tensile strength of the units (HCB). Due to the different stress–strain properties of the HCB and the mortar, an interaction between both materials is exhibited when they are subjected to the same stress. This interaction causes the less deformable material, typically the HCB, to restrict the transversal strain of the most deformable material (mortar), inducing compression stresses in the mortar and tension stresses in the HCB (Figure 2b). Thus, obtaining a reliable tensile strength of the HCB becomes a major issue. Therefore, the main aim of this research is to evaluate the influence of the rod position in the estimation of tensile strength through experimentation by applying the splitting test from the ASTM C-1006-13 standard on HCBs. Figure 2c,d show the principal dimensions of blocks used in the current research, and the mean values of the dimensions illustrated in Figure 2d are indicated in Table 2.
Table 2.
Splitting results (see Figure 2c for the block dimensions).
2. Materials and Methods
This research was realized with HCBs manufactured in Nuevo León, Mexico. The blocks have two cores and are made of cement and aggregate up to a size less than 10 mm and are tapered in the web. The HCBs were randomly chosen from the same batch, and 30 blocks were tested in each of the 4 variants of the splitting test (Figure 1a–d), and 30 blocks were used in the axial compressive test (Figure 3) for a total of 150 blocks tested. Their nominal dimensions are 395 mm × 194 mm × 144 mm (length × height × thickness) (Figure 2b). The ratio of net to gross area is 0.57. According to data provided by the manufacturer, the HCBs were made with medium sand #4 (59.55%), gross sand 3/8″ (25.91%), cement (OPC-40) (10.02%), and water for each unit (4.52%). All the blocks were kept in the laboratory within a temperature range of 24 °C ± 8 °C, and with relative humidity less than 80%. The mean density of blocks was 2008 kgf/m3 (19.692 kN/m3).
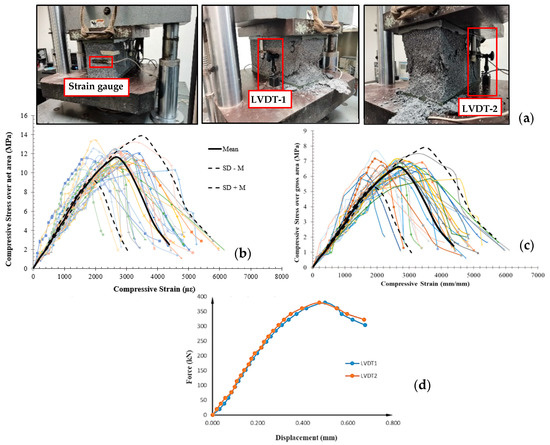
Figure 3.
Results from the compressive test: (a) failure mode, (b) stress–strain curves over the net area, (c) stress–strain curves over the gross area, (d) force–displacement curves from LVDTs.
2.1. Axial Compressive Test
The compressive tests of the HCB were displacement-controlled with a rate using a servo-hydraulic machine. Besides the linear variable differential transformer (LVDT) of the testing machine, for each HCB the following measurement transducers were used: two strain-gauges (SG) to measure the longitudinal and transversal strains in the material elastic stage (Figure 3a) and two LVDTs to measure the load-displacement and stress–strain curve (Figure 3b) and to validate the non-existence of rotation in the upper plate of the testing machine (Figure 3c). The absolute difference measured between both LVDTs was between 10 and 50 (Figure 3c). Therefore, the hypothesis of the non-existence of rotation of the upper plate is acceptable, and it can be considered that the load was uniformly applied on the upper surface of the HCBs.
The compressive strengths were calculated accordingly to the standards [28,29] over the net and gross areas. The compressive strength and the modulus of elasticity were obtained by the standards from the reference [30,31,32,33,34] (Table 1).
The modulus of elasticity was determined as the secant modulus between 5% and 35% of the compressive strength found from the stress–strain curve (Figure 3b).
The axial compression failure in the HCBs (Figure 3a) is characterized by a diagonal shear crack that is produced by a combination of stresses due to the low slenderness ratio of the block, the lateral confinement, and the friction load due to the contact of the HCB and the plates [17,20,35,36]. The failure patterns were not symmetric and exhibited diagonal cracking patterns that generally began in the exterior part of the HCBs, with the compressive failure occurring in the face-shells (Figure 3a).
2.2. Splitting Tests
Splitting tests were performed following the standard ASTM C-1006-13 [26] with a load rate of . The compressive load applied to the unit, imposed by means of bearing rods, resulted in a tensile stress distributed over the height of the unit times the split length. The splitting tensile strength of the specimens was computed with Equation (1) [26]. This test method can be conducted with the rod oriented either in the longitudinal direction or in the transverse direction to the bed face. The diameter of the bearing bars was 1 in, according to ASTM C-1006-13.
where:
Splitting tensile strength ;
Maximum applied load indicated by the testing machine ;
Split length, gross length minus the length of any voids along the failure plane of the bearing rods, (see Figure 4);
Distance between rods, .

Figure 4.
Arrangement for splitting tests: (a) x-direction over the gross area, (b) x-direction over the net area, (c) y-direction, and (d) 200 mm from the central region of the block in the y-direction (modified method).
Figure 4.
Arrangement for splitting tests: (a) x-direction over the gross area, (b) x-direction over the net area, (c) y-direction, and (d) 200 mm from the central region of the block in the y-direction (modified method).

In [11,20], splitting tests in the x-direction were carried out, and it was claimed that the significant differences obtained in that direction could be associated with the load application mode in that direction. The load in those investigations was applied over the gross area (Figure 1a). Considering those results, the splitting test in this study was made over the gross and net areas in the x-direction (Figure 1a,b), and the variations analyzed in the x-direction were the following.
- Apply the load over the gross area (Figure 4a), but use the net area to obtain the splitting strength as in reference [24,25].
It is known that the splitting test setup, the load application, and the arrangement of the test affect the results [37]. For that reason, and to investigate the influence of the rod flexure in the measured tensile strength of the block, a modified test was introduced for the y-direction (see Figure 4d).
In this case study, five different ways to evaluate the splitting strength in HCB are presented: (1) splitting tensile strength in the x-direction over the net area (), (2) splitting tensile strength in the x-direction over the gross area (), (3) splitting tensile strength in the x-direction over the gross area but using the net area to compute the splitting strength (), (4) splitting tensile strength in the y-direction (), and (5) splitting tensile strength in the y-direction, 200 mm from the central region of the block (), assessing the effect of the rod flexibility.
2.3. Direct Tensile Tests in X-Direction
The direct tensile test is not an aim of this research; however, it is an important result through which the results obtained from the splitting tests are evaluated and compared. The procedure to carry out the direct tensile test was described in [20]. The main results from the direct test with the blocks used in this research are described in the supplementary file.
From this test, 30 blocks were tested, the data fitted to the normal distribution, and the mean tensile strength in the x-direction was 0.90MPa.
Results in the x-direction were selected as the reference value for the tensile strength because in this setup the interaction between the steel plates and the specimen has a smaller effect on the real tensile strength of the material [20].
3. Results and Discussion
In this section, the experimental results and the description of the main failure modes are shown for the splitting tensile tests in the x- and y-directions. In addition, a section of statistical analysis is presented, where parametric and non-parametric hypotheses tests were carried out [38].
3.1. Experimental Results
The physical and mechanical properties for each direction in the splitting tests were obtained as shown in Figure 5 and Table 2. As in previous investigations [11,20], when the load was applied over the gross area in the x-direction, the failure was characterized by a non-uniform tearing of the material in the split plane, dividing the block into two parts (Figure 5a). Independently of the compressive strength, a protuberance can be seen in one part of the block and a hole with a sharp perimeter in the other part. The load was applied over the net area in the x-direction and the y-direction. The typical failure mode, characterized by a splitting plane, split the block into two non-uniform parts (Figure 5b–d).
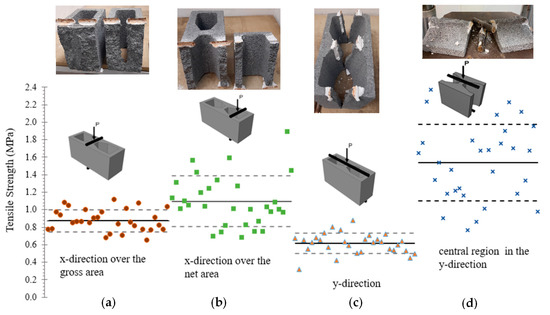
Figure 5.
Failure mode and tensile strength results from the splitting tests: (a) x-direction over the gross area, (b) x-direction over the net area, (c) y-direction, and (d) 200 mm from the central region of the block in the y-direction.
Table 2 shows the average dimensions and results obtained from the splitting tests. The whole data of the splitting tests can be found in references [39,40]. In the next sections, the tensile strengths are studied using statistical analysis and compared with other experimental results.
3.2. Statistical Analysis
Firstly, a Kolmogorov–Smirnov statistical test was carried out to prove that the results of the tests fit a normal distribution. Figure 6 shows that the p-value of all the tested samples was greater than the assumed significance level , indicating that the random variables fit a normal distribution.
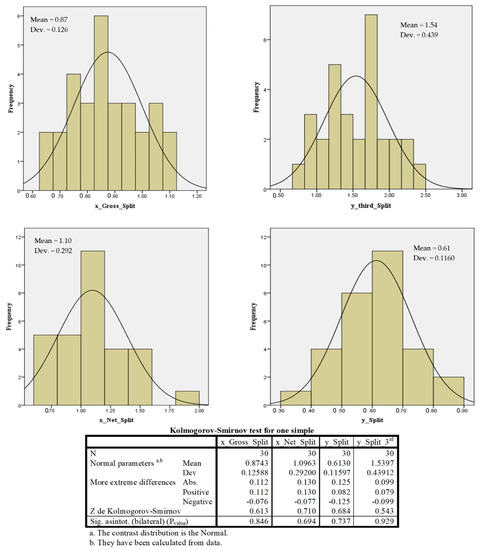
Figure 6.
Normality tests for the experimental results.
To increase the scope of the parametric tests, it is necessary to verify the homogeneity of the variance between the random variables [38]. Thus, the Levene test was employed to compare each pair of random variables (Table 3). According to the Levene test results, the appropriate parametric and non-parametric tests were carried out to determine the mean and median similarities between the compared samples. Table 3 shows these results. In addition, to measure the dispersion, the classical relative differences Equation (2) was applied. In engineering terms, only the mean values of each random variable need to be used. This is the most used criterion for the sub-domain comparison between random variables (Table 3).
Table 3.
Results from the statistic tests.
RD: relative difference. AD: absolute difference
The first five rows in Table 3 show a comparative between the direct tensile tests with the four variant of splitting test carried out in this research. It can be seen that the less relative difference obtained was with the splitting test over the gross area.
The values of the tensile strength in the x-direction, applying the load over the gross area but computing the stress over the net area , is not consistent with the standard (ASTM C-1006). From all the splitting variants, the highest obtained result was , which can be an uncontrolled overestimation of the tensile strength. In addition, this variant presented the highest relative and absolute differences.
The rod position out of the symmetry plane (x-direction over the net area), (Figure 5b), may also cause an overestimation of the tensile strength since there is a 21% relative difference compared to the results when applying the load over the gross area (Table 3). On the other hand, the rod can bend when the load is applied, as illustrated in Figure 4b.
A similar behavior occurs when the rod is placed in the y-direction (Figure 4c). The rod bends, but an underestimation can be obtained when the splitting strength is computed, , since there is 30% of relative difference compared to the results when applying the load over the gross area (Table 3).
An overestimation of the tensile strength also occurred when the modified method of the same rod position (Figure 5d) was carried out, , 43% of the relative difference compared to the results when applying the load over the gross area (Table 3). In this case, the bending of the rod is like the one shown in Figure 4d. Otherwise, the test develops the minimum rod curvature, and the load is applied in the symmetry plane.
The experimental splitting results showed that for each different position that causes bending in the upper rod, due to the load or boundary condition of the block (Figure 5), the splitting strength obtained shall be different. In some cases, the reported strengths increase , and in others they decrease .
3.3. Comparison with Other Studies
In previous investigations [11,20], tensile strength results were obtained from the direct and splitting tests, in x- and y-directions for 28.83 MPa of net compressive strength HCBs. In those works, statistical differences from the hypothesis tests were also obtained. The relative and absolute differences were (RD = 30%, AD = 60%) in the x-direction. In the y-direction, a significant difference between both procedures (direct and splitting) [11,20] did not exist. The differences in the x-direction were attributed to the load application in the gross area in the splitting test.
In the current study, the mean net compressive strength of the HCBs was 11.62 MPa, and the significant differences (P-value, RD, and AD) in the tensile strength in the x- and y-directions were attributed to the bending of the rod when the load is applied over the net area. The bending of the rod is a phenomenon that will be studied in the following research, including a micro-numerical modeling with finite element analysis. Another parameter that can have an influence on the tensile strength of the HCB is the compressive strength.
On the other hand, a few studies [11,12,17,20] have reported the ratio of tensile to compressive strengths in HCBs (Table 4). In some cases, this ratio is far from 10%, which is an usual estimate in some types of concrete [10,41,42].
Table 4.
Results comparison with other studies.
The 2nd and 6th columns from Table 4 show the experimental results of the ratio for two different compressive strength blocks. The relative difference between both columns is 2.6%; i.e., the ratio was similar for both compressive strengths of the HCBs.
However, when the comparison is made between the third and seventh columns from Table 4, the same method was used but with different compressive strengths. In that case, the splitting tests in the x-direction over the gross area had a variation with a relative difference of 29%. These results reaffirm what was discussed in the past section considering the influence of the rod flexibility and the compressive strengths of the HCBs.
Results of columns 4 and 11 from Table 4 for the block BB-1 [17] were obtained from the splitting test in the x-direction over the net area. The used blocks had similar geometries and strengths compared with the current research. The relative difference between both results was less than 5%. On the other hand, if the 6th and 11th columns from Table 4 for BB-3 are compared [17], since the compressive strength was similar, the relative difference is 60%. These results reaffirm those discussed in the splitting section about the overestimation of the splitting strength in the x-direction over the net area.
The 14th column from Table 4 shows the results obtained by other studies [12]. The direct tensile strength was achieved in samples cut from blocks. As it can be seen in this column, the ratios of tensile/compressive strength were higher than 15%. Thus, this strategy is not recommended.
Those results are important since this correlation is the most used ratio in the FEM analysis of masonry structures, and most of the time it uses 10% of the compressive strength. In those analyses, we can estimate that the ratio of tensile/compressive strength is under 10%.
Figure 7 displays a summary of the experimental results reported by the literature, related to the splitting tensile strength of HCBs [11,12,17,20,43]. The observed pattern is that while the compressive strength of the HCB increases, the relative difference between the splitting tensile strength over the gross and net area is greater.
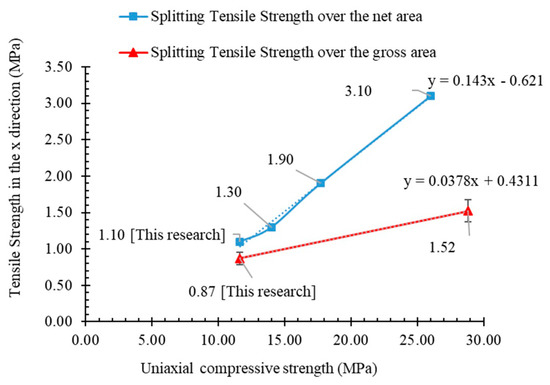
Figure 7.
Summary of the experimental results reported in the specialized literature.
Additionally, it is observed in Figure 7 that the splitting test over the gross area gave better results than over the net area (see Figure 4), i.e., the values obtained with the rod placed over the gross area are closer to the values obtained with the direct tensile test than those obtained with the rod placed over the net area. Considering that only one compressive strength is included in this study, this observation is thus limited to HCBs with two holes and a compressive strength of 11.62 MPa on the net area. Moreover, Equation (1) does not consider the influence of the rod position, and it may be necessary to apply a variable correction function. That function will be proposed in future studies, based on the previous research from reference [44]. The interaction between the rod and the HCB is influenced by the boundary conditions, geometrical properties, and the rod’s material.
With the aim to keep using simple mathematical functions for the indirect tensile strength, such as Equation (1), the following recommendations for the splitting test [26] are suggested:
4. Conclusions
From the results achieved in the statistical and experimental research about the HCBs behavior under splitting tensile tests, the following conclusions were obtained:
- The experimental results from the four different splitting tests showed that the corresponding setups had a significant effect on the computed tensile strength. For each different configuration, the tensile strength shall be different. In some cases, the strengths are greater, and they are smaller in others, i.e., the interaction of the test setup components biases the measured strength.
- In a splitting test, if the load is applied over the gross area, the tensile strength should not be computed over the net area, . This procedure is not consistent with the standard (ASTM C-1006). Furthermore, amongst all the analyzed variations, those results were the least meaningful.
- The splitting test on the net area in the x-direction overestimates the tensile strength.
- The experimental results suggest that when the compressive strength of the HCBs increases, the relative difference between the tensile strength over the gross and net area in the splitting tests is greater.
- This research is limited to HCBs with two holes and a compressive strength of 11.62 MPa on the net area.
Supplementary Materials
The following supporting information can be downloaded at: https://www.mdpi.com/article/10.3390/buildings13010096/s1, Table S1: Results of the direct tensile test (the elastic modulus were evaluated using the secant modulus at 5% to 35% of the ultimate strength); Figure S1: Schematic arrangement and location of the transducers for the direct tensile test in (a) y direction, and (b) x direction; Figure S2: Failure mode from direct tensile tests: (a) y-direction, and (b) x-directiom.
Author Contributions
Conceptualization, methodology, project administration, and funding acquisition J.H.C.-G. and J.Á.-P.; data curation, writing—original draft, and visualization, M.M.-L. and D.C.-d.-L.; writing—original draft preparation, J.Á.-P.; writing—review and editing, G.F.-S.-M.; writing—review and editing and funding acquisition, R.G.-A. All authors have read and agreed to the published version of the manuscript.
Funding
This research was funded by PAICYT 595-IT-2022, PAICYT 496-IT-2022, and PAICYT 598-IT-2022.
Institutional Review Board Statement
Not applicable.
Informed Consent Statement
Not applicable.
Data Availability Statement
Not applicable.
Acknowledgments
The authors gratefully acknowledge the financial support from the Faculty of Civil Engineering (FIC) and the Structural Engineering Department of the Universidad Autónoma de Nuevo León (UANL) as well as the PRODEP.
Conflicts of Interest
The authors declare no conflict of interest.
Nomenclature
| Ultimate strain in compression | |
| Strain related to the maximum stress in compression | |
| HCB uniaxial compressive strength over the gross area, MPa | |
| HCB uniaxial compressive strength over the net area, MPa | |
| Elastic modulus over the gross area, in compression, MPa | |
| Elastic modulus over the net area, in compression, MPa | |
| Splitting tensile strength in the x-direction over the net area, MPa | |
| Splitting tensile strength in the x-direction over the gross area, MPa | |
| Splitting tensile strength in the y-direction, MPa | |
| Splitting tensile strength in the y-direction, 200 mm from the central region of the block, MPa | |
| Splitting tensile strength in the x-direction over the gross area using the net area to compute the splitting strength |
References
- Zhu, F.; Zhou, Q.; Wang, F.; Yang, X. Spatial variability and sensitivity analysis on the compressive strength of hollow concrete block masonry wallettes. Constr. Build. Mater. 2017, 140, 129–138. [Google Scholar] [CrossRef]
- Zhao, Y.; Wang, F. Experimental studies on behavior of fully grouted reinforced-concrete masonry shear walls. Earthq. Eng. Eng. Vib. 2015, 14, 743–757. [Google Scholar] [CrossRef]
- Sassine, E.; Cherif, Y.; Dgheim, J.; Antczak, E. Investigation of the mechanical and thermal performances of concrete hollow blocks. SN Appl. Sci. 2020, 2, 2006. [Google Scholar] [CrossRef]
- Álvarez-Pérez, J.; Chávez-Gómez, J.H.; Terán-Torres, B.T.; Mesa-Lavista, M.; Balandrano-Vázquez, R. Multifactorial behavior of the elastic modulus and compressive strength in masonry prisms of hollow concrete blocks. Constr. Build. Mater. 2020, 241, 118002. [Google Scholar] [CrossRef]
- Fonseca, F.S.; Fortes, E.S.; Parsekian, G.A.; Camacho, J.S. Compressive strength of high-strength concrete masonry grouted prisms. Constr. Build. Mater. 2019, 202, 861–876. [Google Scholar] [CrossRef]
- Pereira, J.M.; Lourenço, P.B. Experimental Characterization of Masonry and Masonry Components at High Strain Rates. J. Mater. Civ. Eng. 2017, 29, 1–10. [Google Scholar] [CrossRef]
- Caldeira, F.E.; Nalon, G.H.; de Oliveira, D.S.; Pedroti, L.G.; Ribeiro, J.C.L.; Ferreira, F.A.; de Carvalho, J.M.F. Influence of joint thickness and strength of mortars on the compressive behavior of prisms made of normal and high-strength concrete blocks. Constr. Build. Mater. 2020, 234, 117419. [Google Scholar] [CrossRef]
- Madhavi, K.; Renuka, M.; Jagadish, K. Split tensile strength of brick masonry. Int. J. Civ. Eng. Comput. 2017, 6, 1–8. [Google Scholar]
- Bolhassani, M.; Hamid, A.A.; Lau, A.C.; Moon, F. Simplified micro modeling of partially grouted masonry assemblages. Constr. Build. Mater. 2015, 83, 159–173. [Google Scholar] [CrossRef]
- Mojsilović, N. Tensile strength of clay blocks: An experimental study. Constr. Build. Mater. 2011, 25, 4156–4164. [Google Scholar] [CrossRef]
- Álvarez, J.; Mesa, M.; Chávez, J. Splitting and direct tensile tests comparison in hollow concrete blocks. In Proceedings of the 14TH Canadian Masonry Symposium, Virtually, 16–19 May 2021. [Google Scholar]
- Haach, V.G.; Vasconcelos, G.; Lourenço, P. Development of a new test for determination of tensile strength of concrete blocks. In Proceedings of the 12th Canadian Masonry Symposium, Vancouver, BA, Canada, 2–5 June 2013. [Google Scholar]
- Almeida, J.C.; Lourenço, P.; Barros, J. Experimental investigation of bricks under uniaxial tensile testing. Mason. Int. 2005, 18, 11–20. [Google Scholar]
- Almeida, J.C.; Li, P.B.; Barros, J. Characterization of¸ brick and brick–mortar interface under uniaxial tension. In Proceedings of the 7th International Seminar on Structural Masonry, CEFET-MG, Belo Horizonte, Brazil, 2 June 2002; pp. 67–76. [Google Scholar]
- Santhakumar, A.R.; Ashok, S. Tensile strength of brick masonry. In Proceedings of the 9th Canadian Masonry Symposium; University of New Brunswick: Fredericton, NB, Canada, 2015. [Google Scholar]
- McBurneyz, J.W. Strength of brick in TENSION1. J. Am. Ceram. Soc. 1928, 11, 114–117. [Google Scholar] [CrossRef]
- Barbosa, C.D.S.; Hanai, J. Strength and deformability of hollow concrete blocks: Correlation of block and cylindrical sample test results. Rev. Ibracon Estrut. E Mater. 2009, 2, 85–99. [Google Scholar] [CrossRef]
- Li, J.; Masia, M.J.; Stewart, M.G.; Lawrence, S.J. Spatial variability and stochastic strength prediction of unreinforced masonry walls in vertical bending. Eng. Struct. 2014, 59, 787–797. [Google Scholar] [CrossRef]
- Zhang, W.; Deng, M.; Guo, L.; Qiu, Z.; Yang, S.; Dong, Z. Seismic Strengthening of Unreinforced Concrete Block Masonry Walls with High Ductile Fiber-Reinforced Concrete (HDC). J. Earthq. Eng. 2022, 1–23. [Google Scholar] [CrossRef]
- Álvarez-Pérez, J.; Mesa-Lavista, M.; Chávez-Gómez, J.H.; Miguel, G.F.-S. Experimental investigation on tensile strength of hollow concrete blocks. Mater. Struct. 2021, 54, 26. [Google Scholar] [CrossRef]
- Oliveira, L.M.F. Numerical and Experimental Study of the Behavior of Vertical Interfaces of Interconnected Structural Masonry Walls; São Carlos School of Engineering, University of São Paulo: Sao Carlos, Brazil, 2014. [Google Scholar]
- Rizzatti, E.; Roman, H.R.; Mohamad, G.; Nakanishi, E. Mechanical behavior analysis of small-scale modeling of ceramic block masonry structures: Geometries effect. Rev. Ibracon Estrut. E Mater. 2012, 5, 702–736. [Google Scholar] [CrossRef]
- Dean, S.W.; Parker, C.K.; Tanner, J.E.; Varela, J.L. Evaluation of ASTM Methods to Determine Splitting Tensile Strength in Concrete, Masonry, and Autoclaved Aerated Concrete. J. ASTM Int. 2007, 4, 12. [Google Scholar] [CrossRef]
- Izquierdo, I.S.; Izquierdo, O.S.; Ramalho, M.A.; Taliercio, A. Sisal fiber reinforced hollow concrete blocks for structural applications: Testing and modeling. Constr. Build. Mater. 2017, 151, 98–112. [Google Scholar] [CrossRef]
- De Oliveira, L.M.F.; Corrêa, M.R.S. Numerical and experimental analysis of the shear capacity of interconnected concrete block walls. Ambiente Construído 2017, 17, 25–37. [Google Scholar] [CrossRef][Green Version]
- ASTM-C-1006; Standard Test Method for Splitting Tensile Strength of Masonry Units. Copyright © ASTM International: West Conshohocken, PA, USA, 2013; p. 3.
- Bolhassani, M.; Hamid, A.; Moon, F. Enhancement of lateral in-plane capacity of partially grouted concrete masonry shear walls. Eng. Struct. 2016, 108, 59–76. [Google Scholar] [CrossRef]
- NTC-M. (Standard) Complementary technical standards for design and construction of masonry structures (in Spanish) (mexican masonry code). In Gaceta Oficial del Distrito Federal, Tomo I, N°.103-BIs.; 2017; p. 284. Available online: http://cgservicios.df.gob.mx/prontuario/vigente/745.pdf (accessed on 27 November 2022).
- NMX-ONNCCE-C-404; Bloques, Tabiques O Ladrillos Y Tabicones Para Uso Estructural–Especificaciones Y Métodos De Ensayo. Organismo Nacional de Normalización y Certificación de la Construcción y Edificación S.C: Ciudad de México, Mexico, 2012; p. 17.
- NMX-C-036-ONNCCE-2013; Resistencia a la Compresión de Bloques, Tabiques o Ladrillos y Tabicones y Adoquines. Organismo Nacional de Normalización y Certificación de la Construcción y Edificación S.C: Ciudad de México, Mexico, 2013; p. 10.
- 18a, A.C.C.M.; Standard Test Methods for Sampling and Testing Concrete Masonry Units and Related Units. ASTM International: West Conshohocken, PA, USA, 2018; p. 17.
- ASTM-C-90-16a; Standard Specification for Loadbearing Concrete Masonry Units. ASTM International: West Conshohocken, PA, USA, 2016; p. 5.
- ASTM-C-129; Standard Specification for Nonloadbearing Concrete Masonry Units. ASTM International: West Conshohocken, PA, USA, 2017; p. 3.
- NMX-C-404-ONNCCE-2012; Bloques, Tabiques o Ladrillos y Tabicones Para uso Estructural. Organismo Nacional de Normalización y Certificación de la Construcción y Edificación S.C: Ciudad de México, Mexico, 2012; p. 17.
- Barbosa, C.S.; Hanai, J. Resistência e deformabilidade de blocos vazados de concreto e suas correlações com as propriedades mecânicas do material constituinte. Cad. Eng. Estrut. 2006, 8, 45–74. [Google Scholar]
- García, J.M.; Bonett, R.; Ledezma, C. Analytical Model for Compression Behavior of Hollow Concrete Blocks. Rev. De La Construcción 2013, 12, 76–82. [Google Scholar]
- Yang, Y.; Massicotte, B.; Genikomsou, A.S.; Pantazopoulou, S.J.; Palermo, D. Comparative investigation on tensile behaviour of UHPFRC. Mater. Struct. 2021, 54, 147. [Google Scholar] [CrossRef]
- Montgomery, D.C.; Runger, G. Applied Statistics and Probability for Engineers, 3rd ed.; Wiley: Hoboken, NJ, USA, 2003. [Google Scholar]
- Álvarez-Pérez, J.; Mesa-Lavista, M.; Chávez-Gómez, J.H.; Cavazos-De-Lira, D.; Terán-Torres, B.T. Splitting test experimental dataset of hollow concrete blocks. Data Brief 2021, 39, 107646. [Google Scholar] [CrossRef]
- Mesa-Lavista, M. Results of the Splitting Tests of Hollow Concrete Blocks; Mendeley-Data: V2; Mendeley-Data, Ed.; Data Archiving and Networked Services (DANS): The Hague, The Netherlands, 2021. [Google Scholar] [CrossRef]
- Thomas, K.; O’Leary, D.O. Tensile strength tests on two types of brick. In Proceedings of the Second InternationaI Brick Masonry 1970, Stoke-on-Trent, UK, 12–15 April 1970. [Google Scholar]
- Hamid, A.A.; Drysdale, R. Effect of Strain Gradient on Tensile Strength of Concrete Blocks; Borchelt, J., Ed.; ASTM International: West Conshohocken, PA, USA, 1982; pp. 57–65. [Google Scholar]
- Barbosa, C.S.; Hanai, J. Strength and deformability of hollow concrete blocks and their correlations with mechanical properties of constituent material. In Proceedings of the in 10th Canadian Masonry Symposium, Banff, AB, Canada, 8–12 June 2005; pp. 8–12. [Google Scholar]
- Van Cauwelaert, F. The split tensile test applied to rectangular concrete blocks—Numerical and analytical approach. Mater. Struct. 1996, 29, 494–499. [Google Scholar] [CrossRef]


Disclaimer/Publisher’s Note: The statements, opinions and data contained in all publications are solely those of the individual author(s) and contributor(s) and not of MDPI and/or the editor(s). MDPI and/or the editor(s) disclaim responsibility for any injury to people or property resulting from any ideas, methods, instructions or products referred to in the content. |
© 2022 by the authors. Licensee MDPI, Basel, Switzerland. This article is an open access article distributed under the terms and conditions of the Creative Commons Attribution (CC BY) license (https://creativecommons.org/licenses/by/4.0/).