Abstract
Although building information modelling (BIM) is a widely acknowledged information and communication technology (ICT) in the architecture, engineering, construction, and operation (AECO) industry, its implementation is hindered by the hybrid practice of BIM and non-BIM information processing, and sometimes, it fails to add value to the AECO business. It is crucial to define, on a scientific base, how to ensure the effective use of BIM regarding the various conditions in which to apply BIM in AECO practices. Although several studies have investigated similar topics, very few have focused on the adoption of distinct BIM applications over the conventional practice from the perspective of business intelligence (BI) as a theoretical framework to justify the effective value of BIM use in the AECO. This study proposes a framework relying on BI principles to justify effective BIM use and explicates the contextual factors in AECO practices. The data were acquired from a three-round Delphi survey. The framework suggests that effective BIM use in AECO practices should follow the two principles of BI: achieving technical effectiveness and realizing business value. The pursuit of technical effectiveness should consider business objectives, business issues, business sustainability and regulatory eligibility, and the realization of business value involves willingness to adopt BIM, human-computer interoperability, visualization-based data quality and sources, data processing and system integration, and application maturity. This study provides a new perspective by which to address the issue of the technological iteration in the current hybrid BIM and non-BIM practice and could help to improve BIM implementation in the AECO industry.
1. Introduction
The digitalization of the architecture engineering and construction (AECO) industry has been remarkable due to the prevalence of information and communication technologies (ICTs) in the recent decades, particularly characterized by the wide use of building information modelling (BIM). Notably, BIM represents a new paradigm by which to process building information with rich information integrated from various dimensions [1,2]. BIM features a seemingly advanced paradigm of building information management in AECO. Sometimes, however, BIM suffers from overly ambitious usage without a discreet examination and assessment of its effectiveness, which means that BIM can fail to realize its expected value and causes undesirable disruption to the project workflow [3,4]. BIM implementation in the AECO industry staggers within a dilemma whether to follow the well-established convention or adapt to the new disruptive approach [5,6,7]. Thus, when adopting a prospective BIM application with uncertain effectiveness, it is essential for decision makers to justify BIM adoption before iterating the conventional practice of information processing with BIM.
A few prevalent viewpoints help to understand BIM adoption. The theory of BIM maturity levels explains the suspension of BIM adoption in AECO practices regarding the maturity of technology use [8]. However, this theory is built on the presumed effectiveness of mature BIM technology and neglects the damage caused by ineffective or failed BIM implementation in terms of its further use in AECO practices. In addition, BIM is often associated with AECO lifecycle information management [9]. However, there are a number of other intelligent initiatives, such as big data analysis, web technology, and neural networks, that serve to automate the AECO process. The relationship between BIM and building information management remains to be clarified. This study strives to add some new insights to these viewpoints by investigating different BIM applications and exploring the logic behind the iteration of BIM practice combined with non-BIM through an experimental project with business intelligence (BI), which provides a business-oriented framework regarding the technical effectiveness and business value of ICT applications to accommodate technology iterations and achieve technology use sustainability [10,11].
Some existing studies have considered similar research objectives. Du et al. [12] investigated the cloud BIM approach and focused on the development of the models for the benchmarking of the overall performance of BIM. Jin et al. [13] clarified that the assessment of BIM effectiveness is of principal importance for BIM use but is often difficult to realize in the AECO practices. Eleftheriadis et al. [14] assessed BIM use from the technical perspective in building design. Furthermore, Liao et al. [3] examined the non-value-adding issues in BIM use and classified the major factors that cause such a result. Recently, Marzouk and Hanafy [15] integrated BI and BIM to develop a framework that enables the smart maintenance of healthcare facilities and buildings. However, very limited studies pay attention to the adoption of different BIM applications over the conventional practices of AECO information processing, and a mature theoretical foundation is missing to guide the assessment of effective BIM use toward more efficient AECO practices.
Nevertheless, the investigation on the effectiveness of BIM use encounters three main issues. First, as the concept of BIM is not standardized, it is difficult to define what is BIM precisely [16,17]. This causes a problem regarding the focused scope of such investigations. Second, the practice of BIM in AECO faces the maturity issue, which depends on a few factors such as institutional conditions and technical procedures [18,19,20]. This feature of BIM use varies in different situations. Third, the advanced use of BIM requires semantic integration with other ICTs and means of data processing to achieve data intelligence [21,22]. Such integration needs alignment from a broader context.
Viewing the AECO project as a business process, this study adopts the perspective of BI and refers to different BIM applications in AECO practices to evaluate BIM effectiveness. BI is a theoretical initiative of intelligent business management that relies on the intelligent handling of data and information, including data collection, data integration, and data analysis, to integrate technological applications with business objectives and improve the effectiveness of technology use in business [10,11]. BI can provide a knowledge framework to standardize BIM as a data processing approach by visualization, as BI accommodates the effective use of a variety of digital applications including data visualization and processing [11,23]. The BI perspective embeds BIM into a broader context of data processing to resolve the issue of defining the scope of BIM use and align its assessment within different conditions. Moreover, this study probes into distinct BIM applications to investigate their effectiveness. Such a measure simplifies the maturity issue and facilitates specific evaluations.
Therefore, this study strives to reveal the logic behind effective BIM use and provide a framework to assess different BIM applications from the distinctive perspective of BI. Accordingly, this study proposes two research questions (RQs) as follows:
RQ 1:
Regarding the current hybrid BIM and non-BIM AECO practice, what is the logic that justifies an effective BIM application over a conventional non-BIM information management practice?
RQ 2:
How can we manage and ensure the effectiveness of BIM use across different BIM applications in AECO practices?
This study adopts the perspective of BI to assess BIM effectiveness. By introducing BI, this study also brings new insights into the significant issues of BIM use, including the logic behind an effective BIM application, how BIM should be implemented in AECO, and the rational role of BIM in building information management.
2. Theoretical Background
2.1. Related Existing Research
With various ICTs widely used in AECO, the current practice of AECO is transforming within such a digitalization trend. The use of BIM together with other ICTs has enriched data analysis in AECO [21,24]. Regarding the AECO project as a business process, AECO data processing encompasses the procures of data collection, integration, and analysis for further decision making [25,26,27]. In spite of the different approaches followed, the principal goal of BIM use is to facilitate efficient AECO practices [28,29].
Because the AECO practice is part of business, using BI as a guideline for BIM implementation fits the purpose of enhancing the efficiency of AECO practices. However, few existing studies can be found that associate BIM with BI. For instance, Çelik [30] suggests that BIM use in AECO should follow the data–information–knowledge–wisdom process to realize BI in AECO and achieve intelligent construction project management. Similarly, Karim Ibrahim [31] advocates for such a strategy of BIM use and provides a multisource approach to integrate BIM into data processing in the AECO work. Little research investigates effective BIM use in AECO practices following the general requirements of BI.
2.2. Rethinking BIM in the AECO Business Context
Drawn from studies such as Gledson [32], Davies et al. [6], and Çıdık et al. [5], BIM implementation involves the identified hybrid practice of information processing. Namely, building information and data are collected and processed both by humans and computing devices in the practice of AECO business. As part of the digitalization of AECO, the computer-enabled approach supplements the human-enabled practice with databases and information repositories such as BIM [33,34]. However, BIM is only one part of the process; other ICTs may also be involved in the hybrid information processing.
As the BIM process is part of the hybrid information processing in the AECO business, a broader view is essential for the use of BIM. Accordingly, the perspective of BI is suitable to reorient BIM use toward the effective handling of business information to achieve higher efficiency. Thus, the BI perspective is adopted herein to justify BIM use in AECO practices.
2.3. Preliminary Framework
BI relies on the effective processing of data and information, including data collection, data integration, and data analysis, to improve business processes, and thereby, involves two benchmarking dimensions of effective technology use and business value realization [11,12]. For visualization in BI, the contextual factors should cover the areas of business issues, purposes, and responsiveness [35]. Aigner [36] identified interactivity, users’ willingness, and validity as the critical factors to visualization in BI. Furthermore, Lavalle et al. [37] suggested that the visualization should include the application objective, interoperability, and data profile. In addition, BI is often regarded as a facilitator of business sustainability for improving organizational behavior and the corporate image [38,39]. From a technical perspective, system integration is a common issue for technical effectiveness [40,41]. The two main dimensions involving business and technology are also confirmed by Hashmi et al. [42] to accommodate the digital transformation of industries. Based on these works, the preliminary framework employs the principles of BI to ensure that the use of different BIM applications fits the human-computer hybrid information processing in BIM-based AECO practices.
Regarding the hybrid practice, the preliminary framework follows the idea of technology iteration to adopt BIM-based AECO practices over the conventional non-BIM practice. As BIM itself can be categorized as a means of the visualization amongst the multiple initiatives of BI in the AECO, its application shall be subordinate to BI objectives. Initially, two main categories, i.e., business value and technical effectiveness, as the aforementioned business intelligence requirements [11,12], set the directions of BIM adoption. The cross-sectioned areas of the two categories define four types of BIM adoption:
- For those not quite valuable and not quite effective ones, the conventional practice is retained;
- For the quite valuable and effective ones, the conventional practice can be iterated with BIM;
- For not quite valuable but effective ones, the use of BIM shall be reoriented toward business value;
- For the valuable but not effective ones, the problems shall be addressed in the BIM application.
Concerning the analysis above, the logic of BIM assessment with the requirements of BI is proposed as illustrated by Figure 1.
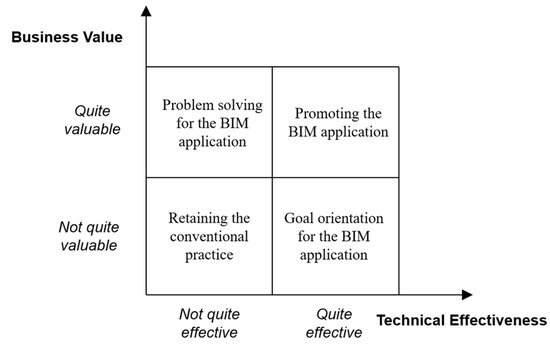
Figure 1.
The logic of BIM assessment with the requirements of BI.
The main categories, business value, and technical effectiveness, help to identify the preliminary contextual factors with the sources as shown in Table 1. The preliminary contextual factors related to business value involve business objectives, business issues, business responsiveness and business sustainability. The technical effectiveness includes preliminary contextual factors willingness to adopt BIM, human–computer interoperability, visualization-based data quality and sources, and data processing and system integration.

Table 1.
Preliminary contextual factors in assessing BIM with BI requirements.
3. Research Methodology
3.1. Method Justification and Research Initiation
The Delphi technique has broad application in academic and practical investigations. It is commonly used to achieve a relative consensus within a panel of selected experts, gather their knowledge and experience, and gain credited understandings on a particular issue [43]. Delphi studies also thrive in the areas of construction management. According to Ameyaw et al. [44], there was a dramatic surge in Delphi studies published in the renowned construction management journals from 1990 to 2012. Bhandari and Hallowell [45] stated that empirical studies based on experts’ knowledge, such as the Delphi survey, enable the construction management researcher to obtain evidence within constrained conditions. In addition, the Delphi survey has been applied to a few BIM studies, such as Mayo and Issa [46], Olawumi et al. [47], and Evans and Farrell [48].
This study probes into the logic and the contextual factors of effective BIM use from the perspective of BI and follows the procedures of proposing a preliminary framework, gathering expert opinions to develop the framework, and verifying the established framework with experts’ assessments. The Delphi survey suits the research purpose well to fulfill the goals by facilitating empirical assessments by experts. Thus, this study employs the Delphi survey as a research approach. It was initiated with a pilot study, which served to develop the questionnaire with reference to the key experts’ opinions regarding the logic and contextual factors of the preliminary framework. The pilot study, via focus group interviews, examined two key experts’ opinions on the research issue and the applicability of the survey. One expert, with the richest experience in AECO (19 years of AECO experience and 6 years of BIM use) in the group, and the other expert, with the most experience in BIM use (8 years of BIM use and AECO experience, respectively) in the group, were interviewed to confirm the logic of the preliminary framework and refine the contextual factors. Then, the researchers worked with the two experts to achieve their consensus. The experts’ achieved agreement on three points: (1) Business responsiveness is already covered by business objectives and issues and therefore can be deleted; (2) the factor regulatory eligibility should be considered for the main category of business value; and (3) application maturity should be added as a contextual factor of technical effectiveness. Based on the results of the pilot study, nine contextual factors in total were retained in the revised list (Table A4 in Appendix A) developed from Table 1.
3.2. Planning and Implementation of the Delphi Survey
In practice, the communication of the focused issues, the channel of data collection, and the survey rounds are crucial to the validity of a Delphi study [43,49]. The pilot study helps to address the communication of the studied issues with feedback from the two key experts through interviews. The other issues are carefully treated in the planning and implementation of the Delphi survey.
3.2.1. The Practical Conditions to Implement the Survey
The researchers managed to secure collaboration from a building research institute in this study. This building research institute has a BIM center serving the AECO practice with the consultancy of BIM use. Thus, the BIM center gathers consultants with rich work experience to provide BIM consulting services. Due to the reason that the research institute has a strong interest in exploring the effectiveness of different BIM applications and developing new consultancy services, its BIM center has a semi-experimental BIM project (SBP), which was investigated as a verification case of the established framework. Some BIM applications of the SBP are experimental; thus, the project is better equipped than an ordinary one to avoid survivorship bias—namely, some less-effective applications can be kept. This feature helps to enhance the validity of framework verification in the project. Accordingly, the researchers invited consultants from the BIM center as the panel experts to participate the Delphi study. However, not all the experts had particular experience in SBP. This could be utilized to obtain a comparison of the expert groups with and without experience of SBP.
3.2.2. Survey Process Design
Based on the investigation needs and the practical conditions, a three-round process was planned to implement the survey; as agreed in a few studies [44,47,50], the process of two or three rounds is desirable for Delphi surveys. The first round is an initial assessment of the contextual factors by the experts. The second round serves to give feedback to the experts on their assessment of the contextual factors and improve the consensus among them. The third round serves as a verification process to apply the framework to a real case and compare the experts’ assessments before and after their adoption of the framework.
A few measures were taken to control the survey and ensure its validity. First, the survey was anonymous to ensure that the experts felt free to express their personal opinions. Second, the controlled feedback process in the second round enabled the experts to rethink and make corrections. Third, the model verification with a real case provided evidence to validate the assessments of the experts and the reliability of the framework. Compared to the regular use of the Delphi technique in solely relying on the opinions of the experts, this study added a validation process to fully leverage the data against the limitations of the available experts who had distinct experience of a specific project.
3.2.3. The Establishment of the Expert Panel
The establishment of the expert panel followed some presumed criteria. According to previous studies with similar subjects [46,47], the eligibility criterion of the experts was focused on their AECO work experience and their BIM use experience and knowledge. Such categorization involves both work and special domain experience, which was confirmed by Ameyaw et al. [44] as a common practice in Delphi studies in construction management research. The selection of experts referred to three indicators, namely AECO work experience by year, BIM use experience by year, and the number of projects in which they had participated. Fifteen experts from the BIM center were invited to participate in the Delphi survey. Through three rounds, a total of thirteen valid responses were collected and the response rate was 86.67%. The sample size was satisfactory as 10–15 is adequate for a Delphi study to facilitate effective assessments with good consensus [51,52]. The experts were consultants who had professional experience in different AECO disciplines, such as architecture, building engineering, MEP, and HVAC, with at least three years of experience as consultants in AECO. The background investigation found that the experts’ work experience in AECO amounted to 6.2 years, and their BIM use experience amounted to 4.9 years, on average. All experts had at least 3 years of AECO work and BIM use experience, including one with 3 years of AECO work and BIM use experience but with experience with more than 10 projects; one had 4 years of AECO work experience, 3 years of BIM use experience, and experience with 5 to 10 projects; and one had 13 years of AECO work experience, 3 years of BIM use experience, and experience with 3 to 5 projects. Another response was obtained from one with 3 years of AECO work and BIM use experience but not enough project experience; they were thus screened out. The demographic information of the experts is presented in Table 2.
Table 2.
The information of the experts’ experience.
3.2.4. Survey Implementation
The tasks in the implementation of the survey were different among the three rounds. In the first round, the experts were requested to evaluate the effectiveness of a few specific BIM applications adopted in the SBP by ranks and then to assess the relative importance of the contextual factors under general conditions of BIM use. In the second round, the experts were invited to give their feedback on the relative importance of the contextual factors referring to the results, including the minimum, mean, and maximum values of the factors obtained in the first round. In the third round, the experts only needed to evaluate the specific BIM applications in the SBP by scales again. The evaluations of the specific BIM applications by rank in the first round and by scale in the third round served to verify the framework, as the evaluations in the first round were entirely based on the experts’ first-hand experience and those in the third round adopted the framework to explicate the effectiveness. All the questionnaires in the different rounds used a five-point Likert scale, as this is commonly adopted by Delphi studies in the AECO field to quantify experts’ assessments of different contextual factors [44].
3.3. Data Analysis and Techniques Applied
The collected empirical assessment data were processed by Microsoft Excel 2019 and IBM Statistical Product and Service Solutions (SPSS) V24, where Excel mainly helped to calculate inter-rater agreement (IRA) and SPSS served for statistical analysis, including descriptive statistics, correlation analysis, and the Mann–Whitney test.
3.3.1. IRA Calculation
IRA is measured by , which can be calculated using Equations (1)–(3) [47,50,53]. The agreement level of the second round indicated general moderate agreement, with one weak and one strong, which maintained an efficient balance between the experts’ independent assessment and common agreement [54,55].
where is the standard deviation; is the maximum scale, i.e., 5; is the minimum scale, i.e., 1; is the mean value; is the lowest threshold of the mean score; is the highest threshold of the mean score; is the sample size which is thirteen in this survey.
The weights were calculated following Equation (4) referring to the mean values of the factors within the main category of business value (n = 4), with similar logic suggested by Yeung et al. [56] and Xia et al. [57].
where is the standard deviation; is the mean value of a particular contextual factor in a major category (i.e., business value/technical effectiveness); is the sum of the mean values of all the contextual factors of a major category.
3.3.2. Correlation Analysis
According to the logic of BIM use with the requirement of BI, as Figure 1 illustrates, the correlations of the contextual factors of business value and those of technical effectiveness need to be analyzed. Correlation analysis commonly applies Spearman’s coefficient and Kendall’s tau to perform non-parametric tests, while Kendall’s tau requires data ranked in a sequential order to function [58]. As the Kolmogorov–Smirnov test indicated that the data were non-normal and the collected data were not sequential, the correlation analysis adopted Spearman’s coefficient.
As shown in Table 3, the correlation matrix of the contextual factors of business value indicated good independency of the factors, as no significant correlations were found. However, the correlation analysis of the technical effectiveness factors found two significant correlations (sig.< 0.01, 2-tailed): one was between human–computer interoperability and data processing and system integration; the other existed between willingness to adopt BIM and application maturity (Table 4). As the experts confirmed the cask effect of the technical effectiveness factors proposed by the researchers in the pilot study, the score for technical effectiveness was determined by the assessed lowest value of its five contextual factors. Thus, the correlations of the technical effectiveness factors had a limited impact on the results.
Table 3.
Correlation matrix of the business value factors.
Table 4.
Correlation matrix of the technical effectiveness factors.
3.3.3. Model Development
The model development of the framework employed the results of descriptive statistics, including mean values and standard deviations, as a summary of the experts’ assessments. Regarding the main category of business value, it had four contextual factors; the calculation of weighted means for business value followed Equation (5). However, due to the cask effect of the technical effectiveness factors, Equation (6) was adopted to determine the score for technical effectiveness, referring to Chang et al. [59] in terms of construction management and Ma et al. [60] in terms of information technology use.
where is the weighted mean of business value; is the weight of Factor i in business value; , is the mean of Factor i, is the score of technical effectiveness; , is the mean of Factor j.
According to the logic of the proposed framework verified by the experts, the main category of business value represents the impact of BIM use on AECO practices, and technical effectiveness represents the feasibility of BIM use. The calculation of the overall score () regarding the two main categories was similar to the critical risk assessment and thus could refer to Equation (7), as used by Chang et al. [59] and Zhao et al. [61].
As Equation (7) normalizes the value of OS, the score can return to the nominal scale of the five-point Likert scale, which would be demonstrated further in the model verification.
3.3.4. Data Validity and Model Validation
The data validity of the survey referred to Cronbach’s α and Kendall’s W. Cronbach’s α measures the reliability of a set of data, with an acceptable threshold between 0.7 and 0.8, and Kendall’s W denotes the concordance of rated data from 0 as no agreement to 1 as total agreement [62].
In the model’s validation, non-parametric tests were needed due to the non-normality of the assessment data. The Mann–Whitney test and Wilcoxon’s rank-sum test are non-parametric tests commonly used to examine discrepancies for two independent groups [62]. Compared with Wilcoxon’s rank-sum test, the Mann–Whitney test can process data regarding small unequal sample sizes of 5 and 6 for two-tailed prediction [63] (pp. 2–6). Such statistical analysis is also applied in the cases of 10 in [62] (pp. 687–699) and 6 in [64]. As the model validation needed a comparison of experts with and without experience of the SBP, the Mann–Whitney test was selected.
4. Results and Analysis
4.1. Reliability of the Delphi Survey
The experts’ assessments of the contextual factors in the first and second rounds of the Delphi survey are presented and compared in Table A1, together with IRA. The reliability indicator Cronbach’s α increases from 0.718 to 0.820. Kendall’s W, as a coefficient of concordance, improves from 0.176, with a significance level of 0.019, to 0.253, with a significance level of 0.001.
4.2. Model Verification
The developed framework with the contextual factors is verified in the SBP. The SBP involves the design and construction of a new building in the extension of a college campus, as illustrated by Figure 2. The site of the SBP covers around 21,000 sqm. The total building floor area is some 80,000 sqm, with approximately 72,000 sqm of building floor above the ground, and approximately 8000 sqm underground. The building includes lecture and training rooms and student dormitories, together with facility rooms for MEP and HVAC. The owner has a vision for its high-quality development and thereby supports multiple applications of BIM in the SBP.
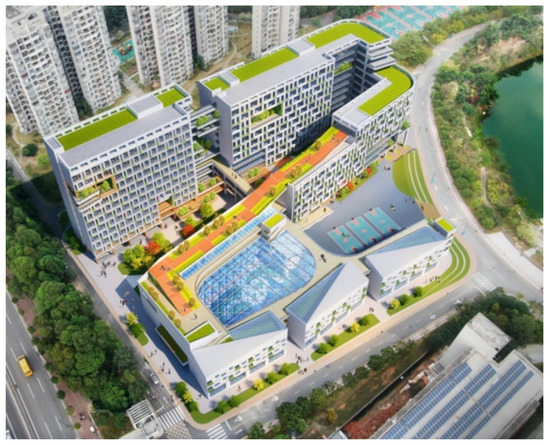
Figure 2.
The designed new building of the campus extension.
As the expert panel consisted of seven experts who participated in this project, and the other six did not participate, a comparison of their opinions on the five distinct BIM applications (Figure 3, Figure 4, Figure 5, Figure 6 and Figure 7) adopted in this project could be obtained. Their assessments also applied a five-point Likert scale, with options as follows: 1—totally disagree, 2—quite disagree, 3—neutral, 4—quite agree, 5—totally agree. The whole panel of experts was requested to assess the effectiveness of BIM applications by the contextual factors in the design and construction stages, including A1—daylight analysis in terms of percentage daylight factor, A2—clash detection, A3—foundation design with geological information modelling, A4—simulation of modular building construction, A5—construction progress analysis, shown in Figure 3, Figure 4, Figure 5, Figure 6 and Figure 7.
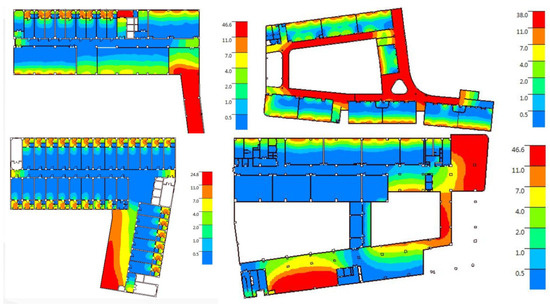
Figure 3.
BIM application A1—daylight analysis in terms of percentage daylight factor.
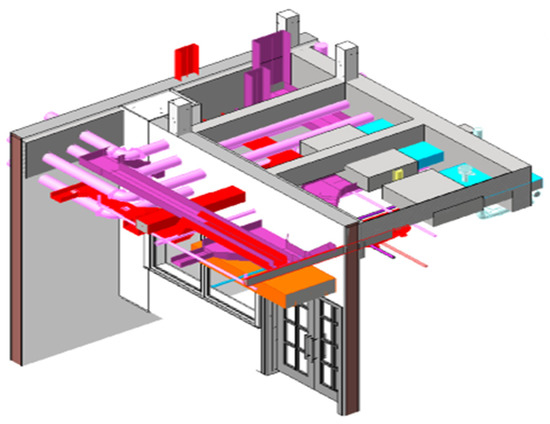
Figure 4.
BIM application A2—clash detection (with different colors representing structures of different disciplines e.g., MEP, HVAC).
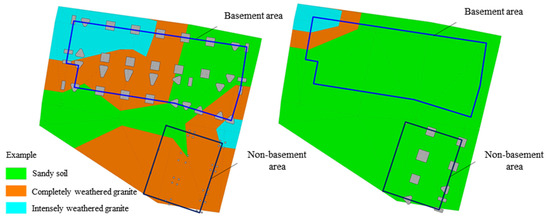
Figure 5.
BIM application A3—foundation design with geological information modelling.

Figure 6.
BIM application A4—simulation of modular building construction.
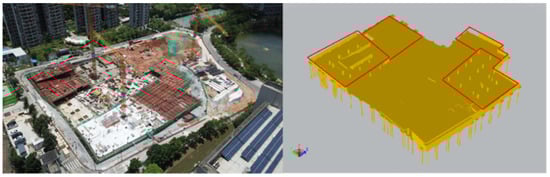
Figure 7.
BIM application A5—construction progress analysis (with red frames representing work to be finished in three days).
The experts’ assessments of BIM application A1–A5 are presented in Table A2. The overall score was calculated using Equations (5)–(7), referring to the assessed mean values of the contextual factors by code (see Table A4). The effectiveness of the applications in decreasing order is A2 (OS = 4.197), A5 (OS = 3.720), A4 (OS = 3.612), A3 (OS = 3.242), and A1 (OS = 2.331). Table A3 compares the experts who participated, as the Experienced Group (EG), and the other experts who did not participate in the SBP, as the Reference Group (RG). It was found that the ranks of both groups were the same as A2 (OS = 4.258 by EG; OS = 4.197 by RG), A5 (OS = 3.637 by EG; OS = 3.720 by RG), A4 (OS = 3.531 by EG; OS = 3.612 by RG), A3 (OS = 3.137 by EG; OS = 3.242 by RG), A1 (OS = 2.186 by EG; OS = 2.331 by RG), in decreasing order.
In case that the two groups of experts have significant differences in their knowledge and general experience, a further Mann–Whitney test can be conducted to investigate such an issue. As per Table 5 and Table 6, no significant difference in their experience in AECO work and BIM use was identified.
Table 5.
Ranking analysis by the Mann–Whitney test of the expert groups’ general experience.
Table 6.
Comparison of the expert groups’ general experience by the Mann–Whitney U.
The rank evaluation of the experts by their first impressions of the BIM applications was analyzed. Table 7 presents the different expert groups’ assessments, and we found no significant difference by the Mann–Whitney test. Furthermore, as shown in Table 8, the mean rank comparison found that the rank evaluation of the EG was not consistent with that of the RG. The experts in the EG gave priority of importance to A3 over A4 and A5, while experts in the RG prioritized A5 over A4 and A3, which is in agreement with the assessments following the logic of the framework. Thus, it can be inferred that the use of the framework helps experts to improve their understanding of the effectiveness of BIM applications, even if they have not participated in the implementation of these BIM applications. Such a conclusion highlights the potential of the framework to predict the effectiveness of prospective BIM applications in an early stage in AECO projects.
Table 7.
The Mann–Whitney test of the expert groups’ rank evaluation of A1–A5.
Table 8.
A comparison of the expert groups’ rank evaluation by mean rank.
The assessed mean value of each BIM application can be utilized to anchor BIM effectiveness by the framework referring to Figure 1. For example, A1, with both TE and BV values below 3, i.e., neutral (data from Table A2), lies in “Retaining the conventional practice”, which means that A1 does not have enough effectiveness in the SBP, and thereby the conventional practice can be retained. However, A2, referring to clash detection, has excellent performance, with scores in both categories no less than 4. It is recommended by the framework that A2 has a considerably good effect and can be adopted to iterate the conventional non-BIM practice in the SBP.
5. Discussion
5.1. Responses to the RQs and Reflections on BIM Effectiveness
The developed and verified framework helps to answer the RQs. In response to RQ 1, the logic behind effective BIM use in AECO practice shall follow the two major requirements of BI in terms of technical effectiveness and business value to ensure the effectiveness of BIM as a technology and the contribution of BIM use to the business. Furthermore, the contextual factors and Equation (7) can be employed to deal with RQ2 by calculating the OS of the target BIM application. Notably, in the identified framework, business value as a main driver does not apply the cask effect, but it is another case for technical effectiveness. Non-effective technology use causes the implementation of BIM to fail and creates waste. Equation (7) considers such a difference to quantify the overall score.
This study focuses on the evaluation of BIM effectiveness. In general, cost-effectiveness is a more comprehensive research subject. However, it is difficult to quantify the cost-effectiveness of BIM use regarding the complex conditions of AECO practice [65,66]. Nevertheless, the implementation of BIM often involves cooperative game issues with regard to construction governance [67,68]. Moreover, the use of BIM helps to enhance the digital environment [69,70], for which the benefits cannot easily quantified. The further promotion of BIM can build on effective BIM use and the common agreement of major business stakeholders [70]. The goal of BIM use in AECO practice may not necessarily be to achieve escalated BIM use but to facilitate effective technology application in the context of BI.
5.2. BI As a Theoretical Framework for BIM Use
The framework underlines human–computer interaction, referring to BI as a theoretical basis to enhance data processing and the semantic integration of BIM in AECO practices. There are a few reasons that BI is referred to rather than artificial intelligence (AI). BI is often regarded as an intermediate process that connects the current human–computer hybrid information processing to future AI-based information processes for business [40,71]. Primarily, BIM is more of an initiative of human–computer interaction, as the visualization focuses on information processing by human cognition. However, AI in AECO relies on the integration of multiple technical and intelligent applications, rather than human intelligence, to facilitate automated information processing [72]. Moreover, AI in AECO requires the integration of multiple technical and intelligent applications [69]; therefore, the current hybrid information processing with BIM fits better with BI. In addition, BIM use needs to be aligned with the goal of the AECO effort [4,28], and BI orients BIM use toward AECO business goals. Thus, adopting the perspective of BI helps to define an attainable objective of BIM implementation in the constrained condition regarding the hybrid practice, and contributes to the better exploitation of BIM in AECO practices.
Based on the discussion above, the digitalization initiative of the AECO should think outside of the “BIM” box and examine the possibilities via various innovative information processing approaches. In the wider scope of BI, BIM has its limitations, as it is only the conceptualization of the AECO product, and it has a deficiency in analyzing dynamic work procedures and organizations [73,74]. Efforts facilitated by new insights can escalate BIM use to enhance the digitalization of AECO. Notably, BI provides a business-oriented framework to accommodate technology iteration and achieve technology use sustainability. The introduction of BI to guide BIM use provides a broader context to align the objectives of different means of visualization by BIM toward the digitalization of AECO.
5.3. Contributions and Implications
5.3.1. Theoretical Contributions
This study has some theoretical contributions. It provides a new insight to enhance the knowledge body of BIM from the perspective of BI. Such a perspective generalizes BIM as a means of data processing to open the “BIM” box and interpret BIM from a broadened context. Meanwhile, as BI has a mature theoretical foundation, such a perspective can expand the knowledge of BIM implementation into the more comprehensive knowledge scope of BI. Moreover, this study clarifies the logic behind effective BIM use. This research effort embeds and aligns BIM implementation in the context of AECO digitalization. It could benefit construction management and informatics.
5.3.2. Practical Implications
Some implications can be described regarding AECO practices. This study employs BI as a framework to fit BIM use into the AECO business. This study also provides a framework to help the AECO project to diagnose existing BIM applications, assess prospective applications, and justify BIM use. The framework can be applied to deal with the decision on the adoption of specific BIM applications over the conventional AECO information processing and engineering BIM applications with poor performance. Furthermore, it can also provide guidance to policy makers in the AECO industry, indicating that BIM use, if necessary, should focus on specific BIM applications rather than generalized BIM use to create more value and cause less technology misuse. These findings regarding distinct BIM applications are rarely reported in peer studies on BIM effectiveness.
6. Conclusions
With the digitalization of the AECO industry, BIM continues to expand into different applications and facilitates the semantic integration of various ICTs. However, the effectiveness of different BIM applications is not taken for granted. Regarding this issue, the current study proposes a framework from the perspective of BI to justify effective BIM use in AECO practice. The justification of BIM effectiveness refers to two demands of BIM use: (1) The semantic integration of BIM with other ICTs should create value for the business; (2) the use of BIM needs to achieve intelligent data processing.
This study was implemented in a few steps. First, the preliminary framework was identified from a literature review to establish a theoretical background. Second, a pilot study using a Delphi survey helped to justify the logic and classify the contextual factors of the framework. Third, the Delphi survey examined the experts’ opinions as empirical evidence to develop the framework via the contextual factors. Finally, the verification through the SBP validated the developed framework. These procedures form a full research cycle to propose, modify, and verify the framework. By introducing BI, this study also brings new insights into the significant issues of BIM use in AECO, including how BIM should be implemented in the AECO industry and its relation to building information management.
This study has two limitations. First, the sample size is somewhat small due to the reason that experienced BIM experts are commonly few in a particular project. As these are the only available experts to help implement the study, specific research approaches including the Delphi survey and the Mann–Whitney test were employed to realize the research purpose. Second, the selected BIM applications of the SBP are not numerous due to the consideration of experts’ possible dropouts. As pointed out by Ameyaw et al. [44], experts tend to drop out of surveys with more than two rounds. This study selected five BIM applications in a real project but failed to cover all the areas as shown in Figure 1. Future research may be directed toward engineering the BIM applications that are either not technically effective enough or not valuable in the AECO business context to achieve an effective BIM application with an in-depth investigation of the BIM use.
Author Contributions
Conceptualization, X.M.; investigation, X.M., Z.H.; writing—original draft X.M., H.Y.; methodology X.M.; data curation X.M., X.L.; founding acquisition X.M., H.Y., X.L.; resources H.Y., X.L.; visualization X.M.; software X.M.; writing—reviewing and editing X.M., X.L., H.Y.; supervision H.Y., T.Z.; coordination Z.H., T.Z. All authors have read and agreed to the published version of the manuscript.
Funding
This research was supported by National Social Science Fund of China, grant number 22BGL008.
Institutional Review Board Statement
Not applicable.
Informed Consent Statement
Not applicable.
Data Availability Statement
The data presented in this study are available on request from the corresponding author.
Acknowledgments
The authors wish to express their sincere thanks to the experts who participate in the Delphi survey either as interviewees or questionnaire respondents.
Conflicts of Interest
The authors declare no conflict of interest.
Appendix A
Table A1.
The experts’ assessments on the contextual factors in the first and second rounds.
Table A1.
The experts’ assessments on the contextual factors in the first and second rounds.
| First Round | Second Round | |||||||||
|---|---|---|---|---|---|---|---|---|---|---|
| Mean | Std. Deviation | IRA | Agreement Level | Weights | Mean | Std. Deviation | IRA | Agreement Level | Weights | |
| B1 | 4.62 | 0.506 | 0.600 | Moderate | 0.269 | 4.46 | 0.519 | 0.687 | Moderate | 0.267 |
| B2 | 4.54 | 0.519 | 0.643 | Moderate | 0.265 | 4.23 | 0.599 | 0.687 | Moderate | 0.253 |
| B3 | 3.92 | 0.760 | 0.603 | Moderate | 0.229 | 4.00 | 0.707 | 0.639 | Moderate | 0.240 |
| B4 | 4.08 | 0.862 | 0.433 | Weak | 0.238 | 4.00 | 0.913 | 0.398 | Weak | 0.240 |
| T1 | 4.38 | 0.870 | 0.213 | Lack | 0.213 | 4.23 | 0.725 | 0.542 | Moderate | 0.214 |
| T2 | 3.92 | 0.760 | 0.603 | Moderate | 0.191 | 4.23 | 0.599 | 0.687 | Moderate | 0.214 |
| T3 | 3.85 | 0.899 | 0.467 | Weak | 0.187 | 3.69 | 0.751 | 0.653 | Moderate | 0.187 |
| T4 | 3.92 | 0.862 | 0.488 | Weak | 0.191 | 3.46 | 0.660 | 0.751 | Strong | 0.175 |
| T5 | 4.46 | 0.776 | 0.300 | Weak | 0.217 | 4.15 | 0.689 | 0.615 | Moderate | 0.210 |
| Cronbach α | 0.718 | 0.820 | ||||||||
| Kendall W | 0.176 | 0.253 | ||||||||
| Asymp. Sig. | 0.019 | 0.001 | ||||||||
| Chi-Square | 18.302 | 25.654 | ||||||||
| df | 8 | 8 | ||||||||
Table A2.
The result of experts’ assessment on A1–A5.
Table A2.
The result of experts’ assessment on A1–A5.
| A1 | A2 | A3 | A4 | A5 | |||||||
|---|---|---|---|---|---|---|---|---|---|---|---|
| Weight | Mean | Cask Value | Mean | Cask Value | Mean | Cask Value | Mean | Cask Value | Mean | Cask Value | |
| B1 | 0.267 | 2.077 | 4.462 | 3.615 | 3.462 | 4.231 | |||||
| B2 | 0.253 | 2.000 | 4.231 | 3.154 | 3.846 | 3.769 | |||||
| B3 | 0.240 | 2.385 | 4.538 | 3.231 | 3.692 | 3.846 | |||||
| B4 | 0.240 | 2.692 | 4.385 | 3.308 | 3.769 | 3.769 | |||||
| BV | 1 | 2.279 | 4.403 | 3.332 | 3.688 | 3.911 | |||||
| T1 | 0.214 | 2.385 * | 4.615 | 3.154 * | 3.692 | 3.769 | |||||
| T2 | 0.214 | 3.538 | 4.615 | 3.538 | 4.077 | 4.154 | |||||
| T3 | 0.187 | 3.154 | 4.462 | 3.462 | 3.923 | 3.692 | |||||
| T4 | 0.175 | 2.923 | 4.000 * | 3.154 * | 3.538 * | 3.615 | |||||
| T5 | 0.210 | 2.538 | 4.615 | 3.231 | 3.692 | 3.538 * | |||||
| TE | 1 | 2.902 | 2.385 | 4.479 | 4.000 | 3.310 | 3.154 | 3.791 | 3.538 | 3.762 | 3.538 |
| OS | 2.331 | 4.197 | 3.242 | 3.612 | 3.720 | ||||||
| Rank | 5 | 1 | 4 | 3 | 2 | ||||||
* TE value regarding the cask effect..
Table A3.
Comparison of assessments on A1–A5 by experts with and without SBP experience.
Table A3.
Comparison of assessments on A1–A5 by experts with and without SBP experience.
| A1 (Mean Value) | A2 (Mean Value) | A3 (Mean Value) | A4 (Mean Value) | A5 (Mean Value) | |||||||
|---|---|---|---|---|---|---|---|---|---|---|---|
| Weight | EG n = 7 | RG n = 6 | EG n = 7 | RG n = 6 | EG n = 7 | RG n = 6 | EG n = 7 | RG n = 6 | EG n = 7 | RG n = 6 | |
| B1 | 0.267 | 2.000 | 2.167 | 4.000 | 5.000 | 3.286 | 4.000 | 3.286 | 3.667 | 4.143 | 4.333 |
| B2 | 0.253 | 1.571 | 2.500 | 3.857 | 4.667 | 3.143 | 3.167 | 3.714 | 4.000 | 3.429 | 4.167 |
| B3 | 0.240 | 1.857 | 3.000 | 4.429 | 4.667 | 3.000 | 3.500 | 3.571 | 3.833 | 3.714 | 4.000 |
| B4 | 0.240 | 2.286 | 3.167 | 4.571 | 4.167 | 3.286 | 3.333 | 3.714 | 3.833 | 3.714 | 3.833 |
| BV | 1 | 1.926 | 2.691 | 4.204 | 4.636 | 3.181 | 3.509 | 3.566 | 3.831 | 3.756 | 4.091 |
| T1 | 0.214 | 2.143 | 2.667 | 4.429 | 4.833 | 2.857 | 3.500 | 3.429 | 4.000 | 3.571 | 4.000 |
| T2 | 0.214 | 3.000 | 4.167 | 4.571 | 4.667 | 3.429 | 3.667 | 3.857 | 4.333 | 3.857 | 4.500 |
| T3 | 0.187 | 2.857 | 3.500 | 4.286 | 4.667 | 3.143 | 3.833 | 3.571 | 4.333 | 3.429 | 4.000 |
| T4 | 0.175 | 2.571 | 3.333 | 3.571 | 4.500 | 2.857 | 3.500 | 3.143 | 4.000 | 3.429 | 3.833 |
| T5 | 0.210 | 2.000 | 3.167 | 4.571 | 4.667 | 3.143 | 3.333 | 3.429 | 4.000 | 3.286 | 3.833 |
| TE | 1 | 2.505 | 3.365 | 4.312 | 4.673 | 3.093 | 3.563 | 3.497 | 4.134 | 3.521 | 4.043 |
| OS | 2.186 | 2.331 | 4.258 | 4.197 | 3.137 | 3.242 | 3.531 | 3.612 | 3.637 | 3.720 | |
| Rank | 5 | 5 | 1 | 1 | 4 | 4 | 3 | 3 | 2 | 2 | |
Table A4.
Sample of the questionnaire with revised contextual factors.
Table A4.
Sample of the questionnaire with revised contextual factors.
| Main Category | Code | Contextual Factor | Statement | Agreement Level |
|---|---|---|---|---|
| Business value | B1 | Business objectives | This BIM application helps to realize project objectives such as time, cost, quality. | |
| B2 | Business issues | This BIM application serves to deal with business information management issues such as fragmented information. | ||
| B3 | Business sustainability | This BIM application helps to maintain the competitive advantage or improve the image of the user. | ||
| B4 | Regulatory eligibility | This BIM application has good regulatory eligibility and applies to practical situations. | ||
| Technical effectiveness | T1 | Willingness to adopt BIM | The key stakeholders have a strong will to adopt this BIM application | |
| T2 | Human-computer interoperability | This BIM application demonstrates a good effect of modelling and visualization and provides the user with a pleasant operation experience. | ||
| T3 | Visualization-based data quality and sources | The data quality and accessibility of this BIM application are good. | ||
| T4 | Data processing and system integration | This BIM application demonstrates good system interface and data interaction. | ||
| T5 | Application maturity | This BIM application has a good record of use in the past practice. |
References
- Ding, L.; Zhou, Y.; Akinci, B. Building Information Modeling (BIM) application framework: The process of expanding from 3D to computable nD. Autom. Constr. 2014, 46, 82–93. [Google Scholar] [CrossRef]
- Succar, B. Building information modelling framework: A research and delivery foundation for industry stakeholders. Autom. Constr. 2009, 18, 357–375. [Google Scholar] [CrossRef]
- Liao, L.; Teo, E.A.L.; Li, L.; Zhao, X.; Wu, G. Reducing non-value-adding BIM implementation activities for building projects in Singapore: Leading causes. J. Manag. Eng. 2021, 37, 05021003. [Google Scholar] [CrossRef]
- Ma, X.; Xiong, F.; Olawumi, T.O.; Dong, N.; Chan, A.P.C. Conceptual Framework and Roadmap Approach for Integrating BIM into Lifecycle Project Management. J. Manag. Eng. 2018, 34, 05018011. [Google Scholar] [CrossRef]
- Çıdık, M.S.; Boyd, D.; Thurairajah, N. Ordering in disguise: Digital integration in built-environment practices. Build. Res. Inf. 2017, 45, 665–680. [Google Scholar] [CrossRef]
- Davies, K.; McMeel, D.J.; Wilkinson, S. Making friends with Frankenstein: Hybrid practice in BIM. Eng. Constr. Archit. Manag. 2017, 24, 78–93. [Google Scholar] [CrossRef]
- Akal, A.Y.; Kineber, A.F.; Mohandes, S.R. A Phase-Based Roadmap for Proliferating BIM within the Construction Sector Using DEMATEL Technique: Perspectives from Egyptian Practitioners. Buildings 2022, 12, 1805. [Google Scholar] [CrossRef]
- Smits, W.; van Buiten, M.; Hartmann, T. Yield-to-BIM: Impacts of BIM maturity on project performance. Build. Res. Inf. 2017, 45, 336–346. [Google Scholar] [CrossRef]
- Rules, C.; Annex, A. National BIM Standard-United States® Version 3; National Institute of Building Sciences: Washington, DC, USA, 2015. [Google Scholar]
- Negash, S.; Gray, P. Business intelligence. In Handbook on Decision Support Systems 2; Springer: Berlin/Heidelberg, Germany, 2008; pp. 175–193. [Google Scholar]
- Niu, L.; Lu, J.; Zhang, G. Cognition-Driven Decision Support for Business Intelligence: Models, Techniques, Systems and Applications; Springer: Berlin/Heidelberg, Germany, 2009. [Google Scholar]
- Du, J.; Liu, R.; Issa, R.R. BIM cloud score: Benchmarking BIM performance. J. Constr. Eng. Manag. 2014, 140, 04014054. [Google Scholar] [CrossRef]
- Jin, R.; Hancock, C.; Tang, L.; Chen, C.; Wanatowski, D.; Yang, L. Empirical study of BIM implementation–based perceptions among Chinese practitioners. J. Manag. Eng. 2017, 33, 04017025. [Google Scholar] [CrossRef]
- Eleftheriadis, S.; Duffour, P.; Mumovic, D. Participatory decision-support model in the context of building structural design embedding BIM with QFD. Adv. Eng. Inform. 2018, 38, 695–711. [Google Scholar] [CrossRef]
- Marzouk, M.; Hanafy, M. Modelling maintainability of healthcare facilities services systems using BIM and business intelligence. J. Build. Eng. 2022, 46, 103820. [Google Scholar] [CrossRef]
- Turk, Ž. Ten questions concerning building information modelling. Build. Environ. 2016, 107, 274–284. [Google Scholar] [CrossRef]
- Miettinen, R.; Paavola, S. Beyond the BIM utopia: Approaches to the development and implementation of building information modeling. Autom. Constr. 2014, 43, 84–91. [Google Scholar] [CrossRef]
- Chen, Y.; Dib, H.; Cox, R.F. A measurement model of building information modelling maturity. Constr. Innov. 2014, 14, 186–209. [Google Scholar] [CrossRef]
- Olanrewaju, O.I.; Kineber, A.F.; Chileshe, N.; Edwards, D.J. Modelling the relationship between Building Information Modelling (BIM) implementation barriers, usage and awareness on building project lifecycle. Build. Environ. 2022, 207, 108556. [Google Scholar] [CrossRef]
- Sun, C.; Chen, H.; Long, R.; Liao, R. Research on BIM Application Two-Dimensional Maturity Model. Buildings 2022, 12, 1960. [Google Scholar] [CrossRef]
- Wu, L.; Lu, W.; Xue, F.; Li, X.; Zhao, R.; Tang, M. Linking permissioned blockchain to Internet of Things (IoT)-BIM platform for off-site production management in modular construction. Comput. Ind. 2022, 135, 103573. [Google Scholar] [CrossRef]
- Zhou, P.; El-Gohary, N. Semantic information alignment of BIMs to computer-interpretable regulations using ontologies and deep learning. Adv. Eng. Inform. 2021, 48, 101239. [Google Scholar] [CrossRef]
- Radenković, M.; Lukić, J.; Despotović-Zrakić, M.; Labus, A.; Bogdanović, Z. Harnessing business intelligence in smart grids: A case of the electricity market. Comput. Ind. 2018, 96, 40–53. [Google Scholar] [CrossRef]
- Bilal, M.; Oyedele, L.O.; Qadir, J.; Munir, K.; Ajayi, S.O.; Akinade, O.O.; Owolabi, H.A.; Alaka, H.A.; Pasha, M. Big Data in the construction industry: A review of present status, opportunities, and future trends. Adv. Eng. Inform. 2016, 30, 500–521. [Google Scholar] [CrossRef]
- Janssen, M.; Haiko, V.; Wahyudi, A. Factors influencing big data decision-making quality. J. Bus. Res. 2017, 70, 338–345. [Google Scholar] [CrossRef]
- Shehzad, H.M.F.; Ibrahim, R.B.; Yusof, A.F.; Khaidzir, K.A.M.; Iqbal, M.; Razzaq, S. The role of interoperability dimensions in building information modelling. Comput. Ind. 2021, 129, 103444. [Google Scholar] [CrossRef]
- Chen, G.; Hou, J.; Liu, C.; Hu, K.; Wang, J. Visualization Analysis of Cross Research between Big Data and Construction Industry Based on Knowledge Graph. Buildings 2022, 12, 1812. [Google Scholar] [CrossRef]
- Ahn, Y.H.; Kwak, Y.H.; Suk, S.J. Contractors’ Transformation Strategies for Adopting Building Information Modeling. J. Manag. Eng. 2016, 32, 05015005. [Google Scholar] [CrossRef]
- Wang, X.; Chong, H.Y. Setting new trends of integrated Building Information Modelling (BIM) for construction industry. Constr. Innov. 2015, 15, 2–6. [Google Scholar] [CrossRef]
- Çelik, U. 4D and 5D BIM: A System for Automation of Planning and Integrated Cost Management. In Communications in Computer and Information Science; Salih Ofluoglu, O.O.O., Isikdag, U., Eds.; Spinger: Istanbul, Turkey, 2019; pp. 57–69. [Google Scholar]
- Karim Ibrahim, H.A.; Vidalakis, C.; Wood, G. BIM Big Data system architecture for asset management: A conceptual framework. In Proceedings of the Lean & Computing in Construction Congress (CIB, W78), Heraklion, Greece, 4–7 July 2017. [Google Scholar]
- Gledson, B.J. Hybrid project delivery processes observed in constructor BIM innovation adoption. Constr. Innov. 2016, 16, 229–246. [Google Scholar] [CrossRef]
- Alvanchi, A.; TohidiFar, A.; Mousavi, M.; Azad, R.; Rokooei, S. A critical study of the existing issues in manufacturing maintenance systems: Can BIM fill the gap? Comput. Ind. 2021, 131, 103484. [Google Scholar] [CrossRef]
- Zhang, J.; Luo, H.; Xu, J. Towards fully BIM-enabled building automation and robotics: A perspective of lifecycle information flow. Comput. Ind. 2022, 135, 103570. [Google Scholar] [CrossRef]
- Bai, X.; White, D.; Sundaram, D. Context adaptive visualization for effective business intelligence. In Proceedings of the IEEE International Conference on Communication Technology, Sydney, Australia, 10–14 June 2014. [Google Scholar]
- Aigner, W. Current Work Practice and Users’ Perspectives on Visualization and Interactivity in Business Intelligence; IEEE Computer Society: Washington, DC, USA, 2013. [Google Scholar]
- Lavalle, A.; Mate, A.; Trujillo, J.; Rizzi, S. Visualization Requirements for Business Intelligence Analytics: A Goal-Based, Iterative Framework. In Proceedings of the 2019 IEEE 27th International Requirements Engineering Conference (RE), Jeju Island, Republic of Korea, 23–27 September 2019. [Google Scholar]
- Petrini, M.; Pozzebon, M. Managing sustainability with the support of business intelligence: Integrating socio-environmental indicators and organisational context. J. Strateg. Inf. Syst. 2009, 18, 178–191. [Google Scholar] [CrossRef]
- Ahmad, S.; Miskon, S.; Alabdan, R.; Tlili, I. Towards sustainable textile and apparel industry: Exploring the role of business intelligence systems in the era of industry 4.0. Sustainability 2020, 12, 2632. [Google Scholar] [CrossRef]
- Aruldoss, M.; Travis, M.L.; Venkatesan, V.P. A survey on recent research in business intelligence. J. Enterp. Inf. Manag. 2014, 27, 831–866. [Google Scholar] [CrossRef]
- Jun, S. Business Intelligence Visualization Technology and Its Application in Enterprise Management. In Proceedings of the 2020 2nd International Conference on Big Data Engineering and Technology, Shanghai, China, 29–31 May 2020. [Google Scholar]
- Hashmi, M.A.; Mo, J.P.; Beckett, R.C. Transdisciplinary systems approach to realization of digital transformation. Adv. Eng. Inform. 2021, 49, 101316. [Google Scholar] [CrossRef]
- Landeta, J. Current validity of the Delphi method in social sciences. Technol. Forecast. Soc. Chang. 2006, 73, 467–482. [Google Scholar] [CrossRef]
- Ameyaw, E.E.; Hu, Y.; Shan, M.; Chan, A.P.; Le, Y. Application of Delphi method in construction engineering and management research: A quantitative perspective. J. Civ. Eng. Manag. 2016, 22, 991–1000. [Google Scholar] [CrossRef]
- Bhandari, S.; Hallowell, M.R. Identifying and Controlling Biases in Expert-Opinion Research: Guidelines for Variations of Delphi, Nominal Group Technique, and Focus Groups. J. Manag. Eng. 2021, 37, 04021015. [Google Scholar] [CrossRef]
- Mayo, G.; Issa, R. Nongeometric Building Information Needs Assessment for Facilities Management. J. Manag. Eng. 2016, 32, 04015054.1–04015054.12. [Google Scholar] [CrossRef]
- Olawumi, T.O.; Chan, D.W.; Wong, J.K.; Chan, A.P. Barriers to the integration of BIM and sustainability practices in construction projects: A Delphi survey of international experts. J. Build. Eng. 2018, 20, 60–71. [Google Scholar] [CrossRef]
- Evans, M.; Farrell, P. Barriers to integrating building information modelling (BIM) and lean construction practices on construction mega-projects: A Delphi study. Benchmarking Int. J. 2021, 28, 652–669. [Google Scholar] [CrossRef]
- Sossa, J.W.Z.; Halal, W.; Zarta, R.H. Delphi method: Analysis of rounds, stakeholder and statistical indicators. Foresight 2019, 21, 525–544. [Google Scholar] [CrossRef]
- Zahoor, H.; Chan, A.P.; Gao, R.; Utama, W.P. The factors contributing to construction accidents in Pakistan: Their prioritization using the Delphi technique. Eng. Constr. Archit. Manag. 2017, 24, 463–485. [Google Scholar] [CrossRef]
- Ludwig, B. Predicting the future: Have you considered using the Delphi methodology? J. Ext. 1997, 35. [Google Scholar]
- Gordon, T.; Pease, A. RT Delphi: An efficient,“round-less” almost real time Delphi method. Technol. Forecast. Soc. Chang. 2006, 73, 321–333. [Google Scholar] [CrossRef]
- Brown, R.D.; Hauenstein, N.M. Interrater agreement reconsidered: An alternative to the rwg indices. Organ. Res. Methods 2005, 8, 165–184. [Google Scholar] [CrossRef]
- Bardecki, M.J. Participants’ response to the Delphi method: An attitudinal perspective. Technol. Forecast. Soc. Chang. 1984, 25, 281–292. [Google Scholar] [CrossRef]
- Blind, K.; Cuhls, K.; Grupp, H. Personal attitudes in the assessment of the future of science and technology: A factor analysis approach. Technol. Forecast. Soc. Chang. 2001, 68, 131–149. [Google Scholar] [CrossRef]
- Yeung, J.F.; Chan, A.P.; Chan, D.W.; Li, L.K. Development of a partnering performance index (PPI) for construction projects in Hong Kong: A Delphi study. Constr. Manag. Econ. 2007, 25, 1219–1237. [Google Scholar] [CrossRef]
- Xia, B.; Chan, A.P.; Yeung, J.F. Developing a fuzzy multicriteria decision-making model for selecting design-build operational variations. J. Constr. Eng. Manag. 2011, 137, 1176–1184. [Google Scholar] [CrossRef]
- Argyrous, G. Statistics for Research: With a Guide to SPSS; Sage Publications: Thousand Oaks, CA, USA, 2011. [Google Scholar]
- Chang, T.; Deng, X.; Hwang, B.-G.; Zhao, X. Improving quantitative assessment of political risk in international construction projects: The case of Chinese construction companies. J. Constr. Eng. Manag. 2019, 145, 04019083. [Google Scholar] [CrossRef]
- Ma, Y.; Chen, Y.; Gu, B. An attributes-based allocation approach of software trustworthy degrees. In Proceedings of the 2015 IEEE International Conference on Software Quality, Reliability and Security—Companion, Vancouver, BC, Canada, 3–5 August 2015; IEEE: Piscataway, NJ, USA, 2015. [Google Scholar]
- Zhao, X.; Wu, P.; Wang, X. Risk paths in BIM adoption: Empirical study of China. Eng. Constr. Archit. Manag. 2018, 25, 1170–1187. [Google Scholar] [CrossRef]
- Field, A. Discovering Statistics Using IBM SPSS Statistics; Sage: Thousand Oaks, CA, USA, 2013. [Google Scholar]
- Salkind, N.J. Mann-Whitney U Test. In Encyclopedia of Research Design; Sage: Thousand Oaks, CA, USA, 2010; Volume 3, pp. 2–6. [Google Scholar] [CrossRef]
- Lacruz, A.; Cunha, E. Project management office in non-governmental organizations: An ex post facto study. Rev. Gestão 2018, 25, 212–227. [Google Scholar] [CrossRef]
- Kim, H.-S.; Kim, S.-K.; Kang, L.-S. BIM performance assessment system using a K-means clustering algorithm. J. Asian Archit. Build. Eng. 2021, 20, 78–87. [Google Scholar] [CrossRef]
- Jang, S.; Jeong, Y.; Lee, G.; Kang, Y. Enhancing Subcontractors’ Participation in BIM-Based Design Coordination under a DBB Contract. J. Manag. Eng. 2019, 35, 04019022. [Google Scholar] [CrossRef]
- Teng, Y.; Li, X.; Wu, P.; Wang, X. Using cooperative game theory to determine profit distribution in IPD projects. Int. J. Constr. Manag. 2019, 19, 32–45. [Google Scholar] [CrossRef]
- Yuan, H.; Yang, Y. BIM adoption under government subsidy: Technology diffusion perspective. J. Constr. Eng. Manag. 2020, 146, 04019089. [Google Scholar] [CrossRef]
- Darko, A.; Chan, A.P.; Adabre, M.A.; Edwards, D.J.; Hosseini, M.R.; Ameyaw, E.E. Artificial intelligence in the AEC industry: Scientometric analysis and visualization of research activities. Autom. Constr. 2020, 112, 103081. [Google Scholar] [CrossRef]
- Wang, H.; Meng, X. BIM-Supported Knowledge Management: Potentials and Expectations. J. Manag. Eng. 2021, 37, 04021032. [Google Scholar] [CrossRef]
- Sestino, A.; De Mauro, A. Leveraging artificial intelligence in business: Implications, applications and methods. Technol. Anal. Strateg. Manag. 2022, 34, 16–29. [Google Scholar] [CrossRef]
- Nilsson, N.J. The Quest for Artificial Intelligence; Cambridge University Press: Cambridge, UK, 2009. [Google Scholar]
- Ma, X.; Chan, A.P.; Wu, H.; Xiong, F.; Dong, N. Achieving leanness with BIM-based integrated data management in a built environment project. Constr. Innov. 2018, 18, 469–487. [Google Scholar] [CrossRef]
- Atta, I.; Bakhoum, E.S.; Marzouk, M.M. Digitizing material passport for sustainable construction projects using BIM. J. Build. Eng. 2021, 43, 103233. [Google Scholar] [CrossRef]


Disclaimer/Publisher’s Note: The statements, opinions and data contained in all publications are solely those of the individual author(s) and contributor(s) and not of MDPI and/or the editor(s). MDPI and/or the editor(s) disclaim responsibility for any injury to people or property resulting from any ideas, methods, instructions or products referred to in the content. |
© 2022 by the authors. Licensee MDPI, Basel, Switzerland. This article is an open access article distributed under the terms and conditions of the Creative Commons Attribution (CC BY) license (https://creativecommons.org/licenses/by/4.0/).