Article

Axial Compressive Performance of Steel-Reinforced UHPC-Filled Square Stainless-Steel Tube

1
School of Urban Construction, Yangtze University, Jingzhou 434023, China
2
Department of Materials, The University of Manchester, Manchester M13 9PL, UK
*
Author to whom correspondence should be addressed.
Buildings 2023, 13(1), 56; https://doi.org/10.3390/buildings13010056
Submission received: 5 November 2022 / Revised: 5 December 2022 / Accepted: 13 December 2022 / Published: 26 December 2022
(This article belongs to the Special Issue Recent Research Progress of UHPC in Structural Engineering)

Abstract

:
To study the axial compression performance of a steel-reinforced ultra-high-performance concrete-filled square stainless-steel tube (SR-UHPCFSSST), eight specimens were designed with different length-to-diameter ratios and skeleton contents, and axial compression tests and numerical simulations were performed. Damage pattern, ultimate load capacity, and load–displacement curve data of the specimens were obtained. Finite element analysis was performed using ABAQUS software for parameter expansion. The damage mechanisms of the specimens and the influences of various parameters, such as the length-to-diameter ratio, skeleton content, diameter-to-thickness ratio, and concrete strength, on the damage processes and ultimate bearing capacities of the specimens were studied. The results showed that among the components of the test piece under the same axial load, the stress of the built-in steel skeleton was the first to approach its yield stress, and the steel pipe was the first to produce a bulging deformation. The ultimate bearing capacities of the specimens increased with the increase in the skeleton content and concrete strength and decreased with the increase in the length-to-diameter and diameter-to-thickness ratios. Based on the test and numerical simulation results, this paper puts forward a calculation formula of the axial compression bearing capacity of a square-stainless-steel-tube ultra-high-performance-concrete middle-length column with a steel skeleton, which provides a reference for engineering design and for compiling relevant codes.

1. Introduction

Concrete-filled steel-tube (CFST) structures have high stiffnesses and load-bearing capacities [1], and they are widely used in high-rise building structures. Steel-pipe concrete structures with built-in steel skeletons allow the concrete and steel skeleton to achieve a synergistic working mechanism while taking advantage of their respective strengths [2]. This further improves the overall mechanical properties of the combined structural column and helps to reduce the cross-sectional area of the steel pipe concrete column. The interactions between the built-in steel skeleton, concrete, and outer steel pipes improve the compressive strength and ductility of the core concrete, and the deformation of the steel skeleton is effectively controlled to achieve complementary advantages [3,4,5]. To date, scholars have studied the steel pipe concrete column with built-in common steel. Kato [6], Du [7], and Wang [8] conducted experiments and numerical simulations on the mechanical properties of steel and steel-pipe concrete composite columns with different cross-sectional forms. The damage modes, load–deformation relationships, and strength indices of the column were studied. The presence of a steel skeleton improved the ductility of steel pipe concrete. Khatir et al. [9,10] investigated crack identification in steel tubes by combining non-destructive testing with finite element analysis. Le et al. [11] collected a large quantity of data and used neural networks to establish a practical axial load prediction equation for rectangular steel-pipe concrete columns. Li et al. [12] investigated the deflection performance of steel-pipe concrete columns with built-in steel skeletons and found that these structures had better ductility. With the rapid development of industry, there is an increasing demand for high performance of steel-pipe and concrete structures in high-rise and super-high-rise buildings. For example, the outer steel pipe should have good corrosion resistance, and the cross section of the steel-pipe concrete column should not be too large.
For this reason, scholars have proposed to replace ordinary steel-pipe concrete columns with stainless-steel-pipe concrete columns and steel-pipe ultra-high-performance concrete columns, respectively, to improve the overall mechanical properties [13,14,15]. Compared to traditional concrete, ultra-high-performance concrete with steel fibers has a higher Young’s modulus and superior compressive strength; thus, a more elongated structure can be designed [16]. Ultra-high-performance concrete inhibits crack expansion with the action of internal steel fibers. Moreover, ultra-high-performance concrete can greatly reduce the self-weight of building structures [17]. For more than a decade, scholars have conducted extensive research on ultra-high-performance concrete. Abbas et al. [18] investigated the compressive stress–strain relationship for concrete containing steel and polyvinyl alcohol (PVA) fibers and established the corresponding stress–strain model. Khan et al. [19,20] tested the flexural properties of ultra-high-performance concrete beams and discovered that fiber and post-tensioned concrete beams have better mechanical properties.
Stainless-steel construction has many advantages over carbon-steel construction. The use of stainless steel instead of carbon steel has not only improved the surface finishes and strengths of steel-pipe concrete structures [21,22] but also the durability, corrosion resistance, and oxidation resistance of the structures [23,24,25]. However, to further reduce the weight of the structure, the wall thicknesses of stainless-steel tubes should not be too large. To ensure the steel-pipe concrete structure can not only meet the load-bearing capacity requirements but also improve the ductility of the structure, a thin-walled stainless-steel-tube UHPC steel-skeleton combination column was proposed in this study to design test specimens of the square section columns commonly used in engineering [26]. The influences of the steel skeleton diameter-to-thickness ratio, slenderness ratio, and section area on the composite columns were considered. Furthermore, the ABAQUS finite element software was used for numerical simulation analysis to consider more influencing factors. This work provides a reference for the calculation of the ultimate load capacities of such columns.

2. Experimental Program

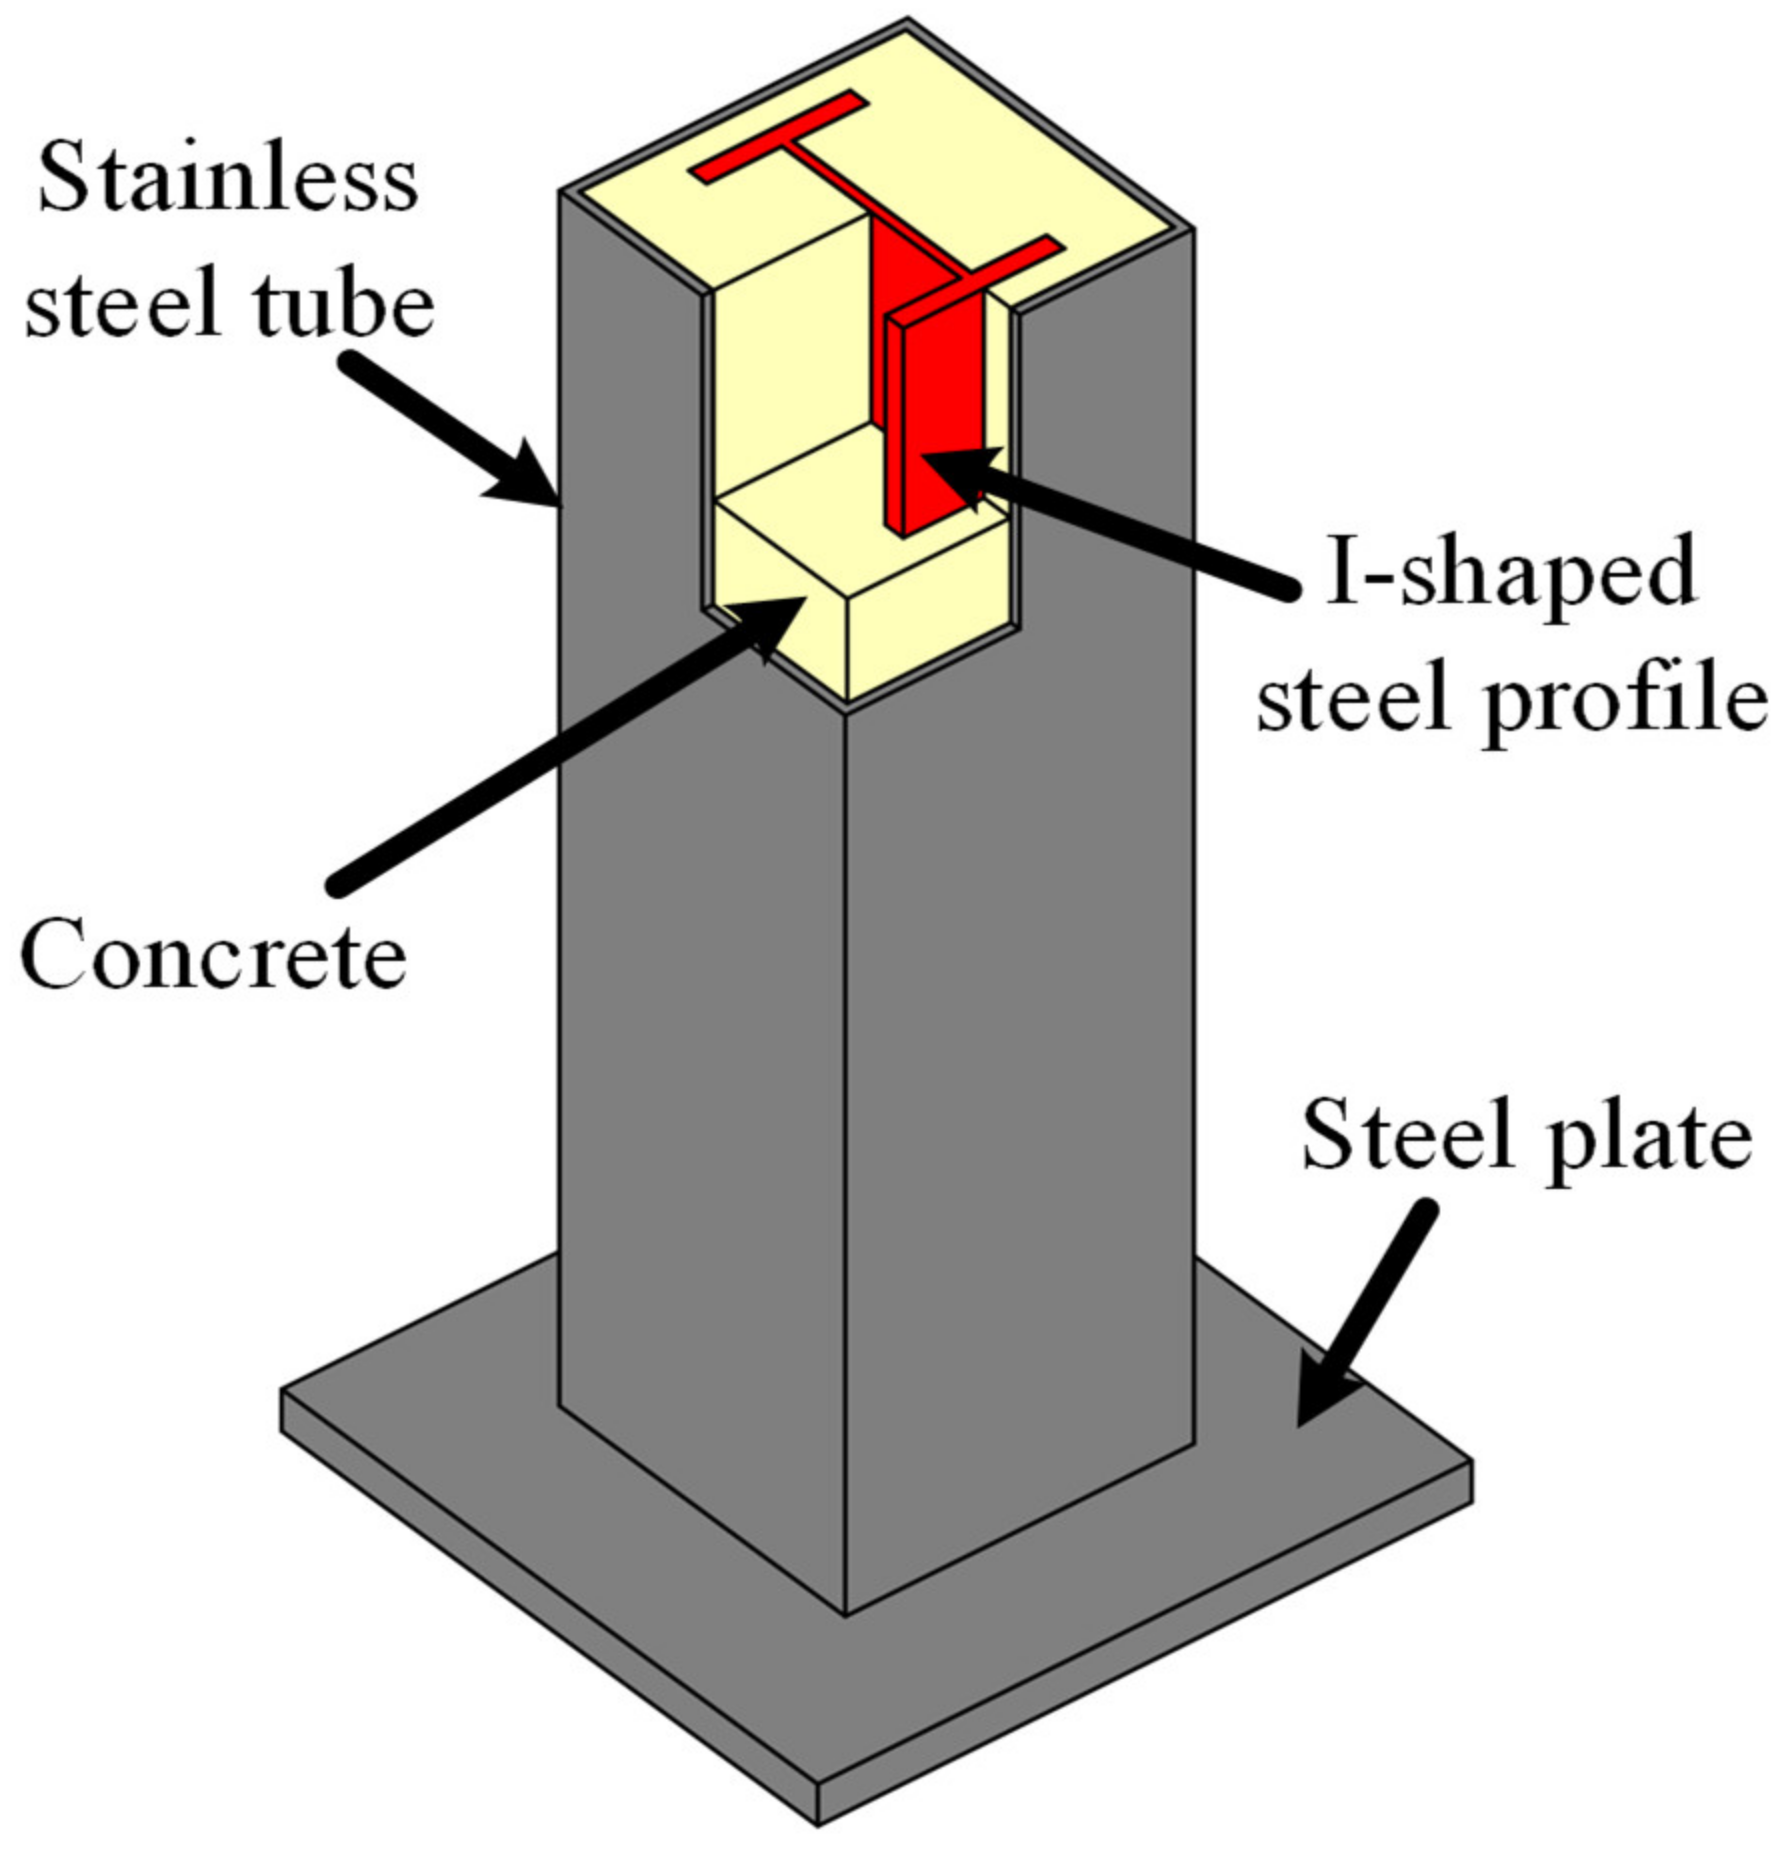
2.1. Specimen Design

Experiments with the skeleton content and stainless-steel-tube length-to-diameter ratio as the parameters were conducted. Eight square-stainless-steel-tube ultra-high-performance-concrete columns were designed for axial compression tests, with five SR-UHPCFSSST specimens and three ultra-high-performance concrete-filled square stainless-steel tubes (UHPCFSSSTs). The stainless-steel tube was made of 304 grade austenitic stainless steel, with a 150 mm tube-edge length and a 2.5 mm thickness. The inner steel skeleton was made of I-steel with strength grade Q235. The specific parameters of the components are shown in Table 1. The I-beam and the geometric center of the base plate were aligned and welded when the members were made to ensure that the built-in steel skeleton and the base plate were combined as a whole. Concrete was poured in layers, and after 28 d of maintenance, the upper end of the member was smoothed, and a cover was welded on to ensure that the steel skeleton, steel pipe, and concrete could be evenly stressed at the same time. Figure 1 shows the three-dimensional schematic diagram of the components.

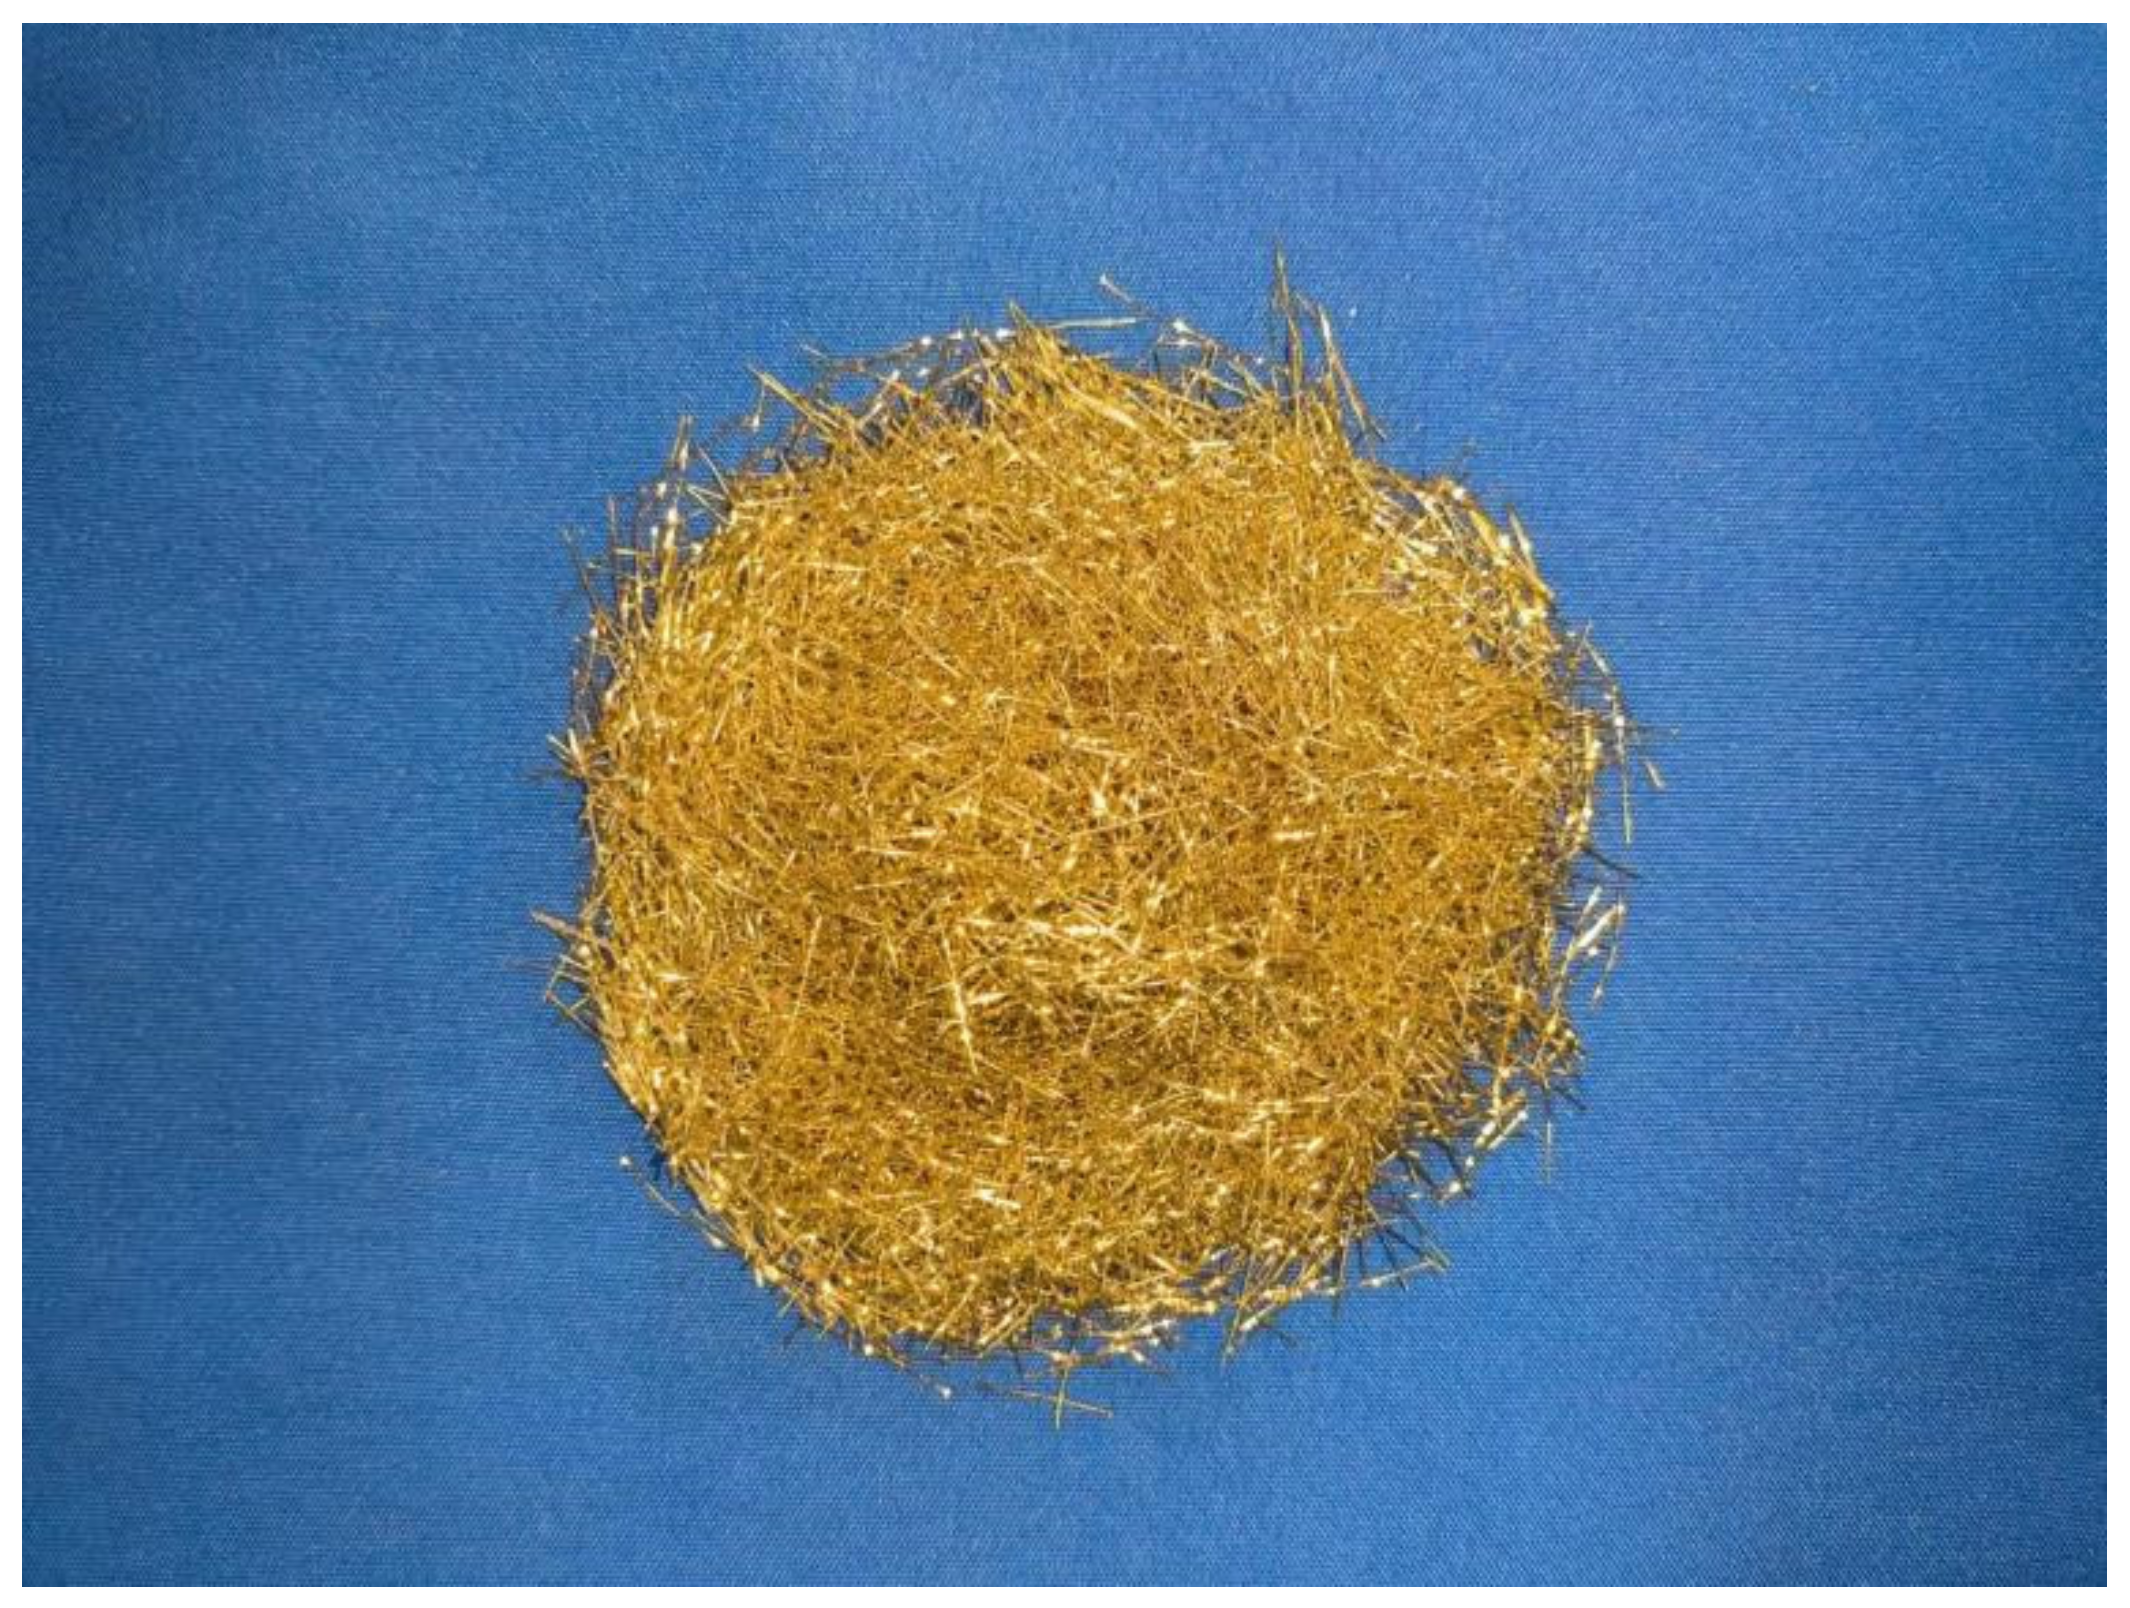
2.2. Material Properties

Standard tensile tests were conducted on the steel, and the mechanical property indices of the steel are shown in Table 2. In the table, E is the elastic modulus, σ0.2 is the yield strength, σu is the ultimate strength, and u is the Poisson’s ratio. The ductility of the UHPC was improved by incorporating steel fibers. A steel fiber sample is shown in Figure 2, and the physical properties are shown in Table 3. The concrete design ratio and physical and chemical properties of various materials are shown in Table 4, Table 5 and Table 6. Concrete cube samples with dimensions of 100 × 100 × 100 mm were prepared during pouring, and the average compressive strength of the cube was fcu = 121 MPa.

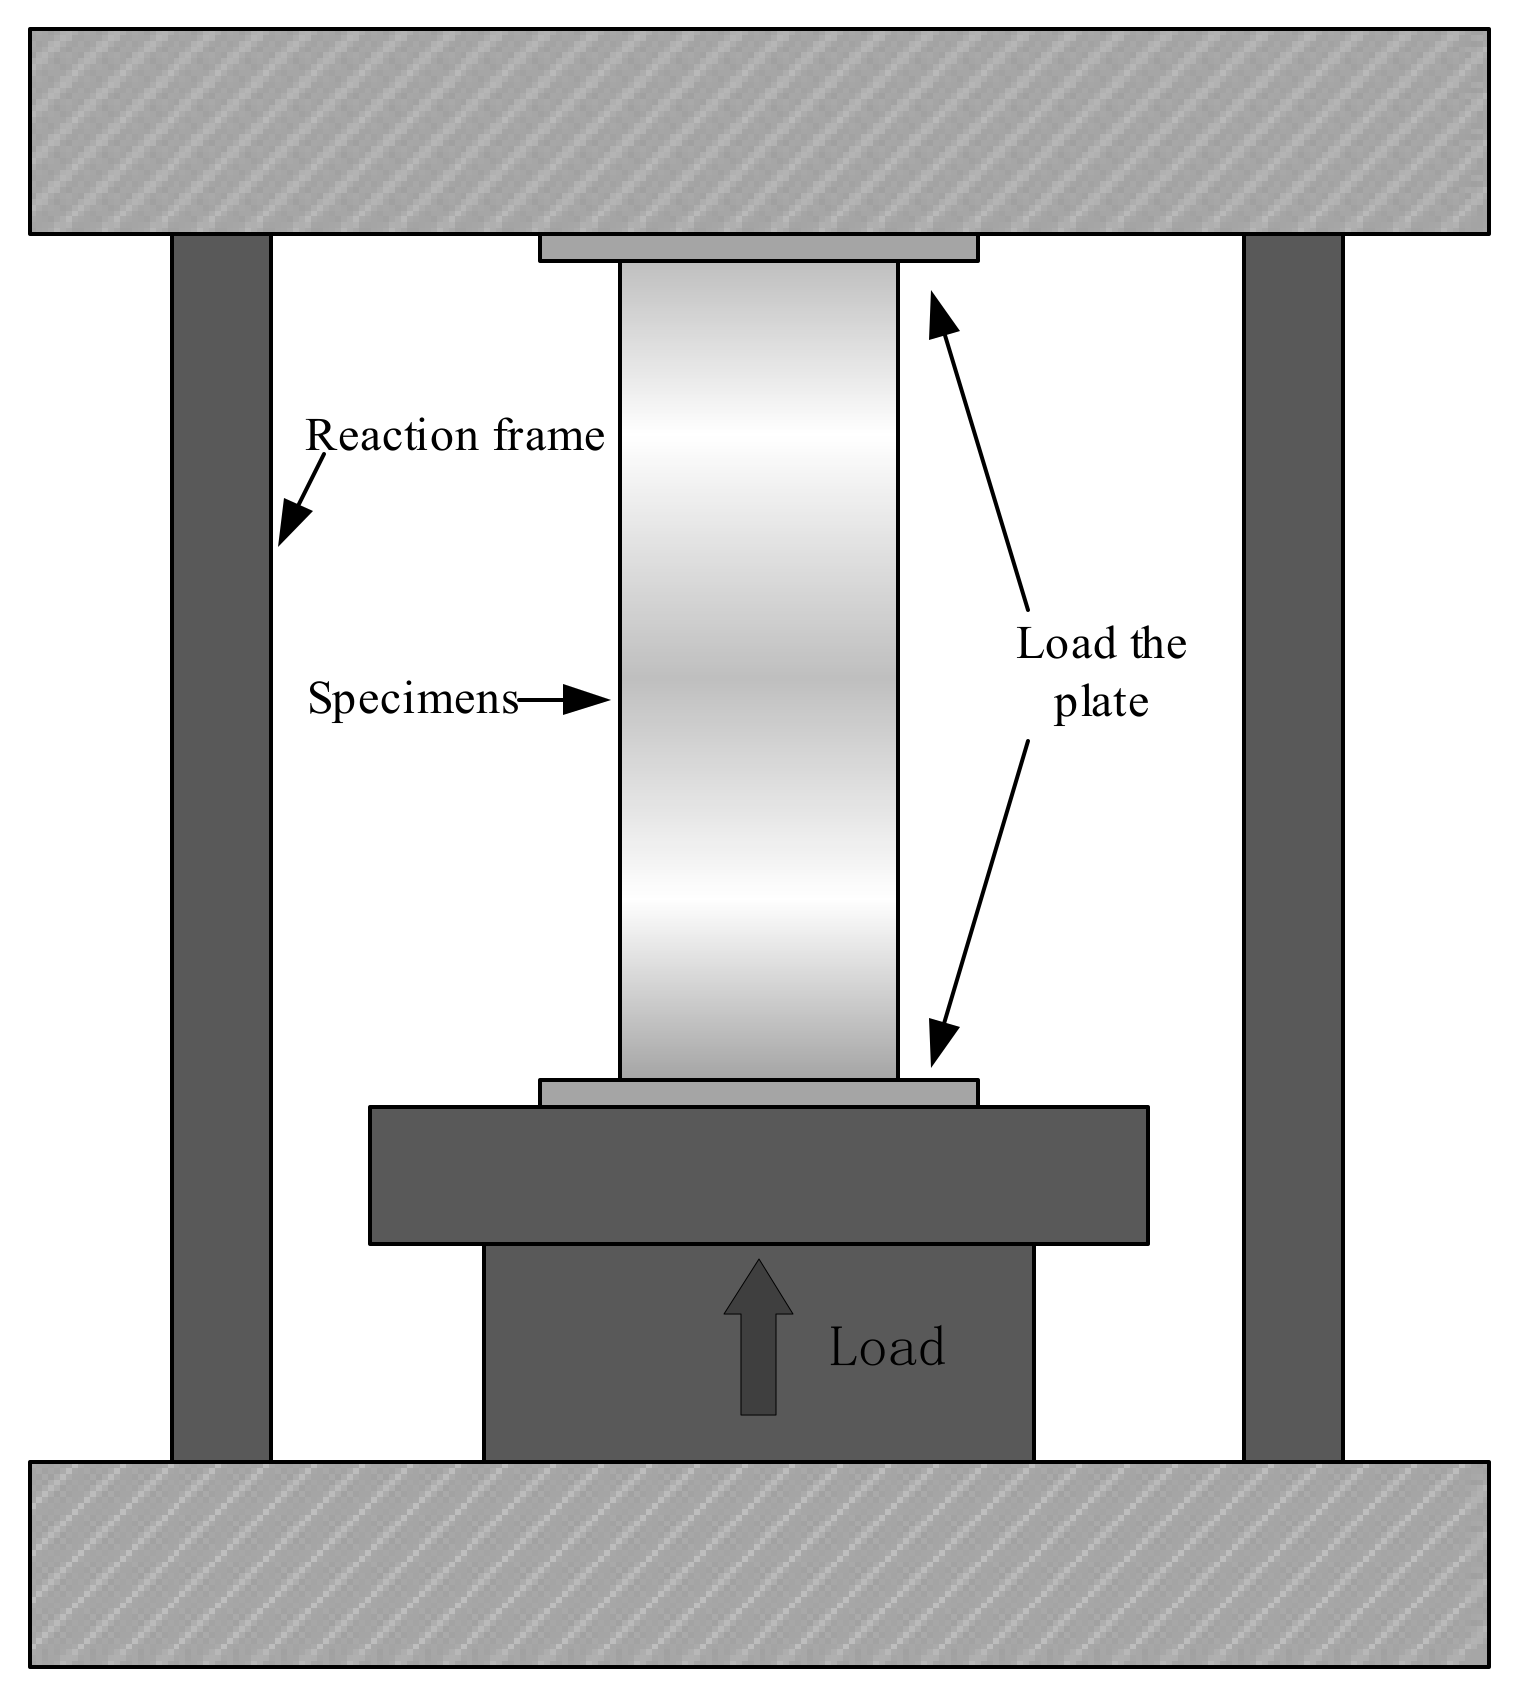
2.3. Experimental Setup and Loading System

To ensure the normal operation of the loading system and each detection point and reduce the test error, 10% of the expected ultimate load was preloaded before loading. The formal loading was graded by displacement loading with a loading rate of 0.5 mm/min. The axial load and displacement of the component were measured by the acquisition system of the hydraulic press. When the deformation of the component was too large and the load dropped to 70% of the peak load, the loading was stopped. The test loading device is shown in Figure 3.

3. Numerical Modeling

3.1. Constitutive Relation

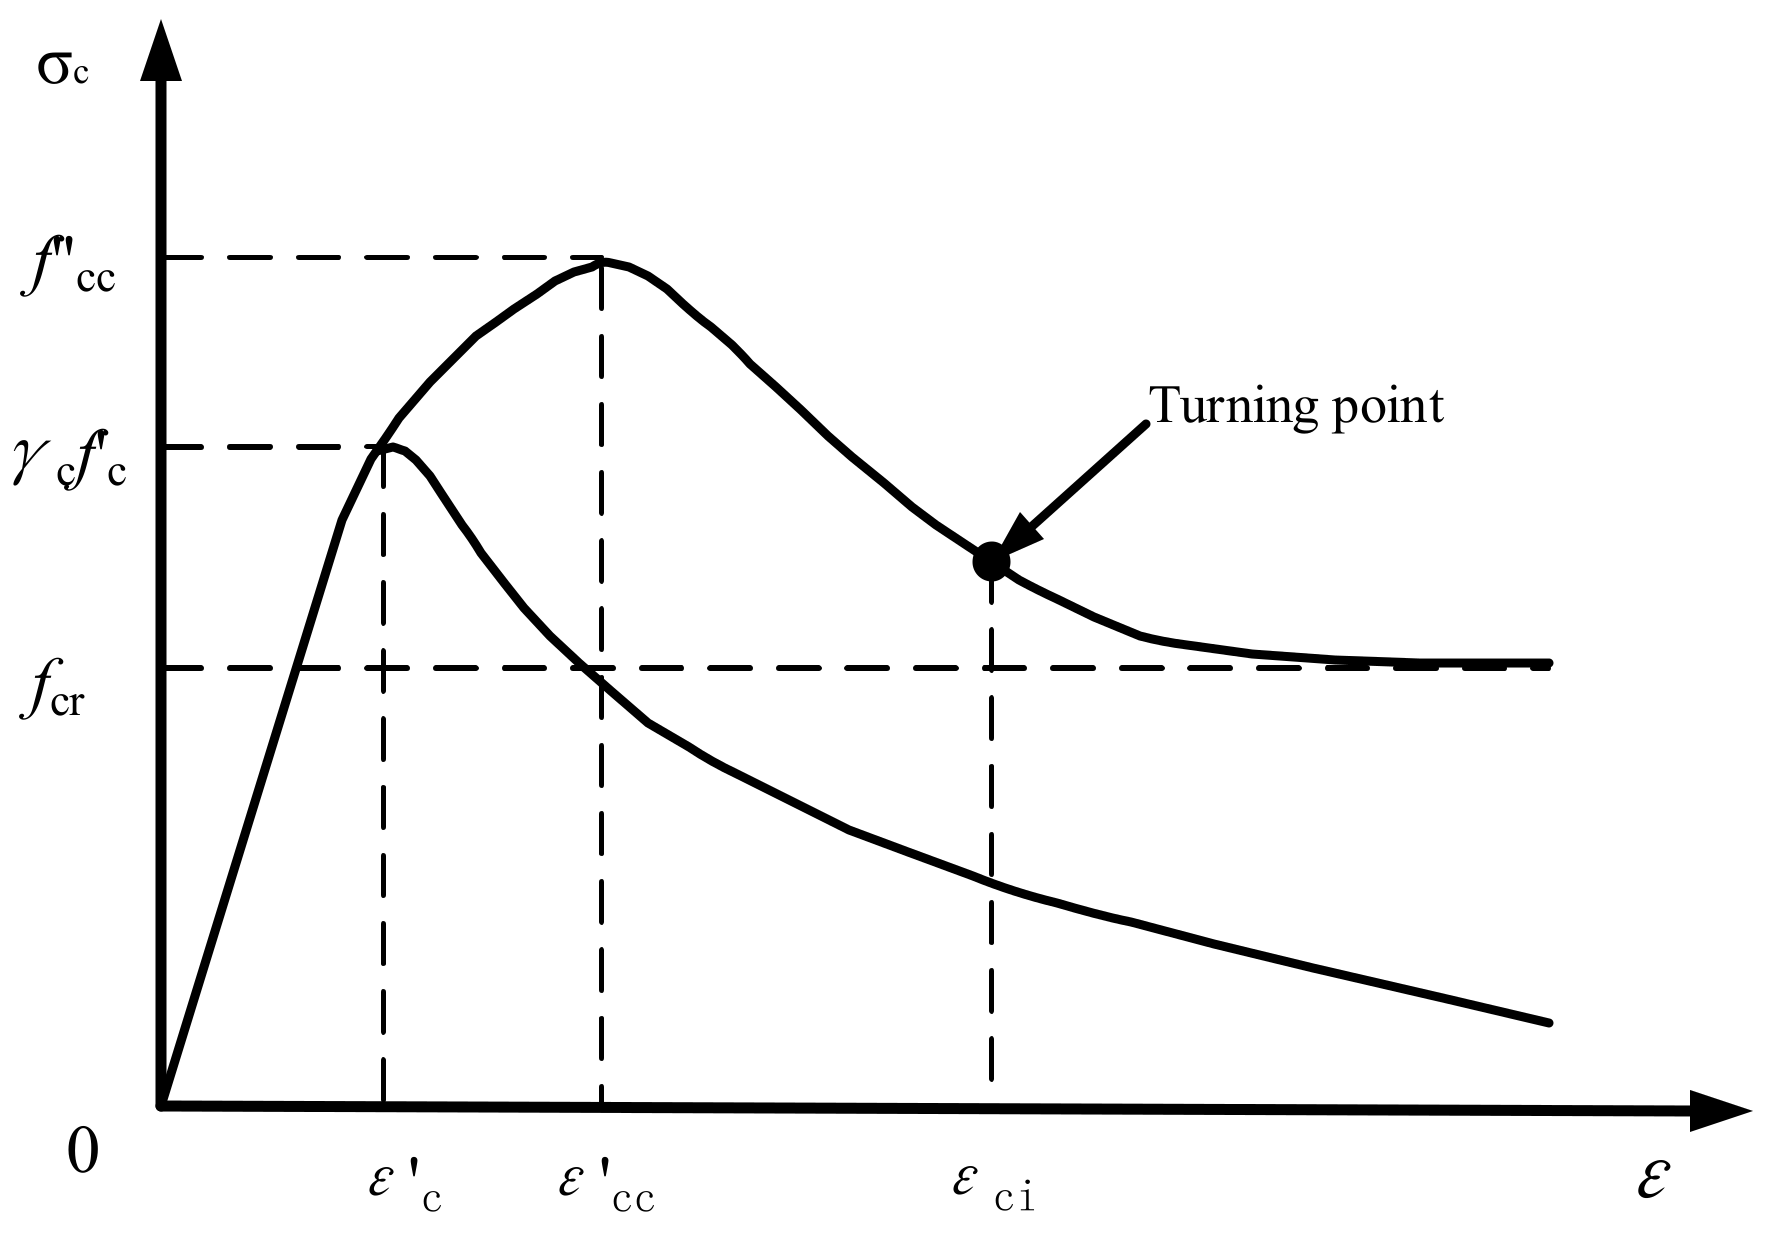
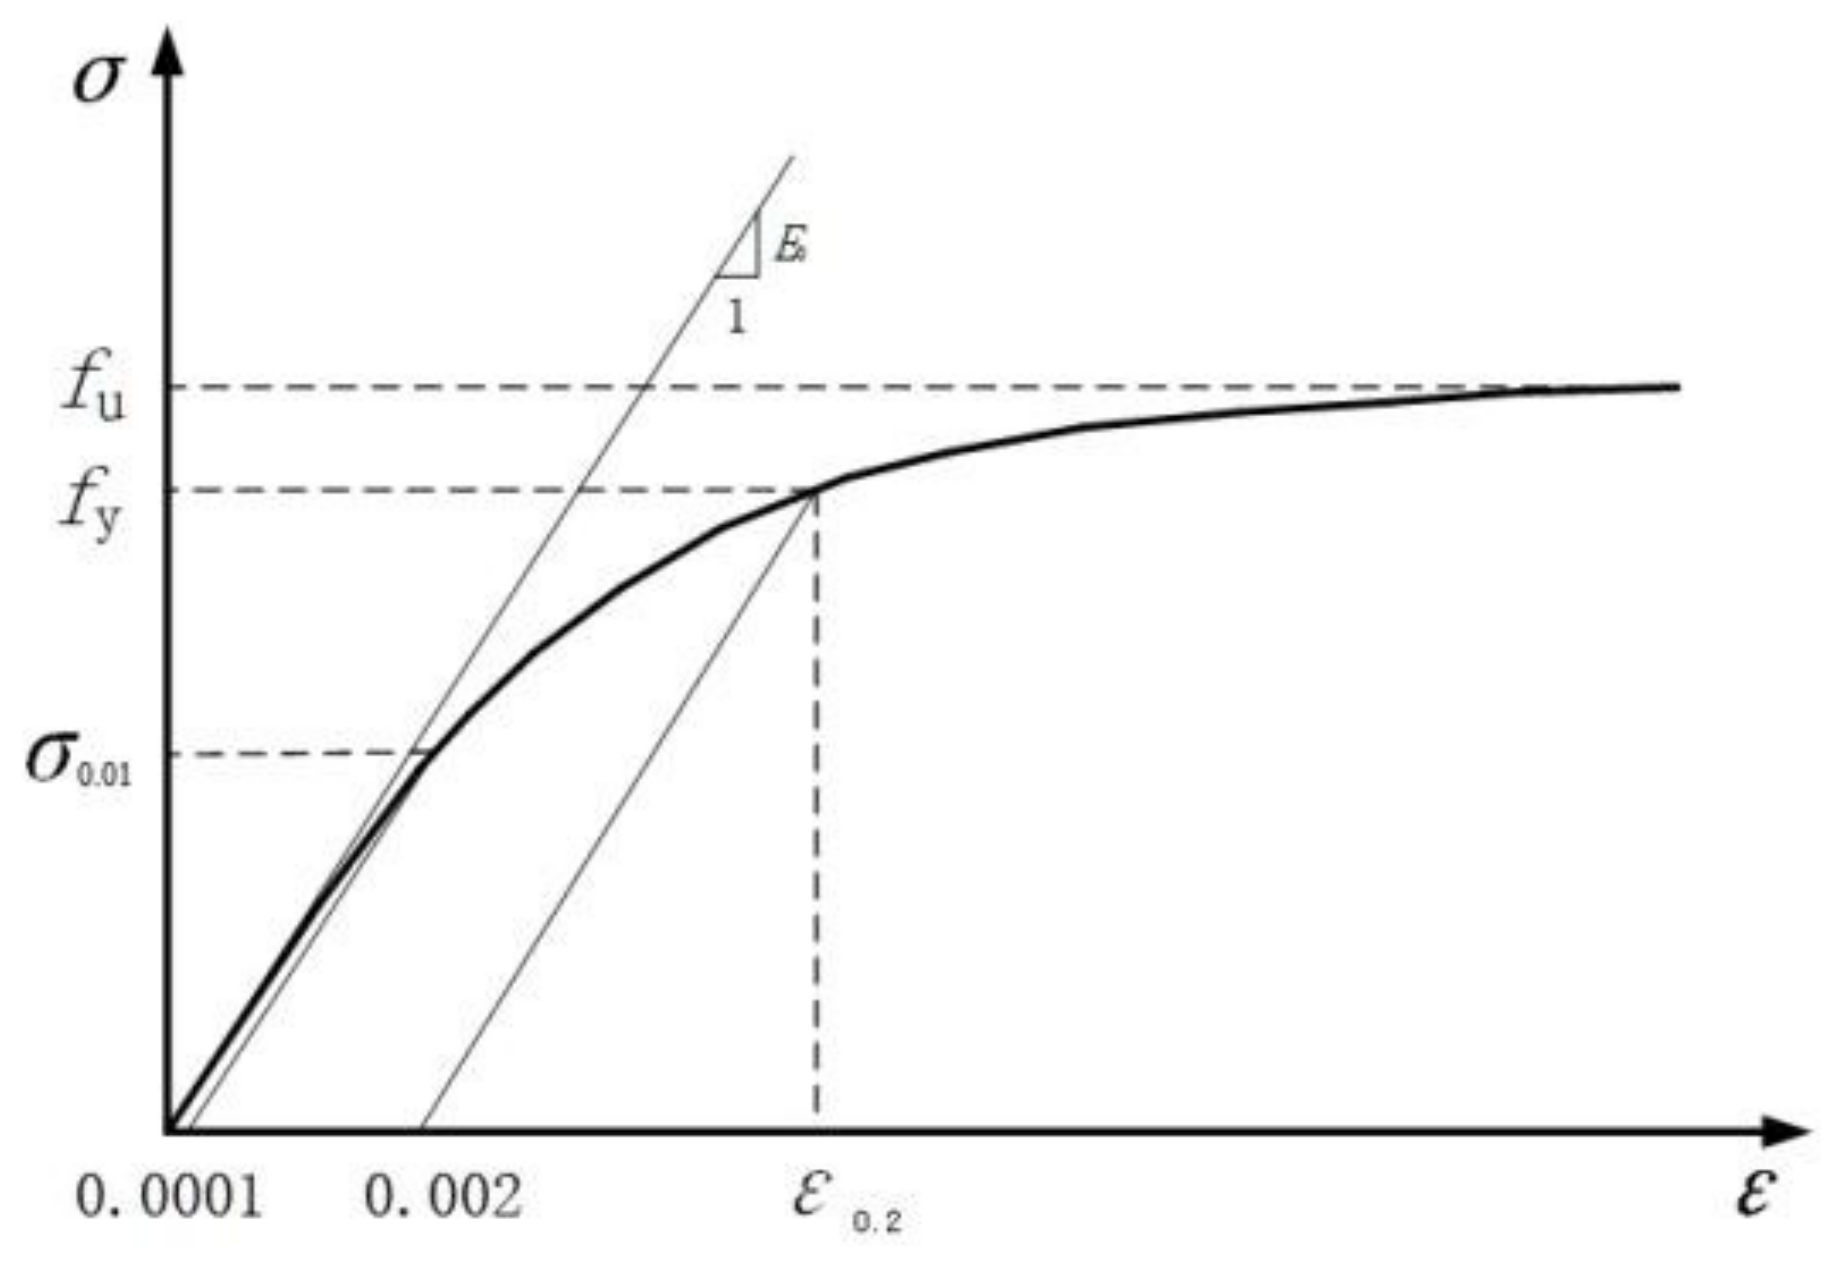
3.1.1. Concrete Material

The uniaxial compressive strength of concrete with lateral constraints is higher than that without constraints. To study the load-bearing capacity of the ultra-high-performance concrete in the core area with an axial pressure inside the steel pipe, finite element simulations were conducted. The stress–strain curves for both phases of the confined and unconfined concrete are shown in Figure 4 [27]. The concrete stress–strain relationship curve followed the model of confined concrete proposed by Mander [28] and Ozbakkaloglu [29] with the following expressions. In the ascending section:
σ c = f c c ε c / ε c c λ ε c / ε c c λ + λ 1 ,
λ = E c ε c c E c ε c c f c c ,
where fcc and εcc are the peak stresses and strains of the concrete, respectively, σc and εc are axial stress and strain, respectively, and Ec is the elastic modulus of concrete (according to the research of Graybeal et al. [30], E c = 3840 f c ), fc is the compressive strength of concrete in the square steel tube, and λ is the concrete brittleness constant. In the descending section:
σ c = f c c f c c f c r 1 + ε c ε c c ε c i ε c c 2 ,
f c r f c c = 1.2420 0.0029 B t 0.0044 γ c f c 0 f c r f c c 1.0 ,
ε c i = 2.8 ε c c γ c f c 0.12 f c r f c c + 10 ε c c γ c f c 0.47 1 f c r f c c ,
where fcr is the residual strength of the core concrete, εci is the strain value corresponding to the reverse bending point of the curve in the descending section, and γc is the size reduction factor of the core concrete. Liang [31] provided the following formulas based on tests of CFSTs:
γ c = 1.85 B 0.135 0.85 γ c 1.0 ,
According to Hu et al. [32], fcc and εcc are calculated as follows:
f c c = f c + k 1 f l ,
ε c c = ε 1 + k 2 f l f c ,
f c = k 3 f c c ,
f l f y = 0.055048 0.001885 B / t 17 B / t 29.2 ,
f l f y = 0 29.2 B / t 150 ,
where B and t are the side length and wall thickness of the square steel pipe, respectively; k1 and k2 are constants, which were set to 4.1 and 20.5, respectively, based on the literature [31]; k3 is the material degradation coefficient; and fl and fy are the confining pressure of the core concrete and the yield strength of the steel, respectively.

3.1.2. Stainless-Steel Material

Figure 5 shows the stress–strain curve of the stainless steel. Stainless steel follows a two-stage modified stress–strain relationship model proposed in Eurocode 3 part 1–4 [33]:
ε = σ E + 0.002 σ f y n σ f y 0.002 + f y E + σ f y E y + ε u σ f y f u f y m f y < σ < f u ,
where fy and fu are the yield strength and peak strength of stainless steel, respectively; E and Ey are the elastic modulus of stainless steel and the tangent modulus at the nominal yield strength, respectively; Ey = E/[1 + 0.002n(E/fy)]; n = ln(20)/ln(fy/Rp0.01); Rp0.01 is the stress value when the residual strain is 0.01%; and the coefficient m = 1 + 3.5fy/fu.

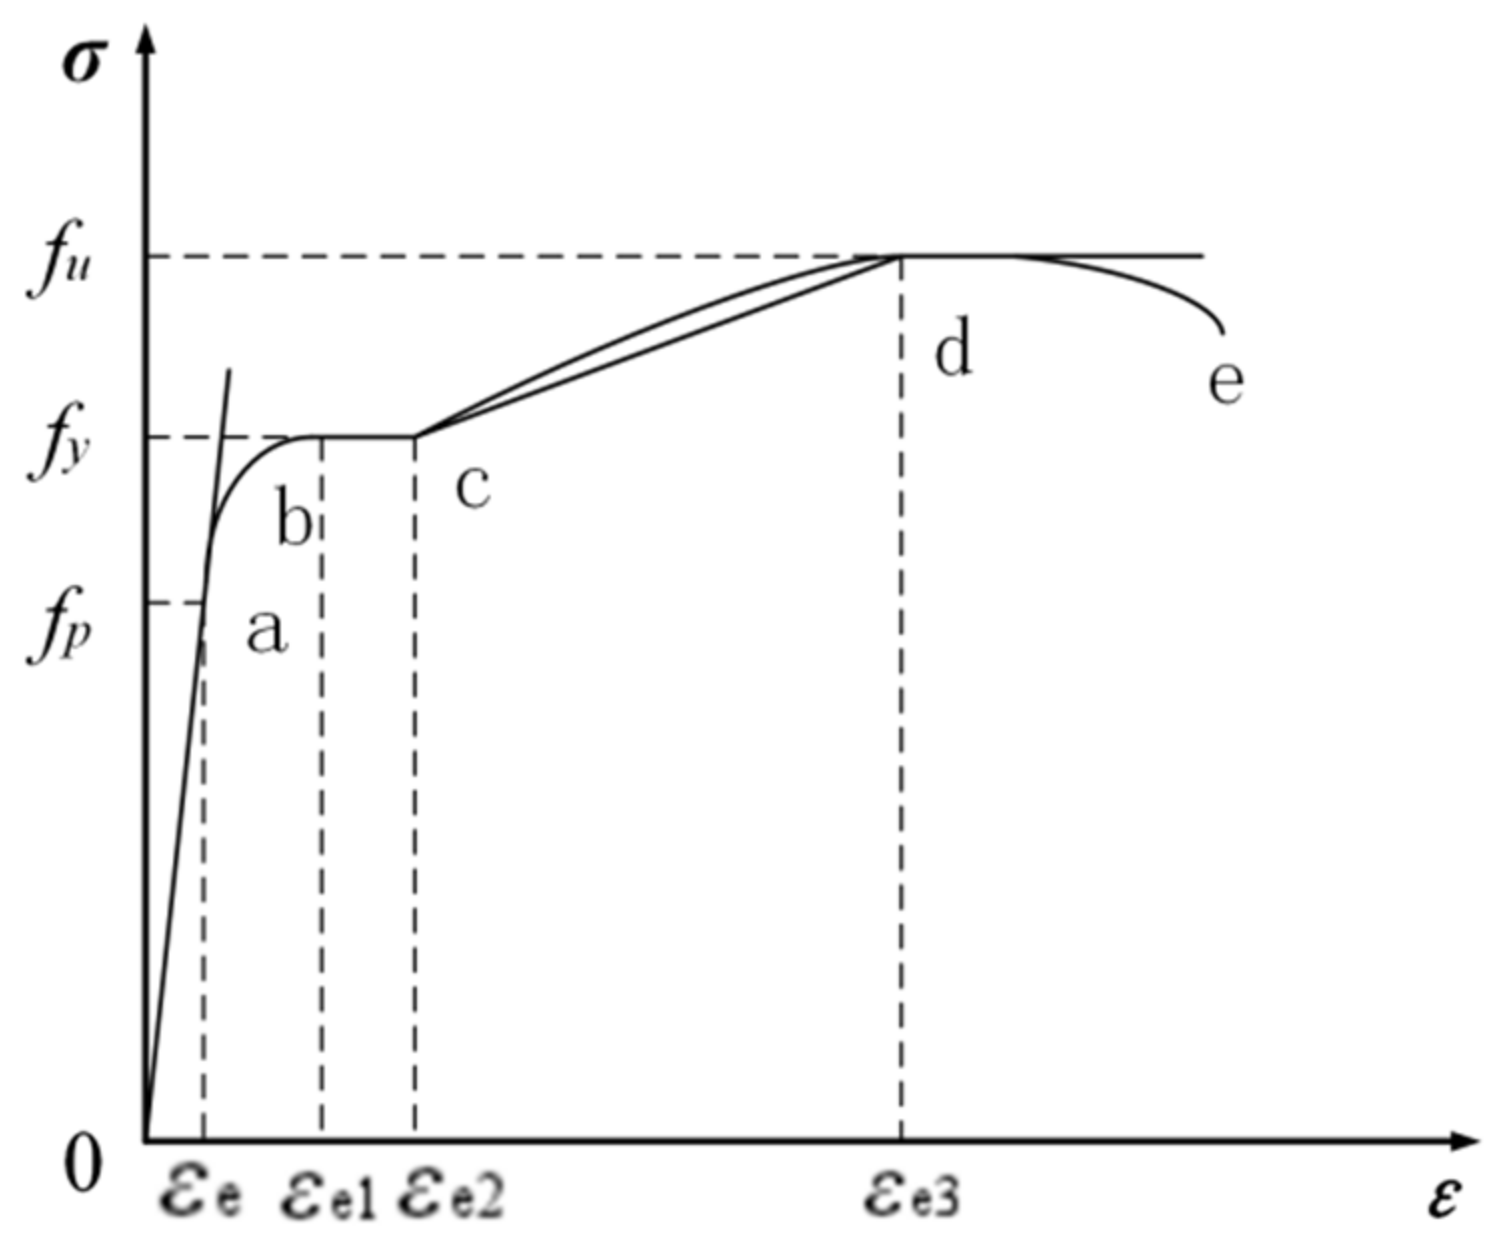
3.1.3. Carbon-Steel Material

The secondary plastic flow model proposed by Han et al. [34] was adopted for the steel skeleton:
σ s = E s ε s ε s ε e A ε s 2 + B ε s + C ε e < ε s ε e 1 f y ε e 1 < ε s ε e 2 f y 1 + 0.6 ε s ε e 1 ε e 3 ε e 2 ε e 2 < ε s ε e 3 1.6 f y ε s > ε e 3 ,
where fp, fy, and fu are the limiting values of the steel proportion, yield strength, and tensile strength respectively; εe = 0.8fy/Es; εe1 = 1.5εe; εe2 = 10εe1; εe3 = 100εe1; a = 0.2fy/(εe1εe); b = 2e1; c = 0.8fy + e2e; and Es is the elastic modulus of steel. The stress–strain curve predicted by the model is shown in Figure 6.

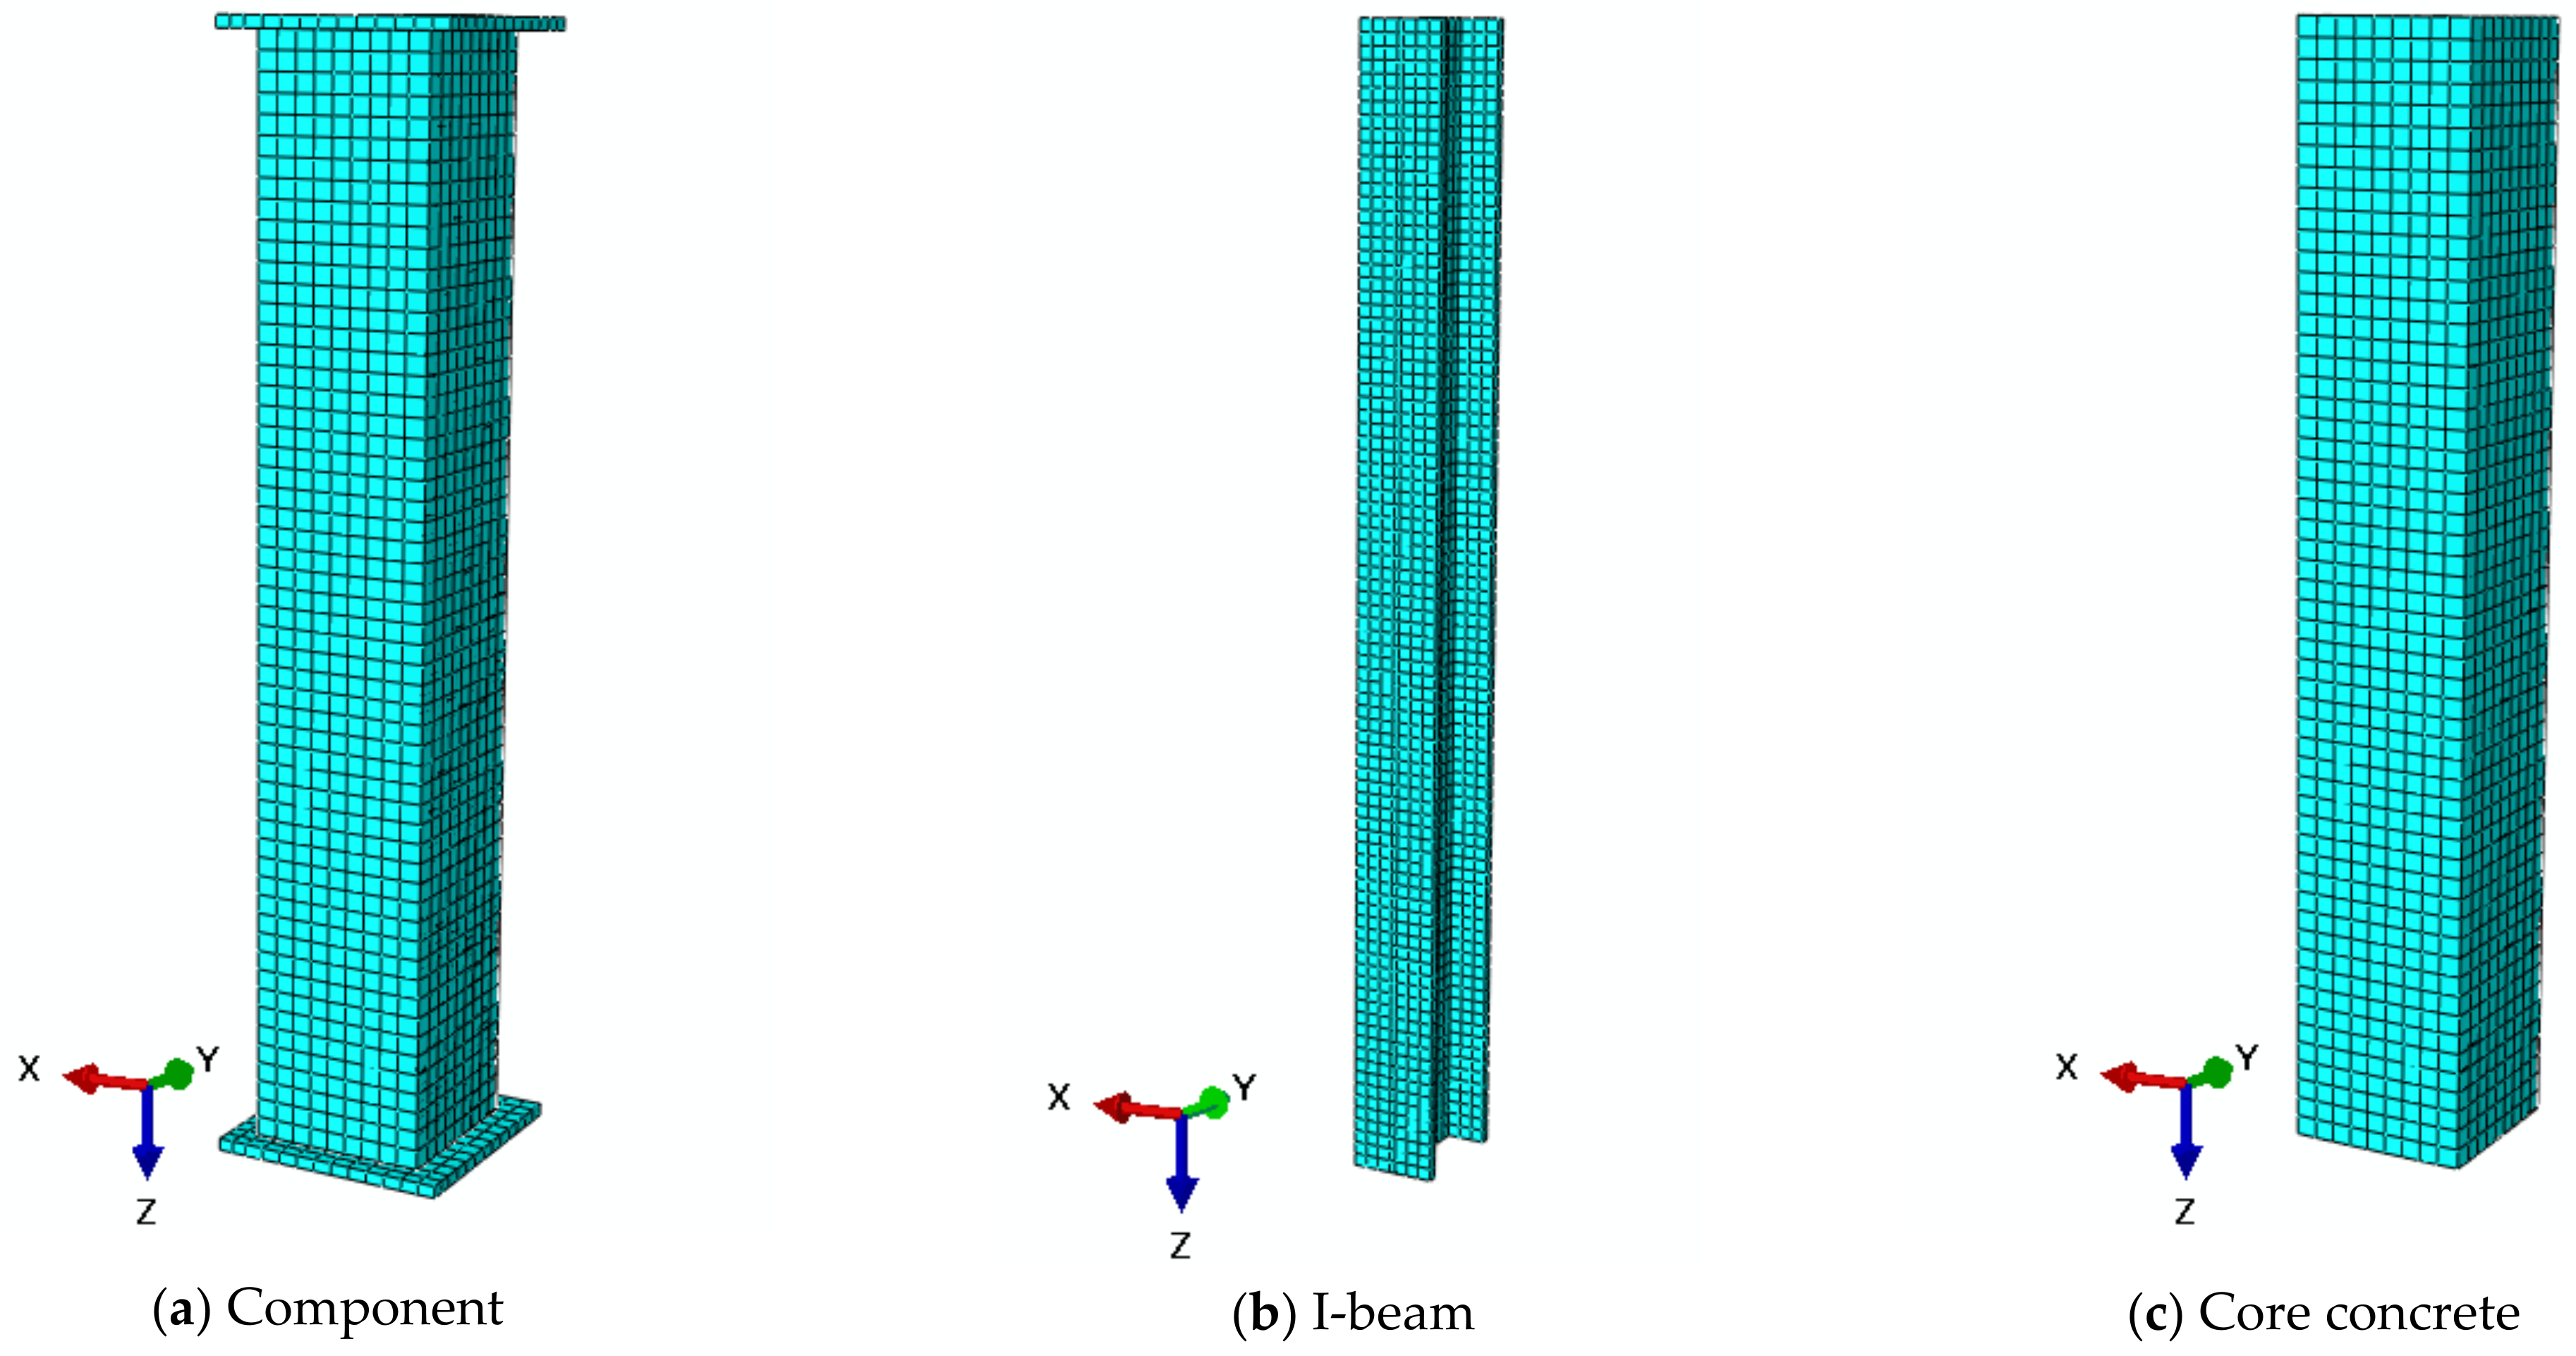
3.2. Finite Element Modeling

A nonlinear finite element model was established in ABAQUS, and the mechanical properties of UHPCFSSST members under axial compression were numerically analyzed. Concrete was simulated by a damaged plastic model, and the expansion angle, eccentricity, yield stress ratio, K value, and viscosity coefficient were 40, 0.1, 1.033, 0.8, and 0.001, respectively [35]. Eight-node linear hexahedral elements (C3D8R) were used to simulate the concrete, steel skeleton, and upper and lower plates, and four-node shell elements (S4R) were used to construct the steel pipes. The grid sensitivity analysis of the established numerical model showed that when the approximate global size was around 12, the calculation accuracy of the simulated bearing capacity was good, and if the approximate global size continued to decrease, the calculation efficiency would be affected. Therefore, the approximate size of the grid was around 12, and the divided grid is shown in Figure 7.
The upper and lower plates were set as rigid bodies, and the axial displacement of the upper plate was loaded on the Z-axis to simulate an axial compression force (U1 = U2 = UR1 = UR2 = UR3). The lower plate was completely fixed in place (U1 = U2 = U3 = UR1 = UR2 = UR3). There was no slippage between the steel and concrete, and the steel was built into the core concrete. The stainless-steel tube was connected to the upper and lower plates by shell–solid coupling. The contact between the concrete, stainless steel, and cover plate was surface-to-surface contact.

3.3. Finite Element Verification
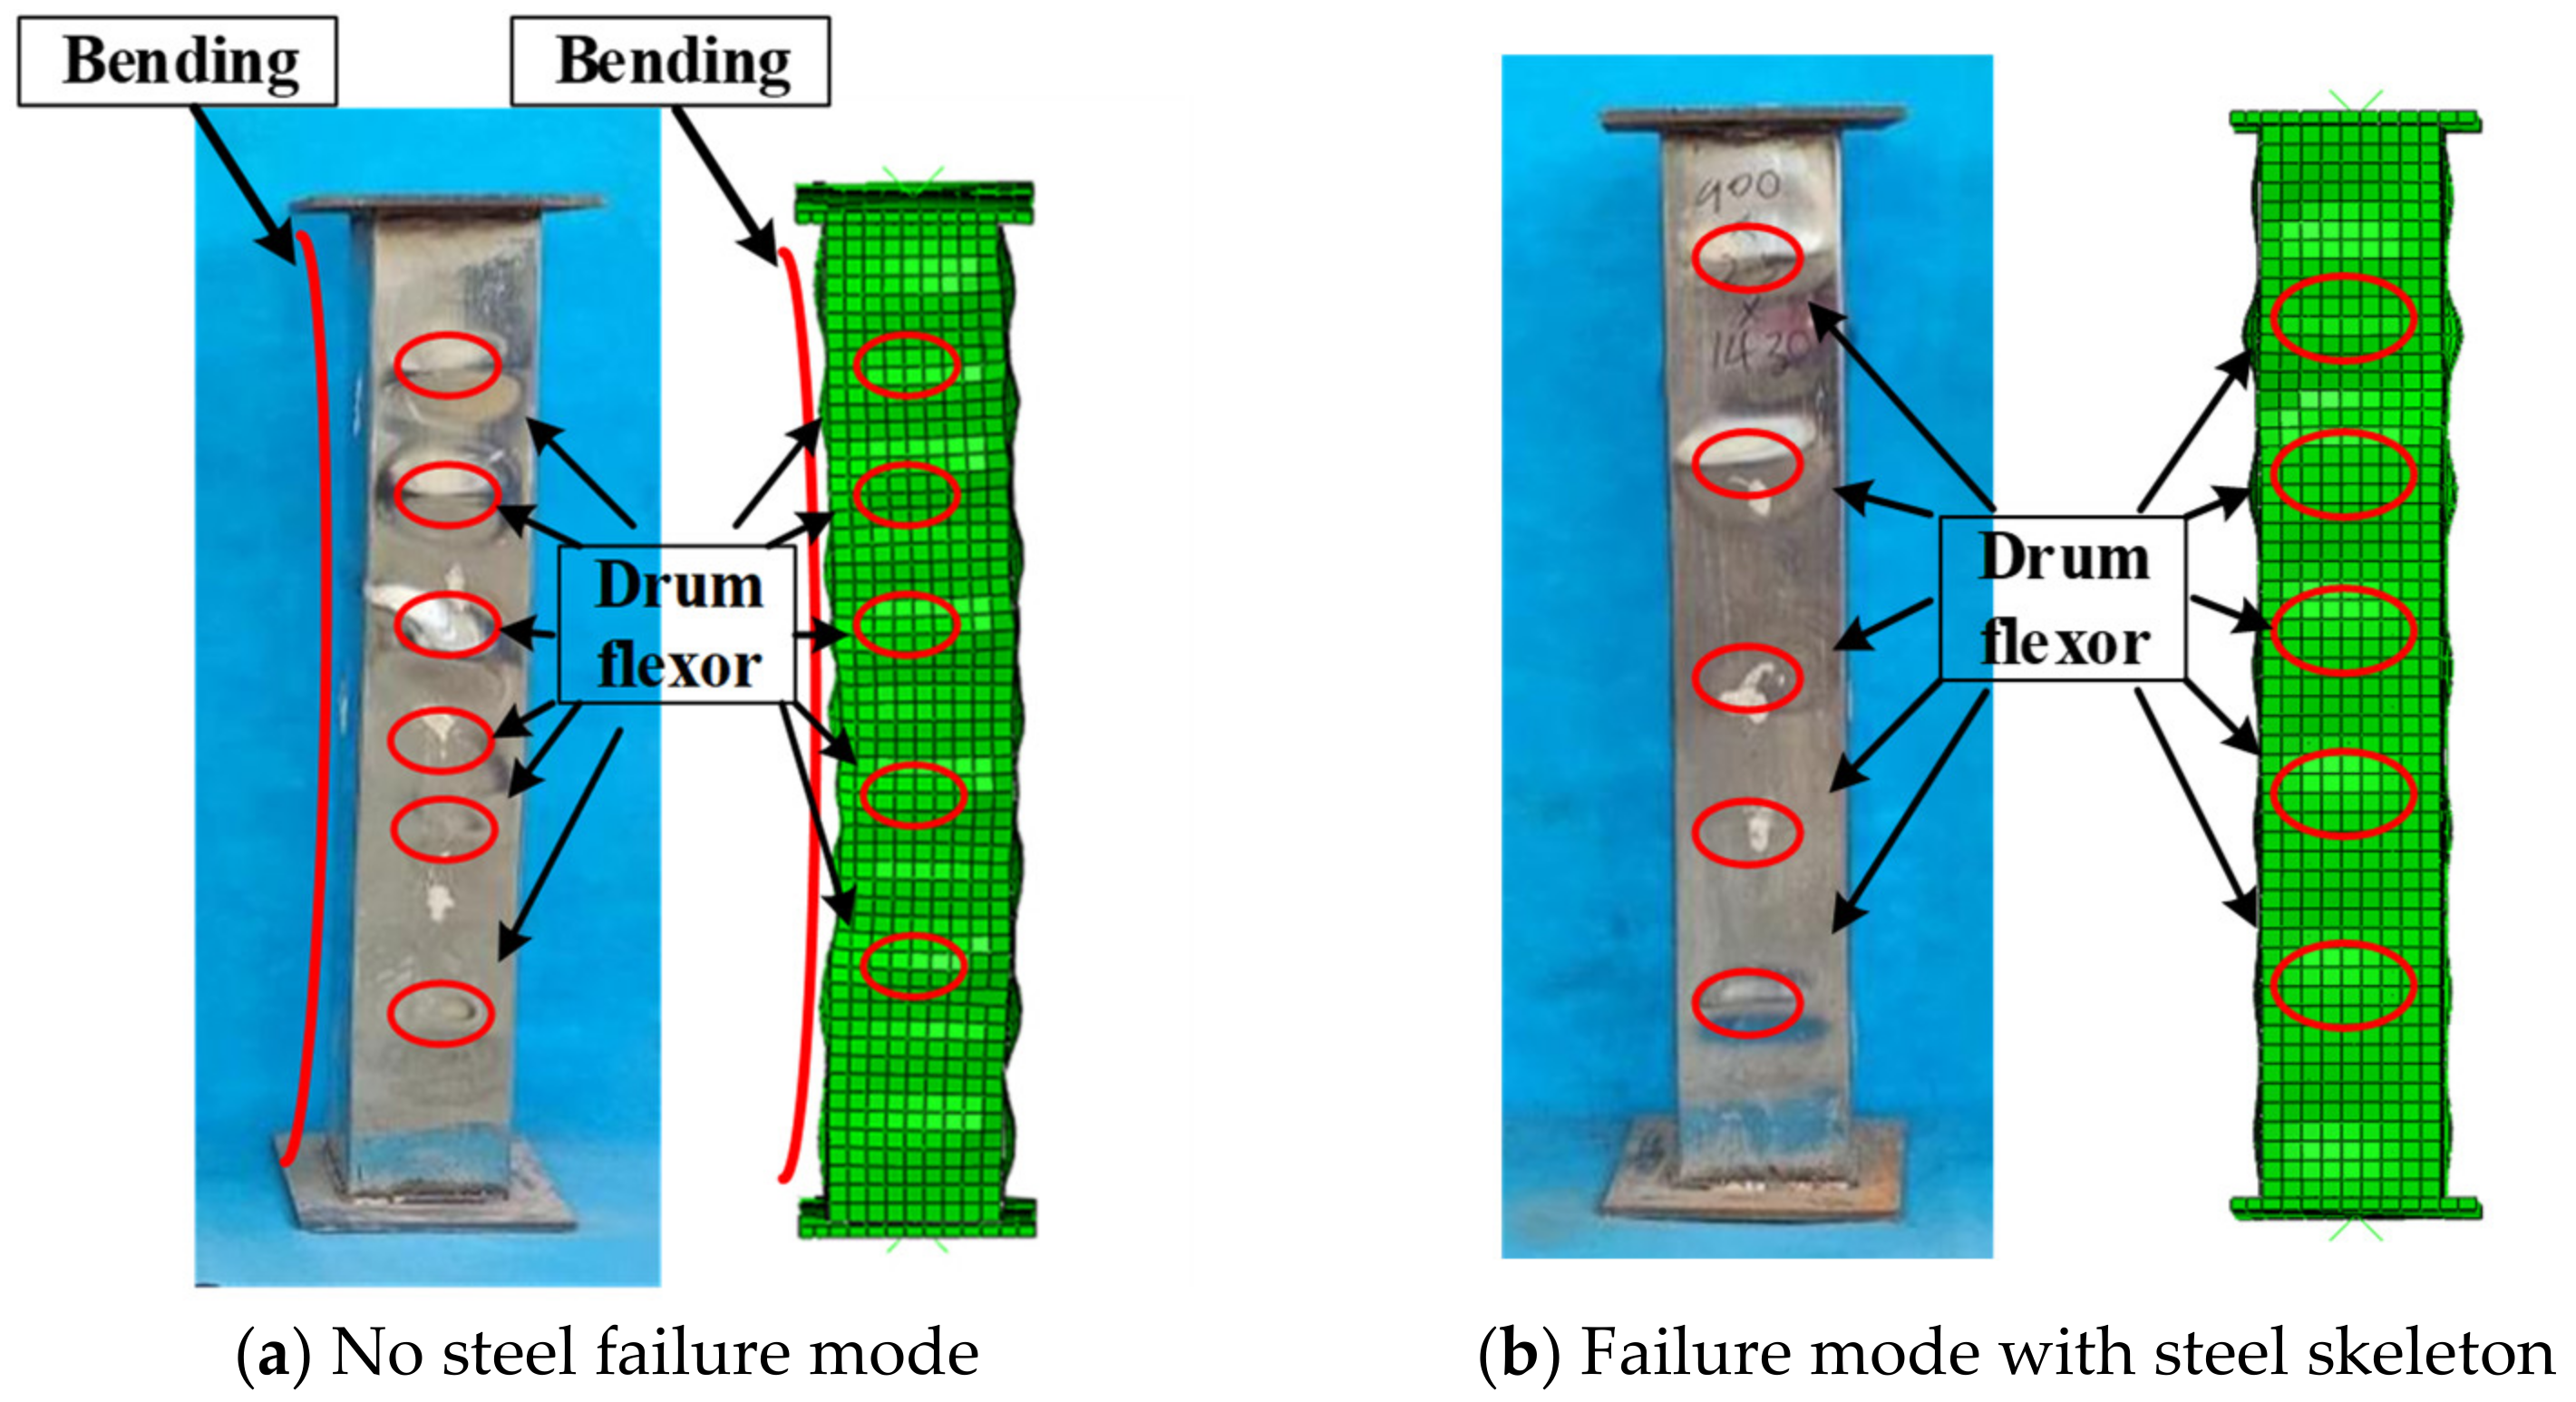
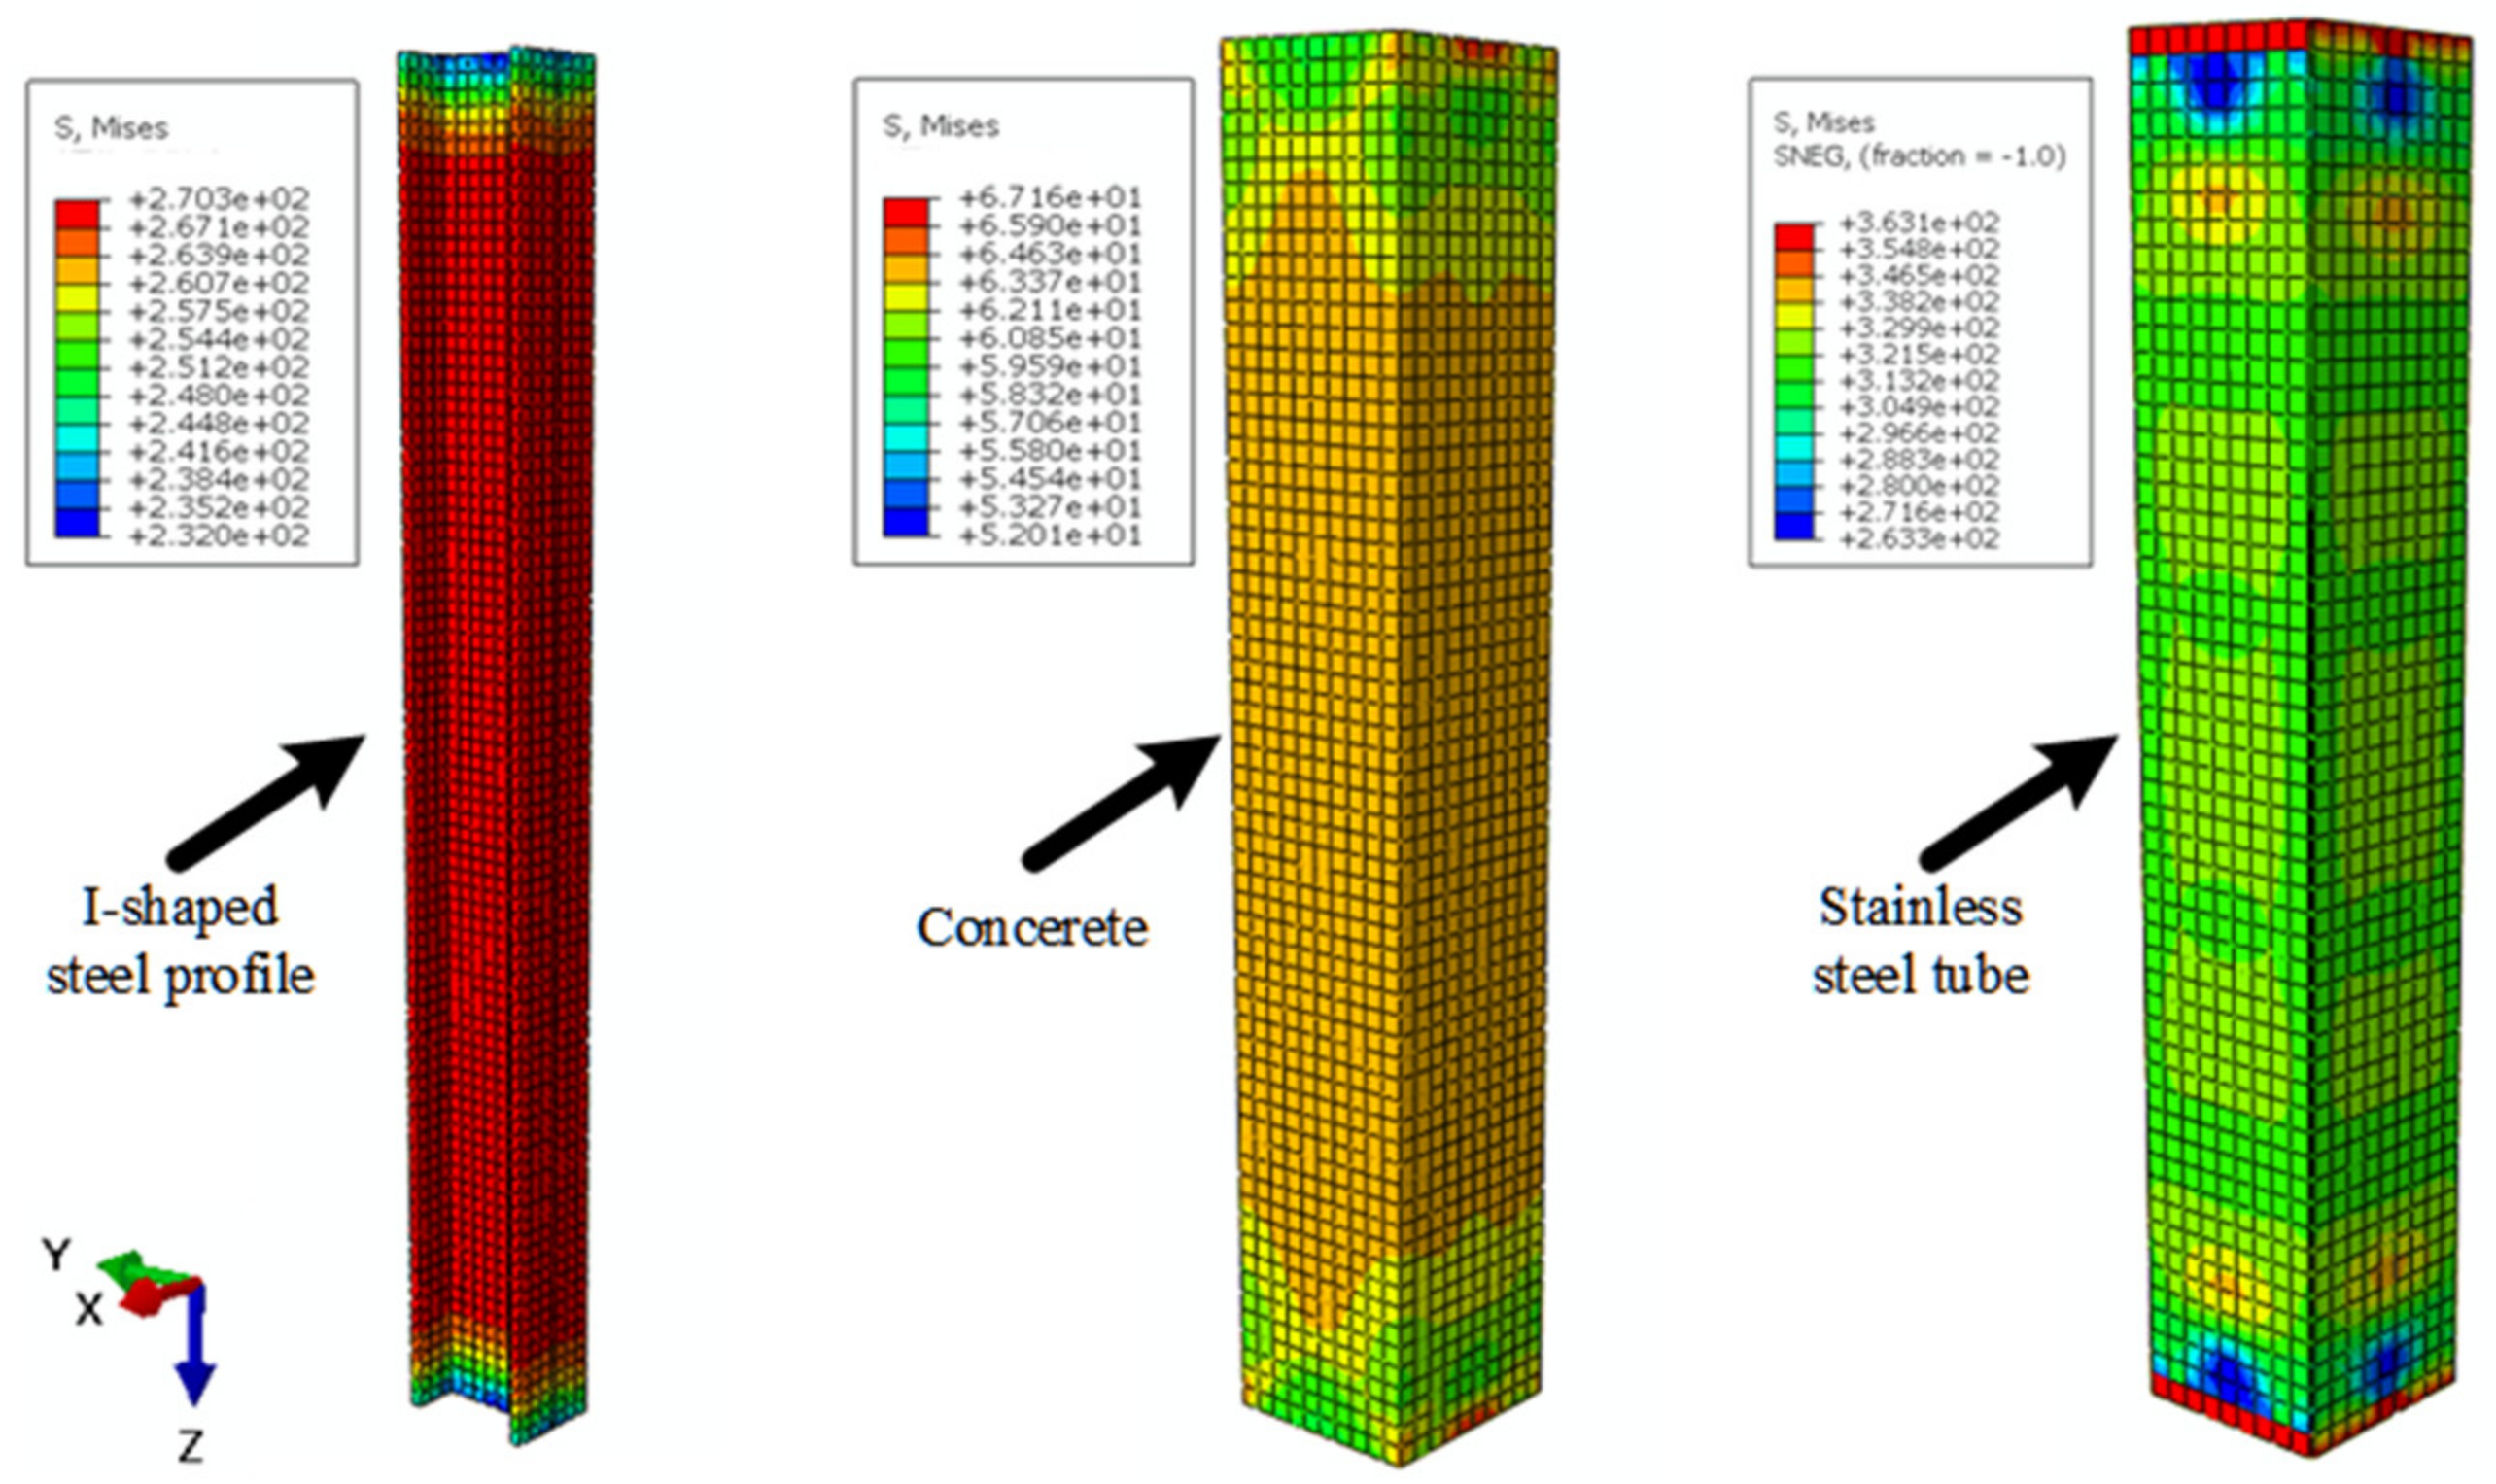
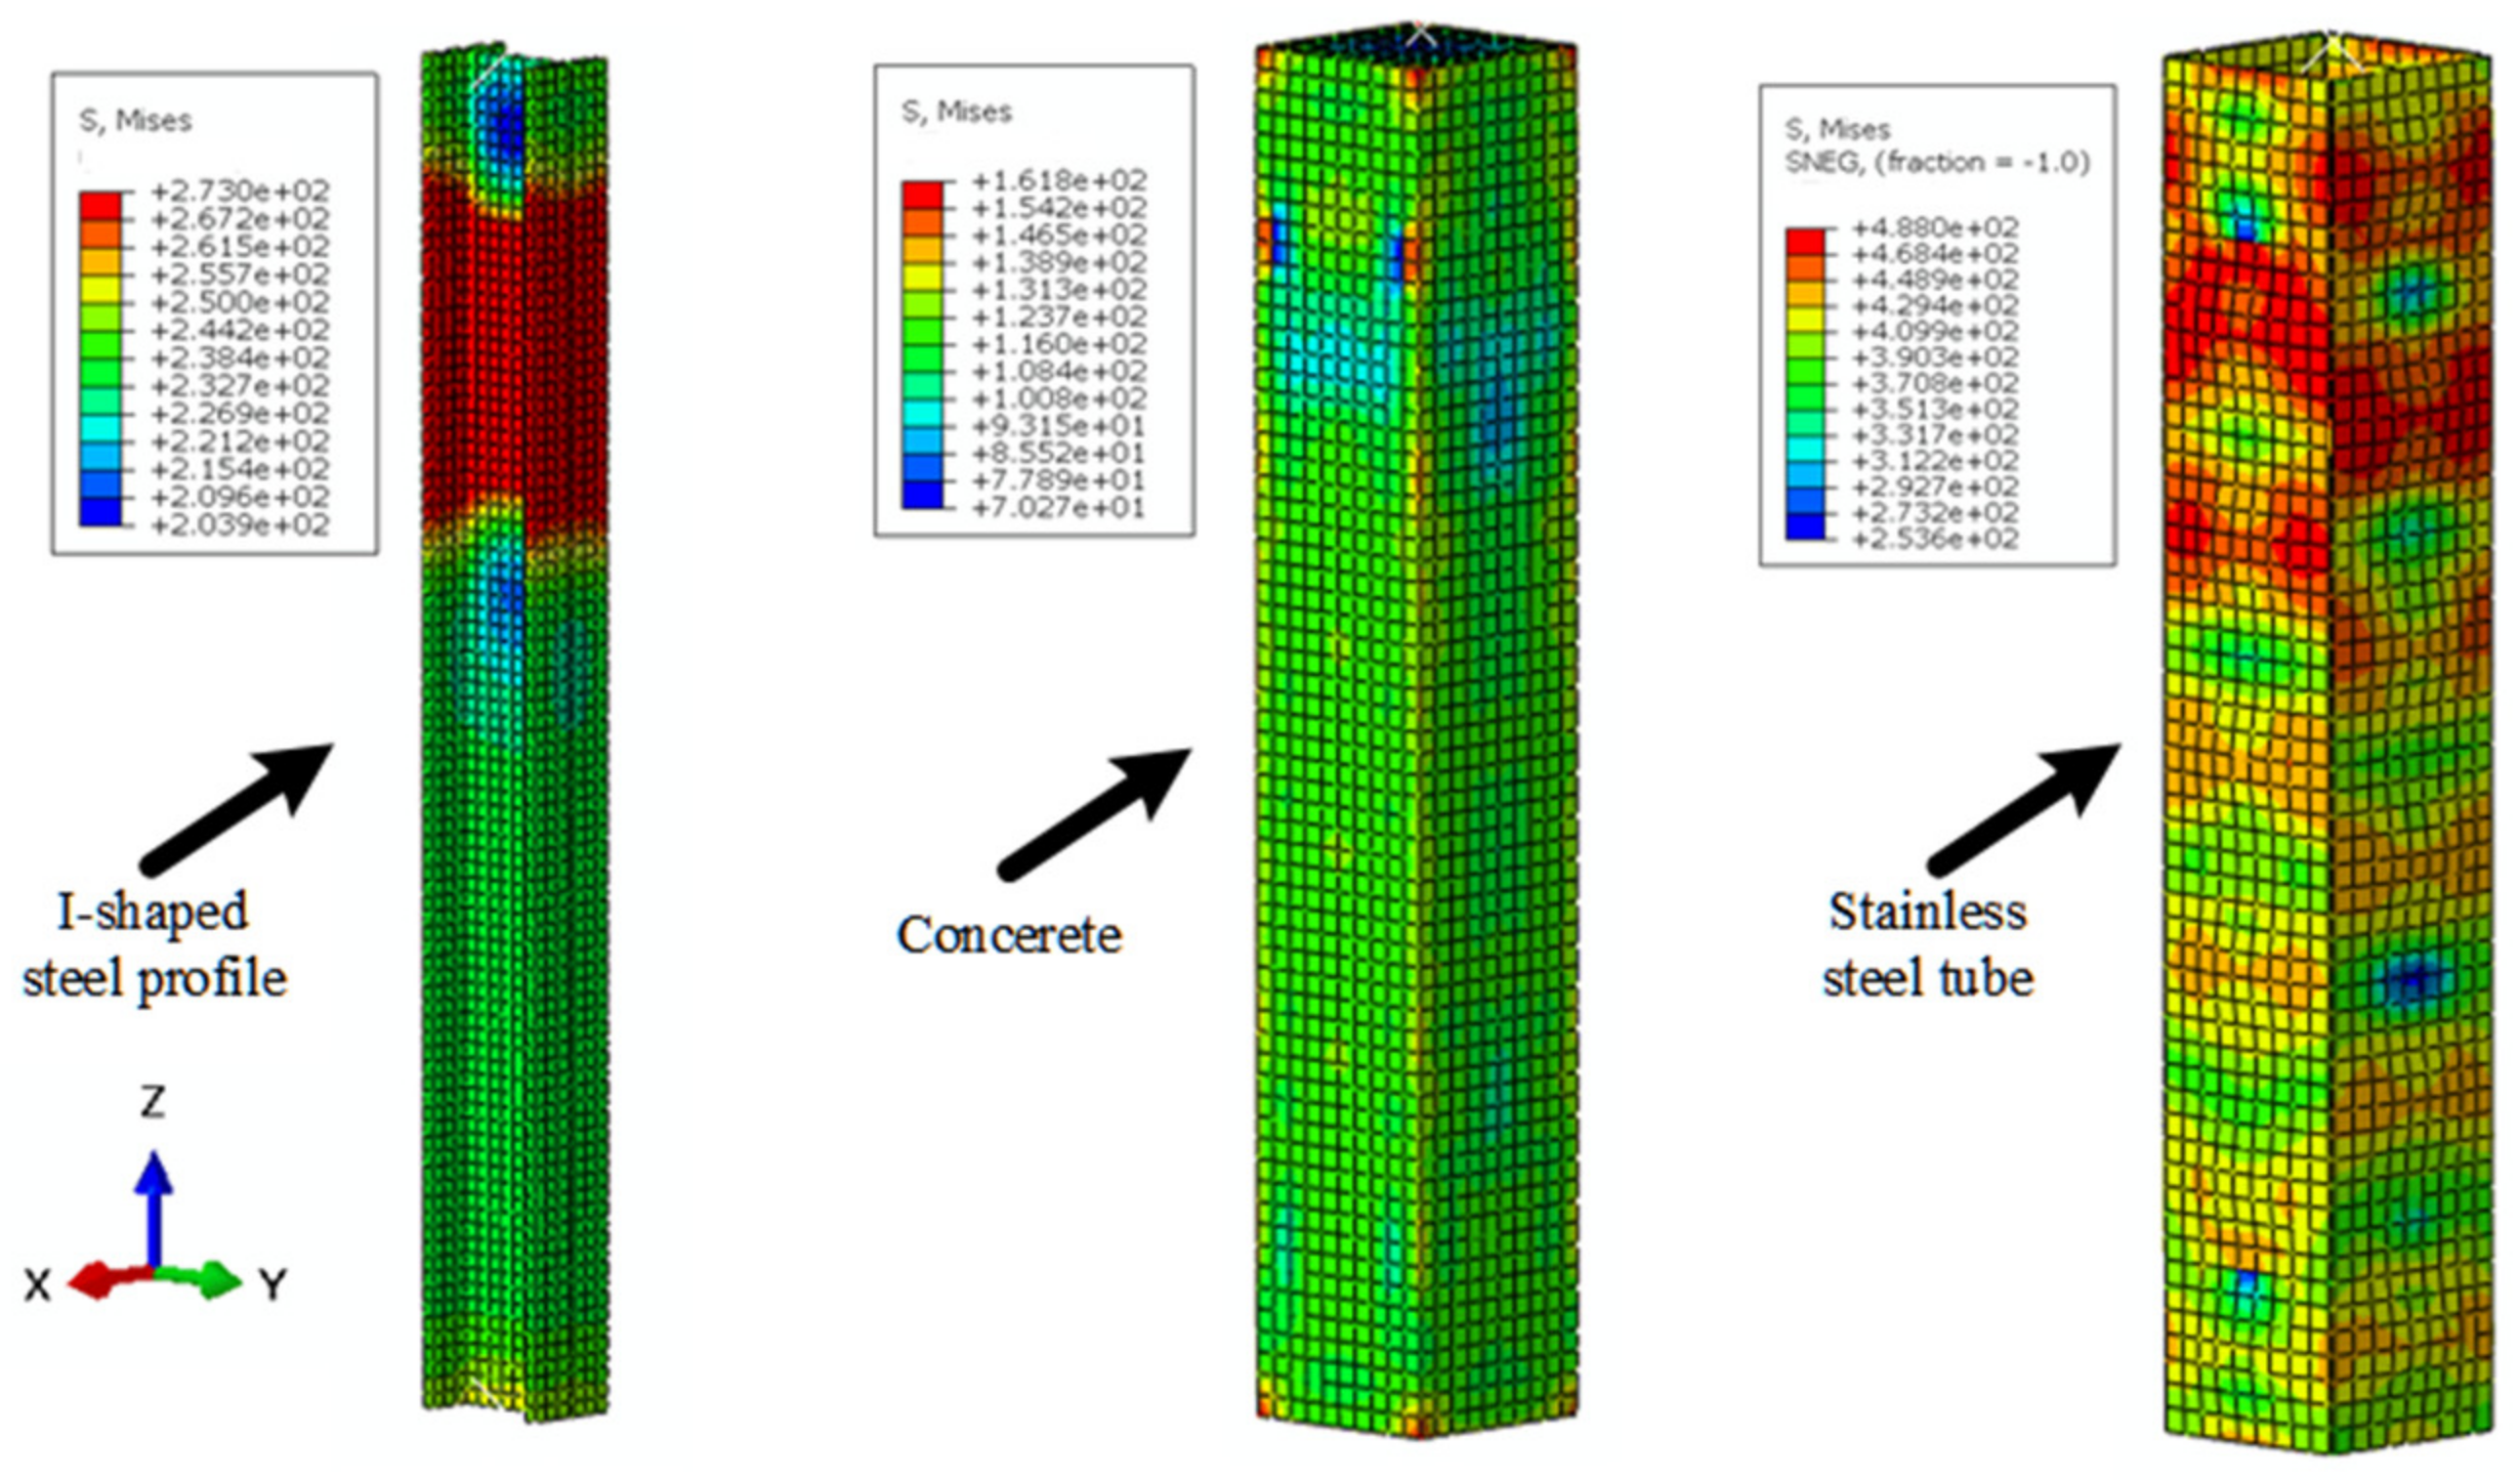
To verify the accuracy of the finite element model, the test results were compared with the simulation results, as were the failure modes, load–displacement curves, and ultimate bearing capacities of the test specimens.

3.3.1. Damage State

Figure 8 shows the failure modes of the component tests and numerical simulations. Comparative analysis showed that the two were in good agreement. For UHPCFSSST members under axial compression, in addition to waveform bending on the surface of the member, the whole member produced bending deformation. For SR-UHPCFSSST members, the main performance characteristic was that the surfaces of the member produced wavy buckling. Under a continuous load, with the continuous expansion of the bulging phenomenon of the stainless-steel pipe, the core concrete was damaged by compression, but the existence of the steel ribs strengthened the constraint of the outer steel pipe on the core concrete and inhibited the development of shear cracks in the concrete to a certain extent. It can be seen from the simulation results that the numerical model established in this paper could better simulate the failure mode of the high-strength-square-steel-tube UHPC column under axial compression.

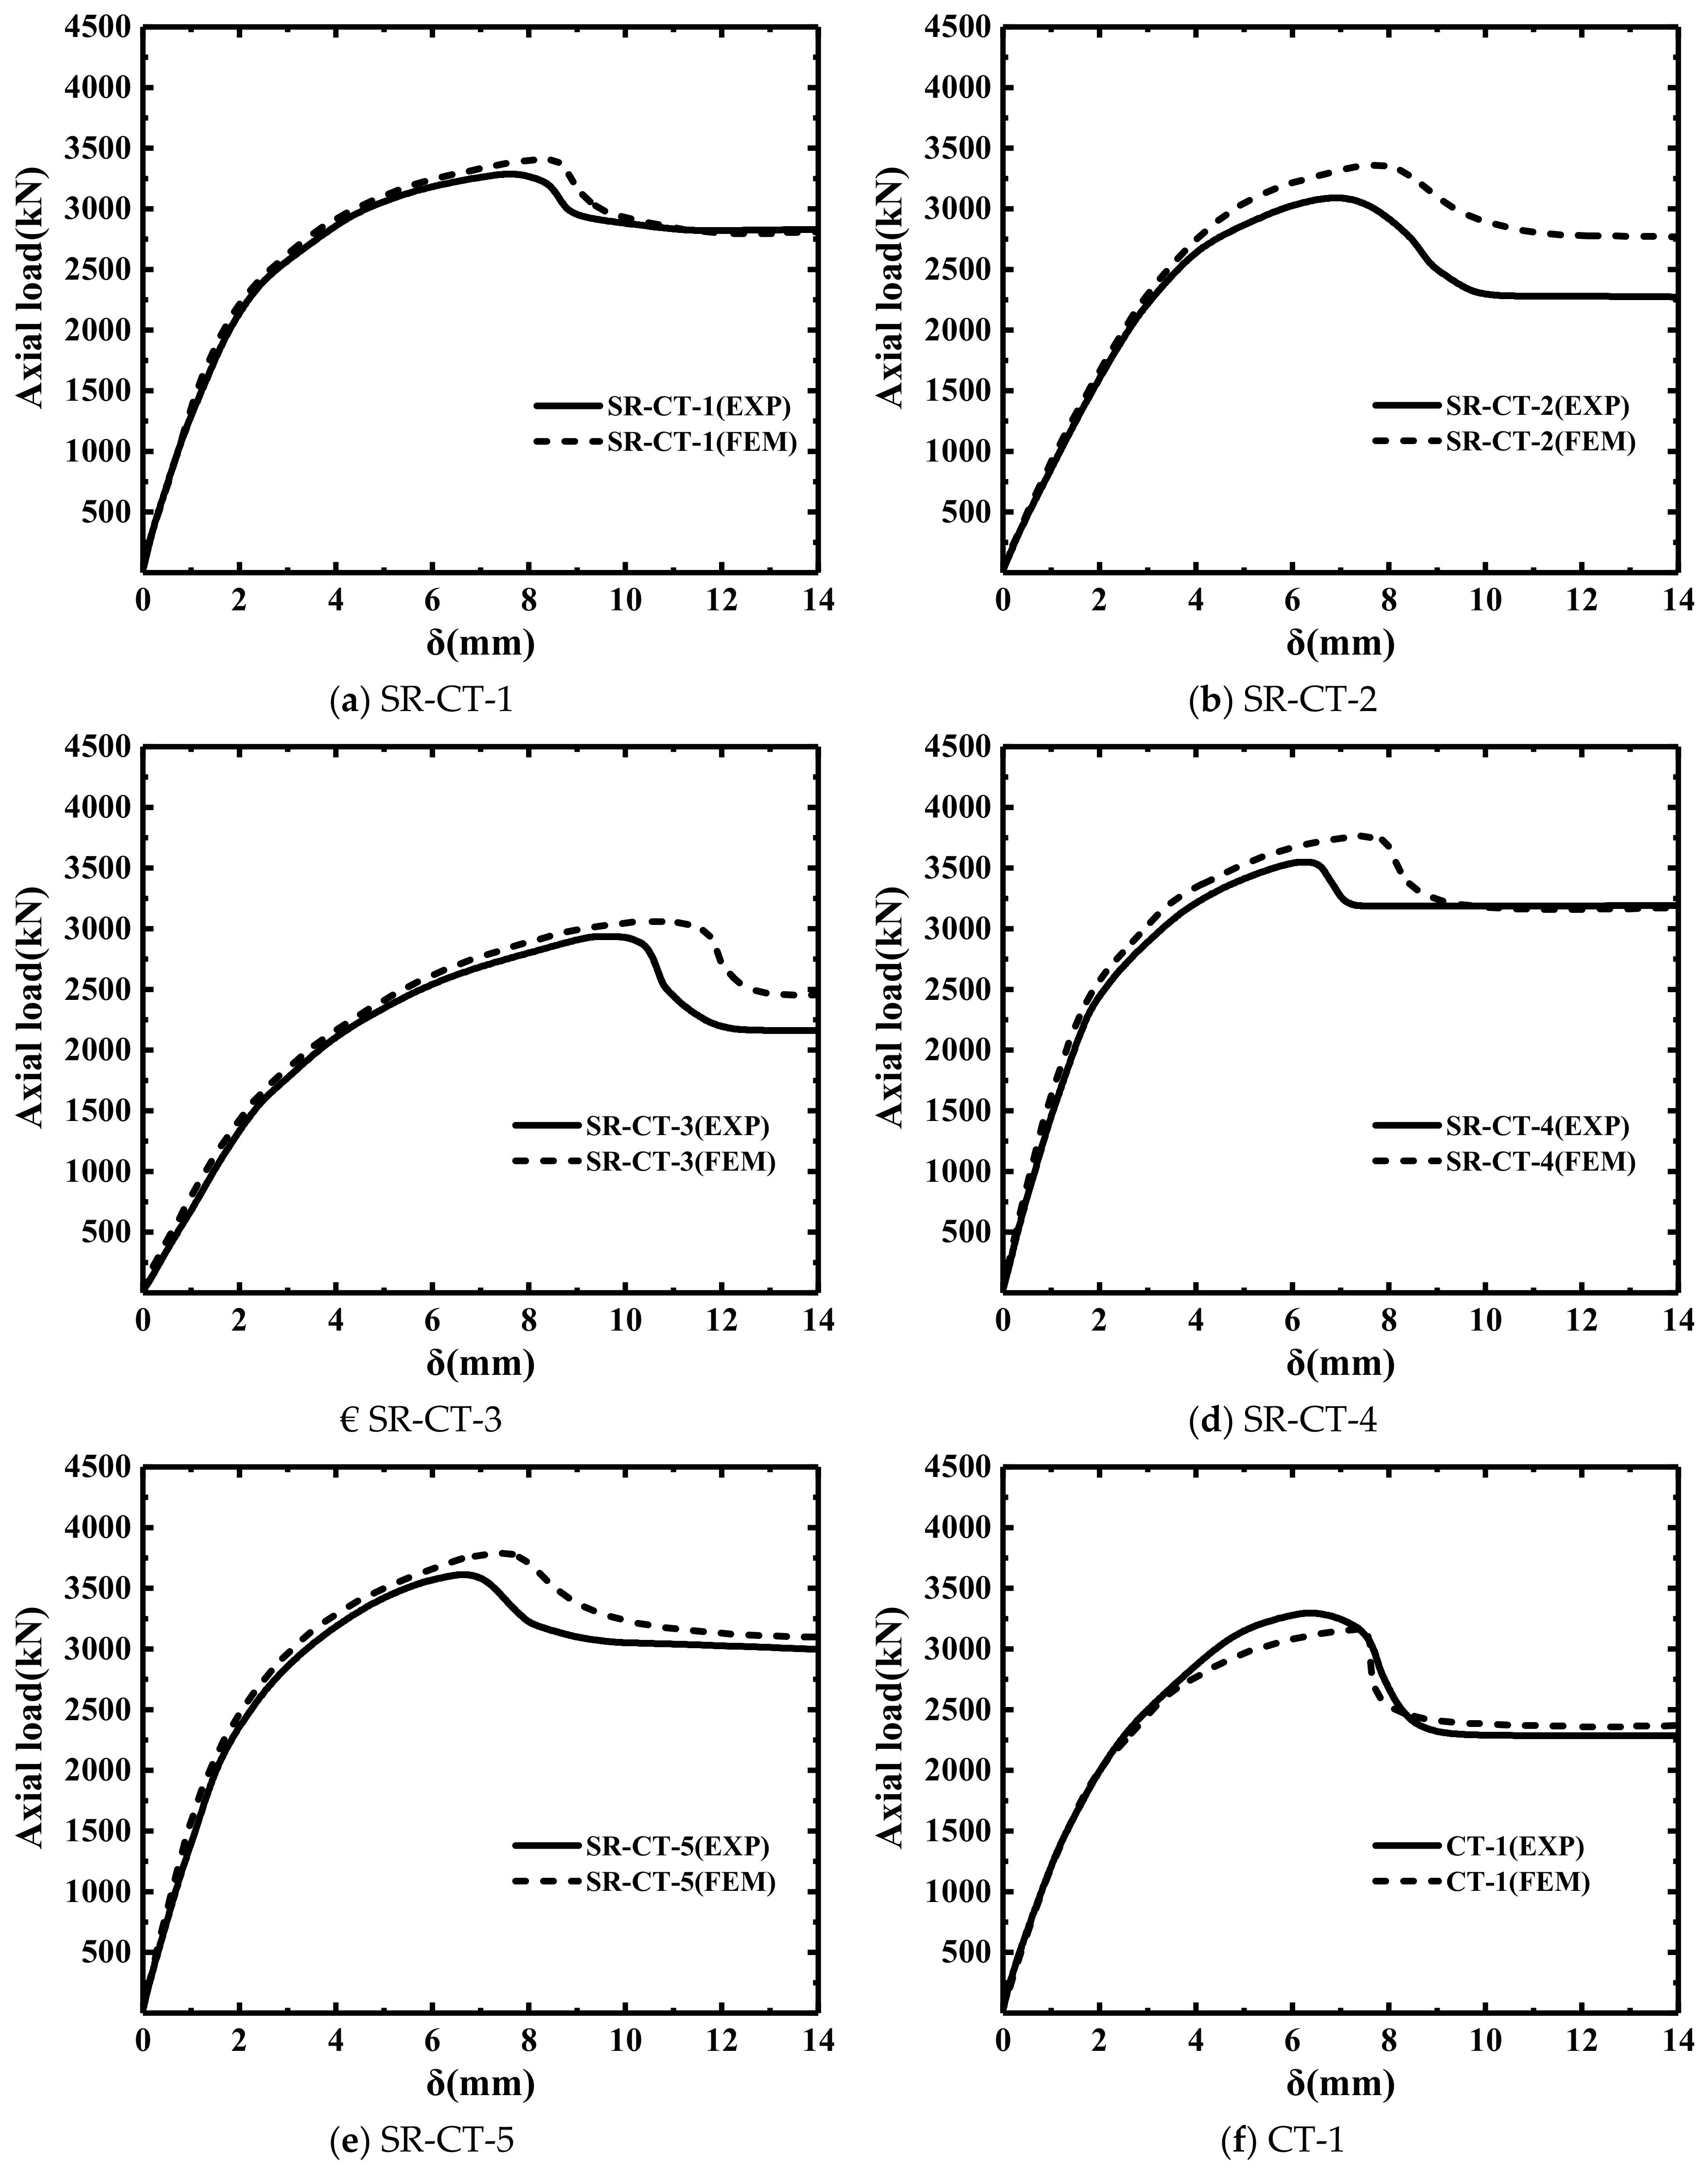
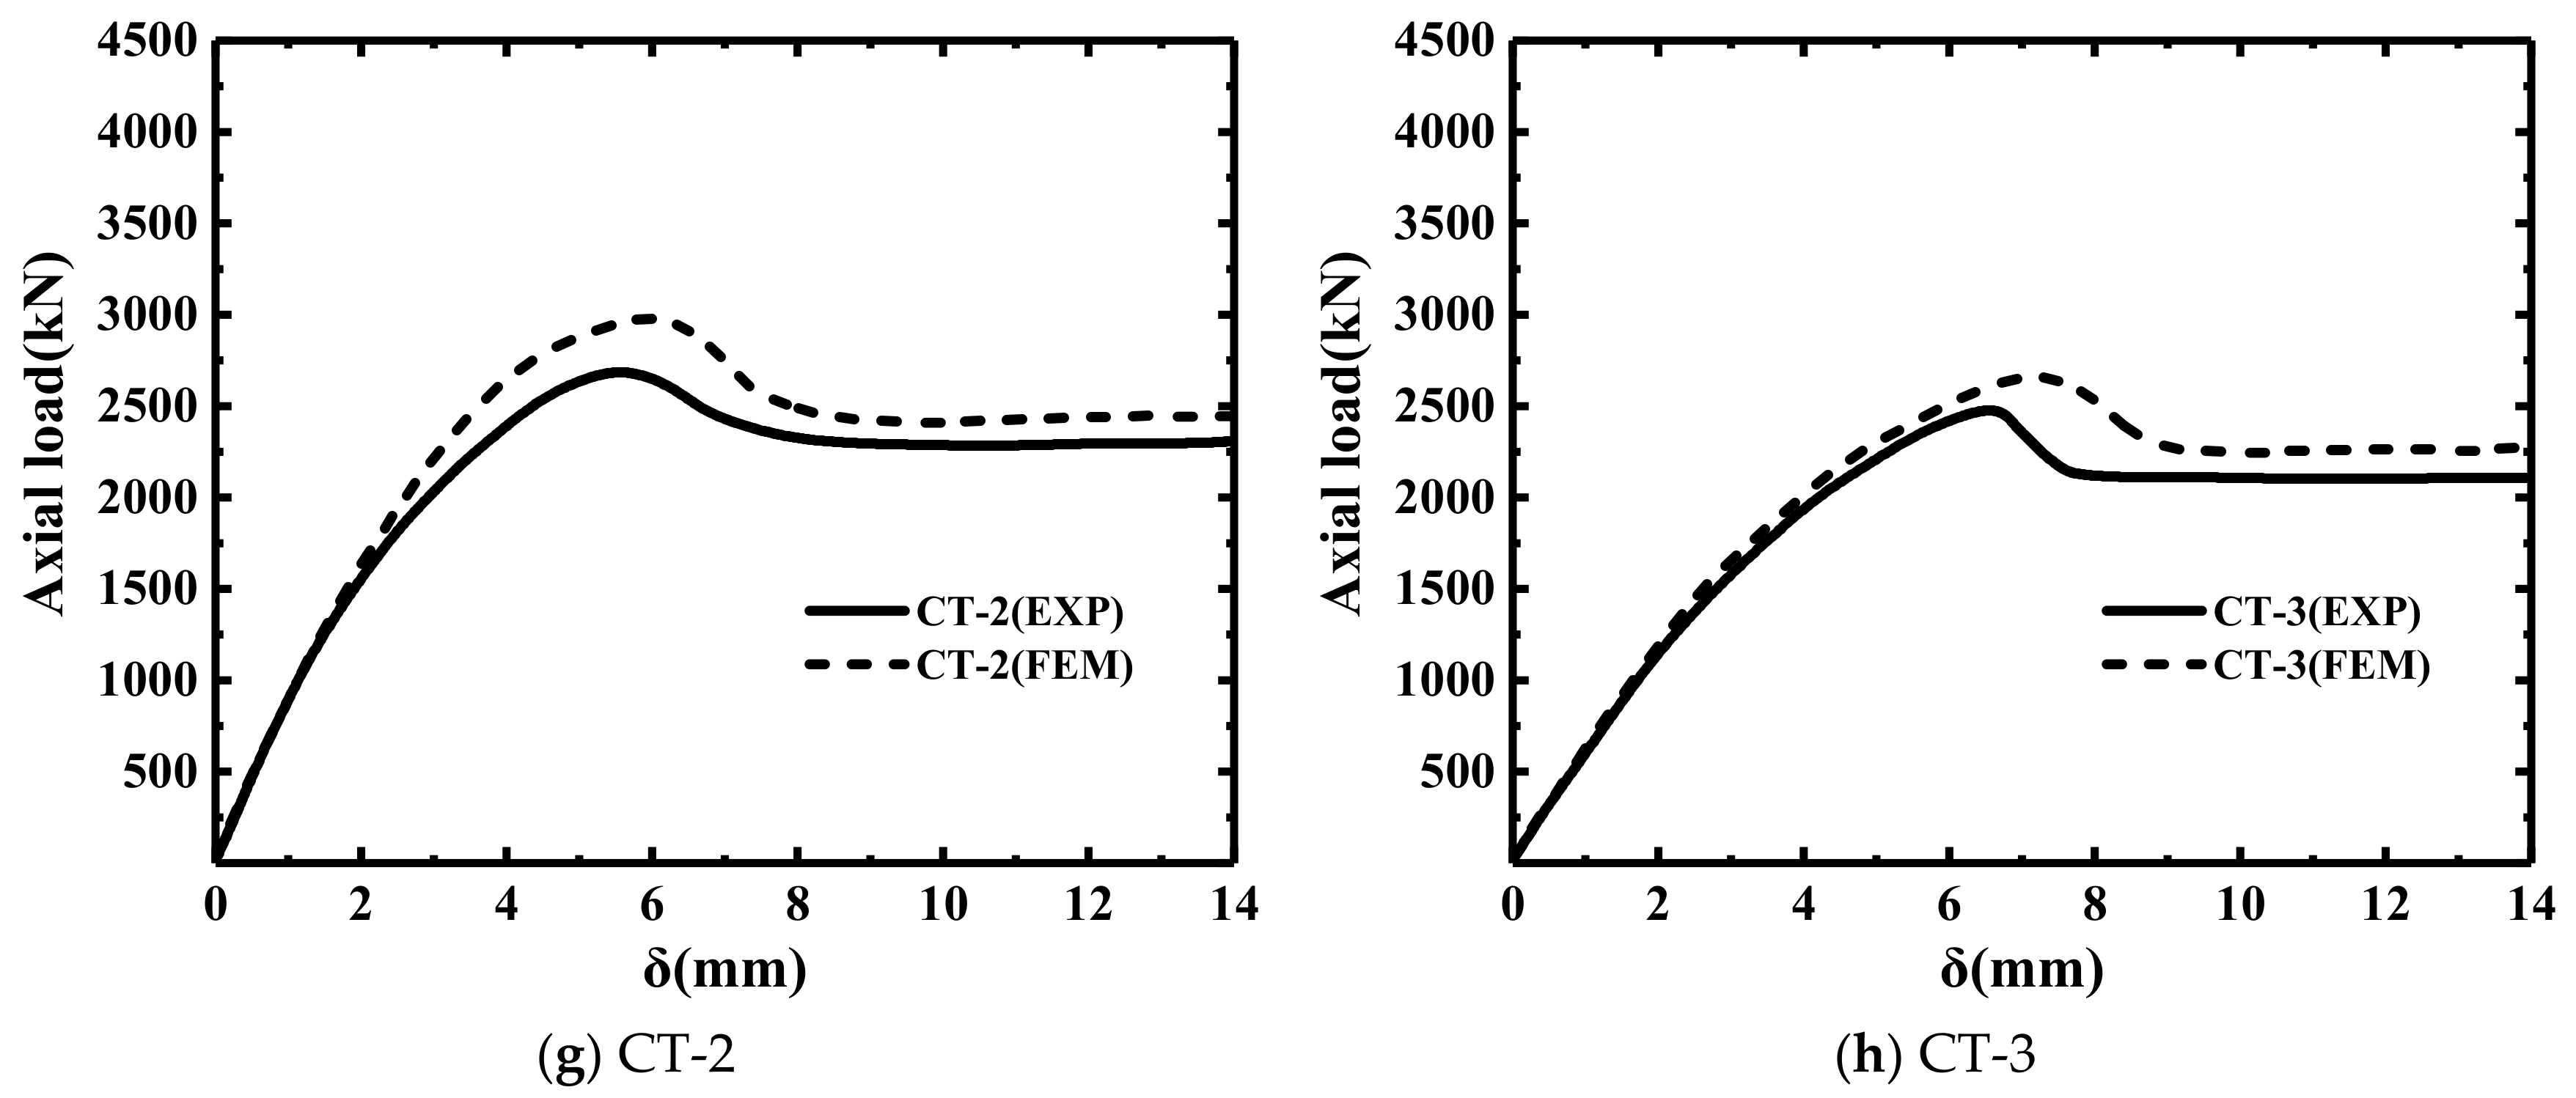
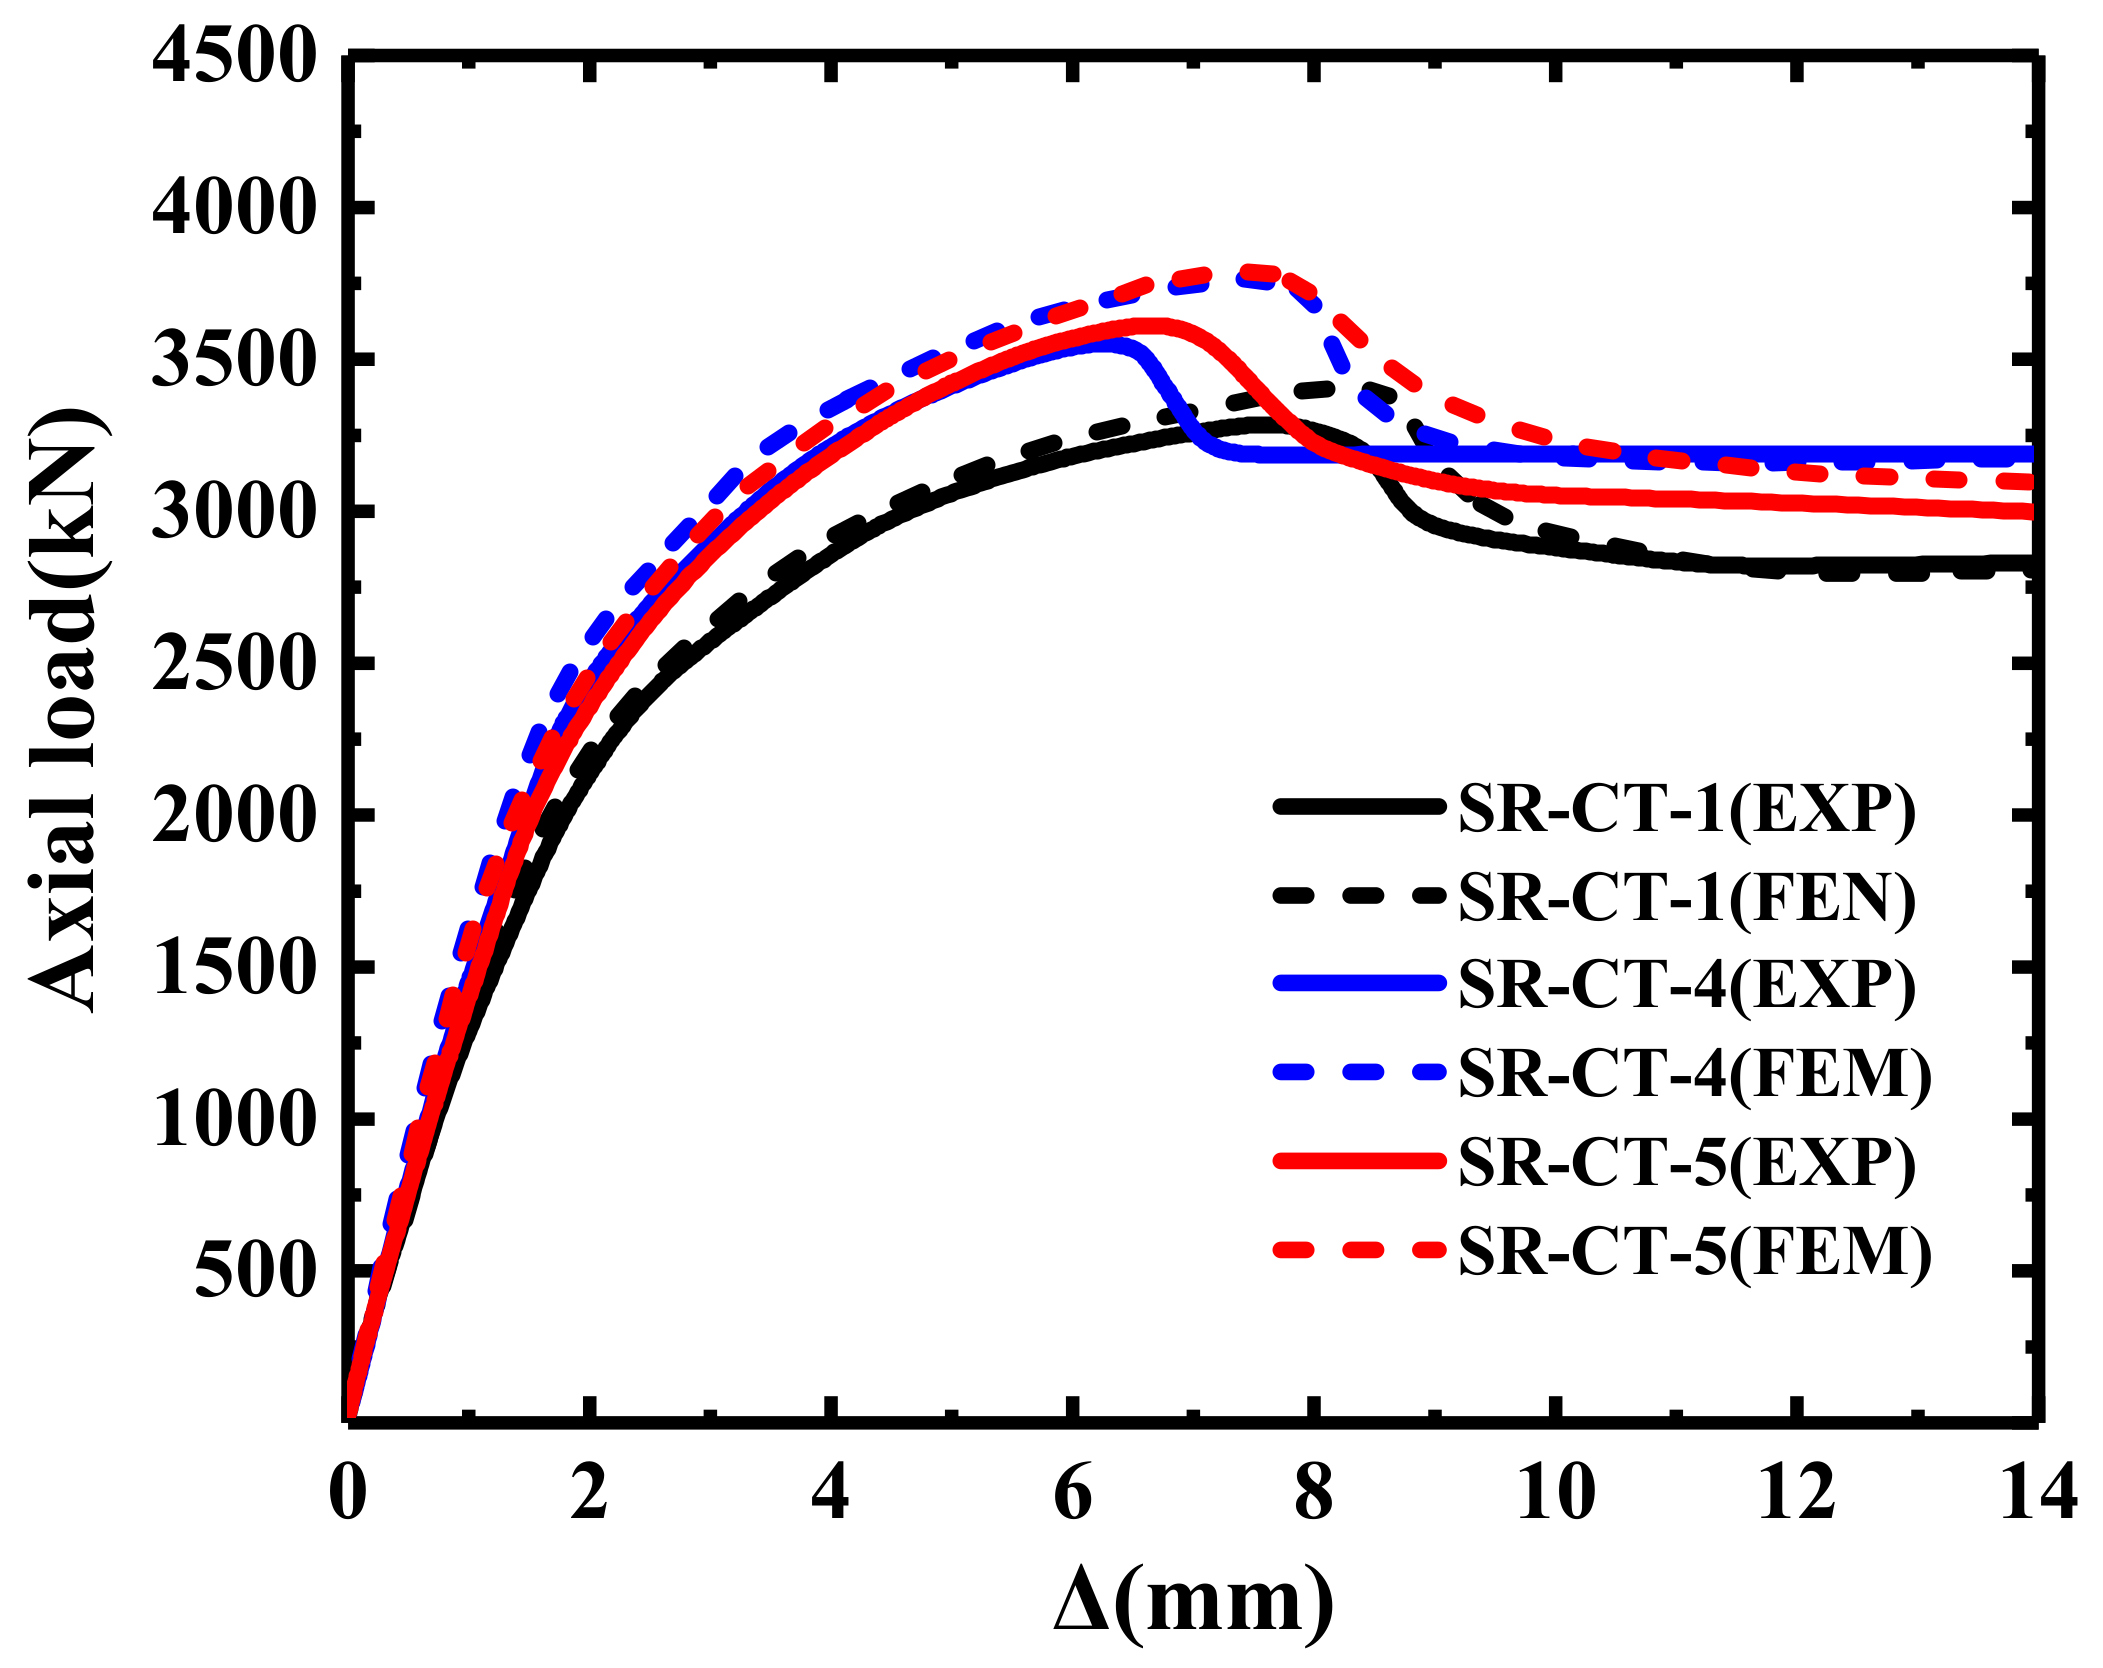
3.3.2. Load–Displacement Curves

Figure 9 shows the load–displacement curves obtained from the experiments and numerical simulations of the components. From the comparison of the curves in the figure, it can be seen that the numerical simulation results were in good agreement with the experimental curves overall. At the initial loading stage, all of them were in the elastic stage. With increasing load, the displacement increased slowly. The ascending and descending stages were the same, and the peak load and residual strength were consistent, indicating that the numerical model established in this paper could better simulate the axial stress process of the components.

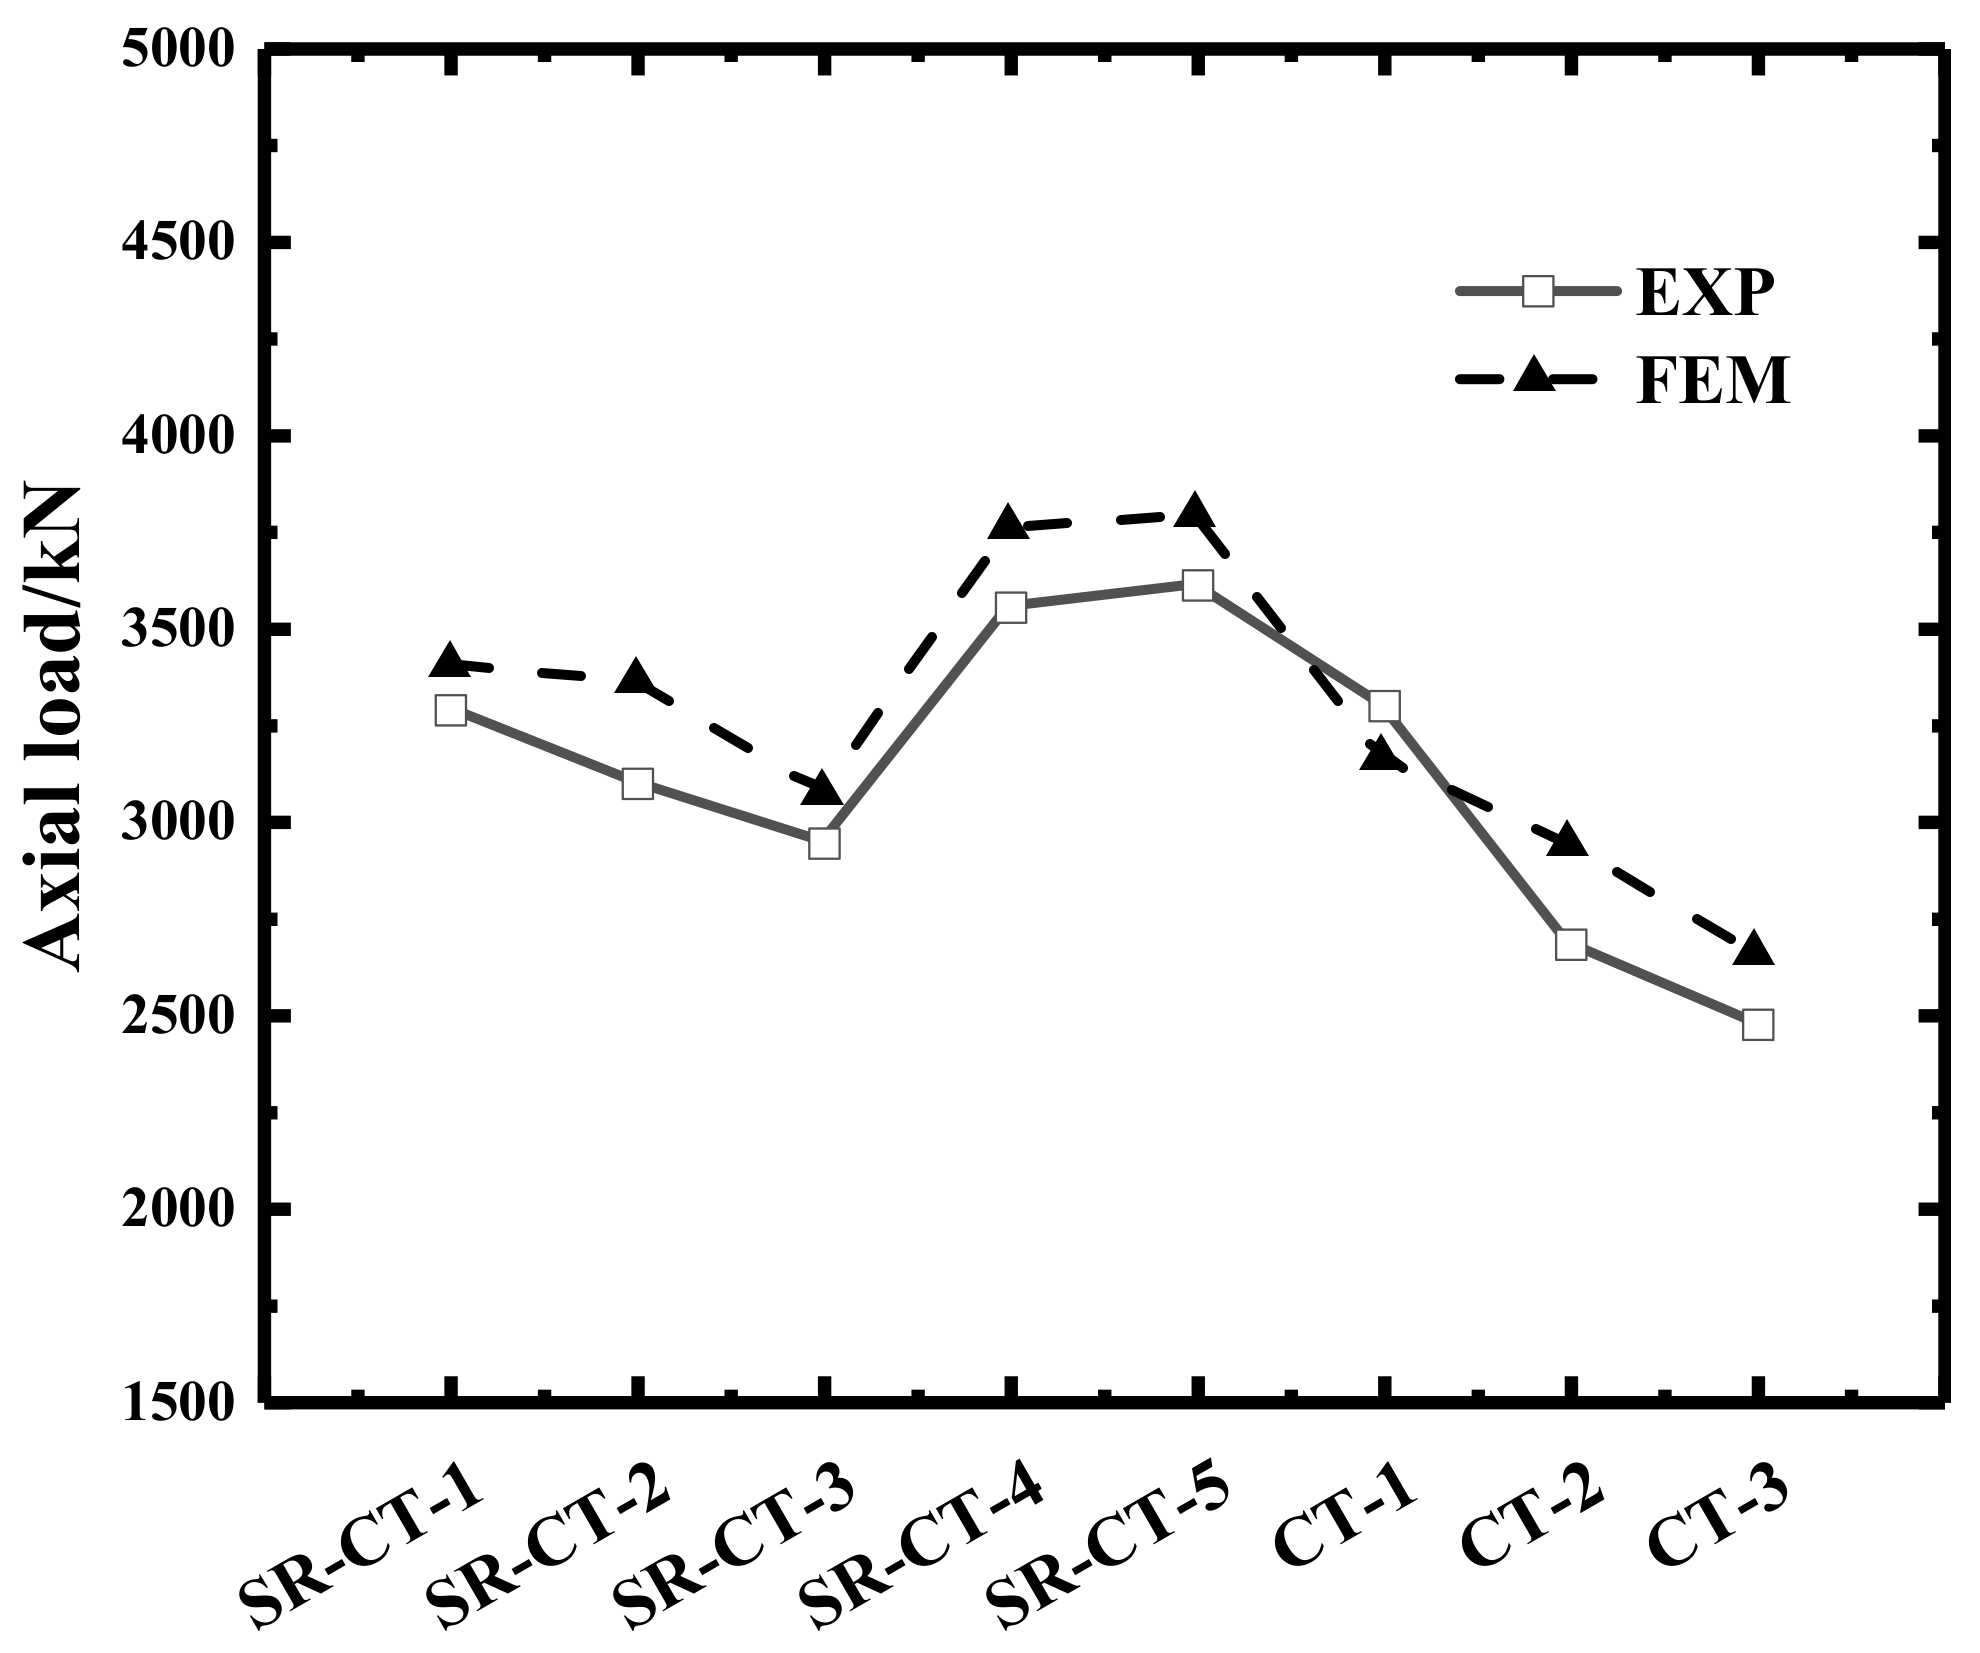
3.3.3. Ultimate Bearing Capacity

The bearing capacity is an important index to judge the performance of concrete-filled steel tubular columns and has been widely studied by scholars. Figure 10 shows experimental and numerical simulation results. It can be seen from the figure that the magnitude and trend of the ultimate bearing capacity obtained from simulations and experiments are in good agreement. Table 7 shows the error analysis of ultimate bearing capacity calculated using the experiments and numerical simulations. According to the comparative analysis in Table 7, the relative error of the ultimate bearing capacity obtained from simulations and experiments was within 10.0%, and the coefficient of variation was 0.046, indicating that the two were consistent. This showed that the finite element model established in this paper could simulate SR-CFSSST and CFSSST components.

4. Test Results and Discussion

4.1. Mechanism Analysis

4.1.1. Test Phenomenon

At the beginning of loading, the specimens were in the elastic phase. The outer wall of the steel pipe was smooth, and no bulging phenomenon was found. With increasing axial load, a small local bulging phenomenon appeared at the upper end of the specimens. After the axial load was increased to 80% of the ultimate bearing capacity, the local bulge at the upper end of the specimens spread around the steel pipe. The test piece can be felt by hand near the middle of the bulge, but no obvious overall deformation was found. When approaching the ultimate load, a clear pressure curvature phenomenon appeared at the bottom and middle of the specimens (or near the middle position). A whole bending phenomenon occurred in some of the specimens.

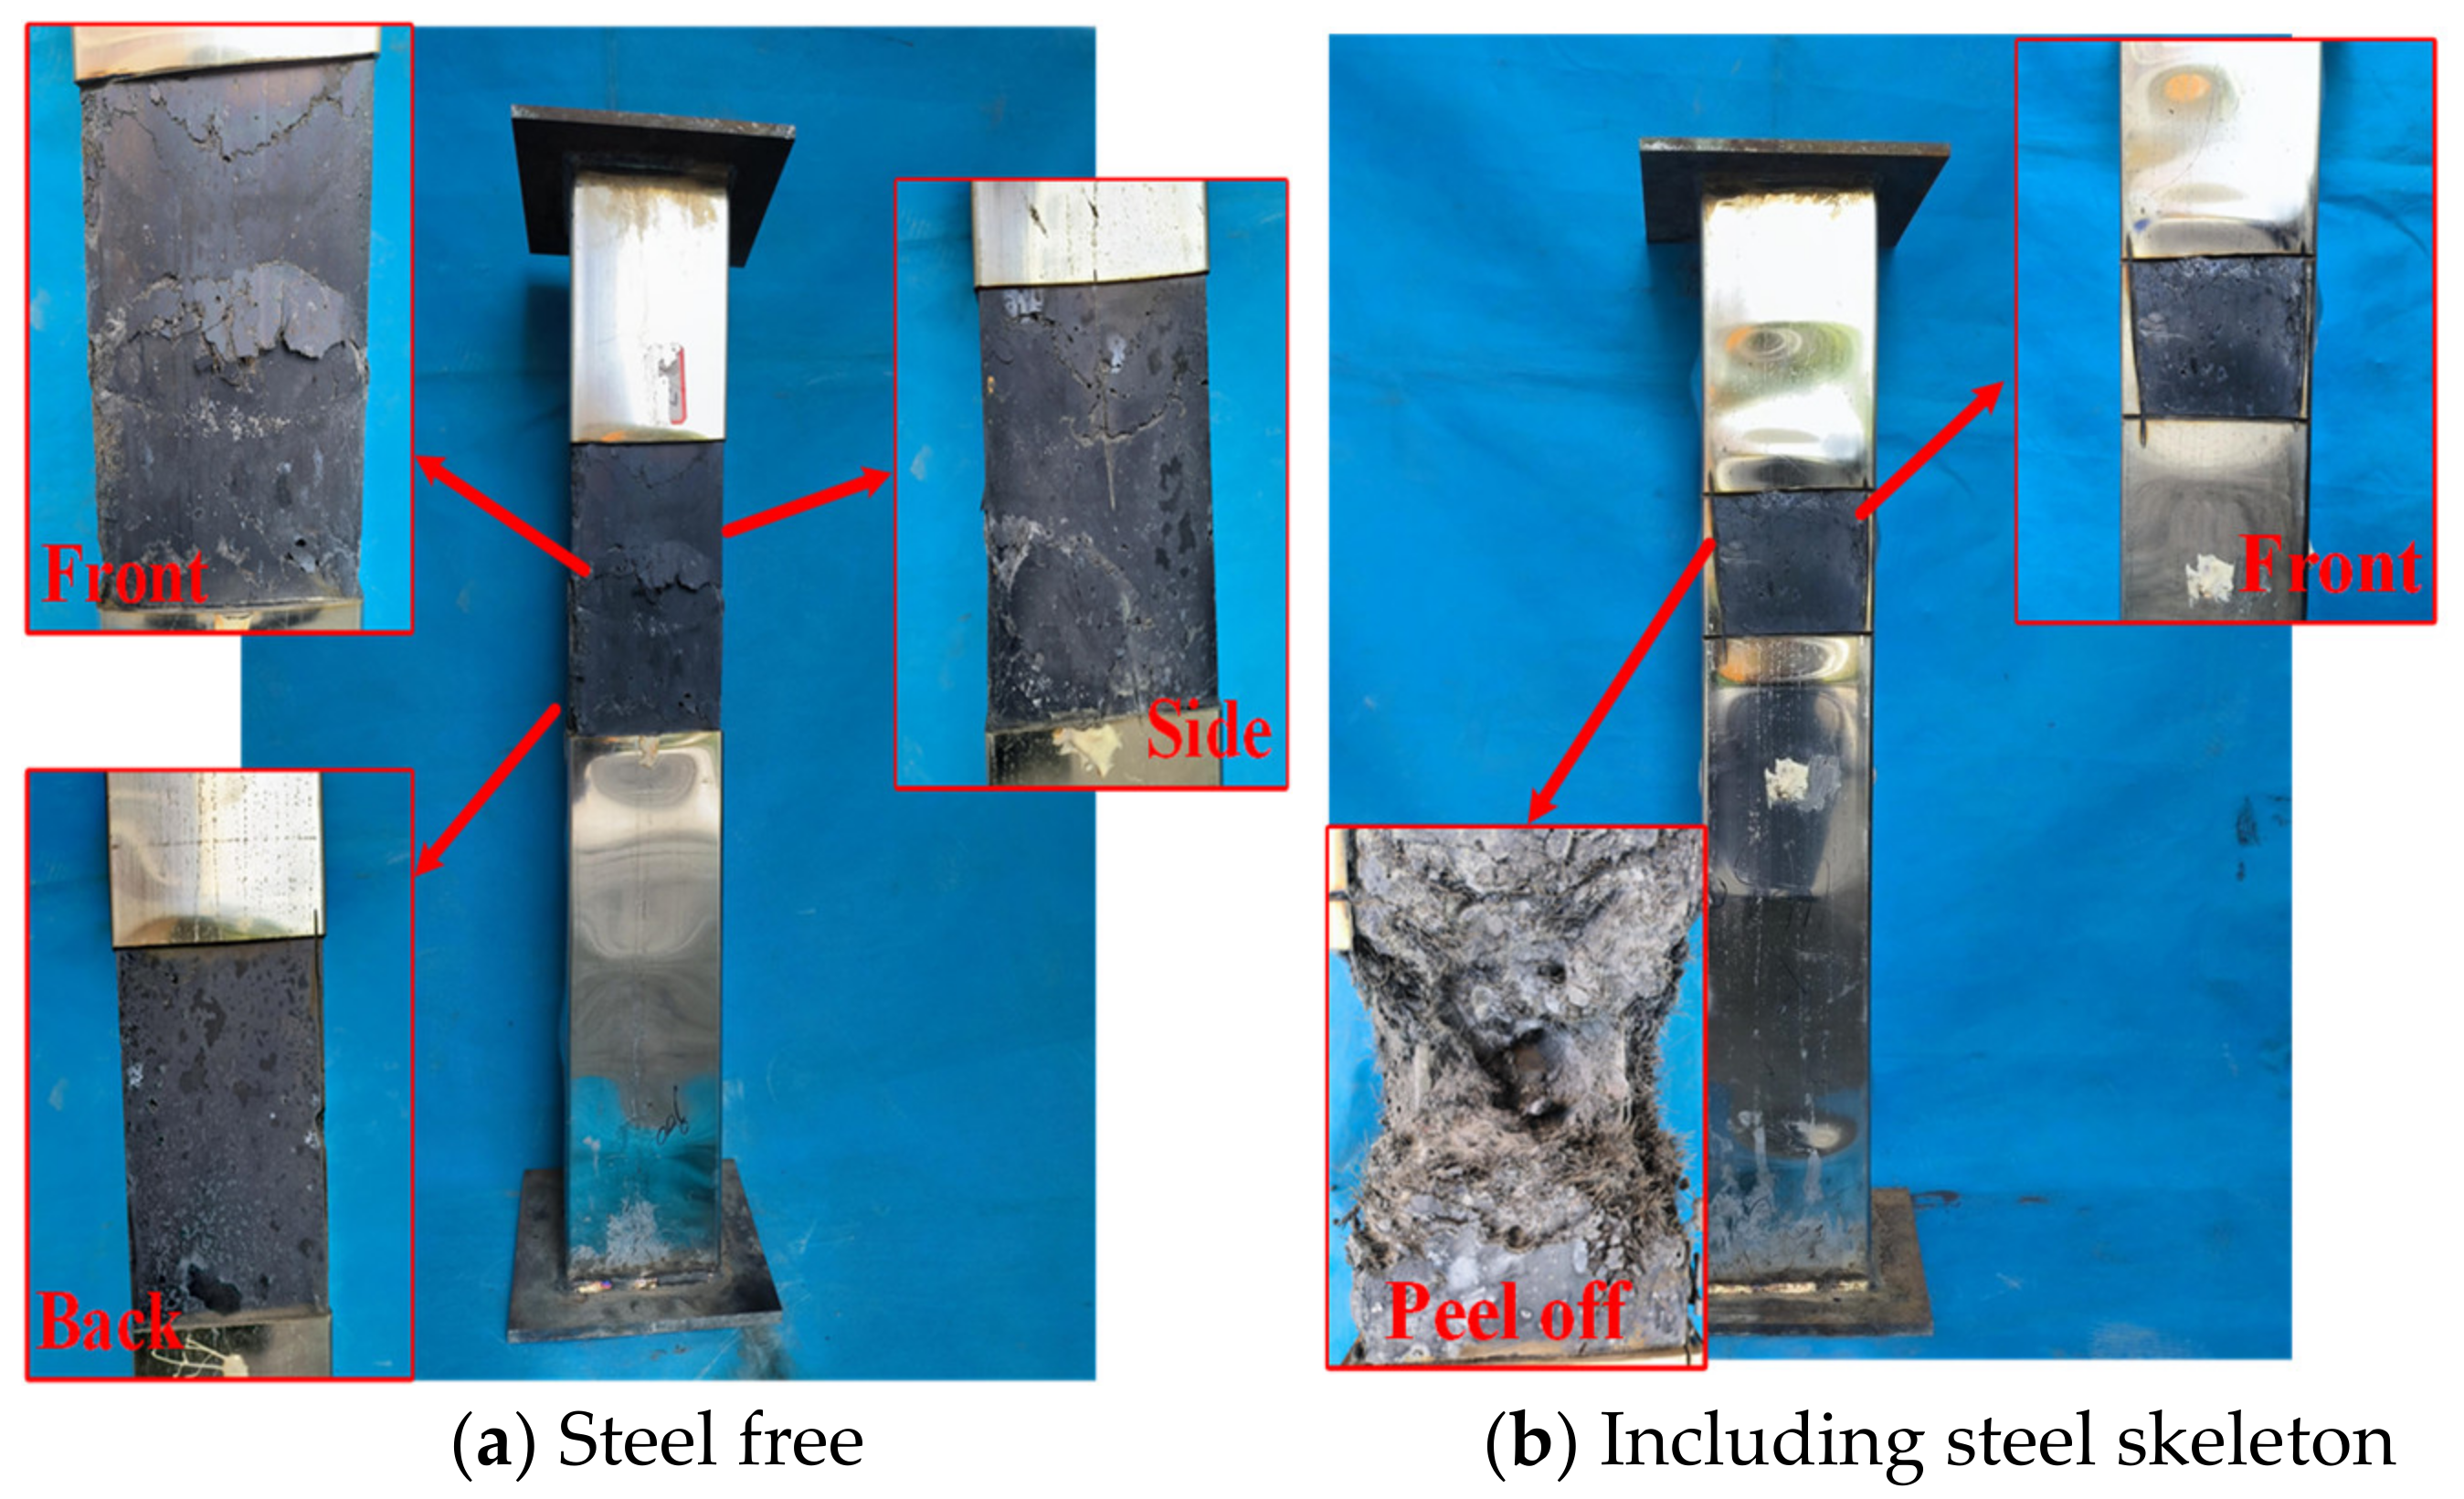
4.1.2. Concrete Failure

After loading, a typical specimen was selected and its outer steel pipe was cut to observe the failure mode of UHPC, as shown in Figure 11. Core concrete has some degree of crushing and transverse cracking at the location where the stainless-steel pipe flexes. After tensile cracking occurred, the cracked part of UHPC remained difficult to peel off, which is due to the crack bridging effect provided by steel fibers, and the cracked part could still transmit tensile force. This shows that the presence of steel fibers can inhibit the development of concrete cracks. For SR-UHPCFSSST specimens, the transverse crack in the flexural part was smaller than that of UHPCFSSST specimens, indicating that the presence of steel skeleton enhanced the ability of the specimen to resist deformation. It can be seen from the stripped concrete that even if the external concrete was damaged, there was no obvious deformation of the internal steel skeleton, and the concrete in the core area was still intact, which indicates that the failure of the stainless-steel pipe ultra-high-performance concrete column was caused by local damage to the material.

4.1.3. Failure of Steel Pipe and Steel Skeleton

Figure 12 shows the cloud chart of stress development of each component under the same coaxial load. It can be found that the stress development trend of each component was the same before the specimen reached the ultimate bearing capacity. Among the components of the test piece under the same axial load, the stresses in the built-in steel skeleton were the first to approach their material yield stresses, followed by the concrete and finally the external stainless-steel pipe. Figure 13 shows the stress cloud diagram of each component when the stainless-steel tube was bulging. It can be seen from the figure that when the stainless-steel tube was bulging, there was no obvious deformation of the steel and concrete inside the specimen. The first buckling position of the steel pipe in the finite element model is consistent with the bone buckling position in the test. The accuracy of the finite element model in this paper is thus further verified.

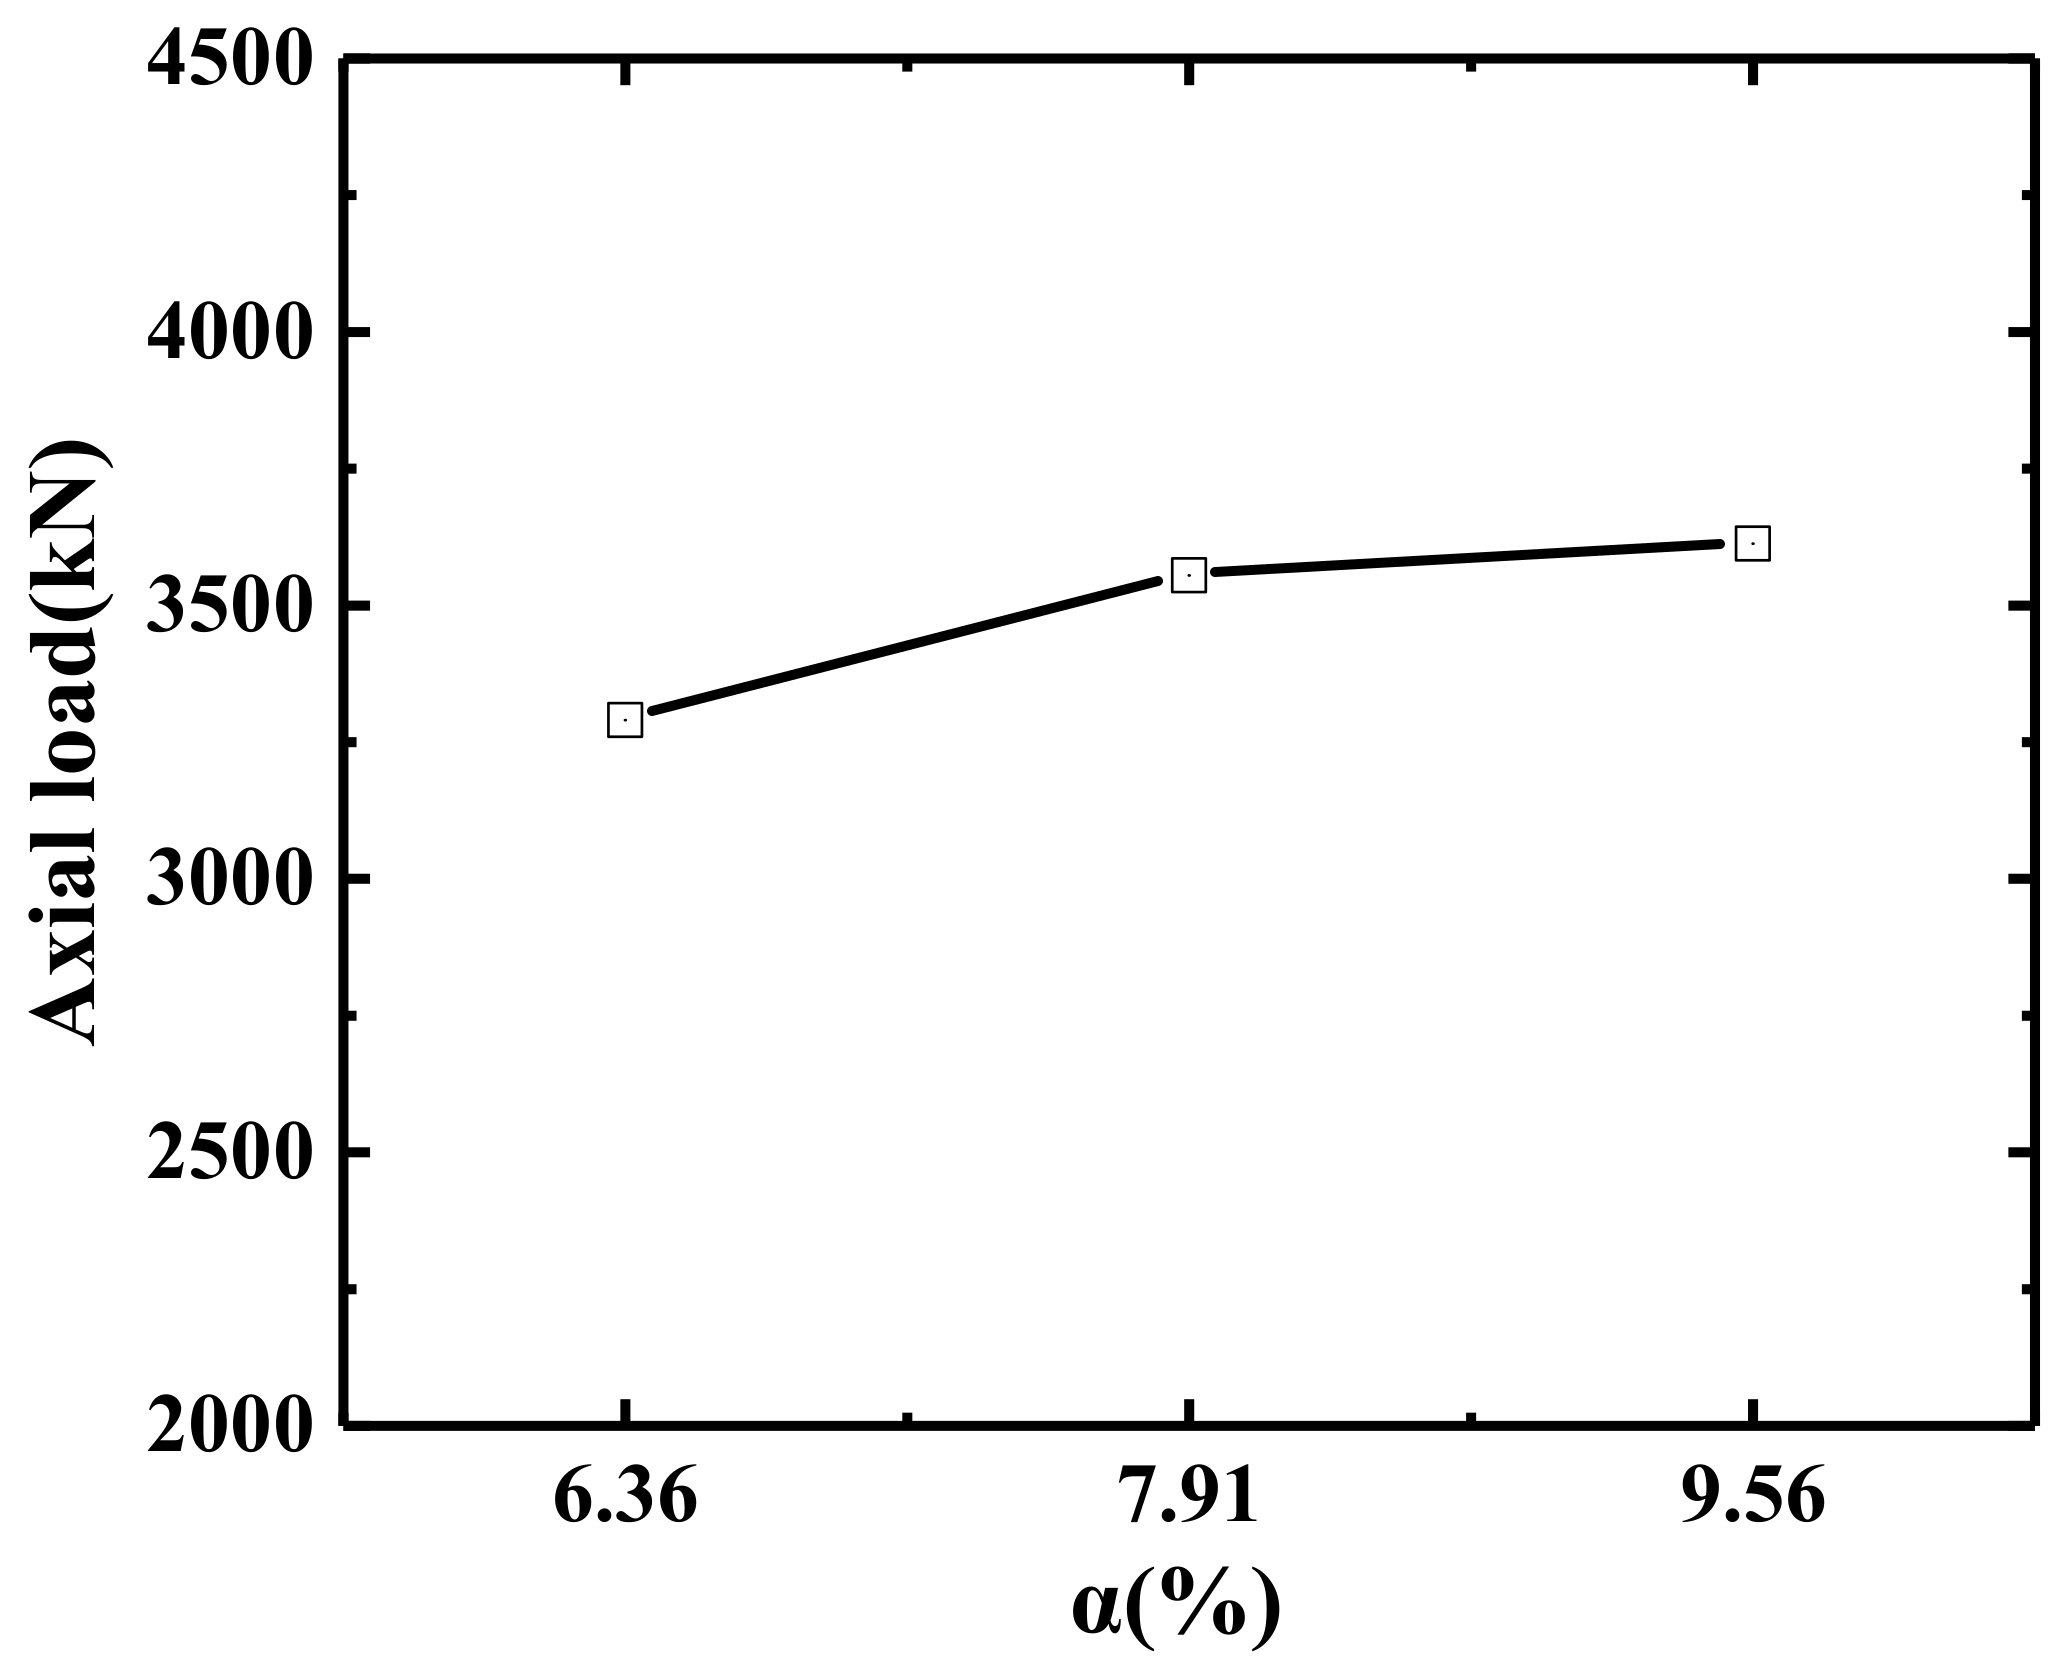
4.2. Skeleton Content
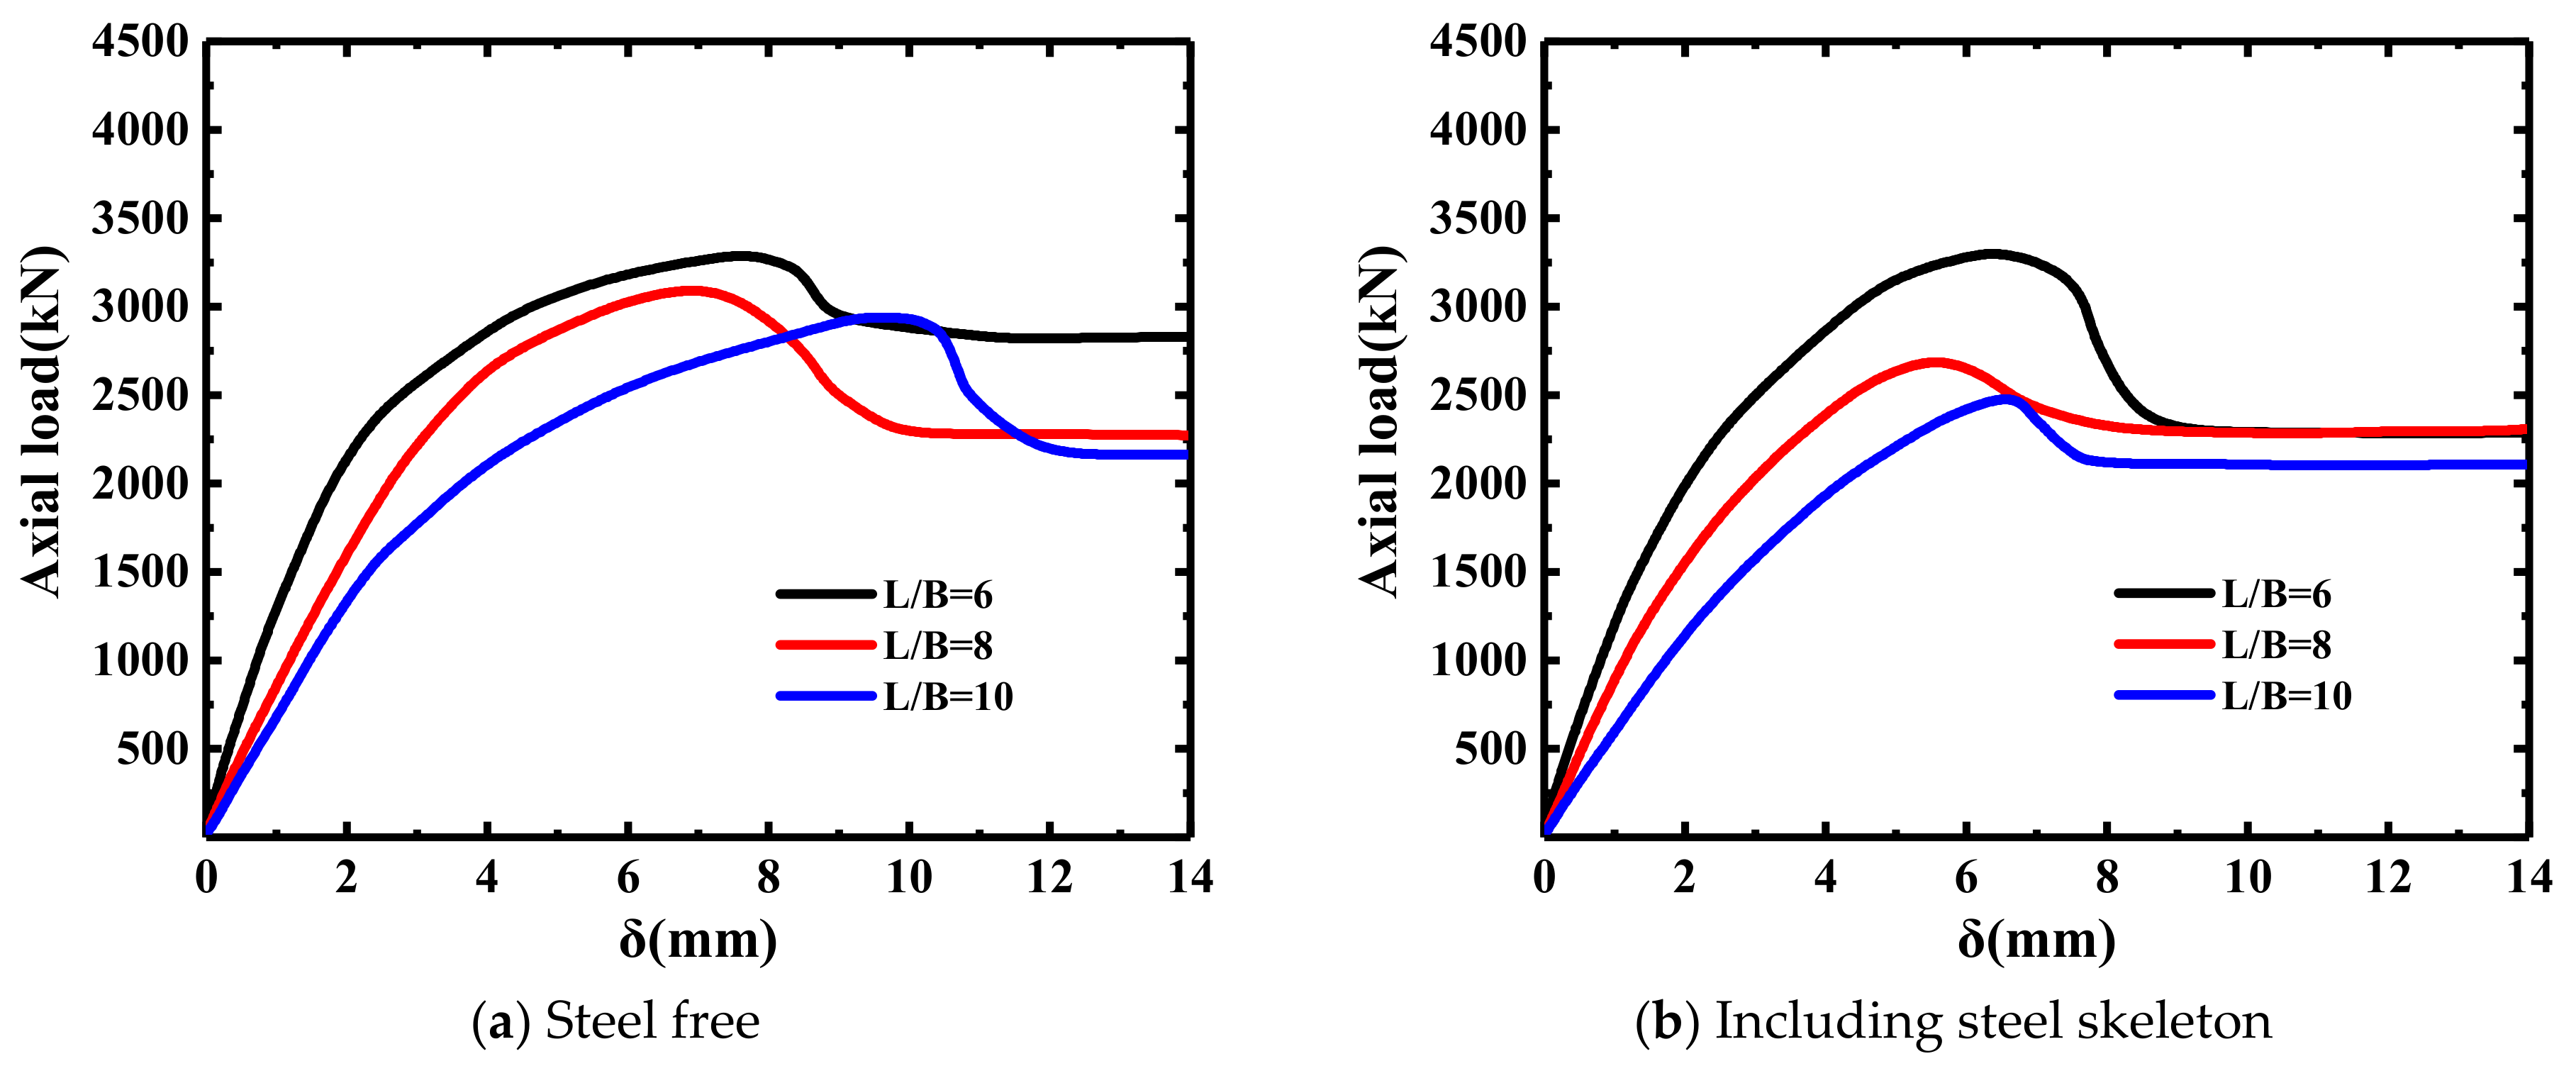
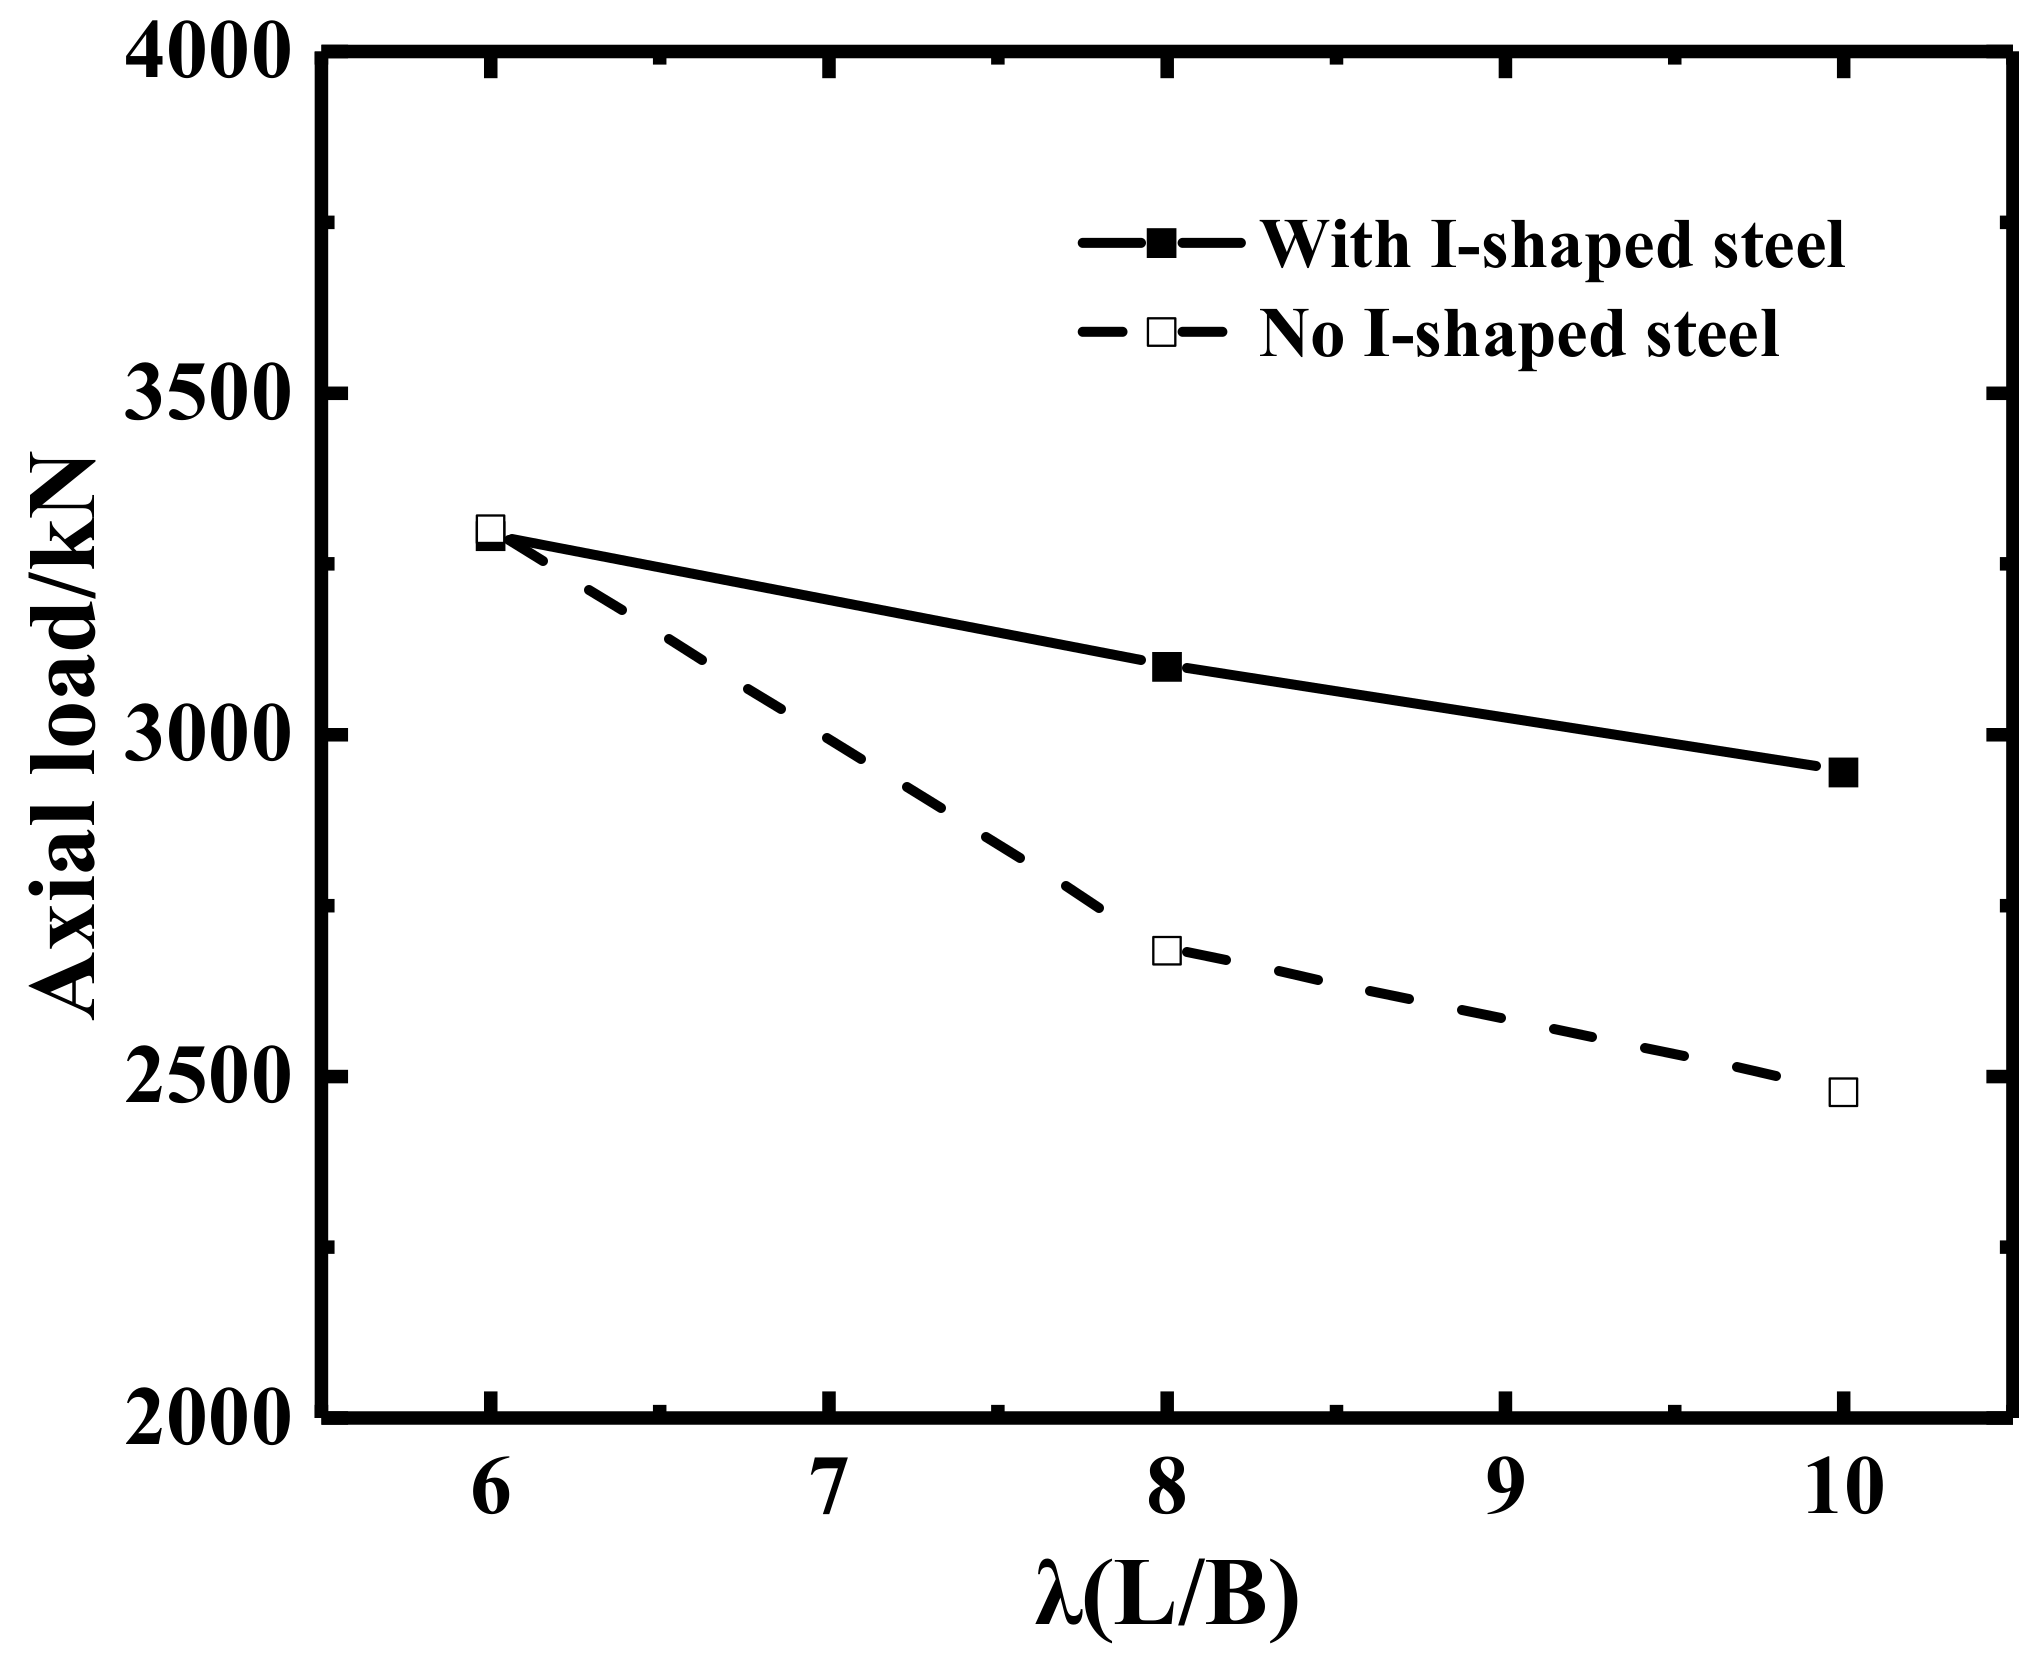
The ultimate bearing capacity increased significantly with the increase in the skeleton content. Figure 14 shows the load–displacement curves of members with different steel-skeleton cross-sectional areas. The peak loads of the curves, the displacements corresponding to the peak loads, the descending velocities, and the residual strengths all changed significantly. Figure 15 shows the variation of the limited bearing capacity of specimens with different skeleton content rates. According to the analysis in Figure 15, when the skeleton content increased from 6.36% to 7.91% and 9.56%, the ultimate bearing capacity of the component increased by 8.06% and 9.81%, respectively. This showed that with the increase in the skeleton content, the ability of the specimen to resist deformation under the action of axial load was enhanced, and the ultimate bearing capacity of the specimen was improved.

4.3. Aspect Ratio

Figure 16 shows the load–displacement curves of the members with different length-to-diameter (L/D) ratios. With the increase in the L/D ratio, the rising section of the curve increased more slowly, the peak load decreased, the moment when the member reached the peak load was advanced, and the degree of material strength was reduced. From the analysis of Figure 17, it can be seen that, when the L/D ratio changed from 6 to 8 and from 6 to 10, the ultimate bearing capacity of the SR-UHPCFSSST members decreased by 5.80% and 10.50%, respectively, and the ultimate bearing capacity of the UHPCFSSST members decreased by 18.7% and 24.97%, respectively. This showed that the length-to-diameter ratio increased, the effect of the second-order effect of medium-length columns increased, the overall stability decreased, and the ultimate bearing capacity decreased.

5. Finite Element Parametric Study

The diameter-to-thickness ratios and concrete strengths of the specimens in this study were constant values, which cannot reflect the effects of the variations of these quantities on the mechanical properties of a medium-length column with a square stainless-steel pipe and ultra-high-performance concrete. Based on the numerical model established in this article and the rationality of the selected parameters, the effect of different diameter-to-thickness ratios and concrete strengths on the mechanical properties of the square-stainless-steel-pipe UHPC medium-length column was explored, and the expanded model parameters are shown in Table 8.

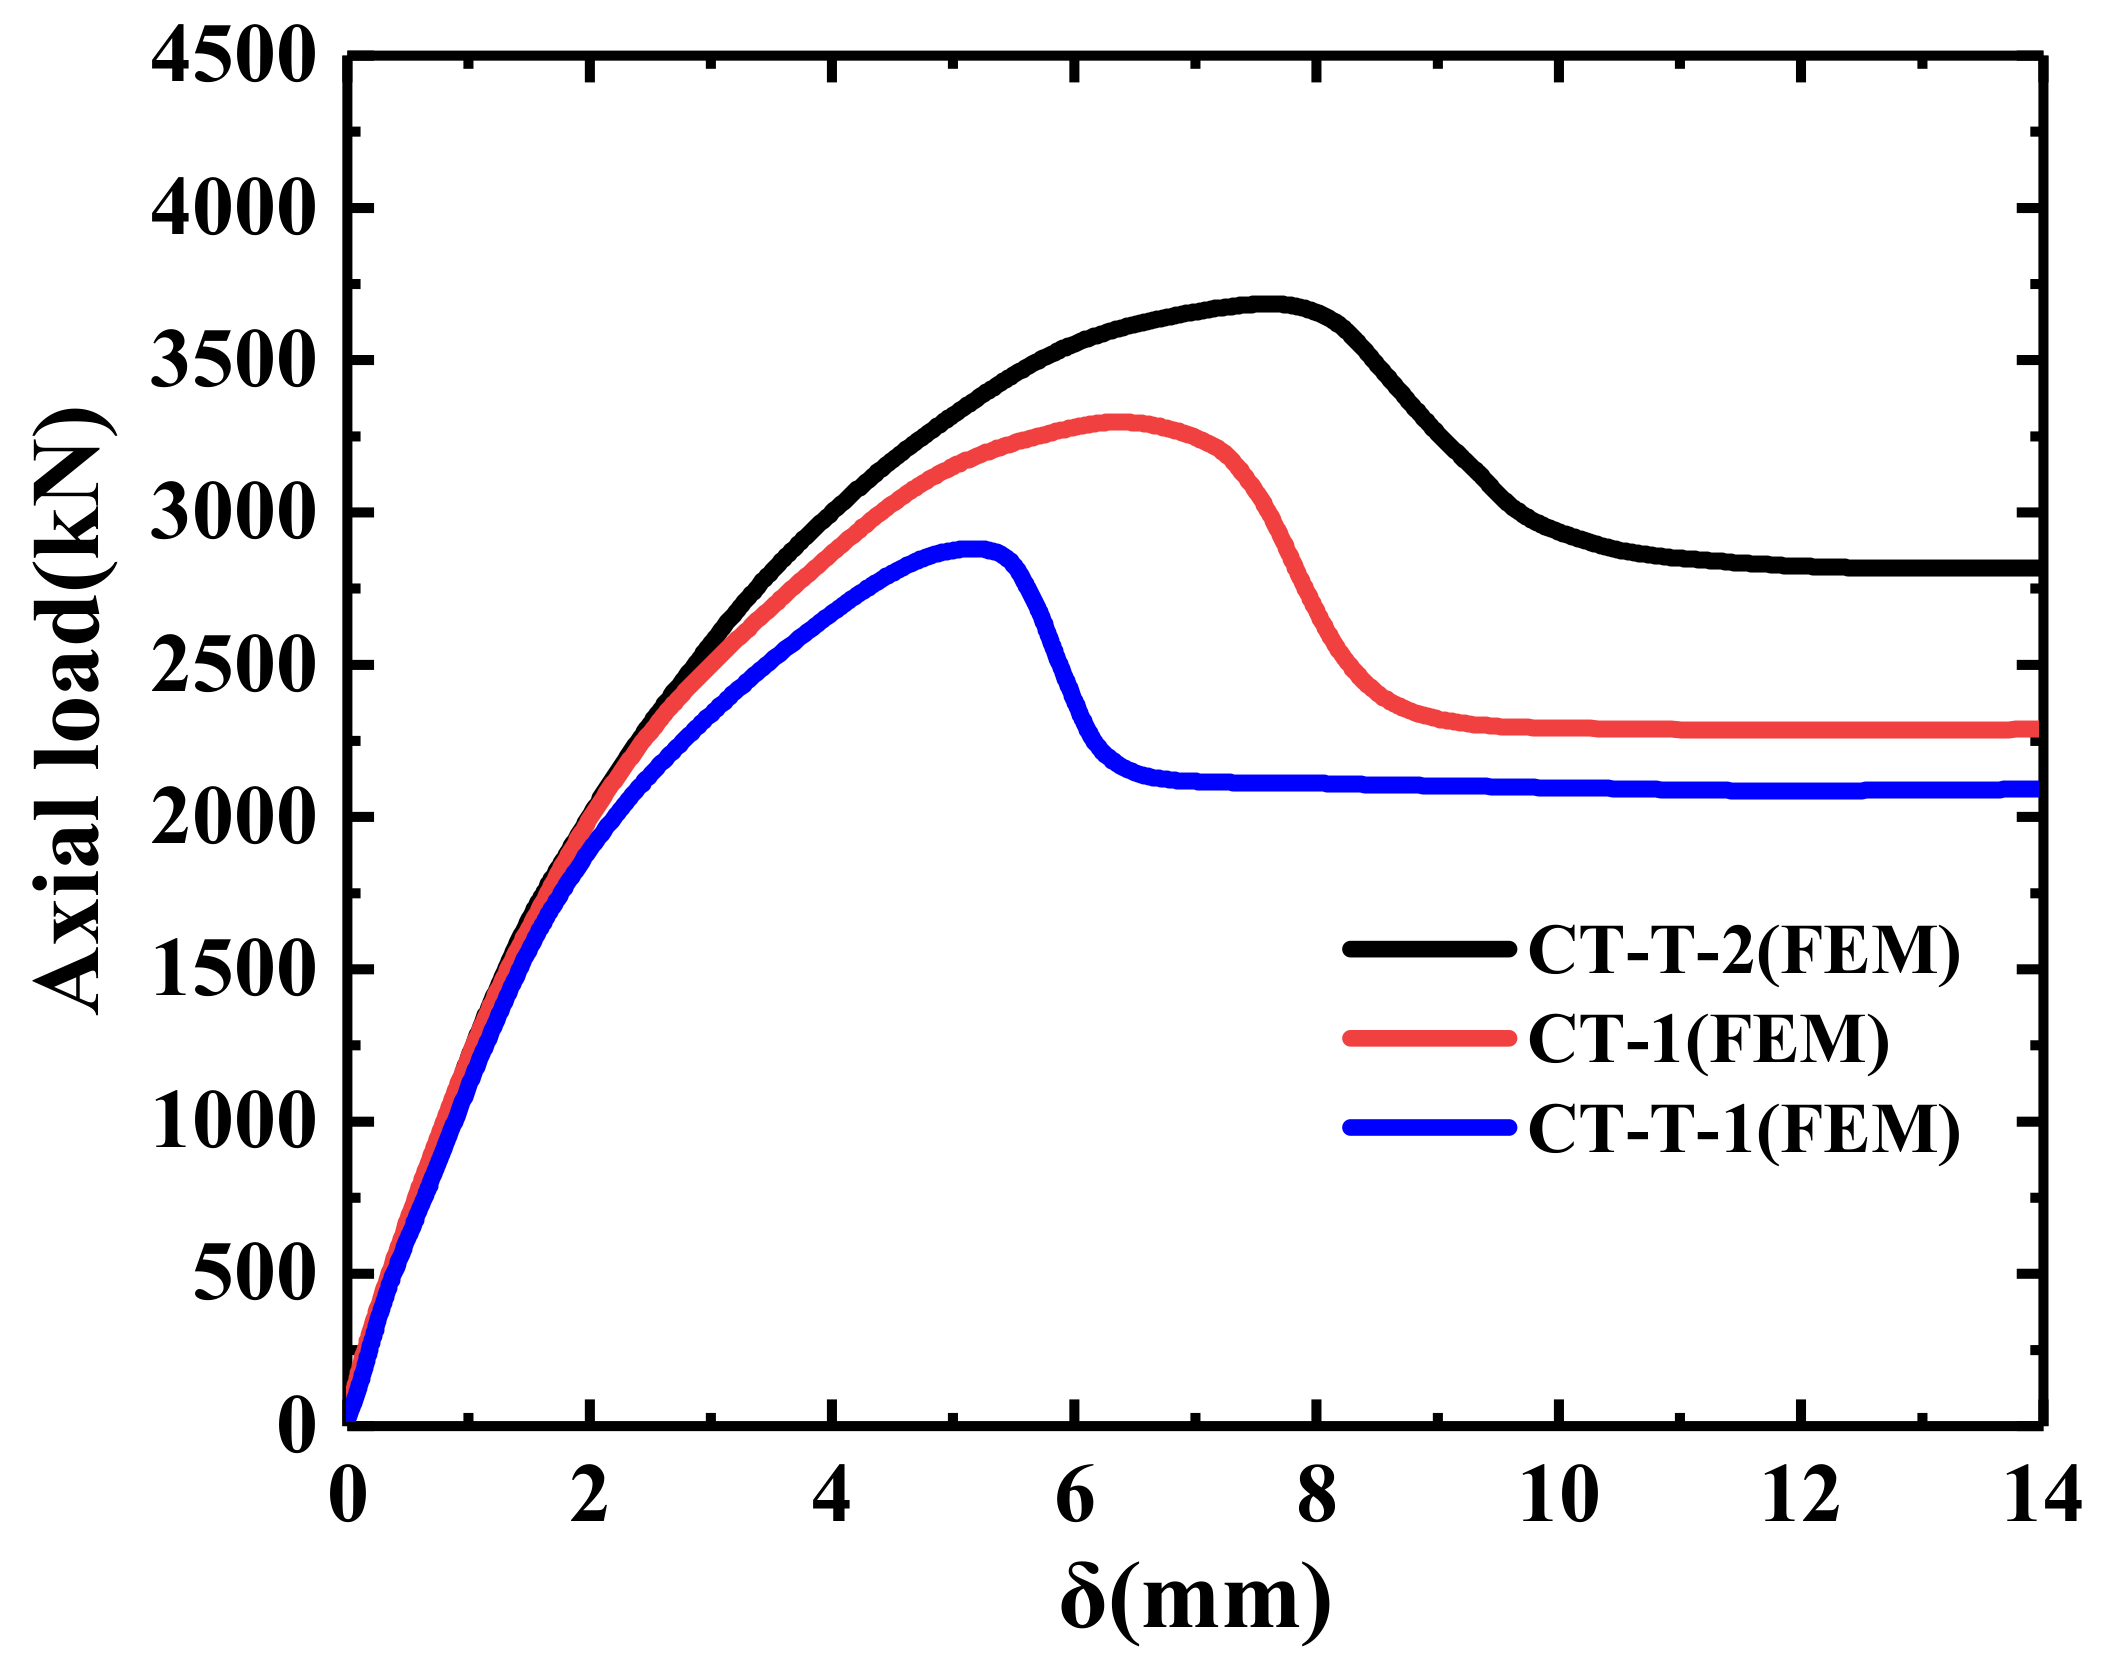
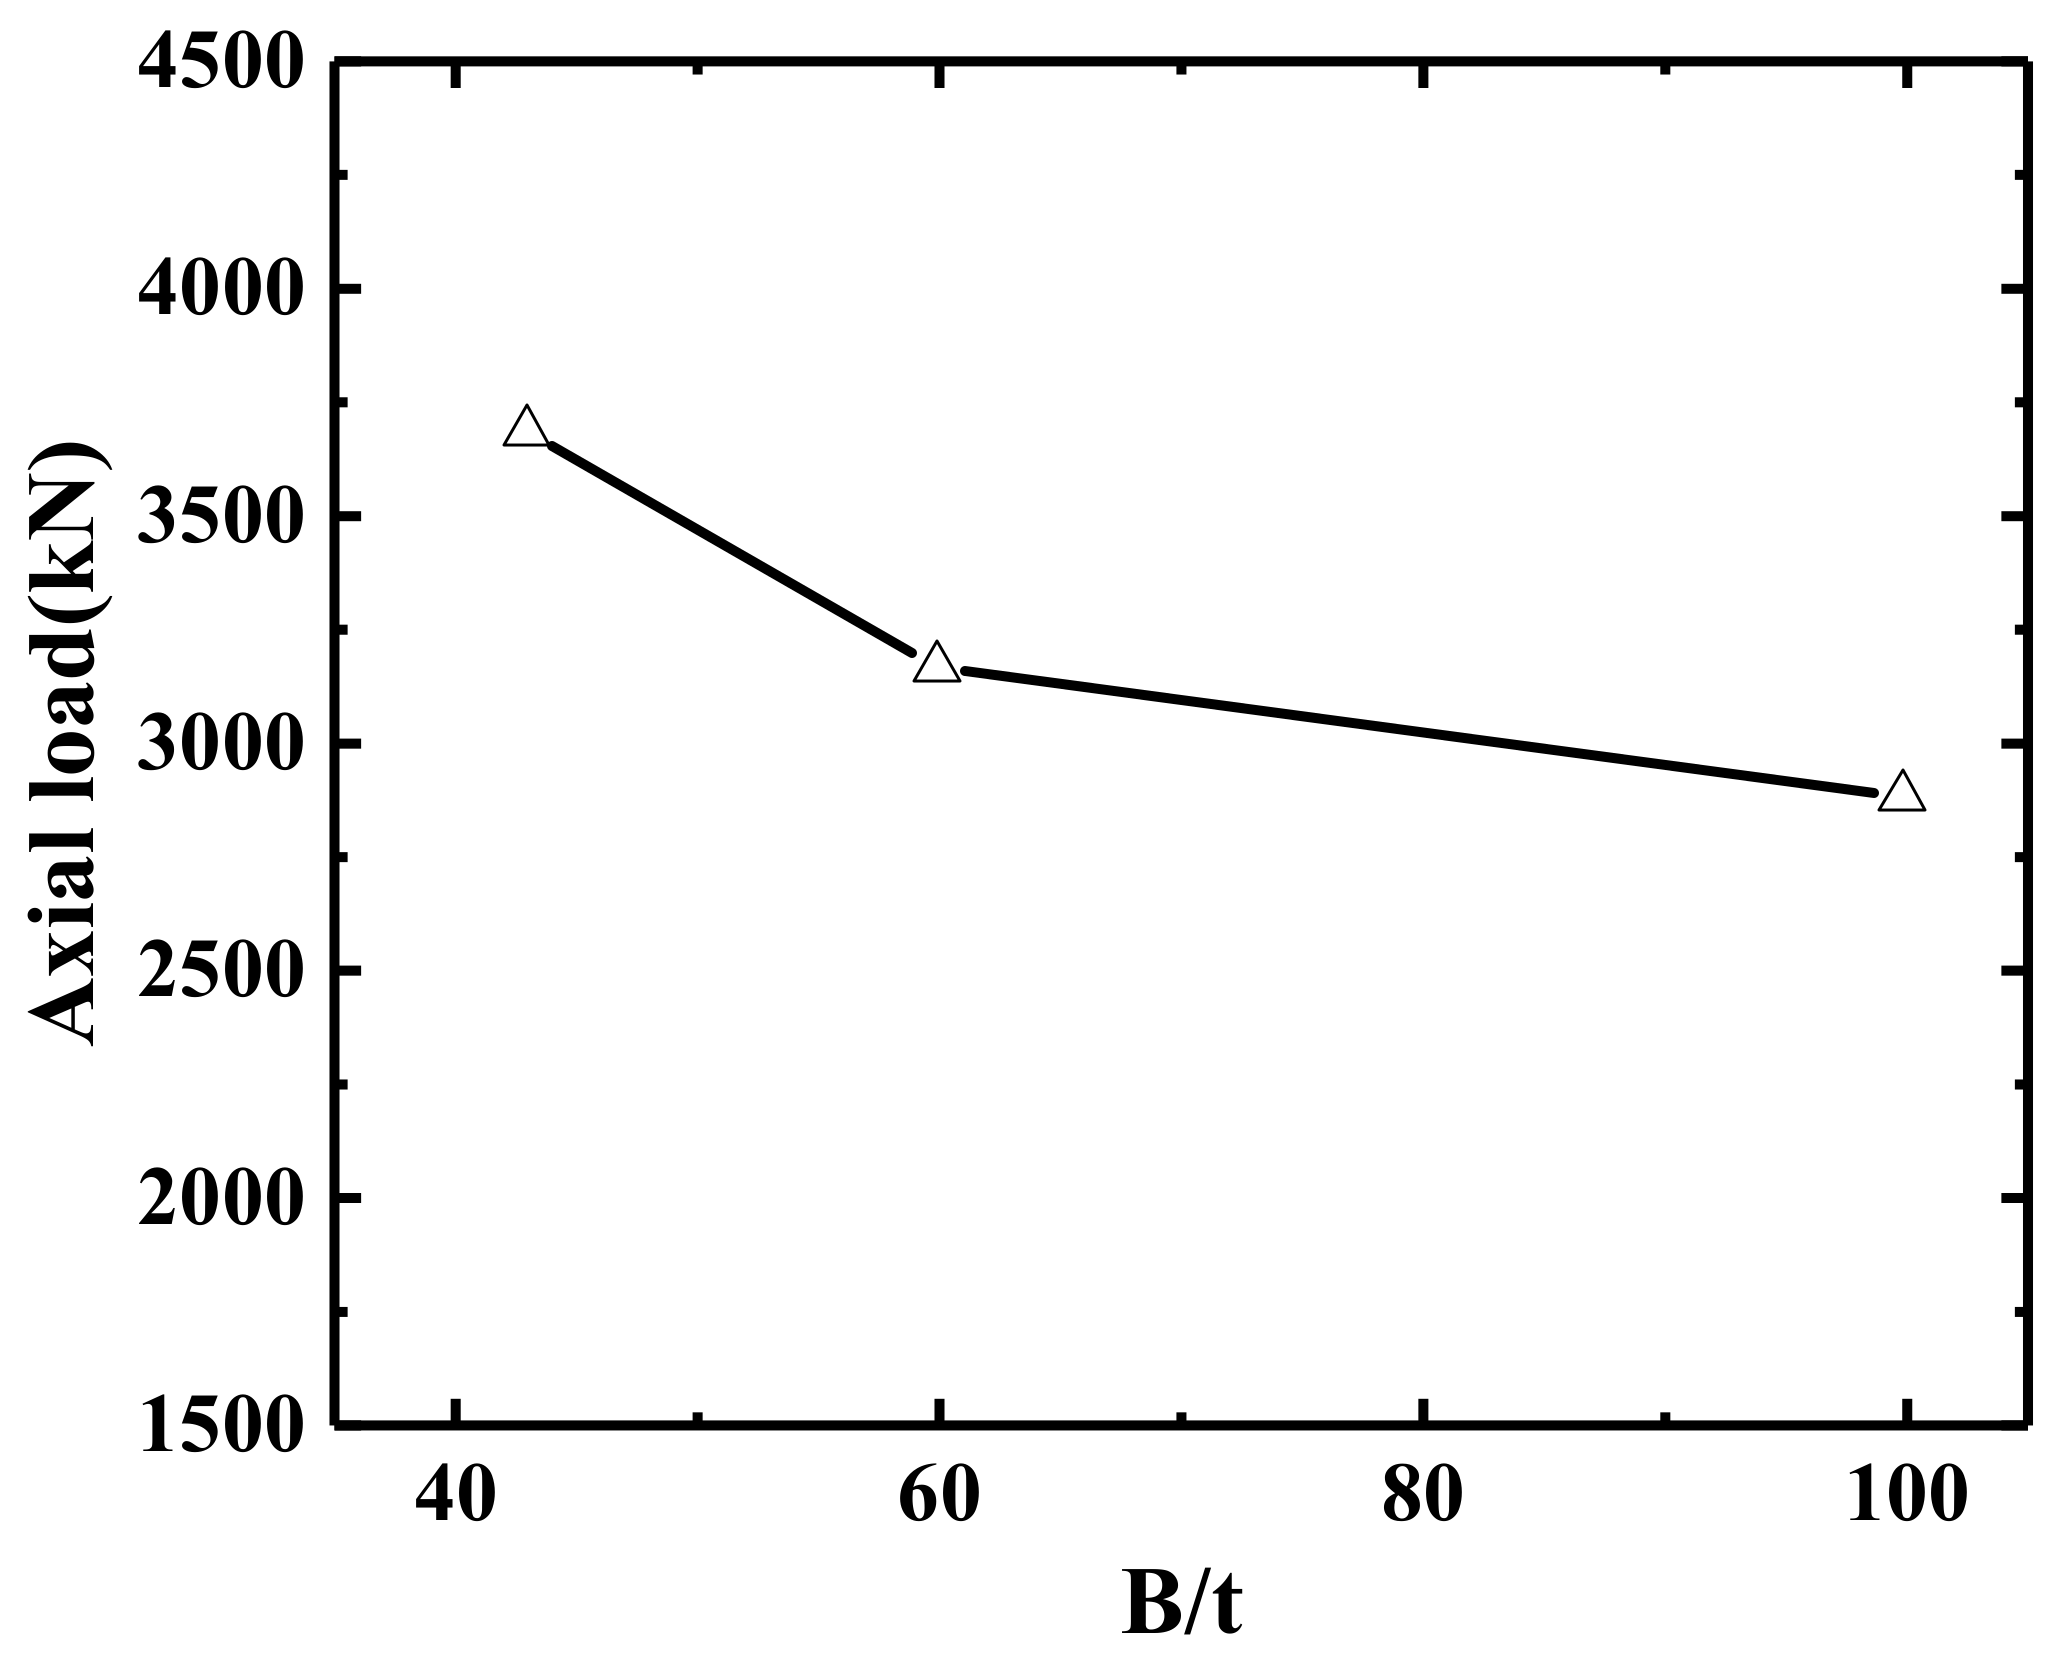
5.1. Effect of Diameter-to-Thickness Ratio

For UHPCFSSST specimens, under a continuous axial load, the steel pipe produced a circumferential restraint on the core concrete, the stainless-steel pipe produced a circumferential bulge, and the core concrete was deformed. Figure 18 shows the load–displacement curves of specimens with different diameter-to-thickness ratios. From the figure, it can be seen that as the diameter-to-thickness ratio increased, the elastic phase of the specimen became shorter, and the peak load decreased and fell more rapidly after reaching the peak. Figure 19 shows the variation of ultimate bearing capacity for specimens with different diameter-to-thickness ratios. From Figure 19, it can be seen that the ultimate bearing capacity of the specimens decreased by 14.13% and 21.86% when the diameter-to-thickness ratio increased from 43 to 60 and 100, respectively. It can be seen that the smaller the diameter-to-thickness ratio, the stronger the confinement effect of the core concrete, which increases the compressive strength of the core concrete under three-way compression and the ultimate bearing capacity of the specimen.

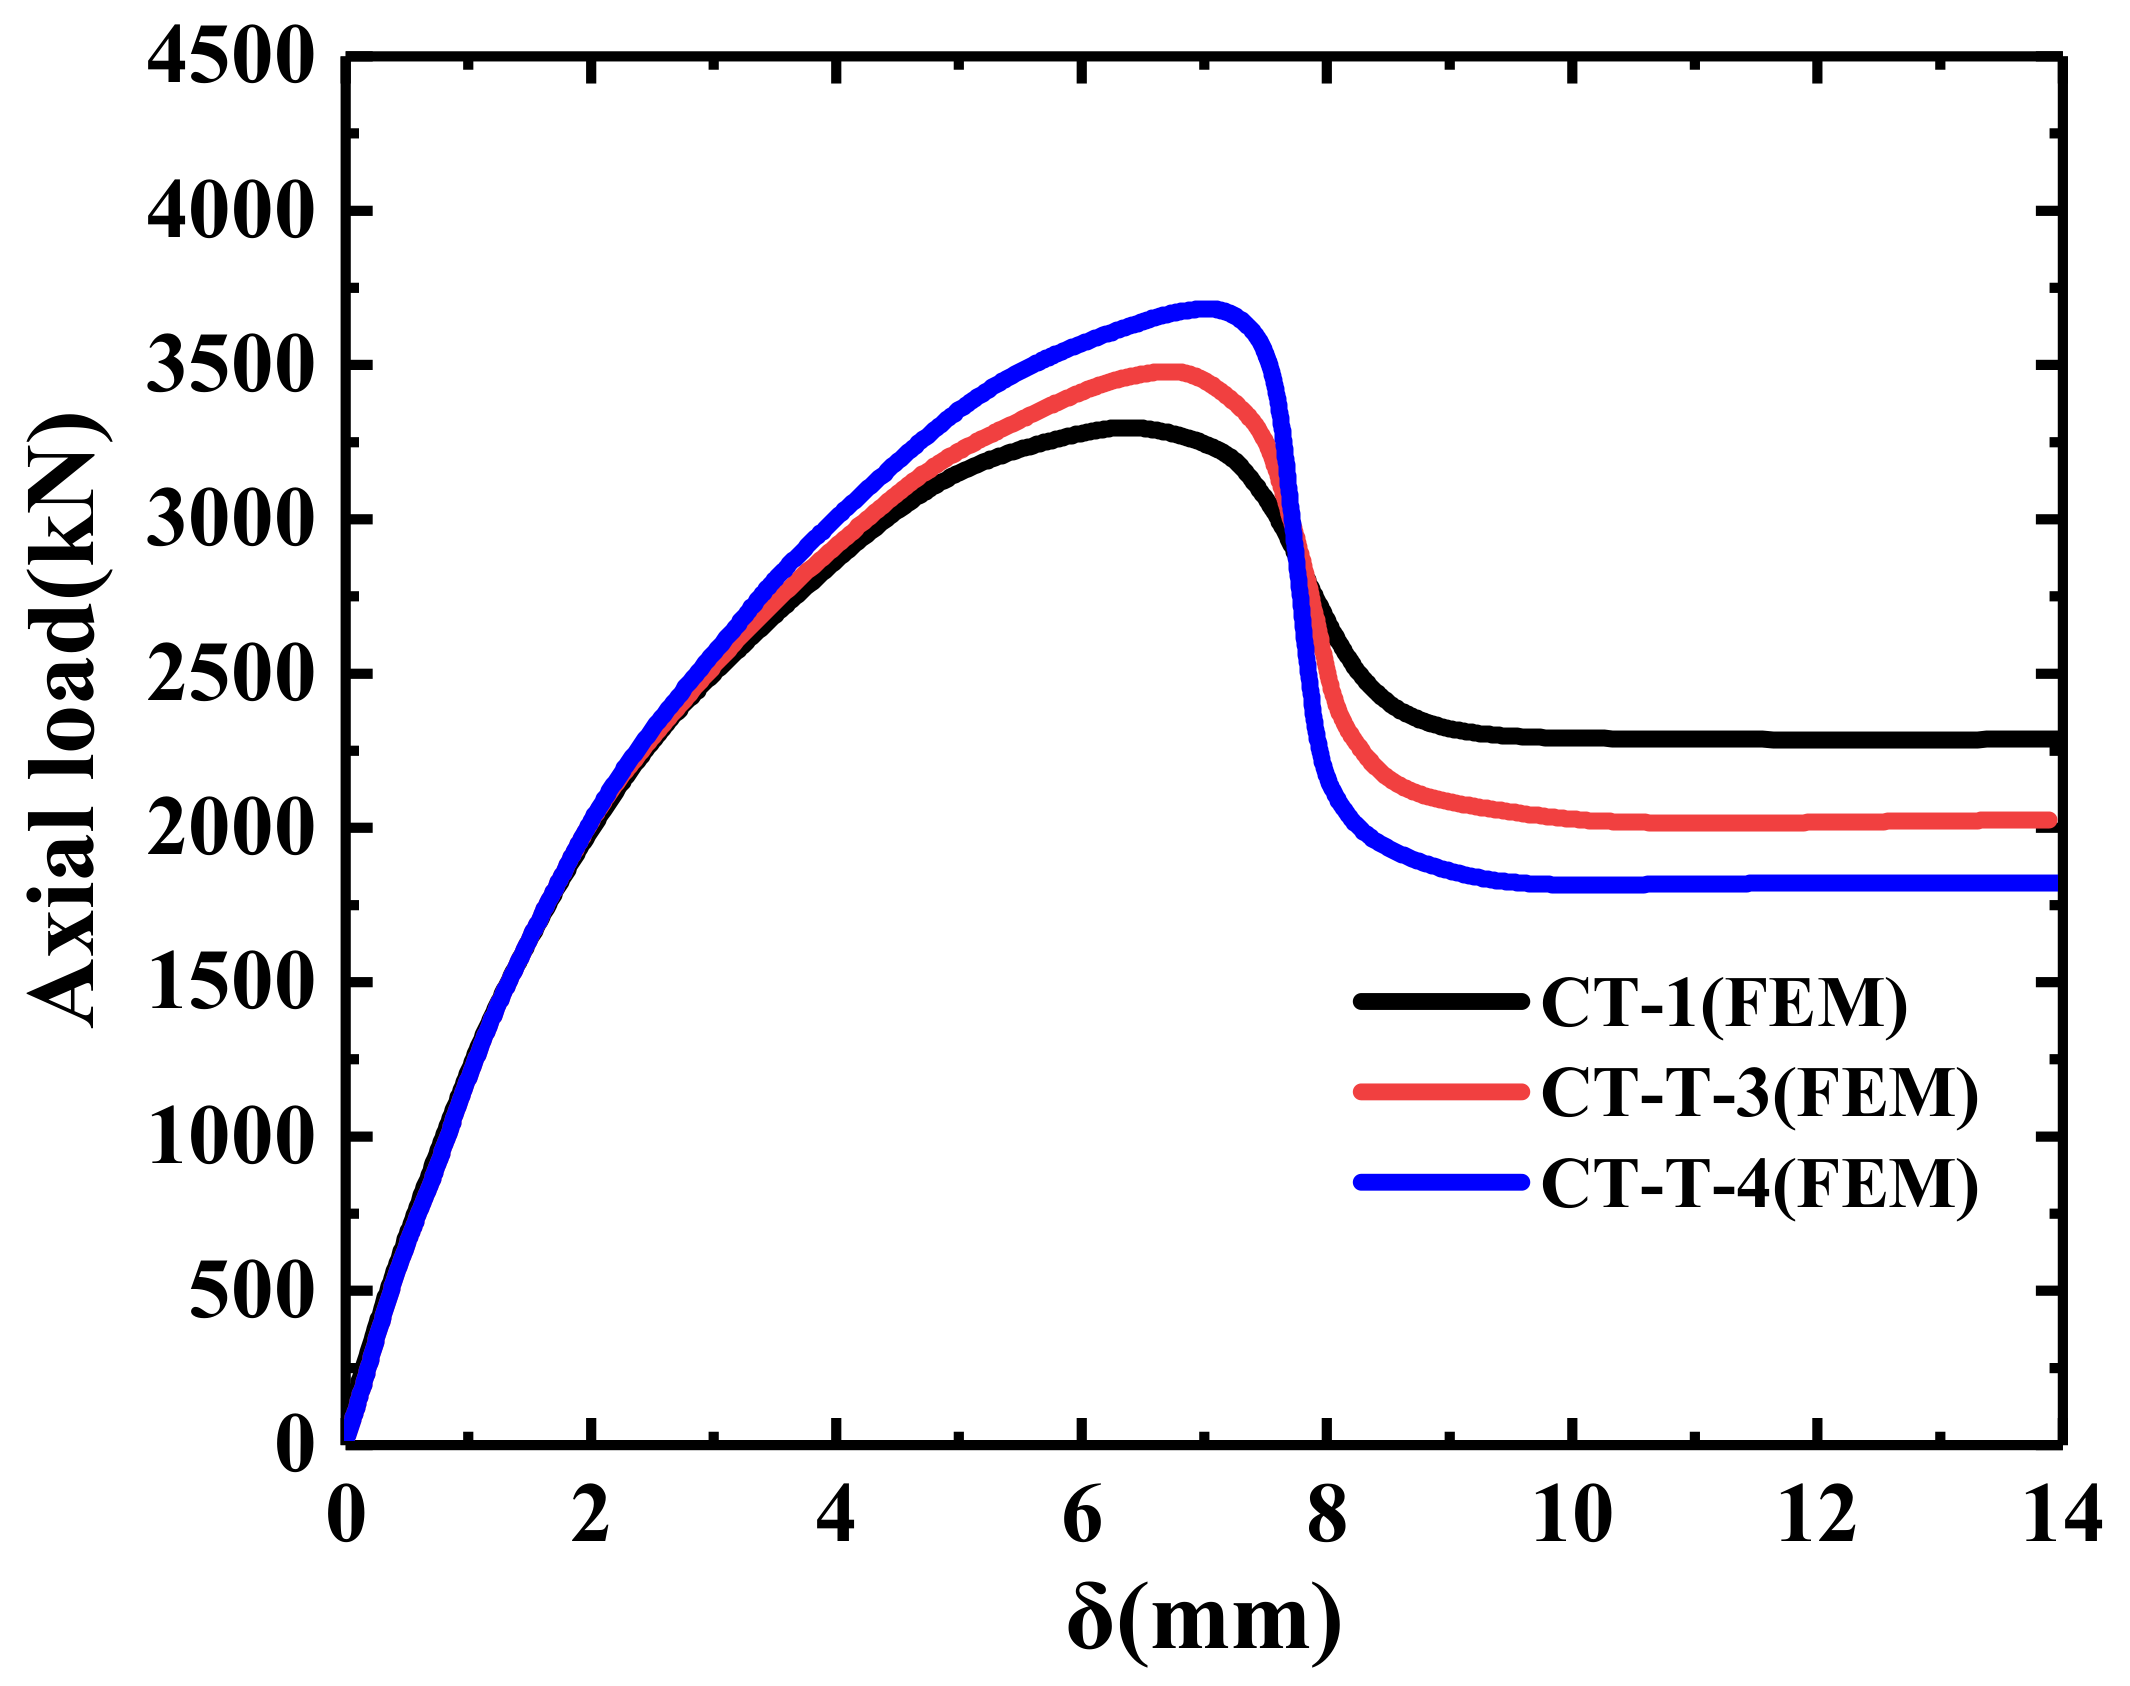
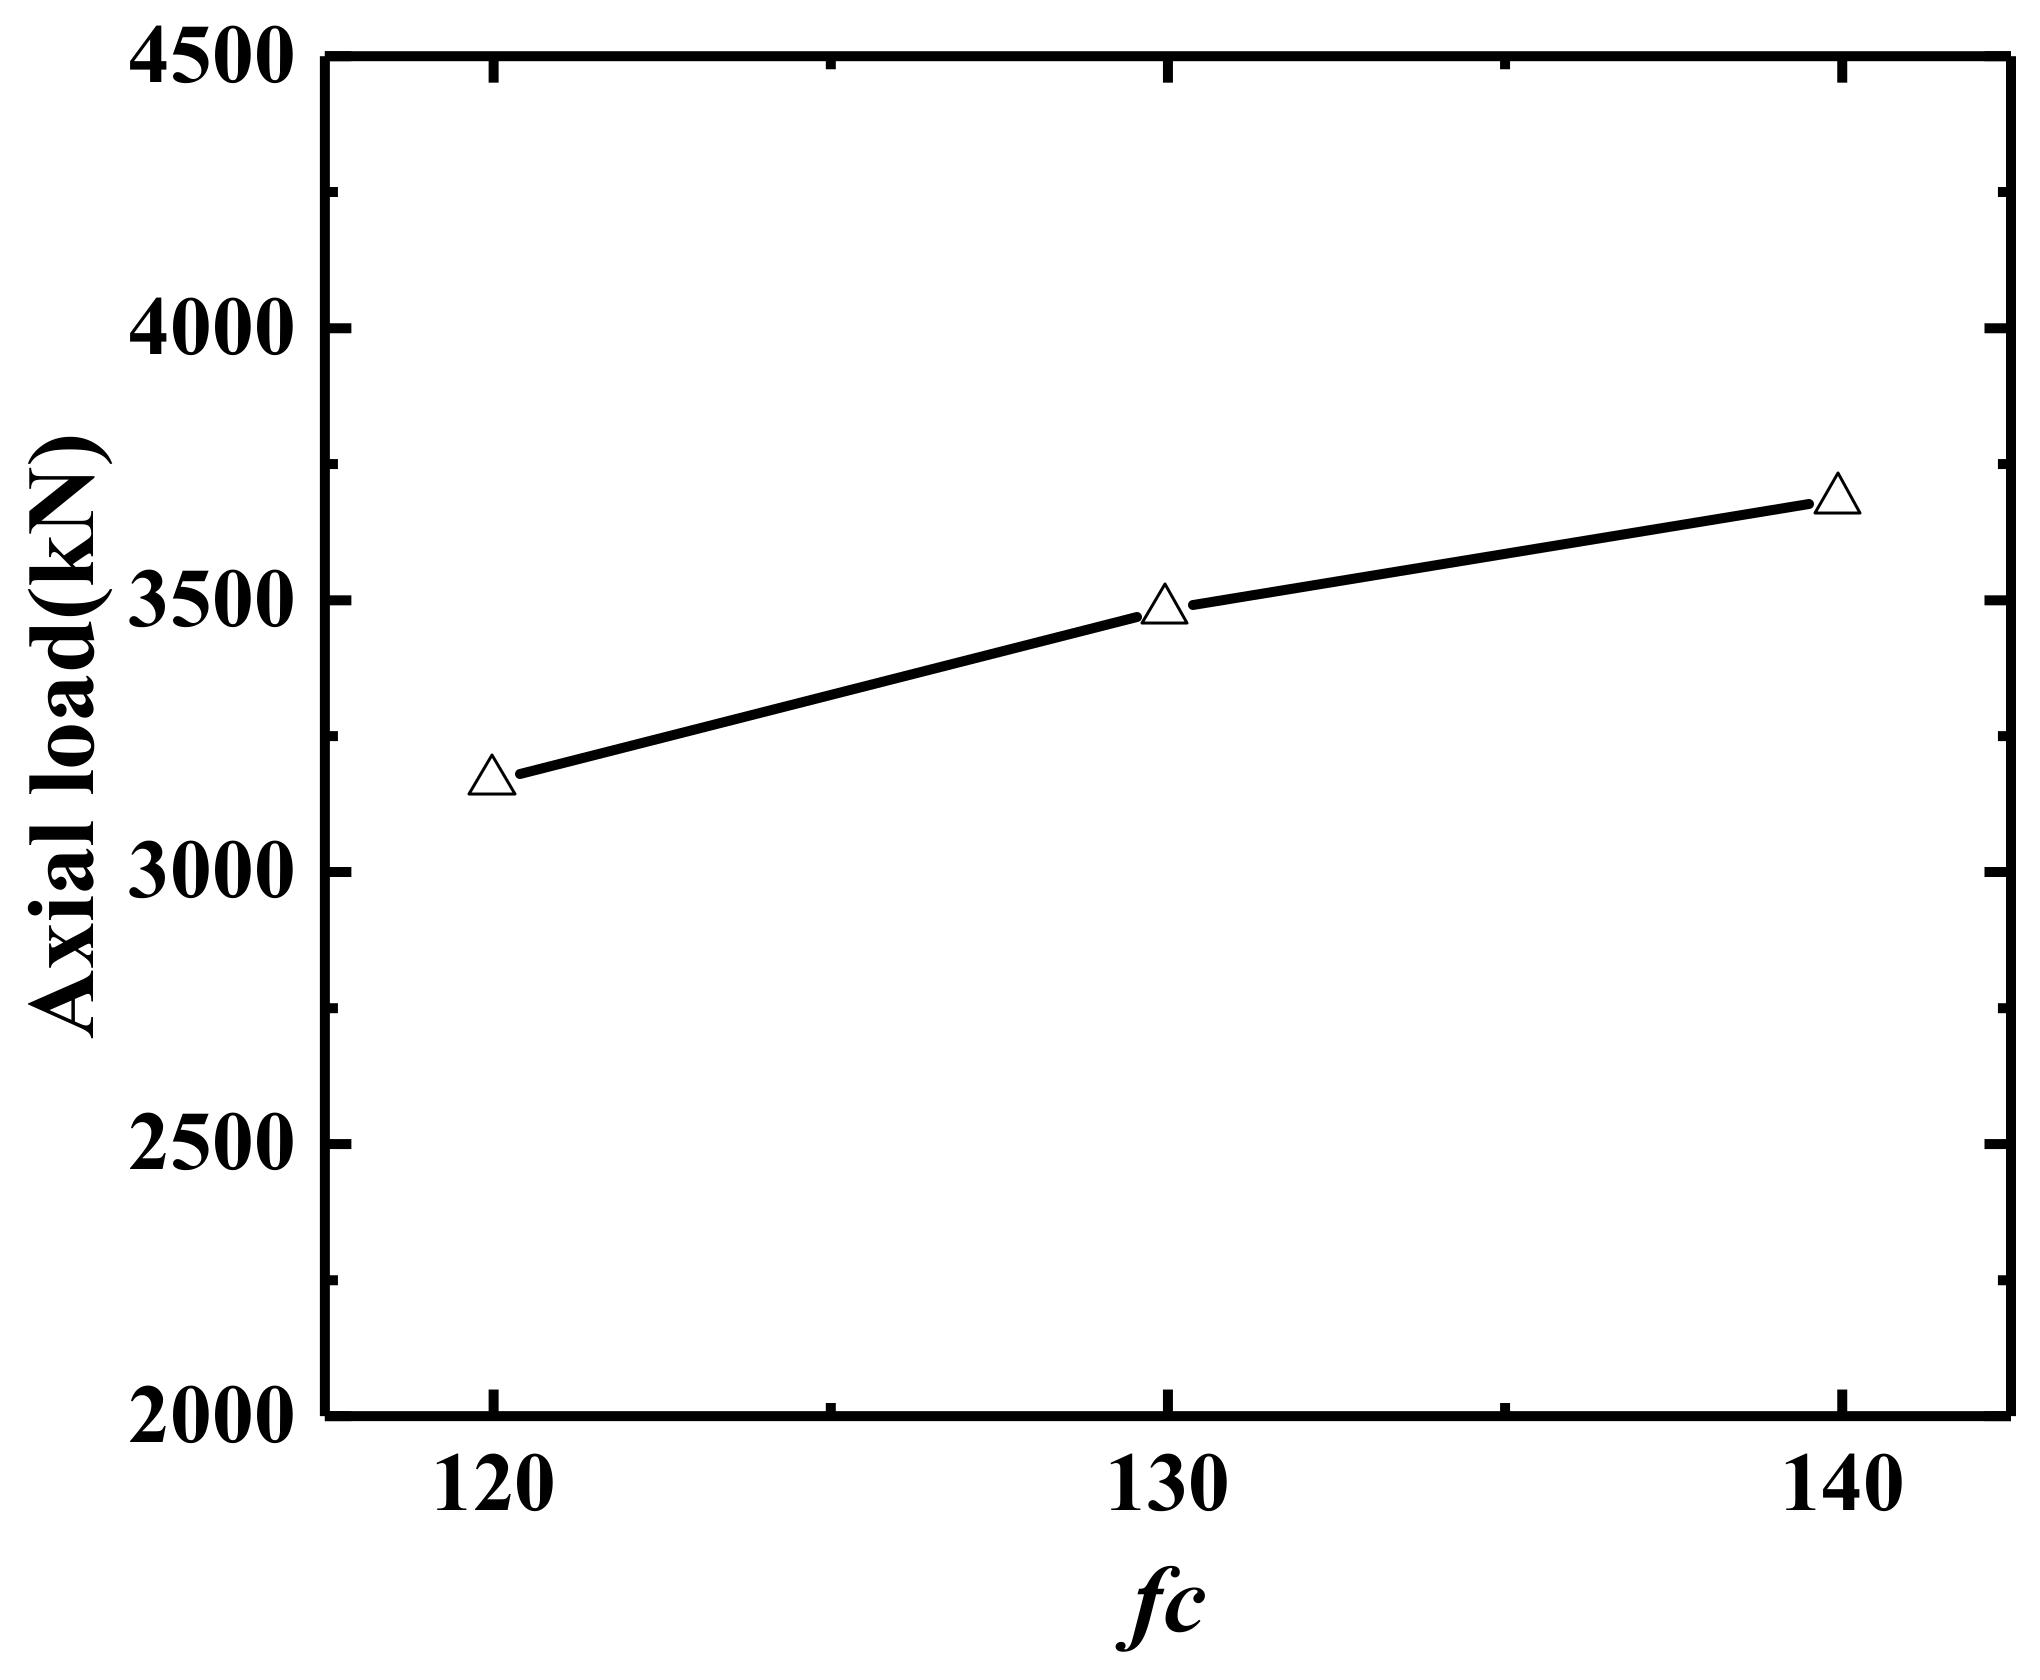
5.2. Strength of Concrete

Figure 20 shows the load–displacement curves for different coagulation strengths. As can be seen from the figure, as the strength of the core concrete increased, the displacement corresponding to the peak load remained unchanged. However, the peak load became larger, the descending speed was faster after reaching the peak load, and the residual strength decreased. Figure 21 shows the variation in the ultimate bearing capacity of specimens with different concrete strengths. From the analysis of Figure 21, it can be seen that when the concrete strength increased from 120 to 130 and 140 MPa, the ultimate bearing capacity of the specimens increased by 9.99% and 16.42%, respectively. This shows that the increase in core concrete strength can increase the ultimate load capacity of the specimen.

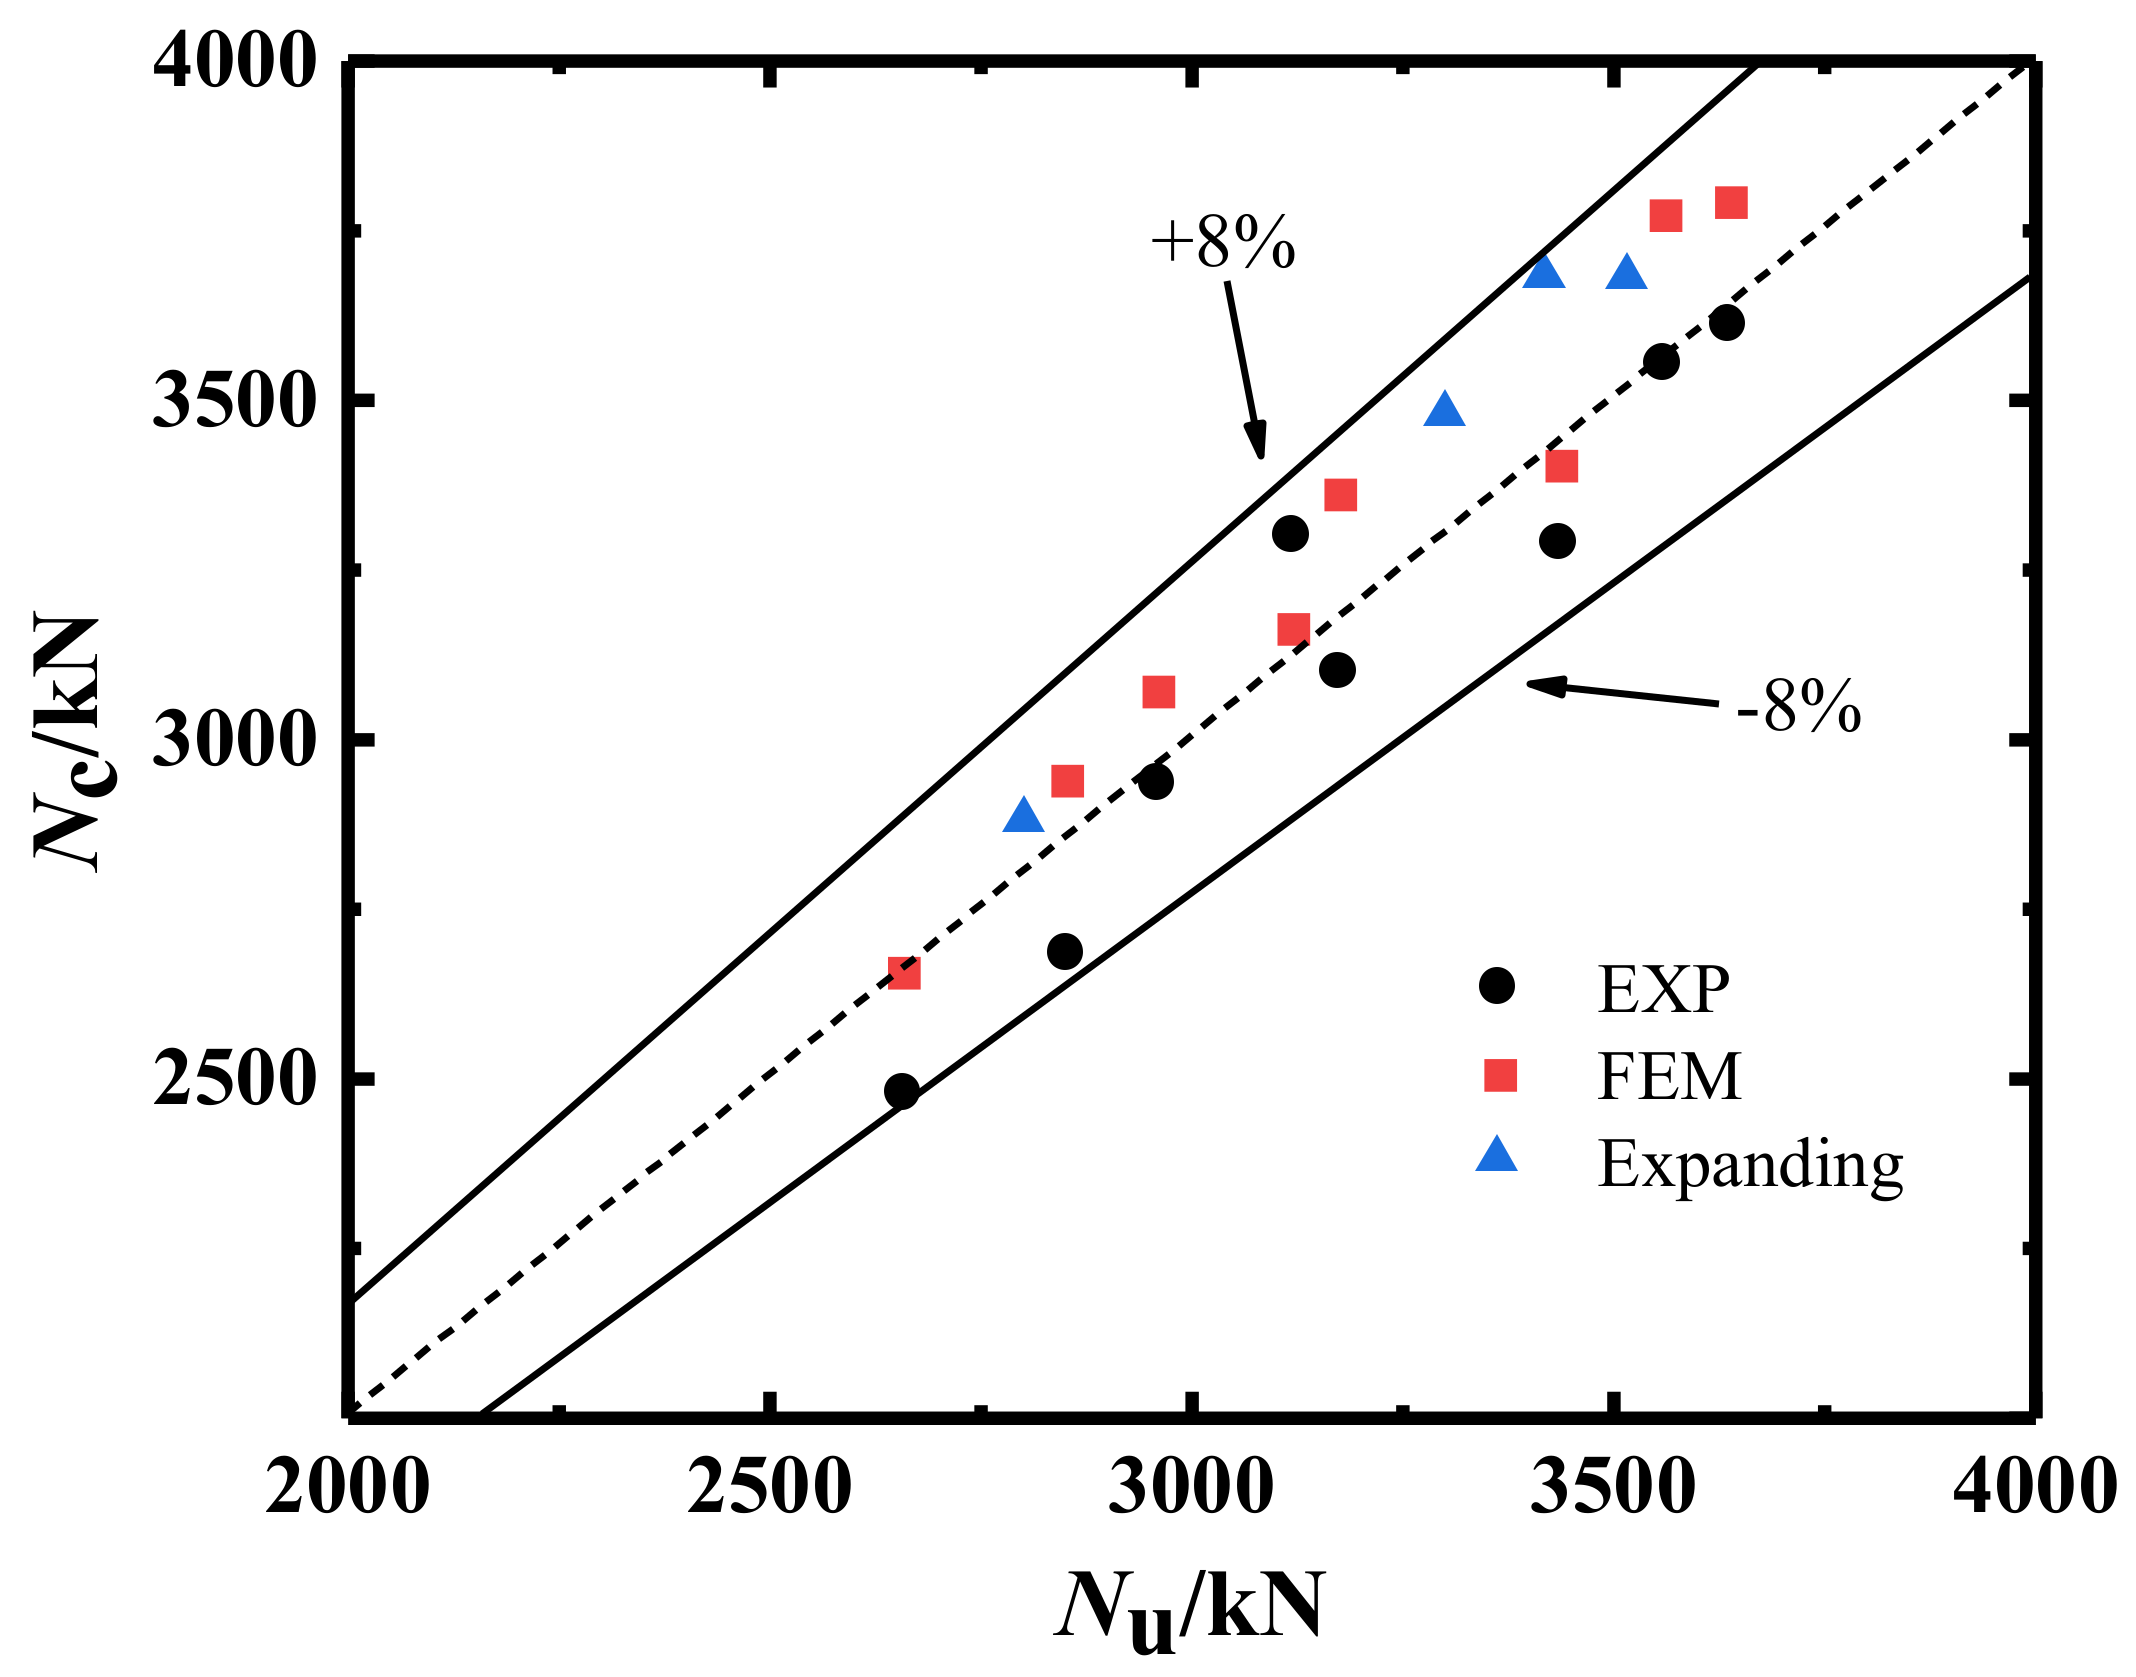
6. Load Capacity Prediction Formula

According to the Chinese technical specification for steel-pipe concrete structures (GB50936-2014) [36], the axial compression bearing capacity of steel-pipe concrete is calculated as follows:
N 0 = A s c f s c ,
where N0 is the design value of the axial compressive strength bearing capacity of the steel-pipe concrete column, Asc is the cross-sectional area of the steel-pipe concrete column, and fsc is the design value of the compressive strength of the steel-pipe concrete. The axial pressure in the built-in steel-skeleton square-stainless-steel-tube UHPC in the long column was mainly affected by the synergy of the core concrete, steel sections, and steel pipe. Thus, there is a need for a more reasonable formula to calculate the axial pressure bearing capacity of built-in steel-skeleton square-stainless-steel-tube UHPC in a long column.
Based on the above experiments and numerical simulations, to evaluate the increase in the ultimate load carrying capacity of the specimen owing to the synergistic action of the three elements, i.e., the stainless-steel pipe, core concrete, and built-in steel skeleton, the strength enhancement index SI was introduced to evaluate the load carrying capacity of the composite section relative to the total strength of the individual components, as follows:
S I = N u f c k ,
S I = φ β 1 + ξ α ,
f c k = A s σ 0.2 + A c f c + A s s f s y ,
where As, Ac, and Ass are the cross-sectional areas of steel pipe, concrete, and steel skeleton, respectively; σ0.2 is the yield strength of stainless steel; fc and fy are the yield strengths of the concrete and steel skeleton, respectively; Nu is the ultimate bearing capacity of steel-pipe concrete; the impact factor α = Bt/L, β is the constraint factor; φ is the discount factor [37]; fck is the combined strength; and ξ is the constraint index. φ is calculated as follows:
a = 1 , φ = 1 0.023 L / B 4 ( 4 < L / B 38.5 ) .
Wei et al. [38] provided the following formula:
f c c f c o = 1.2 + 2 ξ + 0.49 ξ 2 ,
where fcc is the compressive strength of restrained concrete, and fco is the compressive strength of unrestrained concrete. The following equation can be obtained:
N u = φ β 1 + ξ α A s σ 0.2 + A c f c + A s s f s y .
By linear regression of the results of the experiments and numerical analysis, the following was determined:
β = 1.0 With   I - shaped   steel 0.95 No   I - shaped   steel .
Figure 22 shows the comparison of the axial pressure bearing capacity. From the comparison between the measured value of Nc and the calculated value of Nu, it can be seen that all the calculated points were near the Nc/Nu = 1 line, and the errors in the experimental and simulation results were within 8%. The error analysis is shown in Table 9, and the coefficient of variation was 0.039, which indicates that the fitted formula meets the requirements. This showed that the equation proposed in this paper has good accuracy and can be used to predict the ultimate bearing capacities of long columns in square-stainless-steel-tube UHPC.

7. Conclusions

This article presents an experimental study and numerical simulation analysis of the mechanical properties of square-stainless-steel-tube UHPC medium-length columns with built-in steel skeletons. The damage modes of the specimens were analyzed only at the macroscopic level, not at the microscopic level. The steel pipe used in the test is 304 grade austenitic thin-walled stainless steel, and the built-in steel skeleton is Q235 grade I-beam. Because the material is more expensive, it is difficult to popularize its application over a wide range. The following conclusions can be drawn based on the above results.
(1)
Through the observation of the experimental process, the damage patterns of the members with and without steel skeleton were similar, both showing local buckling of the members, but the members without steel skeleton were more likely to bend overall under the same axial load. This was also confirmed in the load–displacement curves of the specimens.
(2)
Based on the good agreement between the finite element model and the test results, the stress change image of each part of the test piece at the critical moment was retrieved from ABAQUS. It can be found that, for steel skeleton–steel pipe ultra-high-performance concrete combination columns, among the components of the test piece under an axial load, the stress of the internal skeleton was the first to approach its material yield stress, and the stainless-steel tube was the first to produce a deformation. The first location of the specimen bulge is the upper part
(3)
The experimental data showed that an appropriate increase in the skeleton content could effectively improve the ultimate load capacities of medium-length column members, while the increase in the L/D ratio reduced the ultimate load capacities of the members. The ultimate load carrying capacity of the members increased by 8.06% and 9.81% when the skeleton content increased from 6.36% to 7.91% and 9.56%, respectively. The ultimate bearing capacities of the SR-UHPCFSSST members were reduced by 5.80% and 10.50%, and the ultimate bearing capacities of the UHPCFSSST members were reduced by 18.7% and 24.97% when the length-to-diameter ratio was increased from 6 to 8 and 9, respectively.
(4)
Numerical simulation results showed that the ultimate bearing capacity of the specimen decreased with the increase in the diameter-to-thickness ratio. The ultimate load capacity of the specimen increased as the strength of the core concrete increased.
(5)
Based on the good agreement between the experimental results and numerical simulations, a formula for predicting the axial compression load capacities of square-stainless-steel-tube UHPC medium-length columns was derived, and the error between the calculated value and the test result is less than 8%. This shows that the bearing capacity formula proposed in this paper can predict the axial compression bearing capacity of square stainless-steel tube ultra-high-performance concrete medium-length column, which provides a reference for the load capacity calculation of square-steel-tube concrete columns.
(6)
According to the results of this paper, when making supertall or large-span buildings, the load-bearing capacity and bending resistance of the structure can be improved by adding a built-in steel skeleton.

Author Contributions

Software, C.W.; Formal analysis, T.Z.; Data curation, J.L.; Writing—Review & editing, Z.C.; Project administration, G.D. All authors have read and agreed to the published version of the manuscript.

Funding

This research was funded by [National Natural Science Foundation of China] grant number [52078052].

Institutional Review Board Statement

Not applicable.

Informed Consent Statement

Not applicable.

Data Availability Statement

The data of this study can be found on the “https://du-yangtzeu.cn/” website, but it is not provided externally.

Acknowledgments

We are very grateful for China’s financial support.

Conflicts of Interest

The authors declare no conflict of interest.

References

  1. Lai, M.H.; Ho, J. A theoretical axial stress-strain model for circular concrete-filled-steel-tube columns. Eng. Struct. 2016, 125, 124–143. [Google Scholar] [CrossRef]
  2. Chang, X.; Wei, Y.Y.; Yun, Y.C. Analysis of steel-reinforced concrete-filled-steel tubular (SRCFST) columns under cyclic loading. Constr. Build. Mater. 2012, 28, 88–95. [Google Scholar] [CrossRef]
  3. Qi, H.; Guo, L.; Liu, J.; Gan, D.; Zhang, S. Axial load behavior and strength of tubed steel reinforced-concrete (SRC) stub columns. Thin-Walled Struct. 2011, 49, 1141–1150. [Google Scholar] [CrossRef]
  4. Inai, E.; Mukai, A.; Kai, M.; Tokinoya, H.; Fukumoto, T.; Mori, K. Behavior of concretefilled steel tube beam columns. J. Struct. Eng. 2004, 130, 189–202. [Google Scholar] [CrossRef]
  5. Espinos, A.; Romero, M.L.; Lam, D. Fire performance of innovative steel-concrete composite columns using high strength steels. Thin-Walled Struct. 2016, 106, 113–128. [Google Scholar] [CrossRef]
  6. Kato, B. Column curves of steel-concrete composite members. J. Constr. Steel Res. 1996, 39, 121–135. [Google Scholar] [CrossRef]
  7. Guo-Feng, D.U.; Xin, S.; Zhi-Zhong, Z.; Si-Ping, Y.U. Experimental research on axially loaded composite l-section steel tubes of middle long columns filled with steel-reinforced concrete. J. Sichuan Univ. (Eng. Sci. Ed.) 2013. [Google Scholar]
  8. Wang, Q.; Zhao, D.; Ping, G. Experimental study on the strength and ductility of steel tubular columns filled with steel-reinforced concrete. Eng. Struct. 2004, 26, 907–915. [Google Scholar] [CrossRef]
  9. Ouladbrahim, A.; Belaidi, I.; Khatir, S.; Magagnini, E.; Capozucca, R.; Wahab, M.A. Experimental crack identification of API X70 steel pipeline using improved Artificial Neural Networks based on Whale Optimization Algorithm. Mech. Mater. 2022, 166, 104200. [Google Scholar] [CrossRef]
  10. Khatir, A.; Capozucca, R.; Khatir, S.; Magagnini, E. Vibration-based crack prediction on a beam model using hybrid butterfly optimization algorithm with artificial neural network. Front. Struct. Civ. Eng. 2022, 16, 976–989. [Google Scholar] [CrossRef]
  11. Le, T.T.; Asteris, P.G.; Lemonis, M.E. Prediction of axial load capacity of rectangular concrete-filled steel tube columns using machine learning techniques. Eng. Comput. 2021, 38, 3283–3316. [Google Scholar] [CrossRef]
  12. Li, G.; Sun, X.; Yang, Z.; Fang, C.; Chen, B.; Ge, H.; Liu, Y. Structural performance of concrete-filled square steel tubular columns encased with I-shaped CFRP under eccentric compression. Eng. Struct. 2021, 248, 113254. [Google Scholar] [CrossRef]
  13. Yoo, D.Y.; Shin, H.O.; Yang, J.M.; Yoon, Y.S. Material and bond properties of ultra high performance fiber reinforced concrete with micro steel fibers. Compos. Part B 2014, 58, 122–133. [Google Scholar] [CrossRef]
  14. Wang, W.; Wu, C.; Liu, Z. Compressive behavior of hybrid double-skin tubular columns with ultrahigh performance fiber-reinforced concrete. Eng. Struct. 2019, 180, 419–441. [Google Scholar] [CrossRef]
  15. Guler, S.; Yavuz, D.; Aydin, M. Hybrid fiber reinforced concrete-filled square stub columns under axial compression. Eng. Struct. 2019, 198, 109504.1–109504.25. [Google Scholar] [CrossRef]
  16. Khan, M.I.; Fares, G.; Abbas, Y.M.; Alqahtani, F.K. Behavior of Non-Shear-Strengthened UHPC Beams under Flexural Loading: Influence of Reinforcement Percentage. Appl. Sci. 2021, 11, 11346. [Google Scholar] [CrossRef]
  17. Khan, M.I.; Fares, G.; Abbas, Y.M. Behavior of Non-Shear-Strengthened UHPC Beams under Flexural Loading: Influence of Reinforcement Depth. Appl. Sci. 2021, 11, 11168. [Google Scholar] [CrossRef]
  18. Abbas, Y.M.; Hussain, L.A.; Khan, M.I. Constitutive Compressive Stress-Strain Behavior of Hybrid Steel-PVA High-Performance Fiber-Reinforced Concrete. J. Mater. Civ. Eng. 2022, 34, 04021401. [Google Scholar] [CrossRef]
  19. Abbass, W.; Khan, M.I. Experimental and numerical investigation of flexural behavior of hybrid fiber reinforced high strength incorporating binary and ternary blend of ultra fines. In Structures; Elsevier: Amsterdam, The Netherlands, 2022; Volume 42. [Google Scholar]
  20. Ahmed, A.A.; Hassan, M.; Masmoudi, R.; Khan, M. Flexural strength of post-tensioned concrete-filled fiber-reinforced-polymer rectangular tube beams. PCI J. 2022, 67, 58–78. [Google Scholar] [CrossRef]
  21. Gunawardena, Y.; Aslani, F. Behaviour and design of concrete-filled spiral-welded stainless-steel tube short columns under concentric and eccentric axial compression loading. J. Constr. Steel Res. 2019, 158, 522–546. [Google Scholar] [CrossRef]
  22. Gardner, L. Aesthetics, economics and design of stainless steel structures. Adv. Steel Constr. 2008, 4, 113–122. [Google Scholar]
  23. Xu, H.; Liu, Y.; Chen, W.; Du, R.G.; Lin, C.J. Corrosion behavior of reinforcing steel in simulated concrete pore solutions: A scanning micro-reference electrode study. Electrochim. Acta 2009, 54, 4067–4072. [Google Scholar] [CrossRef]
  24. Gunawardena, Y.; Aslani, F. Static flexural behaviour of concrete-filled spiral-welded stainless-steel tubes. Thin-Walled Struct. 2020, 151, 106731. [Google Scholar] [CrossRef]
  25. Cheng, Z.; Li, J.; Liu, Z.; Du, G. Axial compressive properties of ultra-high performance concrete stub columns with square stainless steel tubes embedded with steel ribs. J. Build. Sci. Eng. Available online: http://kns.cnki.net/kcms/detail/61.1442.TU.20220420.1520.002.html (accessed on 21 April 2022). (In Chinese).
  26. Yang, Y.F.; Zhang, L.; Dai, X. Performance of recycled aggregate concrete–filled square steel tubular columns exposed to fire. Adv. Struct. Eng. 2016. [Google Scholar] [CrossRef]
  27. Patel, V.I.; Liang, Q.Q.; Hadi, M.N. Nonlinear analysis of axially loaded circular concrete-filled stainless steel tubular short columns. J. Constr. Steel Res. 2014, 101, 9–18. [Google Scholar] [CrossRef] [Green Version]
  28. Mander, J.; Priestley, M. Theoretical Stress-Strain Model for Confined Concrete. J. Struct. Eng. 1988, 114, 1804–1826. [Google Scholar] [CrossRef] [Green Version]
  29. Lim, J.C.; Ozbakkaloglu, T. Stress–strain model for normal- and light-weight concretes under uniaxial and triaxial compression. Constr. Build. Mater. 2014, 71, 492–509. [Google Scholar] [CrossRef]
  30. Graybeal, B.A. Compressive Behavior of Ultra-High-Performance Fiber-Reinforced Concrete. Mater. J. 2007, 104, 146. [Google Scholar]
  31. Liang, Q. Performance-based analysis of concrete-filled steel tubular beam–columns, Part I: Theory and algorithms. J. Constr. Steel Res. 2008, 65, 363–372. [Google Scholar] [CrossRef]
  32. Hu, H.T.; Huang, C.S.; Wu, M.H.; Wu, Y.M. Nonlinear Analysis of Axially Loaded Concrete-Filled Tube Columns with Confinement Effect. J. Struct. Eng. 2003, 129, 1322–1329. [Google Scholar] [CrossRef] [Green Version]
  33. EN 1993-1-4: 2007; Eurocode 3-Design of Steel Structures-Part 1-4: General Rules Supplementary Rules for Stainless Steels. British Standards Institution: London, UK, 2004.
  34. Han, L.H.; Yao, G.H.; Tao, Z. Performance of concrete-filled thin-walled steel tubes under pure torsion. Thin Walled Struct. 2007, 45, 24–36. [Google Scholar] [CrossRef]
  35. Huang, W.; Fan, Z.; Shen, P.; Lu, L.; Zhou, Z. Experimental and numerical study on the compressive behavior of micro-expansive ultra-high-performance concrete-filled steel tube columns. Constr. Build. Mater. 2020, 254, 119150. [Google Scholar] [CrossRef]
  36. GB 50936-2014; Technical Code for Concrete Filled Steel Tubular Structures. China Architecture Press: Beijing, China, 2014.
  37. Luo, T.; Li, N.; Zhang, T.; Li, X. Bearing capacity of circular concrete-filled steel tube columnsunder axial compression. J. Wuhan Univ. (Eng. Ed.) 2014, 47, 764–768+773. [Google Scholar]
  38. Wei, J.; Xie, Z.; Zhang, W.; Luo, X.; Yang, Y.; Chen, B. Experimental study on circular steel tube-confined reinforced UHPC columns under axial loading. Eng. Struct. 2021, 230, 111599. [Google Scholar] [CrossRef]
Figure 1. Three-dimensional schematic diagram of components.
Buildings 13 00056 g001
Figure 2. Steel fiber samples.
Buildings 13 00056 g002
Figure 3. Schematic diagram of the test loading device.
Buildings 13 00056 g003
Figure 4. Stress–strain curves of confined concrete.
Buildings 13 00056 g004
Figure 5. Stress–strain curve of stainless steel.
Buildings 13 00056 g005
Figure 6. Stress–strain curve of carbon steel.
Buildings 13 00056 g006
Figure 7. Component grid diagram.
Buildings 13 00056 g007
Figure 8. Comparison of failure modes of specimens.
Buildings 13 00056 g008
Figure 9. Comparison of the load–displacement curve between the experiments and numerical simulations.
Buildings 13 00056 g009aBuildings 13 00056 g009b
Figure 10. Comparison of ultimate bearing capacities from experiments and simulations.
Buildings 13 00056 g010
Figure 11. Failure modes of typical specimens.
Buildings 13 00056 g011
Figure 12. Cloud chart of stress development of each part under same axial load.
Buildings 13 00056 g012
Figure 13. Stress nephogram of all parts when stainless-steel pipe bulges and bends.
Buildings 13 00056 g013
Figure 14. Load–displacement curves of members with different skeleton contents.
Buildings 13 00056 g014
Figure 15. Variation of limited bearing capacity of specimens with different skeleton content.
Buildings 13 00056 g015
Figure 16. Load – displacement curves with different length-to-diameter ratios.
Buildings 13 00056 g016
Figure 17. Variation of ultimate bearing capacity of specimens with different aspect ratios.
Buildings 13 00056 g017
Figure 18. Load–displacement curve of members with different diameter-to-thickness ratios.
Buildings 13 00056 g018
Figure 19. Different diameter-to-thickness ratio specimens of the ultimate load capacity change.
Buildings 13 00056 g019
Figure 20. Load–displacement curves for different concrete strengths.
Buildings 13 00056 g020
Figure 21. Variation of ultimate bearing capacity of different concrete strength specimens.
Buildings 13 00056 g021
Figure 22. Axial compression bearing capacity comparison.
Buildings 13 00056 g022
Table 1. Component design parameters.
Member NumberB × t × L (mm)λ (L/B)r (B/t)As (mm2)α (%)
SR-CT-1150 × 2.5 × 90066014306.36
SR-CT-2150 × 2.5 × 120086014306.36
SR-CT-3150 × 2.5 × 1500106014306.36
SR-CT-4150 × 2.5 × 90066017807.91
SR-CT-5150 × 2.5 × 90066021509.56
CT-1150 × 2.5 × 900660
CT-2150 × 2.5 × 1200860
CT-3150 × 2.5 × 15001060
Table 2. Mechanical properties of steel.
SpecimenE (N·mm−2)σ0.2 (N·mm−2)σu (N·mm−2)u
2.5 mm1.95 × 1053286480.286
I102.01 × 1052734270.280
I122.01 × 1052704270.281
I142.02 × 1052744280.284
Table 3. Properties of the fiber.
Fiber SpeciesAspect RatioDiameter (mm)Length (mm)Tensile Strength (MPa)
Steel fiber67.700.18–0.2212.00–14.00≥2850
Table 4. Ultra-high-performance concrete mix (kg/m3).
CementSilica FumeSlagQuartz SandWater Reducing AgentWaterSteel FiberWater/Cement Ratio
40–7070–140
70021010542042035.525203235.50.2
Table 5. Physical properties of cement, slag, and silica fume.
PropertiesDensity (g/cm3)Specific Surface Area (m2/kg)Setting Time (min)
Initial SetFinal Set
Cement3.12381115184
Slag2.80432
Silica Fume2.3519,500
Table 6. Chemical composition of cement, slag, and silica fume (wt.%).
OxideAl2O3SiO2Fe2O3CaOMgOSO3TiO2Na2O
Cement5.9020.863.6156.773.502.43
Slag15.3632.800.7437.128.521.95
Silica fume0.0396.160.070.030.100.08
Table 7. Error analysis of ultimate bearing capacities from experiments and simulations.
Serial NumberAssembly NumberNEXP (kN)NFEM (kN)Relative Error (%)NEXP/NFEM
1SR-CT-13290.073403.023.430.97
2SR-CT-23099.113360.228.430.92
3SR-CT-32934.713069.684.600.96
4SR-CT-43555.093772.086.100.94
5SR-CT-53612.663790.944.930.95
6CT-13300.693162.084.201.04
7CT-22683.532938.839.510.91
8CT-32476.472655.327.220.93
Average value 0.953
COV 0.046
COV: Coefficient of variation.
Table 8. Expanded component design parameters.
Serial NumberAssembly NumberBtLL/BB/tAsFC
1CT-11502.5900660120
2CT-T-11501.59006100120
3CT-T-21503.5900643120
4CT-T-31502.5900660130
5CT-T-41502.5900660140
Table 9. Error analysis of test and simulated ultimate bearing capacities.
Serial NumberSample NameNEXP (kN)Calculated Value (kN)Ratio
NFEM (kN)
1SR-CT-13290.073438.710.957
3403.020.990
2SR-CT-23099.113176.640.976
3360.221.058
3SR-CT-32934.712960.880.991
3069.681.037
4SR-CT-43555.093562.140.998
3772.081.059
5SR-CT-53612.663639.450.993
3790.941.042
6CT-13300.693120.911.058
3162.081.013
7CT-22683.532853.030.941
2938.831.030
8CT-32476.472659.250.931
2655.320.999
9CT-T-12804.11
2877.591.026
10CT-T-23422.15
3682.421.076
11CT-T-33304.36
3478.011.053
12CT-T-43520.32
3681.211.046
Average value 1.014
COV 0.039
Disclaimer/Publisher’s Note: The statements, opinions and data contained in all publications are solely those of the individual author(s) and contributor(s) and not of MDPI and/or the editor(s). MDPI and/or the editor(s) disclaim responsibility for any injury to people or property resulting from any ideas, methods, instructions or products referred to in the content.

