Article

Crack45K: Integration of Vision Transformer with Tubularity Flow Field (TuFF) and Sliding-Window Approach for Crack-Segmentation in Pavement Structures

1
Department of Computer Science and Software Eng., College of Information Technology, UAEU, Al Ain 15551, United Arab Emirates
2
Emirates Center for Mobility Research, UAEU, Al Ain 15551, United Arab Emirates
3
AI and Robotics Lab (Air-Lab), UAEU, Al Ain 15551, United Arab Emirates
4
Department of Civil Engineering, College of Engineering, UAEU, Al Ain 15551, United Arab Emirates
*
Author to whom correspondence should be addressed.
Buildings 2023, 13(1), 55; https://doi.org/10.3390/buildings13010055
Submission received: 26 November 2022 / Revised: 20 December 2022 / Accepted: 22 December 2022 / Published: 26 December 2022
(This article belongs to the Special Issue ZEMCH—Zero Energy Mass Custom Home International Research 2021)

Abstract

:
Recently, deep-learning (DL)-based crack-detection systems have proven to be the method of choice for image processing-based inspection systems. However, human-like generalization remains challenging, owing to a wide variety of factors such as crack type and size. Additionally, because of their localized receptive fields, CNNs have a high false-detection rate and perform poorly when attempting to capture the relevant areas of an image. This study aims to propose a vision-transformer-based crack-detection framework that treats image data as a succession of small patches, to retrieve global contextual information (GCI) through self-attention (SA) methods, and which addresses the CNNs’ problem of inductive biases, including the locally constrained receptive-fields and translation-invariance. The vision-transformer (ViT) classifier was tested to enhance crack classification, localization, and segmentation performance by blending with a sliding-window and tubularity-flow-field (TuFF) algorithm. Firstly, the ViT framework was trained on a custom dataset consisting of 45K images with 224 × 224 pixels resolution, and achieved accuracy, precision, recall, and F1 scores of 0.960, 0.971, 0.950, and 0.960, respectively. Secondly, the trained ViT was integrated with the sliding-window (SW) approach, to obtain a crack-localization map from large images. The SW-based ViT classifier was then merged with the TuFF algorithm, to acquire efficient crack-mapping by suppressing the unwanted regions in the last step. The robustness and adaptability of the proposed integrated-architecture were tested on new data acquired under different conditions and which were not utilized during the training and validation of the model. The proposed ViT-architecture performance was evaluated and compared with that of various state-of-the-art (SOTA) deep-learning approaches. The experimental results show that ViT equipped with a sliding-window and the TuFF algorithm can enhance real-world crack classification, localization, and segmentation performance.

Graphical Abstract

1. Introduction

The most recent advancements in computer science have enabled the utilization of automated image-based pavement-assessment technologies in infrastructure- and road-maintenance organizations. The development of an effective and automatic vision-based pavement crack-detection system is an arduous task, because of factors such as the crack’s lack of contrast with the paved surface, irregular size and shape, intensity changes within the image, the existence of different textures, and the presence of shadows [1]. Vison-based crack-detection and localization were performed by acquiring and analyzing images of the structure. The crack-detection approaches are categorized as conventional image processing (IP) and machine learning (ML). The IP techniques use edge detection [2], thresholding [3], region growing [4], and various filters [5,6,7,8] to recognize crack areas. Frameworks created utilizing these techniques provide high accuracy in crack identification; however, substantial human involvement, varying lighting conditions, and lack of continuity and contrast between adjacent crack pixels have hampered their widespread adoption. These limitations can be addressed by combining IP and ML algorithms. ML approaches may learn in-depth features and perform statistical inference with minimal human intervention, as in traditional a priori methods [9]. Machine learning algorithms for pavement-crack-detection include data collection, pre-processing, feature extraction, and classification. However, in the feature-extraction phase, in cases where the retrieved features do not properly describe the cracks, the classifier could be unable to identify them [10,11].
Deep-learning (DL) models have proven to be highly effective, owing to their ability to learn data representations using trainable filters without introducing prior knowledge [12]. Unlike traditional machine-learning models, DL models do not rely on handcrafted features, and perform end-to-end classification by learning the features internally. Numerous DL models have been utilized for the inspection of various civil structures such as asphalt [13], concrete [14], gas turbines [15] and bridges [16]. Convolutional neural networks (CNNs) have been widely used across all DL models, and have shown exceptional performance in crack-detection in civil structures [17]. Various factors influence CNN performance, including hyperparameter selection and architecture fine-tuning [18]. Initial research concentrated on patch-based crack identification utilizing datasets consisting of crack and non-crack patches [19,20,21,22,23,24]. However, a pixel-wise crack-detection approach is necessary to perform crack localization and assess the crack widths, lengths, and propagation directions. To achieve the aforementioned tasks, models based on CNNs have been deployed for semantic segmentation [25,26,27,28,29,30,31]. Various studies [32,33,34,35,36] have proposed fully convolutional neural networks (FCN) to classify concrete and pavement-crack types at the pixel level. However, when the FCN undergoes intensive upsampling, as conducted in several steps, detailed information is lost, resulting in erroneous results for images containing small cracks. Unet overcomes the limitations associated with FCN networks by using skip connections, and has been extensively used in numerous crack-segmentation studies [37,38,39,40,41,42,43,44]. The Unet skip connections provide more local information from low-level data from the downsampling lane to the upsampling path. Despite U-Net-based networks’ outstanding accuracy in crack segmentation, background interference may result in erroneous detections because of duplicate recognition [45]. Chen et al. [46] addressed the limitations of the FCN and Unet architectures by introducing spatial pyramid pooling (SPP) and dilated convolution modules in DeepLabv3+ architecture. These modules facilitate the exploration of multi-scale contextual information and identify distinct target boundaries by gradually reconstructing spatial data [47].
All the aforementioned models were constructed using CNNs; however, despite their remarkable representational properties, CNNs show weak performance in capturing long-range dependencies owing to the localized receptive fields, resulting in a significant false-detection rate [48]. These limitations can be addressed using new architecture called vision transformers (ViTs), which use SA methods for extracting and integrating GCI. The SA mechanism helps the model determine which area should be focused on more [48]. Currently, transformer architecture, which uses self-attention modules to learn the relationships between these embedded patches, is the most popular paradigm in the field of natural language processing (NLP). This paper proposes a ViT-based crack-detection approach to enhance crack-detection using a custom dataset of 45K pavement images in an effort to contribute to the advancement of crack-detection. The ViT approach is also integrated with the SW approach and TuFF algorithm for crack localization and segmentation in pavement structures. The following are the primary contributions of the proposed research:
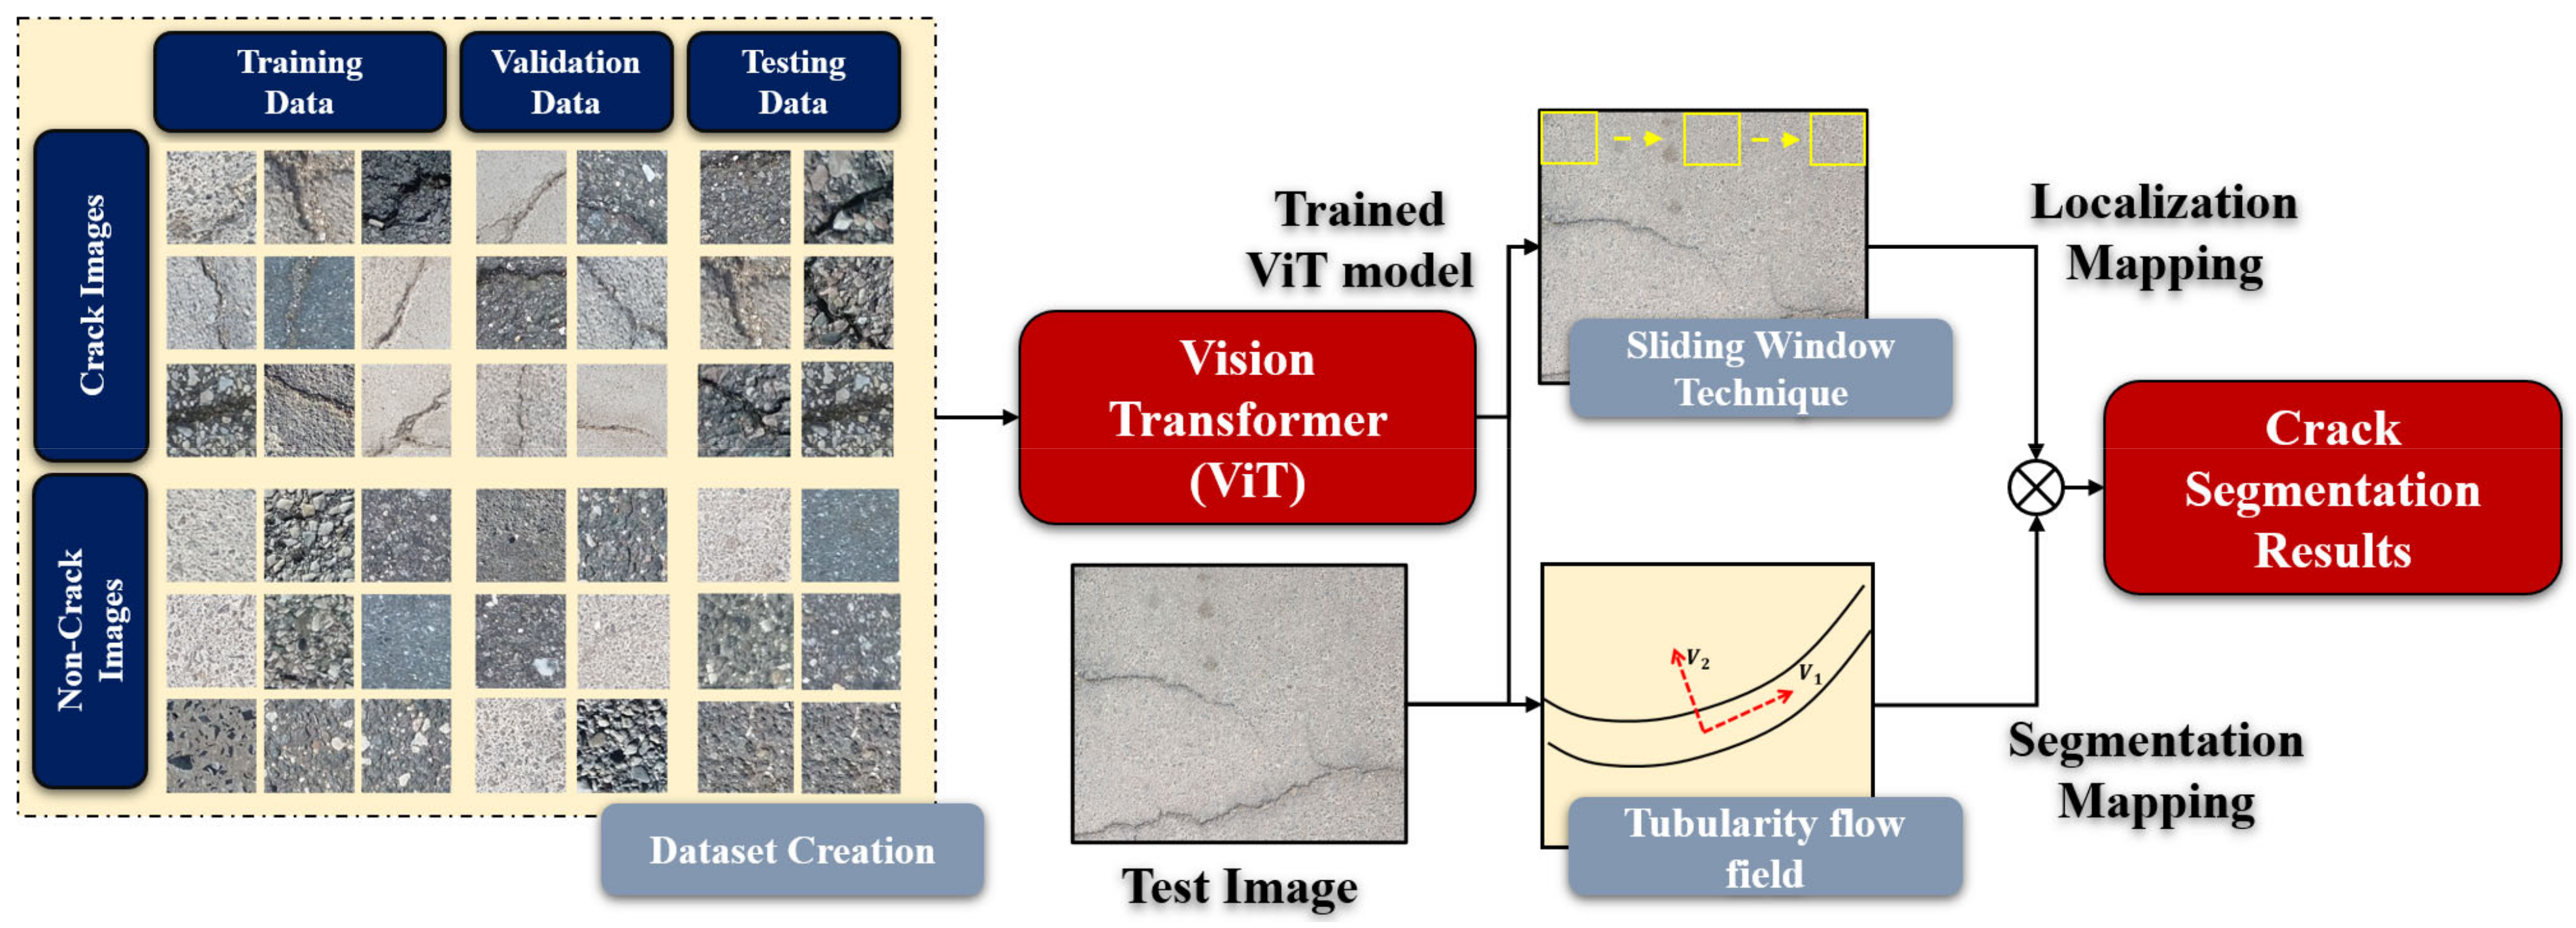
  • The creation of a custom dataset consisting of 45K 224 × 224 pixel images of crack and non-crack diverse pavement surfaces for the crack-detection task;
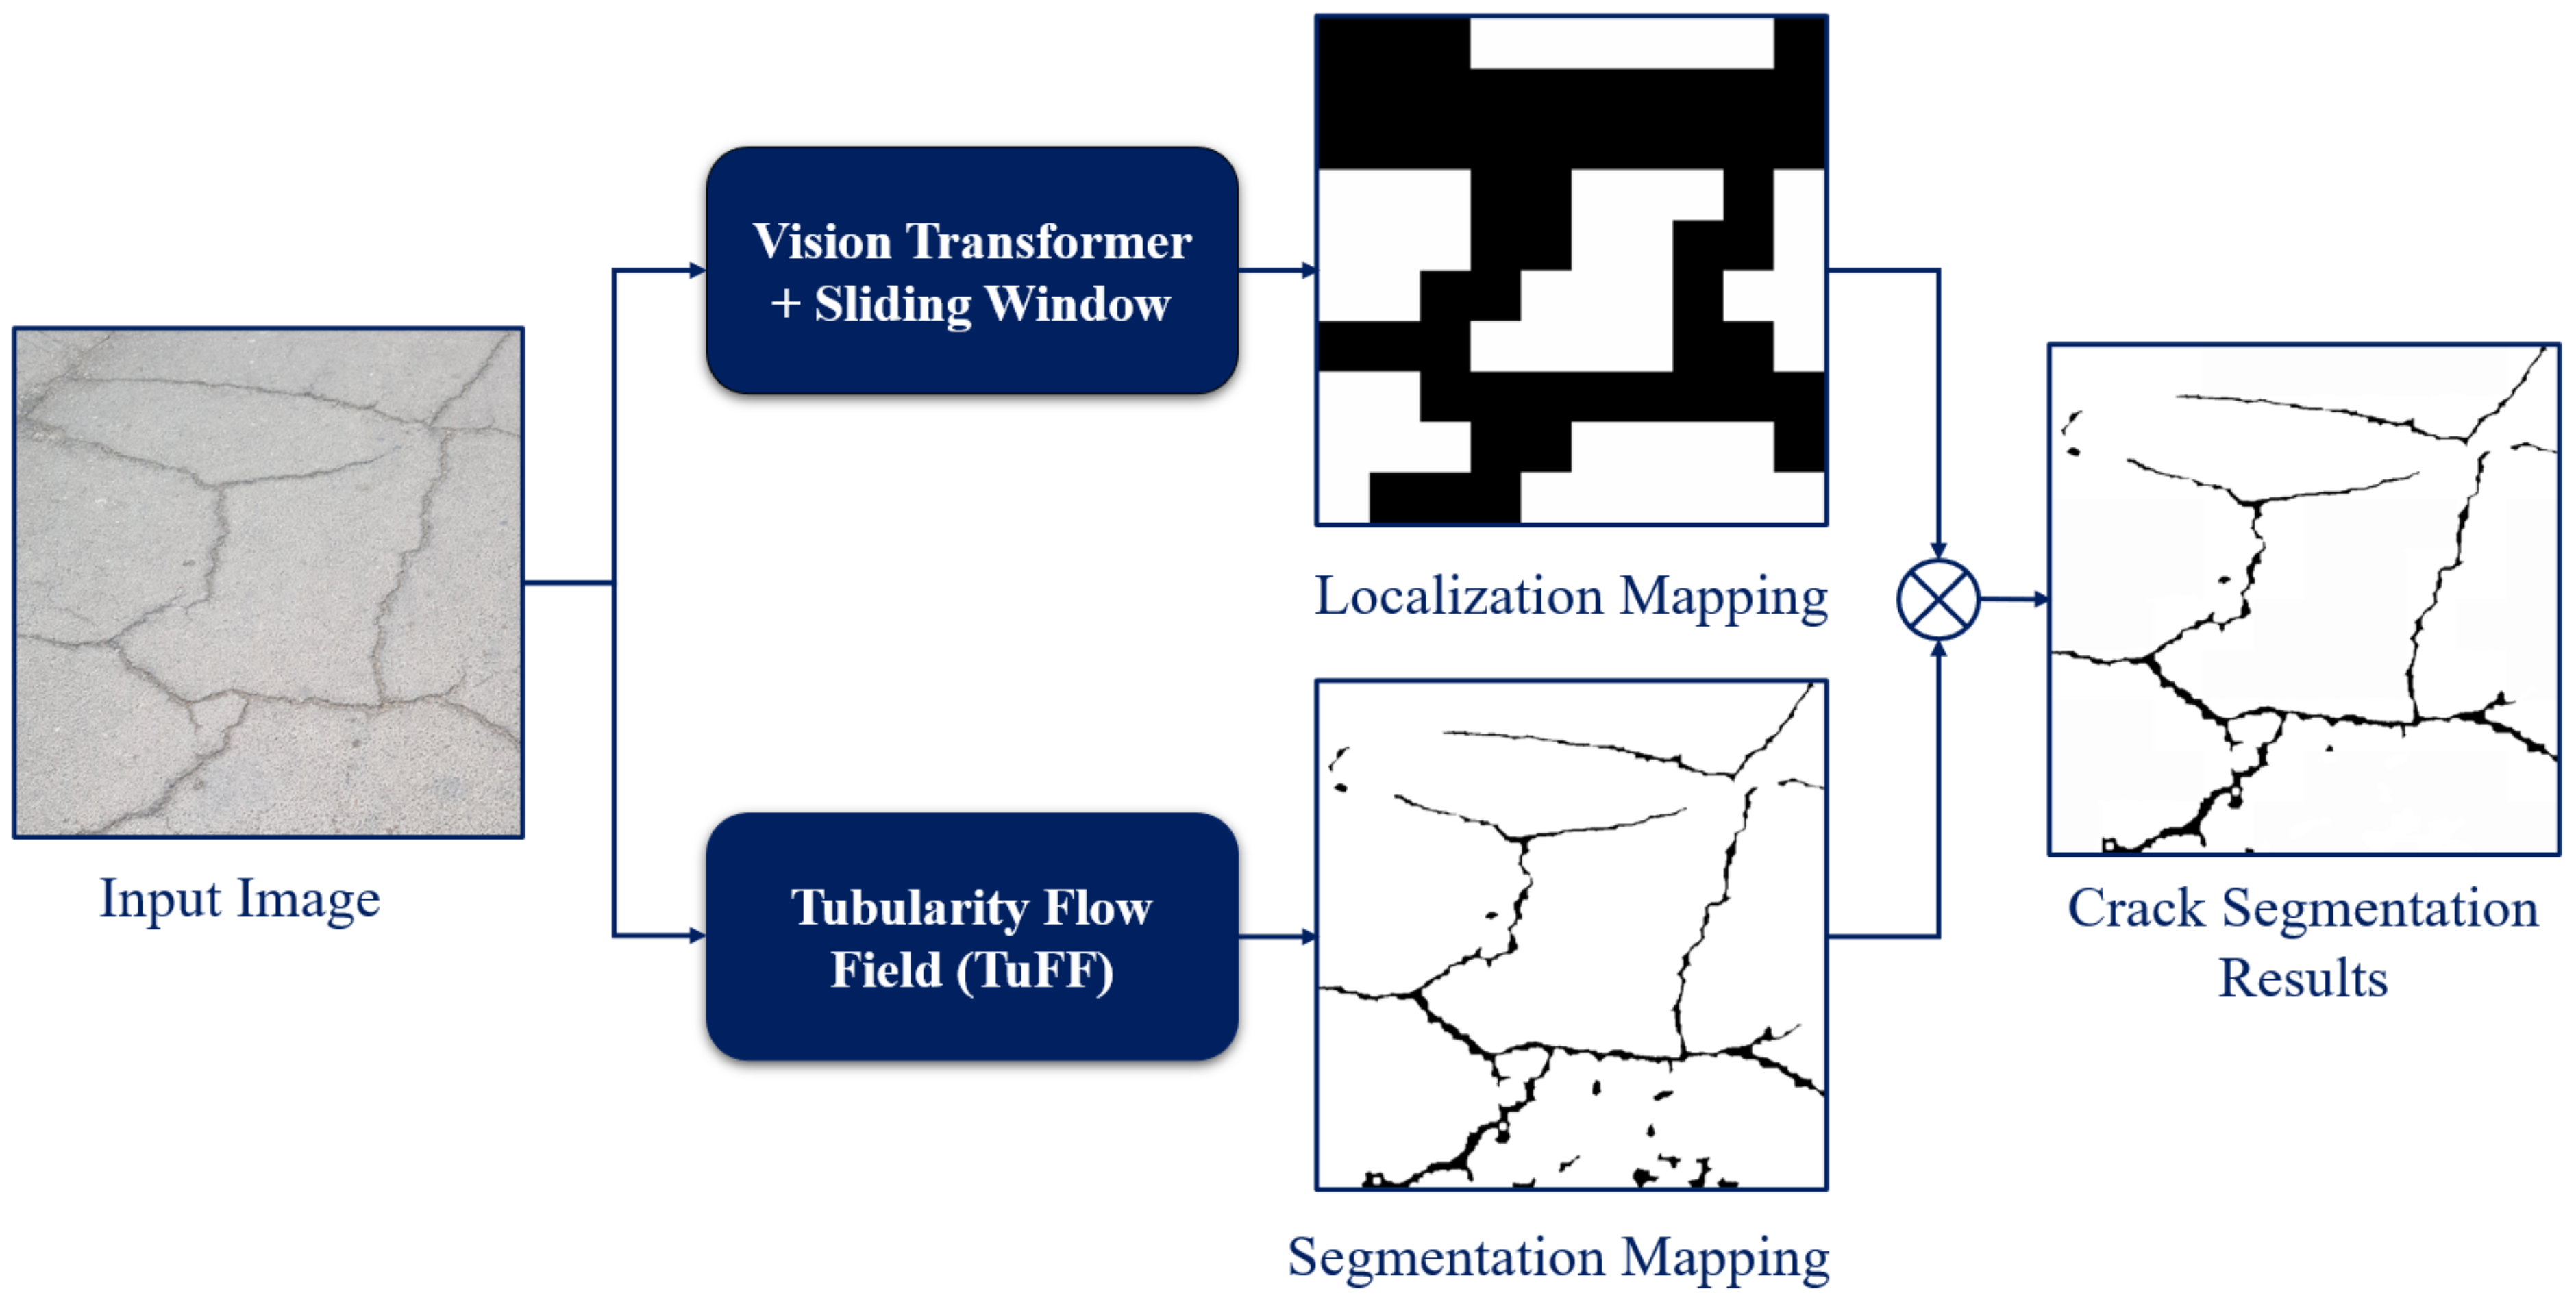
  • The use of ViTs for crack analysis and exploring the feasibility of using self-attention-based networks for crack-image classification. The proposed ViT model is integrated with a sliding window and TuFF algorithm for crack segmentation in pavement surfaces;
  • A comparison of the ViT approach with different CNN models on a custom pavement dataset and publicly available concrete dataset (utilized in our earlier work [12]);
  • A discussion based on experimental findings that emphasize the significance of ViTs for crack identification in pavement structures. Researchers interested in crack identification and localization using deep-learning methods will find this debate useful.
The rest of this article is structured as follows. In Section 2, the proposed system overview is described. The outcomes of the experiment are summarized in Section 3. Finally, Section 4 and Section 5, respectively, contain the discussion and conclusions.

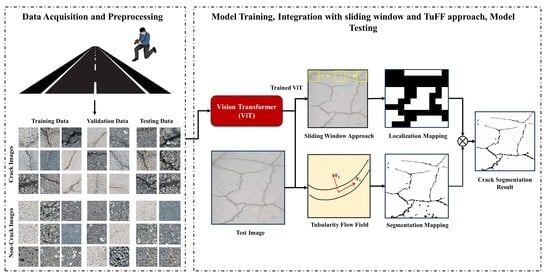
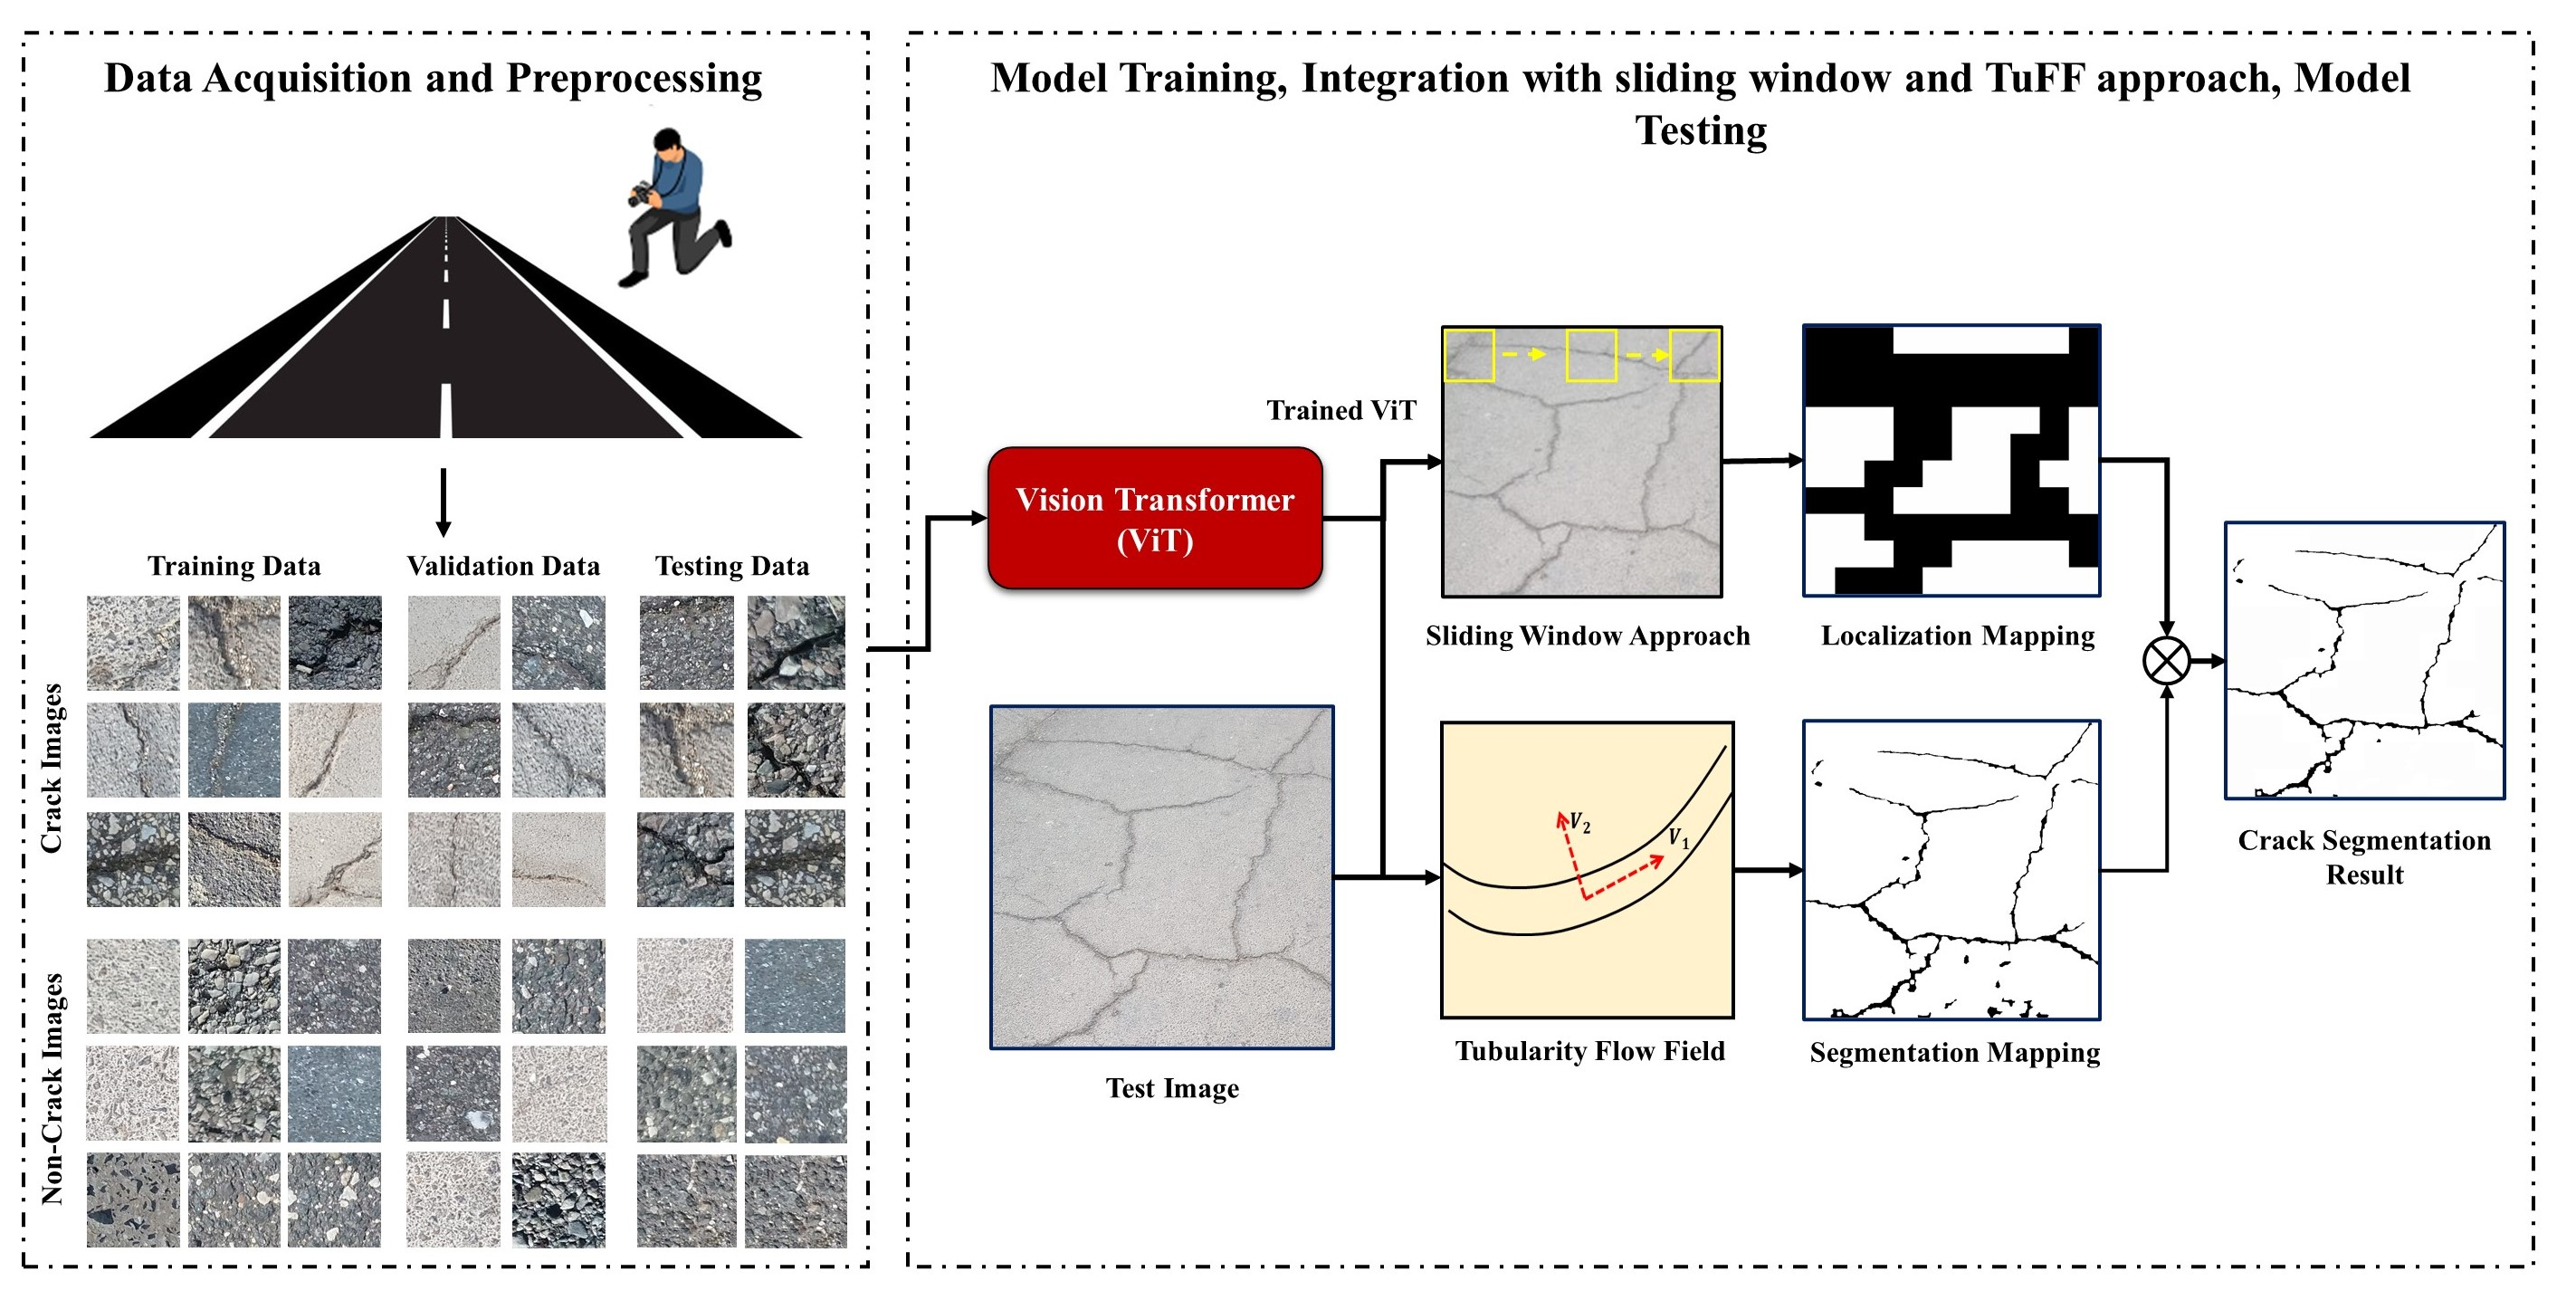
2. Overview of the System

Figure 1 presents a generalized view of the system. Three key modules constitute the system. The first module represents the data-creation phase, whereas the implementation of ViT for crack-detection is explained in the second module. The integration of the ViT model with the sliding-window approach and TuFF algorithm for crack mapping on pavement surfaces is shown in the third module. The system uses an image as its input and produces an image with mapped cracks as its output.

2.1. Database Creation

In the current study, the ViT transformer was trained on a custom dataset collected from diverse pavement structures of the UAE using a camera with resolution, pixel size, sensor size and sensor ratio of 12 MP, 1.4 µm, 1/2.55” and 4:3, respectively. The obtained dataset was made up of 470 images with a resolution of 3042 × 4032. These images included differences in lighting, shadows, and other variations of the images. To create the dataset, 224 × 224 tiny patches were created from the acquired photos. Manual labeling was performed on the patches, and a dataset of 45K data samples for both classes (crack and non-crack) were selected in a proportion of 0.5. The surface texture, shadowing, and crack patterns all contributed to the variation in the presented data samples. Random selection was used to select the patches in the datasets, and a split ratio of 60:20:20 was maintained for the training, validation, and testing sets: that is, 60% of the patches were utilized for training, 20% for validation, and the remaining 20% for testing the ViT system, as shown in Table 1. The testing data consisted of images that were not included in either the training or validation sets. For the concrete structure, the proposed system was trained on a dataset created in our previous study [12], consisting of 8.4K with a resolution of 256 × 256. Both datasets were provided to the ViT for training purposes. A sample pavement dataset is depicted in Figure 2.

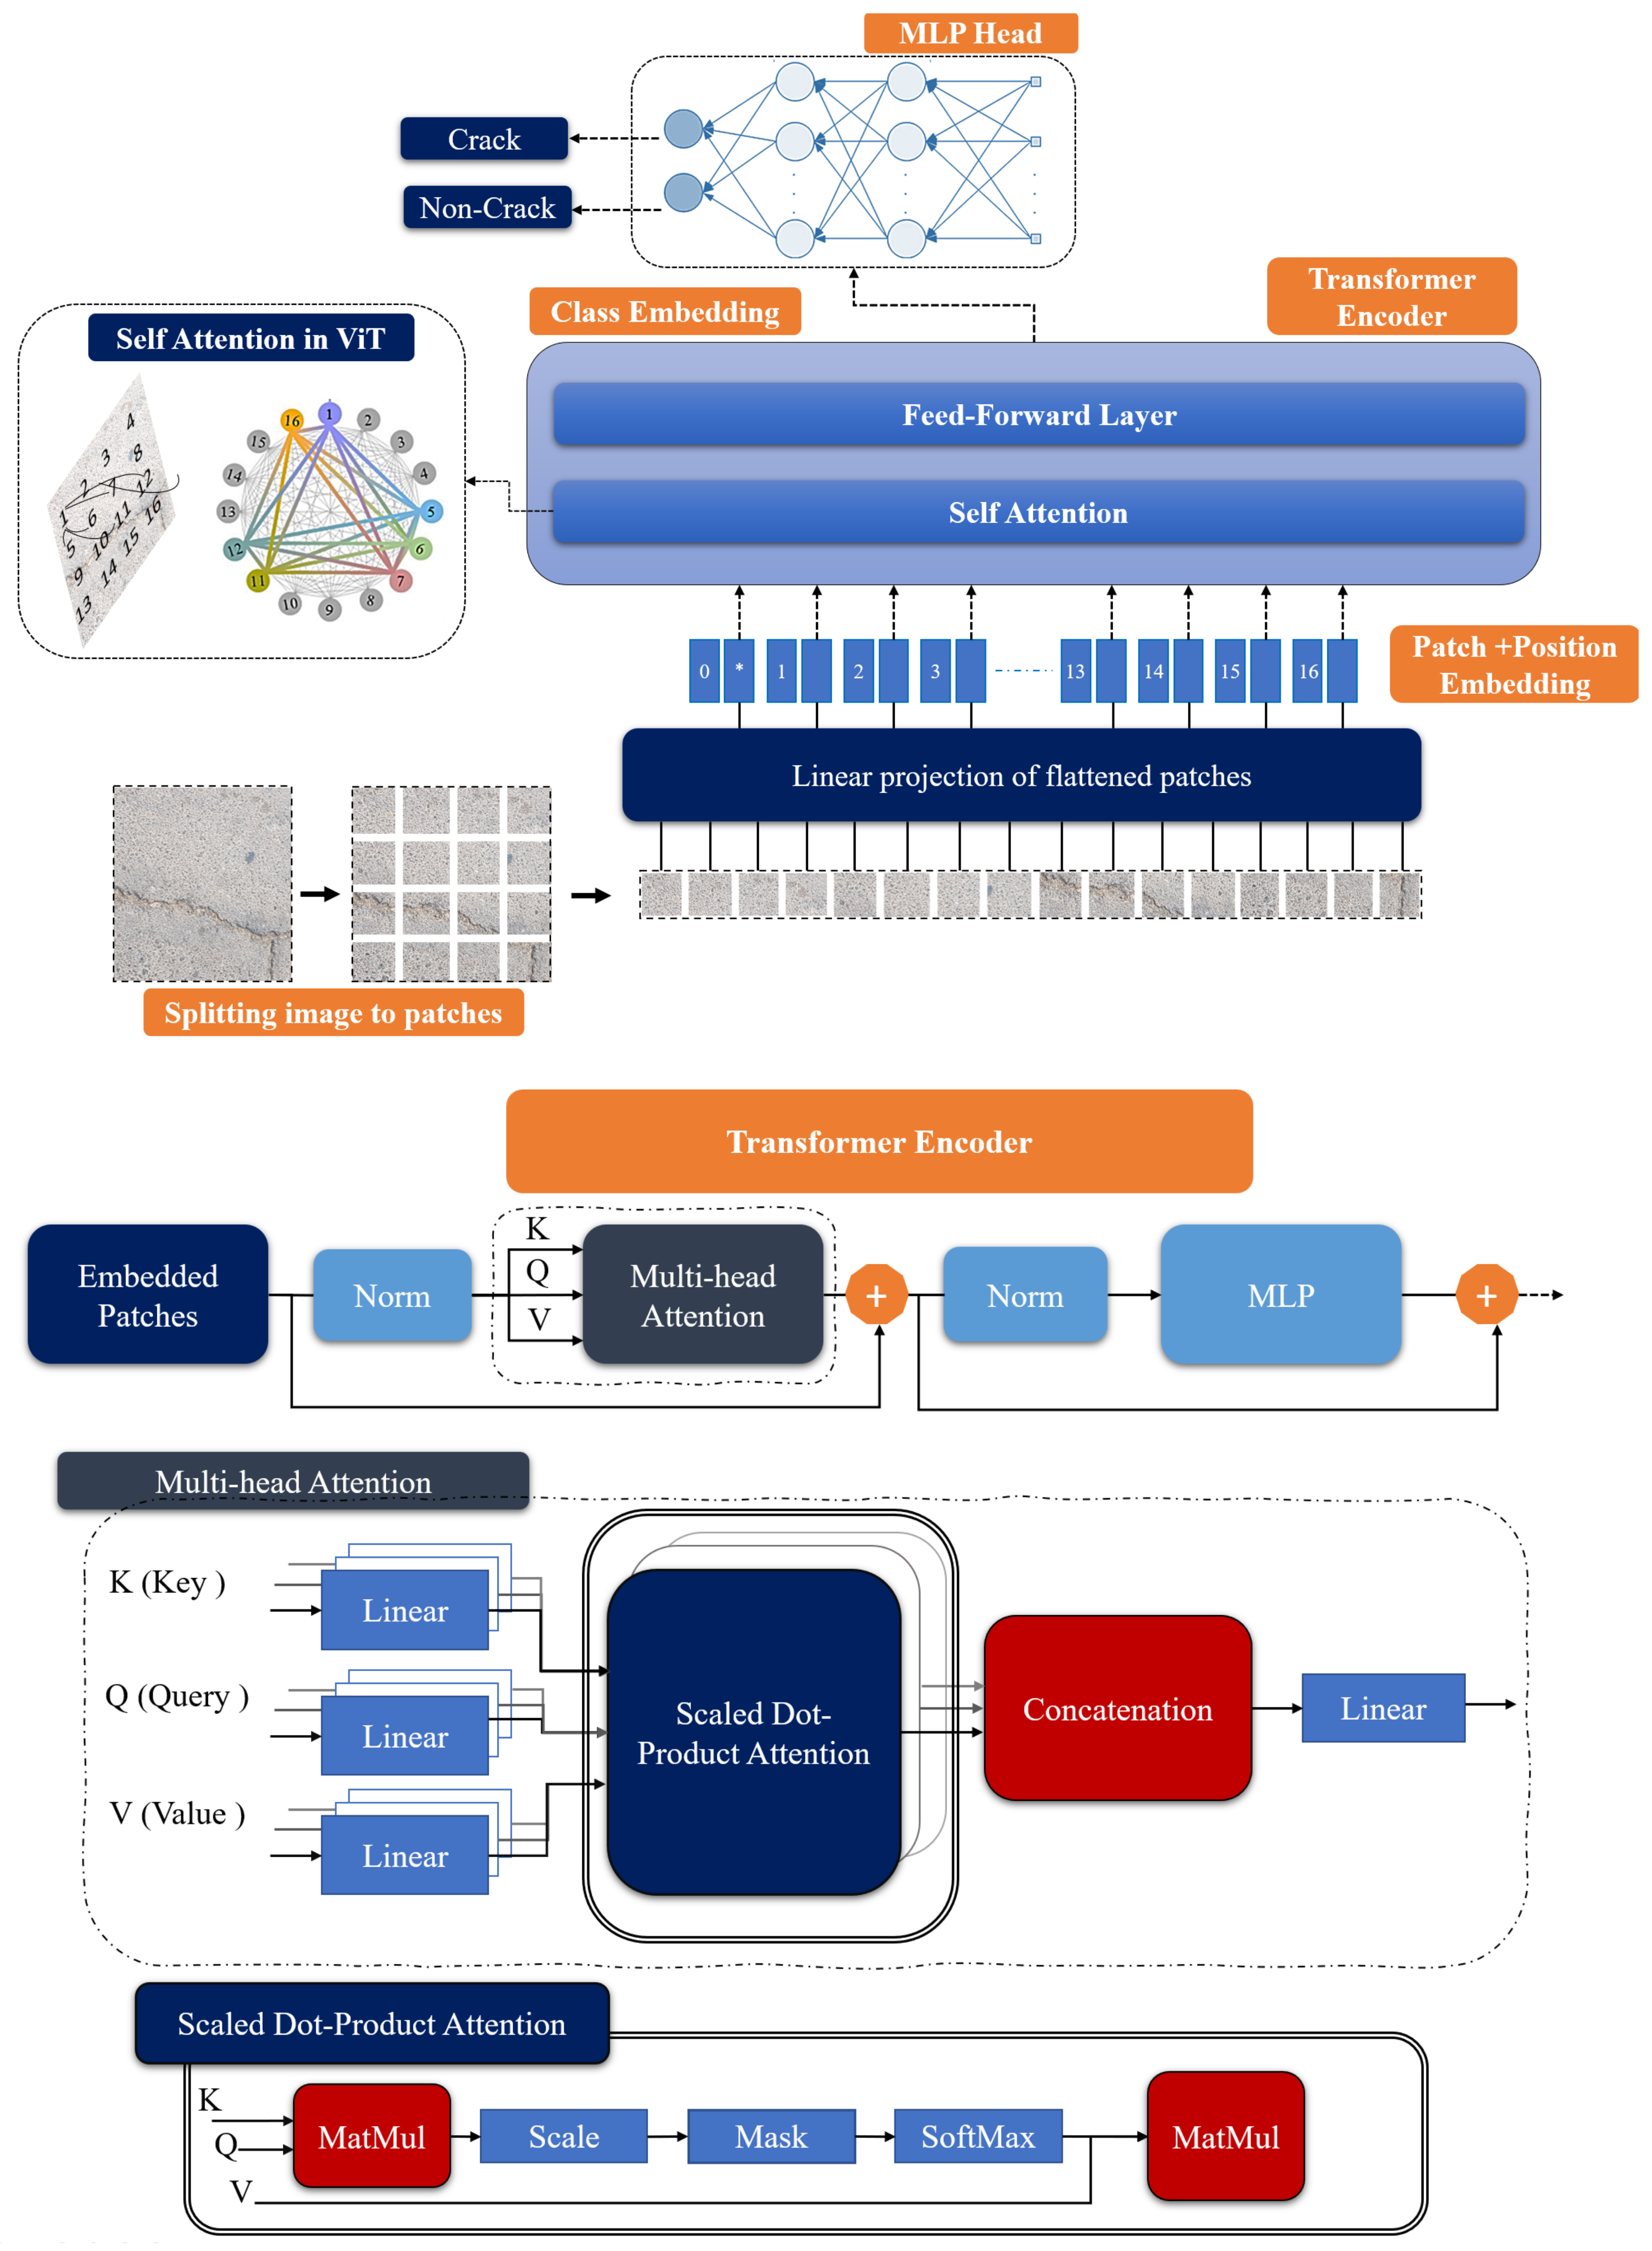
2.2. Vision Transformer (ViT)

The ViTs introduced by Dosovitskiy et al. [48] performed better in image-classification challenges than modern CNNs. ViTs treat image data as a succession of small patches (16 × 16) to acquire GCI using a multi-head self-attention (MHSA) mechanism. In order to overcome the CNNs’ problem of inductive biases, including the regionally confined receptive fields and translation invariance, the ViT model may concentrate on diverse image areas and understand the long-term links between multiple patch-embeddings. The ViT is depicted diagrammatically, in Figure 3.
The ViT flattened the input image ( i h × w × c ) into a sequence of 2D patches ( i p i = n × P 2 . C   |   i = 1 , 2 , , , , , , , N ), where h , w , P ,   P , and c   stand for the relevant picture height, width, patch size, and channel count, respectively. The output number of patches is denoted by N = h × w / p 2 , and is the effective length of the input sequence of the transformer. After converting the input image into patches, the feature is converted into feature vectors of size D , using linear projection. Patch embedding ( E   P 2 . C × D ) and positional embedding E p o s i t i o n   N + 1 × D are blended to encode the spatial data of their input images, as shown in Equation (1).
Y 0 =   i p 1 E ; i p 2 E ; i p N E + E p o s i t i o n
The encoder modules use several self-attention heads and multilayer perceptron blocks to encode the image information efficiently, as shown in Equations (2) and (3). The acquired information is then fed into the multilayer-perceptron classifier for the classification task.
y l = M S A N o r m y l 1 + y l 1
y l = M L P N o r m y l + y l
In the above equations, the term N o r m denotes the normalization operator of the layer, and the term y l h × w P 2 × D represents the acquired encoded feature-vectors. Equation (4) shows the mathematical formulation of a single self-attention block:
A t t e n t i o n I = S o f t m a x k   Q K T d k   V = y l
Query (Q) represents important features; the key (K) represents the feature relevant to Q, the dot product of both variables is normalized by d k which is the dimension of K, and T represents the transpose of the matrix. Equations (5)–(7) show the mathematical representations of the query, key, and value, respectively:
Q = I W q
K = I W k
V = I W v
In Equations (5)–(7), the terms W q , W k , and W v denote the learnable matrices used to project the features from the patches onto the Q, K, and V embeddings, respectively. The acquired information is then fed into the multilayer-perceptron classifier for the classification task. The output of the ViT classifier was integrated with the sliding-window approach to determine crack locations.

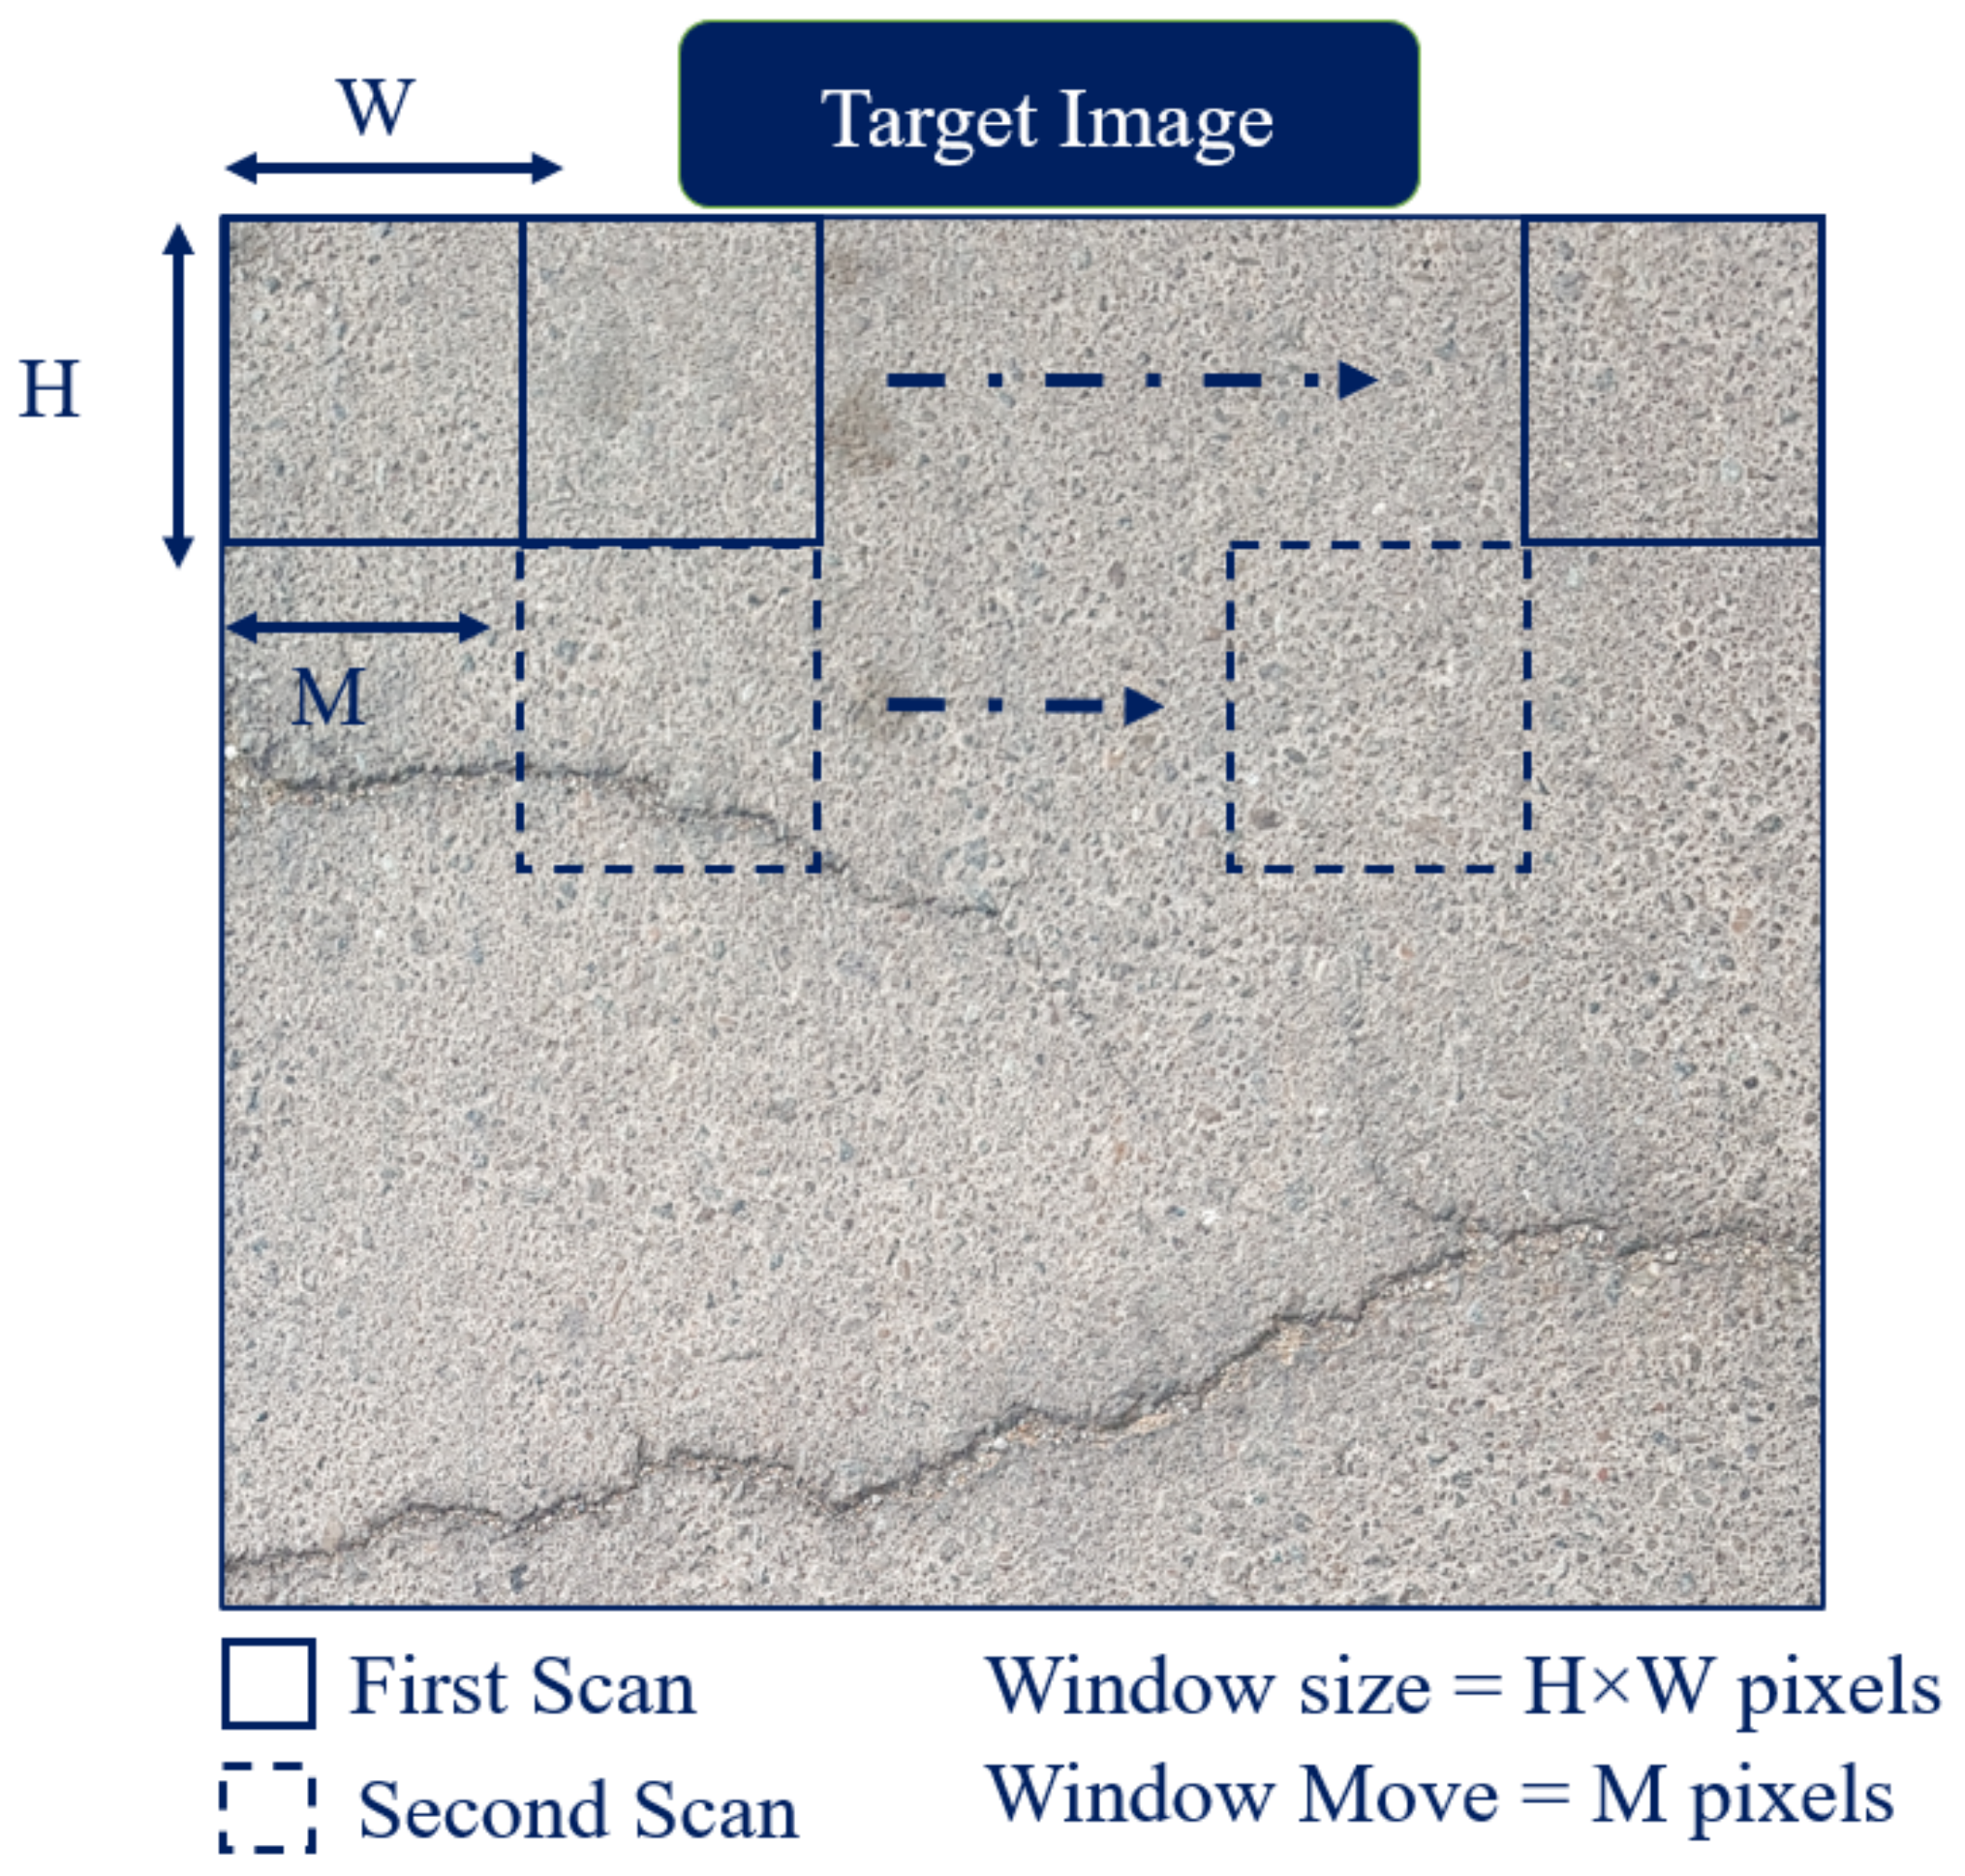
2.3. Sliding-Window Approach

The sliding-window method involves moving a window over a high-resolution image, while simultaneously feeding every patch into a trained ViT model for classification. Until the entire image has been scanned, the window travels with fixed-size pixels in horizontal and vertical directions. When the ViT classifier determines that a given patch is a crack, a rectangle is drawn around it, as shown in Figure 4:

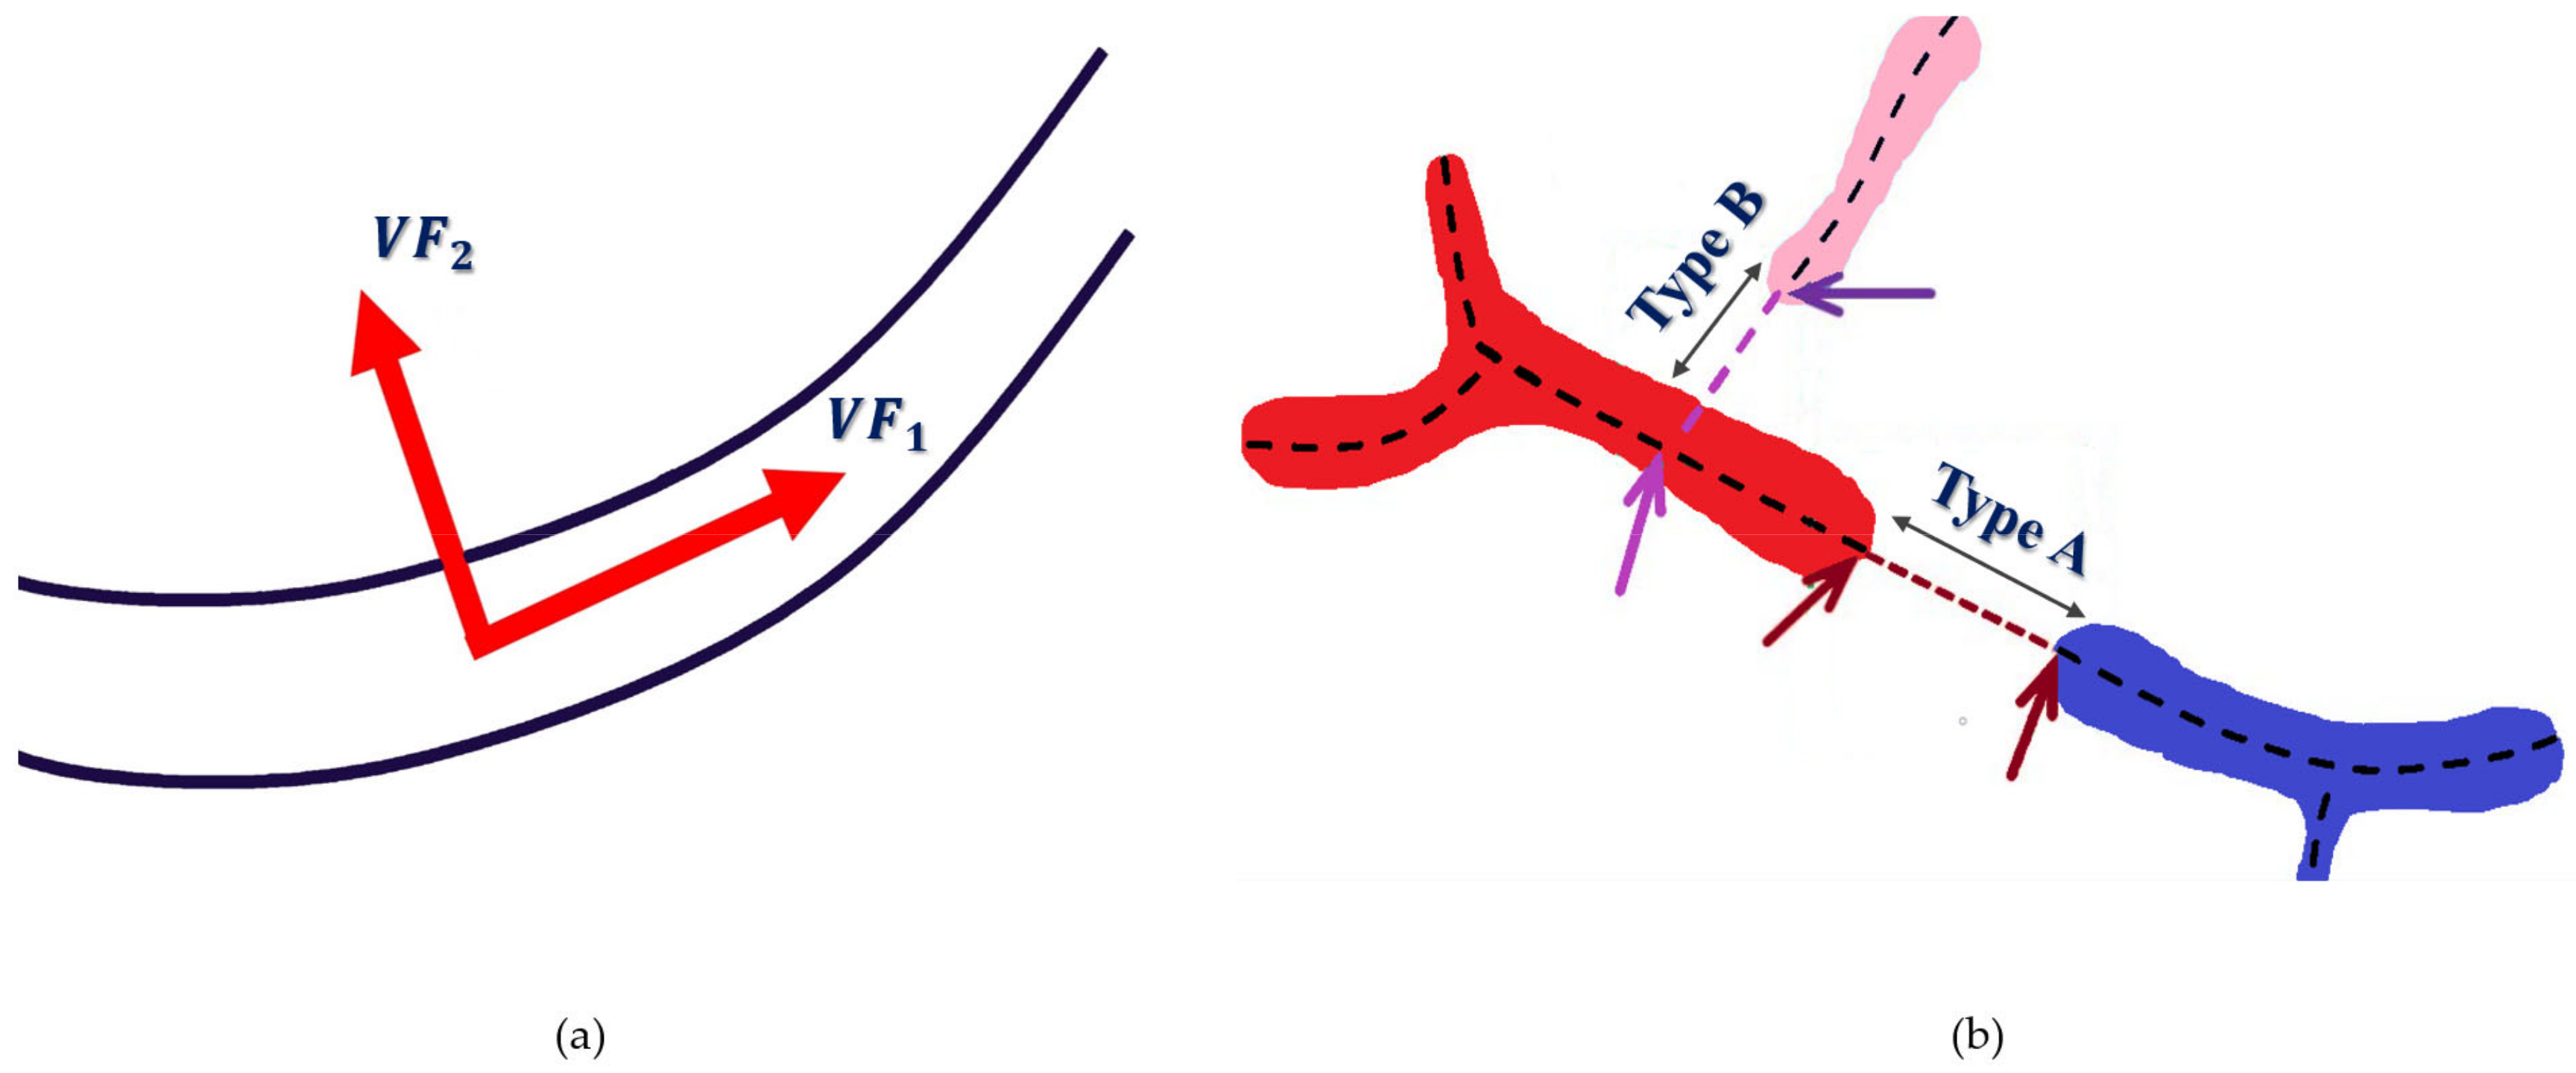
2.4. Tubularity-Flow-Field (TuFF) Algorithm

Mukherjee et al. [49] proposed TuFF, a technique for segmenting filamentous structures in digital images. The TuFF algorithm generates segmentation maps by using a level set. The level sets were automatically initialized using the Otsu global-thresholding approach [50]. Noise removal was performed using a morphological algorithm (an area-opening operation proposed by [51]). The binary distance-transform was then used to calculate the level-set function from these initialized subsegments. In TuFF, two vector fields, referred to as the tubularity flow field, impact the growth of contour C x ,   y , as depicted in Figure 5a. TuFF can overcome different discontinuities, as illustrated in Figure 5b. Contour propagation can be represented using a partial differential equation, as shown in Equation (8):
C t = 1 < V F 1 , N N + 2 < V F 2 , N N
At each position along the curve, C x ,   y ,   N are the unit normal vectors. The vessel orientation and direction orthogonal to it are represented by the axial ( V F 1 ) and normal components ( V F 2 ) of the TuFF. The contour C x ,   y moves such that it spreads outward in two directions: along the vessel axis (caused by V F 1 ) and across the vessel thickness (caused by V F 2 ), with the speed of spread determined by the coefficients 1 and 2 > 0. Interested readers are referred to [49] for more details on the TuFF algorithm. TuFF algorithms work well for concrete structures, which is also evident from the literature [52]; however, the complex texture of the pavement makes the crack segmentation task more challenging. Therefore, the localization map obtained by the SW-based ViT was combined with the findings of the TuFF algorithm to perform efficient crack segmentation in the current study, as depicted in Figure 6.

3. Experiments

3.1. Environmental Setup

The Alienware Arura R8 desktop computer, which has 32 GB of RAM and an NVIDIA GeForce RTX 2080 GPU, was used to train the suggested model. The ViT model was trained using Python 3.8, the TensorFlow library, and Windows 10. Different assessment indicators were used to assess the model’s performance, each of which is discussed in more detail in the next section. The TensorFlow DL framework is used to implement the ViT-base model using settings adapted from [48]. The model was trained on a patch size of 28 × 28, and the learning rate, transformer layers, batch size, and number of epochs were set to 0.001, 16, 16, and 300, respectively, during the hyperparameter tuning stage. A smaller patch-dimension result is considered, as it leads to an improvement in the overall accuracy of the model [53]. An early stopping criterion was considered, to avoid overfitting of the model.

3.2. Evaluation Metrics

The proposed research compares the obtained experimental outcomes using several assessment criteria, including accuracy, precision, recall, F1 score, and computing time.
The accuracy illustrated in Equation (9) is the measure of the number of patches out of all the input patches correctly identified as either cracks or non-cracks.
A c c u r a c y = T P + T N T P + T N + F P + F N  
True Positive, True Negative, False Positive, and False Negative are each denoted by the letters TP, TN, FP, and FN, respectively, in the equation above. Precision, sometimes referred to as the positive predictive value (PPV) as described in Equation 10, is the percentage of correctly anticipated positive outcomes. The accurate model detects only pertinent objects, and generates no false positives (FP).
P r e c i s i o n = T P T P + F P  
The true positive rate, also known as sensitivity, is a measure that determines how many crack patches were actually present and how many were identified. Equation (11) depicts the mathematical expression of recollection:
R e c a l l = T P T P + F N  
The F1 score, as defined in Equation (12), can be calculated by combining precision and recall scores:
F 1 = 2 P r e c i s i o n R e c a l l P r e c i s i o n + R e c a l l  
The computational time of the model can be defined as the the amount of time needed by the model to classify a single patch.

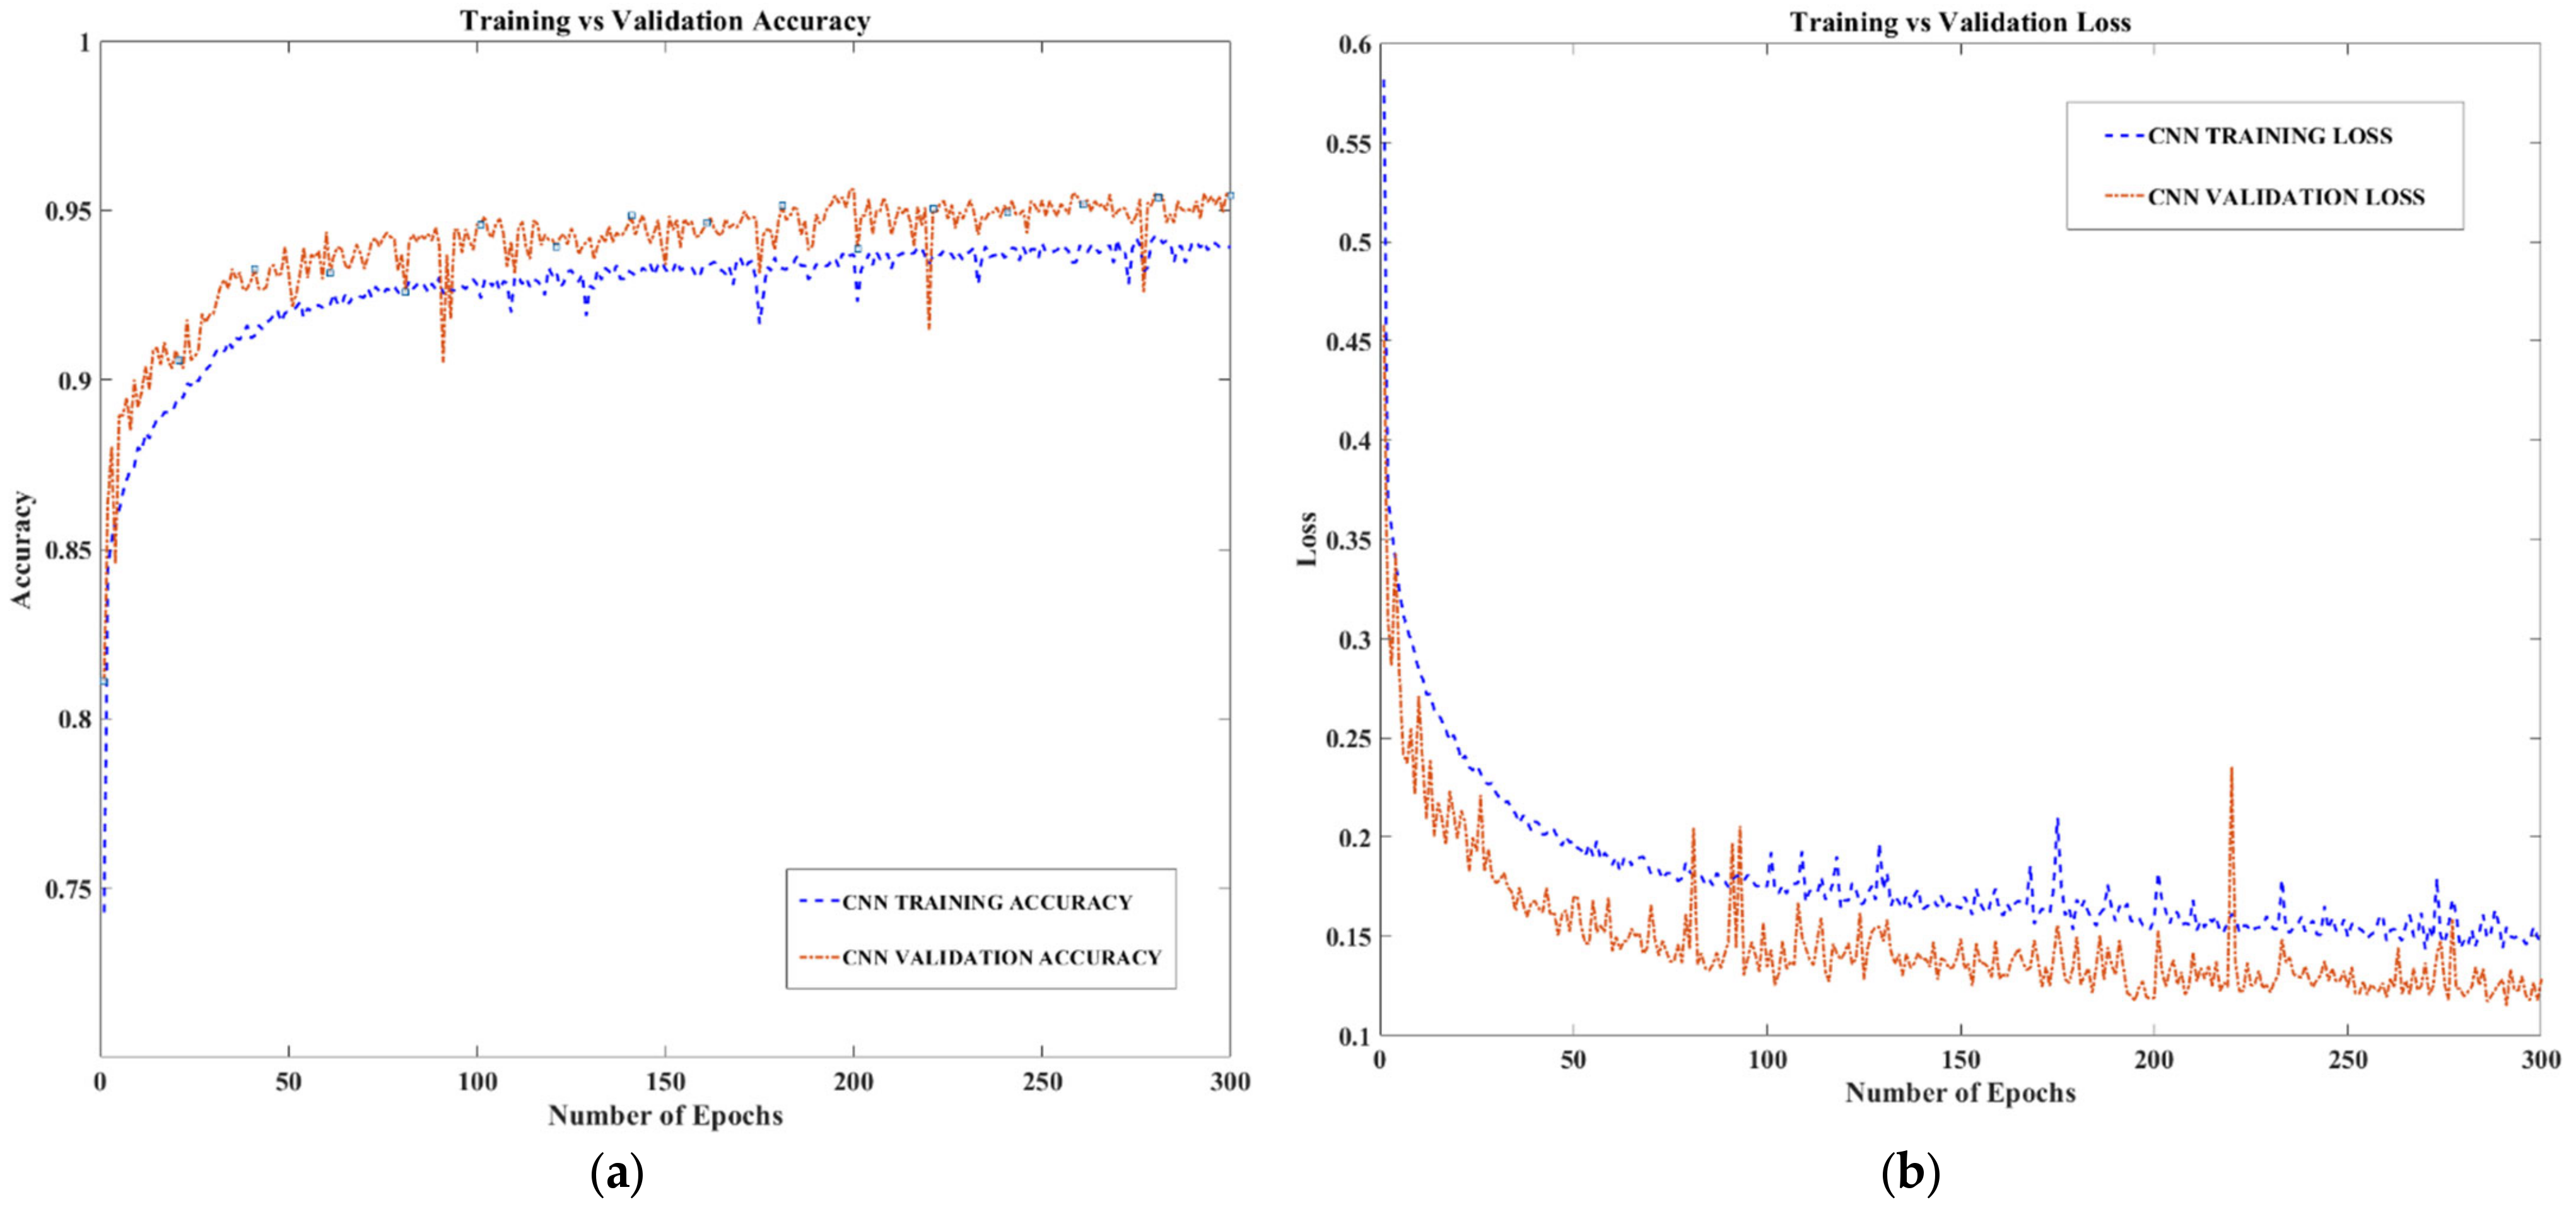
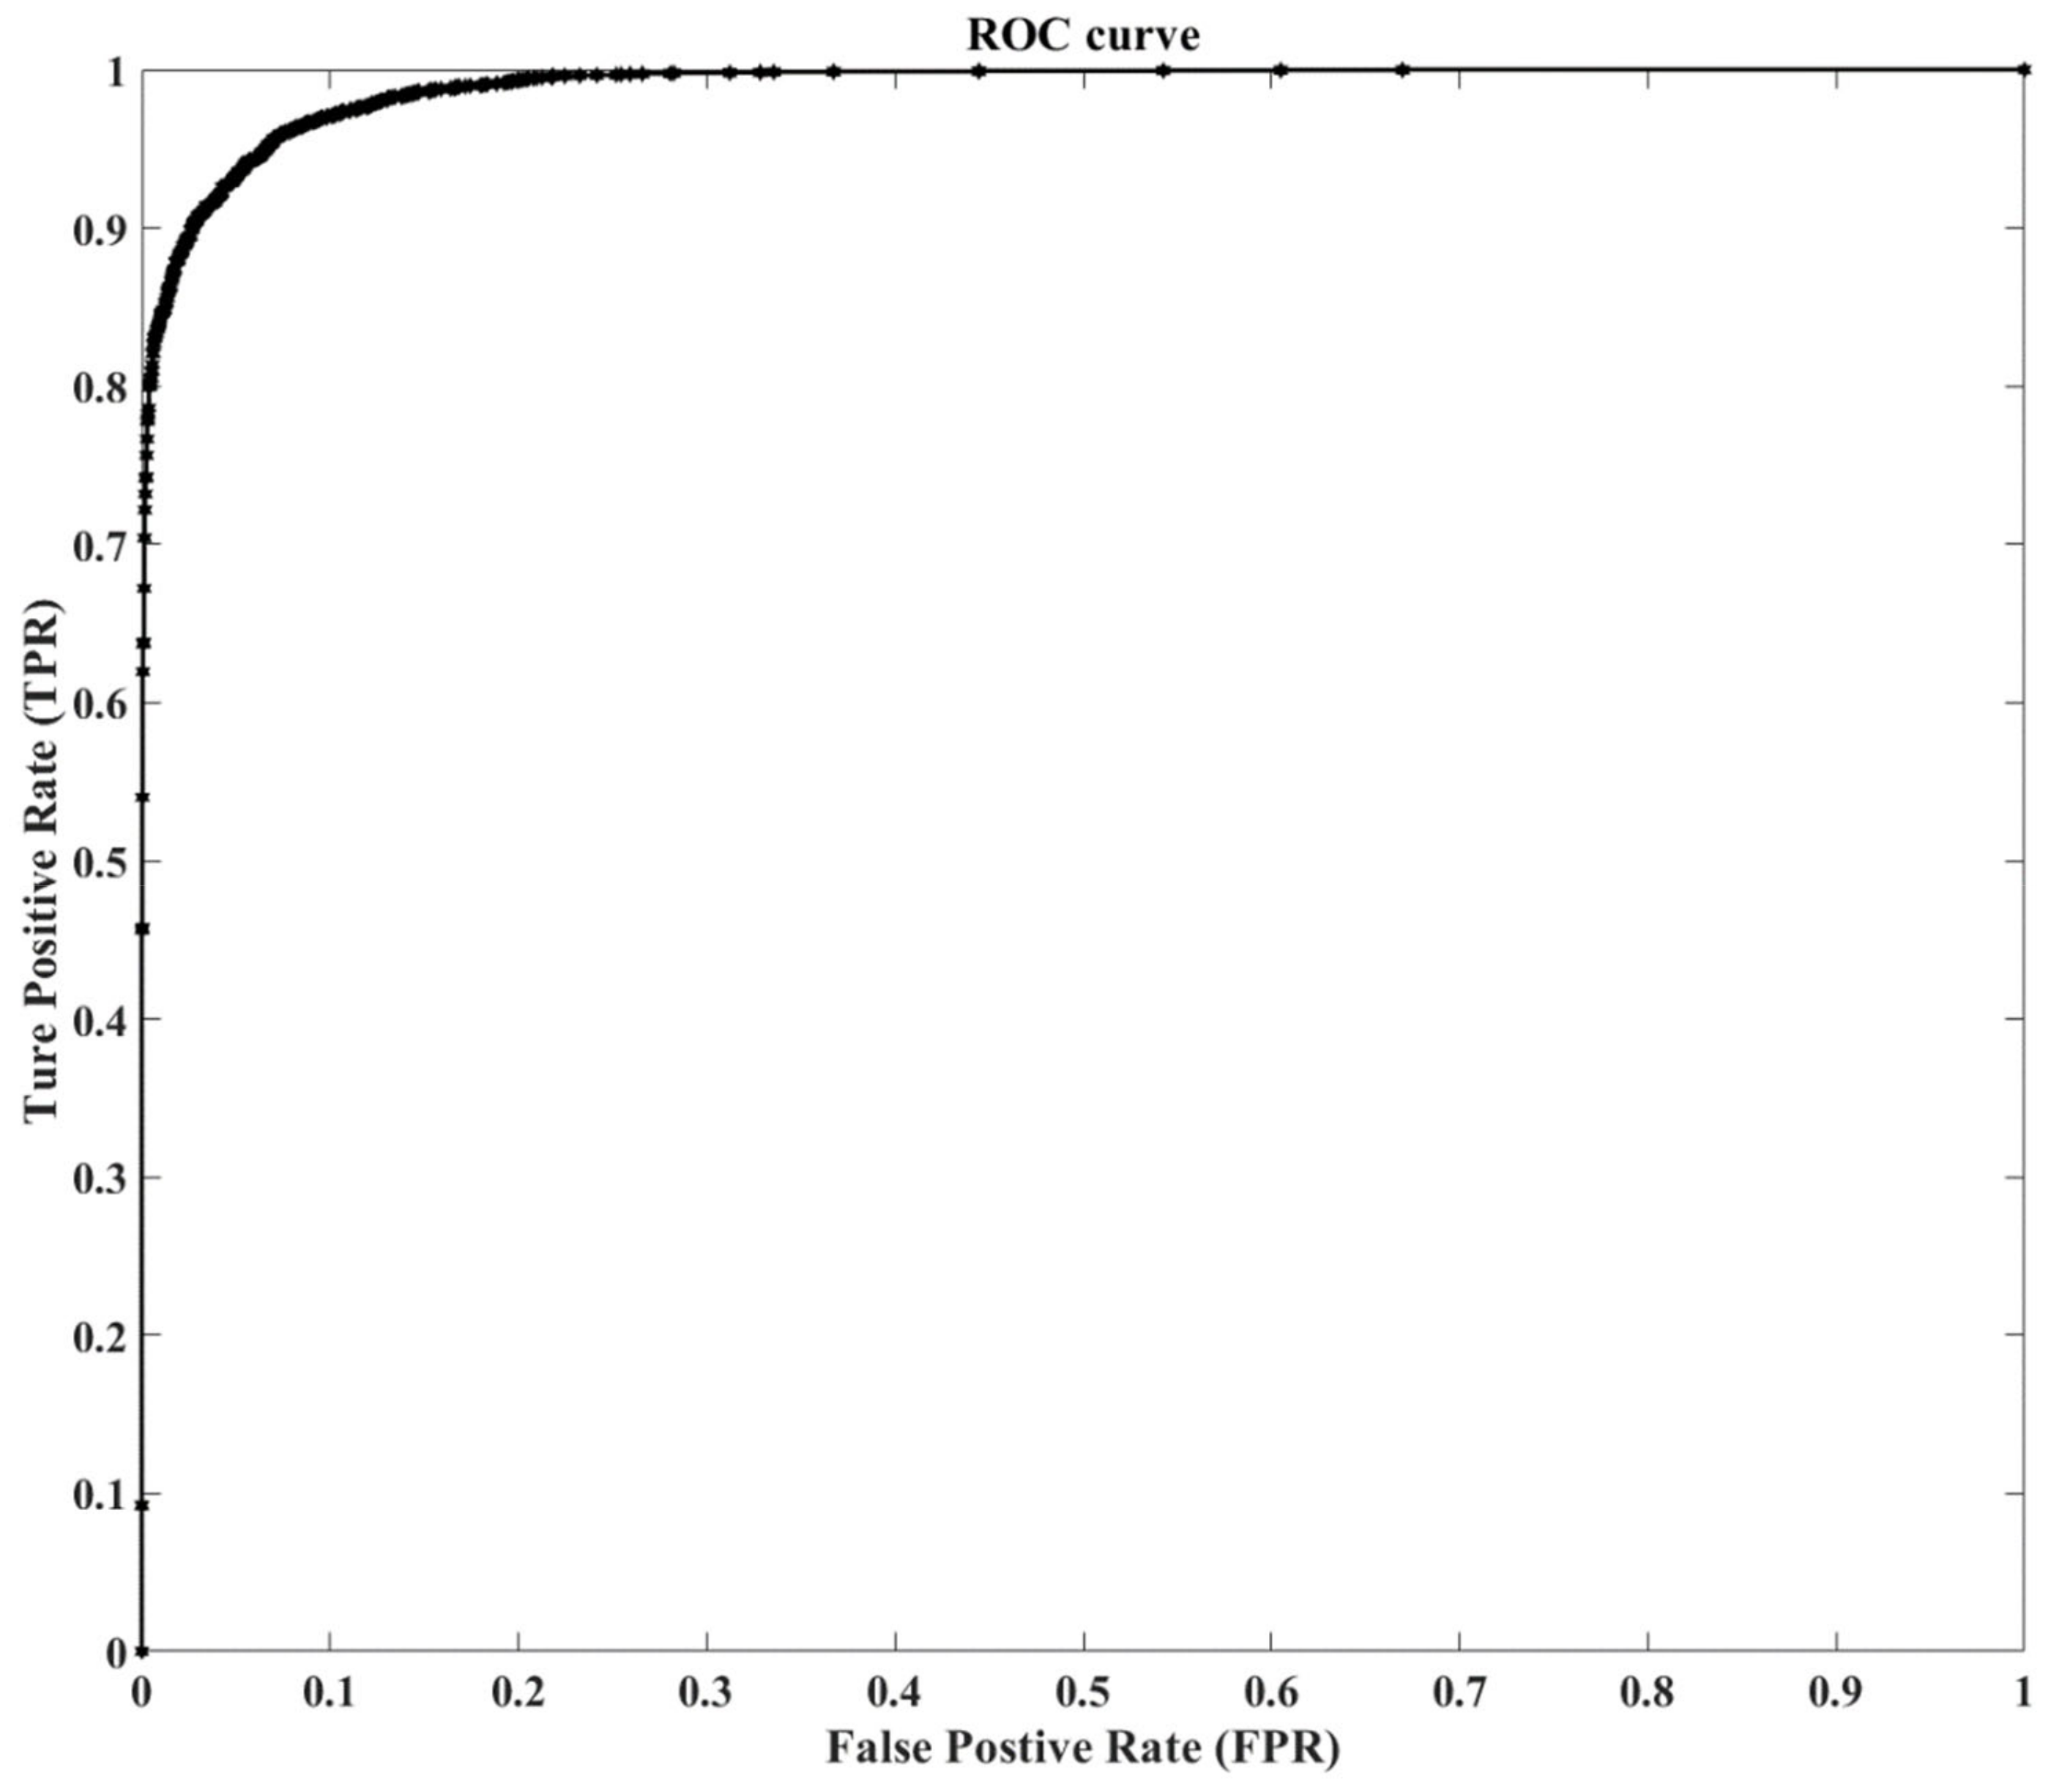
3.3. Classification Results

The ViT classifier model was trained on pavement and concrete datasets. The proposed pavement dataset consists of 45K images with dimensions of 224 × 224, while the concrete dataset consists of the base dataset (25K images) and its seven subsets (20.8K, 15.6K, 13.4K, 10.4K, 8.4K, 5.6K, and 2.8K. The proposed ViT model showed promising accuracy after training on the pavement dataset. The performance of ViT was compared with various DL networks, that is, customized CNN [12], VGG16 [54], VGG19 [54], ResNet50 [55] and Inceptionv3 [56], to prove its effectiveness in performing crack-detection tasks. Table 2 contains a list of each model’s parameters, model size, and input-patch size. In spite of the fact that the ViT transformer has fewer parameters and is smaller in size compared to the customized CNN model, its complexity is lower than that of the pretrained deep-learning models. The model performance was assessed based on new test data that was not utilized during the previous phases of training and validation. A summary of the overall results of all the models used in this study can be found in Table 3. The ViT classifier and customized CNN model outperformed the other pretrained DL models in terms of all evaluation metrics. The ViT classifier achieved a validation accuracy of 0.968, testing accuracy of 0.960, precision of 0.971, recall of 0.950, and an F1 score of 0.960. The validation accuracy and loss curve (training and validation) of ViT is depicted in Figure 7a,b. No divergence can be observed in either the training or validation graphs of accuracy and loss, which demonstrates that the model possesses superior generalization capacity and is not susceptible to overfitting. As depicted in Figure 7, at the 300th epoch, the ViT model loss stabilized, and subsequent epochs showed no additional improvement in accuracy.
Owing to its slow initial convergence, the ViT classifier requires a large number of iterations before producing reliable results. Figure 8 depicts the ViT model’s receiver-operating-characteristic (ROC) curve. Based on the ROC curve, sensitivity (or true positive rate) and specificity (1-false positive rate) are weighed against each other. Almost reaching the upper left-hand corner of the diagram, the obtained curve is good for the model, as it indicates better performance. The proposed model’s false positive rate is 0.03 and its area under the ROC curve (AUC) is 0.97. This suggests that the algorithm can distinguish samples with cracks from those without, with an accuracy of 97%.
However, DL models do not require a high number of epochs, because doing so would lead to overfitting of the models. The CNN model obtained a desirable performance in terms of the evaluation metrics. The model achieved 0.947 validation accuracy, 0.940 testing accuracy, 0.945 precision, 0.938 recall, and a 0.941 F1 score. The high accuracy of the customized CNN model at lower epochs was achieved using an activation function, dropout function, and hyperparameter optimization, all of which allowed the model to skip undesirable features at lower epochs. Among the pretrained models, the VGG16, VGG19, and InceptionV3 models showed comparable performance, while the ResNet50 model did not show promising performance, achieving a testing accuracy of 0.704 on the proposed crack 45K dataset, as illustrated in Table 3. VGG16, Inceptionv3, and VGG19 achieved testing accuracies of 0.906, 0.905, and 0.895, respectively.
A comparison of the ViT and DL models proposed in our earlier study [12] based on a concrete dataset comprised of 8K images, is summarized in Table 4. The testing accuracies of the models were all greater than 0.90, and their other performance measures were comparable. The testing accuracy, precision, recall, and F1 score for the ViT model were 0.974, 0.993, 0.957, and 0.975, respectively; these numbers were superior to those of the CNN model [12]. The InceptionV3 model performance is comparable with that of the proposed ViT model, achieving a testing accuracy of 0.982; however, it requires twice as much computation time and twice as many parameters. The VGG model complexity was 12–13 times greater than that of the ViT model, and it demonstrated a slightly lower performance. The VGG16 and VGG19 models achieved a test accuracy of 0.986 and 0.960, respectively. The capability acquired by the VGG16 and 19 models is easily transferable to other types of structures. The ResNet classifier fared poorly on the concrete data, with an overall testing accuracy of 0.916, which is similar to the performance on the pavement dataset. Both concrete and pavement offer a sufficient degree of variation between the samples, and obtain the greatest performance possible in the crack-detection task utilizing the ViT transformer.
A test image with dimensions of 2240 × 2240 pixels was used to evaluate the single-patch computational time of all algorithms. This image contained a hundred patches of 224 × 224 pixels. Using the Inception-V3 model, a 2290 × 2290 test image with 100 × 229 × 229 patches was chosen. The single-patch computation time was calculated by dividing the total time required to process the entire image by 100. Table 5 shows the computational times of all the algorithms. The CNN model had the least single-patch computing time, of 0.0048 s, followed by the ViT model. Compared to the VGG pretrained models, ViT classifies a patch in 0.0380 s, which is five times faster than ResNet50, two times faster than VGG, but eight times slower than the CNN model. Compared to VGG16 and VGG19, ResNet-50’s single-patch classification time of 0.0662 s is slower, but faster than those of the Inception V3, custom CNN and ViT models. Compared to other models, VGG19’s patch-classification-time requirement of 0.2093 s was the longest. The time required to infer the whole image was recorded as 0.48 s for the customized CNN model, 3.80 s for the ViT model, 19.95 s for the VGG19 model, 6.62 s for the ResNet50 model, and 3.85 s for the InceptionV3 model. In general, the ViT model achieved a lower inference-time and complexity, and fewer parameters, in comparison with the pretrained DL models considered in the proposed study.
The ViT model performance was compared with the DL approaches that are currently accessible in the literature and are based on the CCIC [57] and SDNET [58] datasets. Both datasets were combined in our earlier work [12], to produce a new dataset consisting of 25K images that had a sufficient level of variation among the samples. We do not provide a comparison using the recommended self-created Crack45 dataset, because in the absence of a unified analysis, it is difficult to compare algorithms accurately. The model comparison on the concrete dataset is presented in Table 6. It is evident from the table that the ViT model shows better performance than the DL models in terms of various assessment metrics. Using 18K images from the SDNET [57] dataset, the authors in [59] trained a DCNN model, which resulted in an accuracy of 0.97 and an F1 score of 0.800. Similarly, in [60,61,62], the authors used a DCNN to detect cracks in a variety of civil infrastructures by using the SDNET and CCIC datasets. The results showed that all models attained a promising level of performance. Lu et al. [63] introduced the MSCNet architecture, which comprises feature aggregation and enhancement modules. On a combined dataset of 30K images from SDNET [57] + CCIC [58], the MSCNet architecture was evaluated in comparison to a number of different DL models, and showed promising performance. Zheng et al. [64] used 30K images from the SDNET and CCIC datasets to train their newly suggested ISSD architecture, with impressive results. In [12], the authors proposed a CNN model and compared its performance to that of a variety of pretrained architectures by employing 25K images taken from the CCIC and SDNET datasets. The proposed CNN model surpassed the pretrained models, based on various assessment metrics. In contrast, the proposed ViT was trained on the same 25K dataset, and it achieved 0.974 accuracy, 0.993 precision, 0.955 recall, and a 0.974 F1 score. The model demonstrated greater performance than the DL model in concrete-crack-detection.

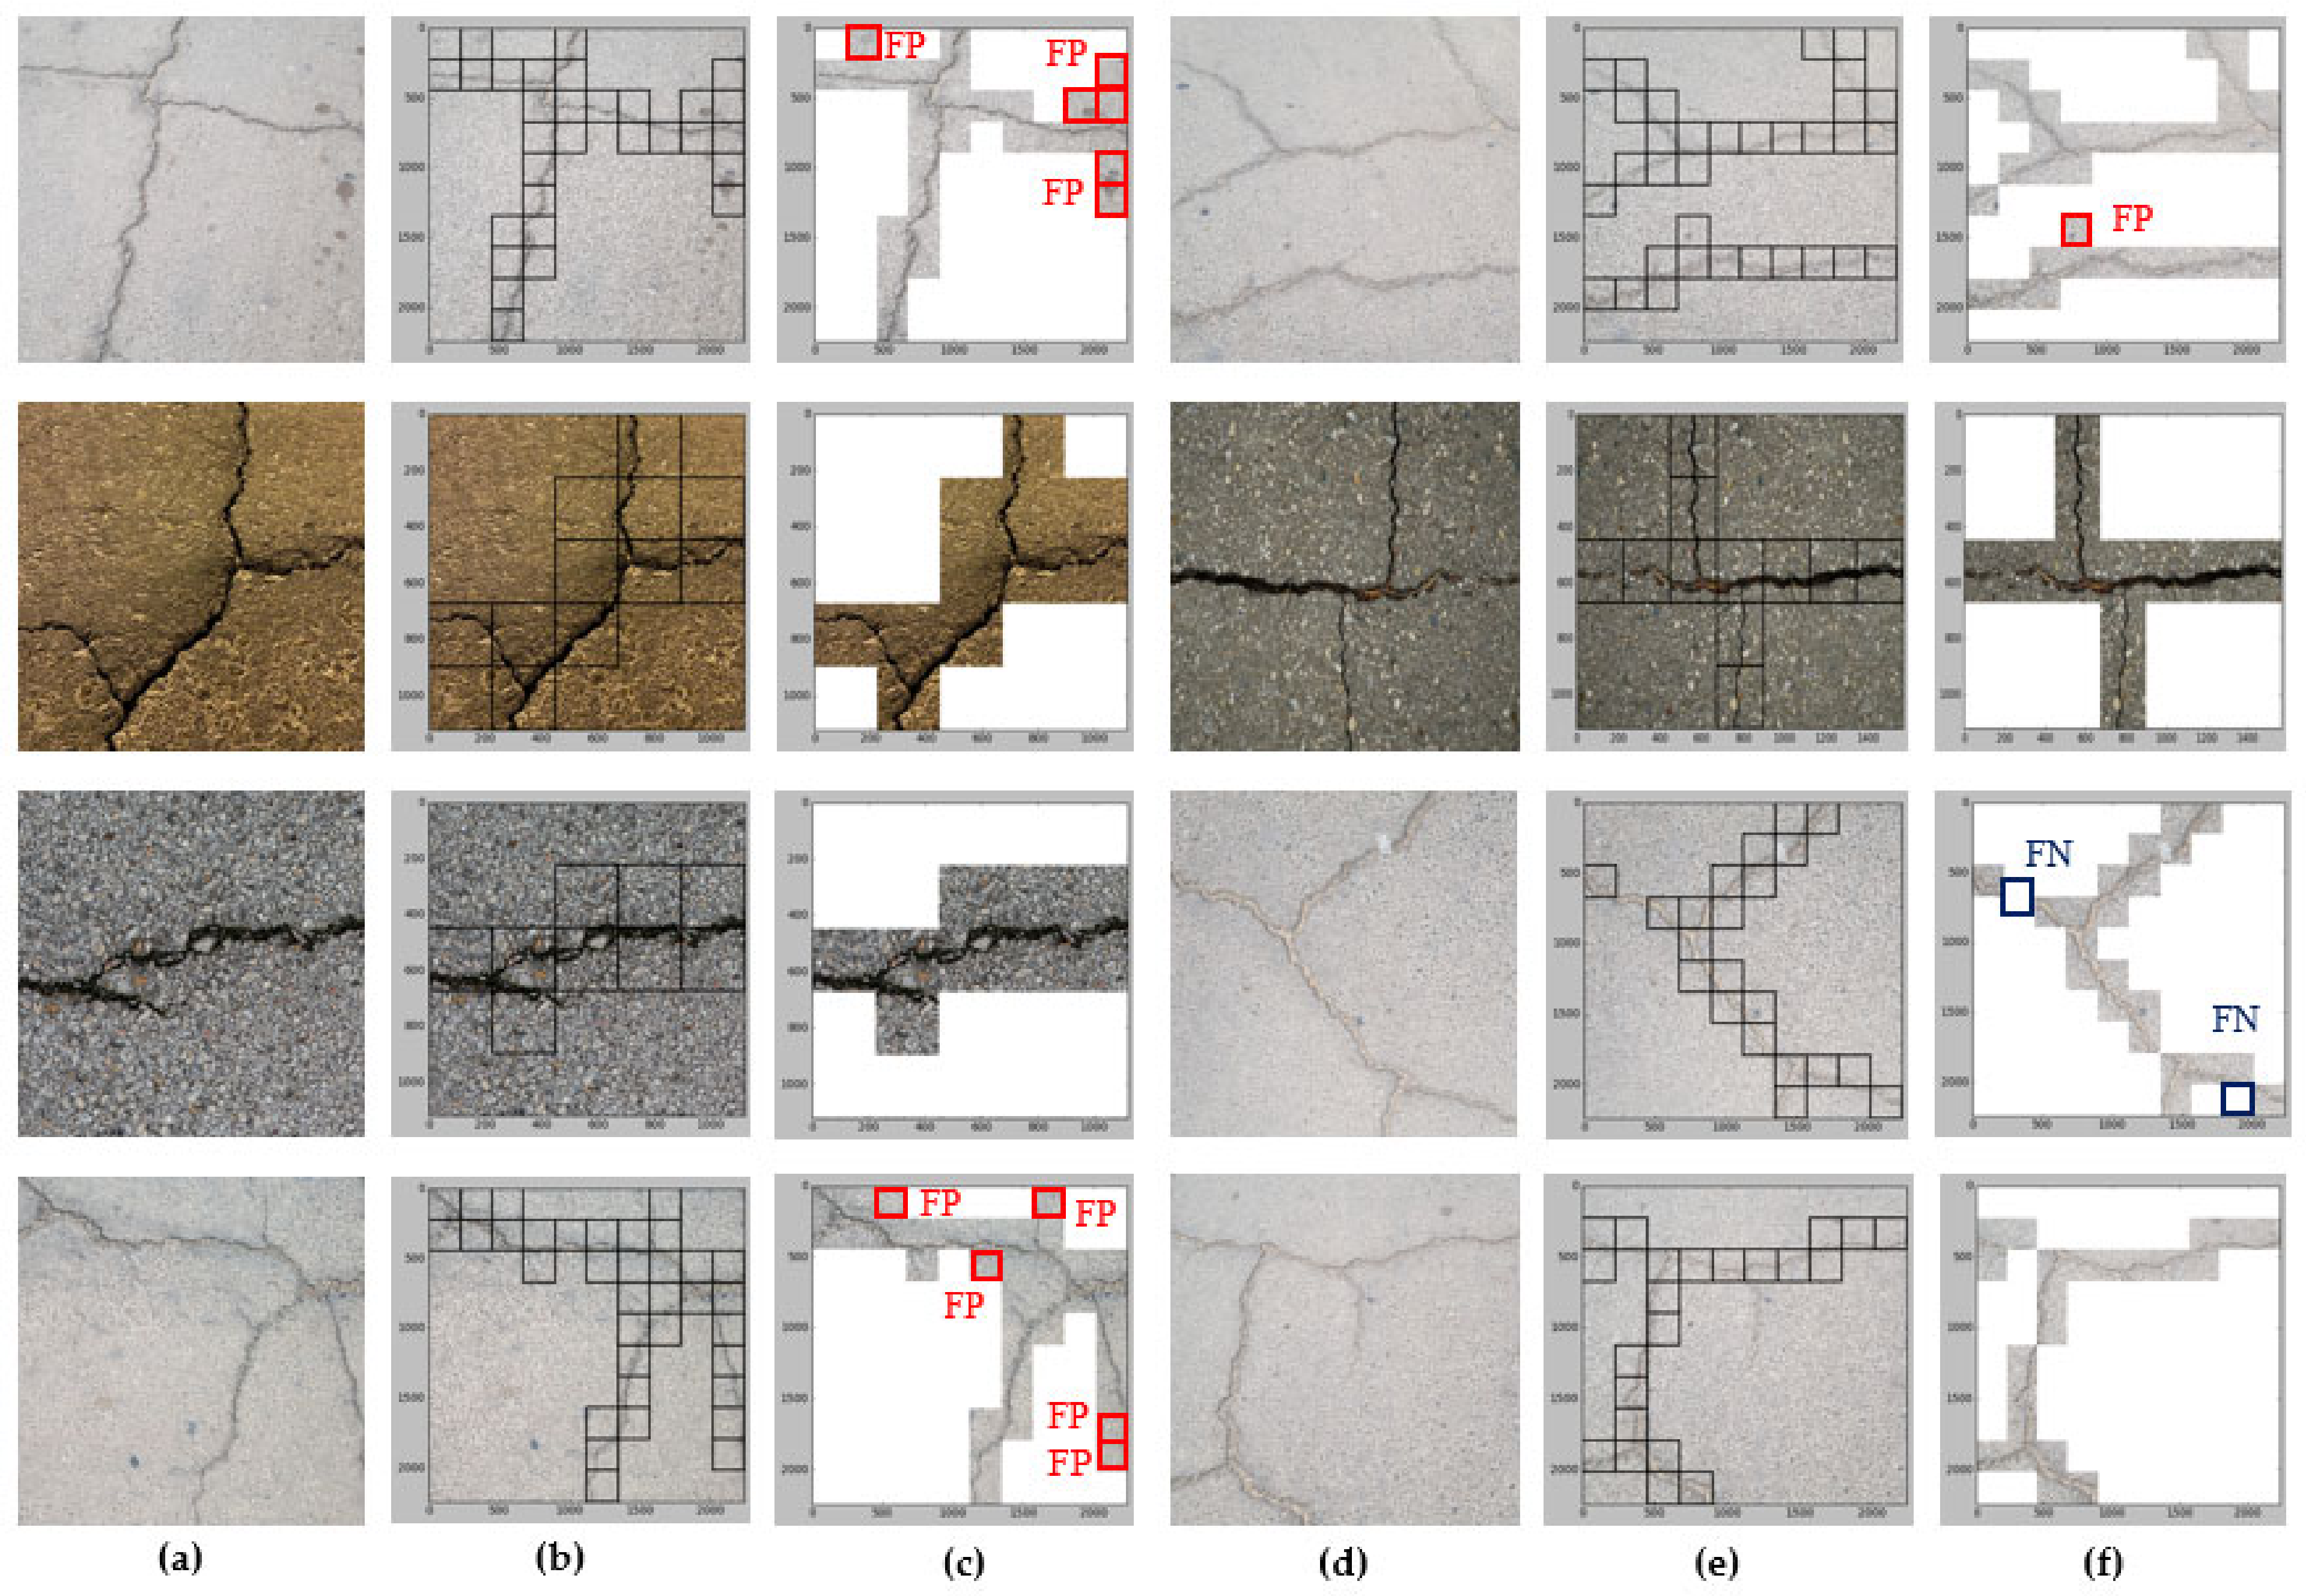
3.4. Localization Results

In the proposed study, the ViT model was integrated with the SW technique to create a crack-localization map. A new batch of images not used in training or validation was fed to the model in order to evaluate its performance in determining crack locations, as shown in Figure 9a,d. A window with dimensions of 224 × 224 was slid across the entire image, and the ViT model was used to classify each window patch. The window was moved from left to right by 224 pixels and up and down by 224 pixels, until the entire image was scanned. The areas indicated by the classifier with cracks are denoted by the areas within the black bounding-boxes. The crack-localization results of the ViT model are shown in Figure 9b,e, whereas Figure 9c,f illustrate the scanning findings for the FP and FN, respectively. The FN patches are indicated by dark blue boxes and the FP patches are indicated by red boxes. The results of the scanning show that the false positives are higher than the false negatives, owing to the fact that the region is similar to cracks. In general, fewer FP and FN patches were observed in the scanned images, demonstrating the capability of the model to perform crack identification in an effective manner.

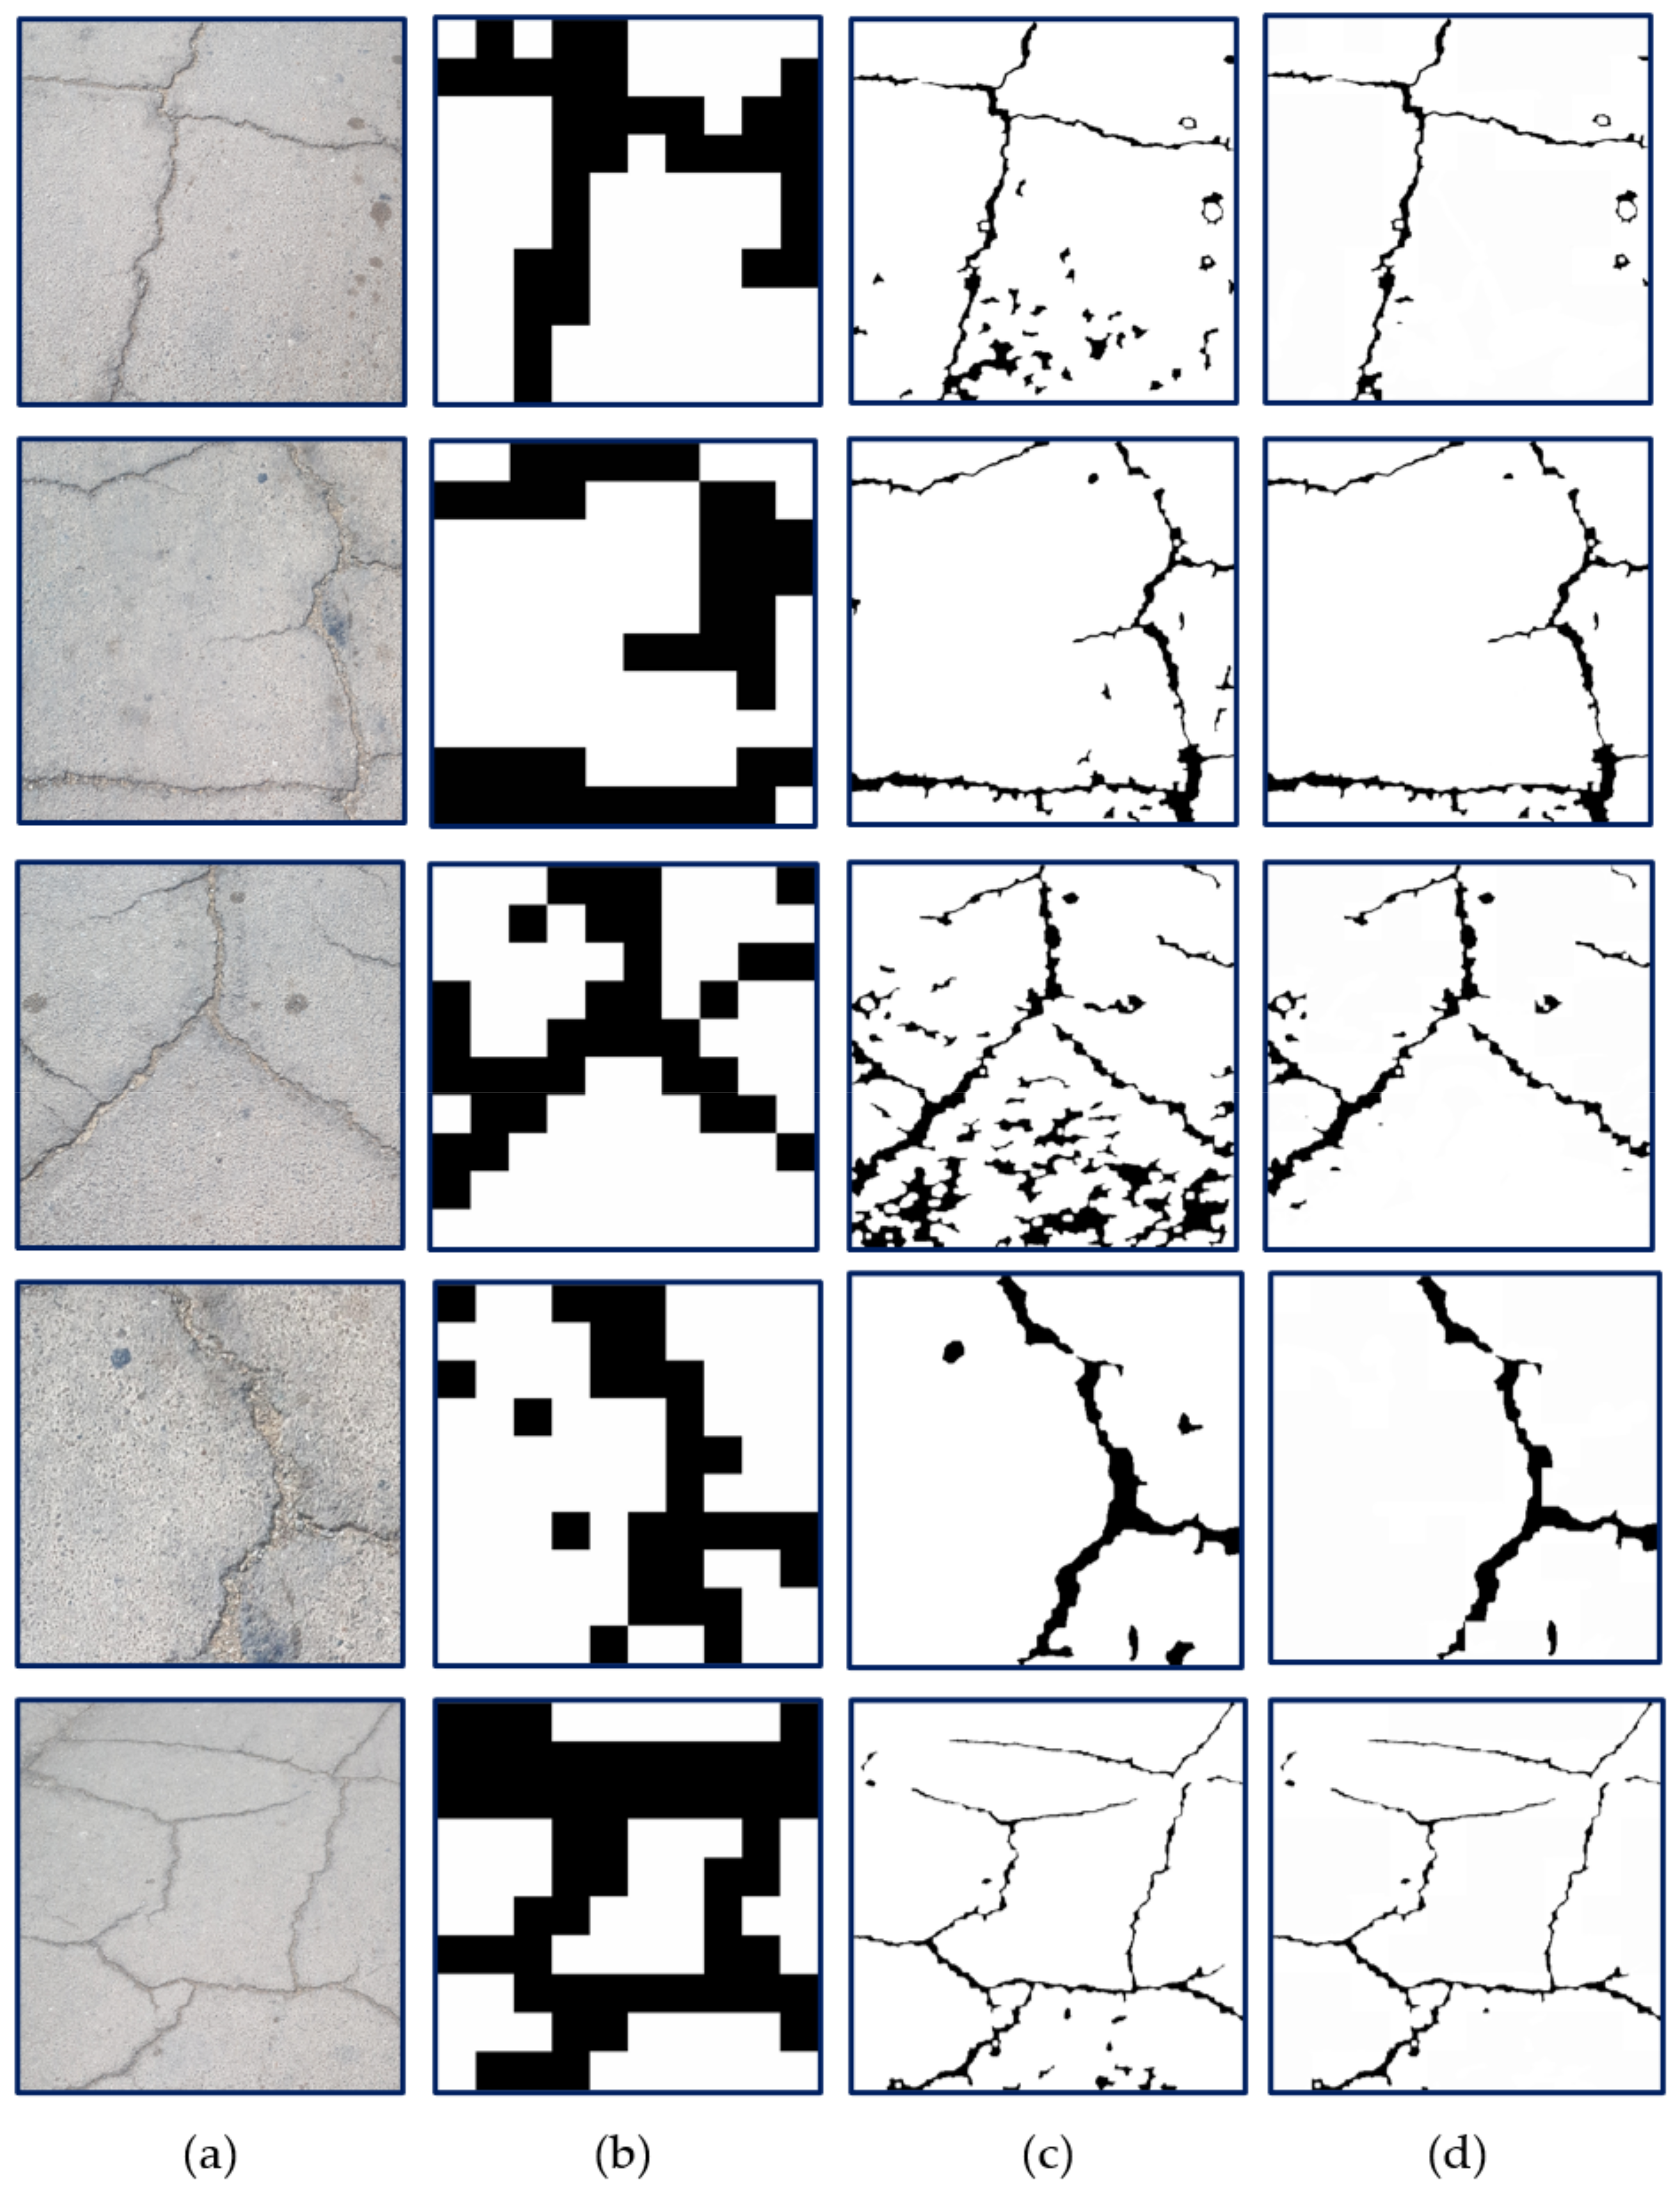
3.5. Segmentation Results

In the proposed study, the binary localization map obtained from the sliding-window-based ViT was merged with the segmentation map acquired from the TuFF algorithm to obtain the segmentation results, as shown in Figure 10. The original images and localization mapping achieved from the sliding-window-based ViT are shown in Figure 10a,b. The mapping acquired from the TuFF approach is depicted in Figure 10c, and consists of unwanted pixels which are unrelated to the crack regions. The TuFF algorithm did not perform well on the pavement surface, owing to the complex nature and irregularity of the cracks. Therefore, to filter out the noise (the unwanted regions) surrounding the cracks, the results of the TuFF algorithm were multiplied with the localized map obtained from the ViT transformer. After multiplication, the output was passed through a bilateral filter for any existing noise, and morphological operations are performed. The outcomes of these operations are depicted in Figure 10d. Most of the unwanted pixels were removed after the multiplication of the results from both algorithms; however, the final crack map still consists of unwanted pixels, which are due to the oily regions in the input images that resemble cracks. These noisy regions were due to the FP patches classified by the ViT classifier. These regions can be removed by further enhancing localization mapping by reducing the number of FP patches in the ViT results.

4. Discussion

In this study, an integrated framework of a ViT and an SW approach is proposed, to detect and localize cracks in pavement and concrete surfaces. The patch-based classification technique was utilized by the integrated architecture to achieve a crack-localization map, which was then combined with the TuFF algorithm to effectively segment the crack region. The performance of the ViT framework was compared with that of various DL models on concrete and pavement datasets. The results shows that the model’s performance is comparable for both datasets, and the ViT model outperformed the other DL models, based on different assessment metrics. This is because the transformer structure can globally extract spatial features from the input image, which is the same as having a large receptive field. It is also clear from the results that the concrete- and pavement-datasets had sufficient variance between samples to maximize the ViT transformer’s effectiveness in a crack-detection task. Additionally, it is evident that the ViT framework requires more training epochs than the DL modes, because of its delayed convergence in the earlier epochs. Early epochs showed faster convergence for the DL models, and high-scoring results did not require additional iterations. The experimental results in Table 4 and Table 5 show that the ViT model surpasses the pretrained DL-models considered in this study in terms of inference time and computational complexity, both of which have significant effects on the performance of the model. We further demonstrated the higher performance of the ViT model by comparing it to earlier CNN-based investigations that used the same publicly available concrete-dataset, as shown in Table 6.
Figure 9’s localization mapping, in which a relatively small number of FP and FN patches can be seen, demonstrates that the combination of the ViT transformer and sliding-window approach can effectively localize crack locations. The FP patches, of which there are more than the FN patches, can be found in the oily region that resembles the crack, and can be reduced by adding more images that contain the oily patches, to the training. In addition, it is demonstrated that combining the localization-mapping findings with those from the TuFF algorithms can further improve crack-mapping results. Combining the outcomes of the two algorithms facilitates the elimination of irrelevant pixels, and makes the process of crack-segmentation more accurate. It is also clear from the results that the effectiveness of the final crack-mapping relies heavily on the localization-mapping from the ViT transformer. The fewer FPs in the localization, the more effective the final crack-mapping. The results from Figure 10 also show that the combined approach can be used as an automatic tool for crack-segmentation dataset labeling, to overcome the problem of manual labeling, which is labor-intensive and time-consuming. However, further improvement is required in both approaches to remove the unwanted pixels shown in Figure 10d.

5. Conclusions

From the above discussion, it can be concluded that the ViT transformer in combination with the sliding-window approach and the TuFF algorithm can be used to perform crack-detection, localization, and segmentation tasks, efficiently. It can also be concluded that the transformer architecture can extract global-scale spatially-associated information, making it possible to detect cracks in digital images of various sizes. In addition to the DL approaches, ViT can be used to detect and localize cracks in civil structures. The ViT model has superior accuracy across training, validation, and testing, and its learned features ensure an optimal efficiency. It is also feasible to conclude that the combined technique (sliding-window-based ViT + TuFF) has the potential to replace the conventional manual labeling of segmentation datasets with one that is less arduous and requires less time to complete. Overall, the proposed method shows the effectiveness of ViTs in automatic crack-detection on pavement and concrete surfaces. The model ensures that civil structures are inspected regularly and automatically, by providing information about their condition from the data they store. The key benefit of the system is its capacity to automatically locate cracks and segment them with little processing. As more data are provided from a wider variety of structures, the system can be upgraded to identify various problems in concrete buildings. However, the system is not yet able to segment cracks effectively. In the future, we plan to investigate other ViT variants [66,67,68] for crack-detection in civil structures. Additionally, the performance of TuFF algorithms will be enhanced to perform initial crack-mapping efficiently. Moreover, the crack-segmentation results are compared with various SOTA DL-based segmentation algorithms, which is a limitation of the proposed method.

Author Contributions

Conceptualization, L.A., F.A. and H.A.J.; methodology, L.A., W.K., H.A.J. and F.A.; writing—original draft preparation, L.A., H.A.J. and F.A.; writing—review and editing, F.A.-N, H.A.J., W.K. and L.A. All authors have read and agreed to the published version of the manuscript.

Funding

This research received no external funding.

Institutional Review Board Statement

Not applicable.

Informed Consent Statement

Not applicable.

Data Availability Statement

Not applicable.

Conflicts of Interest

The authors declare no conflict of interest.

References

  1. Zou, Q.; Cao, Y.; Li, Q.; Mao, Q.; Wang, S. CrackTree: Automatic crack detection from pavement images. Pattern Recognit. Lett. 2012, 33, 227–238. [Google Scholar] [CrossRef]
  2. Abdel-Qader, I.; Abudayyeh, O.; Kelly, M.E. Analysis of Edge-Detection Techniques for Crack Identification in Bridges. J. Comput. Civ. Eng. 2003, 17, 255–263. [Google Scholar] [CrossRef] [Green Version]
  3. Kamaliardakani, M.; Sun, L.; Ardakani, M.K. Sealed-Crack Detection Algorithm Using Heuristic Thresholding Approach. J. Comput. Civ. Eng. 2016, 30, 04014110. [Google Scholar] [CrossRef]
  4. Li, Q.; Zou, Q.; Zhang, D.; Mao, Q. FoSA: F* Seed-growing Approach for crack-line detection from pavement images. Image Vis. Comput. 2011, 29, 861–872. [Google Scholar] [CrossRef]
  5. Sinha, S.K.; Fieguth, P.W. Morphological segmentation and classification of underground pipe images. Mach. Vis. Appl. 2006, 17, 21. [Google Scholar] [CrossRef]
  6. Sinha, S.K.; Fieguth, P.W. Automated detection of cracks in buried concrete pipe images. Autom. Constr. 2006, 15, 58–72. [Google Scholar] [CrossRef]
  7. Chambon, S.; Subirats, P.; Dumoulin, J. Introduction of a wavelet transform based on 2D matched filter in a Markov random field for fine structure extraction: Application on road crack detection. In Image Processing: Machine Vision Applications II, Proceedings of the IS&T/SPIE Electronic Imaging 2009, San Jose, CA, USA, 18–22 January 2009; Niel, K.S., Fofi, D., Eds.; Society of Photo-Optical Instrumentation Engineers: Bellingham, WA, USA, 2009; Volume 7251, pp. 87–98. [Google Scholar] [CrossRef]
  8. Fujita, Y.; Hamamoto, Y. A robust automatic crack detection method from noisy concrete surfaces. Mach. Vis. Appl. 2011, 22, 245–254. [Google Scholar] [CrossRef]
  9. Roychowdhury, S.; Diligenti, M.; Gori, M. Regularizing deep networks with prior knowledge: A constraint-based approach. Knowl.-Based Syst. 2021, 222, 106989. [Google Scholar] [CrossRef]
  10. Spencer, B.F., Jr.; Hoskere, V.; Narazaki, Y. Advances in Computer Vision-Based Civil Infrastructure Inspection and Monitoring. Engineering 2019, 5, 199–222. [Google Scholar] [CrossRef]
  11. Gomes, G.F.; Mendéz, Y.A.D.; da Silva Lopes Alexandrino, P.; da Cunha, S.S., Jr.; Ancelotti, A.C., Jr. The use of intelligent computational tools for damage detection and identification with an emphasis on composites–A review. Compos. Struct. 2018, 196, 44–54. [Google Scholar] [CrossRef]
  12. Ali, L.; Alnajjar, F.; Jassmi, H.A.; Gocho, M.; Khan, W.; Serhani, M.A. Performance Evaluation of Deep CNN-Based Crack Detection and Localization Techniques for Concrete Structures. Sensors 2021, 21, 1688. [Google Scholar] [CrossRef] [PubMed]
  13. Zhang, A.; Wang, K.C.P.; Fei, Y.; Liu, Y.; Tao, S.; Chen, C.; Li, J.Q.; Li, B. Deep Learning–Based Fully Automated Pavement Crack Detection on 3D Asphalt Surfaces with an Improved CrackNet. J. Comput. Civ. Eng. 2018, 32, 04018041. [Google Scholar] [CrossRef] [Green Version]
  14. Yu, Y.; Samali, B.; Rashidi, M.; Mohammadi, M.; Nguyen, T.N.; Zhang, G. Vision-based concrete crack detection using a hybrid framework considering noise effect. J. Build. Eng. 2022, 61, 105246. [Google Scholar] [CrossRef]
  15. Mohtasham Khani, M.; Vahidnia, S.; Ghasemzadeh, L.; Ozturk, Y.E.; Yuvalaklioglu, M.; Akin, S.; Ure, N.K. Deep-learning-based crack detection with applications for the structural health monitoring of gas turbines. Struct. Health Monit. 2020, 19, 1440–1452. [Google Scholar] [CrossRef]
  16. Zhang, Y.; Yuen, K.-V. Review of artificial intelligence-based bridge damage detection. Adv. Mech. Eng. 2022, 14, 16878132221122770. [Google Scholar] [CrossRef]
  17. Dais, D.; Bal, İ.E.; Smyrou, E.; Sarhosis, V. Automatic crack classification and segmentation on masonry surfaces using convolutional neural networks and transfer learning. Autom. Constr. 2021, 125, 103606. [Google Scholar] [CrossRef]
  18. Ali, L.; Alnajjar, F.; Khan, W.; Serhani, M.A.; Al Jassmi, H. Bibliometric Analysis and Review of Deep Learning-Based Crack Detection Literature Published between 2010 and 2022. Buildings 2022, 12, 432. [Google Scholar] [CrossRef]
  19. Park, S.; Bang, S.; Kim, H.; Kim, H. Patch-Based Crack Detection in Black Box Images Using Convolutional Neural Networks. J. Comput. Civ. Eng. 2019, 33, 04019017. [Google Scholar] [CrossRef]
  20. Cha, Y.-J.; Choi, W.; Büyüköztürk, O. Deep Learning-Based Crack Damage Detection Using Convolutional Neural Networks. Comput.-Aided Civ. Infrastruct. Eng. 2017, 32, 361–378. [Google Scholar] [CrossRef]
  21. Ali, L.; Valappil, N.K.; Kareem, D.N.A.; John, M.J.; Al Jassmi, H. Pavement Crack Detection and Localization using Convolutional Neural Networks (CNNs). In Proceedings of the 2019 International Conference on Digitization (ICD), Sharjah, United Arab Emirates, 18–19 November 2019; pp. 217–221. [Google Scholar] [CrossRef]
  22. Ali, L.; Harous, S.; Zaki, N.; Khan, W.; Alnajjar, F.; Al Jassmi, H. Performance Evaluation of different Algorithms for Crack Detection in Concrete Structures. In Proceedings of the 2021 2nd International Conference on Computation, Automation and Knowledge Management (ICCAKM), Dubai, United Arab Emirates, 19–21 January 2021; pp. 53–58. [Google Scholar]
  23. Ali, L.; Alnajjar, F.; Zaki, N.; Aljassmi, H. Pavement Crack Detection by Convolutional AdaBoost Architecture. In Proceedings of the 8th Zero Energy Mass Custom Home International Conference (ZEMCH 2021), Dubai, United Arab Emirates, 26–28 October 2021; pp. 383–394. [Google Scholar]
  24. Ali, L.; Sallabi, F.; Khan, W.; Alnajjar, F.; Aljassmi, H. A Deep Learning-Based Multi-Model Ensemble Method for Crack Detection in Concrete Structures: 38th International Symposium on Automation and Robotics in Construction, ISARC 2021. In Proceedings of the 38th International Symposium on Automation and Robotics in Construction, ISARC 2021, Dubai, United Arab Emirates, 2–4 November 2021; pp. 410–418. [Google Scholar]
  25. Pan, Y.; Zhang, G.; Zhang, L. A spatial-channel hierarchical deep learning network for pixel-level automated crack detection. Autom. Constr. 2020, 119, 103357. [Google Scholar] [CrossRef]
  26. Dong, Z.; Wang, J.; Cui, B.; Wang, D.; Wang, X. Patch-based weakly supervised semantic segmentation network for crack detection. Constr. Build. Mater. 2020, 258, 120291. [Google Scholar] [CrossRef]
  27. Zhang, L.; Shen, J.; Zhu, B. A research on an improved Unet-based concrete crack detection algorithm. Struct. Health Monit. 2021, 20, 1864–1879. [Google Scholar] [CrossRef]
  28. Mei, Q.; Gül, M. Multi-level feature fusion in densely connected deep-learning architecture and depth-first search for crack segmentation on images collected with smartphones. Struct. Health Monit. 2020, 19, 1726–1744. [Google Scholar] [CrossRef]
  29. Ye, X.-W.; Jin, T.; Chen, P.-Y. Structural crack detection using deep learning–based fully convolutional networks. Adv. Struct. Eng. 2019, 22, 3412–3419. [Google Scholar] [CrossRef]
  30. Xue, Y.; Li, Y. A Fast Detection Method via Region-Based Fully Convolutional Neural Networks for Shield Tunnel Lining Defects. Comput.-Aided Civ. Infrastruct. Eng. 2018, 33, 638–654. [Google Scholar] [CrossRef]
  31. Hoskere, V.; Narazaki, Y.; Hoang, T.A.; Spencer, B.F., Jr. MaDnet: Multi-task semantic segmentation of multiple types of structural materials and damage in images of civil infrastructure. J. Civil. Struct. Health Monit. 2020, 10, 757–773. [Google Scholar] [CrossRef]
  32. Alipour, M.; Harris, D.K.; Miller, G.R. Robust Pixel-Level Crack Detection Using Deep Fully Convolutional Neural Networks. J. Comput. Civ. Eng. 2019, 33, 04019040. [Google Scholar] [CrossRef]
  33. Yang, X.; Li, H.; Yu, Y.; Luo, X.; Huang, T.; Yang, X. Automatic Pixel-Level Crack Detection and Measurement Using Fully Convolutional Network. Comput.-Aided Civ. Infrastruct. Eng. 2018, 33, 1090–1109. [Google Scholar] [CrossRef]
  34. Dung, C.V.; Anh, L.D. Autonomous concrete crack detection using deep fully convolutional neural network. Autom. Constr. 2019, 99, 52–58. [Google Scholar] [CrossRef]
  35. Islam, M.M.M.; Kim, J.-M. Vision-Based Autonomous Crack Detection of Concrete Structures Using a Fully Convolutional Encoder–Decoder Network. Sensors 2019, 19, 4251. [Google Scholar] [CrossRef] [Green Version]
  36. Wu, R.-T.; Singla, A.; Jahanshahi, M.R.; Bertino, E.; Ko, B.J.; Verma, D. Pruning deep convolutional neural networks for efficient edge computing in condition assessment of infrastructures. Comput.-Aided Civ. Infrastruct. Eng. 2019, 34, 774–789. [Google Scholar] [CrossRef]
  37. Shokri, P.; Shahbazi, M.; Lichti, D.; Nielsen, J. Vision-Based Approaches for Quantifying Cracks in Concrete Structures. In The International Archives of the Photogrammetry, Remote Sensing and Spatial Information Sciences; Paparoditis, N., Mallet, C., Lafarge, F., Remondino, F., Toschi, I., Fuse, T., Eds.; Copernicus GmbH: Göttingen, Germany, 2020; Volume XLIII-B2-2020, pp. 1167–1174. [Google Scholar] [CrossRef]
  38. Fang, J.; Qu, B.; Yuan, Y. Distribution equalization learning mechanism for road crack detection. Neurocomputing 2021, 424, 193–204. [Google Scholar] [CrossRef]
  39. Sizyakin, R.; Voronin, V.; Gapon, N.; Pižurica, A. A deep learning approach to crack detection on road surfaces. In Artificial Intelligence and Machine Learning in Defense Applications II, Proceedings of the SPIE Defense + Defence, Online, 21–25 September 2020; Dijk, J., Ed.; Society of Photo-Optical Instrumentation Engineers: Bellingham, WA, USA, 2020; Volume 11543, pp. 128–134. [Google Scholar]
  40. Andrushia, A.D.; Lubloy, E. Deep learning based thermal crack detection on structural concrete exposed to elevated temperature. Adv. Struct. Eng. 2021, 24, 1896–1909. [Google Scholar] [CrossRef]
  41. Kanaeva, I.A.; Ivanova, J.A. Road pavement crack detection using deep learning with synthetic data. IOP Conf. Ser. Mater. Sci. Eng. 2021, 1019, 012036. [Google Scholar] [CrossRef]
  42. Ji, J.; Wu, L.; Chen, Z.; Yu, J.; Lin, P.; Cheng, S. Automated Pixel-Level Surface Crack Detection Using U-Net. In Multi-disciplinary Trends in Artificial Intelligence, Proceedings of the 12th Multi-disciplinary Trends in Artificial Intelligence (MIWAI 2018), Hanoi, Vietnam, 18–20 November 2018; Kaenampornpan, M., Malaka, R., Nguyen, D.D., Schwind, N., Eds.; Springer International Publishing: Cham, Switzerland, 2018; pp. 69–78. [Google Scholar]
  43. Liu, F.; Wang, L. UNet-Based Model for Crack Detection Integrating Visual Explanations. Construction and Building Materials 2022, 322, 126265. [Google Scholar] [CrossRef]
  44. Su, H.; Wang, X.; Han, T.; Wang, Z.; Zhao, Z.; Zhang, P. Research on a U-Net Bridge Crack Identification and Feature-Calculation Methods Based on a CBAM Attention Mechanism. Buildings 2022, 12, 1561. [Google Scholar] [CrossRef]
  45. Asadi Shamsabadi, E.; Xu, C.; Rao, A.S.; Nguyen, T.; Ngo, T.; Dias-da-Costa, D. Vision transformer-based autonomous crack detection on asphalt and concrete surfaces. Autom. Constr. 2022, 140, 104316. [Google Scholar] [CrossRef]
  46. Chen, L.-C.; Zhu, Y.; Papandreou, G.; Schroff, F.; Adam, H. Encoder-Decoder with Atrous Separable Convolution for Semantic Image Segmentation. In Proceedings of the 2018 European Conference on Computer Vision (ECCV), Munich, Germany, 8–14 September 2018; pp. 801–818. [Google Scholar]
  47. Ji, A.; Xue, X.; Wang, Y.; Luo, X.; Xue, W. An integrated approach to automatic pixel-level crack detection and quantification of asphalt pavement. Autom. Constr. 2020, 114, 103176. [Google Scholar] [CrossRef]
  48. Dosovitskiy, A.; Beyer, L.; Kolesnikov, A.; Weissenborn, D.; Zhai, X.; Unterthiner, T.; Dehghani, M.; Minderer, M.; Heigold, G.; Gelly, S.; et al. An Image is Worth 16x16 Words: Transformers for Image Recognition at Scale 2021. arXiv 2020. [Google Scholar] [CrossRef]
  49. Mukherjee, S.; Condron, B.; Acton, S.T. Tubularity Flow Field—A Technique for Automatic Neuron Segmentation. IEEE Trans. Image Process. 2015, 24, 374–389. [Google Scholar] [CrossRef]
  50. Otsu, N. A Threshold Selection Method from Gray-Level Histograms. IEEE Trans. Syst. Man Cybern. 1979, 9, 62–66. [Google Scholar] [CrossRef] [Green Version]
  51. Acton, S.T. Fast Algorithms for Area Morphology. Digit. Signal Process. 2001, 11, 187–203. [Google Scholar] [CrossRef]
  52. Hao, M.; Lu, C.; Wang, G.; Wang, W. An Improved Neuron Segmentation Model for Crack Detection—Image Segmentation Model. Cybern. Inf. Technol. 2017, 17, 119–133. [Google Scholar] [CrossRef] [Green Version]
  53. Bazi, Y.; Bashmal, L.; Al Rahhal, M.M.; Al Dayil, R.; Al Ajlan, N. Vision Transformers for Remote Sensing Image Classification. Remote. Sens. 2021, 13, 516. [Google Scholar] [CrossRef]
  54. Simonyan, K.; Zisserman, A. Very deep convolutional networks for large-scale image recognition. arXiv 2014, arXiv:1409.1556. [Google Scholar]
  55. He, K.; Zhang, X.; Ren, S.; Sun, J. Deep Residual Learning for Image Recognition. In Proceedings of the 2016 IEEE Computer Society Conference on Computer Vision and Pattern Recognition (CVPR), Las Vegas, NV, USA, 27–30 June 2016; pp. 770–778. [Google Scholar] [CrossRef] [Green Version]
  56. Szegedy, C.; Vanhoucke, V.; Ioffe, S.; Shlens, J.; Wojna, Z. Rethinking the Inception Architecture for Computer Vision. In Proceedings of the 2016 IEEE Conference on Computer Vision and Pattern Recognition (CVPR), Las Vegas, NV, USA, 27–30 June 2016; pp. 2818–2826. [Google Scholar] [CrossRef] [Green Version]
  57. Dorafshan, S.; Thomas, R.J.; Maguire, M. SDNET2018: An annotated image dataset for non-contact concrete crack detection using deep convolutional neural networks. Data Brief 2018, 21, 1664–1668. [Google Scholar] [CrossRef]
  58. Özgenel, Ç.F. Concrete Crack Images for Classification. Mendeley Data 2019. [Google Scholar] [CrossRef]
  59. Dorafshan, S.; Thomas, R.J.; Maguire, M. Comparison of deep convolutional neural networks and edge detectors for image-based crack detection in concrete. Constr. Build. Mater. 2018, 186, 1031–1045. [Google Scholar] [CrossRef]
  60. Zhang, L.; Yang, F.; Daniel Zhang, Y.; Zhu, Y.J. Road crack detection using deep convolutional neural network. In Proceedings of the 2016 IEEE International Conference on Image Processing (ICIP), Phoenix, AZ, USA, 25–28 September 2016; pp. 3708–3712. [Google Scholar]
  61. Słoński, M. A comparison of deep convolutional neural networks for image-based detection of concrete surface cracks. Comput. Assist. Methods Eng. Sci. 2019, 26, 105–112. [Google Scholar] [CrossRef]
  62. Fang, F.; Li, L.; Gu, Y.; Zhu, H.; Lim, J.-H. A novel hybrid approach for crack detection. Pattern Recognit. 2020, 107, 107474. [Google Scholar] [CrossRef]
  63. Lu, G.; He, X.; Wang, Q.; Shao, F.; Wang, J.; Zhao, X. MSCNet: A Framework With a Texture Enhancement Mechanism and Feature Aggregation for Crack Detection. IEEE Access 2022, 10, 26127–26139. [Google Scholar] [CrossRef]
  64. Zheng, Y.; Gao, Y.; Lu, S.; Mosalam, K.M. Multistage semisupervised active learning framework for crack identification, segmentation, and measurement of bridges. Comput.-Aided Civ. Infrastruct. Eng. 2022, 37, 1089–1108. [Google Scholar] [CrossRef]
  65. Lu, G.; He, X.; Wang, Q.; Shao, F.; Wang, J.; Jiang, Q. Bridge crack detection based on improved single shot multi-box detector. PLoS ONE 2022, 17, e0275538. [Google Scholar] [CrossRef] [PubMed]
  66. Liu, Z.; Lin, Y.; Cao, Y.; Hu, H.; Wei, Y.; Zhang, Z.; Lin, S.; Guo, B. Swin Transformer: Hierarchical Vision Transformer Using Shifted Windows. In Proceedings of the 2021 IEEE/CVF International Conference on Computer Vision (ICCV), Montreal, QC, Canada, 10–17 October 2021; pp. 9992–10002. [Google Scholar] [CrossRef]
  67. Touvron, H.; Cord, M.; Douze, M.; Massa, F.; Sablayrolles, A.; Jegou, H. Training data-efficient image transformers & distillation through attention. In Proceedings of the 38th International Conference on Machine Learning (PMLR), Online, 18–24 July 2021; pp. 10347–10357. [Google Scholar]
  68. Han, K.; Xiao, A.; Wu, E.; Guo, J.; XU, C.; Wang, Y. Transformer in Transformer. In Advances in Neural Information Processing Systems 34, Proceedings of the 2021 Advances in Neural Information Processing Systems (NeurIPS 2021), Online, 6–14 December 2021; Ranzato, M., Beygelzimer, A., Dauphin, Y., Liang, P.S., Wortman Vaughan, J., Eds.; Curran Associates, Inc.: New York, NY, USA, 2021; Volume 34, pp. 15908–15919. [Google Scholar]
Figure 1. Overview of the proposed system.
Buildings 13 00055 g001
Figure 2. Samples of crack and non-crack patches.
Buildings 13 00055 g002
Figure 3. Vision-transformer architecture [48].
Buildings 13 00055 g003
Figure 4. Representation of sliding-window approach.
Buildings 13 00055 g004
Figure 5. (a) Representation of tubularity-flow vector field; (b) representation of 2 types of discontinuities, Type A and Type B.
Buildings 13 00055 g005
Figure 6. Representation of the Crack-Segmentation result after combining the TuFF result with localization mapping obtained from the sliding-window-based ViT.
Buildings 13 00055 g006
Figure 7. ViT model training and validation (45K pavement images): (a) accuracy graph; (b) loss graph.
Buildings 13 00055 g007
Figure 8. ROC curve of the ViT Model.
Buildings 13 00055 g008
Figure 9. (a,d) original images, (b,e) crack localization results of the ViT model, (c,f) scanning for FP and FN.
Buildings 13 00055 g009
Figure 10. (a) Original images; (b) localization-mapping result from sliding window-based vision-transformer; (c) mapping results from TuFF; (d) integration of results from sliding-window-based ViT and the TuFF algorithm.
Buildings 13 00055 g010
Table 1. Representation of images split in pavement and concrete datasets.
Surface TypeDatasetTrain DataVal DataTest Data
Crk PatchesNCrk PatchesCrk PatchesNCrk PatchesCrk PatchesCrk Patches
PavementCrack45K13.5K13.5K4.5K4.5K4.5K4.5K
Concretework [12]25202520840840840840
Concretework [12]750075002500250025002500
Crk = Crack, NCrk = Non-Crack, Val = Validation.
Table 2. Model specifications used in the proposed study.
ModelModel SizeNumber of Parameters (Millions)Patch Size
Customized CNN Model [12]10.3 MB2.70224 × 224
VGG-16 Model [54]528 MB138224 × 224
VGG-19 Model [54]549 MB143.67224 × 224
ResNet-50 Model [55]98 MB23.78224 × 224
Vision Transformer44.0 MB11.46224 × 224
Inception-V3 Model [56]92 MB21.80229 × 229
Table 3. All models’ experimental outcomes on pavement dataset (45K images).
Models
Dataset SizeVision Transformer
Confusion MatricesVal_ACCTest_ACCPRERECF score
45KClassCrk (0)NCrk (1)0.9680.9600.9710.9500.960
Crk (0)4410130
NCrk (1)2294231
Customized CNN Model
ClassCrk (0)NCrk (1)0.9470.9400.9450.9380.941
Crk (0)4310250
NCrk (1)2874150
VGG16 Model
ClassCrk (0)NCrk (1)0.9080.9060.8950.9130.904
Crk (0)3992468
NCrk (1)3764164
VGG19 Model
ClassCrk (0)NCrk (1)0.9120.8950.9020.8880.895
Crk (0)4023437
NCrk (1)5084032
ResNet50 Model
ClassCrk (0)NCrk (1)0.7250.7040.5990.7540.688
Crk (0)26711789
NCrk (1)8713669
InceptionV3 Model
ClassCrk (0)NCrk (1)0.9150.9050.9240.8880.906
Crk (0)4120340
NCrk (1)5184022
Crk = Crack, NCrk = Non-Crack, Val_ACC = Validation Accuracy, Test_ACC = Testing Accuracy, PRE = Precision, REC = Recall.
Table 4. Results of ViT and DL models [12] on the Concrete 8K dataset.
Models
Dataset SizeVision Transformer
Confusion MatricesVal_ACCTest_ACCPRERECF score
8KClassCrk (0)NCrk (1)0.9920.9740.9930.9570.975
Crk (0)245917
NCrk (1)1142411
Customized CNN Model
ClassCrk (0)NCrk (1)0.9670.9580.9930.9300.960
Crk (0)244916
NCrk (1)1922343
VGG16 Model [12]
ClassCrk (0)NCrk (1)0.9870.9860.9760.9960.986
Crk (0)239669
NCrk (1)1282407
VGG19 Model
ClassCrk (0)NCrk (1)0.9600.9600.9720.9490.960
Crk (0)239669
NCrk (1)1282407
ResNet50 Model
ClassCrk (0)NCrk (1)0.9230.9160.8680.9790.920
Crk (0)2433369
NCrk (1)502148
InceptionV3 Model
ClassCrk (0)NCrk (1)0.9850.9820.9720.9920.982
Crk (0)246371
NCrk (1)182448
Crk = Crack, NCrk = Non-Crack, Val_ACC = Validation Accuracy, Test_ACC = Testing Accuracy, PRE = Precision, REC = Recall.
Table 5. Comparison of models’ computational time.
ModelPatch Inference-Time (Sec)Entire Image Inference-Time 2240 ∗ 2240 (Sec)
Customized CNN Model0.00480.480
Vision Transformer0.03803.800
Inception-V3 Model [26]0.03853.850
ResNet-50 Model [27]0.06626.620
VGG-16 Model [25]0.199519.95
VGG-19 Model [25]0.209320.93
Table 6. Comparison of ViT model with SOTA DL models.
WorkDatasetAlgorithmNOENOIACCPRECRECF1
[59]SDNET [57]DCNN3018K0.970NANA0.800
[60]CCIC [58]DCNN<201000KNA0.8690.9250.896
[61]SDNET [57]DCNN1005.2K0.85NANANA
[62]SDNET [57] + CCIC [58,59]DCNN20184KNA0.1840.9430.307
[63]SDNET [57] + CCIC [58]MSCNet [63]30030K0.9270.9350.9420.938
[65]SDNET [57] + CCIC [58]ISSD40030K0.9150.9050.9110.908
[64]SDNET [57] + CCIC [58]SE-Inception-ResNet-181003K0.9480.9790.9160.946
[12]SDNET [57] + CCIC [58]Custom CNN2025K0.9670.9970.8500.918
OursSDNET [57] + CCIC [58]Vision Transformer2025K0.9740.9930.9550.974
ACC = Accuracy, REC = Recall, PREC = Precision, F1 = F1 score, NOI = Number of Images, * NOE = Number of epochs.
Disclaimer/Publisher’s Note: The statements, opinions and data contained in all publications are solely those of the individual author(s) and contributor(s) and not of MDPI and/or the editor(s). MDPI and/or the editor(s) disclaim responsibility for any injury to people or property resulting from any ideas, methods, instructions or products referred to in the content.

