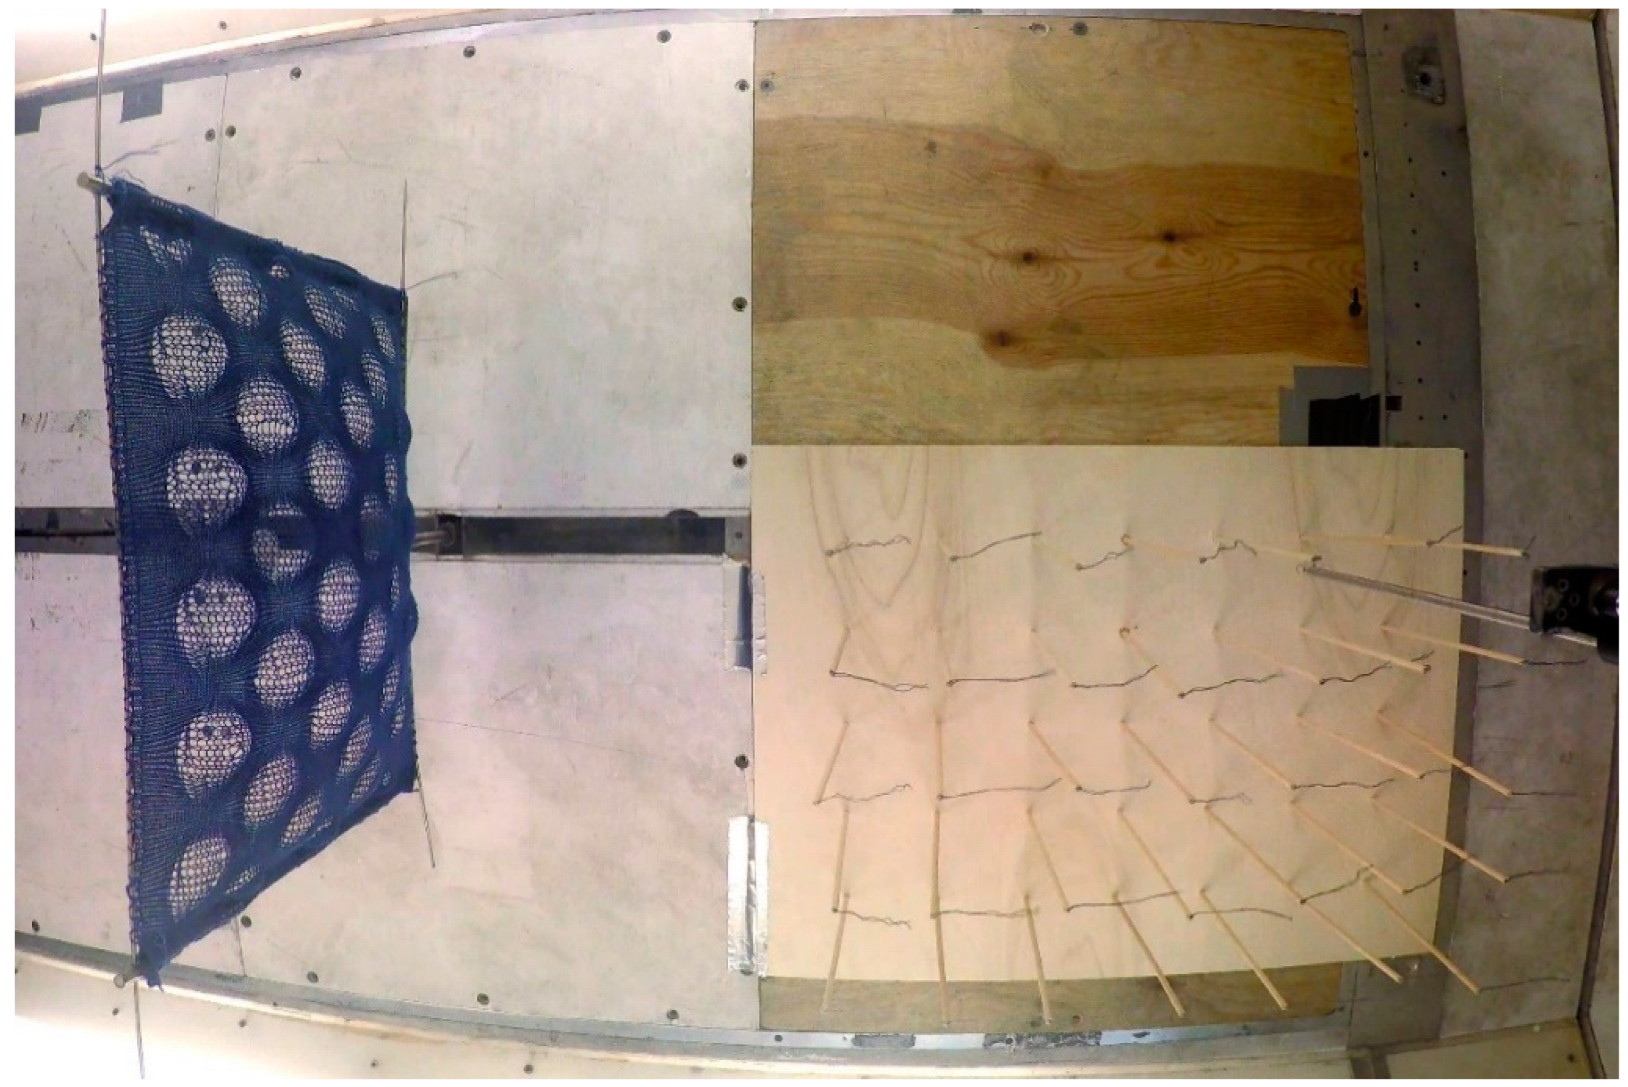
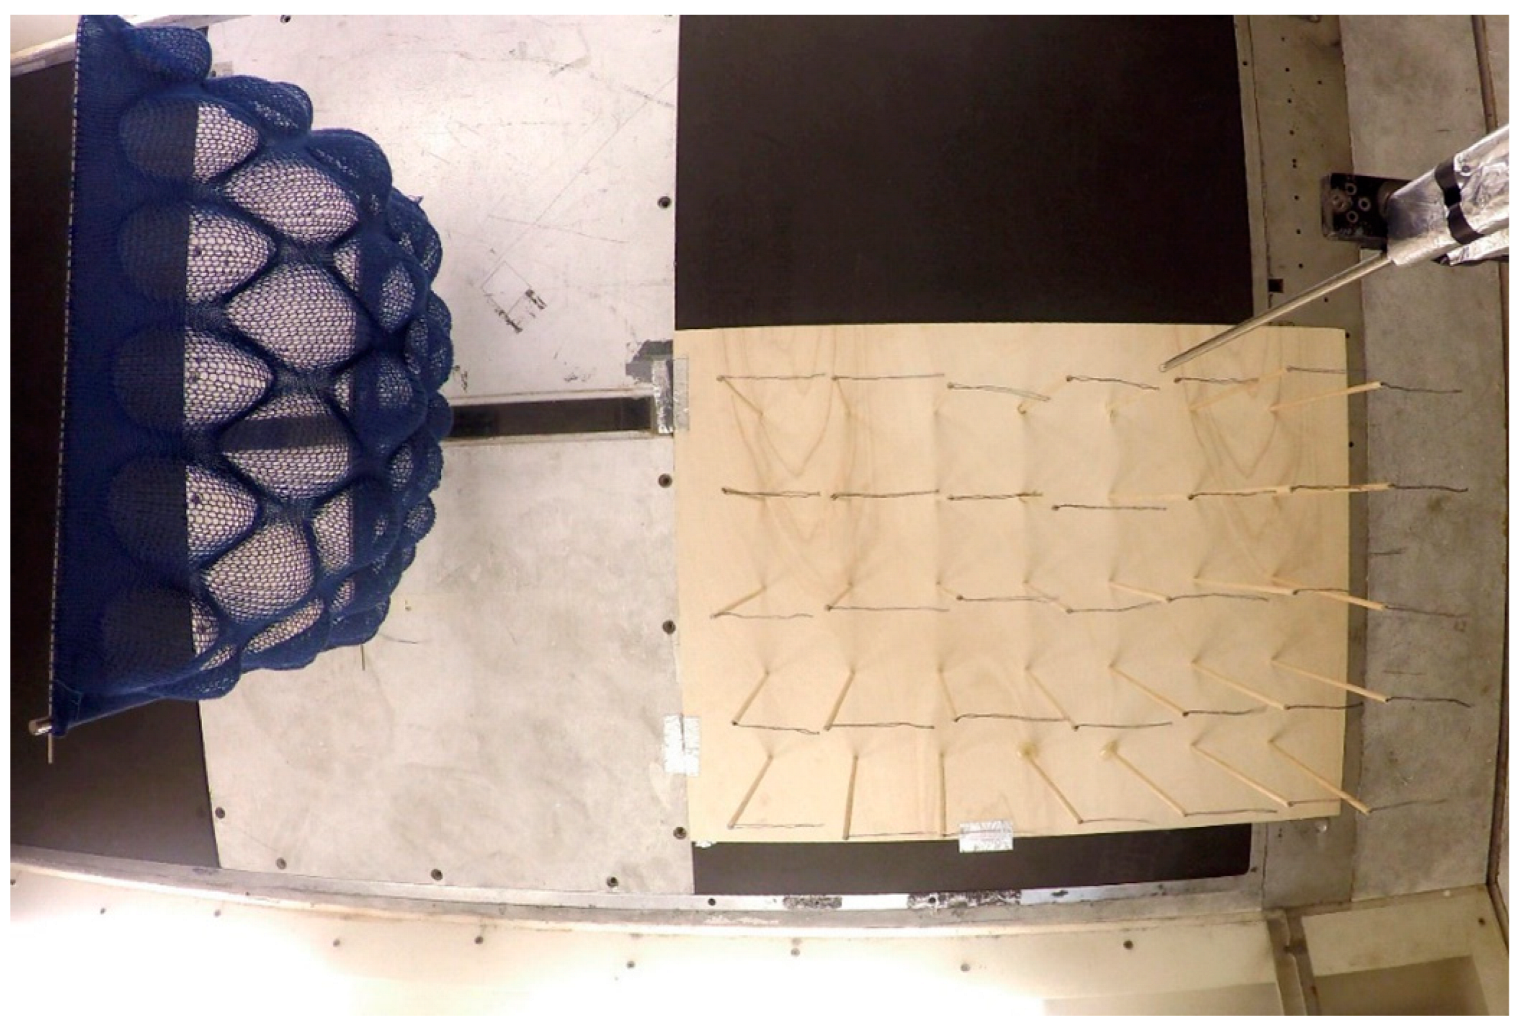
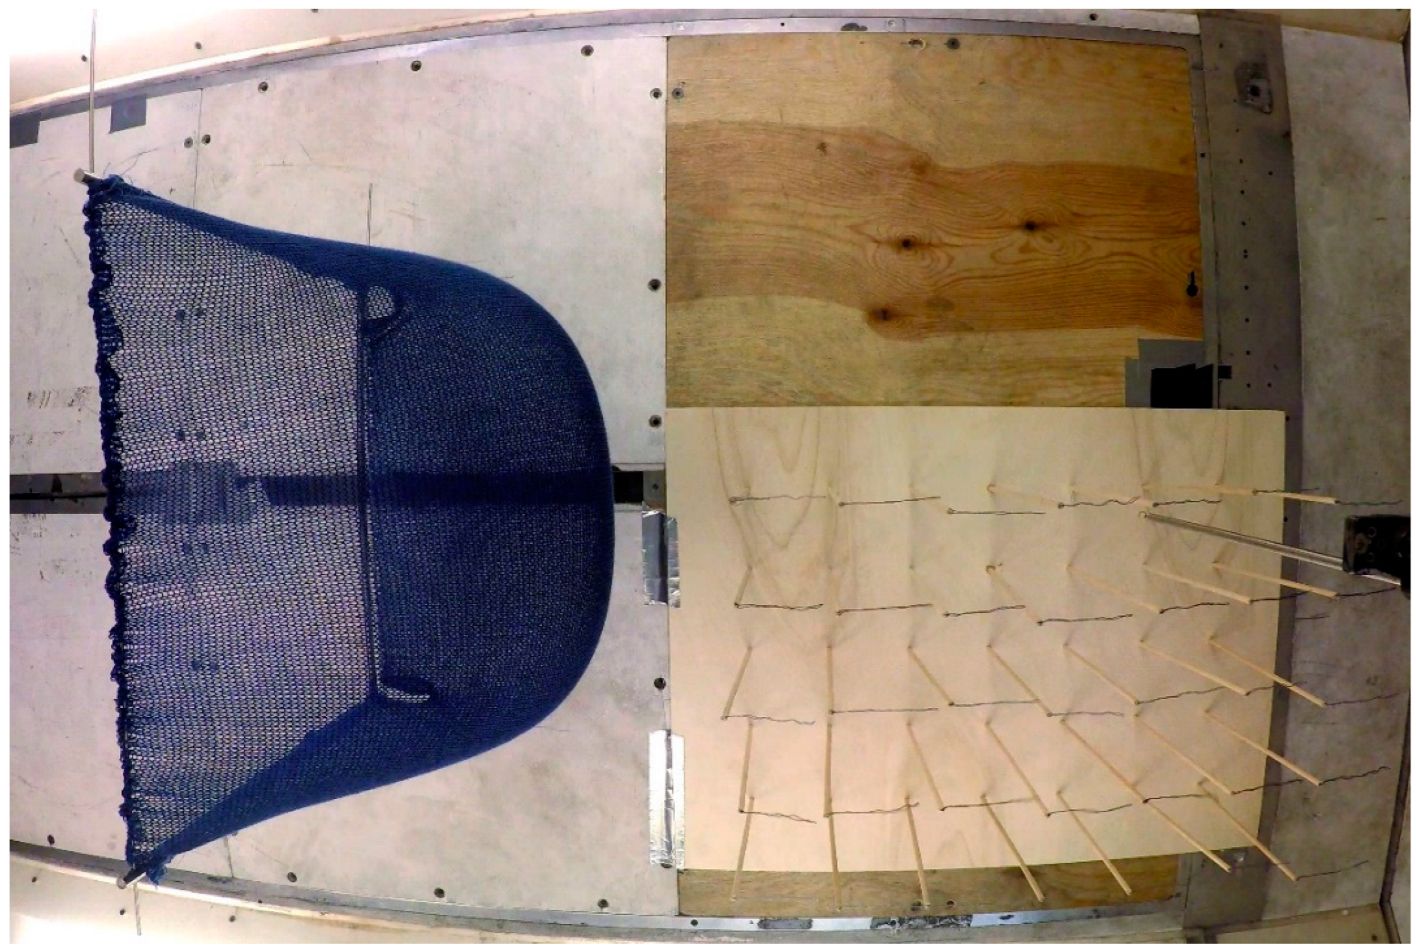
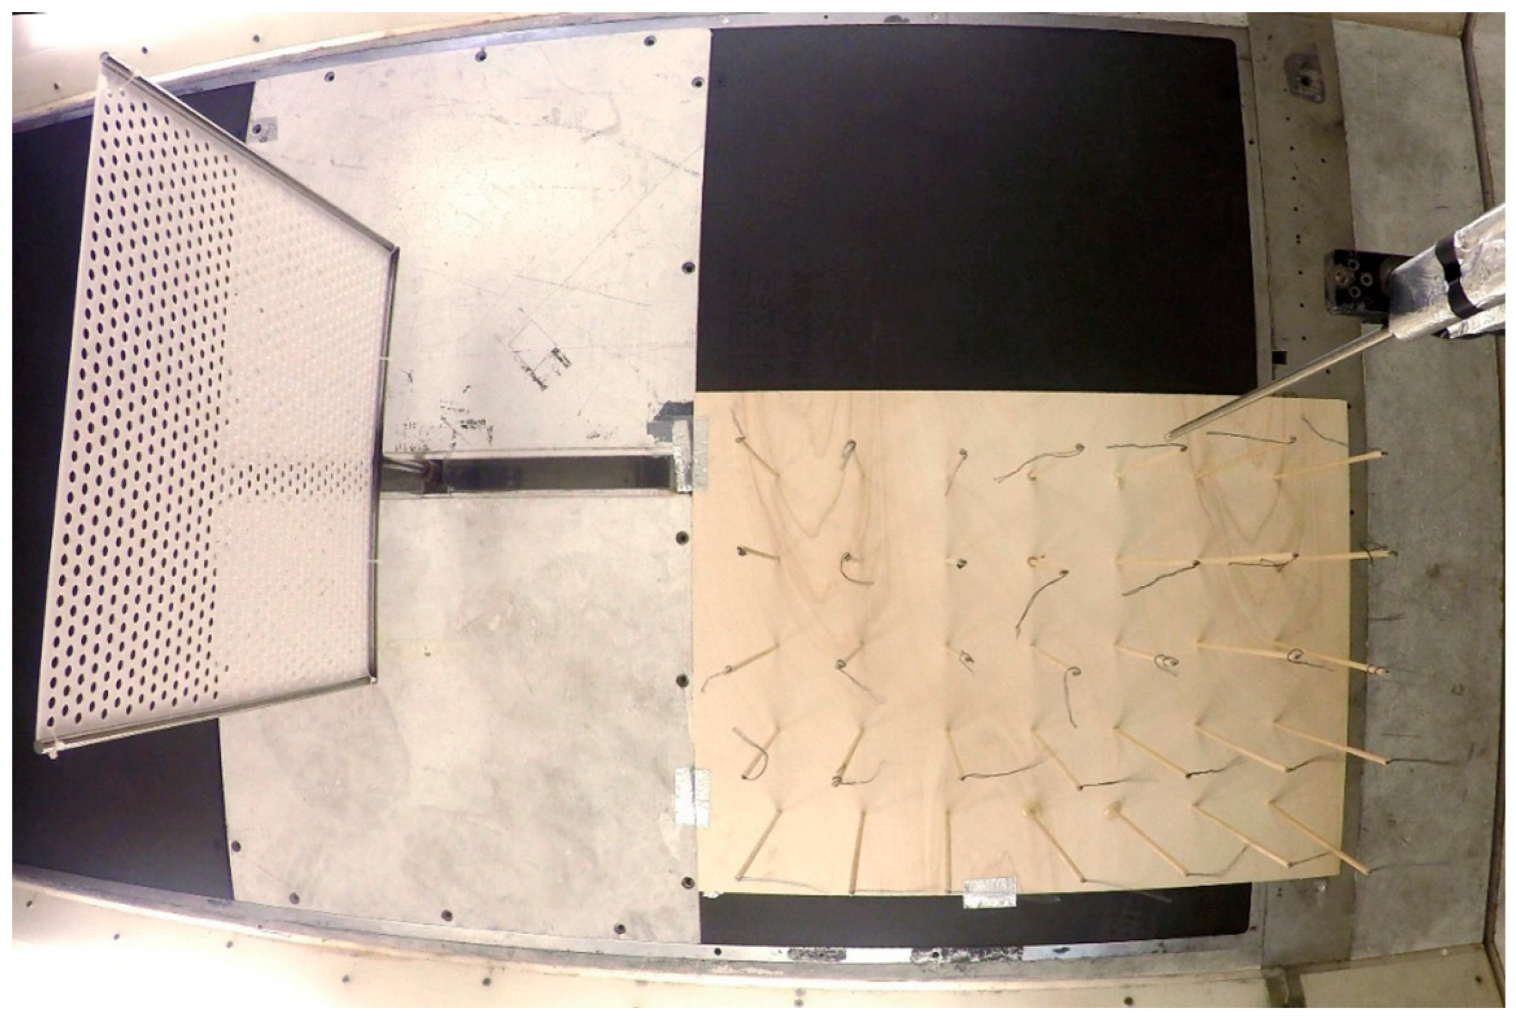
Abstract
There is a need to shield from the wind to improve pedestrian comfort in urban environments. Perforated windbreaks, such as fences, vegetation or textile nets, have proven to be an efficient solution, whereas knitted textiles have not yet been explored. The purpose of this study was to evaluate the capacity of knitted textile windbreaks to reduce wind velocities, to inform further research and promote wider architectural applications. Five custom-knitted textile prototypes, representing fragments of textile windbreaks, were tested in a wind tunnel and compared against a perforated and a nonperforated solid board. Forces on the models, as well as upstream and downstream velocities, were measured. The results indicate that the optimal optical porosity of knitted windbreaks should be around 10%, which differs from the porosity for perforated windbreaks recommended by prior studies. Moreover, it was observed that a textile windbreak knitted using the drop-stitch technique efficiently reduces the wind, while not generating a large drag force. Furthermore, the drag coefficient for the knitted windbreak is reduced with increased windspeed. With this, the presented study demonstrates that knitted structures exposed to wind influence have the functional potential of becoming efficient windbreaks, thus improving wind comfort and aesthetic user experience in the urban space.
1. Introduction
When it comes to pedestrian comfort, wind often becomes problematic in urban areas [1]. This is especially true in colder climates such as in the Nordic countries, where shielding from cold winds is necessary for outdoor comfort. Zhen et al. [2] report that most people in colder regions only find wind speeds below 3 m/s to be acceptable. This could be compared with the findings of Penwarden [3], concluding that windspeeds of 5 m/s and above, i.e., making the hair and clothes flap, cause discomfort. Hence, the value of 5 m/s was also suggested to be a basic value for assessing conditions for pedestrians in cities, and new developments should strive to keep velocities below this value for as much of the time as possible. Winds were deemed to be defiantly unpleasant at a speed of 10 m/s, in which case the wind exerts a considerable force on the body. Winds around 20 m/s were considered to be potentially dangerous.
Even though a denser city plan, in general, results in less wind [4], the geometry and layout of buildings in urban areas can also lead to unfavorable wind conditions. Cochran [5] illustrates and describes some ways in which taller, rectangular buildings influence the wind and potentially create uncomfortable microclimates. Moreover, Fernando et al. [6] point out that high-rise buildings influence the complex patterns of the wind and often introduce uncomfortable and, in some cases, dangerous wind environments. When it comes to comfort, it is mainly the mean wind that is of interest, but for safety reasons, the gust speeds are also important to consider. As high-rise buildings tend to have a larger area that is freely exposed to direct wind flow, a phenomenon known as downwash occurs, due to the pressure difference at the top and bottom of the building [7]. Placing solid, i.e., nonporous, screens can successfully block out the wind locally but does often lead to undesired turbulence. As Heisler and Dewalle [8] point out, the effectiveness of a windbreak is closely related to its porosity. A dense windbreak will generally have a higher maximum reduction of the wind but a shorter protected area. Thus, placing porous barriers, such as greenery [9,10] or a porous fence [11,12,13], will generally give a more desirable effect. While greenery in urban space is beneficial in many ways, it is not always possible or practical, as it requires both a large space and specific growing conditions. In this study, an alternative approach to shielding from the wind is presented, based on the use of foldable, lightweight, knitted textile screens, with custom designs enabling us to both to optimize wind comfort and achieve a varied architectonic expression in an urban setting.
Architectural design will always influence the flow of the wind. Therefore, with climate change and more extreme winds, it becomes even more important to consider the influence of wind as a design parameter. One example of this was given by Sari and Cho [14], who investigated building-integrated turbines and how a building can be shaped to maximize the energy that could be harvested from the wind. Furthermore, indoor thermal comfort can be improved by thoughtful surface designs that alter the wind velocities near the facades [15]. Kormaníková et al. [16], on the other hand, identified five principles by which architectural design can deal with the wind: minimum resistance, concentration, diffusion, deflection and materialization. In the study presented herein, the diffusion and materialization strategies are combined, with the focus on reducing the wind speed by using knitted structures to create a comfortable wind environment, while accommodating a unique architectural expression of a windbreak in urban space. The drop-stitch knitting technique is used to create a variation in porosity in the tested models, as it has been shown to be promising in terms of creating an expressive three-dimensional structure that can be dynamically shaped by wind [17].
1.1. Textiles in Architecture
With textiles, it is possible to create large architectural structures by using little material compared to most other building materials. While textiles can be produced with a wide range of yarn types and through various methods, they are usually lightweight, foldable and thus easy to transport. Two examples from architecture, where the ease of logistics related to textiles as a building material has been a key feature, are the German pavilion at the 1967 World Expo in Montreal by Frei Otto and Rolf Gutebrod [18] and the more contemporary KnitCandela [19]. In the first case, the textile acted as a load-bearing roof structure, whereas the second example is a shell construction that employs the textile as a permanent formwork for a concrete shell.
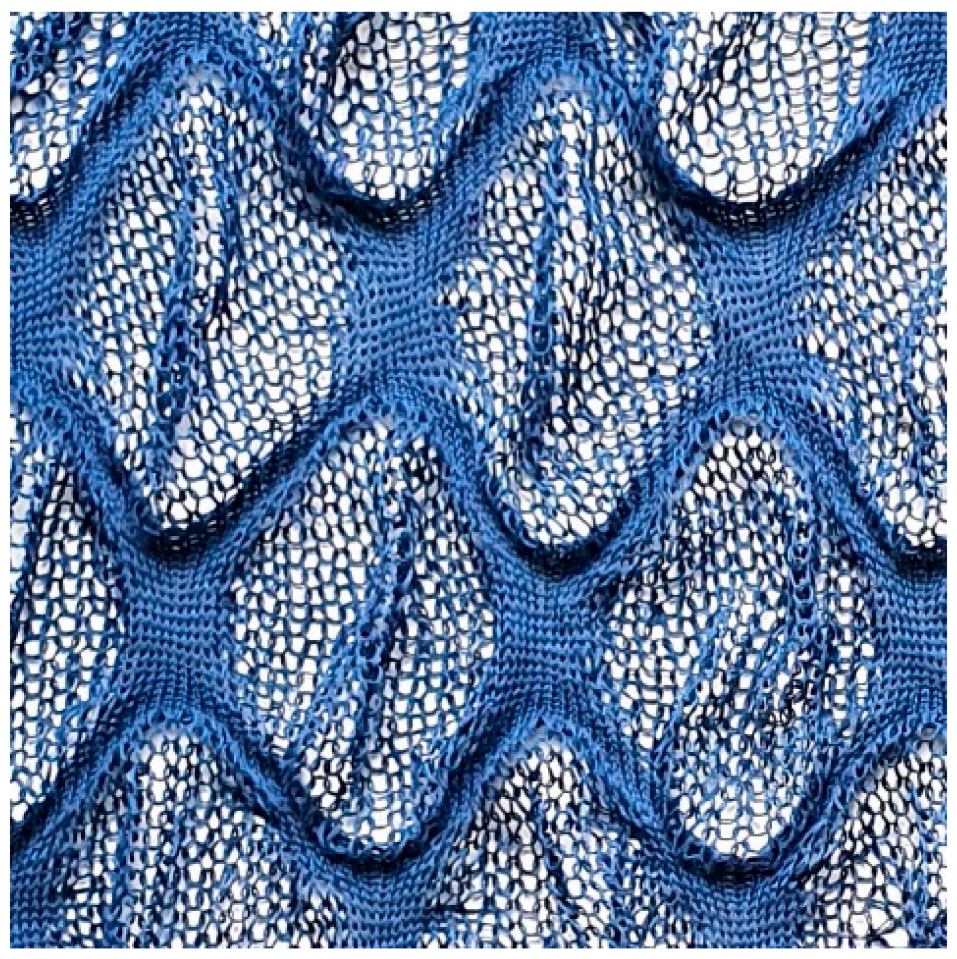
Previous research on textile architecture has commonly focused on tensile textile architecture, with the textile immobilized and tensioned to secure its load-bearing functionalities [20]. However, more loosely fitted textiles open up other design options and functions. These include the large-scale textile structures by Janet Echelman that take advantage of being shaped by wind, e.g., the sculpture 1.78 Borås, which was made with flexible knotted nets (Figure 1). Another example of architectural textiles shaped by the wind is the knitted design prototype (in)Formed by Wind by one of the authors of this article (Figure 2). Further examples of exterior loose textiles embrace the fabric façade of a studio house in Almere, the Netherlands, by CC-Studio, Studio TX, and architect Rob Veening; the Book House Pavilion by Olga Sanina and Marcelo Dantas, two architects; the COS Space by Snarkitecture; and knitted structures such as Lumen by Jenny Sabin.
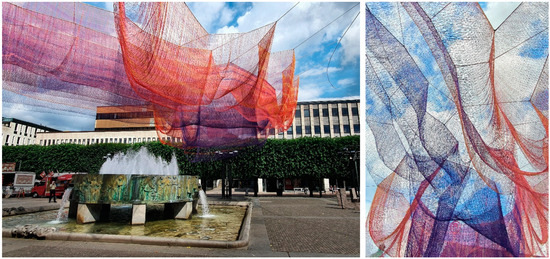
Figure 1.
Janet Echelman’s sculpture 1.78 Borås.
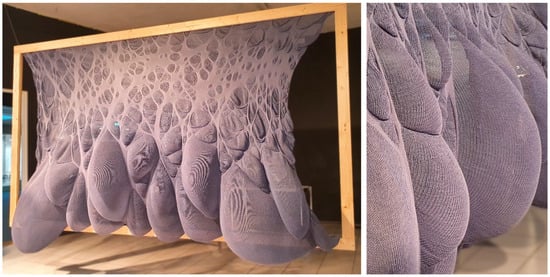
Figure 2.
(in)Formed by Wind, by Erica Hörteborn. A large three-dimensional screen knitted with the drop-stitch technique. (Photo from the exhibition In Motion, at Sergels torg, Stockholm 2022.)
1.2. Existing Design Guidelines for Windbreaks
An important factor for windbreak efficiency is its porosity [8,21,22,23]. Dong et al. [11] even claim that it is the most decisive parameter in determining the windbreak’s efficiency. Windbreak permeability (optical porosity) is defined as the ratio of the open surface to the total surface. Aerodynamic porosity is another way to measure porosity, defined as the ratio of the mean wind velocity immediately leeward of the windbreak to that of an open field.
Completely solid, nonporous windbreaks will generate disturbing turbulence and deflect wind to a much larger extent compared to permeable structures. This leads to higher wind speeds around the structure, potentially making the wind environment worse in the windbreak’s proximity. The explanation for this phenomenon is that a porous windbreak is causing a large number of small eddies (vortices) to emerge behind the windbreak structure, thereby reducing energy in the mean wind. With an unperforated structure, a large high-energy eddy is instead emerging behind a solid screen [24].
Several studies have sought to determine an optimal porosity for wind reduction. Raine and Stevenson [22] recommend using fences with low-to-medium porosity and found that a 20%-permeable windbreak gave the best overall reduction. However, they also state that designing a taller but more permeable windbreak might give better overall protection. Cornelis and Gabriels [25] found that the optimal porosity in terms of wind-velocity reduction was 20–35% and that an even distribution of the porosity resulted in the longest protected area. Similarly, Dong et al. [11] found the optimal porosity to be around 20–30%. Structures that are naturally permeable, such as trees and bushes, make for effective windbreaks [9]. Planting trees for the purpose of shielding the wind dates back to at least the 1700s [26]. However, whether planted in a single or multiple rows, vegetation requires space and good conditions to thrive, which is not always feasible in urban settings.
Other parameters are also important for the efficiency of the windbreak, such as height and wind velocity. Hong et al. [27] developed equations that relate porosity, height and windspeed to the efficiency of a windbreak and also show the effect of using multiple fences.
1.3. Windbreak Performance Evaluation Methods
Three methods could be potentially relevant in the context of assessing the performance of architectural windbreaks: full-scale tests (preferably on-site), computational fluid dynamics (CFD) analysis and physical wind tunnel tests. All of these methods have pros and cons. There are examples of full-scale wind tests [23,26,28], but project/site-specific tests are usually impractical and costly. Hence, with the increase in computational power today, CFD analysis is becoming increasingly popular [29]. The different computational approaches used to simulate the wind could be divided into mesh-based methods, which are most frequently used, and mesh-free/particle-based methods, such as SPH—smoothed particle hydrodynamics [30,31,32,33]. However, computer simulations are still computationally costly to run, especially if, as in the case of windbreaks, turbulence occurs, and it is a fluid–structure interaction (FSI) problem. In this case, the textile and the wind are interacting in a coupled manner by mutually affecting each other, making such simulations particularly computationally expensive. For problems like the one presented in this article, with a loose textile that is both porous and deforming considerably, it is close to impossible to accurately simulate the behavior in a computer model. Thus, the more traditional physical wind tunnel tests are considered to be a better option. Even so, the wind tunnel experiments also have their limitations, mainly due to the dimensional restrictions often necessitating the use of scale models instead of full-size prototypes.
Aynsley [34] argues that architects should always perform wind tests of their designs, using reliable methods. However, it is debatable how reliable the more common wind analysis methods are. Several authors point out the problematic issue of scaling down the tested model, especially when it comes to the wind analysis of a building, which applies to wind tunnel studies in particular. Liu et al. [35] employed computer simulations to show that the flow pattern behind a windbreak looks different in a scale model compared to a 1:1 scale. Li et al. [36] underlined that, for the design of windbreaks in an urban environment, the surrounding buildings also act as obstacles affecting the wind in a way that cannot be ignored, and that most studies that guide the design for windbreaks are based on tests with the incoming wind in an open landscape, with a few obstacles.
Furthermore, Liu et al. [35] bring up multiple issues with scaling when it comes to determining if the experimental results from windbreak research are directly applicable to actual conditions—both with the scaling of the structure itself and the implications that this has for the calculations, as well as with representing the natural wind in a simulation. Others have also raised concerns about the accuracy of scaled models for wind analysis [29,37,38]. Thus, the question of how accurate the models are should always be raised for each specific case. Mahgoub and Ghani [29] point out that CFD simulations can be carried out on a full scale and thus address some of the difficulties with scaling. However, the complex geometry of porous windbreaks in general and knitted or textile windbreaks in particular results in high computational costs. Earlier studies on porous windbreaks and vegetational barriers were carried out through mainly experimental methods, whereas more recent research usually uses CFD models, as computational power is increasing.
The windbreak permeability and aerodynamic porosity are particular problems where the wind tunnel research can be applied successfully and was used in the past [39]. For a knitted windbreak, of the type presented in this paper, the aerodynamic permeability of the structure is fully defined by the incoming flow velocity and the leeward flow velocity, which is, in turn, defined by the small-scale geometrical features of the windbreak rather than by its total dimensions. Thus, wind tunnel models with unscaled drop-stitch patterns can be used, while the actual windbreak dimensions can be scaled down without compromising the aerodynamic permeability. Of course, for a real large-scale windbreak, the extent of the calm zone behind the windbreak will be significantly different and defined by the total windbreak dimension; however, the velocity just downstream of the windbreak will be the same as the one measured in the wind tunnel.
Liu et al. [40] explain that there is a knowledge gap in the linking of the material structure of the knit to the overall mechanical behavior of a knitted structure. This further increases the complexity when it comes to representing wind tests of knitted structures, such as the ones presented in this study, in a computer simulation.
1.4. Objectives
This study focused on knitted textiles since they have several properties that offer potentials for wider applications within the built environment. Particularly, two features of the knitted structure are key in this study: firstly, the loop-structure of the knit enables the creation of three-dimensionality both on a surface level and on an architectural scale, without cutting and sewing; and secondly, the ability to easily incorporate varying levels of porosity into the design of the knitted textile.
Knitted textiles employed as windbreaks in the urban space could contribute to the creation of high-quality outdoor environments, where design informed by the local wind conditions can add both character and satisfactory wind comfort to a space. In this study, results from wind tunnel tests at an early design stage are presented, with the focus on determining the effectiveness of drop-stitch knits with diverse porosities in terms of reducing the wind speed. The overarching purpose is to show the potential with this type of structure and indicate, through a comparative study of knitted prototypes, important design aspects and knit patterns best suited for improving the wind comfort.
2. Materials and Methods
In this study, a set of custom-designed knitted architectural prototypes, in 1:1 scale, representing fragments of prospective windbreaks, were produced. In addition, two reference screens, one porous and one solid, were built using off-the-shelf materials. For the custom-designed porous knitted models, an algorithm was also developed to calculate the visual porosity of the models based on their digital photographs. The architectural models were tested in a wind tunnel and evaluated by using a state-of-the-art methodology.
2.1. Knitted Textiles
Knitted textiles are built up through the intermeshing of yarns in loops. By changing the number of loops (also known as stitches) in a row (course) or the loop size, the three-dimensional shape of the textile is altered. Hence, with a knitted textile, it is relatively easy to achieve three-dimensionality, both at a surface level and at a larger scale. Additionally, compared to woven textiles, which consist of multiple treads that are relatively straight, the dimensional stability of the knitted textile is more dependent on the friction that keeps the loops in place. This also means that a knitted textile, in general, will stretch more than a woven textile, whereas the yarn will typically not be stretched out to the point of breakage [41]. In a previous study by two of the authors of this article [17], the behavior of a knit was described in more depth, including the visual behavior of the knits with a drop-stitch pattern exposed to the action of wind. One of the prototypes used in that study is presented in Figure 2. The prototype was produced by using a drop-stitch technique, which is also used for producing some of the custom-designed knitted models in this study. This technique allows the fabrication of textiles featuring zones with varied porosity, seamlessly embedded within one material piece. The larger loops in the drop-stitch pattern, representing the higher porosity zones, are created by placing yarns on the main needle bed (the upper hooks), which is then dropped, generating longer yarn in the loops on the needles opposite these, on the ribber bed. Figure 3 shows a section of the knitting during the production of a drop-stitch prototype. The yarn on the needles on the main bed (“upper hooks”) will be dropped to form the larger loops in the knit.
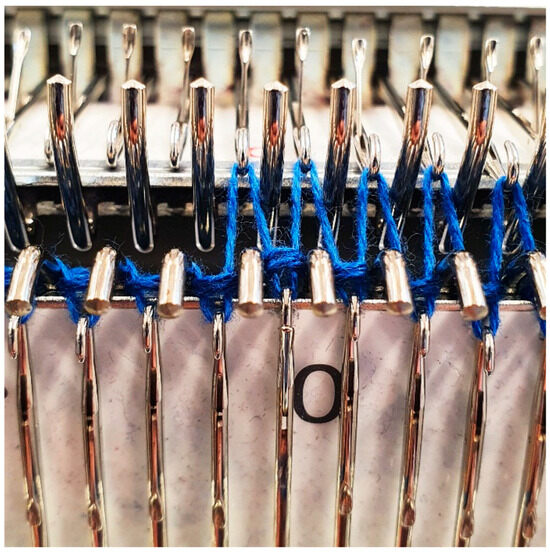
Figure 3.
Close-up shot of the needle bed of a knitting machine, knitting a drop-stitch pattern. The vertical needles (hooks) are in the ribber bed, and the horizontal needles make up the main bed.
The models were knitted with cotton yarns (2 × 20/2Ne, i.e., 2 strands of 2 ply 20 Ne knitted together), on a Silver Reed SK840 knitting machine (4.5 mm standard gauge; shown in Figure 4), using the DesignaKnit 9 software for pattern design. All models were knitted with a width of 160 stitches (loops), and at least 160 rows were knitted. The number of rows depended on how long the models became with the chosen loop sizes. The patterns are variations of drops-stitch that comprised 160 by 160 stitches, with a few rows of plain knits (single jersey) knitted before and after the pattern.
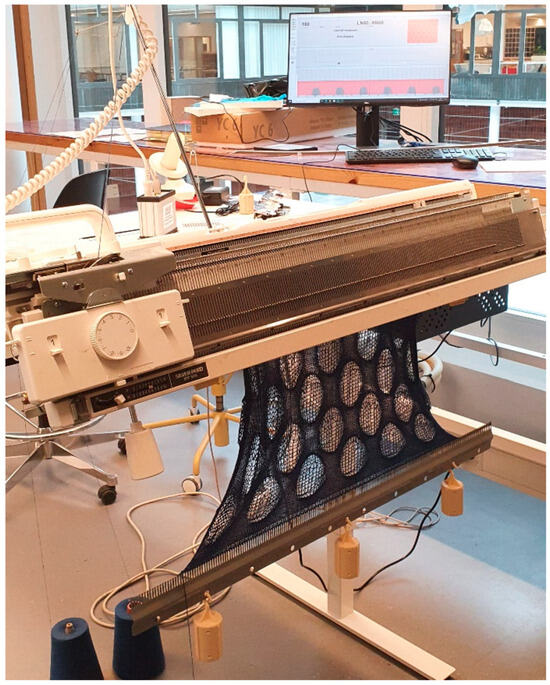
Figure 4.
The models were knitted on a Silver Reed SK840 knitting machine (4.5 mm standard gauge), using the software DesignaKnit 9 for the pattern.
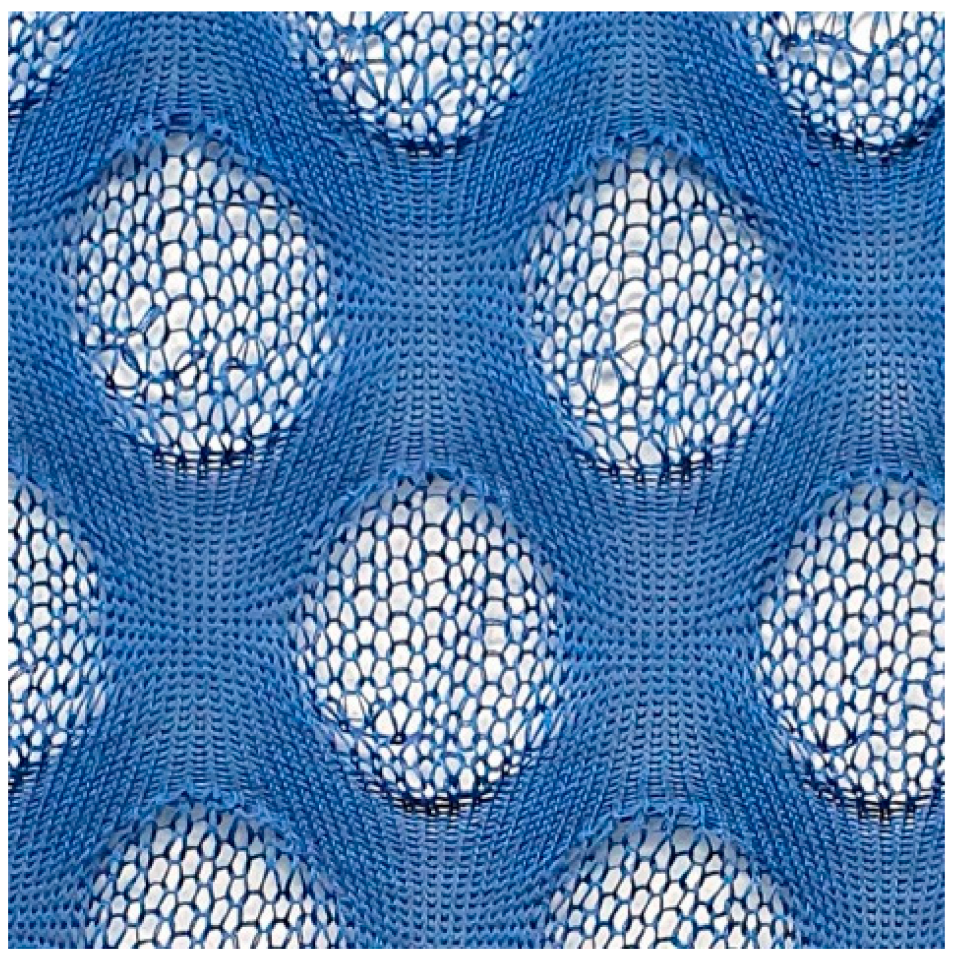
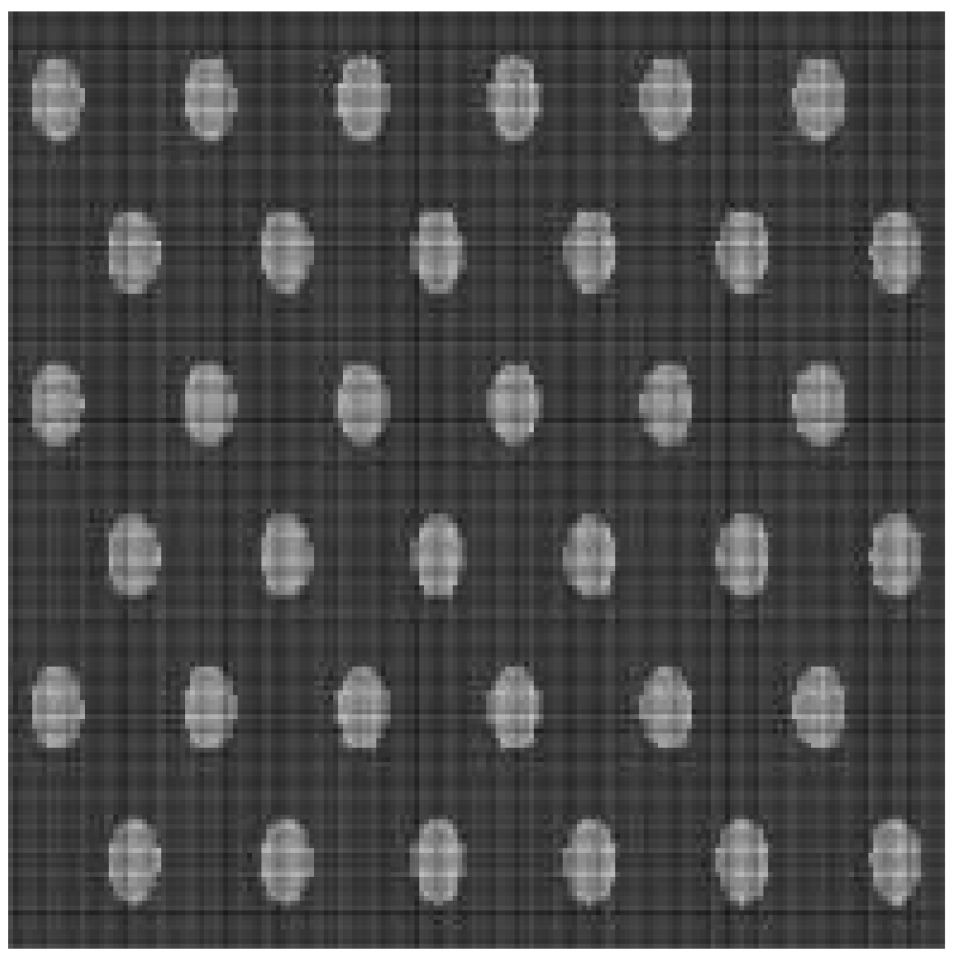
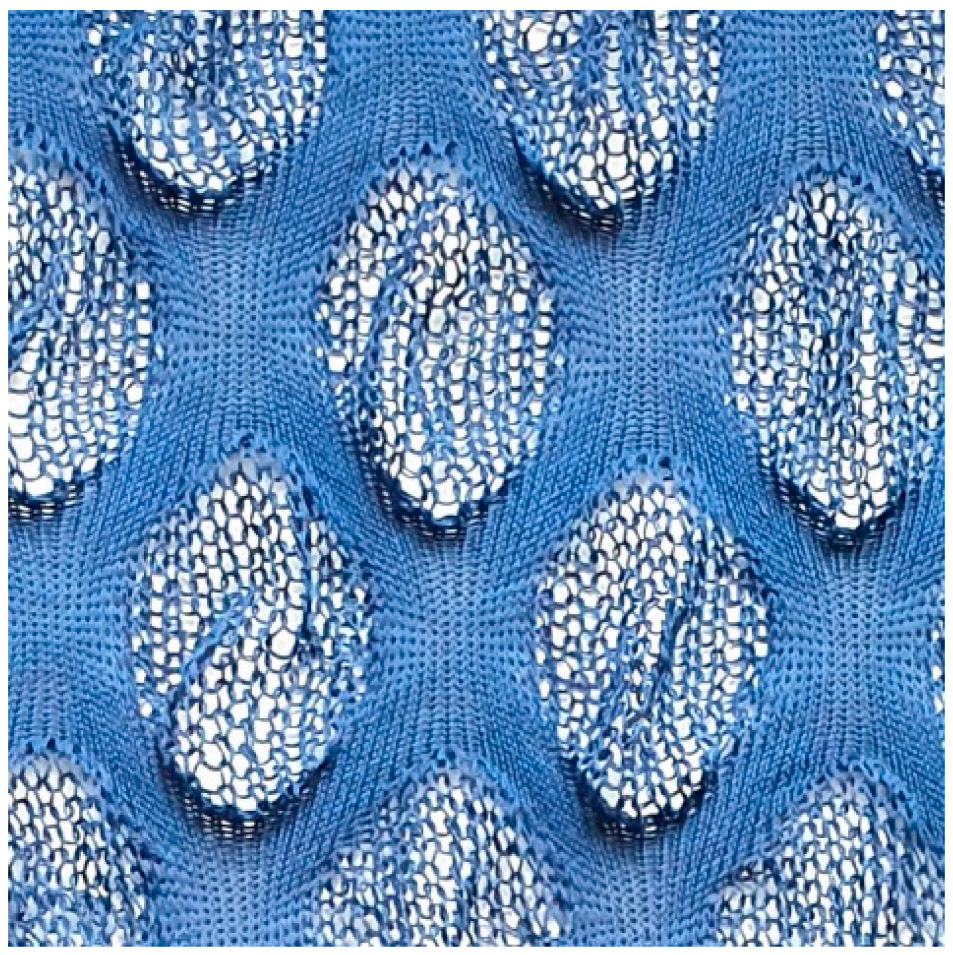
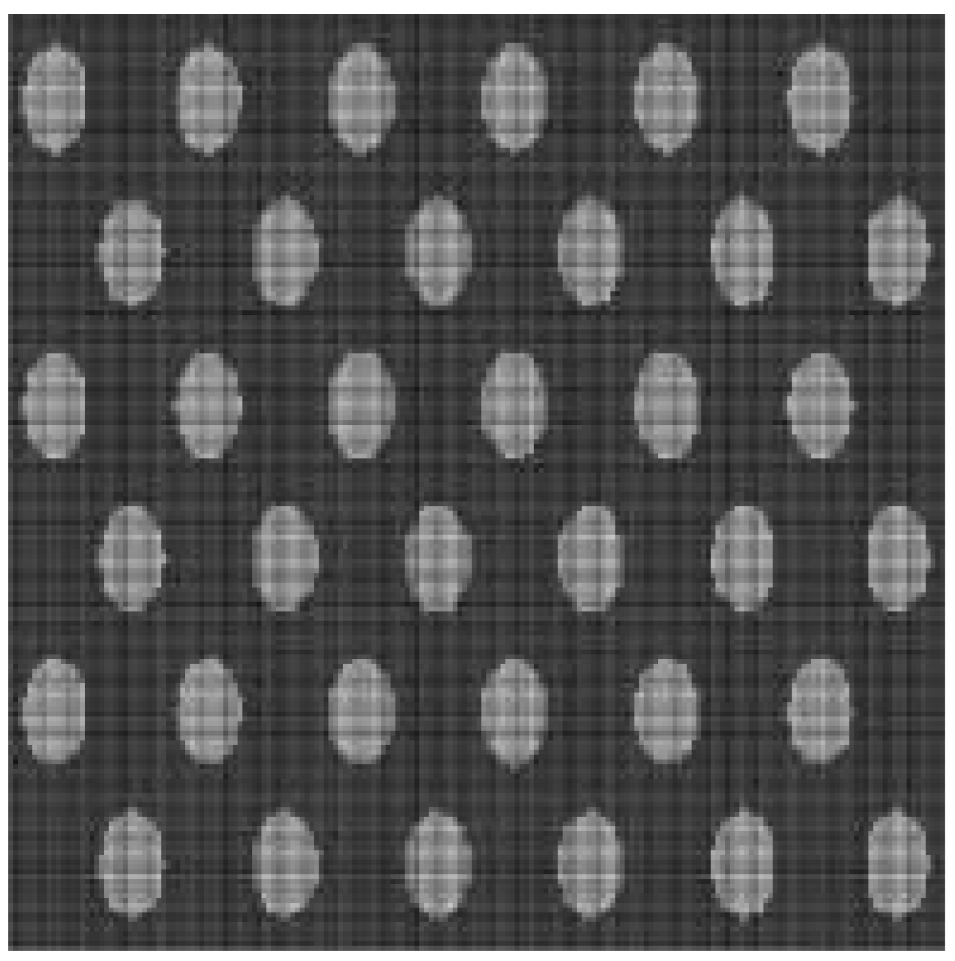
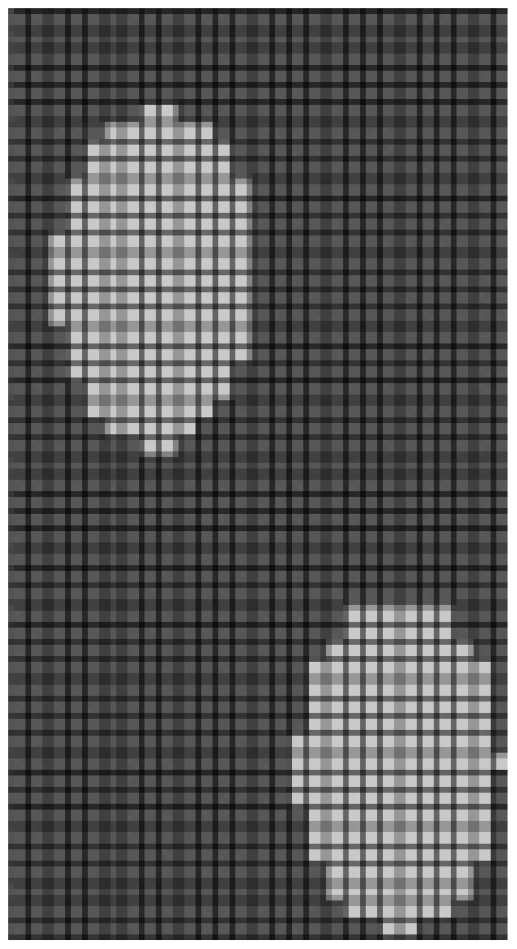
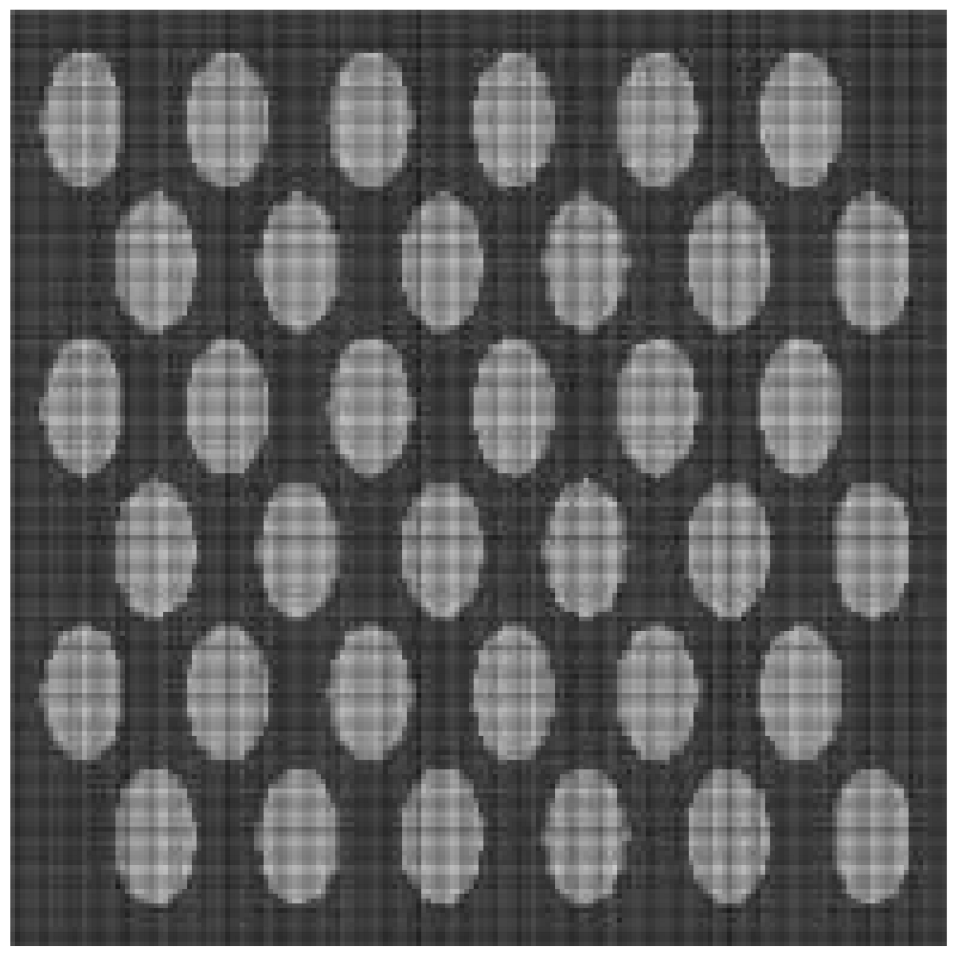
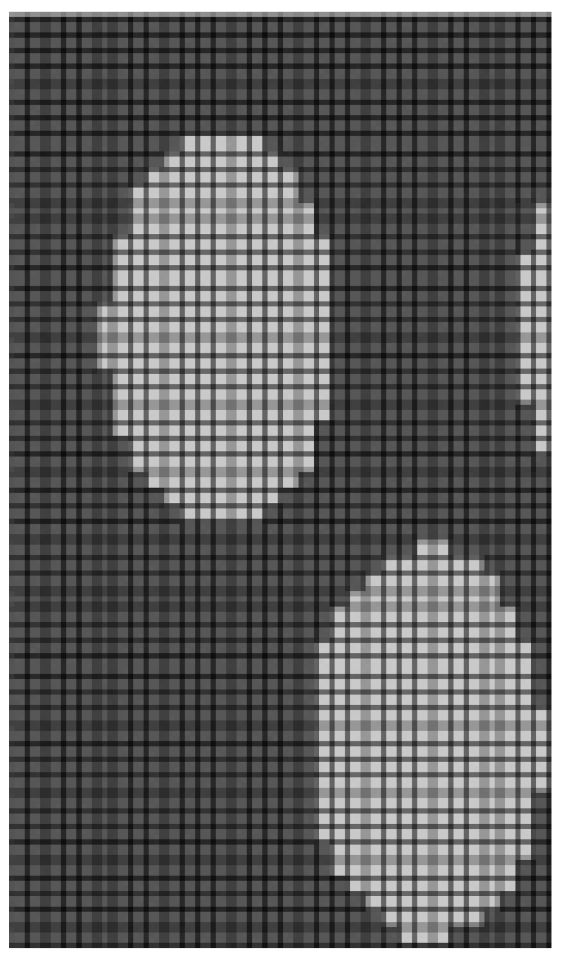
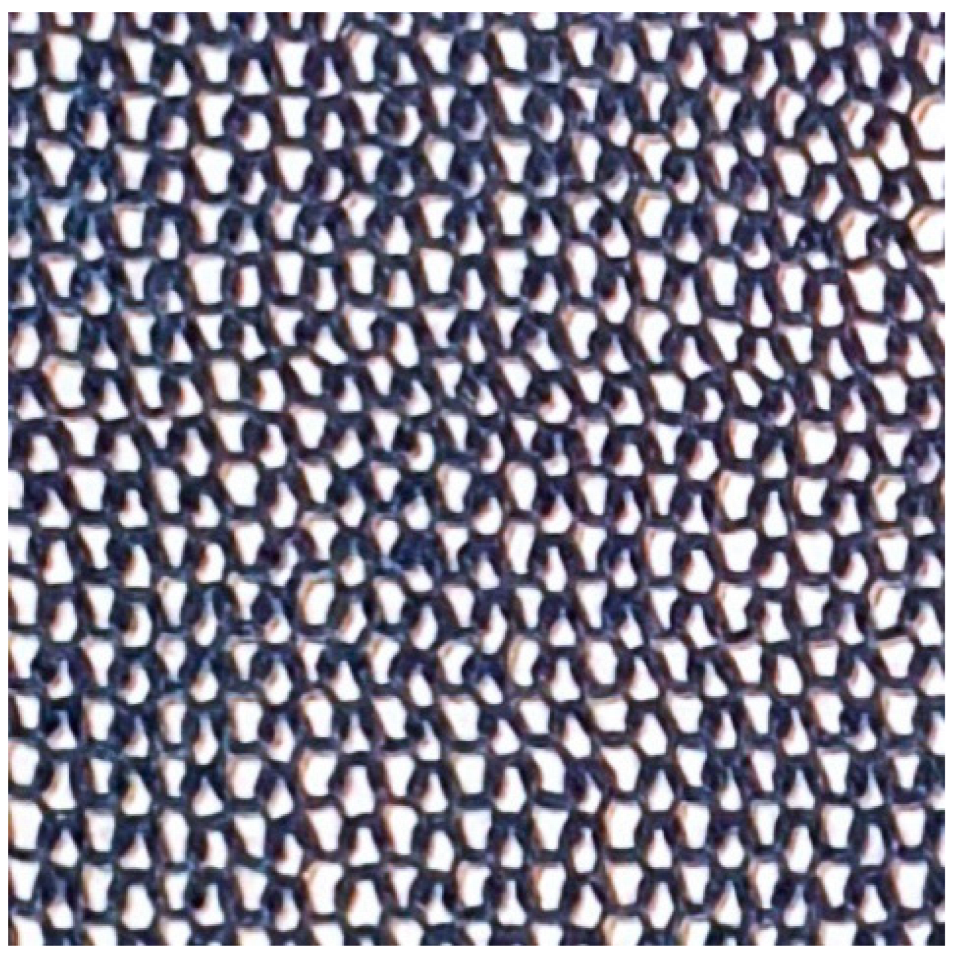
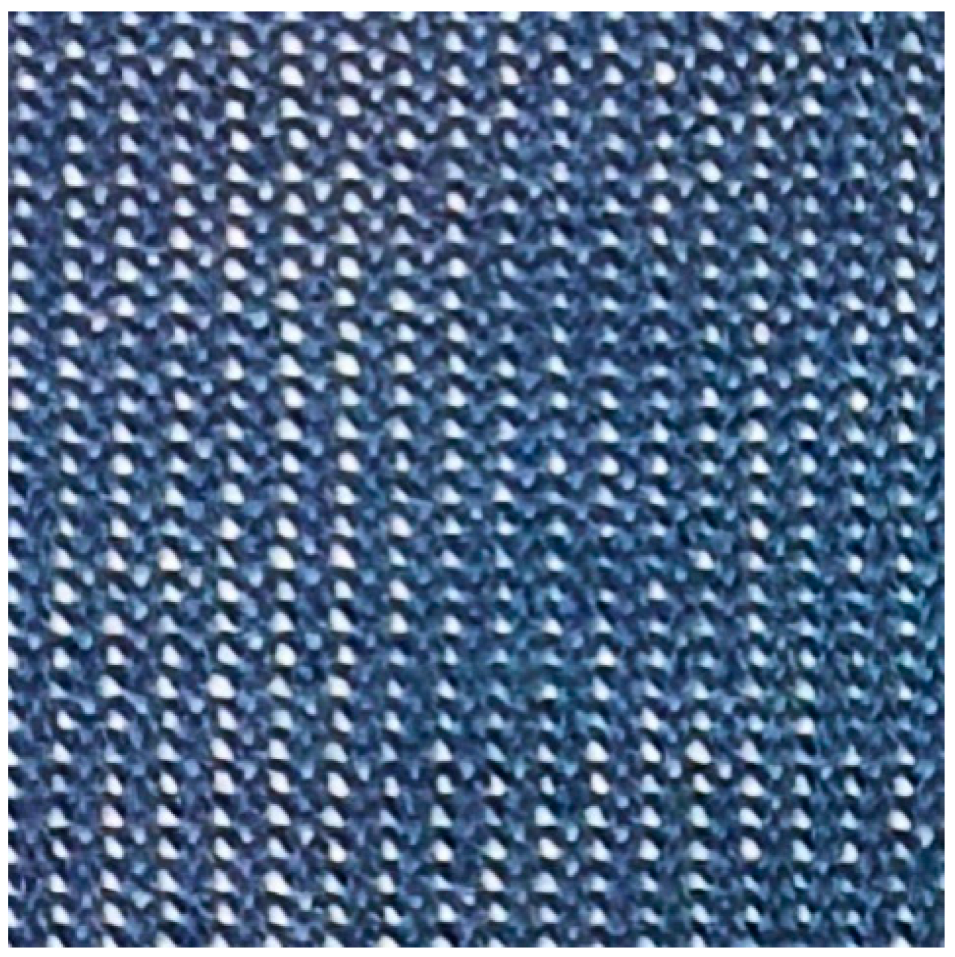
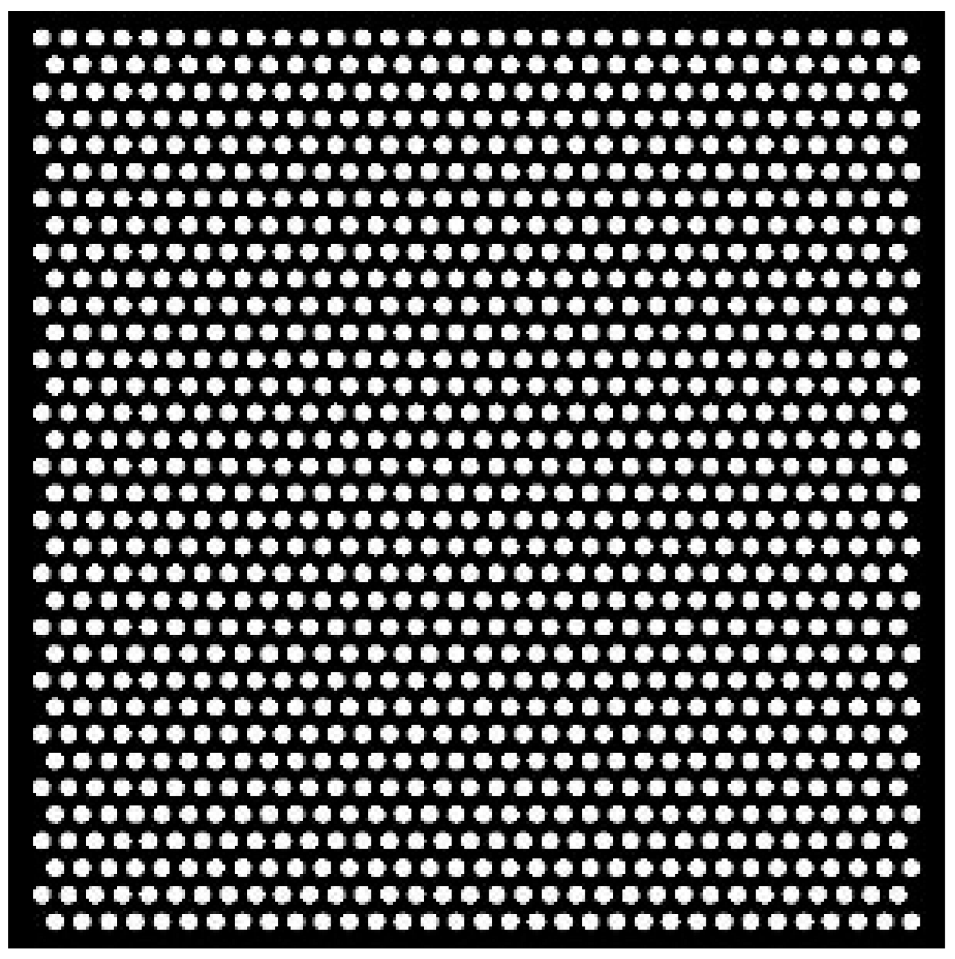
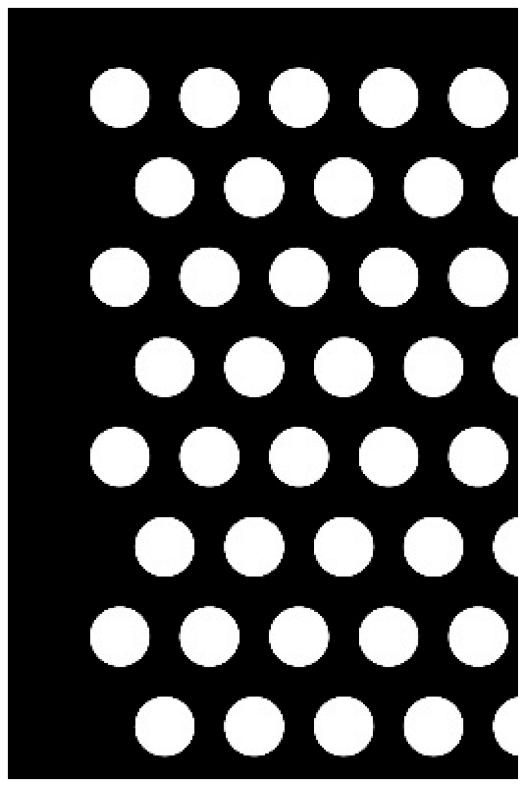
The pattern was created by using the parametric design software Grasshopper for Rhinoceros 3D, picturing a set of 6-by-6 ellipses, where every other row was offset for even distribution. The total area of the ellipses, representing the sections for double loop size, was 10, 15 and 25% of the total area of the pattern. In Table 1, the patterns for the models are shown alongside a section of the corresponding knit/model. For comparative purposes, the patterned models were accompanied by two custom-produced models representing plain uniform knits, with two loops sizes comparable to the dense and loose sections of the drop-stitch models (Figure 5 and Table 1). It should be noted that the more densely knitted models (the dense and drop-stitch 10% prototypes) were slightly stretched in order to fit on the frame, whereas for the more loosely knitted models (mainly the loose knit and the drop-stitch 25%), a width of 160 stitches meant that they were hanging loosely on the frame.

Table 1.
The knits and perforated board used in the wind tunnel tests, along with the corresponding patterns and calculated optical porosity values.
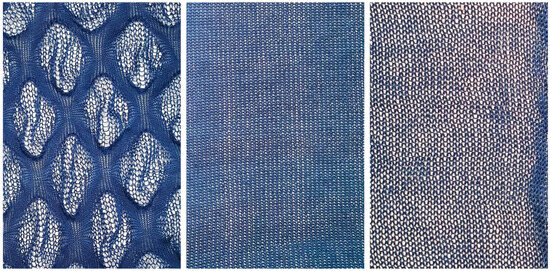
Figure 5.
Comparison between drop-stitch 15% (left), the loose knit (middle) and the dense knit (right).
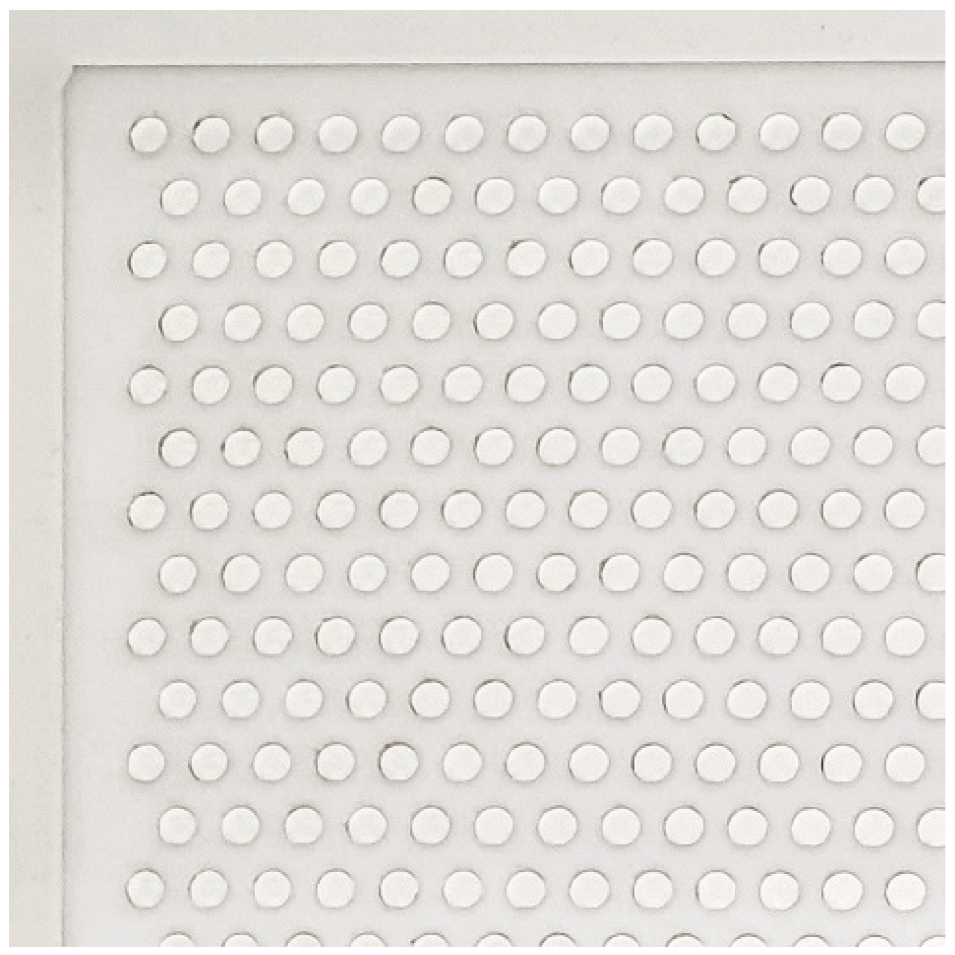
In addition, a solid and a custom-produced perforated board were also used to compare with the knitted models. For the solid model, representing the porosity of 0, a combination of a light parachute textile and a light foamboard was used. The perforated board was produced by CNC drilling an acrylic board (thickness of 3 mm), using a grid of circular holes, with a diameter of 9 mm in an array of 35 by 35 (every other row offset with half the spacing between the circles), resulting in a porosity of 0.32.
2.2. Calculating the Porosity
Two common ways to describe the porosity of a windbreak structure are optical porosity, corresponding to the ratio between open surface and the total surface, and aerodynamic porosity [39]. The knitted structures investigated herein could be classified as two-dimensional and should, theoretically, be well described through optical porosity. This has also been the most frequently used method of estimating porosity in previous studies, as it is more easily measured [39].
The porosity for the knitted models was calculated by analyzing digital photographs of the knits, which were mounted on the frames to obtain the initial stretch, and then using a script to analyze the images in a Java-based programming environment, Processing. The porosity is calculated as the number of sufficiently light pixels divided by the number of all pixels in the photograph. To judge whether the script had correctly identified the pixels in the image, all sections counted as solid were colored yellow. Figure 6 is a visual comparison between the calculated porosity and the photo. The resultant porosities are shown in Table 1.
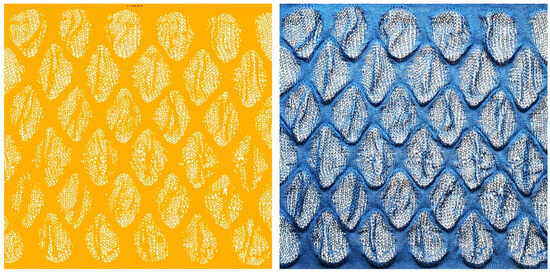
Figure 6.
Porosity calculated by using a script in Processing (based on pixel darkness). The calculated porosity is illustrated through coloring pixels that count as solid, here represented in yellow.
It should be noted that using optical porosity to measure the porosity of knitted structures might not give a fully accurate picture, as visually opaque sections might still let the air through. Furthermore, the three-dimensionality of the loop structure makes it difficult to obtain a photograph completely without shadows on a white background. These shadows can be difficult to separate from the yarn in the photograph. The three-dimensionality of the knits also entails that there will be folds in the drop-stitch models when lying “flat”, thus visually being less porous. With that being said, the calculated visual porosity does still provide a means to compare the different structures, as well as to compare them to previous studies based on the same porosity estimation principles.
Furthermore, the stretch factor needs to be addressed. This is a key aspect that separates knits from other porous media tested for wind reduction. The knitted prototypes presented in this study will stretch under the wind load, generating a larger area with the same amount of yarn and thus a higher porosity of the textile. As mentioned earlier, some of the prototypes also had an initial stretch resulting from the mounting on the frame, thus making it more complex to compare the calculated porosities and prototypes. An example is the drop-stitch 10%. As can be seen in Figure 7, the slight stretch from the mounting on the frame resulted in a difference in porosity.
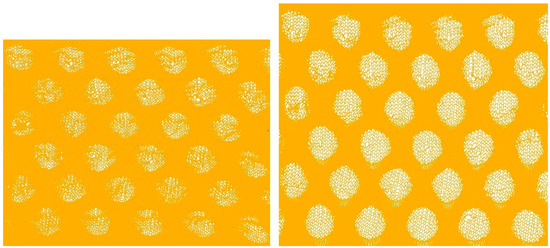
Figure 7.
Drop-stitch 10% unstretched (left) and stretched on a frame (right), resulting in differing porosities, 0.11 and 0.21, respectively. The parts that are calculated as impermeable are shown in yellow.
2.3. Wind Tunnel Setup
The measurements were performed in a wind tunnel at Chalmers University of Technology. It is a closed-loop low-turbulence wind tunnel with a cross-sectional dimension of the test section of 1.8 m × 1.25 m. The wind tunnel has good flow uniformity (better than 1%) and high flow stability. The incoming flow velocity was measured by a high-accuracy digital micromanometer with 0.5% accuracy. The micromanometer was connected to a Prandtl tube located in the wind tunnel inlet, approximately at a two-meter distance from the model. The air density was evaluated from the flow temperature and absolute pressure with 0.5% accuracy. The aerodynamic forces acting on the models were measured by a six-component balance with 1% accuracy. The given precisions apply to the whole measuring range, and the wind tunnel can accurately simulate incoming velocities in the range 0 to 60 m/s. The flow velocity behind the model was measured by a hot-film anemometer from Dantec Dynamics with an accuracy of over 2%, positioned in the middle of the tested screens, as illustrated in Figure 8. The anemometer measured the streamwise wind velocity without distinguishing the direction.
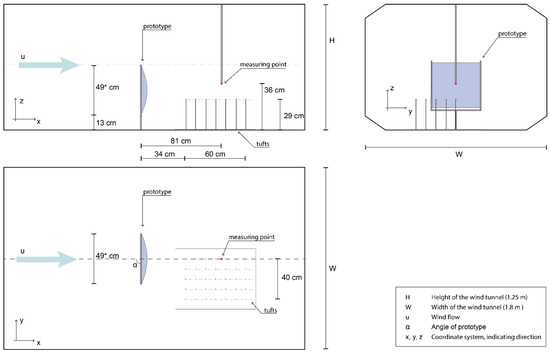
Figure 8.
The wind tunnel setup for the experiments. Top left, side elevation view; top right, front elevation view; and bottom left, top plan view. Compare with photo in Figure 9. * width of steel frame, center to center of the steel rods.
The setup in the wind tunnel can be seen in Figure 8 and Figure 9. All the models were mounted on a steel frame, with all members having a circular cross-section of 10 mm. The frame was mounted on a six-component balance located under the floor outside of the wind tunnel test section (Figure 8). The top and bottom of the textiles were held in place by a smaller steel rod (diameters: 3 mm and 2 mm). The total weight of the frame was 966 g.
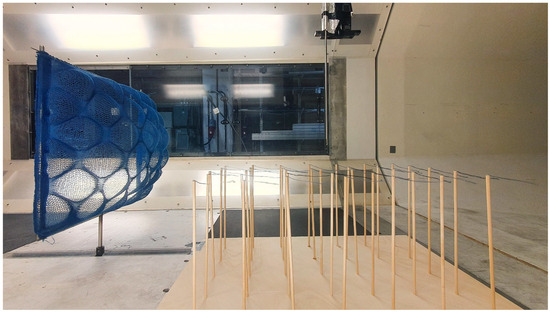
Figure 9.
The wind tunnel setup during the test for the drop-stitch 25% model at upcoming wind velocity of 12.5 m/s.
The upstream velocities were approximately 3.5, 6, 8, 12.5 and 15 m/s (the slight variation between the tests was due to the blockage). These velocities correlate to the Beaufort scales of 3, 4, 5, 6 and 7, ranging from a gentle breeze to near gale [3]. These values were measured for each test, resulting in minor differences each time, as can be seen in the graphs in the Results section. The models were tested at 4 different angles relative to the wind direction: 90°, 70°, 45° and 20° ( in Figure 8).
The wind speed downstream was measured with a hot-film anemometer at a position that would correlate to 5/8 H, where H is the height of the screen. However, compared with other studies on windbreaks, it should be noted that the screen in this study was not positioned at “ground level” but higher up, as can be seen in Figure 8 and Figure 9. As this study aims to evaluate the performance of a thought segment of a larger windbreak screen, the prototype was positioned away from surrounding walls to not be affected by their boundary layers.
3. Results
3.1. Reduction and Altering of the Wind
For the knitted models, the wind speed was reduced by around 60–90% at the position of the hot-film anemometer (Figure 8). This can be compared with the nonporous model, which reduced the wind by approximately 40% at a 90° angle (Figure 10). It should be noted that the hot-film anemometer, which was used to measure the velocity of the wind, does not give information about wind direction. For the case with the solid screen at a 90° angle, it is evident that the wind had changed direction, judging by the tufts placed behind the screens, as can be seen in Figure 11. A significant difference between the solid screen and the knitted ones, in terms of percentage of upwind velocity (PUV), was observed for the models positioned at an angle of 20° (Figure 12). For those models, the knits reduced the wind to 13–36% of the applied velocity, whereas the solid screen generated an increased velocity. Moreover, the PUV for the perforated board, positioned at an angle of 20°, was significantly higher compared to the knitted models. The highest reduction in windspeed was measured for the drop-stitch model and the densely knitted model when placed at a 90° angle and at a windspeed of 8 and 12.5 m/s, reducing the windspeed with 92% (Figure 10).
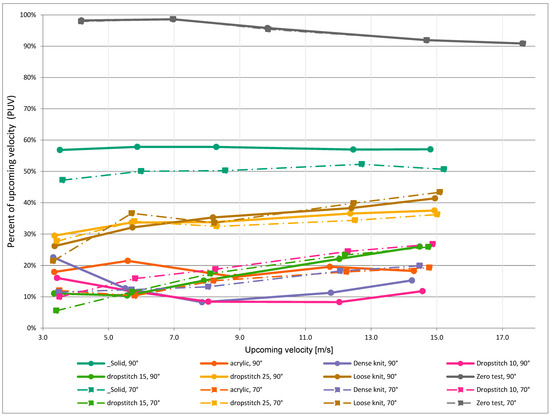
Figure 10.
Percent of upcoming velocity (PUV) for the screens positioned at an angle of 70° and 90° to the wind.
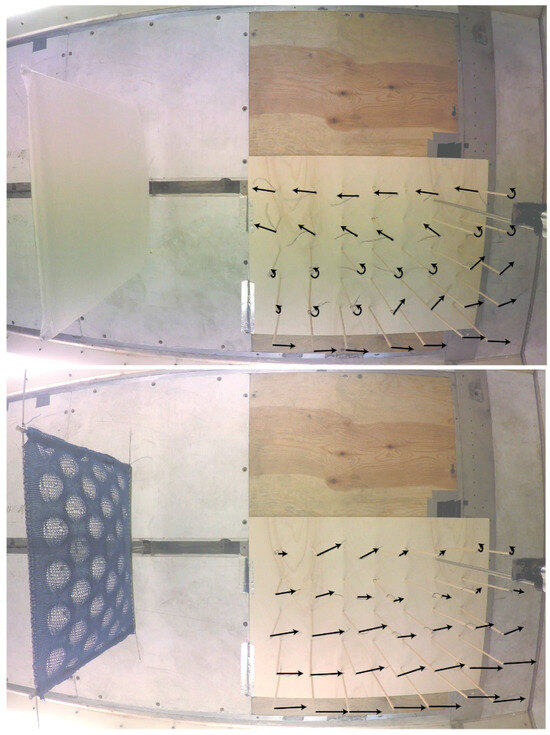
Figure 11.
Illustration of wind direction downwind for drop-stitch and solid screen at 8 m/s. Arrows are an interpretation of wind direction and speed, based on both photos and video filming. Circular arrows depict tufts which were moving randomly without well-defined direction but tended to turn in the direction of the arrow. The length of arrows, representing velocities, is based on the interpretation of the amplitude with which the tufts were fluctuating.
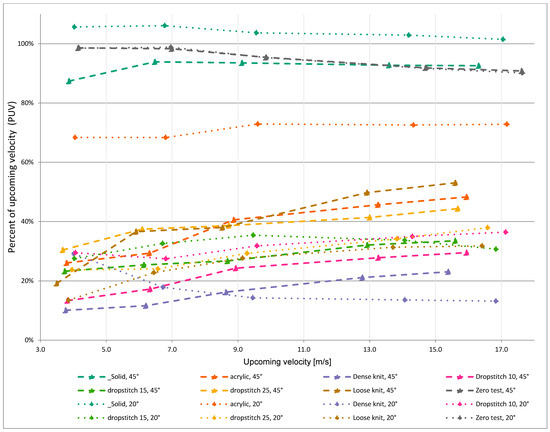
Figure 12.
Percent of upcoming velocity (PUV) for the screens positioned at an angle of 45° and 20° to the wind.
In Figure 13, the prototypes in the chart are arranged by increased PUV, which shows that the drop-stitch 10%, the densely knitted and the drop-stitch 15% prototypes perform best in terms of reducing the wind. In the chart in Figure 13, the calculated optical porosity for each model is also visualized, indicating a low correlation between porosity and PUV. This can be compared with the chart in Figure 14, where the values are arranged according to increasing calculated optical porosity. Here, no clear trend can be seen, implying that the calculated porosities are either wrong or that optical porosity is not a good tool for describing or comparing the models. However, by instead using the calculated optical porosity for the unstretched drop-stitch 10% knit and only including the knitted prototypes, as in Figure 15, the trend suggests that the optimal optical porosity is around 10% for the type of knitted models presented in this study. This could be compared with previous studies, which found that the optimal porosity for porous windbreaks is in the span of 20–35% [11,22,25], implying that the knitted models follow a different pattern than the nonflexible screens. The perforated board (acrylic) had a porosity of 32%, thus falling within the presented span from previous research, and, as can be seen in Figure 13 and Figure 14, it does perform well in terms of reducing wind.
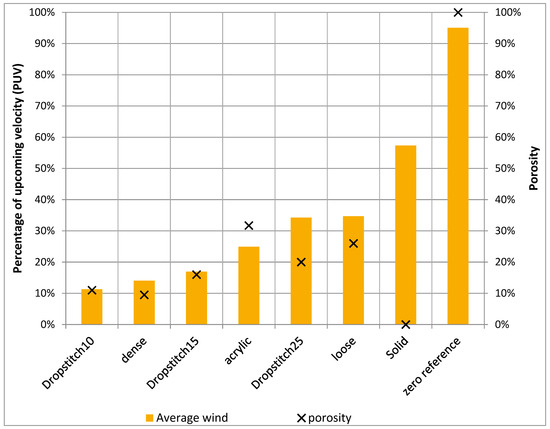
Figure 13.
Percentage of upcoming velocity (PUV) for the different models arranged in order of increasing average PUV and compared against the calculated optical porosity. The value for PUV is an average of all measured wind velocities for each prototype at a 90° position. In this chart, the optical porosity for the unstretched drop-stitch 10% model is used.
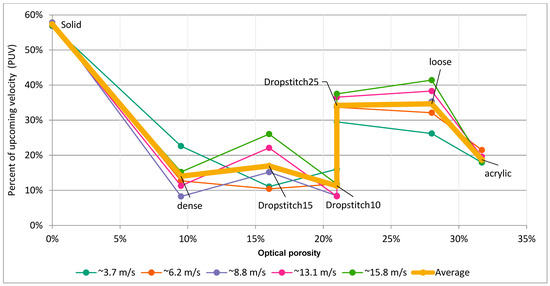
Figure 14.
Percentage of upcoming velocity (PUV) depending on the calculated optical porosity.
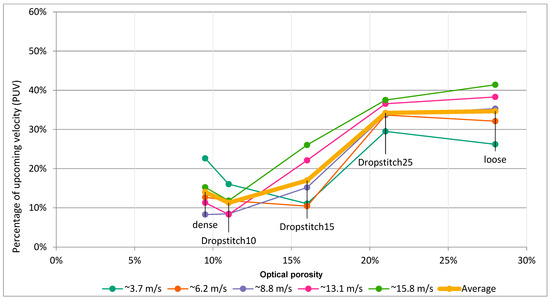
Figure 15.
Percentage of upcoming velocity (PUV) depending on the calculated optical porosity, using the value for unstretched drop-stitch 10%.
As expected, for the knitted models, the direction of the wind remains roughly the same on the leeward side; only the velocity is changed. For the solid screen, a large-scale flow separation zone is created, and the wind is moving in a negative direction at the centerline, when the screen is placed at 90° and 70°. Which can be seen in Figure 11, for the 90° position. For the solid screen in the 45° and 20° position, the wind is directed by the screen to a much larger extent than with the knitted screens.
3.2. Forces Acting on the Models
Figure 16 illustrates how the main force from the wind (drag) acts on the models, as well as the resulting support forces. The measured results for the drag force on the models are shown in Figure 17 and Figure 18. With these figures (Figure 16, Figure 17 and Figure 18), one can read the reaction forces generated by the different designs and get an impression of how these will affect the required anchoring foundation structure. As expected, the solid reference model generates the highest drag. Perhaps more surprisingly, both the perforated board, with a porosity of 32%, and the densely knitted model (9.5% optical porosity) yield relatively high values, and the two show very similar results for angles 90° and 70°. The two knitted models with the highest porosity, i.e., the loosely knitted and the drop-stitch 25% generate the lowest drag force at 90° and 70° positions. For the position at 20°, it is instead the perforated board that generates the lowest force. However, the perforated board is also reducing the wind to a much lower extent in this position.
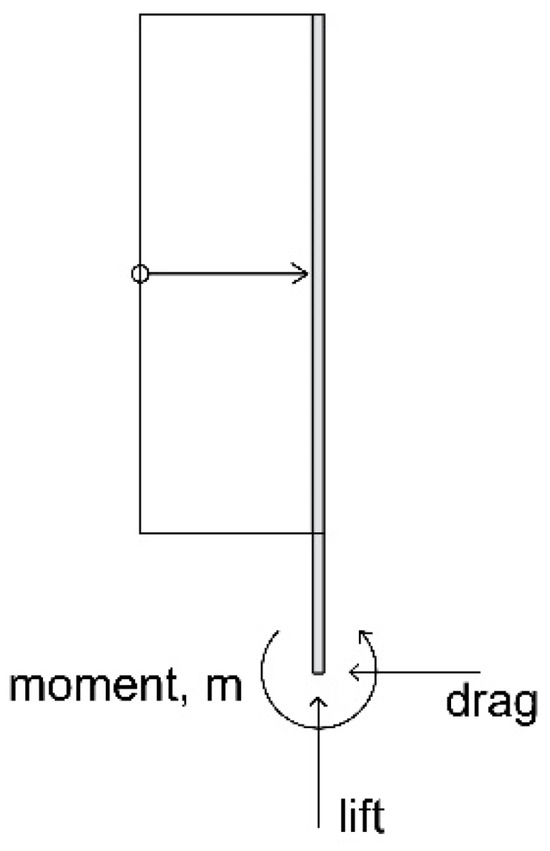
Figure 16.
Free-body diagram of the frame for the tested models.
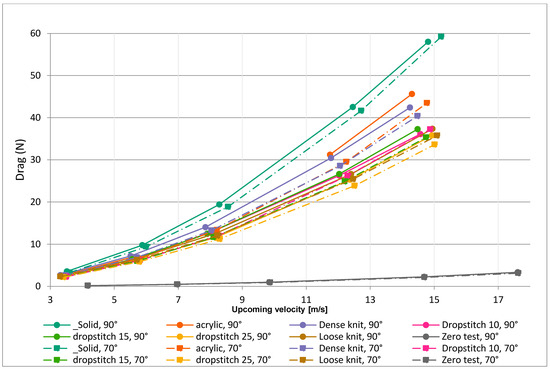
Figure 17.
Drag force exerted on the models during the wind tunnel tests. The results show concern models positioned at 90° and 70° toward the wind direction.
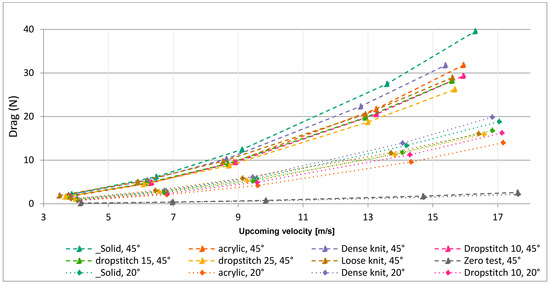
Figure 18.
Drag force exerted on the models during the wind tunnel tests. The results show concern models positioned at 45° and 20° toward the wind direction.
As can be seen in Table 2, it is the weight of the steel frame that is dominating in the total weight of the model.

Table 2.
Weight of the samples.
Figure 19 and Figure 20 show the measured drag coefficient (Cd) for the models, which gives information about the aerodynamic drag; for example, a streamlined body has a low drag coefficient, and a blunt body (e.g., a cube) has a high one. For a windbreak, the drag coefficient is defined as follows:
where , which is the frontal area, , projected perpendicularly to the wind direction; is the incoming wind velocity; is the force from the wind on the windbreak (drag force); and is the air density. For the knitted models placed at a 90° angle, the drag coefficient (Equation (1)) is decreasing with higher wind velocities, meaning that the applied wind load (drag force) on the prototype is lower in relation to the increase in wind velocity. This could be compared with the drag coefficient for the solid screen and the perforated board (noted as acrylic in the charts), which has a more constant value (as is expected). The decreasing drag coefficient is likely a result of increased porosity caused by the stretch of the textile with increased wind load.
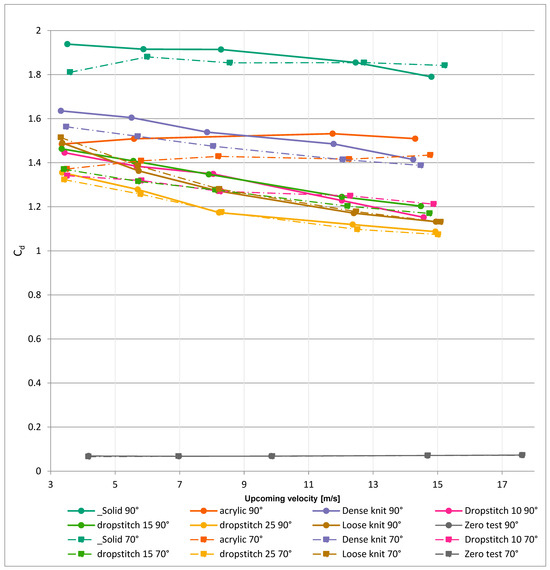
Figure 19.
Drag coefficient, Cd, for the models.
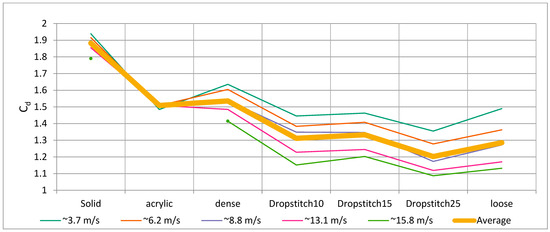
Figure 20.
Drag coefficient, Cd, for the models at 90°, with each curve representing a wind velocity.
3.3. Geometric Deformation and Wind Pattern
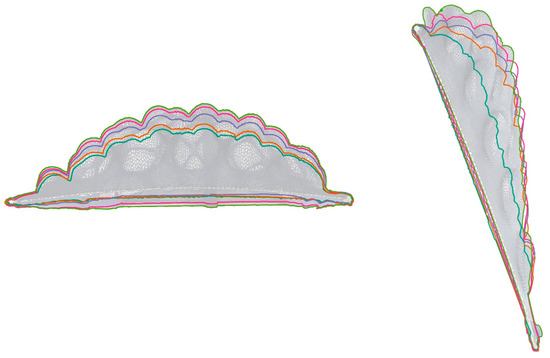
As can be seen in Table 3, the knitted models are bulging under the wind load. These photographs show the deformation, as well as the wind pattern behind the models for the upcoming wind velocity of ~12 m/s. The shape of the deformations relates to the pattern and original size of the models, as well as the stretch of the textile. Figure 21 illustrates simplified deformation shapes of the drop-stitch knit with a 10% ellipse pattern at different velocities, including an estimation of how large the overall bulging of the knit is, based on photos of the deformation. For the loose and dense knit prototypes, the surface curvature is homogenous across the model, whereas the drop-stitch is showing a bubble shape relating to the pattern, which becomes more pronounced with increased windspeed, as can be seen in Figure 22 for the drop-stitch 25% at 90° and 20° positions. The bulging deformation shapes for the knitted models at an angle of 20° are likely the reason for why the knitted models reduce the wind speed to a higher extent compared to solid models (both perforated and solid boards) in this position.

Table 3.
Comparing deformation and wind pattern behind the prototype for all test at a wind velocity of ~12 m/s at 90°.

Figure 21.
Estimated deformation shape of the knitted model drop-stitch 10%, based on the positions of the center of the ellipses on the third row from the top at the different windspeeds from 0 to 15 m/s in photos from wind-tunnel tests. The values represent distances in millimeters.
The tufts, which are mounted on wooden sticks on the wooden board behind the models, visualize the wind direction. In the case of the knitted models, at ~12 m/s wind, the tufts are following the mean wind direction, showing no or little turbulence, as can be seen in Table 3, whereas the tufts behind the perforated board are moving in multiple directions (Table 3), visualizing that turbulence occurs. For the unperforated reference board, there is much turbulence behind the board at angles 45–90°, and in most cases, a vortex is formed, as can be seen in Figure 11. In Appendix A, an estimation of turbulence and wind-direction changes for all tests are given. In the case of the perforated reference board, the vortex also occurs for wind velocities of 8.2–14.8 m/s, at an angle of 70°, as can be seen in Figure 23 for the wind velocity of 12.3 m/s. It is common for all the knitted models to not cause much turbulence; they also do not direct the wind to a large extent. In the case of the more loosely knitted models (drop-stitch 25% and loose), they do not seem to direct the wind at all and do not seem to cause more turbulence than is naturally occurring with just the empty frame and the wooden sticks.
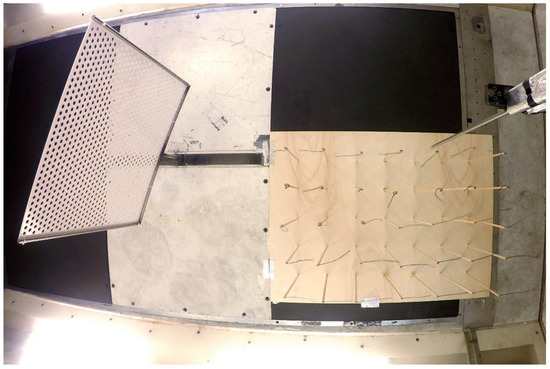
Figure 23.
Perforated board (acrylic) 70° 12.3 m/s. A vortex has taken shape behind the model.
4. Discussion
The results of this study indicate that knitted screens are efficient as windbreak structures and that the force from the wind acting on the screen and the supporting structure is lesser compared to both the porous and nonporous solid boards used as references. The drop-stitch 10% especially stands out in the results, as it reduces the wind efficiently but also generates low drag force, as well as demonstrates a decreased drag coefficient with increased wind velocities. The perforated board performs well in terms of reducing wind, but it generates a higher drag at a 90° angle. This proves to be the opposite for the perforated board positioned at 20°, in which case it has a low drag but does not significantly reduce the wind speed. The knitted models are deforming considerably under the wind load; this is a likely explanation for why these models still reduce much of the upcoming wind velocity even at a lower angle of 20°.
In previous research on porous windbreaks, the concluded optimum porosity varies between 20 and 35% [11,22,25]. The results of this study indicate that the optimum porosity in terms of reducing the wind velocity is around 10% for textile screens knitted using the drop-stitch pattern, as well as for the plain knits. Furthermore, the results suggest that the optimal porosity, in terms of reducing wind velocity, is different for a solid screen and for a screen knitted with a drop-stitch pattern. It should, however, be noted that the measured optical porosity of the windbreaks is an approximated value. Firstly, because it is calculated from color brightness in a photograph, it is difficult to separate shadows from threads in some sections of the knits. The reason for this is the three-dimensionality of the loop-structure that prevents the knit from lying completely flat against a surface, thus eliminating shadows. Secondly, as mentioned before, a visually opaque knit will still let the air through. Finally, as the knit stretches when the wind load is applied, the porosity is increasing with increased wind, as indicated by the decreasing drag coefficient at increasing wind velocities.
In previous studies performed by two of the authors [17], it was concluded that knits in general and drop-stitch knits in particular show design potential in terms of creating effectful volumetric expressions. The experiments in this study demonstrated that such structures have an additional functional potential of becoming efficient windbreaks in terms of reducing the wind speed. All the knitted models noticeably reduced the velocity of the wind. The denser models, with an estimated porosity of 10 to 15%, were most efficient if the optical porosity for the unstretched drop-stitch 10% model was used. At the same time, the more porous knits were still reducing the wind to a larger extent than a solid structure. In terms of wind reduction, the drop-stitch 10% and the dense knit were the most effective and achieved similar results. However, the dense knit had a higher drag coefficient and resulted in larger reaction forces, which indicates that the pattern and the distribution of the porosity are important parameters to include in the design of a knitted textile windbreak.
The loop-structure of the knit provides architects, textile designers and engineers with a large degree of freedom regarding pattern design variation. As different wind climates will be desired for different situations in an urban environment, it can be imagined that it is feasible to produce larger windbreak structures, knitted with the drop-stitch technique, so that the stitch density is customized for a particular space and its aesthetics, as well as local conditions and functional requirements. In a scenario of a colder climate, denser patches that reduce the wind speed to a greater extent could be used for spaces with low-intensity occupant activities, such as standing or sitting down. The looser, more bulging sections of the knit could be applicable in spatial situations where occupants are spending less time or where more high-intensity activities take place, such as walking or running, to achieve custom shielding. Compared to the models tested in this study, designs like this would likely generate a favorable aftereffect of larger aesthetic variation in the three-dimensional character of the textile in the wind, as can be seen in the example in Figure 2 and from prototypes presented in the prior studies by the authors [17].
In cases where the screen was placed at an angle closer to parallel to the wind direction, the knits did not seem to direct and thus concentrate the wind to the same extent as a solid screen, which was noted to increase the wind speed. Moreover, the perforated board reduced the wind speed to a lower extent at the 20° angle. This also suggests that knitted windbreaks of the type described in this article will reduce the wind velocities from a wider spectrum of directions compared to solid screens. Finally, the knitted textiles did not increase the wind speed in any of the tests. This is an important factor for windbreaks in an urban setting, where the wind is more turbulent and may come from any direction.
One significant benefit of using knitted textiles instead of other building materials is flexibility, lightness and foldability. This makes them easy to transport but also to mount and demount. Therefore, the textile windbreaks could be designed for temporary or periodic use in one area and then moved to another place in need of wind protection, for example, during public events or various season conditions at various locations. It is also plausible to accommodate in the design of knitted textiles the possibility of partially or entirely lowering them down to prevent damage in more extreme weather conditions. Furthermore, the fact that the knitted models in this study generated a low drag force and a drag coefficient that decrease with increased wind means that the anchoring foundations can be lighter (as the reaction forces are smaller) compared to other designs.
4.1. Limitations
We do not claim that the results presented herein fully capture the behavior and efficiency of knitted windbreaks but should rather be seen as a proof of concept that sets the stage for further research. For all the wind tunnel experiments, a well-controlled laminar inlet airflow was used to compare the wind speed reduction more easily, given that the downstream velocity was only measured at one point. This condition would not likely occur in natural wind settings.
The size of the tested models was also limited by both the manufacturing capacity of the knitting machine and the cross-section of the wind tunnel. As the models were relatively small, some of the flow would pass on all four sides of them and join the main flow in a way that would likely not occur in the middle zone of a larger windbreak structure. Furthermore, the measuring equipment was not calibrated for this specific case, resulting in less precision for the measured values. With the calibrations on the measuring equipment during the tests, the accuracy is expected to be within the range of multiplied by 1–1.05. However, the aim of the study was to evaluate how different designs of knitted textiles behaved in the wind in general and whether they could be perceived as an efficient solution for reducing the wind speed.
4.2. Future Research and Applications
The movement of the tufts in combination with the hot-wire anemometer gives a general understanding of how the textile affects the behavior and speed of the wind, but it does not provide the full picture. Further research is required to more deeply understand the behavior of the knit in the wind, the wind around the knit, the strains in the yarns and how a failure propagates in the structure. More detailed measurements in the wind tunnel would provide a better comprehension of the flow around the structures, as well as the size of the shielded area. This could be achieved with, for instance, particle image velocimetry (PIV) experiments. Further measurements of the motion and deformation of the knits would be useful for the design of new models. With more detailed measuring, it would also be interesting to study the knits in turbulent flow, as well as the effect it will have on air particle matter concentration.
In addition to this, it would be useful to make full-scale evaluations in outdoor wind conditions, for example, as a textile windbreak or wind shelter, or a similar structure. Such prototypes could also be used to evaluate material parameters that also need to be investigated before these types of structures could be considered viable elements in an urban environment. Further research is needed in terms of yarn and material characteristics, such as structural and safety aspects, sustainability and durability aspects, and how air pollution and dust affect the materials. This will also be important in order to perform life-cycle assessments on future knitted windbreaks and possibly also recycling options. Weather effects, such as rain, also need to be included in these evaluations. It could also be relevant to study whether the knitting pattern has any impact on the settling of impurities. For design and construction, frames and mounting options should also be explored in more detail. From the design standpoint, it would also be relevant to study combinations of differently positioned screens, placed at varying heights and having varying dimensions of the textile patches. Additionally, if larger screens are to be used, effects on birdlife should also be taken into consideration.
To design both efficient and aesthetically valuable knitted windbreaks, further research is needed on how the pattern of the knit correlates with the wind. The question remains of whether the bulging of the knits has a noticeable effect on the wind reduction when the textile is positioned perpendicular to the wind direction, as well as if the movement of the textile in turbulent wind absorbs a measurable amount of the kinetic energy from the wind. Answering this is important to inform potential simplified computational simulations of the flow around knitted windbreaks. Since simulations of these types of structures are a highly complex coupled fluid–structure interaction problem, the best option is likely to use faster particle simulation methods for visualizing the behavior of the knits in the wind, such as SPH (smoothed particle hydrodynamics) simulations [31,32]. The traditional CFD simulations could be relevant to use, as well, for visualizing the wind movement patterns in an urban context, using a simplified static screen with comparable properties.
Another application for knitted textiles in architecture that would be interesting to research further is as a façade layer to increase aesthetics and insulation. This could then be a permanent structure or a temporary/seasonal adjustment acting as a winter coat for a building. For this, a comparative study of different knitting techniques and patterns is suggested, investigating how they relate to parameters such as aesthetical appearance, ability to keep an insulating layer of air, ease of incorporating openings for windows, etc.
5. Conclusions
The results from the wind tunnel experiments carried out in this study demonstrate that knitted textiles have the potential to act as efficient windbreak structures. Two outcomes of this study especially speak for this: firstly, the model knitted with a drop-stitch pattern of 10% stands out in terms of efficiently reducing the wind velocity (PUV 8–16%) while still generating a low drag force; and secondly, the fact that the drag coefficient for the knits seems to decrease with an increased wind speed. This implies that knits should, in theory, better cope with unexpected strong winds. Specifically, the results from this study indicate that the optimal porosity for knitted structures of this type should lie around 10%. In the tests, both the densely knitted and the drop-stitch 10% prototypes reduced the wind by around 90% (with slight variation depending on the wind velocity), while the drop-stitch 10% generated a 12% lower drag force.
Moreover, textiles such as the ones presented in this study have the benefit of being foldable and easy to transport and provide designers with freedom in pattern design and variation in terms of three-dimensionality. Thus, linking on to previous research carried out by two of the authors that concluded that knitted structures such as the ones researched in this paper are useful in terms of generating aesthetic effects of volumetric expressions, it can be concluded that this type of knitted structure has the potential to improve the aesthetic user experience, as well as the wind comfort, especially in urban areas with limited space.
Author Contributions
Conceptualization, E.H. and M.A.Z.; methodology, E.H., M.A.Z., V.C. and M.A.; investigation, E.H., M.A and V.C.; resources, E.H and V.C.; writing—original draft preparation, E.H.; writing—review and editing, E.H., M.A.Z., V.C. and M.A.; visualization, E.H.; supervision, M.A.Z.; project administration, E.H. All authors have read and agreed to the published version of the manuscript.
Funding
The research is funded by the Chalmers University of Technology Foundation.
Data Availability Statement
The data presented in this study are openly available in at the Swedish National Dataservice database, https://snd.gu.se/en (https://doi.org/10.5878/7v2p-gr22).
Acknowledgments
The authors would like to thank Chris Williams for valuable input into this article. Thanks also to Peter Lindblom, Tabita Nilsson and Sebastian Almfeldt for the support and production of the steel mounting frame and the acrylic perforated board for the wind tunnel tests.
Conflicts of Interest
The authors declare no conflict of interest.
Correction Statement
This article has been republished with a minor correction to the Data Availability Statement. This change does not affect the scientific content of the article.
Appendix A. Wind Tunnel Tests: Turbulence and Wind Direction
In Table A2 in this appendix, the evaluation of the turbulence and change in wind direction caused by the models are reported. An explanation of the numbers can be found in the first table (Table A1).

Table A1.
Table legend explaining values and colors in Table A2.
Table A1.
Table legend explaining values and colors in Table A2.
| Turbulence | Wind Direction | ||
|---|---|---|---|
| 0 | Steady laminar flow | 0 | Same as in flow |
| 1 | Tufts shiver | 1 | Some tufts have changed direction slightly |
| 2 | Several tufts move noticeably sideways | 2 | Some tufts have clearly changed direction |
| 3 | A few tufts shake in the magnitude of 90° to the wind direction | 3 | Most of the tufts have clearly changed direction or a few have changed 90° |
| 4 | Several tufts shake considerably, or a few rotate | 4 | Several tufts have changed direction, at least, 90° |
| 5 | Several tufts rotate around the sticks | 5 | Several tufts have turned 180° |

Table A2.
Evaluation of turbulence and wind directions downwind from the prototypes.
Table A2.
Evaluation of turbulence and wind directions downwind from the prototypes.
| Sample | Angle | Windspeed in (U) | Hotwire Output | PUV | Turbulence | Changed Direction | Notes |
|---|---|---|---|---|---|---|---|
| _Solid | 90 | 3.5 | 2 | 57% | 3 | 5 | A vortex has taken shape behind the screen. |
| _Solid | 90 | 5.9 | 3.4 | 58% | 5 | 4 | A vortex has taken shape behind the screen. |
| _Solid | 90 | 8.3 | 4.79 | 58% | 5 | 5 | A vortex has taken shape behind the screen. |
| _Solid | 90 | 12.5 | 7.1 | 57% | 5 | 5 | A vortex has taken shape behind the screen. |
| _Solid | 90 | 14.8 | 8.45 | 57% | 5 | 5 | A vortex has taken shape behind the screen. Value on hot-wire anemometer varies a bit. |
| _Solid | 70 | 3.6 | 1.7 | 47% | 4 | 4 | A vortex has taken shape behind the screen. |
| _Solid | 70 | 6.0 | 3 | 50% | 4 | 4 | A vortex has taken shape behind the screen. |
| _Solid | 70 | 8.6 | 4.3 | 50% | 4 | 4 | A vortex has taken shape behind the screen. Value on hot-wire anemometer varies a lot. |
| _Solid | 70 | 12.7 | 6.65 | 52% | 4 | 4 | A vortex has taken shape behind the screen. Value on hot-wire anemometer varies a lot. |
| _Solid | 70 | 15.2 | 7.71 | 51% | 5 | 4 | A vortex has taken shape behind the screen. |
| _Solid | 45 | 3.9 | 3.38 | 87% | 4 | 4 | Difficult to tell where to draw the line between turbulence and changed direction. Resonance in forces sideways and lift. |
| _Solid | 45 | 6.5 | 6.08 | 94% | 3 | 4 | Difficult to tell where to draw the line between turbulence and changed direction. |
| _Solid | 45 | 9.1 | 8.53 | 94% | 3 | 4 | Difficult to tell where to draw the line between turbulence and changed direction. |
| _Solid | 45 | 13.6 | 12.6 | 93% | 4 | 3 | Difficult to tell where to draw the line between turbulence and changed direction. |
| _Solid | 45 | 16.3 | 15.1 | 93% | 4 | 3 | Difficult to tell where to draw the line between turbulence and changed direction. |
| _Solid | 20 | 4.0 | 4.26 | 106% | 1 | 3 | . |
| _Solid | 20 | 6.8 | 7.19 | 106% | 1 | 3 | . |
| _Solid | 20 | 9.6 | 9.91 | 104% | 1 | 3 | . |
| _Solid | 20 | 14.2 | 14.6 | 103% | 1 | 3 | . |
| _Solid | 20 | 17.0 | 17.3 | 101% | 1 | 3 | . |
| Acrylic | 90 | 3.3 | 0.6 | 18% | 2 | 0 | Value on hot-wire anemometer varies a lot. |
| Acrylic | 90 | 5.6 | 1.2 | 21% | 3 | 0 | Value on hot-wire anemometer varies a lot. |
| Acrylic | 90 | 8.9 | 1.45 | 16% | 4 | 0 | Some measuring data lost. |
| Acrylic | 90 | 11.7 | 2.3 | 20% | 5 | 0 | There is a tendency for a vortex to shape, but the wind fluctuates too much. Value on hot-wire anemometer varies a lot. |
| Acrylic | 90 | 14.3 | 2.61 | 18% | 5 | 0 | There is a tendency for a vortex to shape, but the wind fluctuates too much. Value on hot-wire anemometer varies a lot. |
| Acrylic | 70 | 3.5 | 0.42 | 12% | 2 | 1 | Value on hot-wire anemometer still fluctuates. |
| Acrylic | 70 | 5.8 | 0.6 | 10% | 3 | 1 | Value on hot-wire anemometer still fluctuates. |
| Acrylic | 70 | 8.2 | 1.24 | 15% | 2 | 4 | A vortex has taken shape behind the screen. Value on hot-wire anemometer still fluctuates. |
| Acrylic | 70 | 12.3 | 2.2 | 18% | 3 | 5 | A vortex has taken shape behind the screen. Value on hot-wire anemometer varies a lot. |
| Acrylic | 70 | 14.8 | 2.85 | 19% | 3 | 5 | A vortex has taken shape behind the screen. Value on hot-wire anemometer varies a lot. |
| Acrylic | 45 | 3.8 | 0.99 | 26% | 2 | 2 | Value on hot-wire anemometer varies a lot. |
| Acrylic | 45 | 6.3 | 1.85 | 29% | 2 | 2 | Value on hot-wire anemometer varies a lot. |
| Acrylic | 45 | 8.9 | 3.6 | 41% | 3 | 3 | Value on hot-wire anemometer varies a lot. |
| Acrylic | 45 | 13.3 | 6.05 | 46% | 2 | 3 | Tufts close to model moves vertically. |
| Acrylic | 45 | 15.9 | 7.7 | 48% | 2 | 3 | Value on hot-wire anemometer somewhat more stable. |
| Acrylic | 20 | 4.1 | 2.77 | 68% | 1 | 1 | . |
| Acrylic | 20 | 6.8 | 4.65 | 68% | 1 | 1 | . |
| Acrylic | 20 | 9.6 | 7 | 73% | 1 | 1 | . |
| Acrylic | 20 | 14.3 | 10.4 | 73% | 1 | 1 | . |
| Acrylic | 20 | 17.2 | 12.5 | 73% | 1 | 1 | . |
| Dense knit | 90 | 3.3 | 0.75 | 23% | 2 | 0 | Value on hot-wire anemometer varies a lot. |
| Dense knit | 90 | 5.5 | 0.7 | 13% | 2 | 0 | . |
| Dense knit | 90 | 7.9 | 0.65 | 8% | 1 | 0 | Value on hot-wire anemometer still unstable. |
| Dense knit | 90 | 11.8 | 1.33 | 11% | 1 | 0 | . |
| Dense knit | 90 | 14.2 | 2.17 | 15% | 1 | 0 | . |
| Dense knit | 70 | 3.5 | 0.4 | 12% | 2 | 1 | Value on hot-wire anemometer varies a lot. |
| Dense knit | 70 | 5.7 | 0.7 | 12% | 2 | 1 | Value on hot-wire anemometer varies a lot. |
| Dense knit | 70 | 8.0 | 1.06 | 13% | 2 | 1 | . |
| Dense knit | 70 | 12.1 | 2.2 | 18% | 1 | 1 | . |
| Dense knit | 70 | 14.5 | 2.88 | 20% | 1 | 1 | . |
| Dense knit | 45 | 3.8 | 0.38 | 10% | 3 | 2 | Value on hot-wire anemometer varies a lot. |
| Dense knit | 45 | 6.2 | 0.72 | 12% | 2 | 1 | . |
| Dense knit | 45 | 8.6 | 1.4 | 16% | 1 | 1 | . |
| Dense knit | 45 | 12.8 | 2.7 | 21% | 1 | 1 | . |
| Dense knit | 45 | 15.4 | 3.55 | 23% | 1 | 1 | . |
| Dense knit | 20 | 4.0 | 1.17 | 29% | 2 | 2 | . |
| Dense knit | 20 | 6.7 | 1.2 | 18% | 2 | 2 | . |
| Dense knit | 20 | 9.5 | 1.35 | 14% | 2 | 2 | . |
| Dense knit | 20 | 14.1 | 1.91 | 14% | 2 | 2 | . |
| Dense knit | 20 | 16.8 | 2.22 | 13% | 2 | 1 | . |
| Drop-stitch 10 | 90 | 3.4 | 0.55 | 16% | 2 | 0 | . |
| Drop-stitch 10 | 90 | 5.7 | 0.67 | 12% | 2 | 0 | . |
| Drop-stitch 10 | 90 | 8.0 | 0.68 | 8% | 2 | 0 | . |
| Drop-stitch 10 | 90 | 12.0 | 1 | 8% | 3 | 0 | . |
| Drop-stitch 10 | 90 | 14.6 | 1.72 | 12% | 2 | 0 | . |
| Drop-stitch 10 | 70 | 3.5 | 0.35 | 10% | 1 | 1 | . |
| Drop-stitch 10 | 70 | 5.8 | 0.92 | 16% | 1 | 1 | . |
| Drop-stitch 10 | 70 | 8.3 | 1.55 | 19% | 1 | 1 | . |
| Drop-stitch 10 | 70 | 12.3 | 3.01 | 24% | 1 | 1 | . |
| Drop-stitch 10 | 70 | 14.9 | 3.99 | 27% | 1 | 1 | . |
| Drop-stitch 10 | 45 | 3.8 | 0.51 | 13% | 1 | 2 | . |
| Drop-stitch 10 | 45 | 6.3 | 1.09 | 17% | 1 | 2 | . |
| Drop-stitch 10 | 45 | 8.9 | 2.17 | 24% | 1 | 2 | . |
| Drop-stitch 10 | 45 | 13.3 | 3.69 | 28% | 1 | 2 | . |
| Drop-stitch 10 | 45 | 15.9 | 4.71 | 30% | 1 | 2 | . |
| Drop-stitch 10 | 20 | 4.1 | 1.2 | 30% | 1 | 2 | . |
| Drop-stitch 10 | 20 | 6.8 | 1.87 | 27% | 1 | 2 | . |
| Drop-stitch 10 | 20 | 9.6 | 3.05 | 32% | 1 | 2 | . |
| Drop-stitch 10 | 20 | 14.3 | 5 | 35% | 2 | 2 | . |
| Drop-stitch 10 | 20 | 17.1 | 6.24 | 36% | 2 | 2 | . |
| Drop-stitch 15 | 90 | 3.3 | 0.37 | 11% | 1 | 0 | . |
| Drop-stitch 15 | 90 | 5.6 | 0.58 | 10% | 1 | 0 | . |
| Drop-stitch 15 | 90 | 7.9 | 1.2 | 15% | 1 | 0 | . |
| Drop-stitch 15 | 90 | 12.0 | 2.66 | 22% | 1 | 0 | . |
| Drop-stitch 15 | 90 | 14.5 | 3.77 | 26% | 1 | 0 | . |
| Drop-stitch 15 | 70 | 3.4 | 0.19 | 6% | 1 | 0 | . |
| Drop-stitch 15 | 70 | 5.7 | 0.66 | 12% | 1 | 0 | . |
| Drop-stitch 15 | 70 | 8.1 | 1.41 | 17% | 1 | 0 | . |
| Drop-stitch 15 | 70 | 12.2 | 2.85 | 23% | 1 | 0 | . |
| Drop-stitch 15 | 70 | 14.7 | 3.82 | 26% | 1 | 0 | . |
| Drop-stitch 15 | 45 | 3.7 | 0.87 | 23% | 1 | 1 | . |
| Drop-stitch 15 | 45 | 6.1 | 1.56 | 25% | 1 | 1 | . |
| Drop-stitch 15 | 45 | 8.7 | 2.32 | 27% | 1 | 1 | . |
| Drop-stitch 15 | 45 | 12.9 | 4.15 | 32% | 1 | 0 | . |
| Drop-stitch 15 | 45 | 15.6 | 5.23 | 34% | 1 | 0 | . |
| Drop-stitch 15 | 20 | 4.0 | 1.11 | 28% | 1 | 1 | . |
| Drop-stitch 15 | 20 | 6.7 | 2.19 | 33% | 1 | 1 | . |
| Drop-stitch 15 | 20 | 9.5 | 3.35 | 35% | 1 | 0 | . |
| Drop-stitch 15 | 20 | 14.1 | 4.74 | 34% | 1 | 0 | . |
| Drop-stitch 15 | 20 | 16.8 | 5.17 | 31% | 1 | 0 | . |
| Drop-stitch 25 | 90 | 3.4 | 0.99 | 30% | 1 | 0 | . |
| Drop-stitch 25 | 90 | 5.7 | 1.92 | 34% | 1 | 0 | . |
| Drop-stitch 25 | 90 | 8.2 | 2.78 | 34% | 1 | 0 | . |
| Drop-stitch 25 | 90 | 12.4 | 4.52 | 37% | 1 | 0 | . |
| Drop-stitch 25 | 90 | 14.9 | 5.6 | 38% | 1 | 0 | . |
| Drop-stitch 25 | 70 | 3.4 | 0.95 | 28% | 1 | 0 | . |
| Drop-stitch 25 | 70 | 5.8 | 1.97 | 34% | 1 | 0 | . |
| Drop-stitch 25 | 70 | 8.3 | 2.69 | 32% | 1 | 0 | . |
| Drop-stitch 25 | 70 | 12.5 | 4.3 | 34% | 1 | 0 | . |
| Drop-stitch 25 | 70 | 15.0 | 5.44 | 36% | 1 | 0 | . |
| Drop-stitch 25 | 45 | 3.7 | 1.12 | 30% | 1 | 0 | . |
| Drop-stitch 25 | 45 | 6.1 | 2.28 | 37% | 1 | 0 | . |
| Drop-stitch 25 | 45 | 8.7 | 3.37 | 39% | 1 | 0 | . |
| Drop-stitch 25 | 45 | 13.0 | 5.38 | 41% | 1 | 0 | . |
| Drop-stitch 25 | 45 | 15.7 | 6.95 | 44% | 1 | 0 | . |
| Drop-stitch 25 | 20 | 4.0 | 0.94 | 24% | 1 | 0 | . |
| Drop-stitch 25 | 20 | 6.6 | 1.58 | 24% | 1 | 0 | . |
| Drop-stitch 25 | 20 | 9.3 | 2.72 | 29% | 1 | 0 | . |
| Drop-stitch 25 | 20 | 13.8 | 4.73 | 34% | 1 | 0 | . |
| Drop-stitch 25 | 20 | 16.6 | 6.29 | 38% | 1 | 0 | . |
| Loose knit | 90 | 3.4 | 0.88 | 26% | 1 | 0 | . |
| Loose knit | 90 | 5.7 | 1.84 | 32% | 1 | 0 | . |
| Loose knit | 90 | 8.2 | 2.89 | 35% | 1 | 0 | . |
| Loose knit | 90 | 12.4 | 4.75 | 38% | 1 | 0 | . |
| Loose knit | 90 | 14.9 | 6.19 | 41% | 1 | 0 | . |
| Loose knit | 70 | 3.3 | 0.71 | 21% | 1 | 0 | . |
| Loose knit | 70 | 5.7 | 2.09 | 37% | 1 | 0 | . |
| Loose knit | 70 | 8.2 | 2.76 | 34% | 1 | 0 | . |
| Loose knit | 70 | 12.5 | 4.97 | 40% | 1 | 0 | . |
| Loose knit | 70 | 15.1 | 6.54 | 43% | 1 | 0 | . |
| Loose knit | 45 | 3.5 | 0.67 | 19% | 1 | 0 | . |
| Loose knit | 45 | 5.9 | 2.16 | 37% | 1 | 0 | . |
| Loose knit | 45 | 8.5 | 3.24 | 38% | 1 | 0 | . |
| Loose knit | 45 | 12.9 | 6.43 | 50% | 1 | 0 | . |
| Loose knit | 45 | 15.6 | 8.28 | 53% | 1 | 0 | . |
| Loose knit | 20 | 3.9 | 0.52 | 14% | 1 | 0 | . |
| Loose knit | 20 | 6.4 | 1.47 | 23% | 1 | 0 | . |
| Loose knit | 20 | 9.1 | 2.53 | 28% | 1 | 0 | Knit moves on rod. |
| Loose knit | 20 | 13.7 | 4.3 | 31% | 1 | 0 | Start to touch the pins. |
| Loose knit | 20 | 16.4 | 5.22 | 32% | 1 | 0 | . |
| Zero test | 90 | 4.2 | 4.1 | 98% | 1 | 0 | . |
| Zero test | 90 | 7.0 | 6.88 | 99% | 1 | 0 | . |
| Zero test | 90 | 9.8 | 9.43 | 96% | 1 | 0 | . |
| Zero test | 90 | 14.7 | 13.5 | 92% | 1 | 0 | . |
| Zero test | 90 | 17.6 | 16 | 91% | 1 | 0 | . |
| Zero test | 70 | 4.2 | 4.08 | 98% | 1 | 0 | . |
| Zero test | 70 | 7.0 | 6.87 | 99% | 1 | 0 | . |
| Zero test | 70 | 9.9 | 9.41 | 95% | 1 | 0 | . |
| Zero test | 70 | 14.7 | 13.5 | 92% | 1 | 0 | . |
| Zero test | 70 | 17.6 | 16 | 91% | 1 | 0 | . |
| Zero test | 45 | 4.1 | 4.09 | 99% | 1 | 0 | . |
| Zero test | 45 | 7.0 | 6.87 | 98% | 1 | 0 | . |
| Zero test | 45 | 9.9 | 9.4 | 95% | 1 | 0 | . |
| Zero test | 45 | 14.7 | 13.5 | 92% | 1 | 0 | . |
| Zero test | 45 | 17.6 | 16 | 91% | 1 | 0 | . |
| Zero test | 20 | 4.2 | 4.11 | 98% | 1 | 0 | . |
| Zero test | 20 | 7.0 | 6.88 | 99% | 1 | 0 | . |
| Zero test | 20 | 9.9 | 9.4 | 95% | 1 | 0 | . |
| Zero test | 20 | 14.7 | 13.5 | 92% | 1 | 0 | . |
| Zero test | 20 | 17.6 | 15.9 | 90% | 1 | 0 | . |
References
- Blocken, B.; Stathopoulos, T.; van Beeck, J.P.A.J. Pedestrian-Level Wind Conditions around Buildings: Review of Wind-Tunnel and CFD Techniques and Their Accuracy for Wind Comfort Assessment. Build. Environ. 2016, 100, 50–81. [Google Scholar] [CrossRef]
- Zhen, M.; Chen, Z.; Zheng, R. Outdoor Wind Comfort and Adaptation in a Cold Region. Buildings 2022, 12, 476. [Google Scholar] [CrossRef]
- Penwarden, A.D. Acceptable Wind Speeds in Towns. Build. Sci. 1973, 8, 259–267. [Google Scholar] [CrossRef]
- Lai, D.; Liu, W.; Gan, T.; Liu, K.; Chen, Q. A Review of Mitigating Strategies to Improve the Thermal Environment and Thermal Comfort in Urban Outdoor Spaces. Sci. Total Environ. 2019, 661, 337–353. [Google Scholar] [CrossRef] [PubMed]
- Cochran, L. Design Features to Change and/or Ameliorate Pedestrian Wind Conditions. In Proceedings of the Structures Congress 2004, Nashville, TN, USA, 22–26 May 2004; pp. 1–8. [Google Scholar] [CrossRef]
- Fernando, S.; Fernando, S.; Mendis, P. Pedestrian Wind Comfort Study Using Computational Fluid Dynamic (CFD) Simulation. In Proceedings of the International Conference on Sustainable Built Environment (ICSBE 2018), Banjarmasin, Indonesia, 11–13 October 2018; Dissanayake, R., Mendis, P., Eds.; Springer: Singapore, 2020; pp. 323–339. [Google Scholar]
- Stathopoulos, T. Wind and Comfort. In Proceedings of the 5th European and African Conference on Wind Engineering, EACWE 5, Florence, Italy, 19–23 July 2009. [Google Scholar]
- Heisler, G.M.; Dewalle, D.R. 2. Effects of Windbreak Structure on Wind Flow. Agric. Ecosyst. Environ. 1988, 22–23, 41–69. [Google Scholar] [CrossRef]
- Bitog, J.P.; Lee, I.-B.; Hwang, H.-S.; Shin, M.-H.; Hong, S.-W.; Seo, I.-H.; Mostafa, E.; Pang, Z. A Wind Tunnel Study on Aerodynamic Porosity and Windbreak Drag. For. Sci. Technol. 2011, 7, 8–16. [Google Scholar] [CrossRef]
- Zhou, X.H.; Brandle, J.R.; Mize, C.W.; Takle, E.S. Three-Dimensional Aerodynamic Structure of a Tree Shelterbelt: Definition, Characterization and Working Models. Agrofor. Syst. 2005, 63, 133–147. [Google Scholar] [CrossRef]
- Dong, Z.; Luo, W.; Qian, G.; Wang, H. A Wind Tunnel Simulation of the Mean Velocity Fields behind Upright Porous Fences. Agric. For. Meteorol. 2007, 146, 82–93. [Google Scholar] [CrossRef]
- Lee, S.-J.; Kim, H.-B. Laboratory Measurements of Velocity and Turbulence Field behind Porous Fences. J. Wind. Eng. Ind. Aerodyn. 1999, 80, 311–326. [Google Scholar] [CrossRef]
- Lee, S.-J.; Lim, H.-C. A Numerical Study on Flow around a Triangular Prism Located behind a Porous Fence. Fluid Dyn. Res. 2001, 28, 209. [Google Scholar] [CrossRef]
- Sari, D.P.; Cho, K.-P. Performance Comparison of Different Building Shapes Using a Wind Tunnel and a Computational Model. Buildings 2022, 12, 144. [Google Scholar] [CrossRef]
- Hershcovich, C.; van Hout, R.; Rinsky, V.; Laufer, M.; Grobman, Y.J. Thermal Performance of Sculptured Tiles for Building Envelopes. Build. Environ. 2021, 197, 107809. [Google Scholar] [CrossRef]
- Kormaníková, L.; Achten, H.; Kopřiva, M.; Kmeť, S. Parametric Wind Design. Front. Archit. Res. 2018, 7, 383–394. [Google Scholar] [CrossRef]
- Hörteborn, E.; Zboinska, M.A. Exploring Expressive and Functional Capacities of Knitted Textiles Exposed to Wind Influence. Front. Archit. Res. 2021, 10, 669–691. [Google Scholar] [CrossRef]
- Koch, K.-M.; Habermann, K.J.; Forster, B. Membrane Structures: Innovative Building with Film and Fabric; Prestel Publishing: Munich, Germany, 2004. [Google Scholar]
- Popescu, M.; Rippmann, M.; Liew, A.; Reiter, L.; Flatt, R.J.; Van Mele, T.; Block, P. Structural Design, Digital Fabrication and Construction of the Cable-Net and Knitted Formwork of the KnitCandela Concrete Shell. Structures 2020, 31, 1287–1299. [Google Scholar] [CrossRef]
- Hörteborn, E. Textile Architecture Informed by Wind; Chalmers University of Technology: Gothenburg, Sweden, 2020. [Google Scholar]
- Hagen, L.J.; Skidmore, E.L. Turbulent Velocity Fluctuations and Vertical Flow as Affected Bv Windbreak Porositv. Trans. ASAE 1971, 14, 634–637. [Google Scholar]
- Raine, J.K.; Stevenson, D.C. Wind Protection by Model Fences in a Simulated Atmospheric Boundary Layer. J. Wind. Eng. Ind. Aerodyn. 1977, 2, 159–180. [Google Scholar] [CrossRef]
- Richardson, G.M.; Richards, P.J. Full-Scale Measurements of the Effect of a Porous Windbreak on Wind Spectra. J. Wind. Eng. Ind. Aerodyn. 1995, 54–55, 611–619. [Google Scholar] [CrossRef]
- Wilson, J.D. Numerical Studies of Flow through a Windbreak. J. Wind. Eng. Ind. Aerodyn. 1985, 21, 119–154. [Google Scholar] [CrossRef]
- Cornelis, W.M.; Gabriels, D. Optimal Windbreak Design for Wind-Erosion Control. J. Arid. Environ. 2005, 61, 315–332. [Google Scholar] [CrossRef]
- Caborn, J.M. Shelterbelts and Microclimate; The Forestry Department of Edinburgh University: Edinburgh, UK, 1957; pp. 1–164. [Google Scholar]
- Hong, S.-W.; Lee, I.-B.; Seo, I.-H. Modelling and Predicting Wind Velocity Patterns for Windbreak Fence Design. J. Wind. Eng. Ind. Aerodyn. 2015, 142, 53–64. [Google Scholar] [CrossRef]
- Park, C.-W.; Lee, S.-J. Verification of the Shelter Effect of a Windbreak on Coal Piles in the POSCO Open Storage Yards at the Kwang-Yang Works. Atmos. Environ. 2002, 36, 2171–2185. [Google Scholar] [CrossRef]
- Mahgoub, A.O.; Ghani, S. Numerical and Experimental Investigation of Utilizing the Porous Media Model for Windbreaks CFD Simulation. Sustain. Cities Soc. 2021, 65, 102648. [Google Scholar] [CrossRef]
- Hörteborn, E.; Zboinska, M.; Dumitrescu, D.; Williams, C.; Felbrich, B. Architecture from Textiles in Motion. In Proceedings of the Form and Force, CIMNE, Barcelona, Spain, 7–10 October 2019; pp. 2316–2323. [Google Scholar]
- Liu, M.B.; Liu, G.R. Smoothed Particle Hydrodynamics (SPH): An Overview and Recent Developments. Arch. Comput. Methods Eng. 2010, 17, 25–76. [Google Scholar] [CrossRef]
- Hosain, M.L.; Domínguez, J.M.; Bel Fdhila, R.; Kyprianidis, K. Smoothed Particle Hydrodynamics Modeling of Industrial Processes Involving Heat Transfer. Appl. Energy 2019, 252, 113441. [Google Scholar] [CrossRef]
- Shadloo, M.S.; Oger, G.; Le Touzé, D. Smoothed Particle Hydrodynamics Method for Fluid Flows, towards Industrial Applications: Motivations, Current State, and Challenges. Comput. Fluids 2016, 136, 11–34. [Google Scholar] [CrossRef]
- Aynsley, R.M. Shape and Flow: The Essence of Architectural Aerodynamics. Archit. Sci. Rev. 1999, 42, 69–74. [Google Scholar] [CrossRef]
- Liu, B.; Qu, J.; Zhang, W.; Tan, L.; Gao, Y. Numerical Evaluation of the Scale Problem on the Wind Flow of a Windbreak. Sci. Rep. 2014, 4, 6619. [Google Scholar] [CrossRef]
- Li, W.; Wang, F.; Bell, S. Simulating the Sheltering Effects of Windbreaks in Urban Outdoor Open Space. J. Wind. Eng. Ind. Aerodyn. 2007, 95, 533–549. [Google Scholar] [CrossRef]
- Obasaju, E.D.; Robins, A.G. Simulation of Pollution Dispersion Using Small Scale Physical Models—An Assessment of Scaling Options. In Urban Air Quality: Monitoring and Modelling: Proceedings of the First International Conference on Urban Air Quality: Monitoring and Modelling University of Hertfordshire, Hatfield, UK, 11–12 July 1996; Sokhi, R.S., Ed.; Springer: Dordrecht, The Netherlands, 1998; pp. 239–254. ISBN 978-94-011-5127-6. [Google Scholar]
- Yeh, C.-P.; Tsai, C.-H.; Yang, R.-J. An Investigation into the Sheltering Performance of Porous Windbreaks under Various Wind Directions. J. Wind. Eng. Ind. Aerodyn. 2010, 98, 520–532. [Google Scholar] [CrossRef]
- Guan, D.; Zhang, Y.; Zhu, T. A Wind-Tunnel Study of Windbreak Drag. Agric. For. Meteorol. 2003, 118, 75–84. [Google Scholar] [CrossRef]
- Liu, D.; Christe, D.; Shakibajahromi, B.; Knittel, C.; Castaneda, N.; Breen, D.; Dion, G.; Kontsos, A. On the Role of Material Architecture in the Mechanical Behavior of Knitted Textiles. Int. J. Solids Struct. 2017, 109, 101–111. [Google Scholar] [CrossRef]
- Francis, N.; Sparkes, B. 3-Knitted Textile Design. In Textile Design; Briggs-Goode, A., Townsend, K., Eds.; Woodhead Publishing Series in Textiles; Woodhead Publishing: Sawston, UK, 2011; pp. 55–87e. ISBN 978-1-84569-646-7. [Google Scholar]
Disclaimer/Publisher’s Note: The statements, opinions and data contained in all publications are solely those of the individual author(s) and contributor(s) and not of MDPI and/or the editor(s). MDPI and/or the editor(s) disclaim responsibility for any injury to people or property resulting from any ideas, methods, instructions or products referred to in the content. |
© 2022 by the authors. Licensee MDPI, Basel, Switzerland. This article is an open access article distributed under the terms and conditions of the Creative Commons Attribution (CC BY) license (https://creativecommons.org/licenses/by/4.0/).
