Abstract
Additive technologies in construction and architecture are becoming more and more popular. Due to their advantages, concrete extrusion technologies have great potential for the future. One of the important parameters is the quality and precision achieved in the entire building process. This study investigates the search for a methodology to verify the quality of three-dimensional (3D) printing from concrete mixtures not just as an indication of the resulting accuracy of the process but to monitor the behavior of the printed object in the period immediately after the printing for a period of 28 days. Research has confirmed, among other things, that one of the main causes of dimensional changes over time is shrinkage, which occurs primarily in the length and height directions of the object. The drying behavior of the material also depends on the thickness of the wall, with the thicker parts of the element shrinking more slowly than the thin and peripheral parts. The research also confirmed the hypothesis that digitization using 3D optical scanning could be used for complex three-dimensional analysis of the dimensional accuracy and dimensional stability of concrete elements produced by 3D printing. However, due to the surface structure of printed objects, specific inspection procedures need to be chosen, which are analyzed and described in this paper.
1. Introduction
Additive technologies in the construction industry have seen a huge increase in popularity over the past decade, mainly due to the ability to easily create complex geometric shapes, the need for few workers on site, the savings in materials, and the potential for low-cost construction in the future [1,2]. A number of research teams around the world are working on this issue, for example, the following projects: COBOD from Denmark [3]; Apis Cor from the USA [4]; Baumit BauMinator from Austria [5]; Betabram from Slovenia [6] or; FBR Ltd. from Australia [7]. Major international companies operating in the conventional construction sector, such as Sika, Lafarge, Strabag, Skanska, etc., have also started to invest in their own development in this area [8]. A number of projects, such as printed houses, bridges, and other architectural forms, have also been successfully applied worldwide [9,10]. However, it is also a fact that most load-bearing printed structures are not certified as safe for public use. An example, testing and the difficulty of such certification in the case of a bridge is described in [11].
Three-dimensional (3D) printing from concrete mixtures is, in most cases, realized by successive layering of individual layers of the printing cement mixture using a special print head placed on a positioning device [12,13,14].
Standard robots equipped with a special print head can be used for 3D printing in the construction industry. However, due to the size of the printed objects, it is more common to develop special printing equipment directly for the purpose of building construction [15,16]. Robotic devices for the purpose of printing cement mixtures are developed either in the form of Cartesian robots or in the form of specialized robotic arms of various configurations or completely different concepts, such as cable-driven parallel robot solutions [17]. The development of a variety of specialized devices then often require the deployment of advanced device design methods.
An important part of 3D printing projects in the construction industry is also the development of printing mixtures. Various studies have been carried out on the methodology of determining the printing parameters, testing these materials, and developing simulation models of the material behavior during depositing. A number of factors affect the quality and accuracy of the structures being deposited, such as the dimensions of the layer to be deposited, the speed of depositing, and the solidification rate of the material being deposited. From the point of view of the material to be deposited, it is essential that its mechanical strength is sufficient for the subsequent layers to be deposited. This aspect is discussed, for example, in studies [18,19]. In addition, other papers extend this issue to various modifications of the basic cementitious mixtures, including, e.g., fiber reinforcements [20,21] or the addition of styrene butadiene rubber (SBR) [22].
One of the criteria of the cement mixture that affects the accuracy of 3D printing is its time-dependent shrinkage during drying. It is mainly caused by the evaporation of internal water in the hardened concrete [23]. Due to the usually thin printed profiles and their large areas, there is a high risk of rapid drying and, thus, a risk of cracking of the printed object [24]. This phenomenon is also discussed in detail here [25].
However, based on the conducted research and our own experiments, the most important failure mechanisms in terms of 3D printing quality and accuracy are plastic collapse (strength mechanism), see Figure 1a, and for elastic buckling (stability mechanism), see Figure 1b [26].
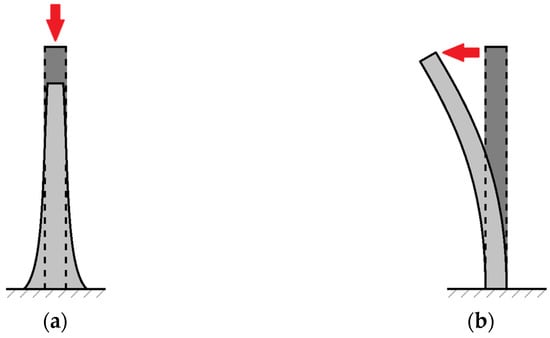
Figure 1.
Wall failure by (a) plastic collapse and (b) elastic buckling [26].
Manufacturing accuracy is an important part of the defining process capability, but there are not many such studies for 3D printing in the construction industry. An example can be studied by evaluating the geometric accuracy of printed sample parts after printing [27,28]. It is more common to evaluate print quality on-line already during the printing process by integrating various sensors to monitor important parameters of the entire 3D printing process [29,30,31]. The quality of the printed objects can thus be checked and, if necessary, feedback influenced.
The aim of this study is to find and validate a method to control the quality of the print not only as a resultant indication of the accuracy of the process but also to monitor the behavior over time with respect to the curing and hardening of the concrete mix. Due to the long curing time of the concrete, it is not possible to use the on-line method during the printing process. Conventional measurement of printed objects is problematic because of the typical structure of objects printed in layers. On such a structured object, it is problematic to repeatedly guarantee the measurement of the basic dimensions at the same locations. Furthermore, the results of such measurements do not give a complex view of the object’s shape changes during the concrete mix’s curing. For example, small local deflections, deformations, etc., cannot be captured.
Taking into account previous experience with the digitization of machine parts, it was decided to use an optical scanner for the repeated 3D scanning of the printed wall element. The method of 3D scanning of the shape of the wall segment can be used both to check the shape and its changes due to rheological changes during printing of the elements and to monitor the dimensional changes of the segment due to shrinkage of the cement composite during its solidification and hardening. This method also has the advantage of performing an overall analysis of the shape of the object and its changes. The above-mentioned structuring of the object, which can change over time, can be a problem. For example, it is questionable whether the results of comparing the scans over time with an ideal CAD model in the form of color maps will be informative for describing the global changes of the printed object or whether other methods of evaluation will have to be sought.
2. Materials and Methods
2.1. TestBed
Our team at the Technical University of Liberec is engaged in the research and development of a complete 3D printing process for cement mixtures for building construction. In the first stage of development, a three-axis printing robot with a Cartesian coordinate system was built together with its own printing head. The working area of this robot is 3500 × 1100 × 1300 mm (X, Y, Z). The maximum feed rate is 3 m/s on the X and Y axis and 2 m/s on the Z axis. Positioning repeatability is better than 0.3 mm in all axes. For more detailed parameters, see [32].
A program, StarSlicer, is also being developed for print preparation and print head path generation. In this program, all printed objects in STL format are opened and positioned, where the individual surfaces represent the central axes of the future printed walls. As a part of the preparation of a single print job, the print head paths are calculated, optimized, and visualized in individual sections in this program (see Figure 2a). The result is a generated NC program, which, after uploading it to the TestBed control system, is run for the actual implementation of the 3D printing (Figure 2b).
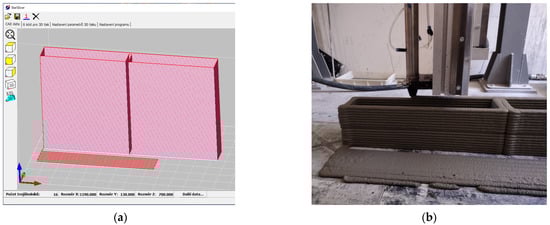
Figure 2.
(a) Preparing the print in the StarSlicer program; (b) 3D printing of the object on TestBed.
2.2. Wall Segment
In order to verify the properties of the printing compound and the printing quality control methodology itself, a wall segment was designed with the largest possible free surfaces without internal partitions, reinforcements, etc.
In this particular case, a rectangular wall element was printed with dimensions of 1190 × 130 × 700 mm (middle trajectory), with only a single reinforcing partition in the middle of the longest wall. For the actual printing, a 20 mm diameter nozzle head was used, the thickness of the layers was 10 mm, and the speed of the print head movement during the extrusion of the mixture was 120 mm/s. Due to the relatively high printing speed and the inertia of the extruder, the extrusion was not switched off during the stroke to the next layer, resulting in a noticeable overflow of material in the initial corner of the object.
A proprietary mixture based on cement with additional additives was developed as a construction material and is currently patent pending. For the purpose of continuous printing, it was necessary to accelerate the hardening of this mixture with an accelerator. This acceleration resulted in partial degradation of the mechanical properties. The reference material without the accelerator has a flexural tensile strength of 10.5 MPa (after 28 days), respectively up to 12.5 MPa (after 90 days), and a compressive strength of 59.0 MPa (after 28 days), respectively up to 70.5 MPa (after 90 days). The flexural tensile strength of the specimen with the accelerator is 6.3 MPa (after 28 days) or 8.5 MPa (after 90 days), and the compressive strength is 44.5 MPa (after 28 days) or 49.5 MPa (after 90 days). However, due to the acceleration of the hardening of this material, it was possible to print the aforementioned wall element for about 30 min continuously without the risk of its collapse.
2.3. Digitization and Inspection
A MetraScan 350 optical 3D scanner (Creaform, Lévis, QC, Canada) was used for digitizing the printed wall element. It is a two-camera non-contact system that uses an optical tracking unit—C-track—for positioning in 3D space. Thanks to it, it is possible to scan in an area of up to 16.6 m3 without the need to stick reference marks on the measured object. According to the manufacturer, the accuracy of the system over the entire working area is up to 0.12 mm.
For each new scan day, the entire system (C-track, scan head) was calibrated according to the manufacturer’s methodology and standards. This was followed by the digitization of the printed object (see Figure 3a). The VX Element software (Creaform, Canada) was used as the control software (see Figure 3b).
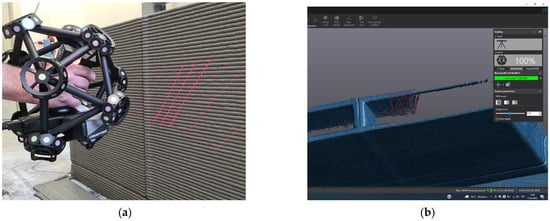
Figure 3.
(a) Wall element scanning with MetraScan; (b) scanning preview in SW VX Elements.
In this software, the parameters of the scanning process are set—e.g., the choice of exposure (camera shutter time) or scanning point density. A resolution of 1 mm was chosen for the wall element scan. This value proved to be an ideal compromise between the scanned details and the data requirements and speed of the whole scanning process during previous testing (in which resolutions in the range of 0.2 to 5 mm were tested). The scanning results in a large number of points describing the surface of the object (the so-called point cloud). From this, an optimized polygonal mesh (mesh model in STL format) is calculated after the digitization has been finished. The dimensional and shape control (inspection) of the printed elements was subsequently performed in the GOM Inspect Professional v2018 software (Zeiss, Braunschweig, Germany). Here, the model must first be aligned to the coordinate system—most often by registering to the nominal model or to a previous (reference) scan. Then the actual inspection is performed—in our case, color deviation maps were calculated, and length measurements in all three directions of the coordinate system were performed using two methods. A schematic representation of the different inspection steps is shown in Figure 4.
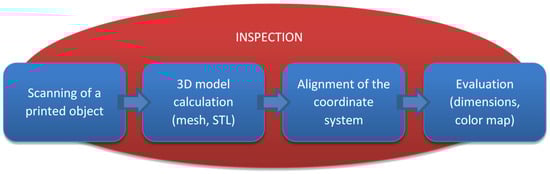
Figure 4.
Inspection stages using a 3D scanner.
In principle, the 3D model obtained by digitizing the printed object can be used either to check the accuracy of the 3D printing itself or to evaluate the deformation of the element over time (e.g., for the analysis of the shrinkage process, which is one of the main causes of possible cracks).
- (1)
- In the first case, i.e., when checking the accuracy of the 3D printing, the scanned model (Figure 5a) of the real object was compared with the nominal CAD model (Figure 5b). After aligning the two models to a common coordinate system (Figure 5c), such an analysis can result in both dimensional information and a comprehensive 3D output of dimensional deviations in the form of, for example, a color map or inspection section;
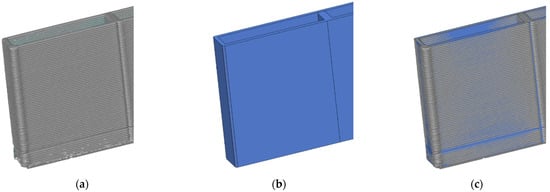 Figure 5. (a) Actual (scanned) model (mesh), (b) nominal model (CAD), (c) models aligned to a common coordinate system.
 - (2)
- The second option is to compare the scanned models with each other and determine the mutual deviations in time. In this way, it is possible, for example, to evaluate the deformation of the element immediately after printing or to measure the dimensional changes due to the shrinkage of the cement composite during its hardening.
In our analysis, we focused primarily on tracking the shape and dimensional deformations of the printed element over time. The segment was scanned immediately after the printing process was completed (referred to as time “0” or model “0”) and then repeated at 15 min, 1 day, 7 days, and 28 days after printing. Digitization at 1, 7, and 28 days was repeated twice to increase the reliability of the output data. It was technically not possible to repeat the scan at time “0” and 15 min, as the repeated scans would have been done at a different time (the time of one scan cycle took about 5–10 min). Thus, in addition to the nominal CAD model, there were a total of 8 actual models of the printed wall element.
In the GOM Inspect Professional software, all models were imported into one project as a so-called STAGE. This also allows, in addition to the comparison with the nominal CAD model, the comparison of the individual models against each other with the choice of which STAGE is the reference. In the case of the calculation of color deviation maps and dimensional changes, model “0” was chosen as the reference, i.e., the sample scanned immediately after printing.
Several methods were used for the evaluation:
- (A)
- Color maps of the deviations from the reference model “0” in each time state were calculated. The color maps allow a quick visual inspection and a comprehensive view of the deformations and dimensional changes in the color spectrum—they express the normal deviations from the reference model “0” (warm shades—positive deviation, cold shades—negative deviation). For the interpretation of the color deviation maps, the way the individual models are aligned within the coordinate system is important. In this case, the alignment to the YZX planes was chosen (3-2-1 method), with the symmetry plane chosen from the outer planes for the Y and X planes and the pad plane for the Z axis;
- (B)
- In all five time states, measurements of the three basic dimensions of the printed sample were taken in Figure 6a (length—X, width—Y, and height—Z). Since the walls are not straight, it was not possible to make direct measurements. For this reason, interleaved planes were first designed on each wall (see Figure 6b for Y direction). The Chebyshev best-fit (Outside) method was chosen for the construction of the fitted plane. In order to eliminate measurement inaccuracies, areas in the corners and peripheral areas of the specimen where there were overflows of the concrete mix were excluded from the selection of points for generating the planes (note: Chebyshev best-fit (Outside) method—the software calculates the maximum distance of the selected points or polygons to the fitting plane. The software designs the plane so that the maximum distance is the smallest. For the outer fit plane, the software enlarges the original fit element so that all points lie inside the outer fit element [33]);
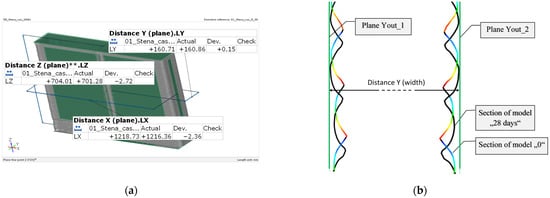 Figure 6. (a) Measurement of the dimensions of the wall element by the method of interlacing planes; (b) measurement of the dimensions between the fitting planes (Y direction).
 - (C)
- In order to investigate the deformation of the wall element in more detail and to capture local variations in addition to the changes in global dimensions, detailed measurements of the distance between opposite walls at several horizontal and vertical levels were made in addition to the above measurement of the lengths between planes. The measurements were made at each location using the “Caliper” function (see Figure 7). The method is based on the principle of a sliding scale, where two parallel touching disks touch the selected area from the outside. The software creates two touch points where the discs first touch the feature. As a result, it calculates the distance between the two touch points in a given direction [33]. For the measurements, the diameter of the disc was set to 30 mm (so that approximately three layers are affected).
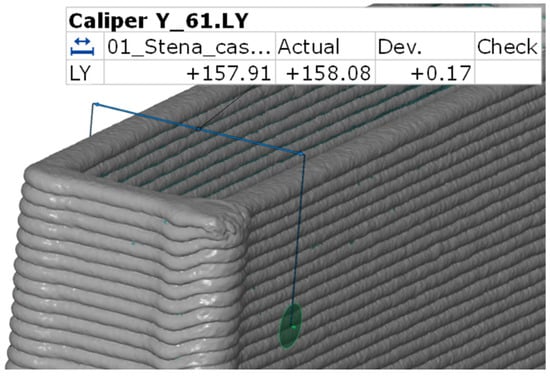 Figure 7. Local distance measurement with the “Caliper” function.
In the X-axis (length), the measurements were made in six height levels of 100 mm each (marked Xi: the index “i” indicates the height level), in the Y-axis (width) in the same six height levels, while in each level the measurements were made in six vertical sections with a spacing of 200, 600, 1000 mm from the sample axis (marked Yij: index “i” denotes the height level, index “j” the position of the vertical section), in the Z axis (height) the measurements were made in the same sections as in the Y axis, measuring both parallel walls separately (denoted Zkj: index “j” denotes the position of the vertical section, index “k” the first respectively the second wall). The method of marking can be seen in more detail in Figure 8. Therefore, measurements were made on 54 locations for 8 scans in total, so a total of 432 results. The data were finally statistically processed and evaluated.
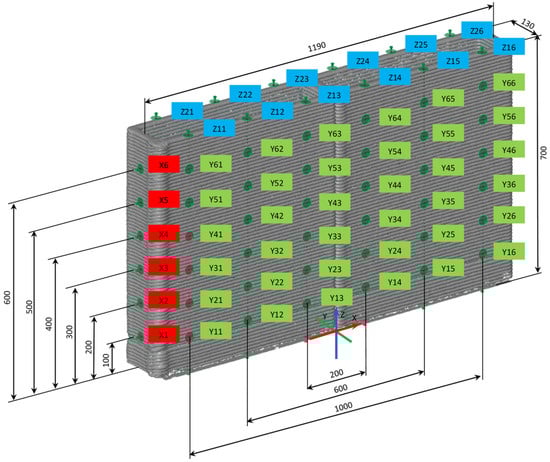
Figure 8.
Marking the positions of measuring the dimensions of the “Caliper” function.
3. Results
(1) Due to the consistency of the concrete mixture, the width of the printed footprint is usually not equal to the diameter of the nozzle used (it is usually wider). The size of this disproportion is determined by the parameters of the printing process itself (material extrusion speed, nozzle feed speed, layer height, etc.) but also by the speed of mix solidification (influenced by viscosity, accelerator quantity, etc.). For the analysis of the manufacturing accuracy, depending on the above-mentioned parameters, it is possible to determine in advance what the width of the printed track will be and to adapt the nominal CAD model for inspection according to these criteria. In our case, a CAD model with a wall thickness of 25 mm instead of 20 mm (as would be determined by the nozzle width) was used for the inspection. This value corresponds to the real average width of the printed footprint.
Figure 9 above shows the deviations from the nominal CAD model defined in this way in the form of a color map. The model (mesh) scanned 28 days after printing was used for the evaluation.
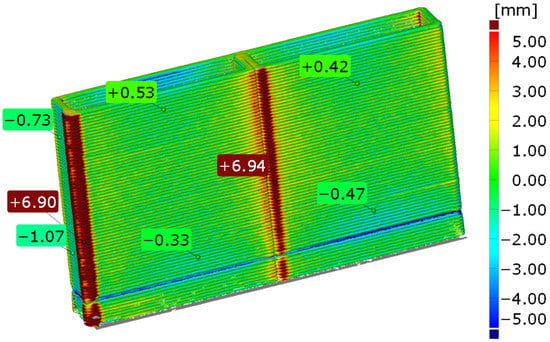
Figure 9.
Color map showing deviations between printed and nominal model (28-day scan).
It is clear from the results that the wall element on flat surfaces shows a good agreement with the required dimensions (deviations are up to 1 mm), which is quite satisfactory for a concrete element of this size. However, the inspection also shows a significant positive deviation at the point where the nozzle was displaced vertically into the next printed layer (left corner in Figure 9, bottom left corner in the section in Figure 10). By pausing the horizontal movement of the nozzle and not interrupting the concrete mixture extrusion during this time, more mixture than required was extruded at this exposed location, resulting in overflows. More significant deviations from the nominal shape also occur at other locations where sudden changes in the direction of movement of the print head (typically corners) occur. Due to inertia and the nature of the control of the printing device (deceleration of the feed at these points, machine limiting the maximum acceleration and jerk), an overflow of material (positive deviations from the nominal model) is particularly noticeable in the direction of movement (see the locations marked by red circles in Figure 10).
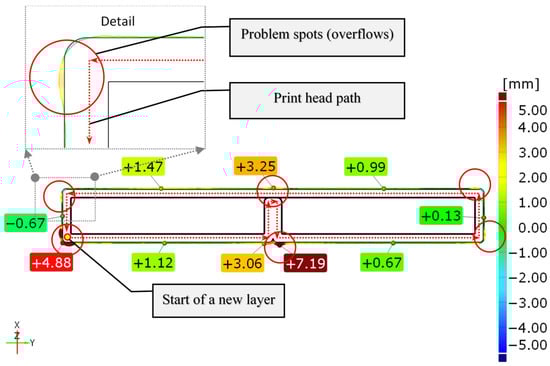
Figure 10.
Inspection section of the 35th layer (half-height) expressing the deviations between the printed and nominal model (28-day scan).
The analysis can also detect potential problems with the dosing of the material itself. Figure 9 shows the negative deviation in the ninth printing layer (blue color). Here, there was a problem with a short-term failure in the dosing of the print material mixture, and the process was inconsistent during this time.
(2A) The results of the analysis of the shape changes over time in the form of color maps are shown in Figure 11. All color maps express deviations from the reference model, i.e., the scan created immediately after the completion of the printing process (model “0”).
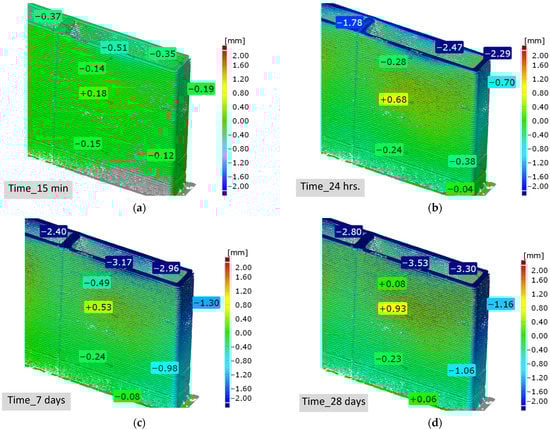
Figure 11.
Color map showing deviations from reference sample ‘0′ (a) after 15 min; (b) after 24 h; (c) after 7 days; (d) after 28 days.
From the analysis, it is evident at first glance that the printed part undergoes dimensional changes mainly in the direction of the length of the sample (X-axis) and its height (Z-axis). In the X direction, the deformation is mainly caused by the shrinkage of the material due to its drying and chemical changes. On the other hand, in the vertical direction, where a significant decrease is visible already in the first minutes and hours after printing, in addition to shrinkage (which takes place similarly to the X-axis in a longer time horizon), large initial dimensional changes must be attributed to other processes. These take place in material that has not yet hardened and are a combination of the action of gravity (settlement and creep due to the action of weight, especially in the plastic state), shrinkage from drying, and autogenous shrinkage. The initial decrease of the upper layers in the Z axis is also influenced by possible deformations and buckling of the wall (Y direction) in the fresh state. The drying process of the material also depends on the thickness of the wall, with bulkier parts of the element shrinking more slowly than thin and edge parts. This may be one of the reasons why the 2 × 20 mm reinforcement shrinks in the vertical direction more slowly (−1.78 mm) than the thin walls (−2.47 mm and −2.29 mm) (see Figure 11, time 24 h).
(2B) The average dimensional changes in the three monitored axes, which are based on the measurement of the interlaced plane distances, are shown in Figure 12a (absolute dimensional changes in mm) and in Figure 12b (relative changes in % with respect to the measured length).
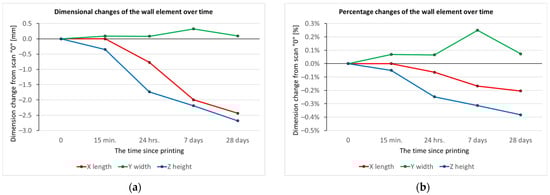
Figure 12.
Dimensional changes of a wall element over time (based on measurements of plane distances): (a) absolute; (b) percentage.
This method of measurement also confirms the trends from the previous analysis. After 24 h, the lengthwise direction of the sample was shortened by approximately 0.75 mm, and the height of the sample decreased by approximately 2 mm. After 28 days, when the required strength should be reached, the total dimensional change in the X-axis was around 2.5 mm (roughly −0.2%); in the Z-axis, almost 3 mm (roughly 0.4%). In the direction of the width of the sample, i.e., the Y direction, the wall element, except for local deformations and buckling, did not significantly change dimensionally over time. It is interesting to note the parallelism of the curves for the X and Z axis in Figure 12b at the time from 24 h to 28 days. This trend shows that after 24 h, there is almost no subsidence due to gravity, and the sample is so stiff that both the longitudinal and vertical directions are almost exclusively shrinkage, which takes on the same magnitude.
(2C) The local measurement of deformations of the Caliper function brought more than four hundred dimensional data items, divided into individual axes and times. These were statistically processed, and the summary results are presented in the following graphs. Figure 13 shows the shrinkage results in the X-axis direction measured at six height levels.
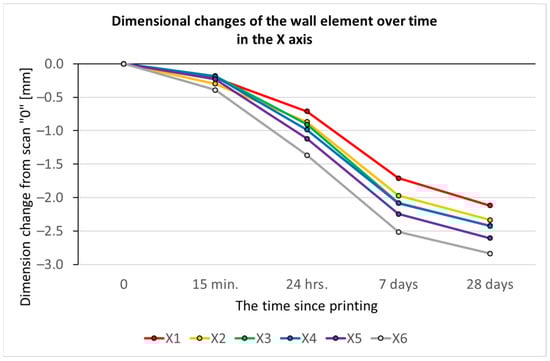
Figure 13.
Dimensional changes of the wall element over time in the X-axis (based on local Caliper measurements).
From this detailed measurement, it is clear that the lower layers (X1,2) show less shrinkage than the upper layers (X5,X6). After 28 days, the difference between the first layer (100 mm above the pad) and the sixth measured layer (600 mm above the pad) is 0.72 mm. Since 90% of this difference was achieved in the first 24 h (0.66 mm difference), this effect may be due to faster drying in the upper layers of the print but also to adhesion of the lower layers to the substrate.
Figure 14 shows the deformations for the vertical direction—Z-axis. The graph shows the top layer drop (change in element height) in six sections along the X-axis. The graph is shown for the back wall measurements (without ribs). The results of the front wall brought comparable values.
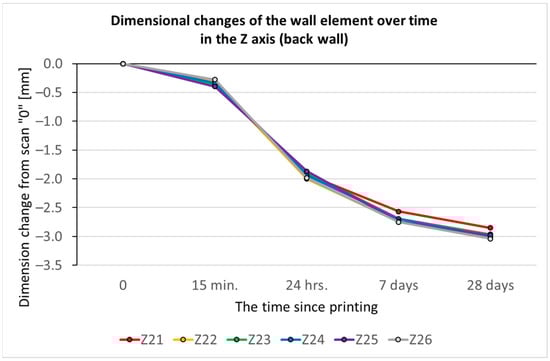
Figure 14.
Dimensional changes of the wall element over time in the Z-axis (based on local Caliper measurements).
The trend of the change in the height of the element fully corresponds to the measurements made using the plane in Figure 12a and also confirms that there is uniform deformation at all points of the wall. The only exception is the reinforcement location where two footprints touch. Here the drop is a few tenths of mm less (clearly visible from the color maps in Figure 11). This disparity in the rate of deformation occurred between the 15 min and 24 h time points. This is likely due to slower drying due to the greater (twice as much) wall thickness at this location. The thicker parts of the element shrink more slowly than the thin and marginal parts.
The last two graphs express the width measurements of the element in the Y-axis direction. The measurement in this direction is the most complicated and also the most difficult to predict. In the length and height direction of the object, we measured the deformation of the centerline of the wall (which is mainly due to different types of material shrinkage). However, in the thickness direction of the element, we measured the distance between two thin walls, which is more significantly affected by the overall spatial deformation of the object. This is influenced by many variables, such as the shape of the printed object, the thickness of the walls, the print quality, and the solidification rate of the mixture, etc.
Figure 15 shows the results for each vertical section, with the values averaged across all height levels of each section. The analysis yields interesting findings. In sections Yi2 and Yi4, which are located in the middle of the wall (between the edge and the central brace), the deformations are the largest and most positive compared to the outermost sections. Moreover, most of this deformation occurred in the first minutes after printing. This could confirm the assumption that it is primarily a spatial deformation of the element due to the bulging of the immature mixture at that moment.
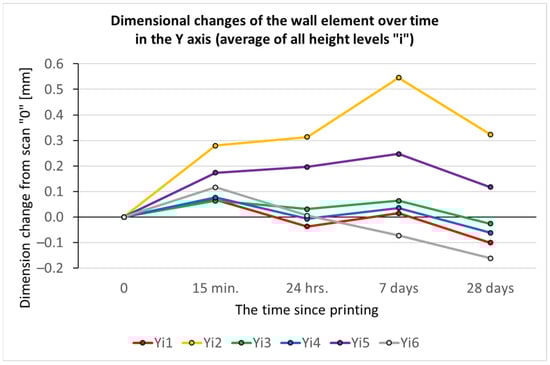
Figure 15.
Dimensional changes of the wall element over time in the Y-axis in individual vertical sections (based on local Caliper measurements).
Figure 16 shows the results for each height level, averaging the values across all vertical sections for each level. The sequence of strain magnitude versus measurement height is very similar to the results for the X-axis (Figure 13), but the trend (direction) of the strain is quite the opposite. While in the X-axis, the shrinkage increased with increasing distance from the substrate (i.e., the distance of the opposite walls was smaller), in the Y-axis, the dimensional changes with the height from the substrate increased in a positive sense (the sample thickness was larger). The explanation is a different mechanism involved in the shape change. As already mentioned, in the X-axis direction, where we measured the change in the length of the long wall centerline, the primary cause was shrinkage. In the Y-axis, however, we measured the distance between the two thin walls and hence its spatial deformation. In this particular case, there is an outward deformation (bulging) in the upper layers, and thus there is an increasing error compared to the lower layers, which are partially held by the support and are not as susceptible to buckling due to the smaller number of layers. Unfortunately, unlike length shrinkage, these shape changes are not well predictable at this time (software is being developed to simulate these processes), and so it is not known in advance whether this deformation will occur, how large it will be, and in exactly what direction (outward, inward).
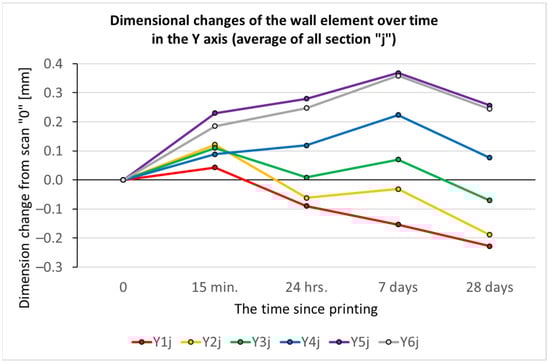
Figure 16.
Dimensional changes of the wall element over time in the Y-axis at each height level (based on local Caliper measurements).
To illustrate the complexity of the Y-axis shape behavior of the wall element, we present a numerical representation (Figure 17) with the values of the deviations detected within the whole measurement matrix (in all sections and levels) by the Caliper function for the time 28 days after printing. Even from this detailed data, the behavior described above is evident, in particular, more uniform and smaller deviations in the lower layers and larger (in this particular case positive) deviations in the upper layers, especially in sections Yi2 and Yi5, which are furthest from the center reinforcement or from the perpendicular side walls.
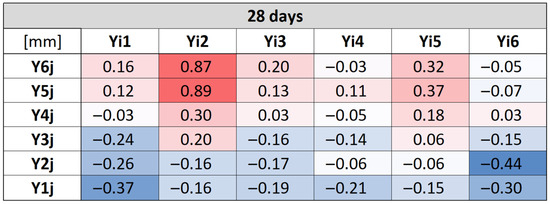
Figure 17.
Dimensional changes in the Y-axis of the wall element in the matrix (height level, vertical section) over 28 days (based on local measurements with Caliper functions).
4. Discussion
For a quick analysis of the shape match, it is usually used to compare the scanned element with, e.g., CAD data or a scan of a reference element, where the evaluation in the form of color deviation maps provides a quick overview of the shape accuracy of the part. For an object printed from concrete, there are quite large dimensional changes, which can be several mm/m, as shown here. Due to the characteristic structure of the printed wall element, there is a displacement due to deformations over time and, thus, a partial overlap of the individual printed layers. Therefore, the color maps are not entirely revealing, especially when comparing individual scans with each other, and it is difficult to accurately analyze the dimensional changes over time.
The second evaluation method consisted of interlacing the outer planes to the individual surfaces of all scans. This method provides quick results and a comprehensive view of the overall dimensional changes of the feature over time. However, it only affects the average dimensional values in a given direction and cannot determine local shape changes within the element under study.
The third proposed method, in which the printed element was measured locally at defined locations using the Caliper function, proved to be the most appropriate. By evaluating the thickness in the form of distance measurements using parallel planar surfaces of defined size, this function proved to be the best for evaluating and analyzing in detail the dimensional and shape changes for such structured elements. The method also provides accurate and detailed information on the object’s behavior. A significant advantage of this method is the possibility to change the size of the measuring disk and the raster density of the control points as needed according to the object properties and other requirements.
Research has confirmed, among other things, that one of the main causes of dimensional changes over time is shrinkage, which occurs mainly in the length and height directions of the object. There are several causes of shrinkage, but the two most important are drying of the material and chemical changes. The drying behavior of the material has also been shown to depend on the thickness of the wall, with the bulkier parts of the element shrinking more slowly than the thin and peripheral parts. This uneven shrinkage may then cause secondary deformation in the direction perpendicular to the centerline (axis) of the wall. In this direction, shape changes are generally the most difficult to predict since the distance between two thin walls is measured, which is more affected by the overall spatial deformation of the object. Different wall behavior has been confirmed in the research at rib-reinforced and rib-free locations. Therefore, in further analyses, it will be appropriate to consider and assess the density of the reinforcing ribs, which essentially eliminates the wall deformation problem in the perpendicular direction. These deformations can, in extreme cases, lead to the collapse of the printed object.
5. Conclusions
The technology of 3D printing from concrete using computer-controlled machines has been developed for more than 10 years. Many houses and other building structures have already been printed around the world. However, there is still not much work available that assesses the accuracy of printed concrete elements or the changing dimensions of building elements over time with respect to concrete curing.
Therefore, in the presented work, the dimensional accuracy of the printed concrete object was analyzed, and its dimensional changes were mainly studied over a period of 28 days, from printing to mix curing. Concrete shrinkage during drying is a natural phenomenon and was experimentally determined to be 1–2 mm/m for the given concrete mixture. However, in addition to the shrinkage itself, various deformations of the printed objects also occur during the application of thin-wall 3D printing technologies. Therefore, a comprehensive analysis and evaluation of the dimensional changes were necessary. For this purpose, the method of optical digitization of the printed wall element using an optical non-contact 3D scanner was used, which has been successfully used for many years, e.g., in the mechanical engineering industry. However, due to the specific surface structure of the printed object, it was necessary to search for a suitable way of evaluating the results (see Figure 18).
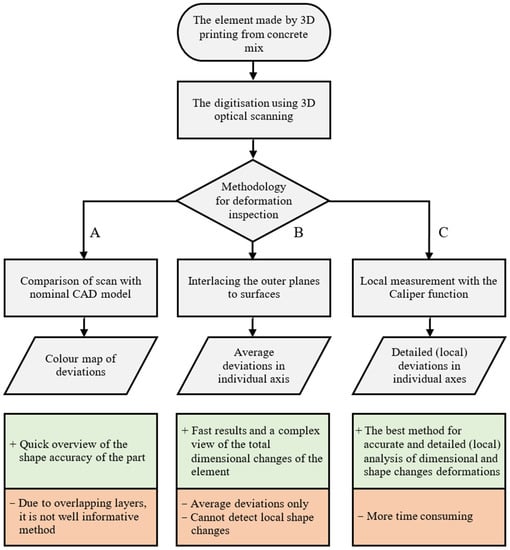
Figure 18.
Flow chart of research into a suitable inspection methodology of an element produced by 3D printing from a concrete mix.
The above research has shown that 3D optical scanning digitization can be advantageously used for complex three-dimensional analysis of the dimensional accuracy and dimensional stability of concrete elements produced by 3D printing. However, specific inspection procedures have to be chosen, and color deviation maps used mainly in engineering are not very suitable (accurate) due to the coarse structure and only provide a quick insight into the shape behavior of the printed object. On the other hand, the dimensional analysis of measurements using the Caliper function seems to be very accurate, although it is more time-consuming.
The subject of further research will be to perform more detailed analyses on a larger group of samples of other shapes and also to extend the time horizon of the monitoring to a minimum of three months. It is also planned to search for the exact mechanisms of the sample behavior and the dependence on the parameters of the printing process, the material used, or the geometry of the printed object itself. This ongoing research should lead to the development of software to predict the shrinkage processes and the shape behavior of printed objects using computer numerical simulation.
Author Contributions
Conceptualization, R.M. and P.K.; methodology, R.M.; validation, R.M.; formal analysis, R.M. and P.K.; resources, P.K.; data curation, R.M.; writing—original draft preparation, R.M. and P.K.; writing—review and editing, R.M. and P.K.; visualization, R.M. and P.K. All authors have read and agreed to the published version of the manuscript.
Funding
The research presented in this paper was supported by the European Structural and Investment Funds of the Operational Programme Research, Development and Education within the project “3D Print in civil engineering and architecture—3D STAR” reg. number CZ.02.1.01/0.0/0.0/16_025/0007424.
Data Availability Statement
The data presented in this study are available on request from the corresponding author.
Conflicts of Interest
The authors declare no conflict of interest.
References
- Zhang, Y.; Zhang, Y.; Liu, G.; Yang, Y.; Wu, M.; Pang, B. Fresh Properties of a Novel 3D Printing Concrete Ink. Constr. Build. Mater. 2018, 174, 263–271. [Google Scholar] [CrossRef]
- Paul, S.C.; van Zijl, G.P.A.G.; Tan, M.J.; Gibson, I. A Review of 3D Concrete Printing Systems and Materials Properties: Current Status and Future Research Prospects. Rapid Prototyp. J. 2018, 24, 784–798. [Google Scholar] [CrossRef]
- Cobod International A/S Cobod. Available online: https://cobod.com (accessed on 25 October 2022).
- Apis Cor 2021 Apis Cor. Available online: https://www.apis-cor.com/ (accessed on 21 July 2021).
- Baumit 2021 Baumit BauMinator®|Baumit.At. Available online: https://baumit.at/bauminator?PageSpeed=noscript (accessed on 21 July 2021).
- BetAbram 2021 Betabram.™—Absolutely Simple, Fascinating and Magical to Use. Available online: https://betabram.com/ (accessed on 21 July 2021).
- FBR Ltd. FBR|Industrial Automation Technology. Available online: https://www.fbr.com.au/ (accessed on 21 July 2021).
- Partnerskabet 3D Printet Byggeri. 3D Printet Byggeri—Afslutningsrapport Februar 2018. Technical Report. 2018. Available online: http://3dprintetbyggeri.dk/pdf/Afslutningsrapport.pdf (accessed on 1 December 2022).
- Bos, F.; Wolfs, R.; Ahmed, Z.; Salet, T. Additive Manufacturing of Concrete in Construction: Potentials and Challenges of 3D Concrete Printing. Virtual Phys. Prototyp. 2016, 11, 209–225. [Google Scholar] [CrossRef]
- Buswell, R.A.; Leal de Silva, W.R.; Jones, S.Z.; Dirrenberger, J. 3D Printing Using Concrete Extrusion: A Roadmap for Research. Cem. Concr. Res. 2018, 112, 37–49. [Google Scholar] [CrossRef]
- Salet, T.A.M.; Ahmed, Z.Y.; Bos, F.P.; Laagland, H.L.M. Design of a 3D Printed Concrete Bridge by Testing. Virtual Phys. Prototyp. 2018, 13, 222–236. [Google Scholar] [CrossRef]
- Craveiro, F.; Nazarian, S.; Bartolo, H.; Bartolo, P.J.; Pinto Duarte, J. An Automated System for 3D Printing Functionally Graded Concrete-Based Materials. Addit. Manuf. 2020, 33, 101146. [Google Scholar] [CrossRef]
- Khoshnevis, B. Toward Total Automation of On-Site Construction—An Integrated Approach Based on Contour Crafting. In Proceedings of the ISARC, Eindhoven, The Netherlands, 24 September 2003. [Google Scholar]
- Panda, B.; Noor Mohamed, N.A.; Paul, S.C.; Bhagath Singh, G.; Tan, M.J.; Šavija, B. The Effect of Material Fresh Properties and Process Parameters on Buildability and Interlayer Adhesion of 3D Printed Concrete. Materials 2019, 12, 2149. [Google Scholar] [CrossRef]
- Guamán-Rivera, R.; Martínez-Rocamora, A.; García-Alvarado, R.; Muñoz-Sanguinetti, C.; González-Böhme, L.F.; Auat-Cheein, F. Recent Developments and Challenges of 3D-Printed Construction: A Review of Research Fronts. Buildings 2022, 12, 229. [Google Scholar] [CrossRef]
- Rehman, A.U.; Kim, J.-H. 3D Concrete Printing: A Systematic Review of Rheology, Mix Designs, Mechanical, Microstructural, and Durability Characteristics. Materials 2021, 14, 3800. [Google Scholar] [CrossRef]
- Tho, T.P.; Thinh, N.T. Using a Cable-Driven Parallel Robot with Applications in 3D Concrete Printing. Appl. Sci. 2021, 11, 563. [Google Scholar] [CrossRef]
- Perrot, A.; Rangeard, D.; Pierre, A. Structural Built-up of Cement-Based Materials Used for 3D-Printing Extrusion Techniques. Mater. Struct. 2016, 49, 1213–1220. [Google Scholar] [CrossRef]
- Roussel, N. Rheological Requirements for Printable Concretes. Cem. Concr. Res. 2018, 112, 76–85. [Google Scholar] [CrossRef]
- Shakor, P.; Nejadi, S.; Paul, G. A Study into the Effect of Different Nozzles Shapes and Fibre-Reinforcement in 3D Printed Mortar. Materials 2019, 12, 1708. [Google Scholar] [CrossRef]
- Le, T.T.; Austin, S.A.; Lim, S.; Buswell, R.A.; Law, R.; Gibb, A.G.F.; Thorpe, T. Hardened Properties of High-Performance Printing Concrete. Cem. Concr. Res. 2012, 42, 558–566. [Google Scholar] [CrossRef]
- Kim, K.K.; Yeon, J.; Lee, H.J.; Yeon, J.H. Dimensional Stability of SBR-Modified Cementitious Mixtures for Use in 3D Additive Construction. Appl. Sci. 2019, 9, 3386. [Google Scholar] [CrossRef]
- Kim, G.; Kim, J.-Y.; Kurtis, K.E.; Jacobs, L.J. Drying Shrinkage in Concrete Assessed by Nonlinear Ultrasound. Cem. Concr. Res. 2017, 92, 16–20. [Google Scholar] [CrossRef]
- Zhang, Y.; Zhang, Y.; Yang, L.; Liu, G.; Chen, Y.; Yu, S.; Du, H. Hardened Properties and Durability of Large-Scale 3D Printed Cement-Based Materials. Mater. Struct. 2021, 54, 45. [Google Scholar] [CrossRef]
- Moelich, G.M.; Kruger, J.; Combrinck, R. Plastic Shrinkage Cracking in 3D Printed Concrete. Compos. B Eng. 2020, 200, 108313. [Google Scholar] [CrossRef]
- Wolfs, R.J.M.; Suiker, A.S.J. Structural Failure during Extrusion-Based 3D Printing Processes. Int. J. Adv. Manuf. Technol. 2019, 104, 565–584. [Google Scholar] [CrossRef]
- Xu, J.; Buswell, R.A.; Kinnell, P.; Biro, I.; Hodgson, J.; Konstantinidis, N.; Ding, L. Inspecting Manufacturing Precision of 3D Printed Concrete Parts Based on Geometric Dimensioning and Tolerancing. Autom. Constr. 2020, 117, 103233. [Google Scholar] [CrossRef]
- Buswell, R.; Xu, J.; De Becker, D.; Dobrzanski, J.; Provis, J.; Kolawole, J.T.; Kinnell, P. Geometric Quality Assurance for 3D Concrete Printing and Hybrid Construction Manufacturing Using a Standardised Test Part for Benchmarking Capability. Cem. Concr. Res. 2022, 156, 106773. [Google Scholar] [CrossRef]
- Wolfs, R.J.M.; Bos, F.P.; van Strien, E.C.F.; Salet, T.A.M. A Real-Time Height Measurement and Feedback System for 3D Concrete Printing. In High Tech Concrete: Where Technology and Engineering Meet; Hordijk, D.A., Luković, M., Eds.; Springer International Publishing: Cham, Switzerland, 2018; pp. 2474–2483. ISBN 978-3-319-59470-5. [Google Scholar]
- Shojaei Barjuei, E.; Courteille, E.; Rangeard, D.; Marie, F.; Perrot, A. Real-Time Vision-Based Control of Industrial Manipulators for Layer-Width Setting in Concrete 3D Printing Applications. Adv. Ind. Manuf. Eng. 2022, 5, 100094. [Google Scholar] [CrossRef]
- Kazemian, A.; Yuan, X.; Davtalab, O.; Khoshnevis, B. Computer Vision for Real-Time Extrusion Quality Monitoring and Control in Robotic Construction. Autom. Constr. 2019, 101, 92–98. [Google Scholar] [CrossRef]
- Vojir, M.; Myslivec, T.; Petr, T.; Brousek, J.; Beran, L.; Diblik, M.; Keller, P.; Kajzr, D.; Vozenilek, R. A new way to design software for industrial automation–3D printer cement mixtures. MMSJ MM Sci. J. 2021, 2021, 4223–4229. [Google Scholar] [CrossRef]
- GOM, mbH GOM Inspect Professional 2018 (Direct Help). Available online: https://www.gom.com/ (accessed on 15 December 2022).


Disclaimer/Publisher’s Note: The statements, opinions and data contained in all publications are solely those of the individual author(s) and contributor(s) and not of MDPI and/or the editor(s). MDPI and/or the editor(s) disclaim responsibility for any injury to people or property resulting from any ideas, methods, instructions or products referred to in the content. |
© 2023 by the authors. Licensee MDPI, Basel, Switzerland. This article is an open access article distributed under the terms and conditions of the Creative Commons Attribution (CC BY) license (https://creativecommons.org/licenses/by/4.0/).