Article

Initial Shape Analysis and Experimental Study of Air-Supported Membrane Structure Considering Cable–Membrane Contact

College of Architecture and Civil Engineering, Beijing University of Technology, Beijing 100124, China
*
Author to whom correspondence should be addressed.
Buildings 2023, 13(1), 184; https://doi.org/10.3390/buildings13010184
Submission received: 10 December 2022 / Revised: 3 January 2023 / Accepted: 6 January 2023 / Published: 10 January 2023
(This article belongs to the Section Building Structures)

Abstract

:
The cable net and membrane of the air-supported membrane structure transmits the load through mutual extrusion, and the contact interaction between the cable net and membrane should be considered in the initial morphological analysis stage. In this paper, a scale model was designed according to a large-span air-supported membrane structure engineering project, and the shape and force of the structure were measured. At the same time, a finite element model of cable–membrane contact was established, and its interaction behavior was regarded as a combined contact state and sliding contact state. The results show that the influence of different contact state analyses on the prestress of the cable net is obvious, and the influence of the sliding contact between the cable and the membrane should be considered in the design of the membrane structure.

Graphical Abstract

1. Introduction

An air-supported membrane structure is a type of building shell using high-performance membrane material. In order to create a structure with a certain stable shape and bearing capacity, tension is created on the membrane surface due to the air pressure differential within and outside the membrane [1]. For long-span permanent construction, an air-supported membrane structure reinforced by a cable net is appropriate. This design has been used most often in recent years in environmental protection areas such as contaminated soil covers and closed coal yard repair projects. At the same time, with the improvement of material performance and environmental protection requirements, the number of air-supported membrane structures, the unit area and span are all increasing year by year [2,3,4]. Figure 1 shows the air-supported membrane structure of a closed coal yard with the largest span at present. Its size is 225 m in length, 198 m in width and 66 m in height.
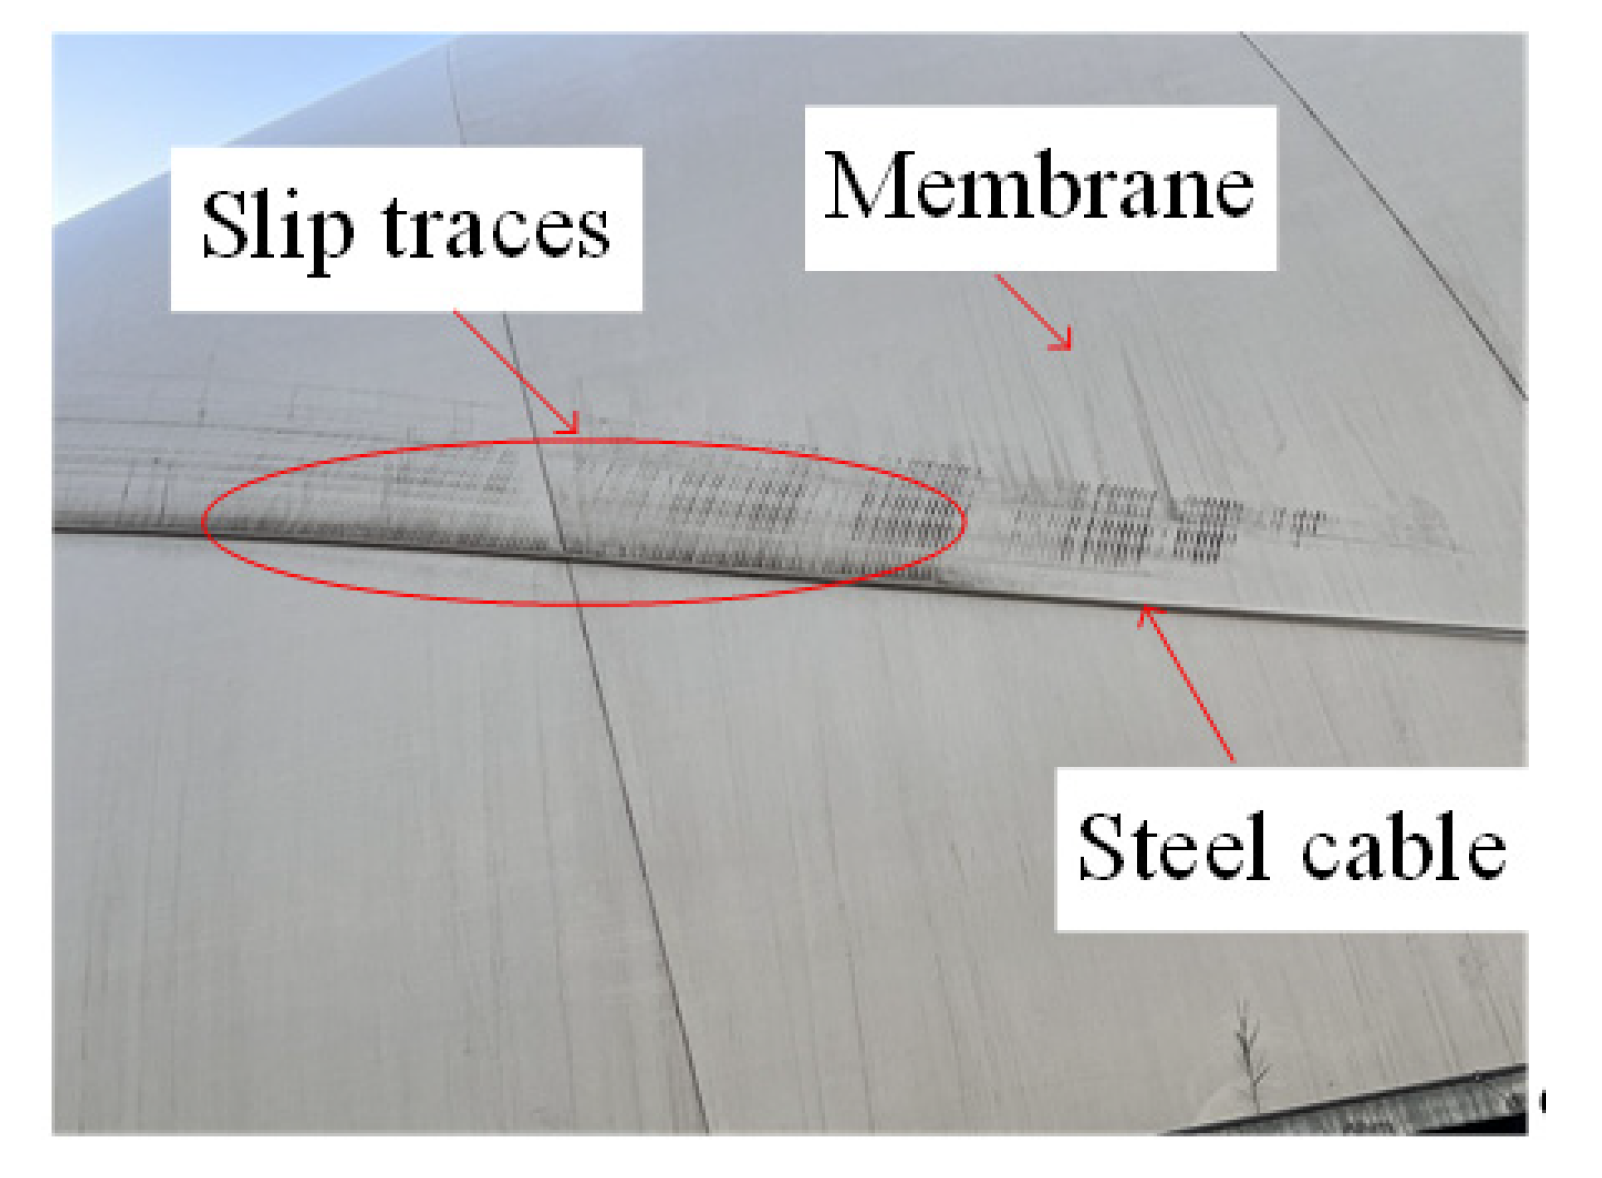
The air-supported membrane structure for the majority of engineering applications necessitates the installation of oblique orthogonal cable nets on the membrane surface. It efficiently reduces the stress and displacement of the membrane surface by resisting external stresses alongside the membrane surface [5]. The majority of the current research on air-supported membrane structures is attempting to simplify the model of the connection between the cable and membrane according to the common node mode since the structure has a significant geometric nonlinearity, so as to carry out simulation analysis [6,7,8,9,10]. However, in fact, the cable–membrane structure transmits force by contacting and squeezing each other. Since the air-supported membrane structure is a typical flexible structure, the structure will undergo relatively large deformation during the forming stage and the loading stage. Frictional slippage tends to occur between the membrane surface and the cable net (as shown in Figure 2), and the cable membrane will even separate under the action of pressure [8,9,10].
Recently, some scholars have proposed the analysis of an air-supported membrane structure considering cable–membrane contact., but there are few related studies. Matsumura et al. [11] were the first to study the cable sliding over the membrane surface by adding a “bending element”. Using this method, the cable unit will intrude into the interior of the membrane unit during sliding; however, this is not what happens to an actual structure and also does not take into account the friction between the cable and membrane. To account for the effect of friction, Lshii et al. [12] inserted a spring between the cable and membrane, but it is challenging to determine how the stiffness of the spring relates to the friction force. The above studies highlight the effectiveness of the proposed method without analyzing the effect on the mechanical properties of the structure. Song Chang-yong [13] used ABAQUS to analyze the sliding between cable and membrane as a contact problem and introduced the friction coefficient to consider the influence of friction sliding. Form-finding analysis and load analysis considering the sliding contact of the cable and membrane were completed for the tensioned membrane structure, but the number of cable–membrane structures in the sample was small, which was not universal. F. Ju [14] used the multi-polyline element to analyze the problem of the cable element passing through multiple contact points at the same time and took the cable slippage at the contact point as the new unknown quantity of the contact point displacement vector. The number of displacement-solving equations is supplemented by the force transfer relationship, and the calculation problem of cable slip is solved, but it cannot be applied to an actual structure without considering the slip of the cable on the membrane surface. Hirohisa [15] used the meshless method to analyze the sliding of the cable on the membrane surface and proposed that the combination of the arbitrary Lagrange multiplier method and the penalty function method should be applied to the traditional EFG method. The modified method was applied to the sliding analysis of the cable on the membrane surface, but only the effectiveness of the new method was emphasized, and there is no analysis of the structure. Yanli He et al. [16] used ANSYS software to consider the frictional slip between cables and membranes of air-supported membrane structures as a contact problem. By introducing the slow dynamic method to analyze the wind load response of an actual engineering project, the problem of the influence of the cable–membrane contact on the wind-induced response of the air-supported membrane structure is effectively solved, but this method lacks the verification of experimental data.
Xiongyan Li et al. [6] carried out the initial shape test of the air-supported membrane structure through the geometric scale test of an actual project (Figure 1). The superiority of the state-finding analysis in the initial shape finite element analysis was verified. The research model adopts longitudinal and lateral cable-net forms. The layout and force characteristics of this cable net form are relatively simple, and it is suitable for air-supported membrane structures with small spans. However, the large-span air-supported membrane structure needs to be reinforced by a cable net in the form of an obliquely intersecting grid. The influence of the friction force between the cable net and the membrane surface needs to be considered in the structural analysis.
In this paper, ANSYS software is used to analyze the state of the air-supported membrane structure considering the cable–membrane contact. A sliding contact model considering cable–membrane friction-slip and a binding contact model not considering cable–membrane friction-slip are established to analyze the initial shape of the cable–membrane air-supported membrane structure. Using the model basis in the literature [6], an experimental model of a cable net in the form of a diagonally crossed grid was established, and the shape of the membrane surface and the tension of the cable net were measured. The experimental results were compared with different contact models, and the influence of cable–membrane sliding contact on structural analysis was studied.

2. Establishment of Contact Model

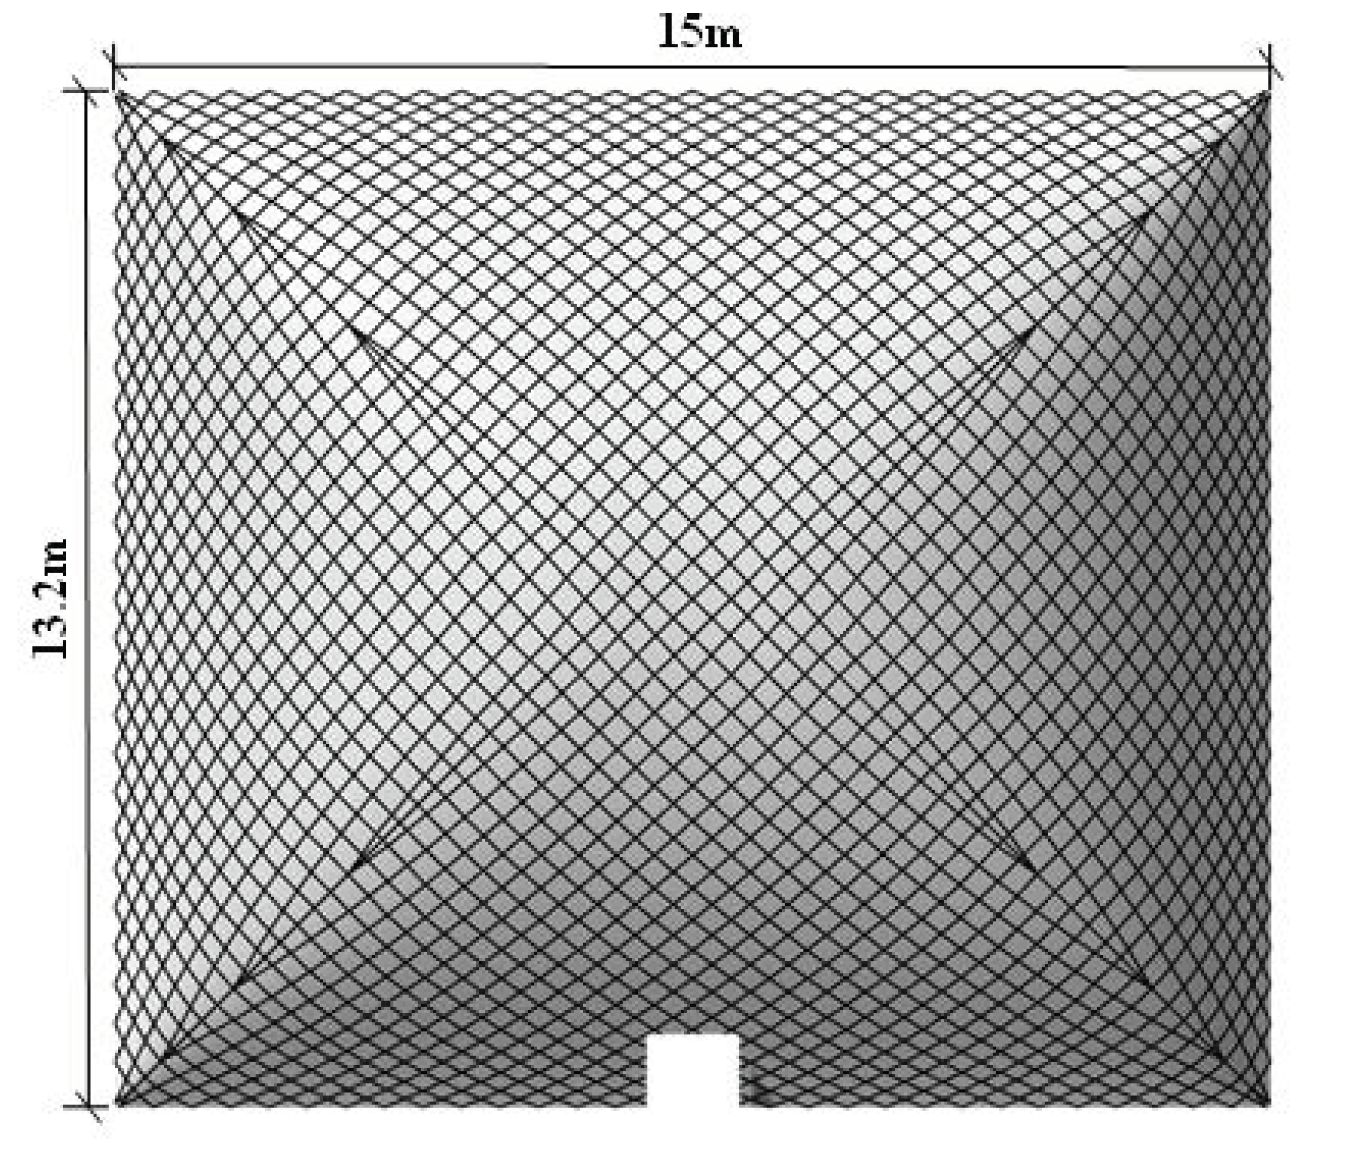
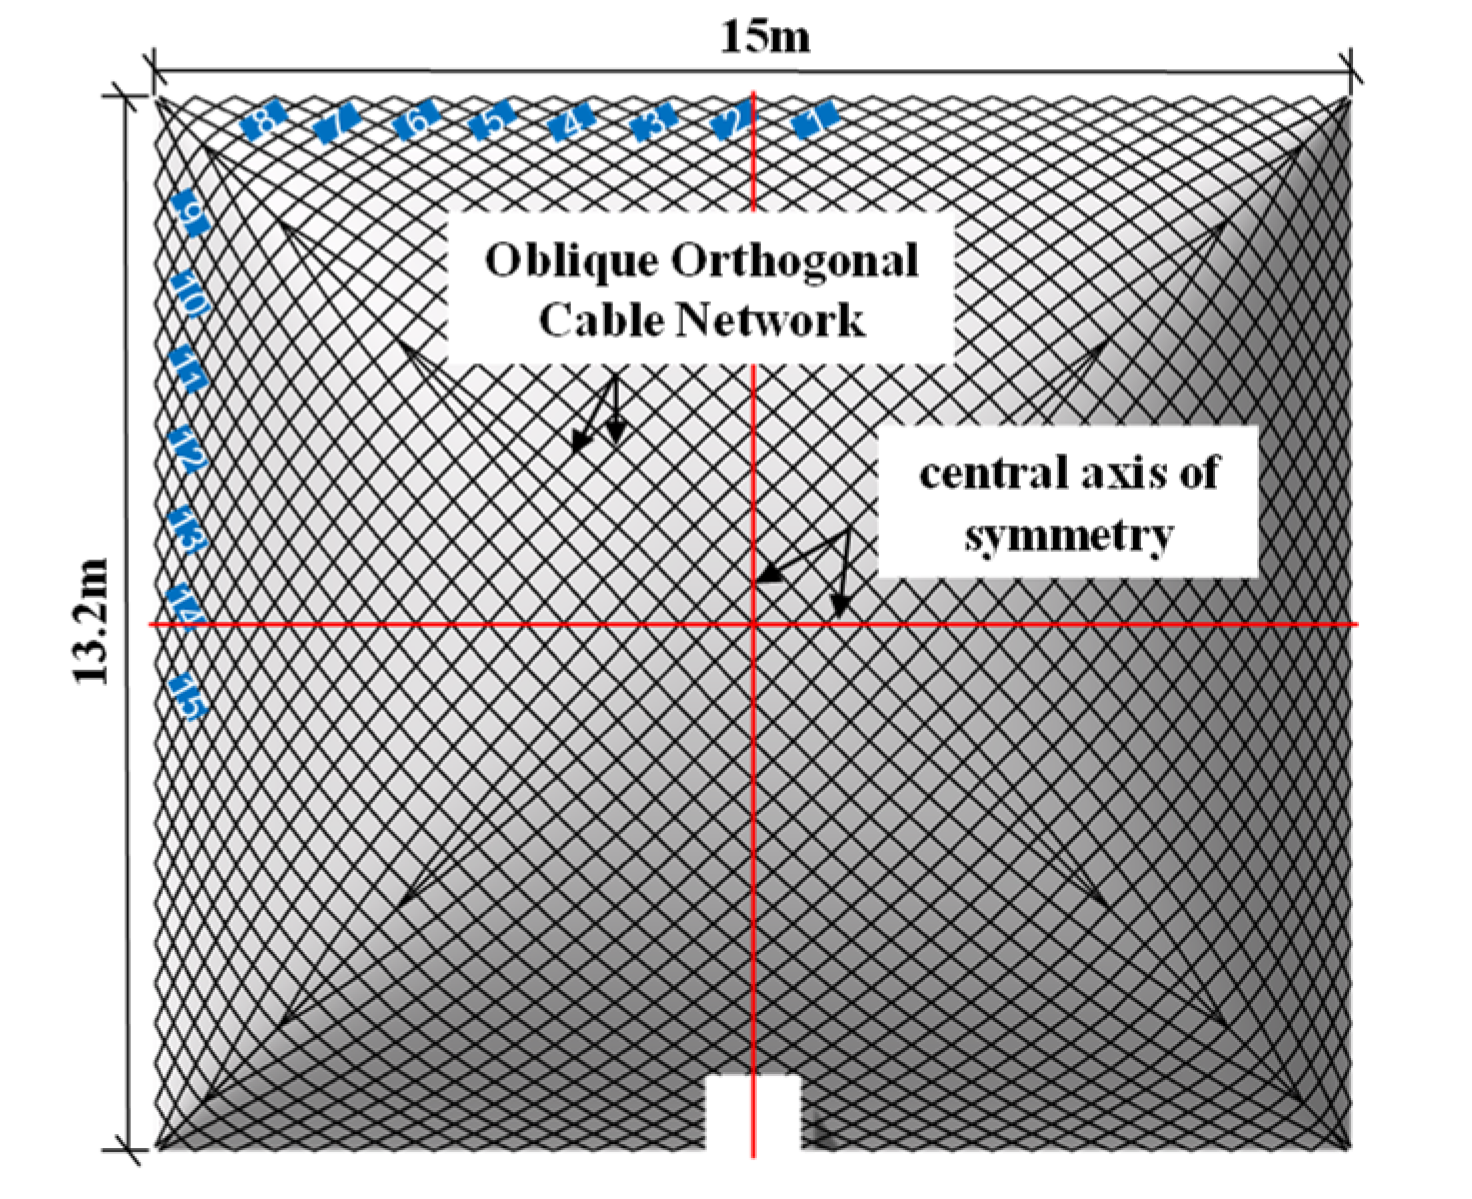
Based on the actual project, this paper conducted geometric scaling at 1:15, and determined the size of the model to be 15 m × 13.2 m × 4.4 m. A 3D model was created in Rhino software to form a smooth, wrinkle-free surface. At the same time, an oblique orthogonal cable network with a spacing of 0.5 m was established (Figure 3).

2.1. Point-Surface Contact Pair

The model was imported into ANSYS software to conduct initial morphological analysis of the air-supported membrane structure stiffened by cable nets by means of point-to-surface contact. The membrane surface was discretized into three-node SHELL41 elements, and through the cloth option, the element was set to be in tension only and ignored the bending stiffness of the membrane. The cables were discrete into LINK10 units that could only be pulled. The sliding between the cable net and the membrane surface was simulated using the standard contact mode. The membrane element was covered with the target surface (defined by the TARGE170 element). The cable net was broken up into several cable segments, and a contact surface (defined by the CONTA175 element) was superimposed on the cable element at the nodes where all of the cable segments crossed. The target and contact surfaces formed point–surface contact pairs by sharing real constant numbers (Figure 4). It is worth noting that contact was only made when the outer normal direction of the target element pointed towards the contact element [17].

2.2. Contact State

All nodes on the contact surface may touch at any point on the target surface. There are three contact states between the cable and membrane, namely, binding contact, slip contact and separation, which correspond to different contact boundary coordination conditions. Binding contact binds the target surface and the contact surface along the normal and tangential directions of the contact surface without relative motion. Sliding contact means that there is relative movement between the contact points along the tangential direction of the contact surface, but there is no relative movement along the normal direction of the contact surface. Separation means that the parts that were in contact are out of contact with the deformation of the object, and there is no boundary coordination condition [18,19,20].
Figure 5 shows a schematic diagram of the coordination conditions for the local contact deformation of the cable–membrane. Intrusion occurs between the target surface and the contact surface during the finite element iterative calculation process (Figure 5a shows the intrusion of the contact surface node P after (j) iterations). At this time, it should be modified to meet the coordination conditions.
For bound contact, the contacted point O of the target surface should move to O(j + 1) together with point P of the contact surface. Figure 5b shows the boundary shape after j + 1 iterations satisfy the displacement coordination. At this point, the geometric relationship of the contact boundary in the x-direction is as follows (the y-direction is similar):
d j + 1 ( j ) = n x T ( u M ( j ) u N ( j ) )
ϕ = ( n x d j + 1 ( j ) ) T ( u O ( j ) u N ( j ) ) = ( n r d j + 1 ( j ) ) T ( u P ( j ) g P ( j ) u N ( j ) )
where n: the unit vector of the local coordinates of the contact element; the subscripts x, y, z: the local coordinates of the contact boundary element along the tangential and normal directions; g P : the intrusion vector at the node P of the contact surface. ϕ is the relative position of the actual contact point O on the boundary of the target contact surface on the boundary contact element. In the case of bound contact, the relative position ϕ of the actual contact point O in the element MN at j iterations is the same as at j + 1 iterations, and its constraint is g P = u p u O .
For slip contact, the relative position of the actual contact point O in the element MN changes. The coordinates of the contact point O and the contact point P along the normal direction should be the same; there is relative motion along the tangent direction, and its constraint is n j + 1 T g P = n j + 1 T ( u p u O ) .

2.3. Contact Algorithm

In this paper, the extended LaGrange algorithm is used. It combines the pure Lagrangian multiplier method and the penalty function method and satisfies the contact coordination; its governing equation is as follows: [21,22,23]
[ K + K p G T G 0 ] { U λ } = { F F p g 0 ( U ) }
where K p is the contact stiffness of the contact element; λ is the introduced Lagrange multiplier (its physical meaning is the contact stress of the contact pair); F p is the contact force (including the contact pressure and friction). When the contact state is bound contact, the contact mechanics on the target surface are consistent with the displacement degrees of freedom. When the contact state is slip state, a contact point has only one unknown contact force.
Contact forces include contact pressure and friction. The contact pressure is shown in Equation (4):
P = { 0             while u n > 0 K n u n + λ i + 1 while u n 0
λ i + 1 = { λ i + K n u n   while | u n | > ε λ i                 while | u n | < ε
where K n is the normal contact stiffness; u n is the size of the contact gap; ε is the intrusion tolerance; λ i is the component of the Lagrangian multiplier in the ith iteration, which is calculated for each iteration unit.
The friction force adopts Coulomb’s law, and it is assumed that the coefficient of kinetic friction and the coefficient of static friction are equal. The calculation formula is shown in Equation (6):
τ = { K S u ,       while τ = τ y 2 + τ z 2 μ P < 0 ( b i n d ) μ K n u n ,   while τ = τ y 2 + τ z 2 μ P < 0 ( s l i d e )
where K s is the rigidity of tangential contact; u is the contact sliding distance; μ is the friction coefficient.

2.4. Numerical Method

The contact problem is a typical highly nonlinear problem, and the air-supported membrane structure itself has obvious geometric nonlinearity. The number of cable nets in this model is relatively large, and the number of contact pairs between the discrete cable nets and the membrane surface also increases accordingly. At this point, the static solution method will lead to difficulty in convergence. In this paper, a slow dynamic method and its solution strategy for nonlinear contact analysis based on implicit finite element method are introduced [24]. The so-called slow dynamic is to directly open the time integration effect after defining the transient dynamic analysis. By applying all dead loads and virtual large damping, and then adopting a certain analysis time, the dynamic reaction of the structure under load will steadily lose its impact until it is stable. At this point, the contact balance equation is shown in Equation (7) below:
M i U 1 ( t ) + C 1 U 1 ( t ) + K i U ( t ) = P i + R i ( t ) M 2 U 2 ( t ) + C 2 U 2 ( t ) + K 2 U ( t ) = P 2 + R 2 ( t ) }
where K i is the overall stiffness matrix of the i object (i = 1, 2); P i is the overall external load vector of the i object; R i is the contact force vector of the i object including the normal contact force and friction force; U i is the node of the i object displacement vector. M i and C i are the overall mass matrix and damping matrix of the i object (i = 1, 2); U i ( t ) , U i ( t ) and U ( t ) are the node acceleration vector, node velocity vector and node displacement vector of the i object.

3. Numerical Simulation

3.1. Model Simplification

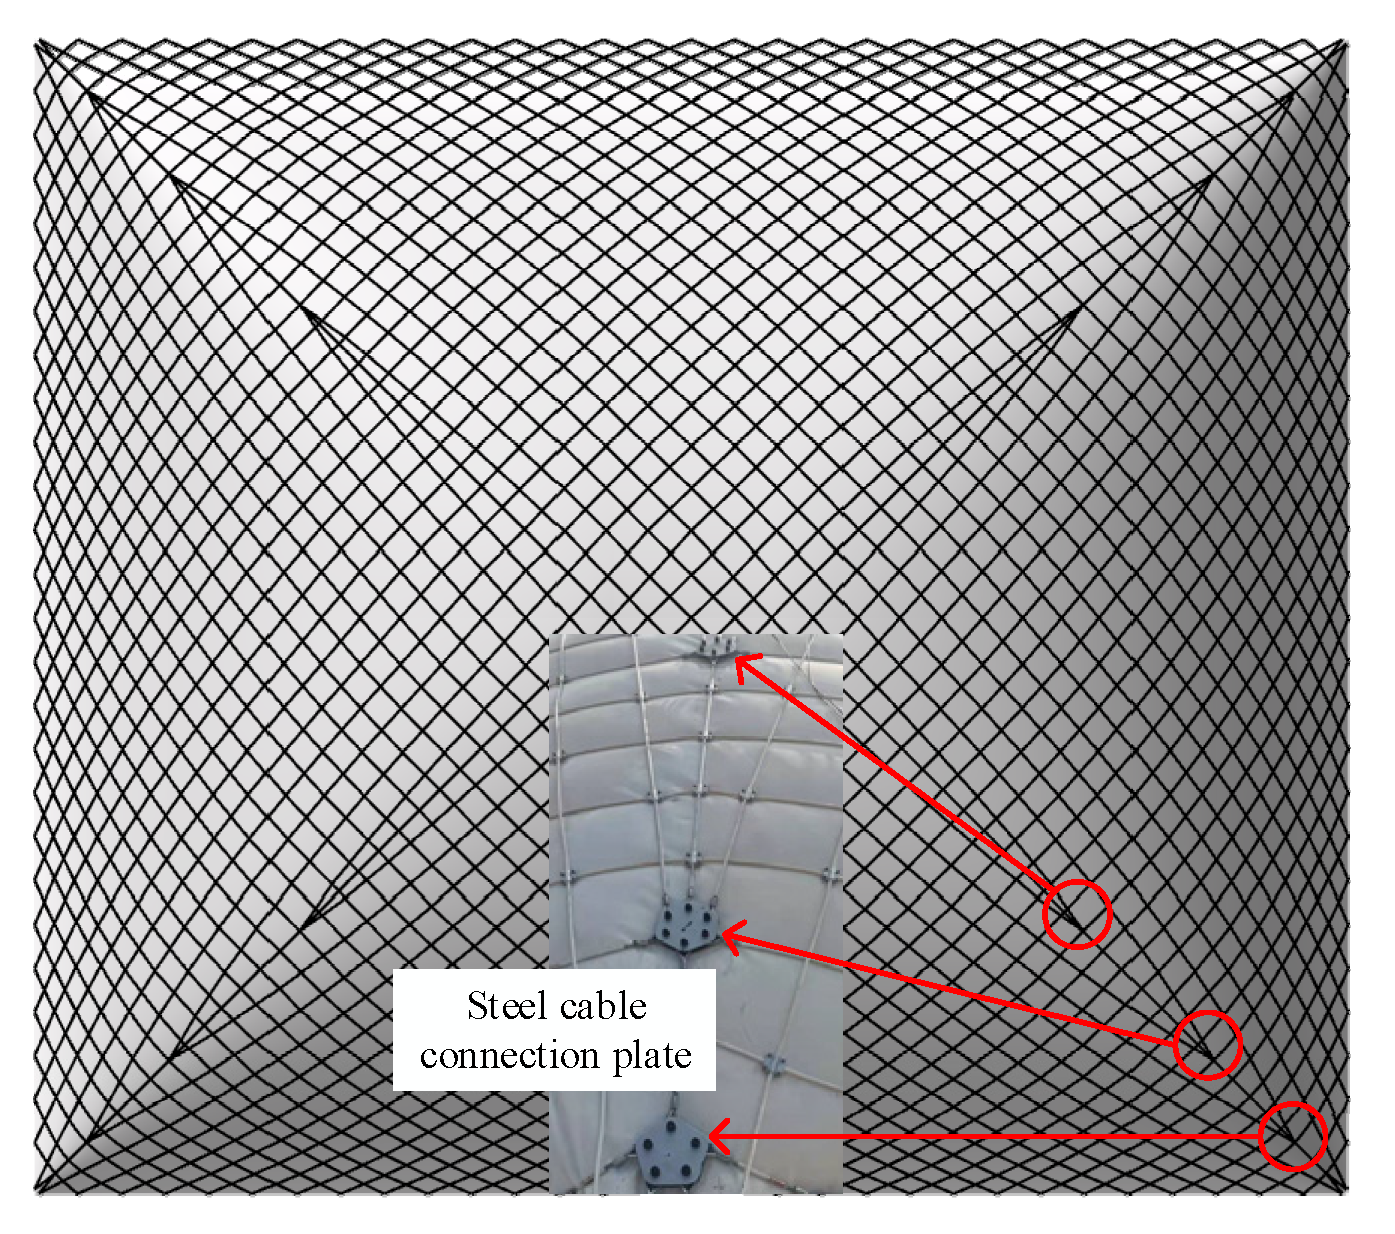
In the actual project, to ensure the stable position of the steel cables, aluminum alloy buckles were equipped with the intersections of the steel cables. The function of the aluminum alloy buckle in the construction is represented as a common node in the digital-analog simulation, where the intersection of the cable net is discrete. In the actual project, the intersection of more than three cables on the ridge is fixed by a steel cable connection plate (Figure 6). When performing finite element calculation, it is difficult to converge the model only by co-node processing at this part. In order to facilitate convergence, the ridge cable network of the test model was simplified during the establishment of the finite element model (Figure 7). The cable fixed by the connection plate was extended and fixed on the foundation. The number of cable nets in the simplified model remains unchanged, and measurement points were not arranged in this part during subsequent test verification.

3.2. Parameter Setting

The elastic modulus of the membrane element is e1 = 1.5 × 10⁸ N/m2; Poisson’s ratio ν1 = 0.25; the thickness is 0.04 mm; the material density ρ1 = 1200 Kg/m3. The elastic modulus of the cable element is e2 = 1.9 × 10¹¹ N/m2; Poisson’s ratio ν2 = 0.3; the cross-sectional area is 5.024 × 10⁻³ m2. Li Jingzhong et al. [25] obtained the friction coefficient between the cable and different membrane materials through experiments, and the recommended value of the membrane material coefficient between the membrane material and the cable is between 0.25 and 0.4. In this paper, the friction coefficient between the cable and membrane was taken as 0.4, and the initial shape analysis of the air-supported membrane structure of the diagonal cable net was carried out under the two conditions of cable–membrane binding contact and cable–membrane sliding contact. The normal working internal pressure was 400 Pa.

3.3. Analysis of Simulation Results

Figure 8 is the velocity contour and acceleration contour of the sliding contact analysis solved by the slow dynamic method. The structure’s velocity and acceleration are shown to steadily diminish until they ultimately reach zero as analysis time and the influence of virtual damping rise. The calculation results are close to the static solution results.
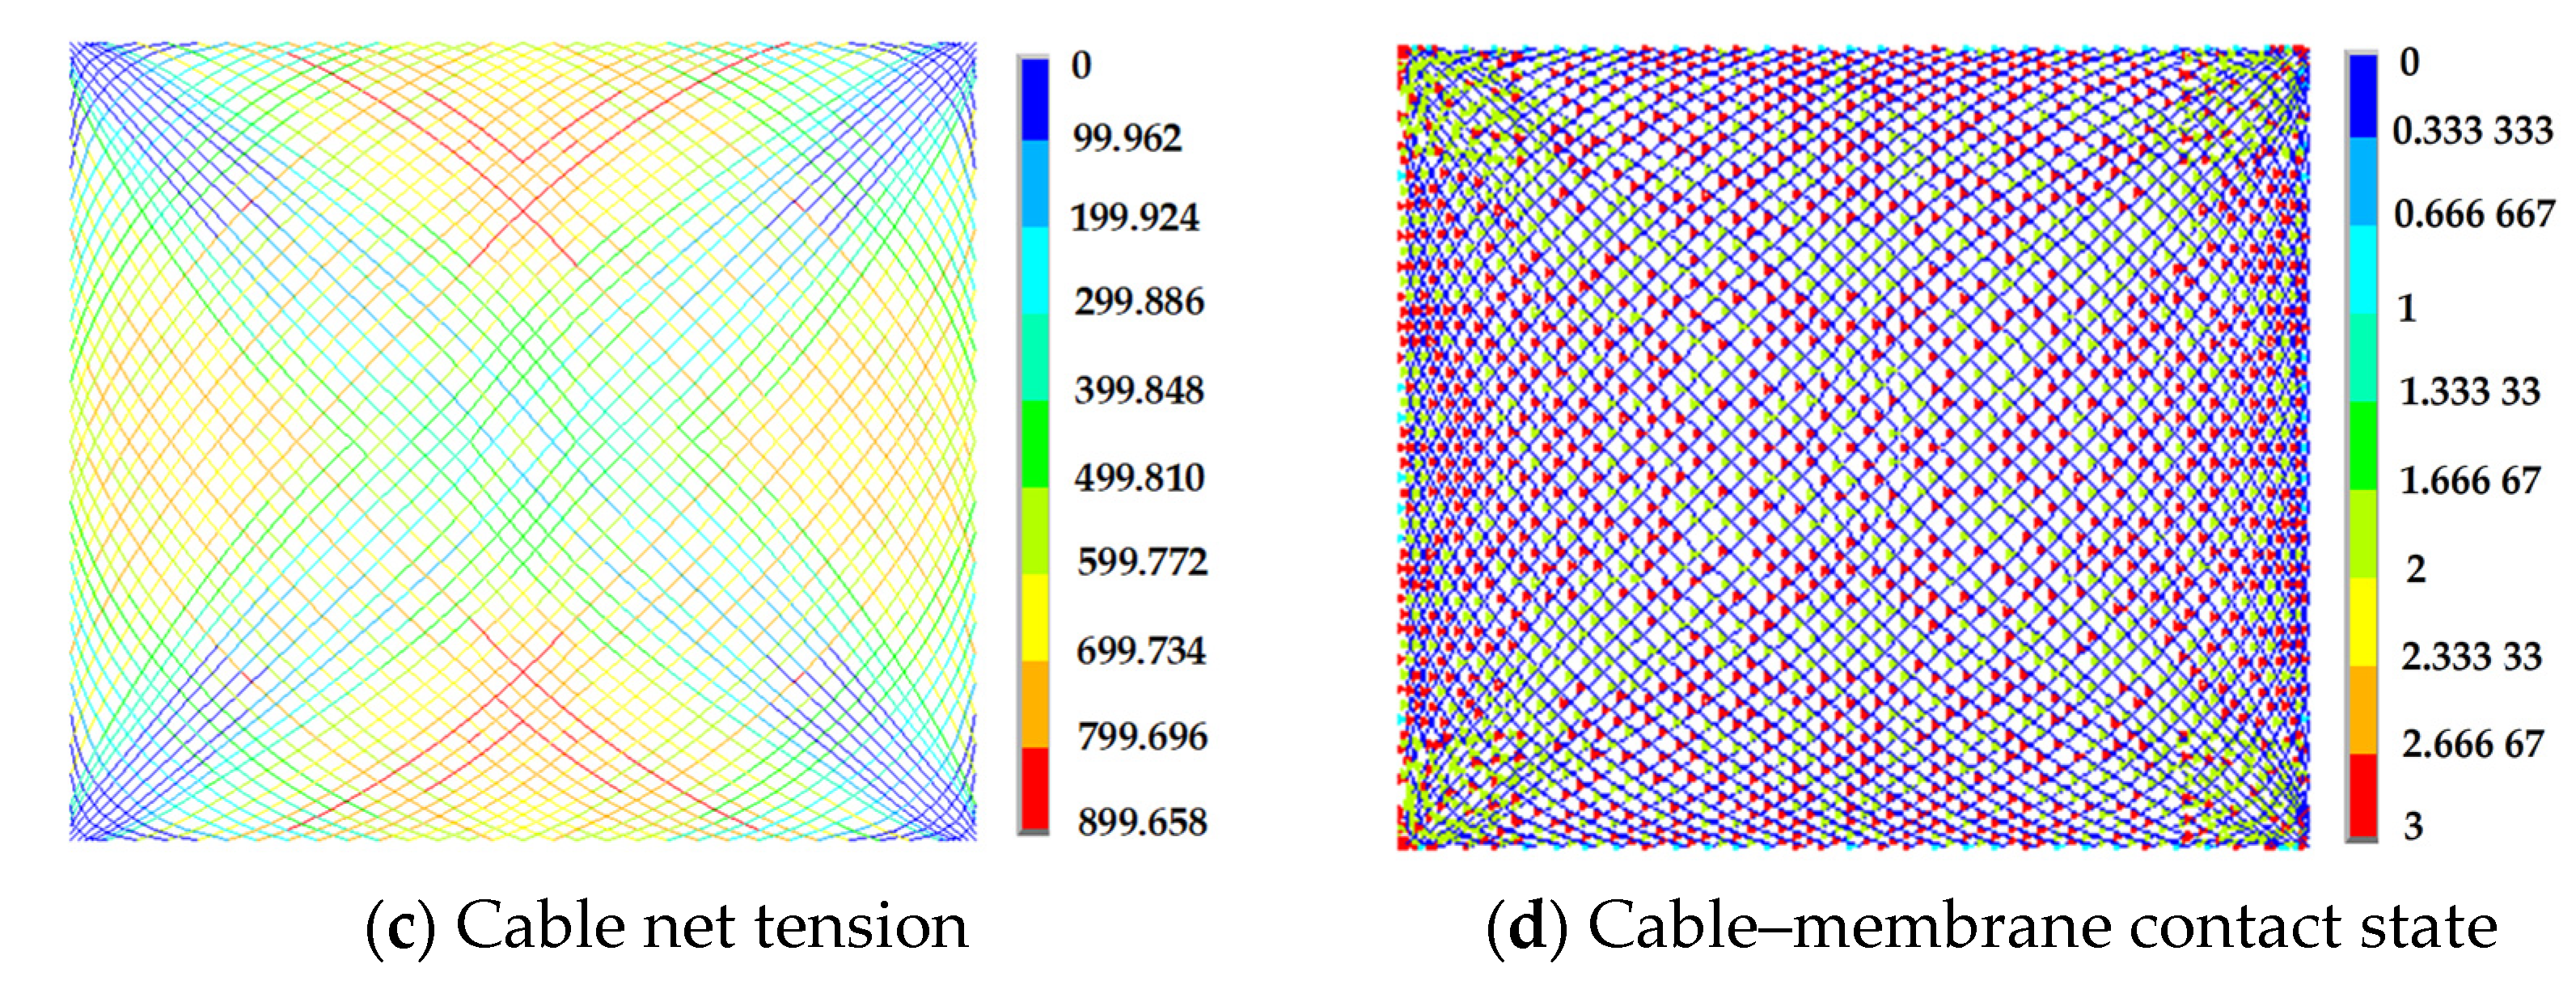
Figure 9 and Figure 10 show the membrane surface displacement, membrane surface stress, cable net tension and contact state cloud diagram between the cable and membrane, taking into account various contact circumstances in the starting state of the model at 400 Pa internal pressure. In the cloud diagram of the contact state between the cable and membrane, the color in the 0–1 interval indicates that the cable–membrane contact state is a separation state, the 1–2 interval indicates that the cable–membrane contact state is a sliding state, and the 2–3 interval indicates that the cable–membrane contact state is a bound state.
According to the calculation results, it can be obtained that when the air-supported membrane structure is in the initial state, the cable nets in the sliding contact analysis and the binding contact analysis are less stressed at the corners and tops of the structure, and the membrane surface stress is relatively large at this position. The difference between the membrane surface displacement of the cable–membrane sliding contact analysis and the membrane surface displacement of the binding contact analysis is very small. The difference of the maximum stress of the membrane surface of the two contact analyses is also very small. However, the minimum stress of the membrane surface of the binding contact analysis is smaller than that of the sliding contact analysis, and it is clear that the membrane surface stress distribution in the binding contact study is more uneven. The tension of the cable net in the binding contact is greater than that in the sliding contact. The distribution of the tensile force of the binding contact cable net is uneven compared with that of the sliding contact cable net, and the phenomenon of stress concentration is prone to occur. From the cloud diagram of the contact state between the cable and membrane, when considering the cable–membrane sliding contact analysis, 49% and 49% of the cable–membrane contact elements are in the bound state and the sliding state, and very few are in the separated state.

4. Experimental Verification

4.1. Model Design and Installation

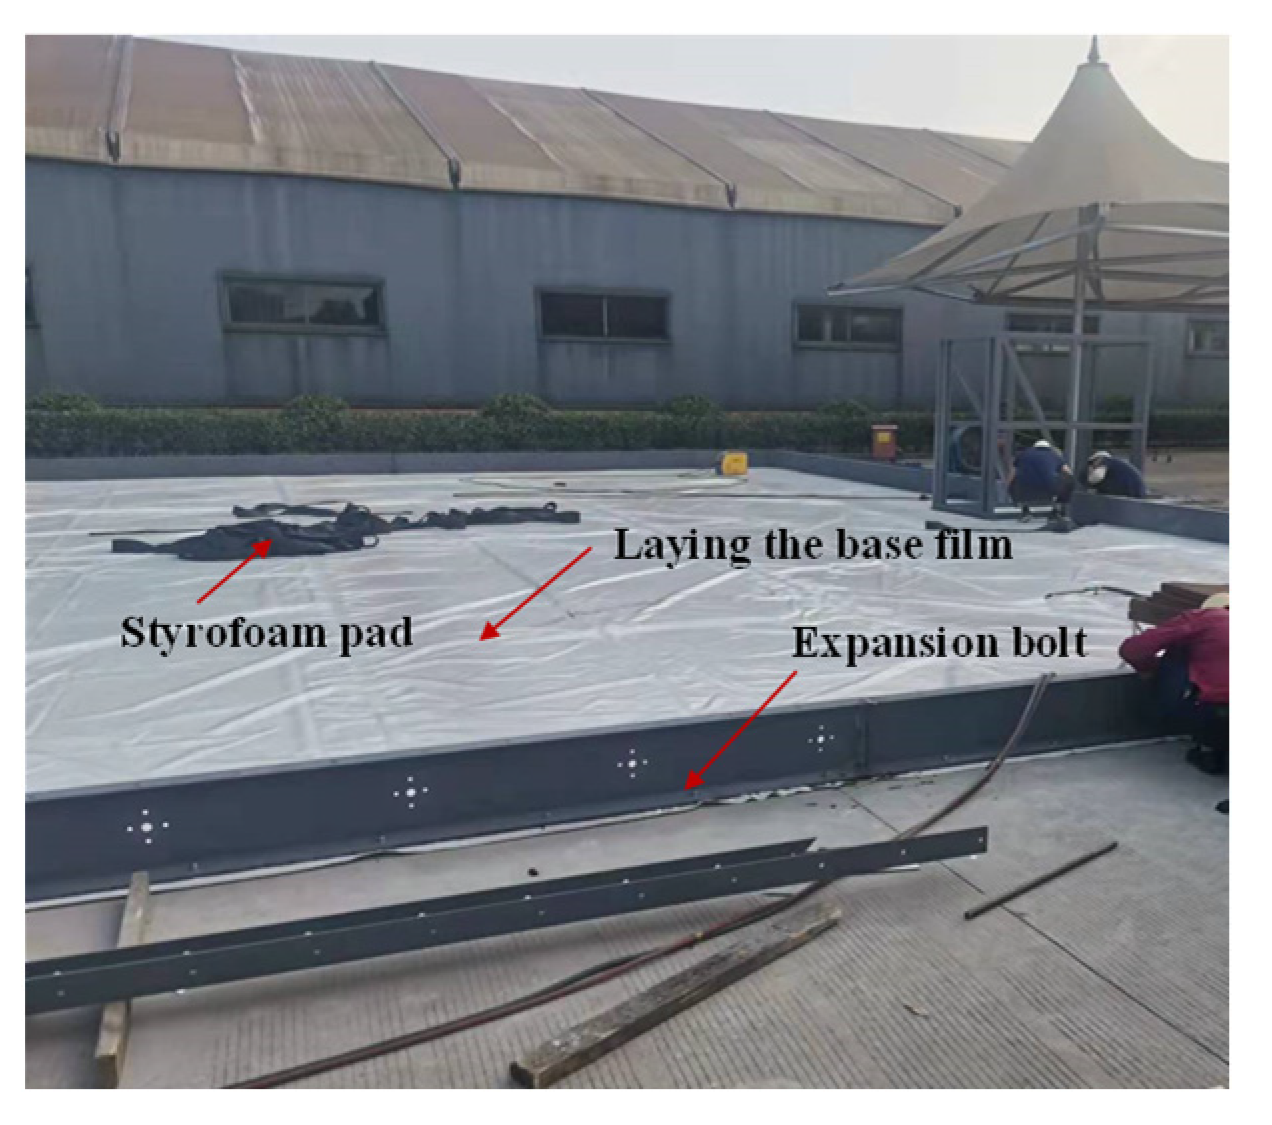
The size of the experimental model is 15 m × 13.2 m × 4.4 m. As shown in Figure 11, the system consists of a C28 channel steel foundation, polyester fabrics coated with PVC and having a 0.4 mm thickness, a cable net in the form of an obliquely intersecting grid (comprised of an 8 mm-diameter steel wire rope that is encased in HDPE), a blower and its control system and measuring instruments. The cable net adopts the oblique orthogonal arrangement, the cable net spacing is 0.5 m, and there are a total of 140 oblique orthogonal stiffening cables. The air-supported membrane structure has very high requirements for sealing. It is necessary to level and harden the ground in advance, install the embedded parts, and lay the bottom film and foam rubber pad to ensure the airtightness of the internal space (Figure 12).
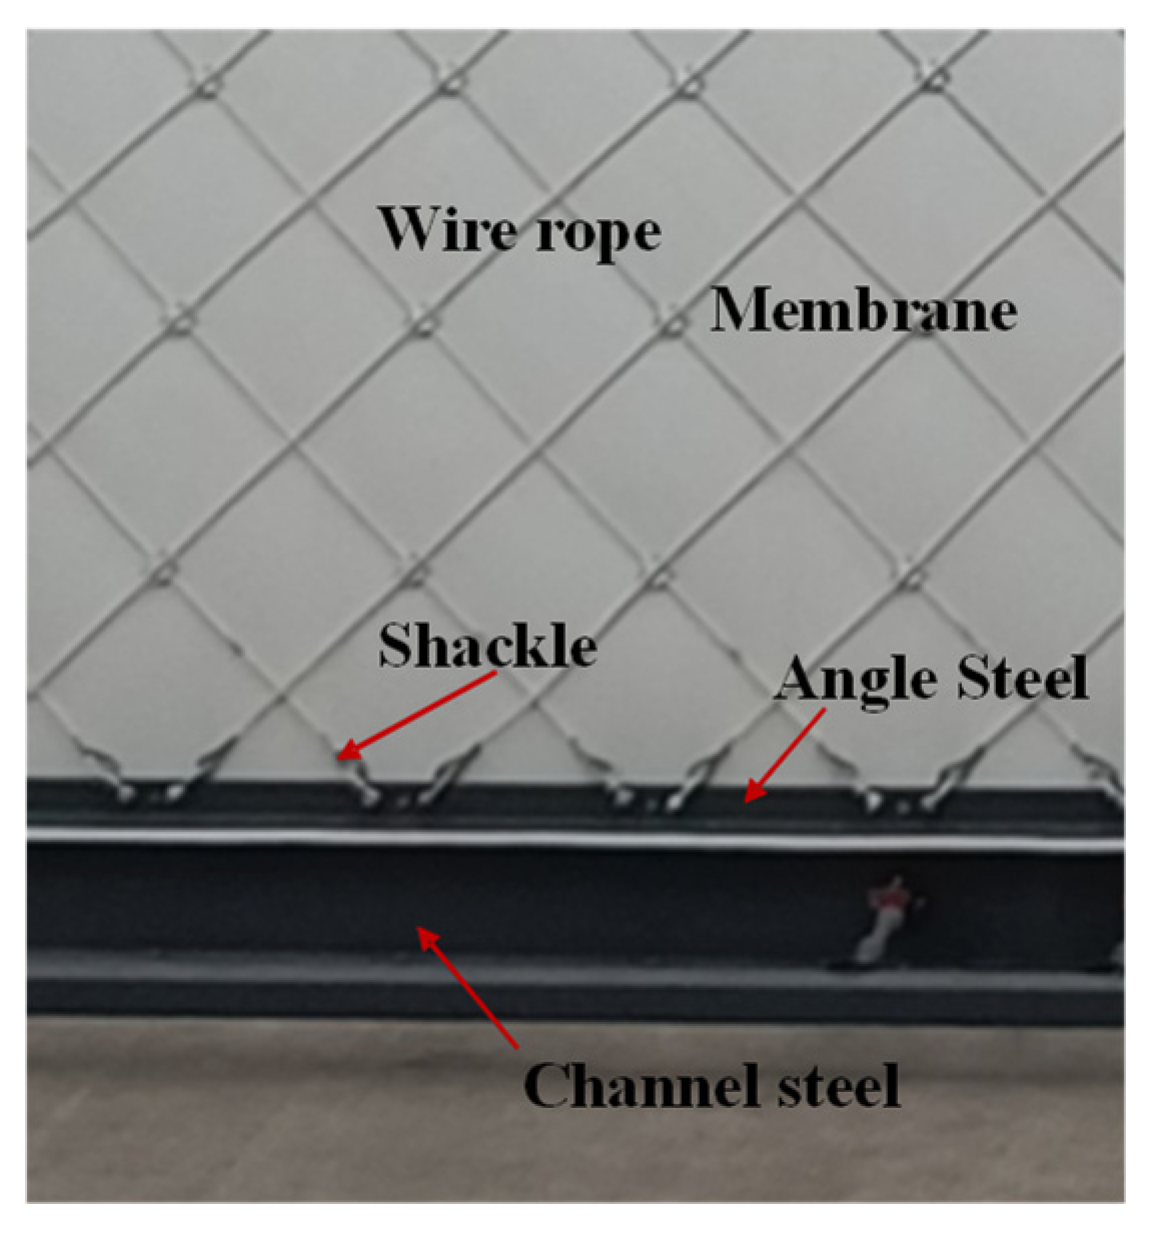
The membrane unit expands and extends beyond the base channel steel, connects with the base through angle steel and applies pressure to the pressure plate through bolts. The foam pads are filled to close the gaps between the membranes, and the membranes and the foundation are connected, as shown in Figure 13. After the installation of the membrane surface is completed, the cable net is laid. First, the cable net is hoisted to the required location and the corresponding orientation of the cable net is adjusted. At the same time, it is necessary to inspect the unfolded cable net to make sure that there are no tangles and no knots, and finally, the wire rope is fixed on the angle steel by the shackle (Figure 14).

4.2. Measuring Instrument

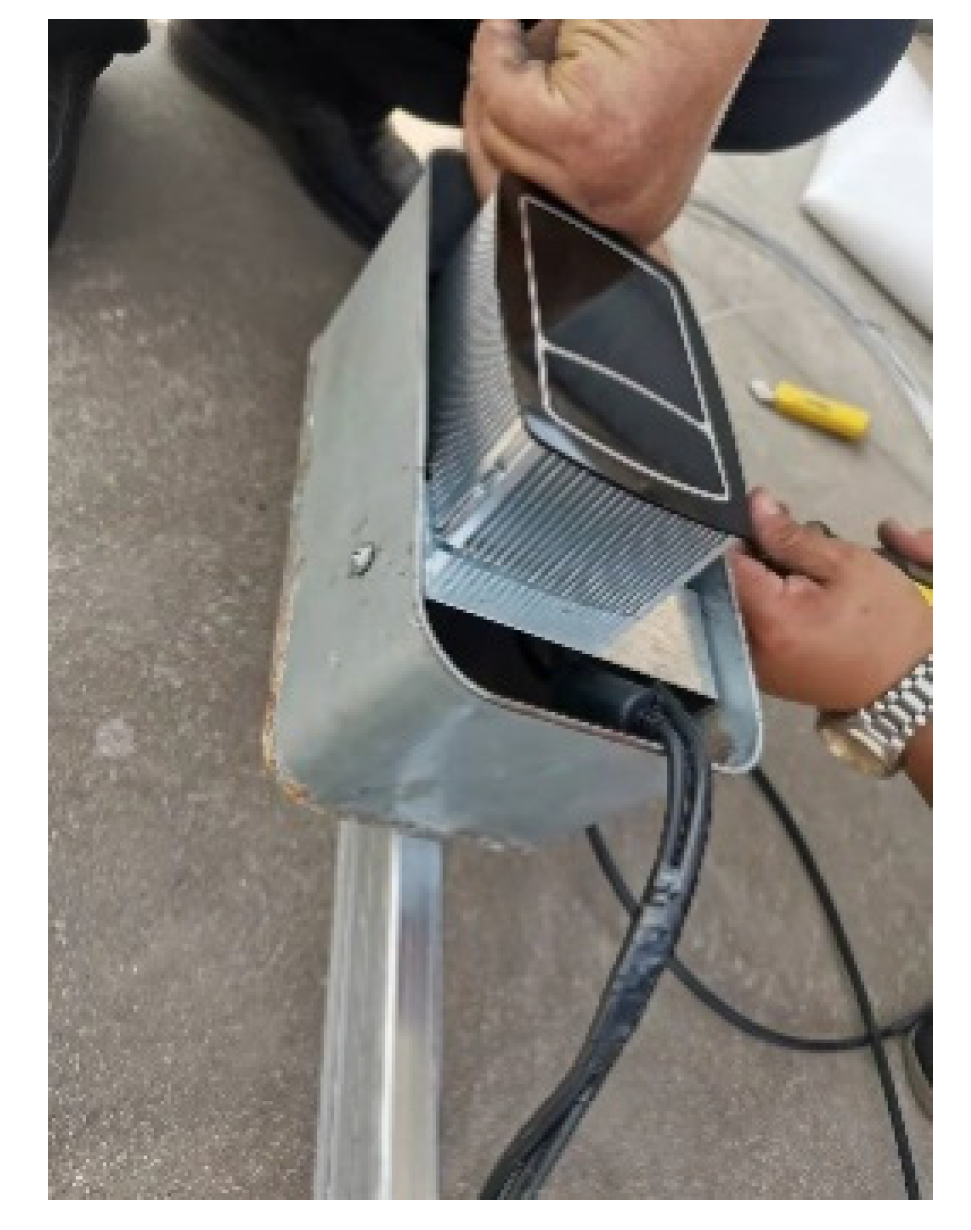
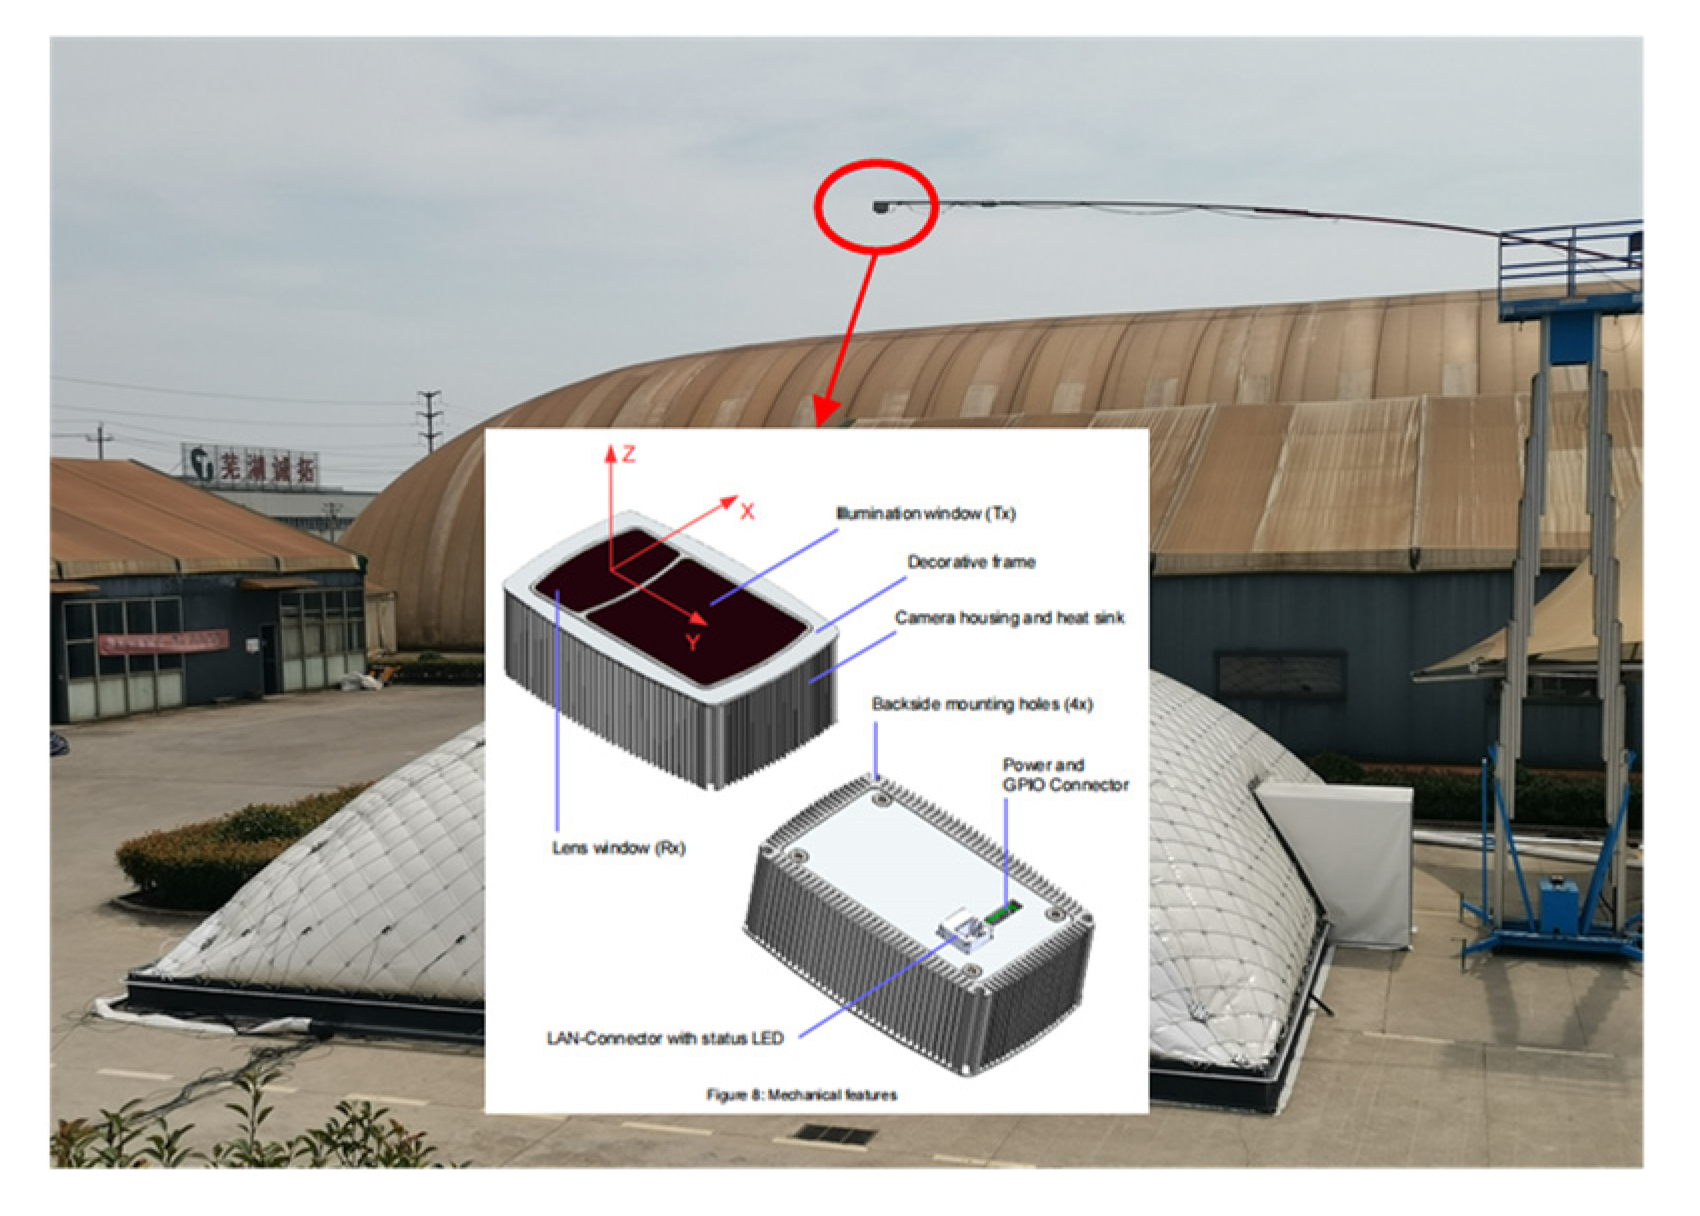
Due to the limitations of the test conditions, the test could not measure the tension of the film surface. Considering that the inflatable membrane structure is a typical flexible structure, the size and distribution of the membrane’s prestress value are directly related to the geometry of the membrane surface. Therefore, in this paper, the shape of the membrane surface is measured using solid-state lidar (see Figure 15), so as to reflect the stress state of the membrane surface. A surface strain gauge (EY501) is used to measure the cable tension directly (see Figure 16).

4.3. Measurement Point Arrangement

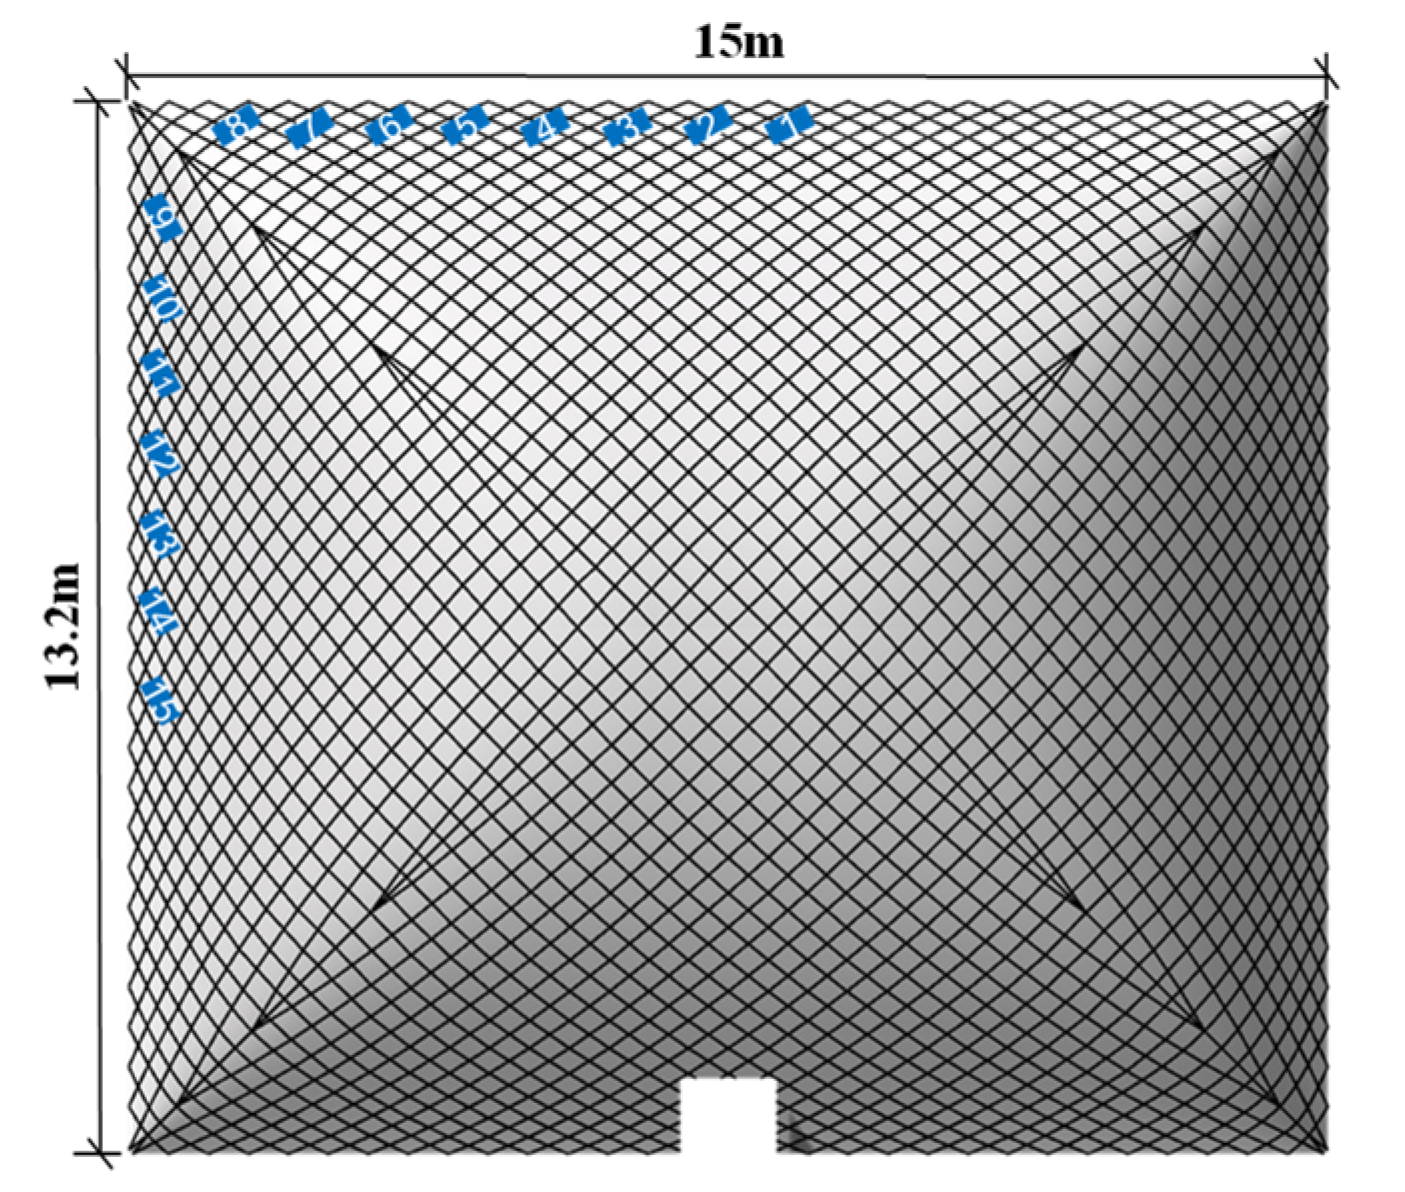
Strain gauges that measure cable tension were placed with transducers at one end of each cable. The number of diagonal cable nets was large, and half of the long and short sides were used to arrange sensors (15 in total). According to the symmetry of the model, the force of all cables can be included (Figure 17).
As shown in Figure 18, the lidar is used to measure the shape of the structure. In order to ensure that a complete model can be collected, the radar is located 11 m above the outside of the structure.

4.4. Test Process

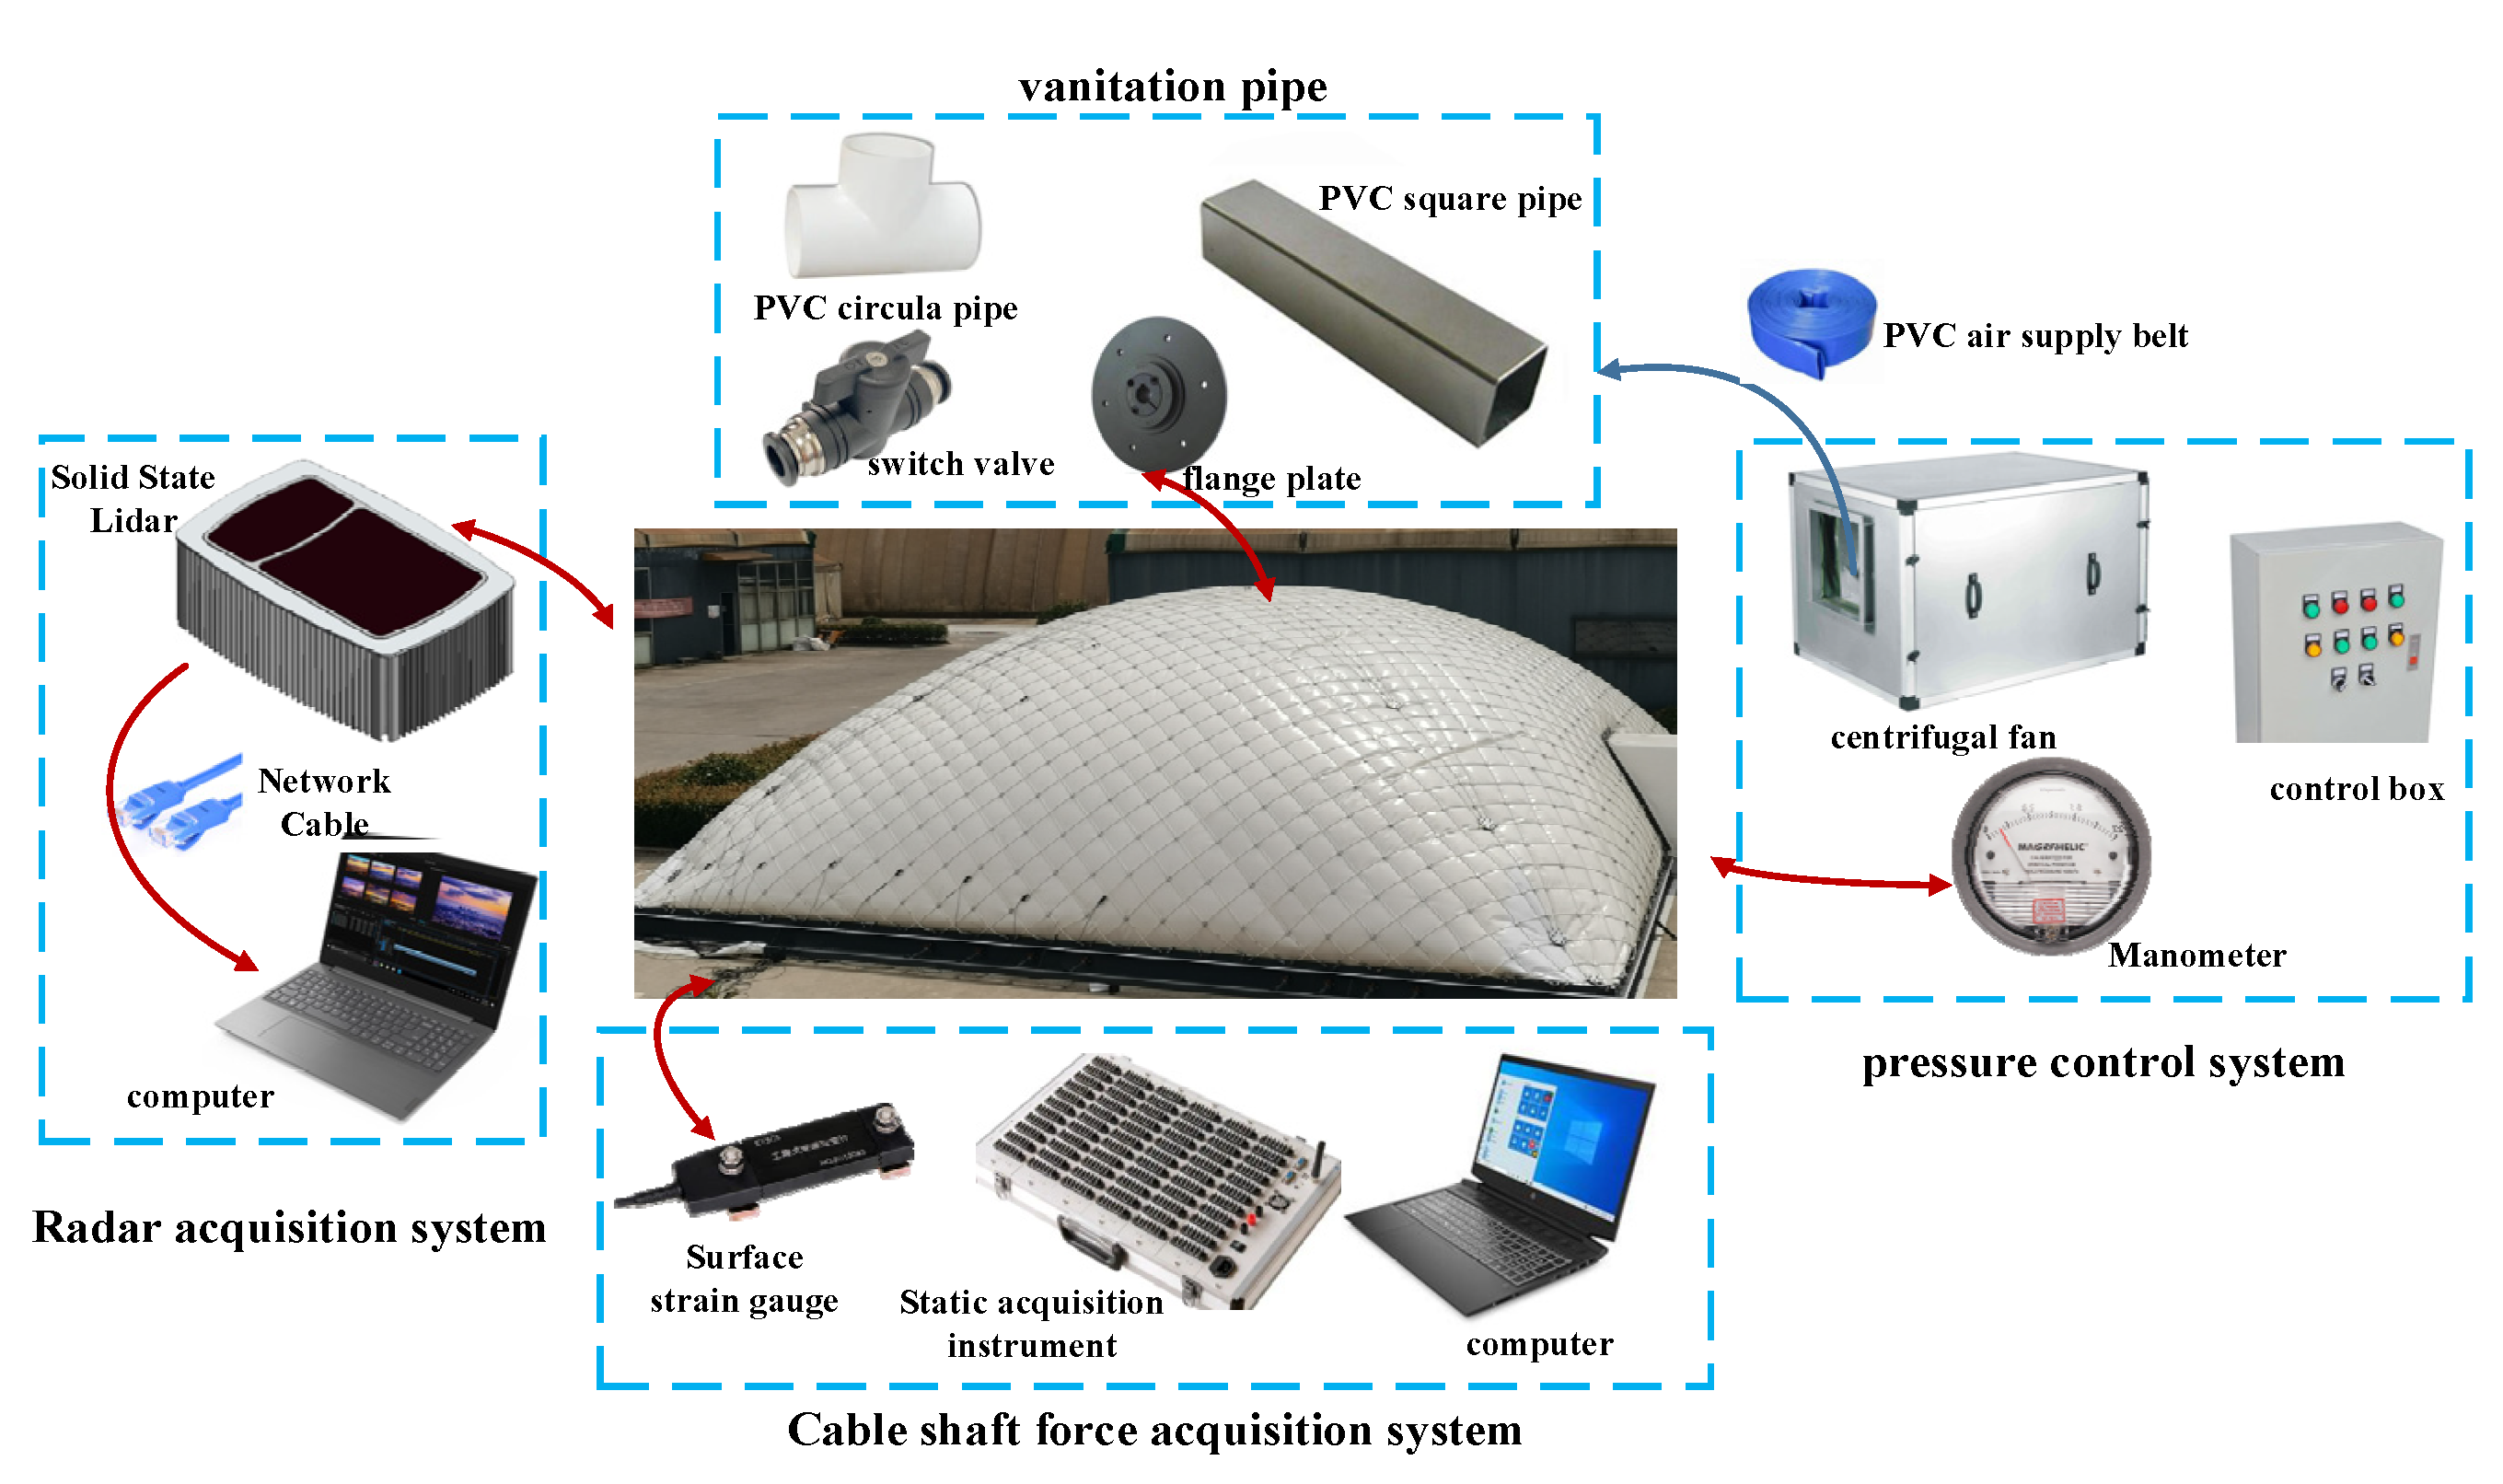
Figure 19 shows a sketch of the main experimental equipment and its layout.
Before the test started, equipment was debugged. First, the lidar and surface strain gauges were connected to the computer. Then the fan was started to begin inflation, and observation was made to see whether the value of each strain gauge was abnormal through the computer. The internal pressure was maintained after the inflatable membrane had essentially developed. The three-dimensional point cloud data of the structure collected by the radar was displayed through the computer window. At the same time the radar position was adjusted according to the image. After the test instrument was debugged, all the gas inside the inflatable membrane was removed.
After the gas inside the inflatable membrane was completely discharged, the fan was restarted to begin inflation. The internal pressure of the initial shape of the inflatable membrane was approximately 80 Pa. The initial internal pressure was set to 80 Pa and remained unchanged while ensuring the cable net was in the correct position. Following the establishment of the cable net location, inflation was increased to 400 Pa until the air pressure became steady (Figure 20). After waiting for ten minutes, the internal pressure was stabilized at 400 Pa, and the pressure acted uniformly inside the structure. At this moment, the computer collected data from the radar and strain gauges.

4.5. Test Results

(1) Cable net data processing
The sensors were numbered in advance (see Figure 21) before the test measurement of the skew cable network. The sensor was installed in the corresponding position, and the sensitivity of the corresponding sensor was input to the instrument according to the definition of the lead wire. To measure the tension at the end of the cables of the cable net in the grid form of the air-supported membrane structure, numerous measurements were taken, and the average value was calculated. In order to observe the changing law of the cable tension, the central axis of the structure along the long and short sides is marked in Figure 15. It can be found that the No. 2 measuring point and the No. 14 measuring point are located at the midpoint of the long side and the short side, respectively. Fifteen measuring points can cover a quarter of the structure. Due to the symmetry of the structure, the change law of the results of the measured points can basically represent the change law of the tension at the end of the cable of the overall diagonally crossed grid shaped cable net.
Figure 22 and Table 1 show the tension at the end of the cable net at the measuring point of the diagonally crossed grid-shaped cable net under the internal pressure of 400 Pa. According to the test findings, when the internal pressure is the same, the cable tension of the diagonally crossed grid shaped cable net at the corner of the structure is the smallest. From the corner to the midpoint of the length, the cable force first increases and then decreases. It can be seen from Table 1 and Figure 21 that the larger values are located at measuring points 3, 4 and 5 on the long side. That is, the maximum cable force along the long side of the structure is located at one quarter and three quarters. From the corner to the midpoint of the short side, the cable end tension increases. That is, the maximum cable force on the short side of the structure is located at the midpoint. On the whole, under the same internal pressure, the cable force along the long side of the diagonal cable net is slightly larger than the cable force along the short side. The force of the air-supported membrane structure is relatively uniform under the diagonal cable net arrangement.
(2) Radar data processing
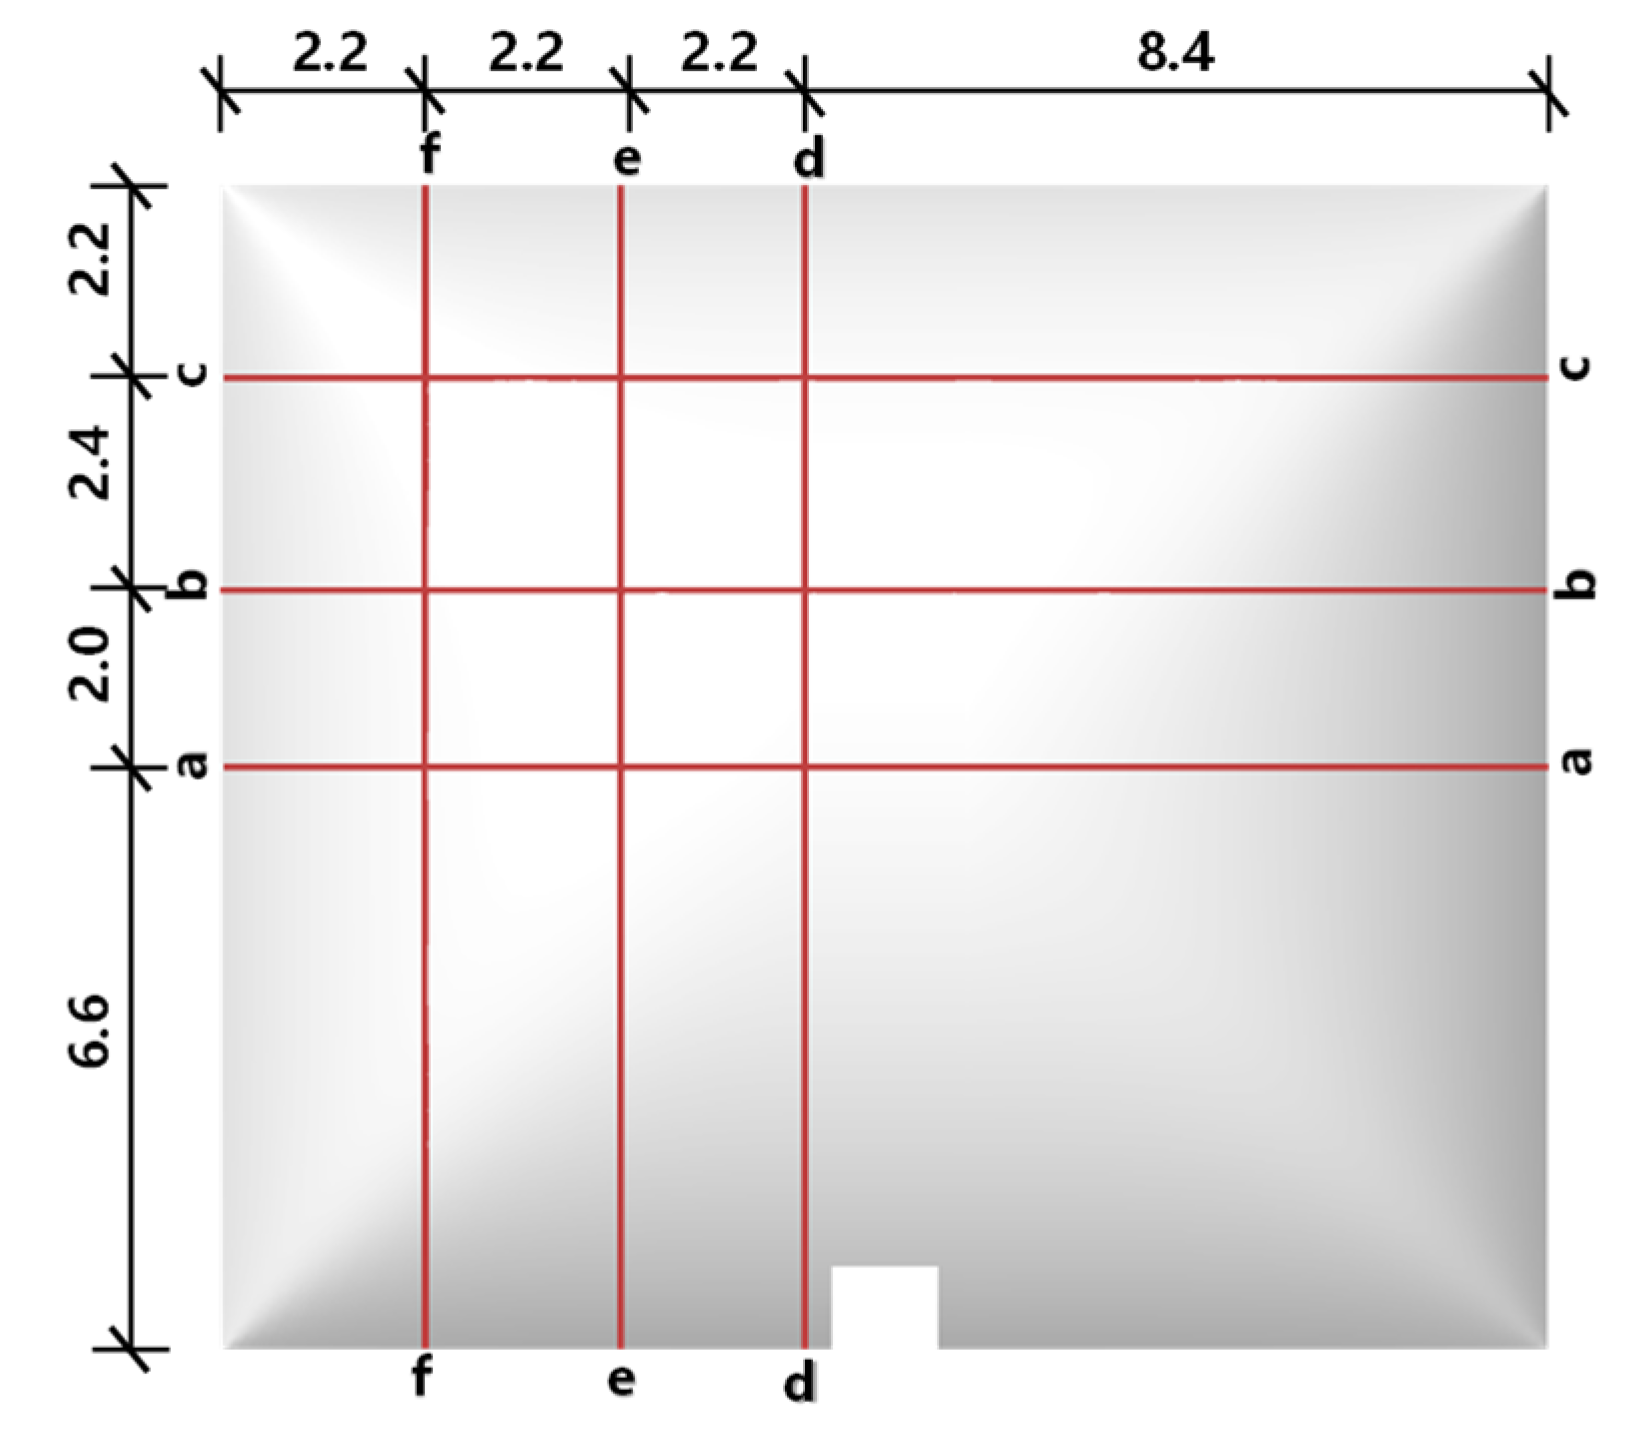
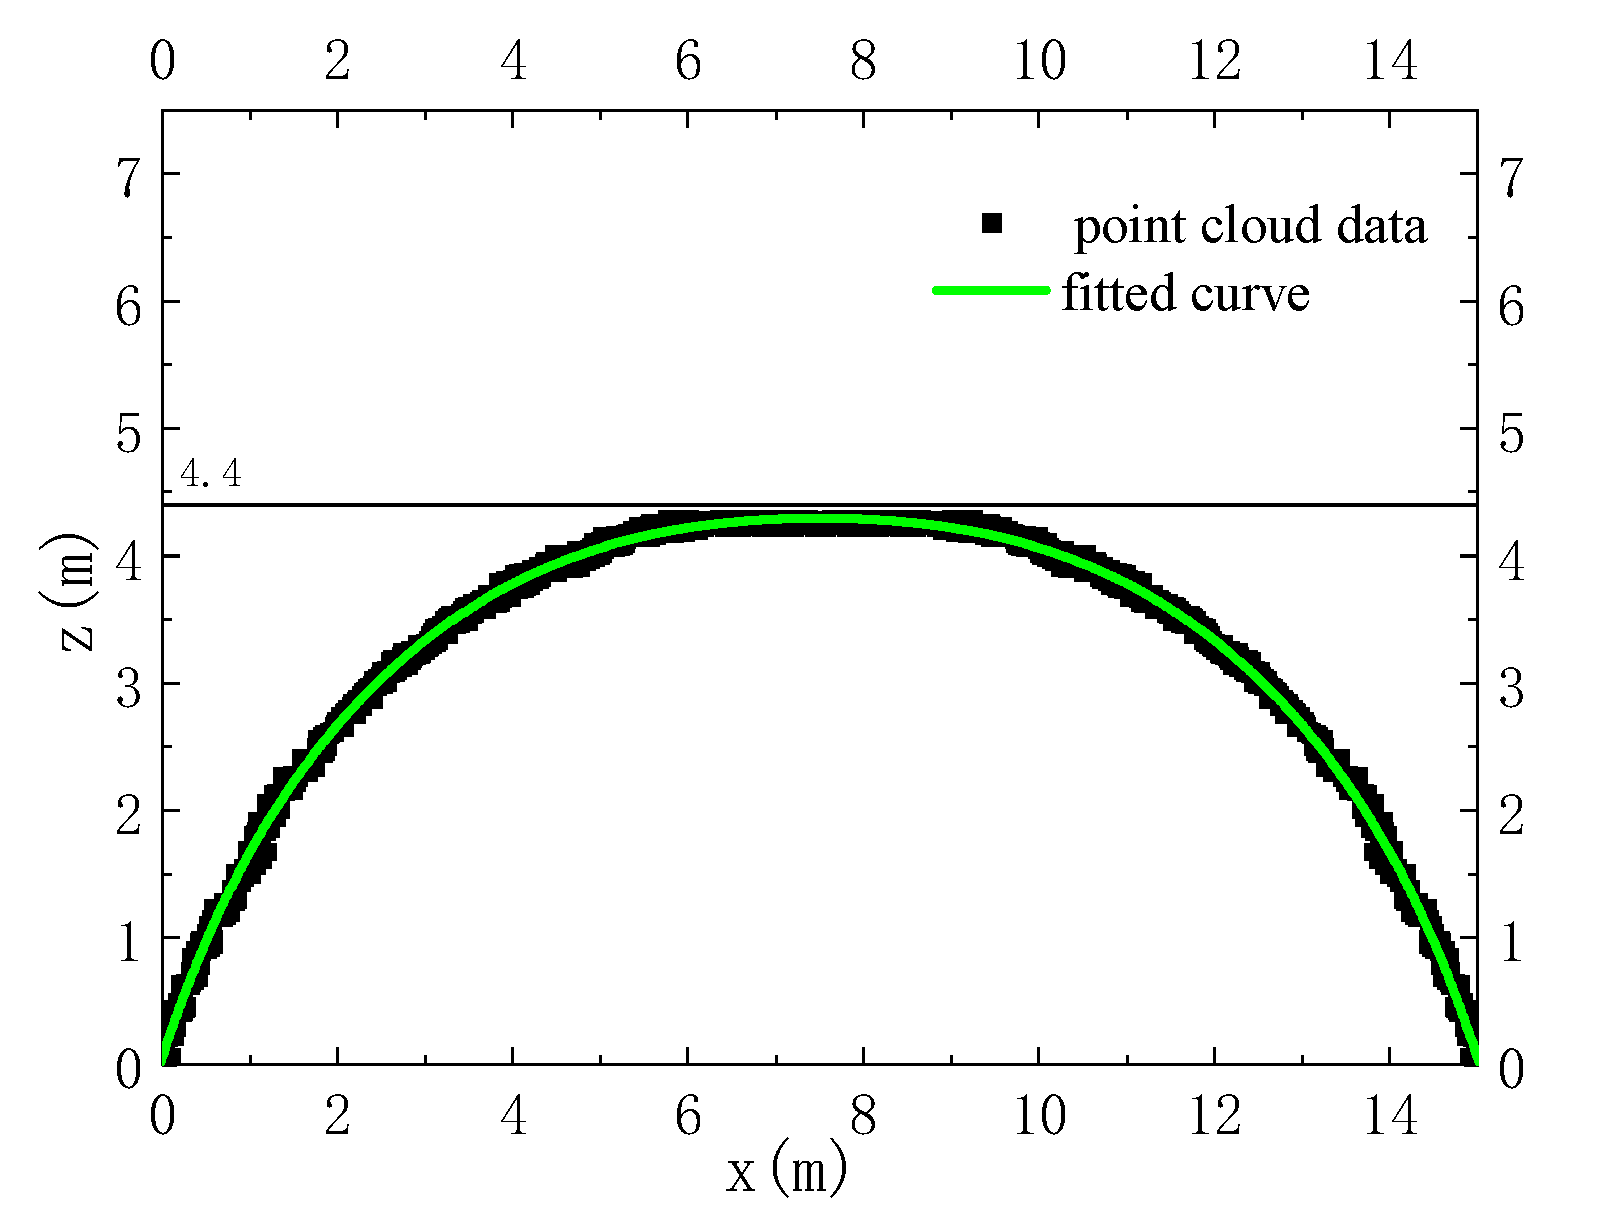
To obtain the point cloud coordinates of the membrane surface, the radar measurement data must be denoised and transformed into a text file that can be used. Figure 23 explains the fitting of the processed point cloud data to a curved surface using Origin software. Three cross-sections (as shown in Figure 24) from the longitudinal and transverse directions of the membrane surface were extracted and curve fitting was performed. The data and curves of the a-a section are shown in Figure 25. The figure shows that the height of the test model at 400 Pa internal pressure is 4.51 m with a base height of 0.28 m, and that the main body height of the membrane is 4.23 m, which is 0.21 m less than the design height.

5. Comparative Analysis of Results

5.1. Comparison of the Tensile Force

The simulation results considering the cable–membrane sliding contact analysis and binding analysis were obtained by ANSYS, and the cable tension value at the measuring point was extracted. The experimental results and the simulation results were compared and analyzed (Figure 26). Table 2 shows the cable tension test values of the long and short cable measuring points under the internal pressure of 400 Pa and the error between the experimental value and the simulated value calculated based on the experimental data.
According to the calculation findings, the variation trend of the cable tension considering the cable–membrane sliding contact analysis is consistent with the test results. The cable tension at the corner is the smallest, and the cable force changes from the corner along the length to the midpoint, which increases first and then decreases. The cable force increases gradually from the corner to the midpoint along the short direction. The error of the analysis results considering the cable–membrane sliding contact is basically below 10%, and the measuring point with the largest error is located at the corner of the structure. The results of the binding contact analysis are quite different from the experimental results. The change trend of the cable force along the long direction was the same as that of the test results, but the error was relatively large, with the maximum error reaching 39%. The change trend of the force for the short cables was quite different from the experimental trend, and the overall trend was “W”. The errors of measuring points 5, 8, 12 and 13 with the test data under different internal pressures were all below 15%. The maximum error with the experimental data reached 44%, but the minimum error was 0.91%. This explains the inhomogeneity of the tension of the cable net in the binding analysis.

5.2. Comparison of Sections

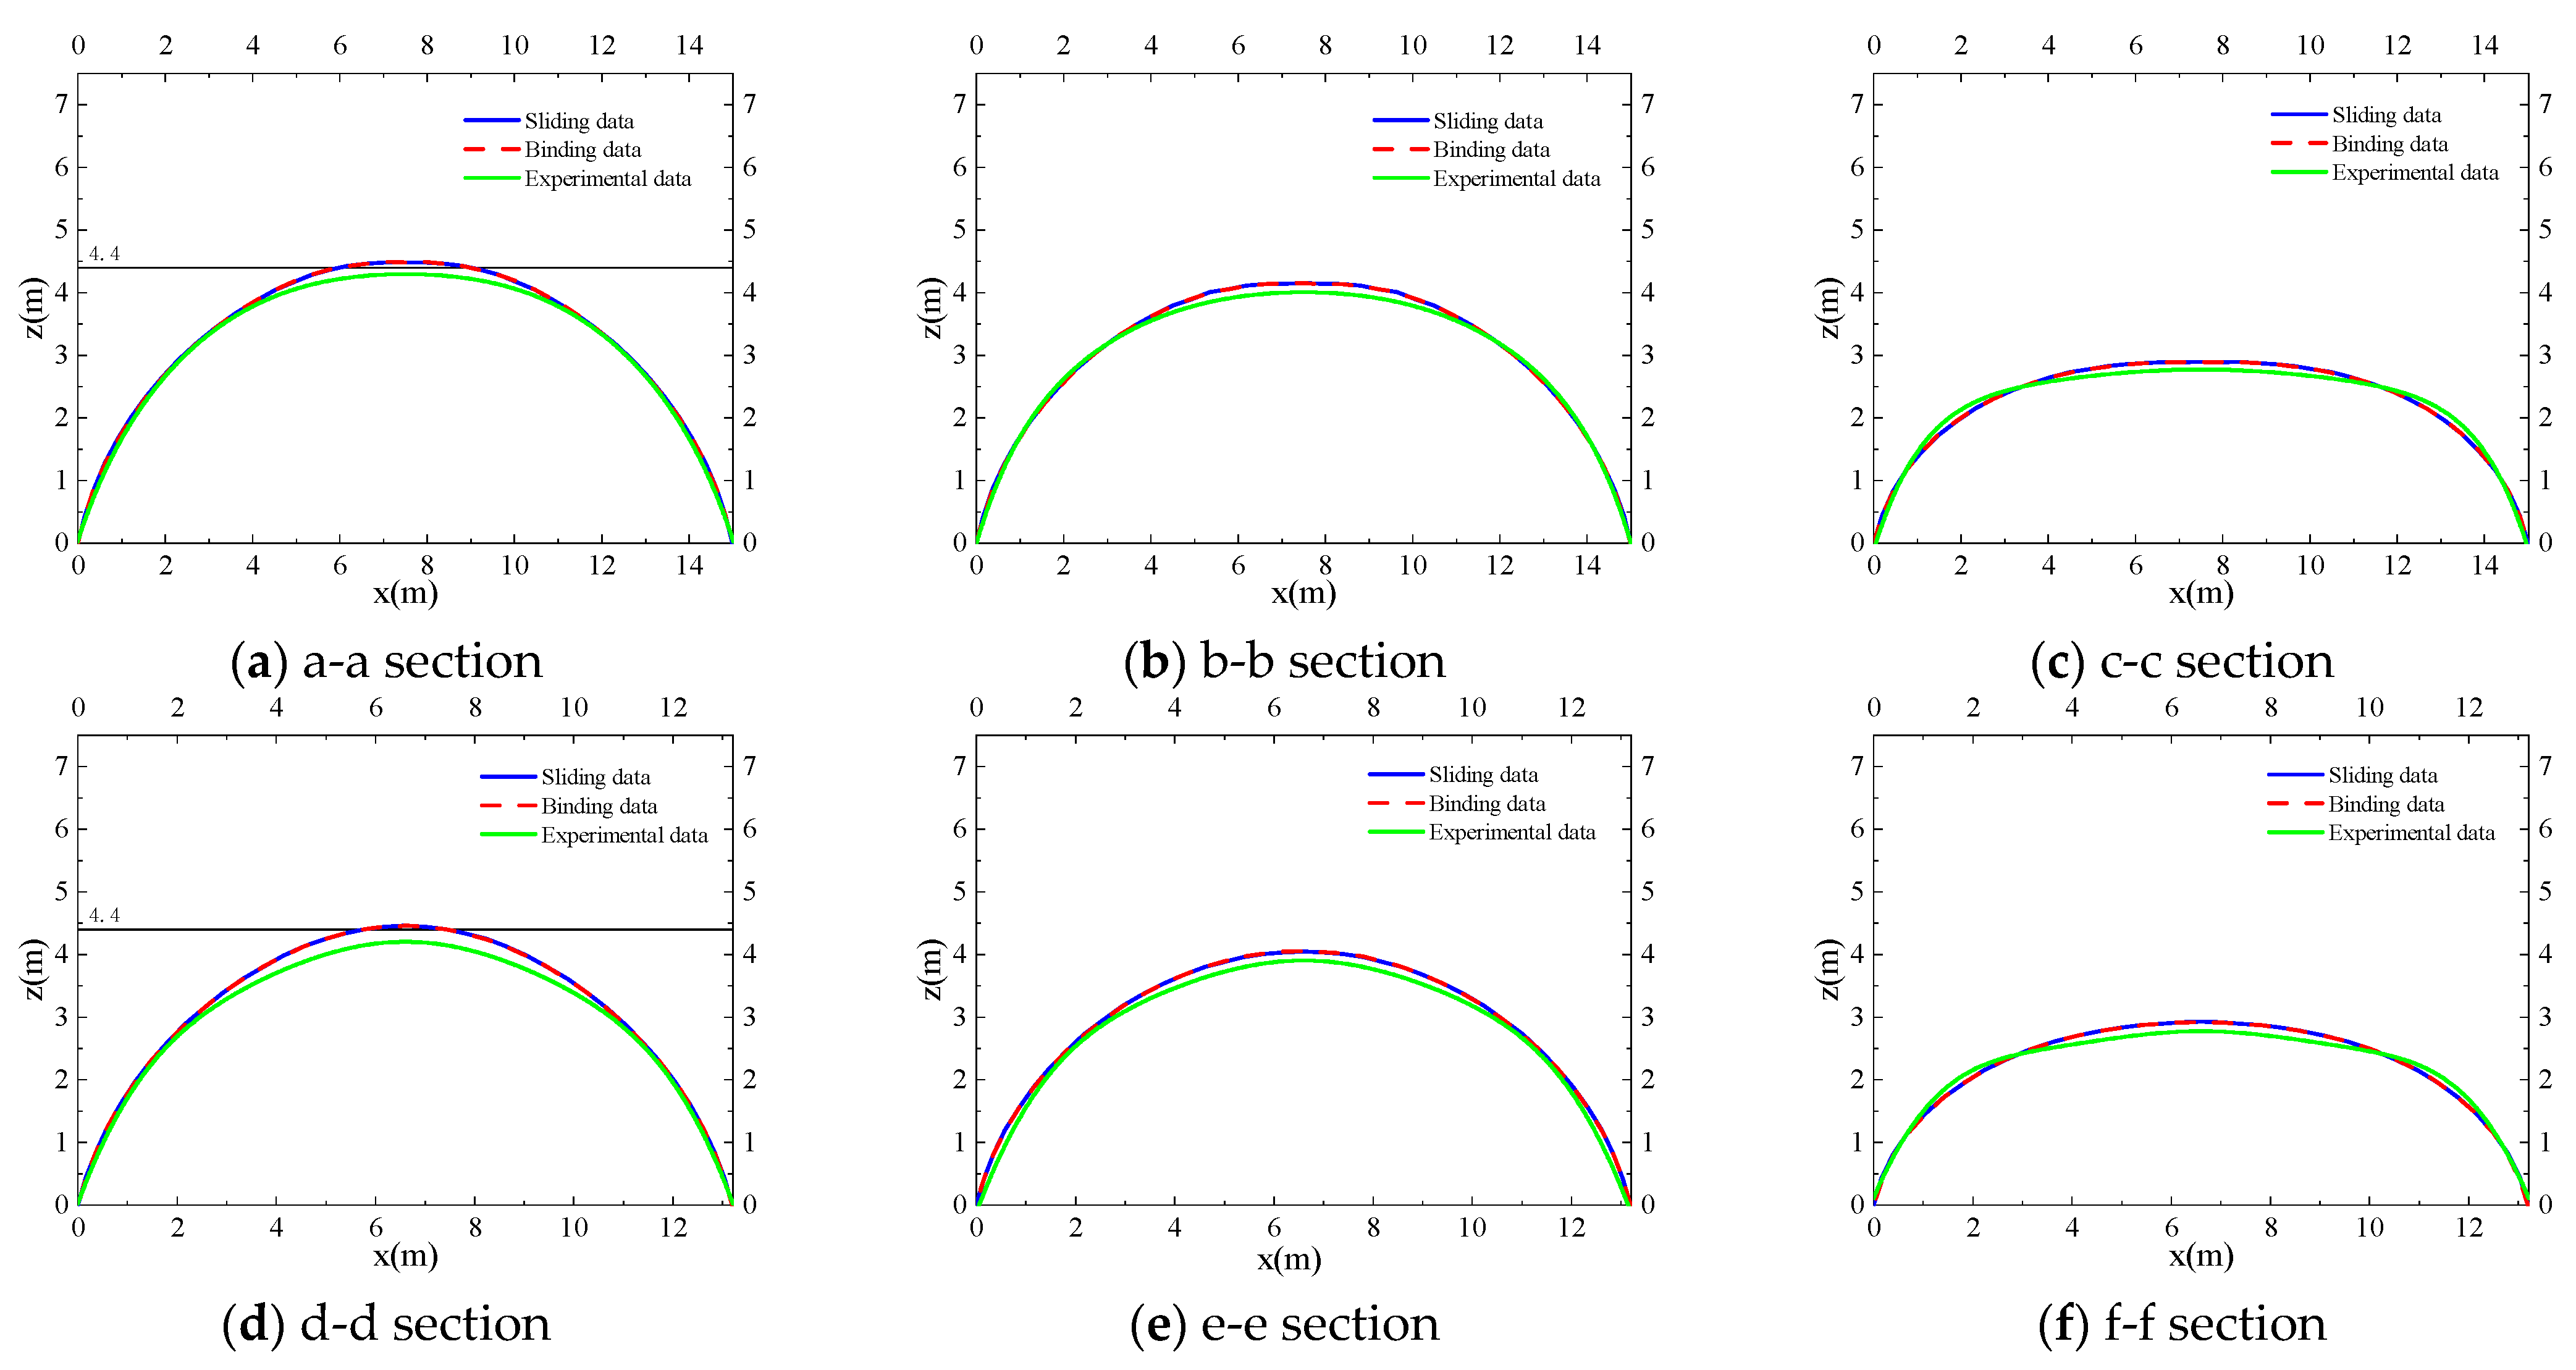
The simulation results considering cable–membrane sliding contact analysis and binding analysis were obtained by ANSYS, and the section shape was extracted. The test results under 400 Pa internal pressure were compared with the simulation results, as shown in Figure 27.
The model height of the numerical simulation is more than the design height, as can be seen in the figure. The height of the binding analysis is slightly higher than that of the sliding analysis, but the difference is small. The profiles of the two contact analysis methods are basically consistent at all profile positions, and the test heights are smaller than the design heights. The shapes of the sections (a-a, d-d) in the middle position of the structure in the simulation analysis are higher than the test shape, and the overall fit is relatively high. However, the shapes of the sections (c-c, f-f) located at the edge position of the simulation analysis are in poor agreement with the experimental shape. It is mainly manifested in that the top of the test shape is a relatively gentle slope and the corners protrude upwards. This is because the distribution of air flow inside the structure is different from the way in which the internal pressure is applied during the simulation analysis.
In general, since the experimental model is smaller than the actual project, the results of the binding analysis and the analysis considering the sliding contact of the cable and membrane for the membrane surface displacement are less different. It is not easy to judge only by the section shape, considering the influence of cable–membrane sliding contact analysis on the initial shape. The largest difference between the simulation results and the experimental results is at the top of the structure. The real prestressed state has a flatter top and a lower height. Errors in the fabrication of the cable net and the cutting procedure for the membrane surface might be to blame for this difference.

6. Conclusions

In this paper, a scale model of an air-supported membrane structure with a diagonally crossed grid-shaped cable net was taken as the research object. The initial morphological analysis of the model was carried out using two analysis methods, namely, the sliding contact analysis of the cable and membrane and the binding contact analysis. The results of the two contact models were compared and analyzed, and the tensile force and section shape of the cable were extracted and compared with the test data. The conclusions are as follows:
(1) In the finite element simulation, the difference between the membrane surface displacement of the cable–membrane sliding contact analysis and the membrane surface displacement of the binding contact analysis is very small. The stress distribution of the membrane surface for the bound contact analysis is not uniform compared to that of the sliding contact. The tension of the cable net for binding contact is greater than that for sliding contact. In addition, the uneven distribution of the tension of the binding contact cable net is prone to stress concentration.
(2) By comparing the simulation and test results, it is obvious that the change trend of the cable tension considering the cable–membrane sliding contact analysis is consistent with the test results. When the contact slip of the cable and membrane is not considered, the stress concentration of the cable and membrane appears, and the deviation of the overall result is large. Consideration of the cable–membrane contact slip has relatively little influence on the shape of the membrane surface. The top of the film surface shape obtained by the experimental analysis is a gentler slope than the simulated value. This is because the distribution of air flow inside the structure is different from the way in which the internal pressure is applied during the simulation analysis.
(3) In practical engineering, the slip contact between cables and membranes should be considered in the initial morphological analysis of large-span air-supported membrane structures to avoid stress concentration. This results in a cost-effective structure when selecting cable materials.

Author Contributions

Conceptualization, Methodology, Writing—Reviewing and Editing, X.L.; Inves-tigation, Data curation, Writing—Original draft preparation, Z.Z.; Writing—Re-viewing and Editing, S.X.; Software, Writing—Reviewing and Editing, Y.H. Conceptualization, Methodology, Y.Z. All authors have read and agreed to the published version of the manuscript.

Funding

The National Natural Science Foundation of China (No. 51878014) provided financial support for this article. We also appreciate Beijing Jintengsheng Membrane Structure Technology Co., Ltd. and Zhejiang HONTEX New Materials Co., Ltd. for help with the membrane structure experiment.

Institutional Review Board Statement

Not applicable.

Informed Consent Statement

Not applicable.

Data Availability Statement

No new data were created or analyzed in this study. Data sharing is not applicable to this article.

Conflicts of Interest

The authors declare no conflict of interest.

References

  1. Kromoser, B.; Huber, P. Pneumatic formwork systems in structural engineering. Adv. Mater. Sci. Eng. 2016, 2016, 4724036. [Google Scholar] [CrossRef] [Green Version]
  2. Yin, Y.; Chen, W.; Hu, J.; Zhao, B.; Wang, Q. In-situ measurement of structural performance of large-span air-supported dome under wind loads. Thin-Walled Struct. 2021, 169, 108476. [Google Scholar] [CrossRef]
  3. Xu, Y.; Guan, F.-L. Structure design and mechanical measurement of inflatable antenna. Acta Astronaut. 2012, 76, 13–25. [Google Scholar] [CrossRef]
  4. Europe-China Today. 2020. Available online: https://www.ectoday.eu/ (accessed on 5 January 2023).
  5. Bell, L. Pneumatic membrane structures for space and terrestrial applications. In Proceedings of the 11th Biennial ASCE Aerospace Division International Conference on Engineering, Science, Construction, and Operations in Challenging Environments, Long Beach, CA, USA, 3–5 March 2008; pp. 1–8. [Google Scholar]
  6. Li, X.; Zhang, Z.; Xue, S.; He, Y. Experimental and simulation analysis of the initial shape of a large-span air-supported membrane structure. Thin-Walled Struct. 2022, 178, 109491. [Google Scholar] [CrossRef]
  7. Bonet, J.; Wood, R.D.; Mahaney, J.; Heywood, P. Finite element analysis of air supported membrane structures. Comput. Methods Appl. Mech. Eng. 2000, 190, 579–595. [Google Scholar] [CrossRef]
  8. Mokin, N.A.; Kustov, A.A.; Trushin, S.I. Numerical simulation of an air-supported structure in the air flow. Textiles composites and inflatable structures VIII. In Proceedings of the VIII International Conference on Textile Composites and Inflatable Structures, Barcelona, Spain, 9–11 October 2017; CIMNE; pp. 383–393. [Google Scholar]
  9. Schek, H.J. The force density method for form finding and computations of general networks. Comput. Methods Appl. Mech. Eng. 1974, 12, 115–134. [Google Scholar] [CrossRef]
  10. Wan, Z.; Ohlbrock, P.O.; D’Acunto, P.; Cao, Z.; Fan, F.; Schwartz, J. A form-finding approach for the conceptual design of air-supported structures using 3D graphic statics. Comput. Struct. 2021, 243, 106401. [Google Scholar] [CrossRef]
  11. Matumura, T.K. Finite Element Analysis of Cable Reinforced Membrane Structures with the Use of Bendable-Element; IASS International Symposium’97 on Sell & Spatial Structures: Singapore, 1997; pp. 567–576. [Google Scholar]
  12. Lshii, K. Form finding analysis in consideration of cutting patterns of membrane structures. Int. J. Space Struct. 1999, 14, 105–119. [Google Scholar]
  13. Yong, S.C.; Wang, S. The influence of cable sliding on the performance of membrane structure. In Proceedings of the 10th National Conference on Structural Engineering, Nanjing, China, 1 October 2001; Chinese Society of Mechanics: Beijing, China, 2001; pp. 674–682. (In Chinese). [Google Scholar]
  14. Ju, F.; Choo, Y.S. Super element approach to cable passing through multiple pulleys. Int. J. Solids Struct. 2005, 42, 3533–3547. [Google Scholar] [CrossRef]
  15. Noguchi, H.; Kawashima, T. Meshfree Analyses of Cable-reinforced Membrane Structures by ALE–EFG Method. Eng. Anal. Bound. Elem. 2004, 28, 443–451. [Google Scholar] [CrossRef]
  16. He, Y.; Zhu, M.; Zhao, Y.; Li, X. Influence of different cable–membrane connection models on wind-induced responses of an air supported membrane structure with orthogonal cable net. Thin-Walled Struct. 2022, 180, 109840. [Google Scholar] [CrossRef]
  17. Okamoto, N.; Nakazawa, M. Finite element incremental contact analysis with various frictional conditions. Int. J. Numer. Methods Eng. 1979, 14, 337–357. [Google Scholar] [CrossRef]
  18. Mijar, A.R.; Arora, J.S. Review of formulations for elastostatic frictional contact problems. Struct. Multidiscip. Optim. 2000, 20, 167–189. [Google Scholar] [CrossRef]
  19. Chen, J.S.; Wang, H.P. New boundary condition treatments in meshfree computation of contact problems. Comput. Methods Appl. Mech. Eng. 2000, 187, 441–468. [Google Scholar] [CrossRef]
  20. Yin, L.; Zhou, H.L.; Lü, Y.F. Form-finding and wind loading analysis of air-supported membrane structures. Ind. Constr. 2013, 43 (Suppl. 1), 349–353. [Google Scholar]
  21. Belytschko, T.; Neal, M.O. Contact-impact by the pinball algorithm with penalty and Lagrangian methods. Int. J. Numer. Methods Eng. 1991, 31, 547–572. [Google Scholar] [CrossRef]
  22. Cuomo, M.; Ventura, G. Complementary energy approach to contact problems based on consistent augmented Lagrangian formulation. Math. Comput. Model. 1998, 28, 185–204. [Google Scholar] [CrossRef] [Green Version]
  23. Gould, N.I.M. On the convergence of a sequential penalty function method for constrained minimization. SIAM J. Numer. Anal. 1989, 26, 107–128. [Google Scholar] [CrossRef]
  24. Wang, X.M. ANSYS Structural Dynamic Analysis and Application; People’s Communications Press: Beijing, China, 2011. [Google Scholar]
  25. Li, Z.; Zhang, Y.; Zhang, Y. Experimental study on friction coefficient between cable and membrane. Build. Struct. 2010, 40, 107–110. (In Chinese) [Google Scholar]
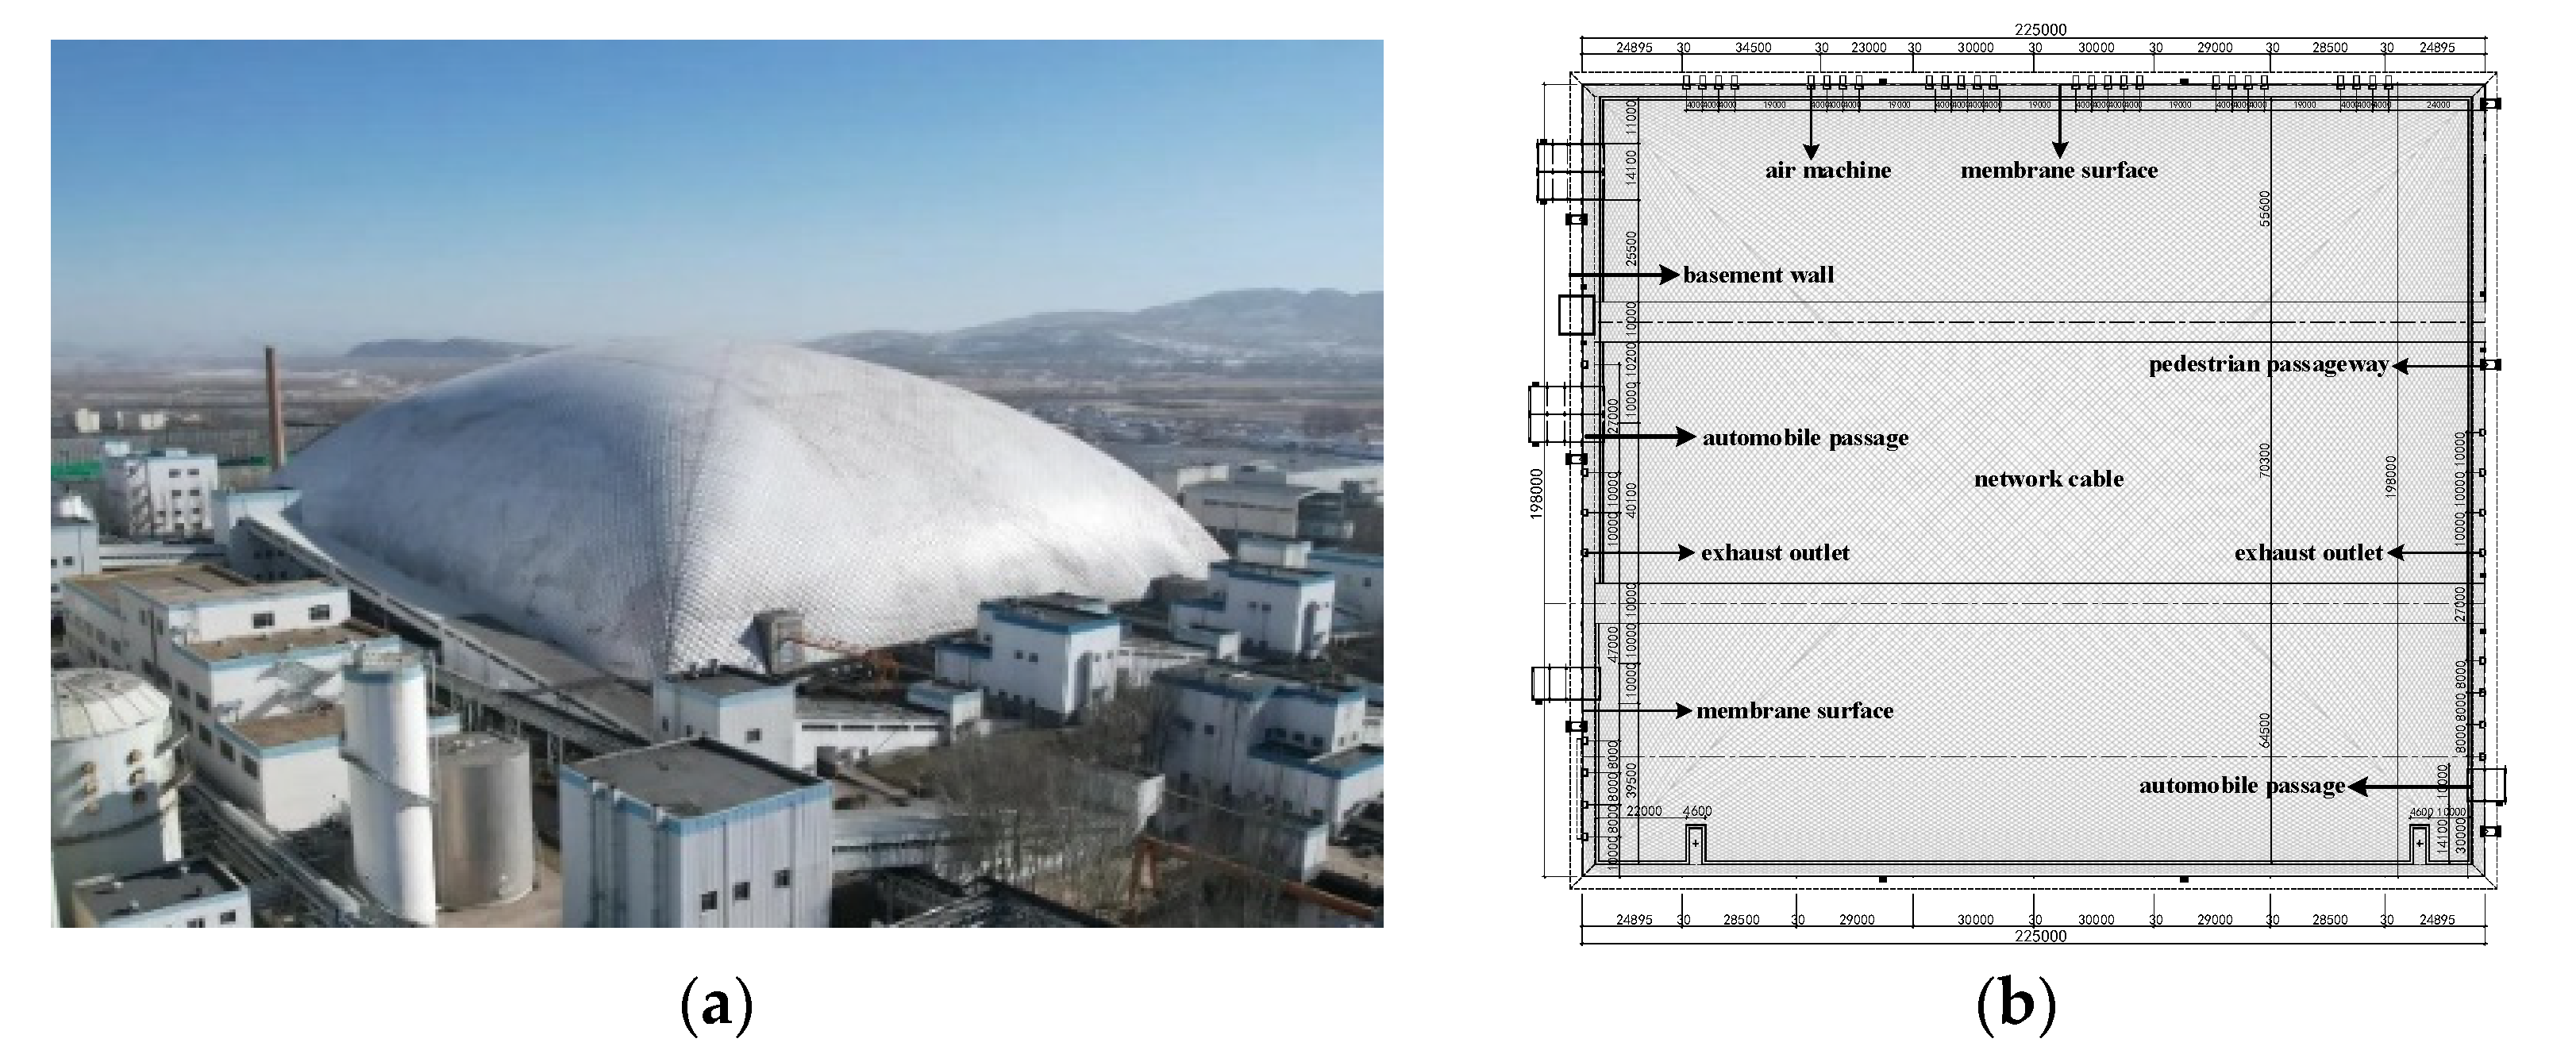
Figure 1. Closed coal yard structure. (a) Aerial View; (b) Structure Plan View.
Buildings 13 00184 g001
Figure 2. Friction slip between cable and membrane.
Buildings 13 00184 g002
Figure 3. Geometric model.
Buildings 13 00184 g003
Figure 4. Point-to-surface contact pair model.
Buildings 13 00184 g004
Figure 5. Schematic diagram of contact boundary deformation coordination conditions. (a) Intrusion of target and contact surfaces; (b) Modification to meet bound contact.
Buildings 13 00184 g005
Figure 6. Original model.
Buildings 13 00184 g006
Figure 7. Computational Simplified Model.
Buildings 13 00184 g007
Figure 8. Sliding Contact Analysis Results.
Buildings 13 00184 g008
Figure 9. Cable–membrane internal force in sliding contact state.
Buildings 13 00184 g009aBuildings 13 00184 g009b
Figure 10. Cable–membrane internal force in bound contact state.
Buildings 13 00184 g010
Figure 11. Test model.
Buildings 13 00184 g011
Figure 12. Basic installation.
Buildings 13 00184 g012
Figure 13. Membrane installation.
Buildings 13 00184 g013
Figure 14. Cable network connection.
Buildings 13 00184 g014
Figure 15. Surface strain gauge.
Buildings 13 00184 g015
Figure 16. Solid-state lidar.
Buildings 13 00184 g016
Figure 17. Sensor measuring point layout.
Buildings 13 00184 g017
Figure 18. Radar installation location.
Buildings 13 00184 g018
Figure 19. Experimental layout sketch.
Buildings 13 00184 g019
Figure 20. The process of inflating.
Buildings 13 00184 g020
Figure 21. Sensor number.
Buildings 13 00184 g021
Figure 22. Cable tension variation curve.
Buildings 13 00184 g022
Figure 23. 3-D surface of test model.
Buildings 13 00184 g023
Figure 24. Sectional position.
Buildings 13 00184 g024
Figure 25. Fitting curve of section a-a.
Buildings 13 00184 g025
Figure 26. Cable tension comparison curve. (a) Comparison curve of long cable data; (b) Comparison curve of short cable data.
Buildings 13 00184 g026
Figure 27. Comparison curve diagram of transverse section.
Buildings 13 00184 g027
Table 1. Cable end tension values of different measuring points.
Along the Long SideAlong the Short Side
Measuring PointCable Tension(kN)Measuring PointCable Tension(kN)
10.59590.549
20.626100.595
30.722110.659
40.746120.621
50.742130.674
60.660140.689
70.492150.604
80.427--
Table 2. Comparison of cable end axial tension.
Measuring
Point
TestSliding ContactBinding Contact
Tension (kN)Tension (kN)Error (%)Tension (kN)Error (%)
10.595 0.641 7.75 0.672 13.00
20.626 0.660 5.48 0.818 30.60
30.722 0.759 5.06 0.853 18.16
40.746 0.768 2.99 0.924 23.89
50.742 0.768 3.46 0.806 8.58
60.660 0.719 8.95 0.815 23.46
70.492 0.527 7.10 0.685 39.31
80.427 0.476 11.47 0.476 11.47
90.549 0.596 8.62 0.796 44.94
100.595 0.625 5.02 0.736 23.77
110.659 0.692 4.95 0.880 33.61
120.621 0.653 5.23 0.669 7.78
130.674 0.700 3.84 0.710 5.31
140.689 0.730 5.91 0.903 31.00
150.604 0.661 9.48 0.817 35.21
Disclaimer/Publisher’s Note: The statements, opinions and data contained in all publications are solely those of the individual author(s) and contributor(s) and not of MDPI and/or the editor(s). MDPI and/or the editor(s) disclaim responsibility for any injury to people or property resulting from any ideas, methods, instructions or products referred to in the content.