Article

Numerical Analysis of Wind Effects on a Residential Building with a Focus on the Linings, Window Sills, and Lintel

1
Department of Structural Mechanics, Faculty of Civil Engineering, Slovak University of Technology in Bratislava, Radlinského 11, 810 05 Bratislava, Slovakia
2
Department of Mathematics and Descriptive Geometry, Faculty of Civil Engineering, Slovak University of Technology in Bratislava, Radlinského 11, 810 05 Bratislava, Slovakia
3
Department of Building Construction, Faculty of Civil Engineering, Slovak University of Technology in Bratislava, Radlinského 11, 810 05 Bratislava, Slovakia
4
AVIDESIGN, Javorinská 25, 911 01 Trenčín, Slovakia
*
Author to whom correspondence should be addressed.
Buildings 2023, 13(1), 183; https://doi.org/10.3390/buildings13010183
Submission received: 3 August 2022 / Revised: 27 December 2022 / Accepted: 28 December 2022 / Published: 10 January 2023
(This article belongs to the Special Issue Sustainable Architecture and Construction Infrastructure)

Abstract

:
This article deals with the investigation of wind effects on a façade of a rectangular residential building with explicit modelling of the windows for specific wind conditions. The external wind pressure coefficients were treated on the façade and at the places of the window sills, linings, and lintel for the direction of the wind from 0° to 90° with increments of 22.5°. For a detailed analysis, the CFD simulation using Ansys Fluent was used. The method selected for the CFD simulation solution and its setting (quality of meshing, horizontal homogeneity of the boundary layer, etc.) were verified by known results of similar objects. The purpose of this analysis is to show how important it is to consider wind effects to determine the suitable placement of passive ventilation devices. Research shows the potential optimal position of ventilation units in terms of favourable pressure distribution. Zones with negative pressure and corners or façades in a wake are not suitable for applying passive ventilation units. The results can serve as a basis for designers to achieve optimal comfort in residential buildings.

1. Introduction

An increase in air temperature affects the use of buildings; natural ventilation and air-conditioning is needed. The distribution of wind velocity around the building can significantly change the efficiency of natural ventilation. New materials, advances in technologies, requirements of investors, total dimensions and slopes of building sites, ideas of architects, and challenges of engineers have a significant influence on the design of atypically shaped structures and the determination of their colossal heights. There is wind tunnel testing, CFD. Their design seems problematic because the information mentioned in the standards is insufficient. The best solution is the combination of both. Thus, basic experimental measurements can be made in a wind tunnel laboratory (or in situ), and the results obtained can be used to set and verify the CFD simulation. After that, CFD simulation can be used for other similar calculations, detailed analyses, and solutions to particular problems. The active or passive (natural) ventilation system ensures thermal and acoustic comfort and air quality in residential buildings. There are central or decentral systems. We aim to evaluate the decentral systems installed on the façade of the building. The effectiveness of this ventilation affects the pressure differences between the internal and external spaces. The wind enormously changes the external pressure distribution on the façade. Our goal is to create the initial simplified form that represents the rectangular-sectioned building. Decentral systems are installed in the window sills, linings, or lintel. The experimental approach does not allow the physical installation of the pressure taps in the window sill in the scaled model. We used the verified and validated CFD simulation to model windows with linings and sills. An overview of the literature indicates that the problem of the location of the trickle vents in the window solution has not received much attention. The actual wind boundary conditions and the building geometries were selected. The building is situated in the area of the Slovak Republic in urban conditions. Especially in today’s era of renovating older buildings, this is a necessary topic to address. We want to contribute to the state of knowledge with our article.

2. Literature Review

As mentioned in [1], most people live in urban areas and spend 90% of their time in offices, homes, schools, shopping centers, etc. Several types of research have confirmed that air quality in cities is decreasing annually. In [1], the authors wrote about the parameter of low indoor air quality, which leads to sick building syndrome and significantly affects people’s health. They provided a lot of information on natural ventilation and mechanical ventilation. Their research focuses on trickle vents, known as background ventilators and natural ventilation devices, which can be integrated into external walls and windows. Therefore, the air in interior spaces has to be monitored and artificially modified by different devices, e.g., air washer, humidifier, dehumidifier, air ionizer, etc.
The main topic of [2] is also natural ventilation. The authors assume that the full potential of natural ventilation is not utilized, especially in high-rise and medium-rise buildings. The balconies should be used to guide airflow into the spaces to moderate the indoor ambient air, increase thermal comfort, and reduce the need for mechanical ventilation. The design and methods for evaluating its effectiveness in utilizing natural ventilation are discussed in detail. Different natural ventilation strategies and passive design elements (windows, chimneys, courtyards, etc.) are analyzed. The environmental consequences of the use of various technologies that are more or less needed and climate changes are discussed. The article contains a comprehensive review of the literature.
Natural ventilation as a tool for passive cooling of buildings, improving indoor air quality, and low-energy building strategy is the topic of [3]. As mentioned in [4], natural ventilation is an integral part of the Low-Energy Building Strategy, but it has several problems. The CFD simulation of the windows with two different dimensions (10% and 25% of the floor area) was analyzed. Various wind directions were considered. The pressure coefficients and air change rates per hour were calculated. This article deals with the ventilation strategy and aerodynamic behavior of purpose-provided openings (PPO). Provides valuable information about the determination of different types of flows through several outlets. It is noted in this study that the techniques for modelling actual openings are flawed and create systematic errors in performance predictions. An extended review of the literature, including theoretical information and different studies, is also listed.
The influence of window ventilation behavior on the temperature of interior spaces is investigated in [5]. This research was repeated in several chosen flats in different residential buildings. They differ from each other in both external and internal design. The window ventilation behavior also affects the performance of ventilation units used in buildings.
The totality shape of the building and the façade design impact the external pressure distribution of the indoor air quality air. It seems from the available literature that better design of buildings, especially the façade of a building, can lead to better utilization of natural ventilation. This approach should be a helpful tool to increase building efficiency and decrease service costs. In places where natural ventilation is insufficient, ventilation devices are needed. The authors of [6] investigated various alternatives for a façade: smooth, with horizontal shading (balconies), vertical shading, and egg-crate shading on the critical parameter on the Convective Heat Transfer Coefficient (CHTC). The building was investigated in detail: effects on corners, middle sections, and rooms at different heights. For this purpose, the CFD simulation and the heat transfer simulation were used. This research confirmed that the shading effects significantly influenced the CHTC value, and the direction of the wind caused only a local increase in this value. Regarding this fact, the optimal design of the glazed façade should be considered because it provides a beautiful view and sufficient light in interior spaces. Still, on the other hand, it has a weak thermal performance creating high heating and cooling loads. The other paper dealing with the appropriate design of the façade of a tall building is [7]. The modified double-skin façade (often used by architects for its better properties compared to standard solutions) is under the interest of the authors. Four different configurations of a double skin façade with and without vertical openings are presented. For this investigation, wind tunnel tests were performed. The shape of the building has a crucial impact on the pressure distribution on the façade. This paper also confirms that the pressure distribution is affected by the cladding used. This results in different air flows in the internal space and natural ventilation. Modification of the shape of the building or installation of the external construction (ribs, double skin, façade appurtenances) can lead to optimization of pressure distribution. Façade surfaces in high-rise buildings substantially affect positive peak pressure [8]. Further research [9] analyzed the effect of horizontal and vertical ribs on local and overall wind loads. Continuous horizontal ribs fixed on the windward side of the square-section building reduce the height of the stagnation point. Vertical ribs have an impact on the intensity of turbulence. The double skin transparent façade [10] is another high efficiency system to improve the natural ventilation of the building for energy saving purposes. Further geometric modifications are the balconies. They modify the recirculation zones near the façade and the pressure distribution with respect to the direction of the wind. Balconies create multiple separations of flow from the surface [11]. The authors in the cited article evaluated this phenomenon with the CFD approach for LES and RANS models. The demand for low-energy and energy-saving architecture leads to the design of the autonomous system in buildings. One of them is the intelligent façade. The ventilation system is an integral part of this green deal. Aerodynamic modification can strongly optimize the demand for it. In [12], aerodynamic change, surface roughness effects, available bioinspired approaches, and potential morphing material capabilities were investigated to understand the flow control mechanism of such systems, which can lead to innovative façade system designs.
The results of the analyses of the wind distribution on the façade impact the design of the trickle vents. As is already known, these units are placed in the lining, window sill, and lintel space, or mounted on the window frame. Biler et al. [1] published a detailed review of trickle vent performance and studies. Various ventilation rate regimes for passive ventilation systems represented by trickle vents lead to demand-controlled ventilation (DCV). The meta-analysis included various studies in the research by Guyot et al. [13]. However, it is necessary to know the wind conditions to fit and check the unit correctly.
CFD simulation is a handy tool for modelling wind flow around the structures, but it can also be used to predict air flow inside the objects. The problem is the setting of CFD simulation, selection of the turbulence model, and using appropriate input parameters. In [14], four of the most used different models (SST k-ω based model, standard k-ε, the RNG k-ε and the laminar model) were considered for the calculation of airflow velocities and temperatures in the office room. The results obtained were compared with the data from the experimental measurements. All selected models were presented in detail. The authors ascertained a good coincidence between all models and could be used to predict the air velocity and temperature in interior spaces.

3. Research Method, Description of a Building and CFD Calculation Model

3.1. Research Methods

An interdisciplinary approach involving experimental in situ results from a simplified model, which is the basis for CFD validation. Subsequently, the verified numerical model was chosen for a detailed model with window sills and linings. The following method was selected to investigate the pressure distribution on the façade. Analysis for different wind directions. Synthesis of results and comparison of the trend on the façade with the movement near the window construction. Conclusions and suggestions for construction practice. To evaluate the mean value of the pressure, the RANS method (Reynolds averaged Navier-Stokes equations) method was chosen by considering the computational time and complexity of the model with the relevant results. A simulation model was verified by previous research activities [15,16,17]. The results are used to evaluate the position of the trickle vents. The hypothesis is that the functionality of the trickle vent will be affected by negative pressure because the trickle vent provides the air inlet in the building. Negative stress can disrupt the flow. On the other hand, high positive pressure can lead to massive convection flow of cold air in the winter into the interior.

3.2. Residential Building and Input Parameters

The residential building model could be classified as a high-rise building because its total height was more than 30 m and less than 150 m. The full dimensions were (W × L × H)—30 m × 20 m × 35 m; see Figure 1. It represents the panel building constructed of prefabricated pre-prestressed concrete, which took place on a large scale in the last century, and now the renovation of these buildings is underway. Only windows were considered on the façade. The resultant shape of the structure was a cuboid. The total dimensions of the windows were 1.5 m × 1.2 m, and the widths of the window sills and the linings were 250 mm. The horizontal distance between the windows was 2.0 m and the vertical space was 1.6 m. Surrounding objects were not considered in this study—only a standalone entity was investigated. The building was located in Bratislava (Slovakia). The wind load and other input parameters needed for the calculation were defined by [18,19].
Wind flow, wind velocities, and values of wind pressures depend on the wind conditions of a given area, the roughness of the terrain, the aerodynamic parameters of investigated objects, and the dimensions and the shapes of surrounding objects.
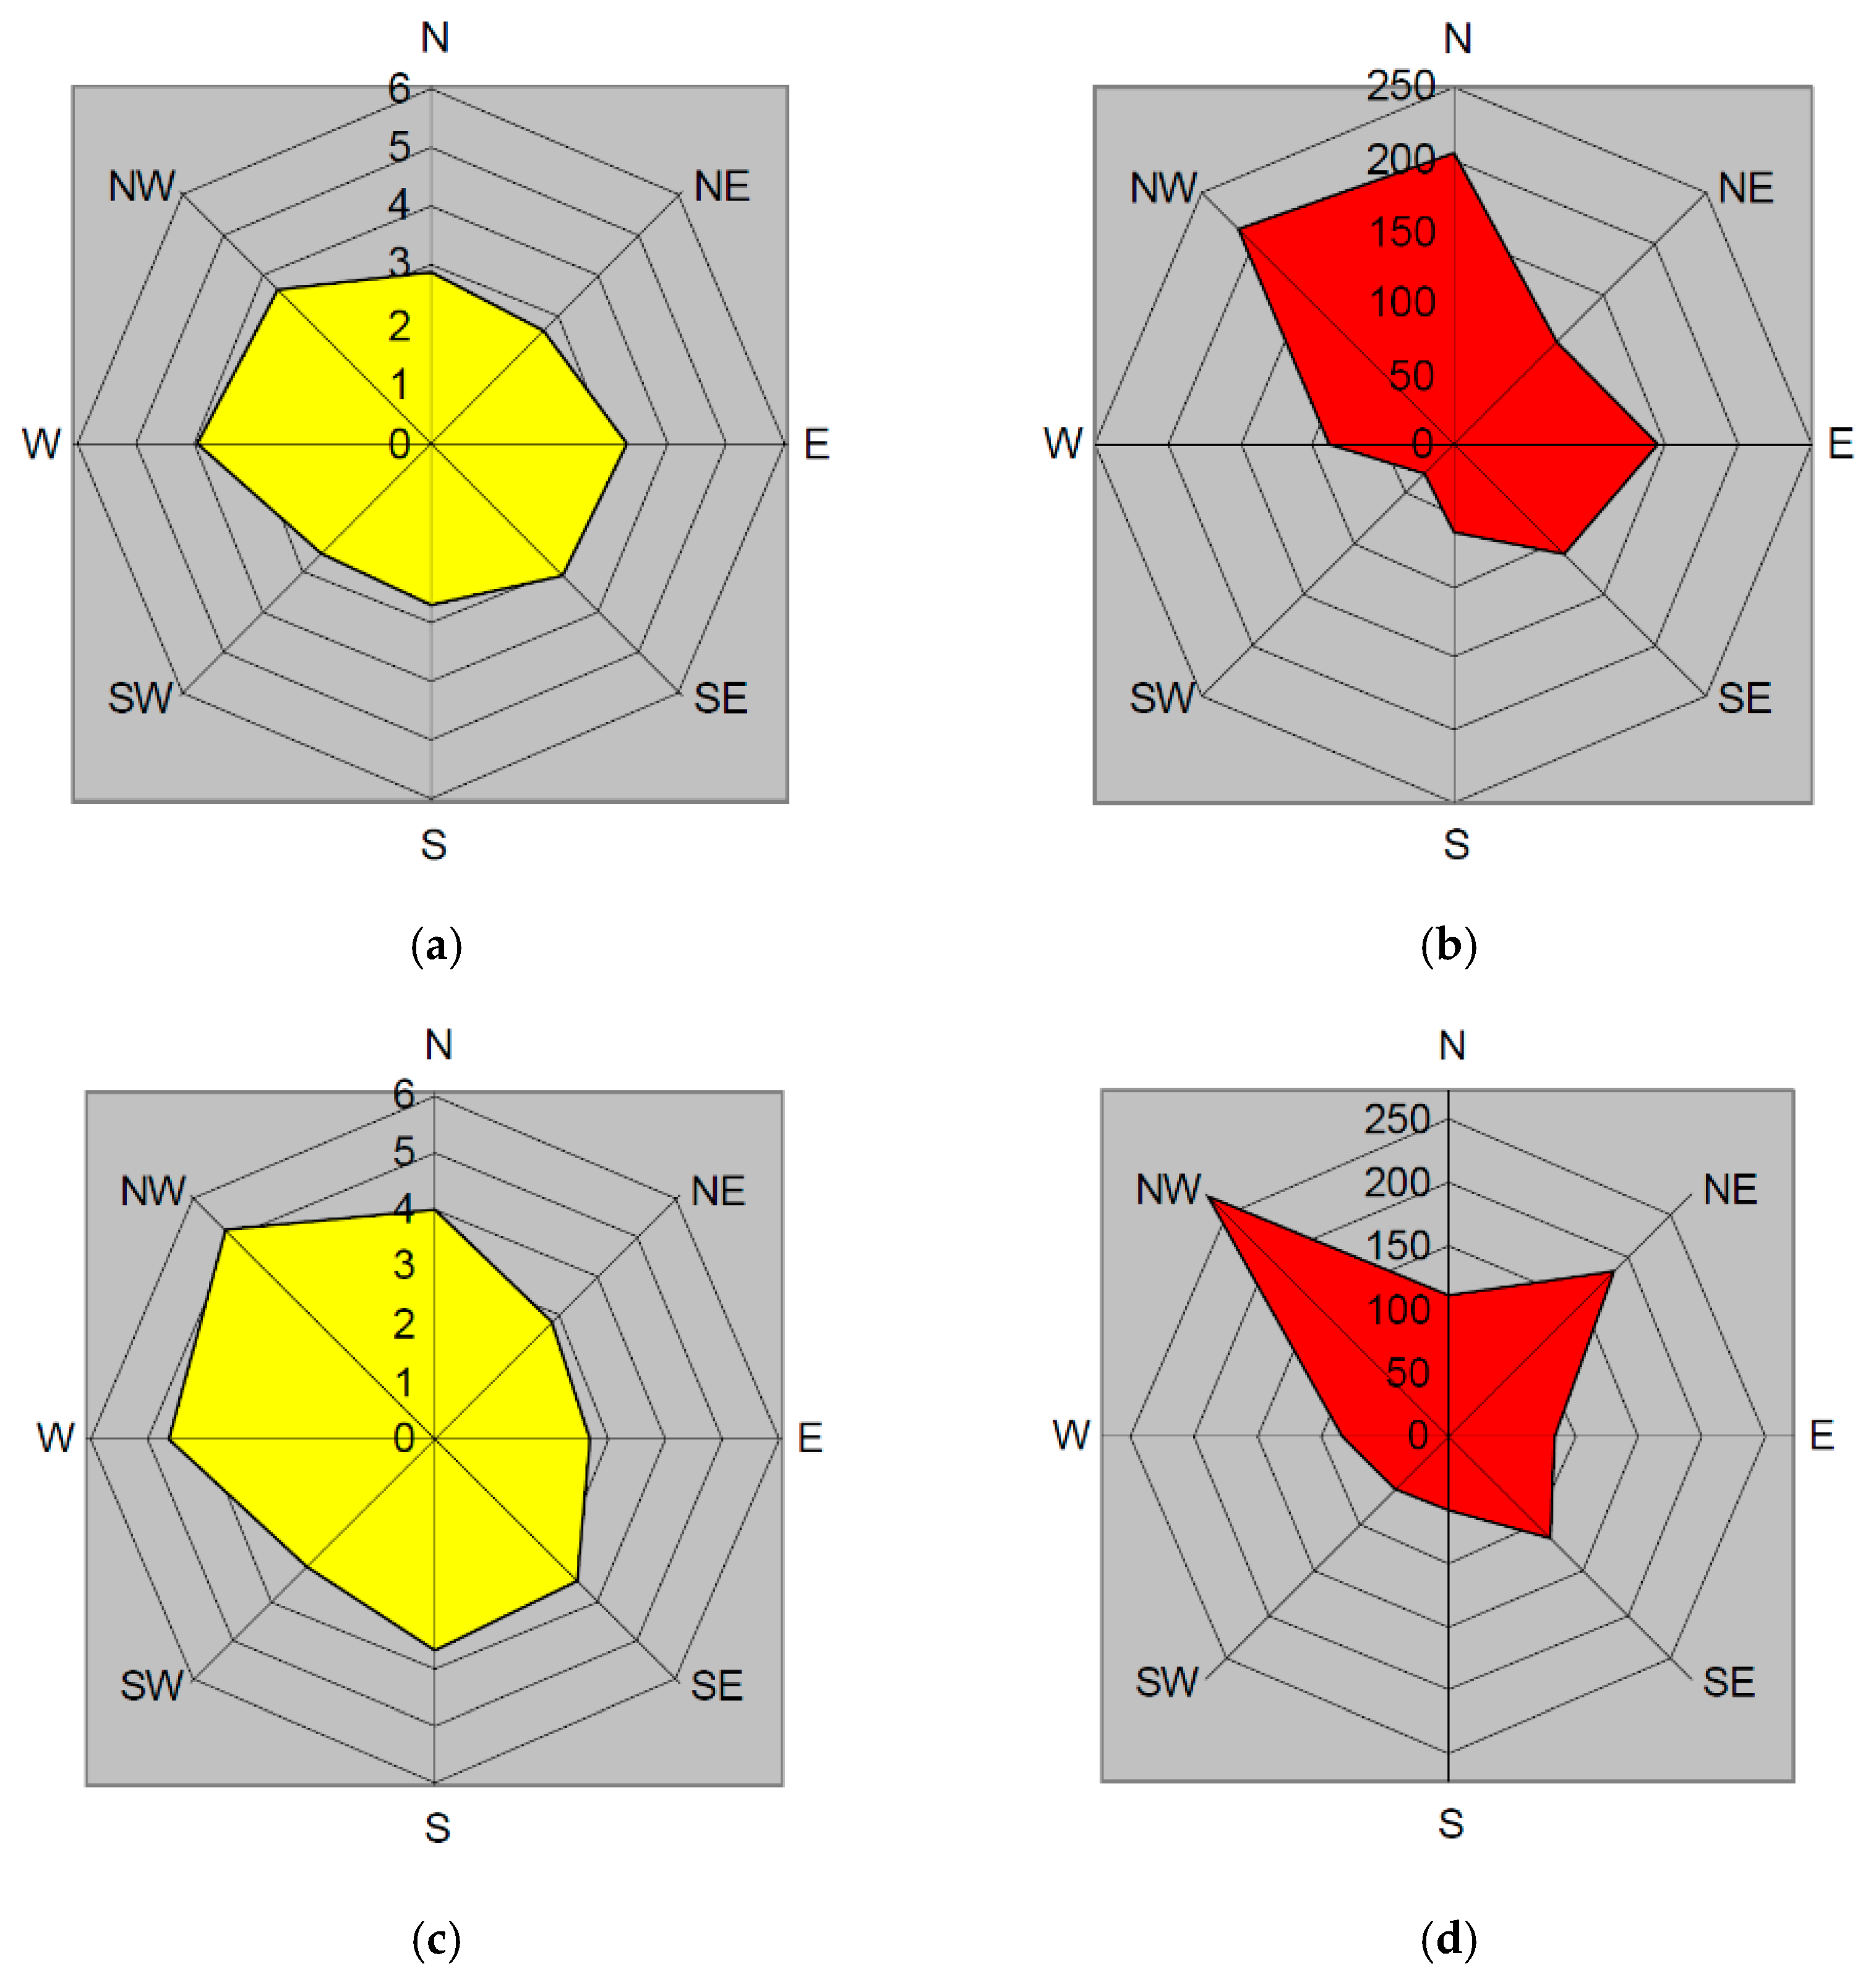
Strong wind effects (wind storms) occurring coincidentally should also be considered in the design of structures. Long-term meteorological measurements record peak values of wind velocities. A critical parameter is also the dominant direction of the wind flow in a given area. This parameter can be determined from the wind direction of the assigned area e.g., [20]. In the case of an investigated residential building located in Bratislava, the dominant trends of wind flow were northwest, north, and northeast, Figure 2.

3.3. CFD Model Created in the Ansys Fluent Software

The program Ansys Fluent was selected because it allows for detailed modelling of structure and its solution. It contains many mathematical models for various applications. For many engineering problems of turbulent wind flow, the statistical models of turbulence based on the method of time-averaging of parameters of turbulence wind flow (RANS-Reynolds Averaged Navier-Stokes equations) and follow-up procedure of time-averaging of balance equations are the most used tools. The set of equations of motion is not closed and is solved together with the collection of additional equations and empirical formulas. This complex of equations is called the model of turbulence. The set of algebraic and partial differential equations creates the numerical model. In the program Ansys Fluent, this set is solved by using the finite-volume method.
For the numerical simulation, the Realizable k-ε model was used. Compared to the standard k-ε model, the Realizable model contains a new formulation for turbulent viscosity and a new transport equation for the dissipation rate. This parameter was derived from an exact equation for the transport of the mean-square vorticity fluctuation. This model satisfies certain mathematical constraints on the Reynolds stresses, consistent with the physics of turbulent flows. The advantage of this model is that it predicts the spreading rate of both planar and round jets with more accuracy. Furthermore, it provides superior performance for flows involving rotation, boundary layers under adverse solid pressure gradients, separation, and recirculation. More information can be found in [21].
It is a double-equation model. The solution of turbulence dynamic viscosity in the equation for Bussinesq’s hypothesis is solved by separated transport equations. It allows us to determine the turbulent kinetic energy k and the dissipation velocity ε.
Selected Realizable k-ε model solves the transport equation for the transfer of turbulence kinematic energy k:
t ( ρ k ) + x i ( ρ k u i ) = x j [ ( μ + μ t σ k ) k x j ] + G k + G b ρ ε Y M + S k
and transport equation for transfer of the velocity of the turbulence kinematic energy dissipation rate ε:
t ( ρ ε ) + x i ( ρ ε u i ) = x j [ ( μ + μ t σ ε ) ε x j ] + ρ C 1 S ε C 2 ρ ε 2 k + υ ε + C 1 ε ε k C 3 ε G b + S ε
where
C 1 = m a x [ 0.43 , η η + 5 ]
η = S k ε
S = 2 S i j S i j
Other information (recommended values of model constants, etc.) and equations used to model turbulent viscosity were considered according to [21].
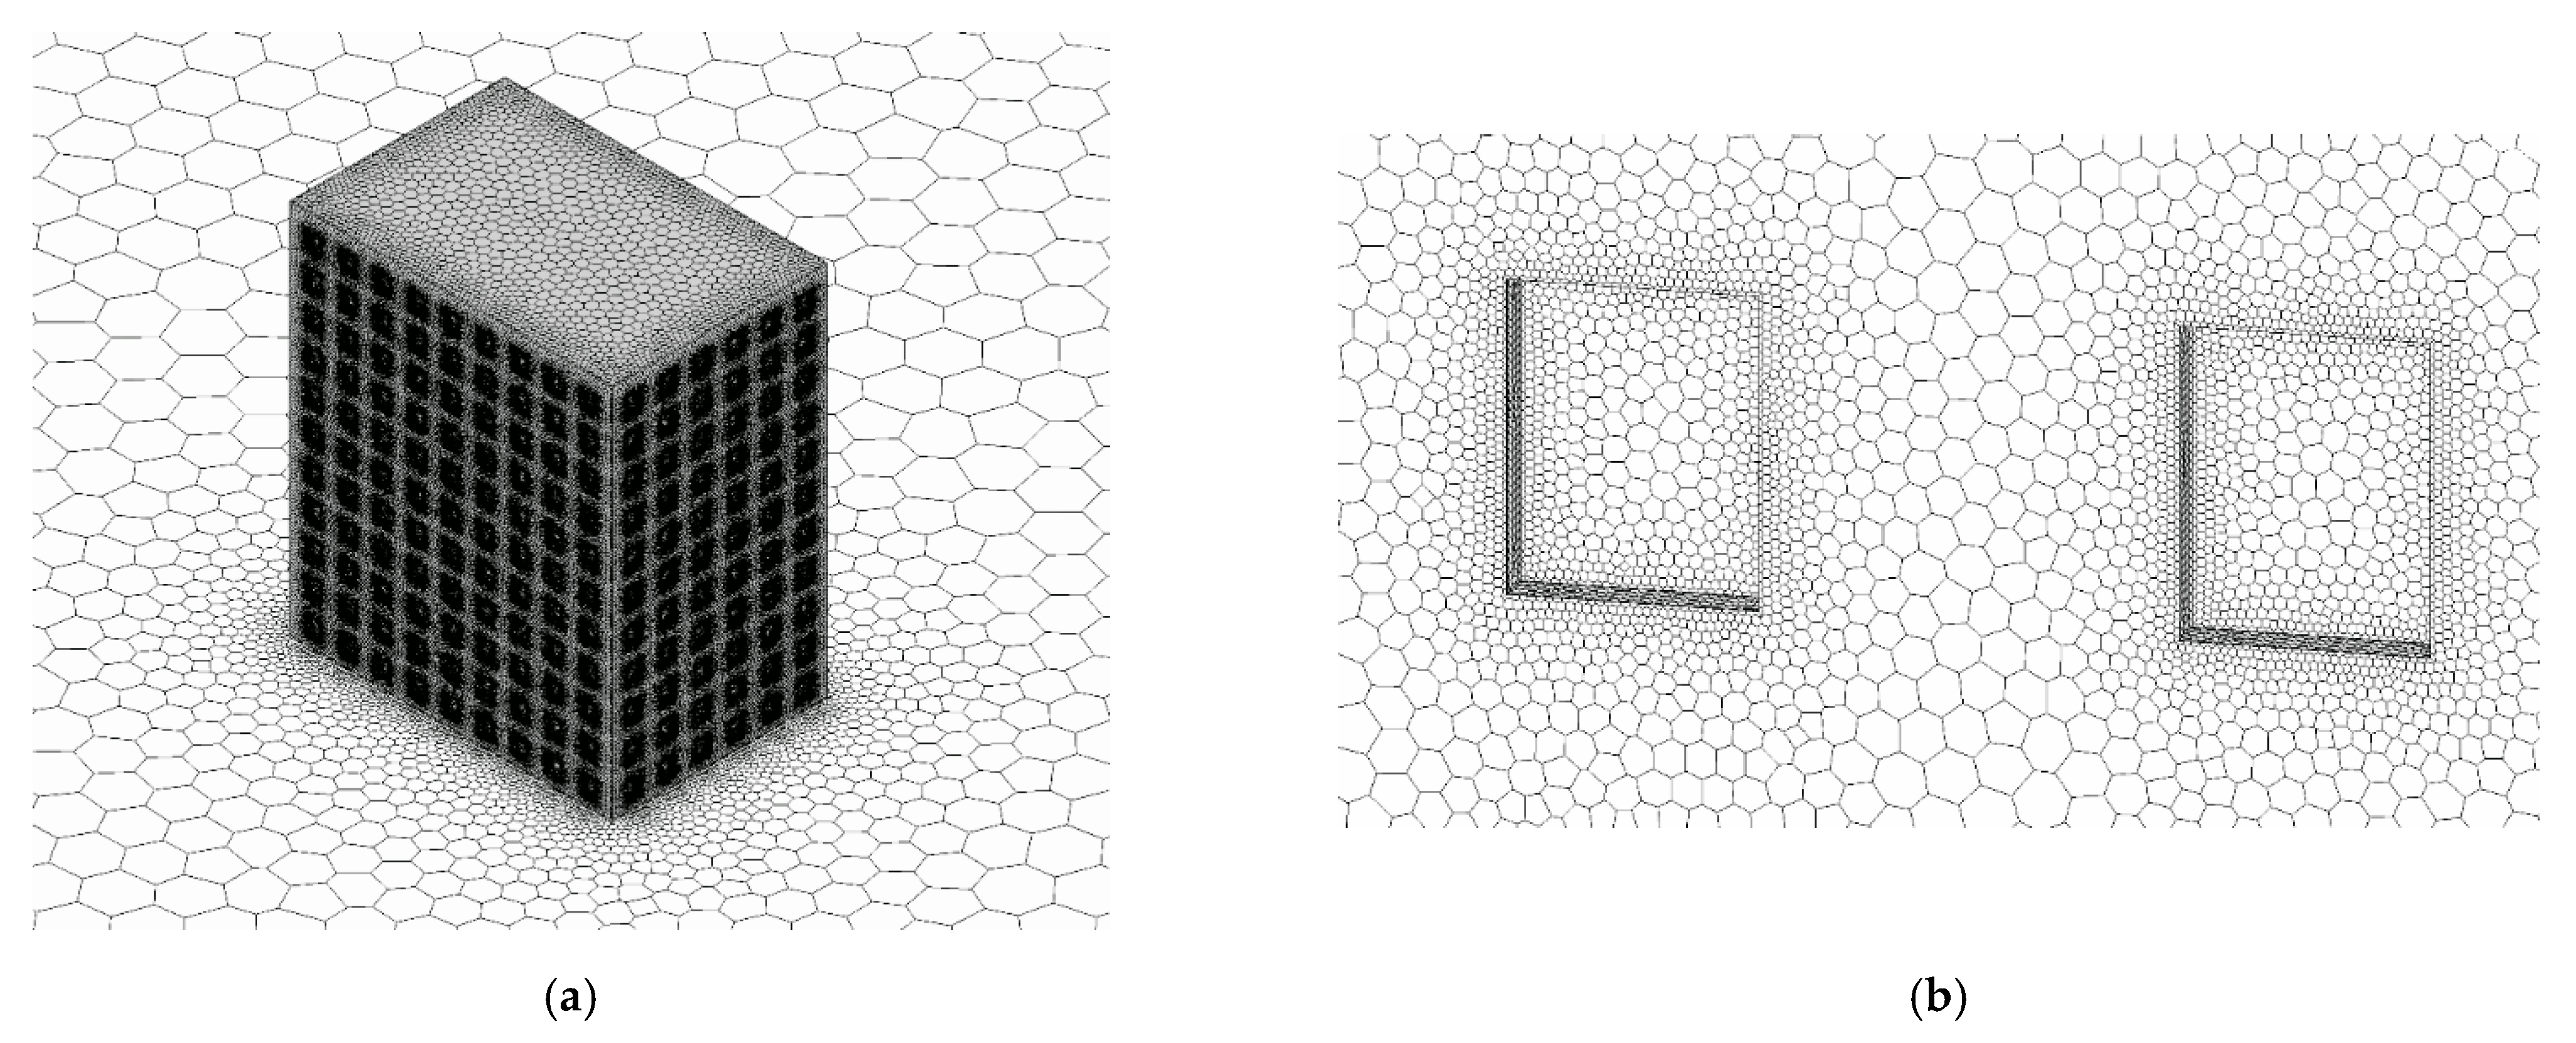
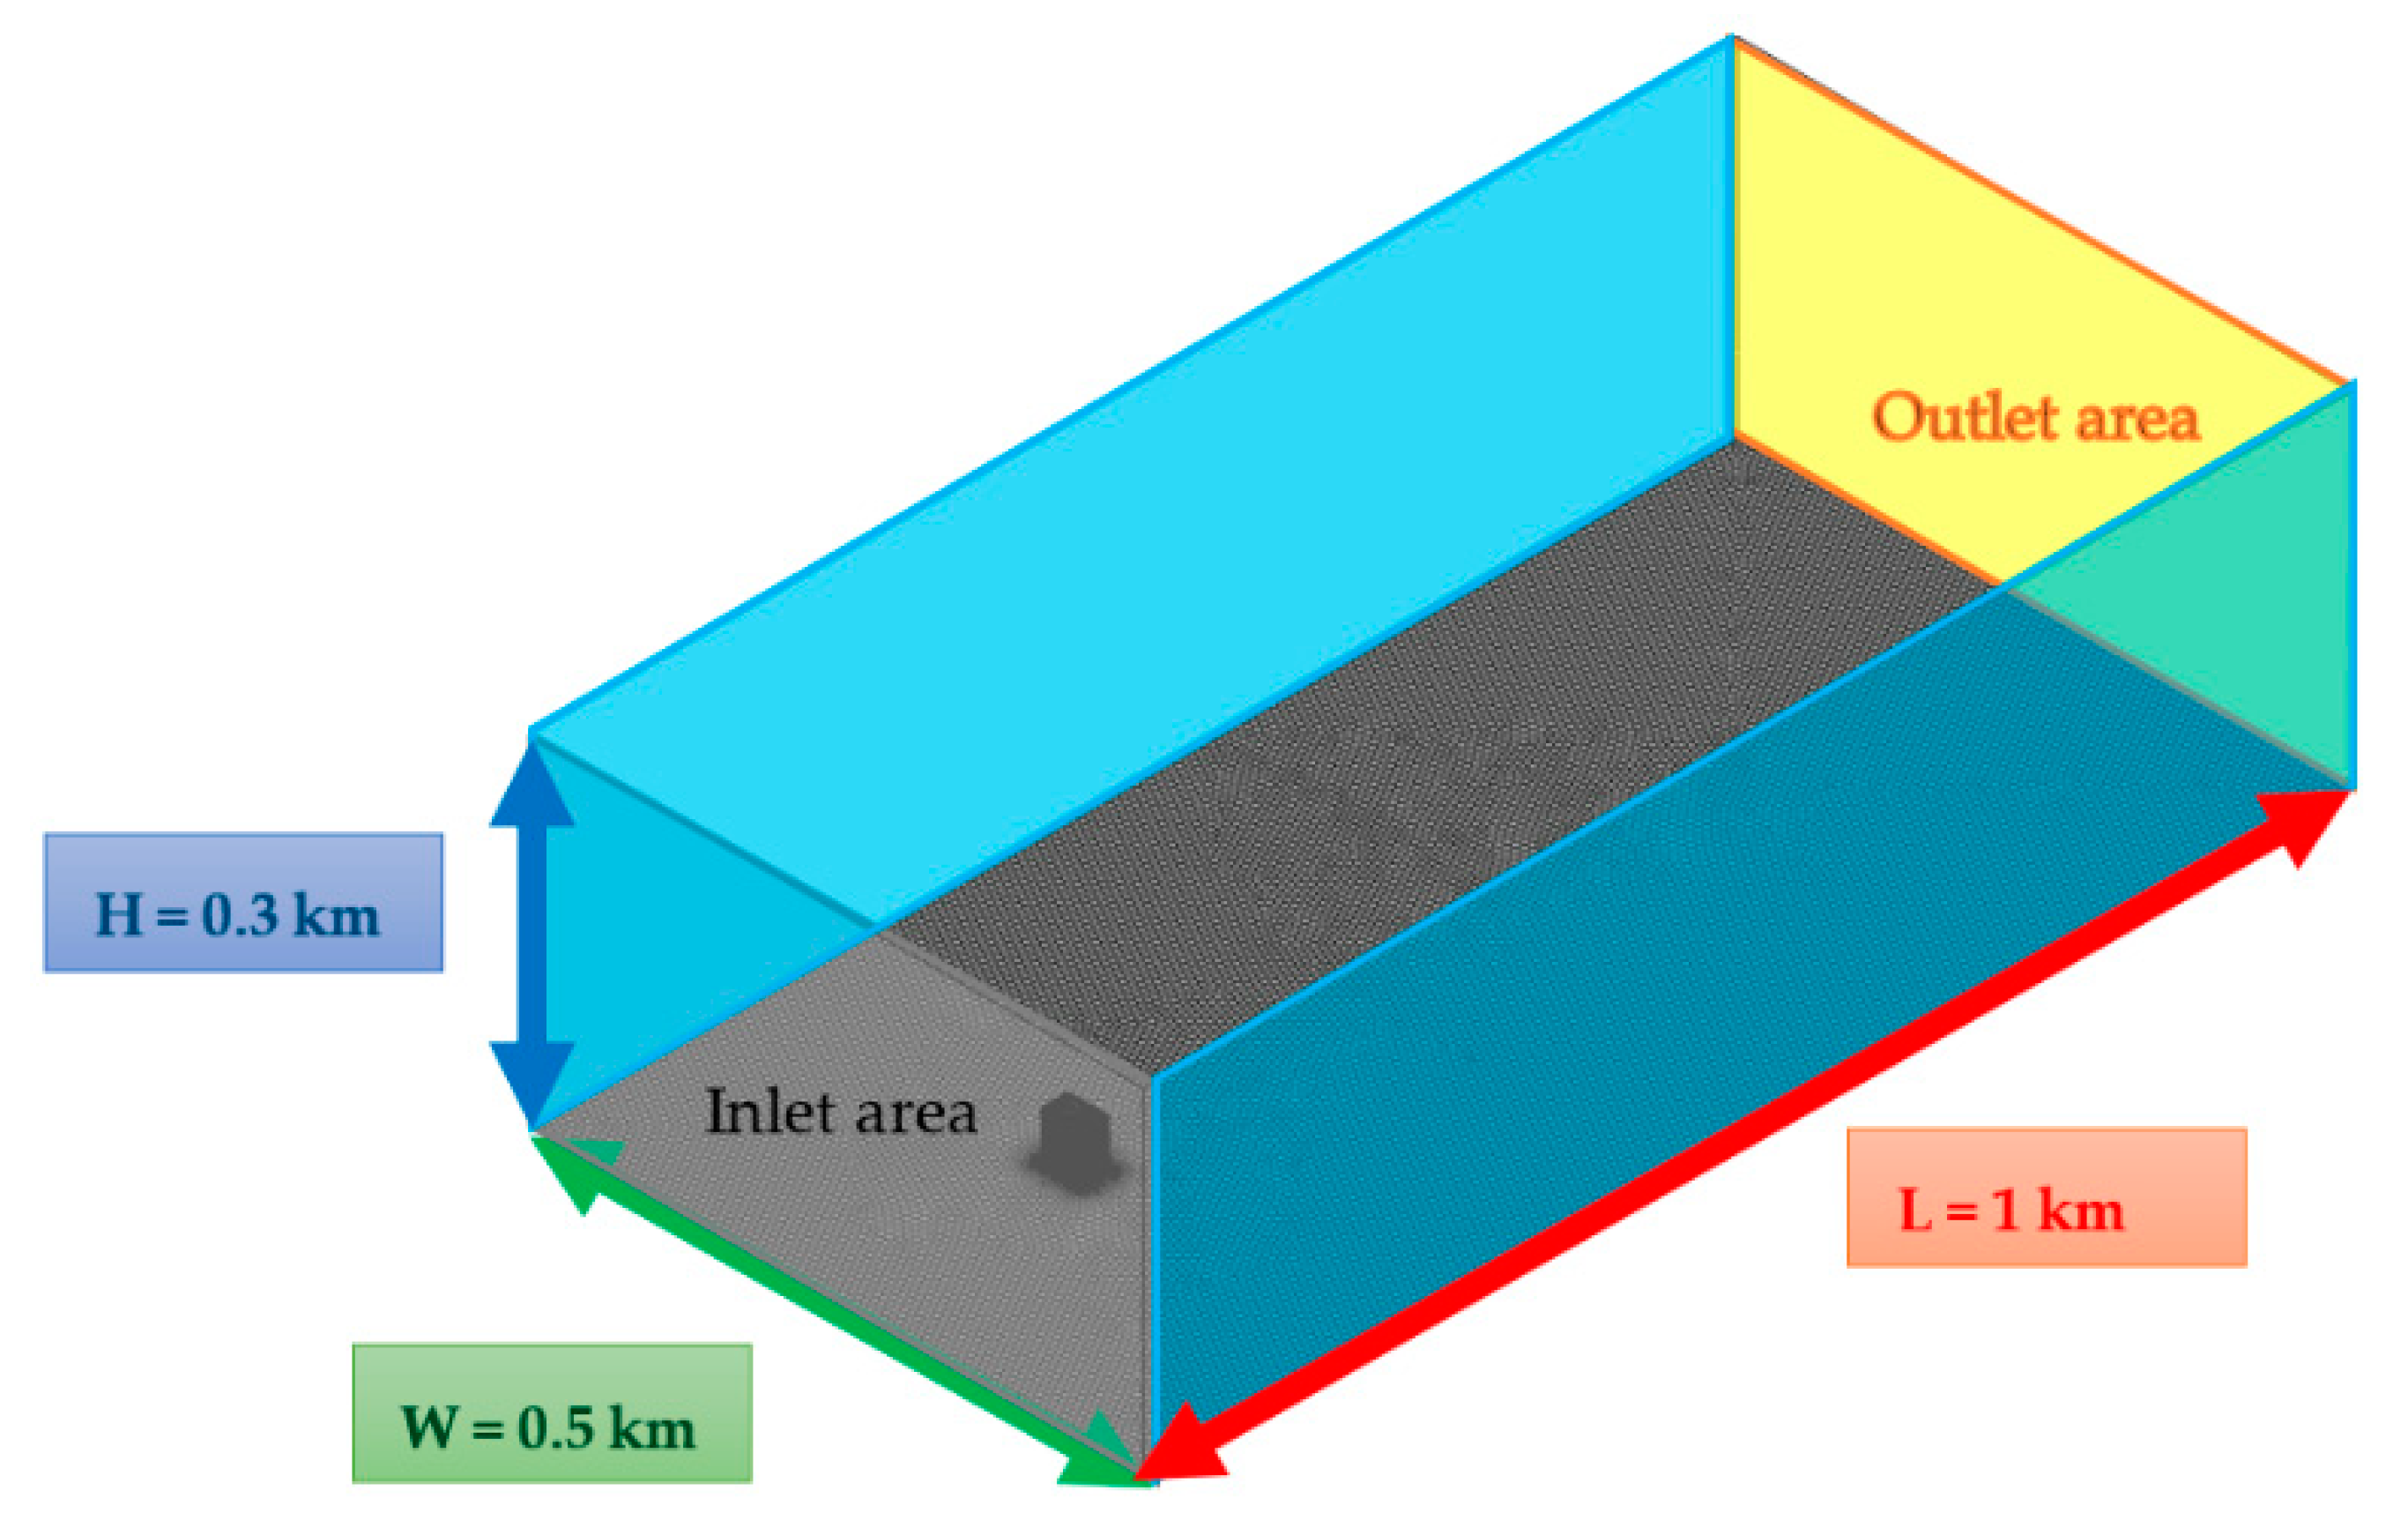
For the CFD simulation, the following input parameters were considered: the model scale was 1:1 (Figure 3), the roughness length for the uniformly constructed area, the total dimensions of the computational domain were 1 km × 0.5 km × 0.3 km (Figure 3) according to the recommendation [22,23]. The ratio of the size of the solved structure to the size of the computational domain should be less than 3%. Then, the results obtained will not be affected by the computational domain boundaries. Hexacore elements were used for meshing. The size of the pieces was 5 m (Figure 3a) and 40 mm in the areas around the windows (Figure 2b). On the bottom side of the computational domain (Figure 4), where the terrain was considered, the inflation function with five layers was applied. The height of the first layer was 0.5 m. This procedure followed all the recommendations to create computational meshing according to [22]. The entire grid had 24,334,678 nodes, Figure 3. The accuracy of the simulation model, which was chosen for this analysis, is explained in the works [15,16,17]. Statistical metrics, according to the creation of Chang and Hanna [24], were used to validate this model.
Boundary conditions were considered as follows. The inlet to the computational domain was defined by the vertical profiles:
v m ( z ) = v κ l n z + z 0 z 0
v = v r e f κ l n z r e f + z 0 z 0
reference wind velocity considered in the height of 35 m above the ground level (the top of the residential building) was equal to 23.25 m·s−1 according to [18,19].
The turbulence in the inlet area was modelled using:
k = u 2 C μ
ε ( z ) = u 3 κ ( z + z 0 )
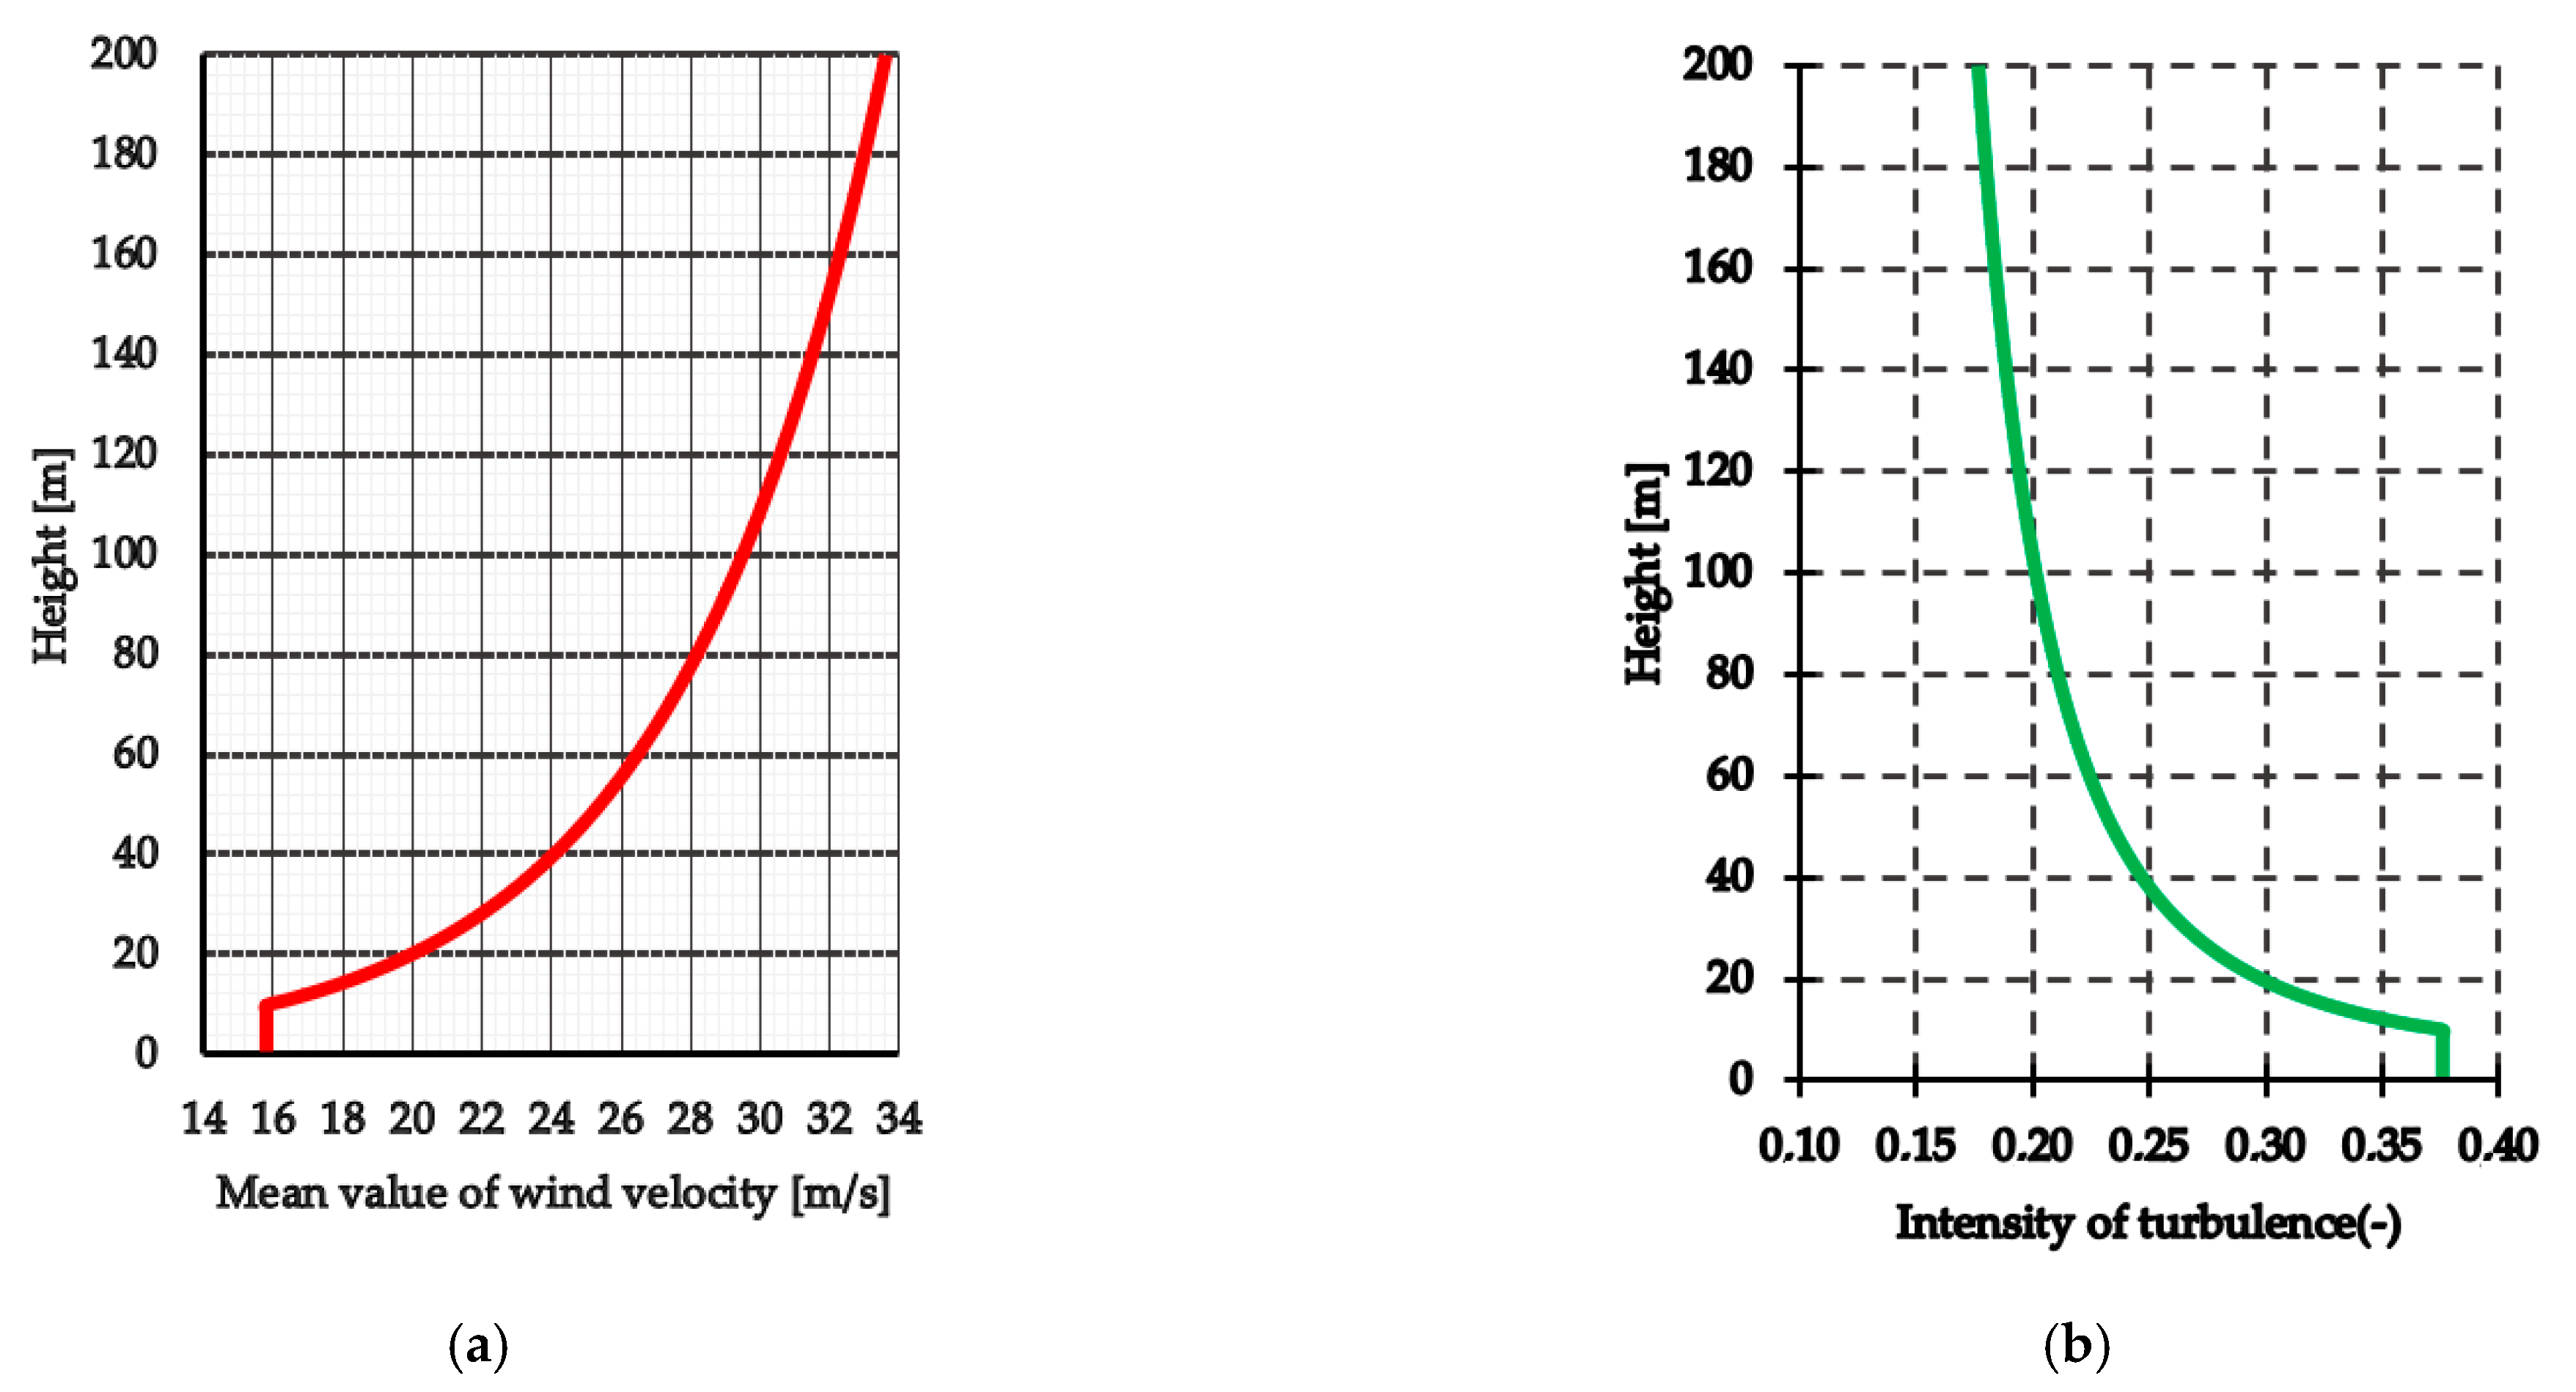
Then, the wind velocity profile and the turbulence profile (Figure 5), according to [18], were created by the boundary conditions mentioned. Wind flow in urban terrain was taken from [18,19] using z0 equal to 0.7. It can be seen in Figure 5a,b that constant values up to 10 m above the ground were considered.
The pressure outflow condition defined the boundary conditions for the outlet area. On both sides of the computational domain, symmetry was applied. The upper boundary was also determined by zero gradients (definition of symmetry). The simulation setting was pressure-based and was solved as a stationary task. The numeric scheme was set simply as pressure-velocity dependence with the discretization of the second order without relaxation. For solutions, hybrid initialization was used. Regarding the used RANS and the Realizable k-ε model, only the mean values of the external pressure coefficients cpe are presented in the paper.

3.4. Calculation of the External Pressure Coefficients and Wind Pressures

The external pressure coefficients cpe [-] were calculated as follows:
c p e = p C F D p R E F
p r e f = 0.5 ρ v r e f 2
The reference wind velocity at the top of the building (H = 35 m) is equal to 23.25 m/s. These values were determined according to [18,19].
The nondimensional values of external pressure coefficients are important for calculation of the values of wind pressures or suctions. These values can be calculated using the following.
we = qp(ze)cpe,
The peak value of the wind pressure at height ze [m] qp(ze) is defined as:
qp(ze) = [1 + 7lv(ze)] 0.5ρ ν2m (ze)

4. SILSOE Cube, Wind Tunnel Testing, and Verification of the CFD Simulation

As mentioned above, there are many possibilities to create and solve 3D computing models in the program Ansys Fluent. Therefore, it is essential to verify results obtained from the calculation with results from wind tunnel testing, in situ measurements, or information from the literature. In our study, the SILSOE cube was chosen for this purpose. It is a similar object, and the results were available from our previous research [25]. In 2013, information on this cube and its testing was used to verify the simulated boundary layer in the Boundary Layer Wind Tunnel (BLWT), which belongs to the Slovak University of Technology in Bratislava. Now, we know that the wind tunnel is set correctly and provides accurate results. Therefore, we can use the same results (external pressure coefficients) to verify the 3D calculation model of the cuboid-shaped residential building.

4.1. The SILSOE Cube in the Scale 1:1

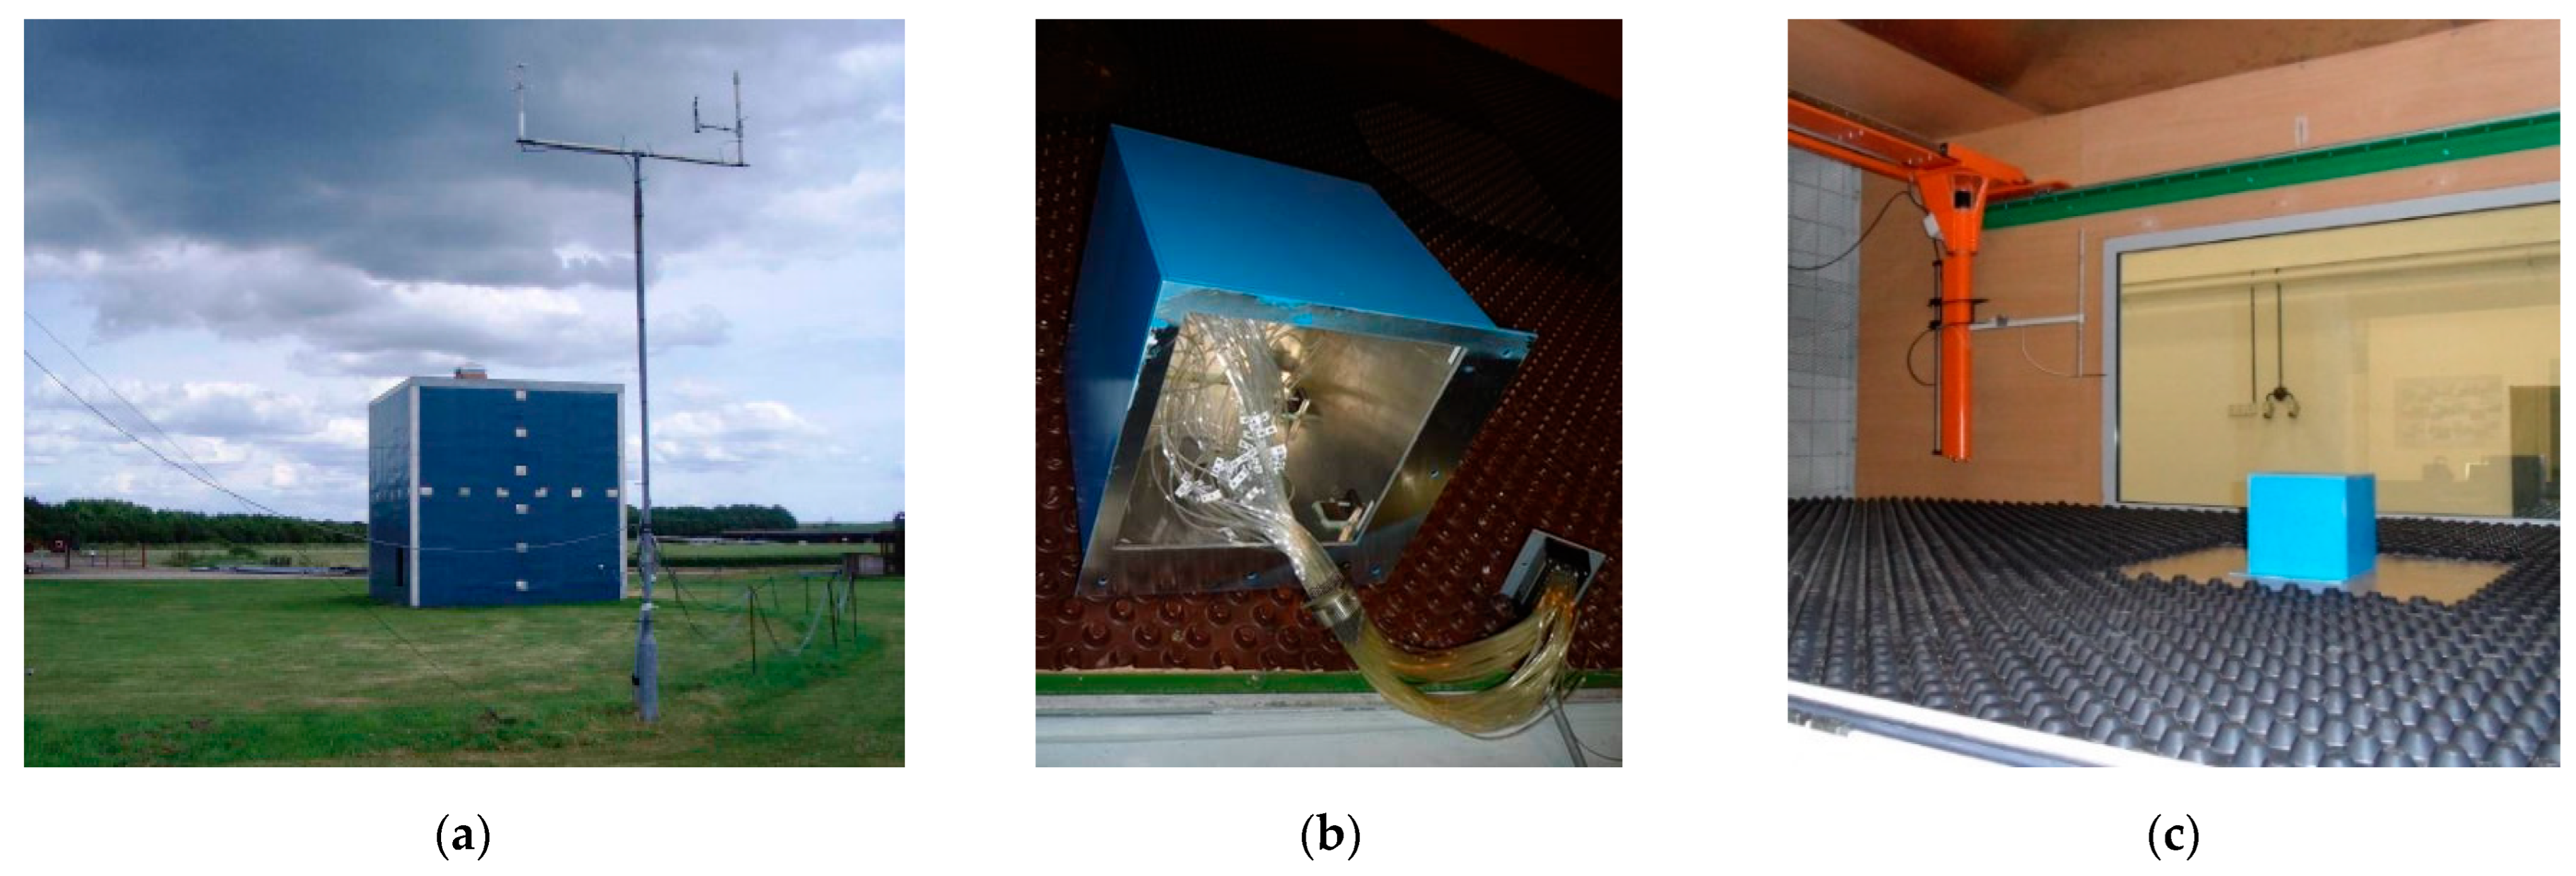
The SILSOE cube (Figure 6a) is a well-known object for many scientists in the area of wind engineering and aerodynamics of structures. Therefore, only a short description is mentioned here. More information can be found in [25,26,27]. This cube was tested directly in situ at the Silsoe Research Institute (England, in 2000). The total dimensions were 6 m × 6 m × 6 m. The cube was located in open terrain (only a few trees), classified as category II terrain [18]. In this case, the effective roughness length of the landscape z0 was 0.006 to 0.01 m due to relatively flat terrain with periodic skipping. Therefore, it was impossible to consider the typical parameters for terrain category II. Other essential parameters: The Jensen number (h/z0) of the SILSOE cube was 600 to 1000, and the intensity of turbulence was 19–20% at the top of the cube. The walls and roof of the cube were smooth. Six pressure taps were placed in the middle of the wall in the horizontal and vertical directions. The top was divided into four quadrants. In each quadrant, 30 pressure taps were placed. The cube was rotated by increments of 15°. The reference velocity was measured at 6 m (the top of the cube).

4.2. The Model of the SILSOE Cube in Scale 1:30

The SILSOE cube model (Figure 5b) was tested in two wind tunnels—certified VZLÚ tunnel in Prague (Výzkumný a zkušební letecký ústav, a.s.) and BLWT in Bratislava (Figure 6c). The model material was a duralumin plate with a thickness of 3 mm. Pressure taps were made using short brass tubes (the external diameter was 1.2 mm, the internal diameter was 0.6 mm, and the length was 30 mm). These brass tubes were fixed to the holes in the cube’s walls with special methacrylate glue. Vinyl tubes (external diameter 1.68 mm, internal diameter 0.86 mm) were placed at the ends of brass tubes. All vinyl tubes were connected to the special 19F460 pneumatic connector (Scanivalve). More information can be found in [25].

4.3. BLWT in Bratislava and Methodology of the Testing of SILSOE Cube Model

BLWT in Bratislava was built and put into operation in 2013. Information on construction, measurement devices, and application areas can be found as follows [29,30]. The wind pressures on the model were estimated using a 64-channel ESP-64HD Miniature Electronic Pressure (Pressure systems). The reference pressure at the top of the model (the height 200 mm, without model) was measured using a miniCTA hotwire anemometer (Dantec Dynamics). The data obtained were evaluated using LabView software (National Instruments). This value was used for the calculation of the wind velocity. This device was also used for measurements of the vertical profile of the mean value of the longitudinal component of the velocity vector and profile of turbulence intensity (time of size 30 s, sampling frequency 3000 Hz), the spectral density of turbulence energy at the height of 200 mm above the floor of the tunnel (time of measurement 180 s, sampling frequency 25,000 Hz). The Prandtl tube, located on the wall of the wind tunnel, was used as a reference probe during the tests. This device was also used to calibrate the Hot-wire anemometer miniCTA 54T42.
The model of the SILSOE cube was tested for terrain category III [18,19]—areas uniformly covered by vegetation, buildings, or stand-alone barriers with a maximum distance equal to 20 times the fence’s height. In our case, the combination of a wood barrier with a height of 150 mm and a dimpled membrane FASTRADE 20 (the size was 20 mm) was chosen. The measurements were repeated for three values of wind velocity: 5 m/s, 10 m/s, and 15 m/s. The angles of rotation were: 0°, 15°, 22.5°, 30°, 45°, and 67.5°. The sampling frequency was 100 Hz, and the measurement time was 30 s. The mean values of the pressure coefficients were statistically evaluated from all data; more information is given in [25]. The nondimensional value of the Reynolds number was equal to 5.44 × 10³ (reference velocity 4.1 m/s), 1.01 × 10⁴ (reference velocity 7.56 m/s), 1.53 × 10⁴ (reference velocity 11.52 m/s). The barometric pressure was 99,160 Pa, and the air temperature was 16.8 °C during the test.

5. Validation of the CFD Model of the Residential Building Results with SILSOE Cube

5.1. External Pressure Coefficients—Residential Building vs. SILSOE Cube

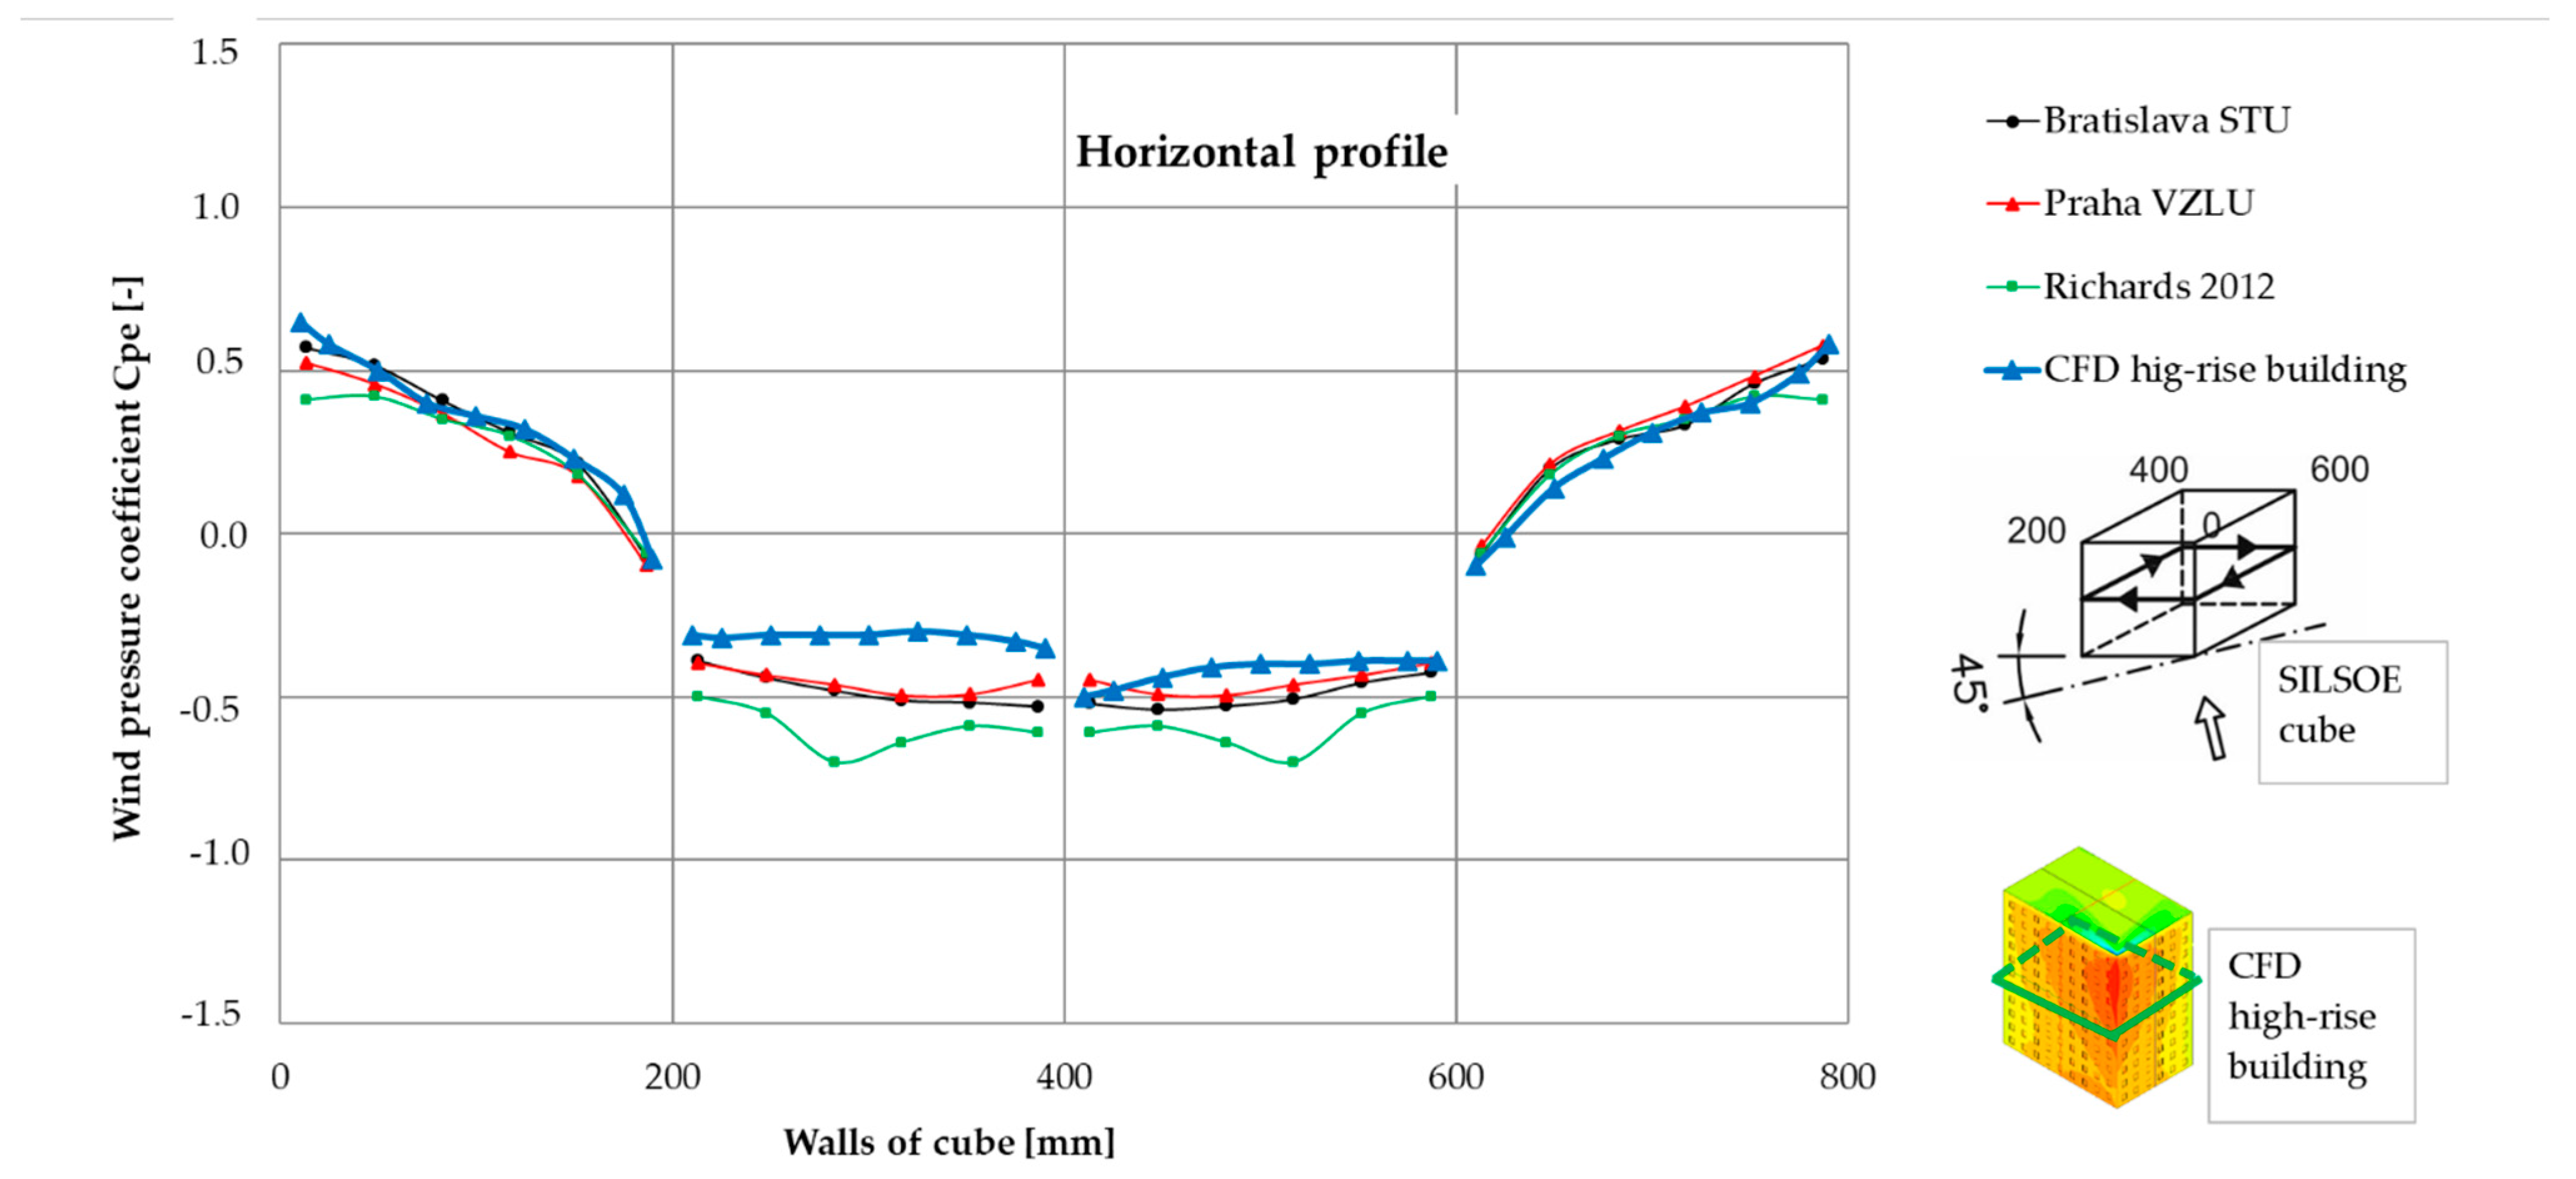
The external pressure coefficients cpe obtained from the residential building CFD model (Figure 6a,b) were compared with the results of the SILSOE cube tested in situ [28] and in wind tunnels. The vertical profile, horizontal profile, and roof were compared for wind direction 45°. A good coincidence in the values was achieved (Figure 7, Figure 8 and Figure 9). Thus, this 3D computing model could be used for other calculations and detailed analysis—determination of wind pressures and suctions in the places of window sills and the lining. The dimensions of the window sills and linings were too small for their implementation in the 3D model tested in a wind tunnel.

5.2. External Pressure Coefficients—Residential Building vs. STN EN 1991-1-4

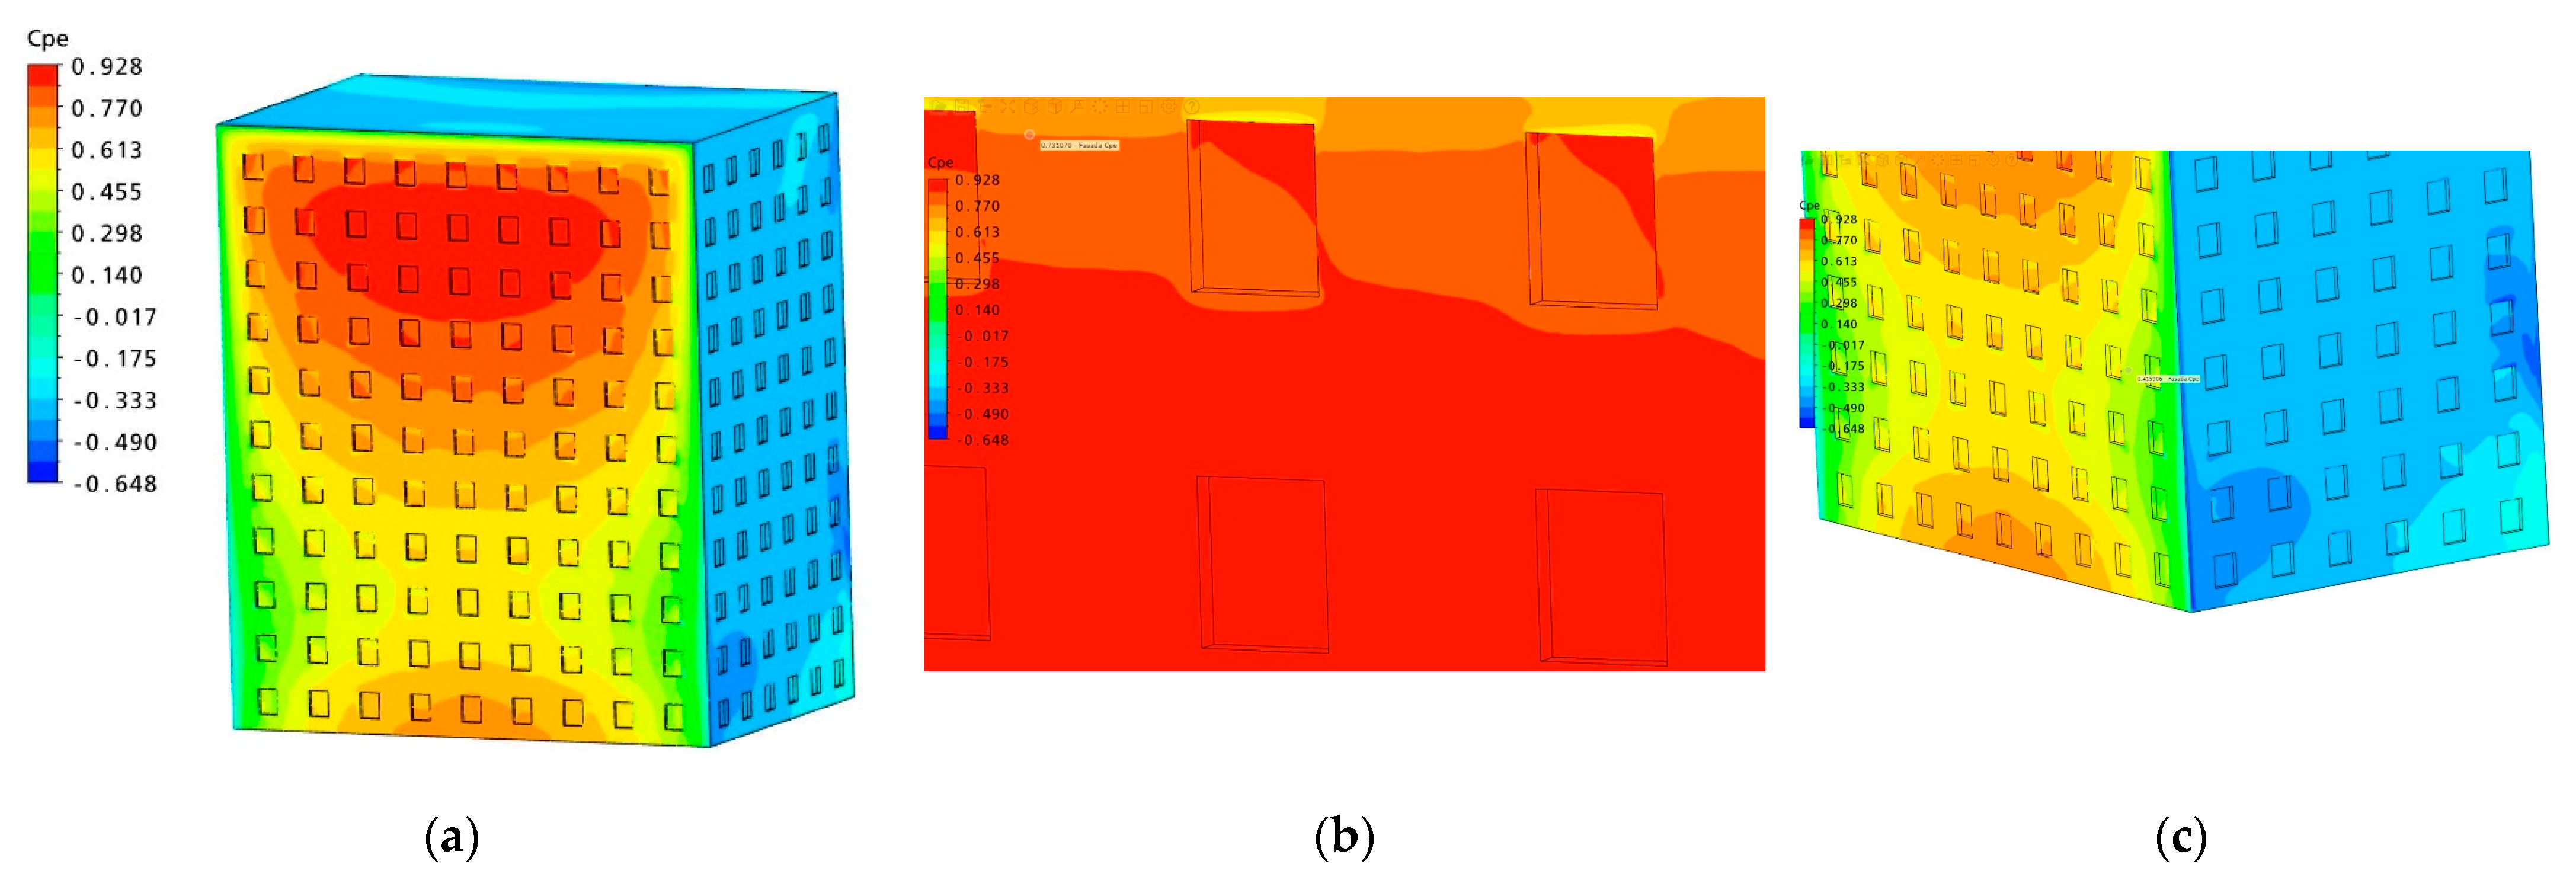
The shape of the building was cuboid. Therefore, the cpe values determined for the 0° wind direction (Figure 10a) could also be compared with the values defined in standards [18,19] (Figure 10c). These values are defined for the entire wall. In the case of all walls, the total area was greater than 10 m2, so cpe,10 was considered. For the windward side, cpe was equal to +0.8. For the leeward side, cpe was −0.5. In the case of side walls (parallel with wind direction), the walls were divided into two parts. For area A, cpe was −1.2 on a length of 6 m. In area B, cpe was −0.8 on the rest of the wall (14 m). From the comparison, it is evident that it is sufficiently safe to consider the values of external pressure coefficients according to the standards of the design or assessment of the structure.
It is important to note that the cpe values on the roof defined in the standards [18,19] were significantly different (for the residential building and the SILSOE cube model). The values mentioned in the standards were more significant, making their use safer. In the cross section of the roof of a residential building, the importance of cpe was: −1.2 for area G (the length was 3 m), −0.7 for area H (the size was 12 m), ±0.2 for area I (the rest of the roof). In the corners (in the areas F, the length was 3 m), the values of cpe were −1.8.

6. Results and Discussion: Detailed Analysis—Window Sills, the Linings and Lintel

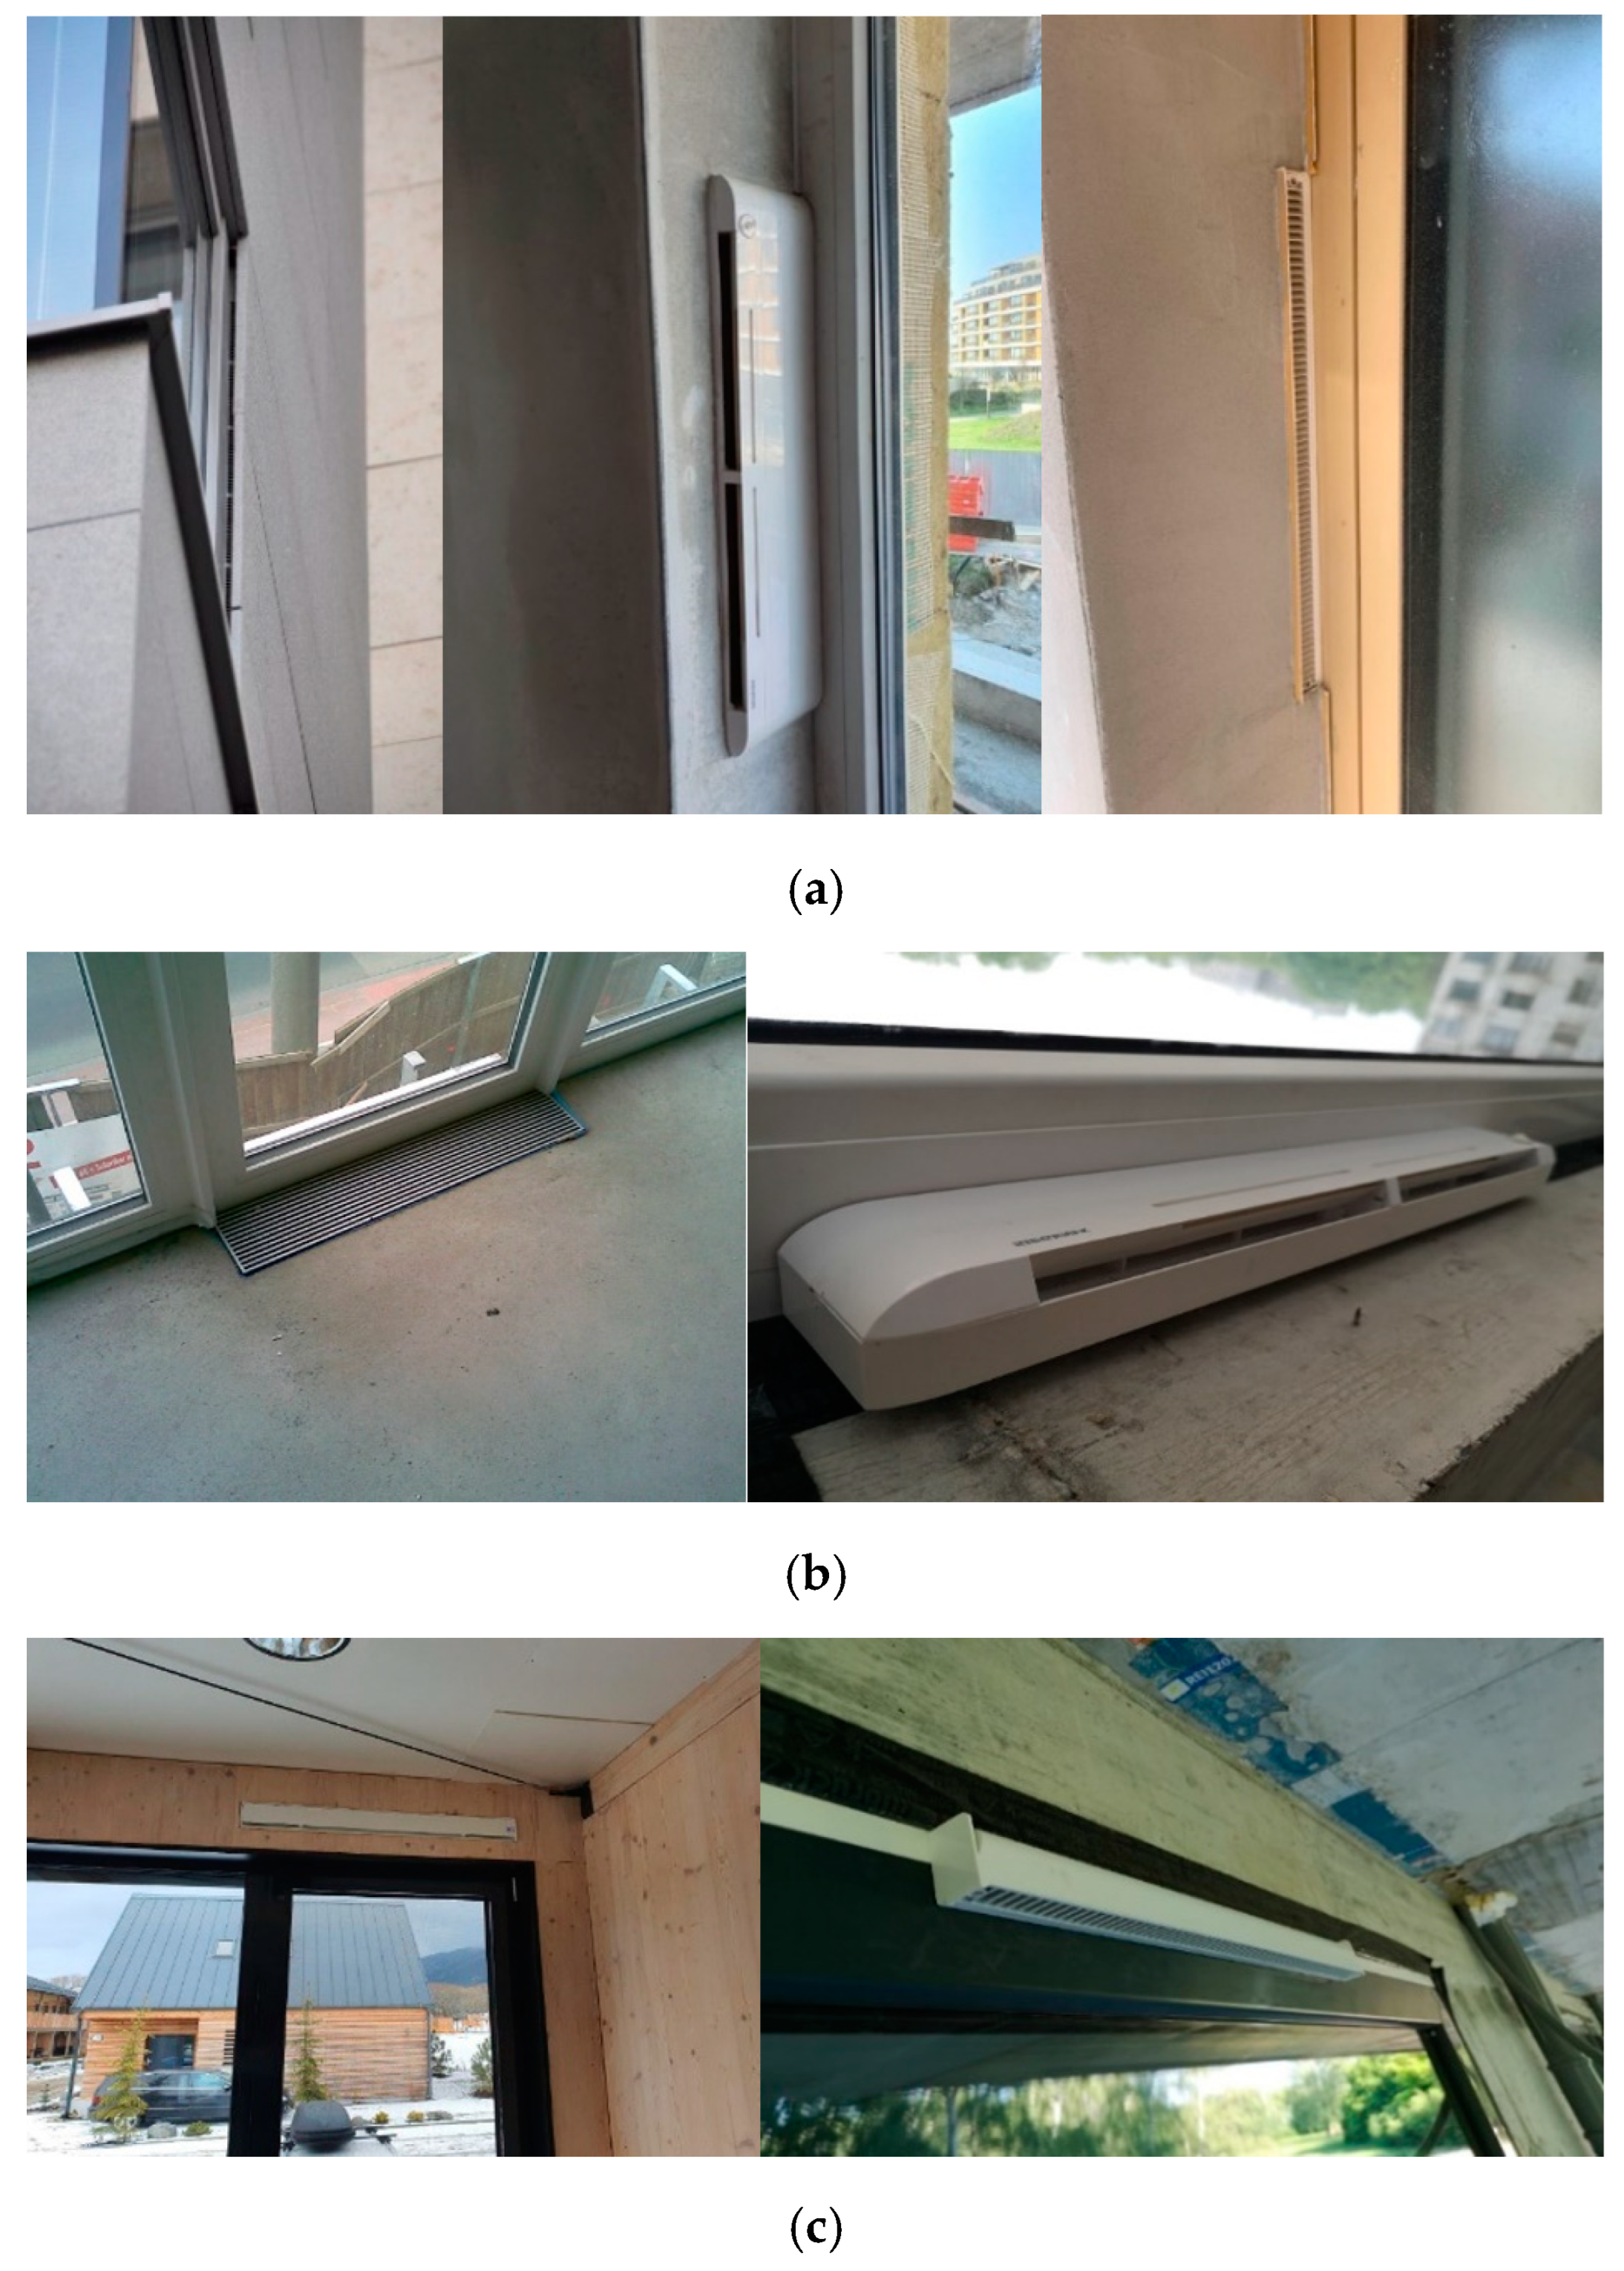
The values of wind pressures in the places of window sills, the linings, and the lintel are essential for the determination of the most suitable sites for air-conditioning units. This study considered passive ventilation systems AEROMAT FLEX, AEROMAT VT WRG 1100, and AEROTUBE DD 110 by SIEGENIA (Figure 11). These devices can be characterized as follows: straightforward, elegant, beautifully designed, small total dimensions, installed vertically or horizontally to external walls or window frames, utilization for forced ventilation in closed spaces. The basic principle of their system functioning is the equalization of pressure between the internal and external environments (the principle of pressure difference). The main requirement is that the ventilation ports cannot be covered, and air can be flown into/from the internal/external space. In the case of extreme climate conditions, the following unfavorable states can occur such as making condensate water, function restriction (in the case of suction, the air is not inlet to the internal space, but the reverse process is launched), and an increase of noise. The best places are where the wind pressures are (but not extreme pressures). In areas where extreme wind pressures occur, these devices are overloaded. Then they close and uncomfortable conditions are in the interior. When considering the dominant direction of the wind in a given area and the position of buildings, it is possible to find suitable places to place air- conditioning devices.

6.1. Wind Direction 0°

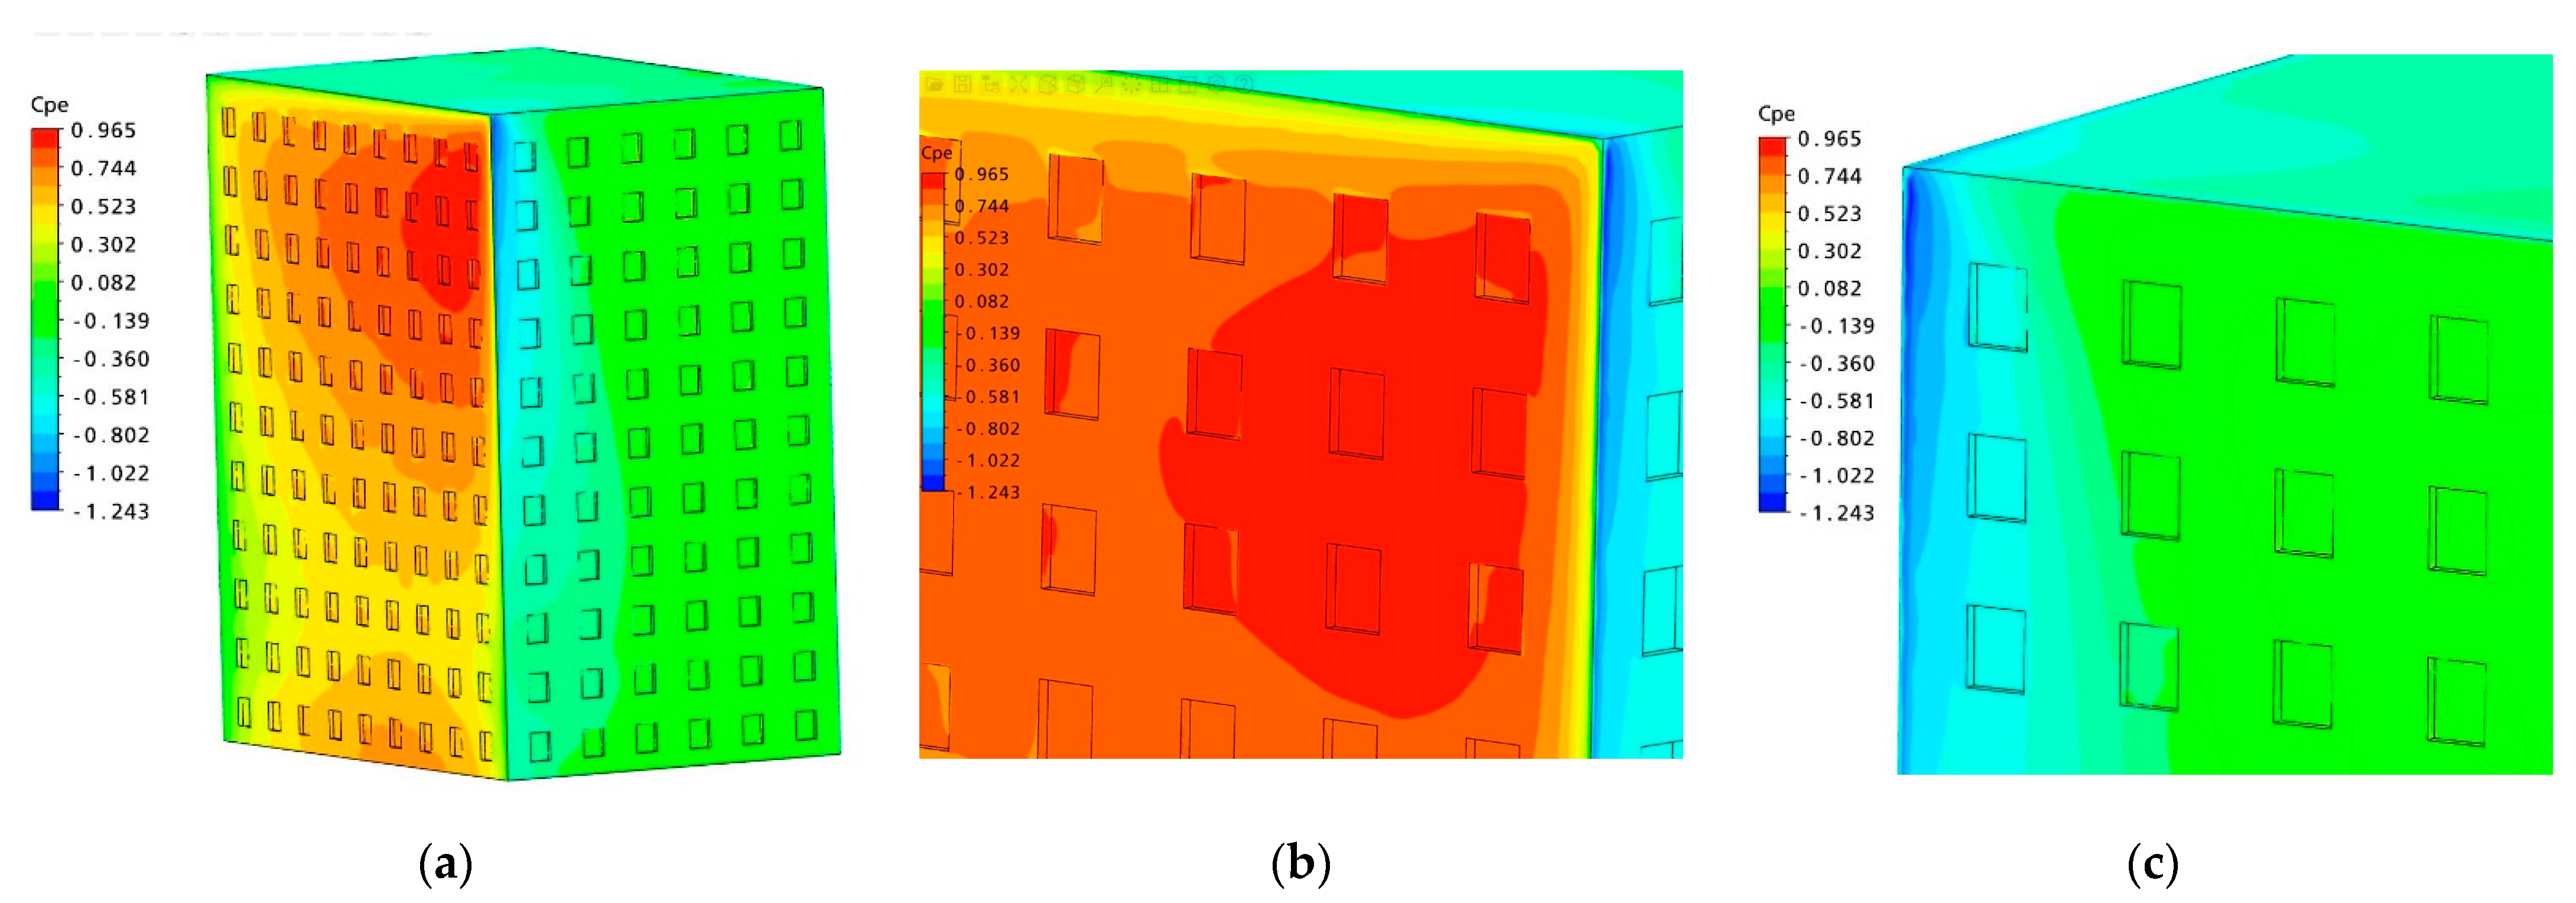
Façade A is almost entirely in the positive pressure zone. The extreme values are in the upper part cpe = 0.89. From the point of view of passive ventilation, we do not recommend the installation of these units in the extreme positive zone of pressure. The optimal position is in the site according to the labels from the green to the yellow area (Figure 12a). Zones where the pressure distribution on the window does not copy the façade pattern must be specially treated (Figure 12a,c). Negative values occur only near the corner. This negative zone is outside the windows (Figure 12a). The other three façades B, C, and D, are in the negative pressure zone. The extreme values are in the corners where the acceleration and separation of the flow occur cpe = −0.53 (Figure 12c). We recommend replacing passive ventilation in these zones with forced ventilation.

6.2. Wind Direction 22.5°

Façade A is almost entirely in the positive pressure zone. The extreme values are in the upper right part cpe = 0.91. From the point of view of passive ventilation, we do not recommend the installation of these units in the extreme positive zone of pressure. The optimal position is in the site according to the labels from the green to the yellow area (Figure 13a). Zones where the pressure distribution on the window does not copy the façade pattern must be specially treated (Figure 13a,c). Negative values occur only near the corner. This negative zone interferes with the windows (Figure 13a). The other three façades B, C, and D, are in the negative pressure zone. The extreme values are in the corners, where the acceleration and separation of the flow occur cpe = −1.19 (Figure 13c). We recommend replacing passive ventilation in these zones with forced ventilation.

6.3. Wind Direction 45°

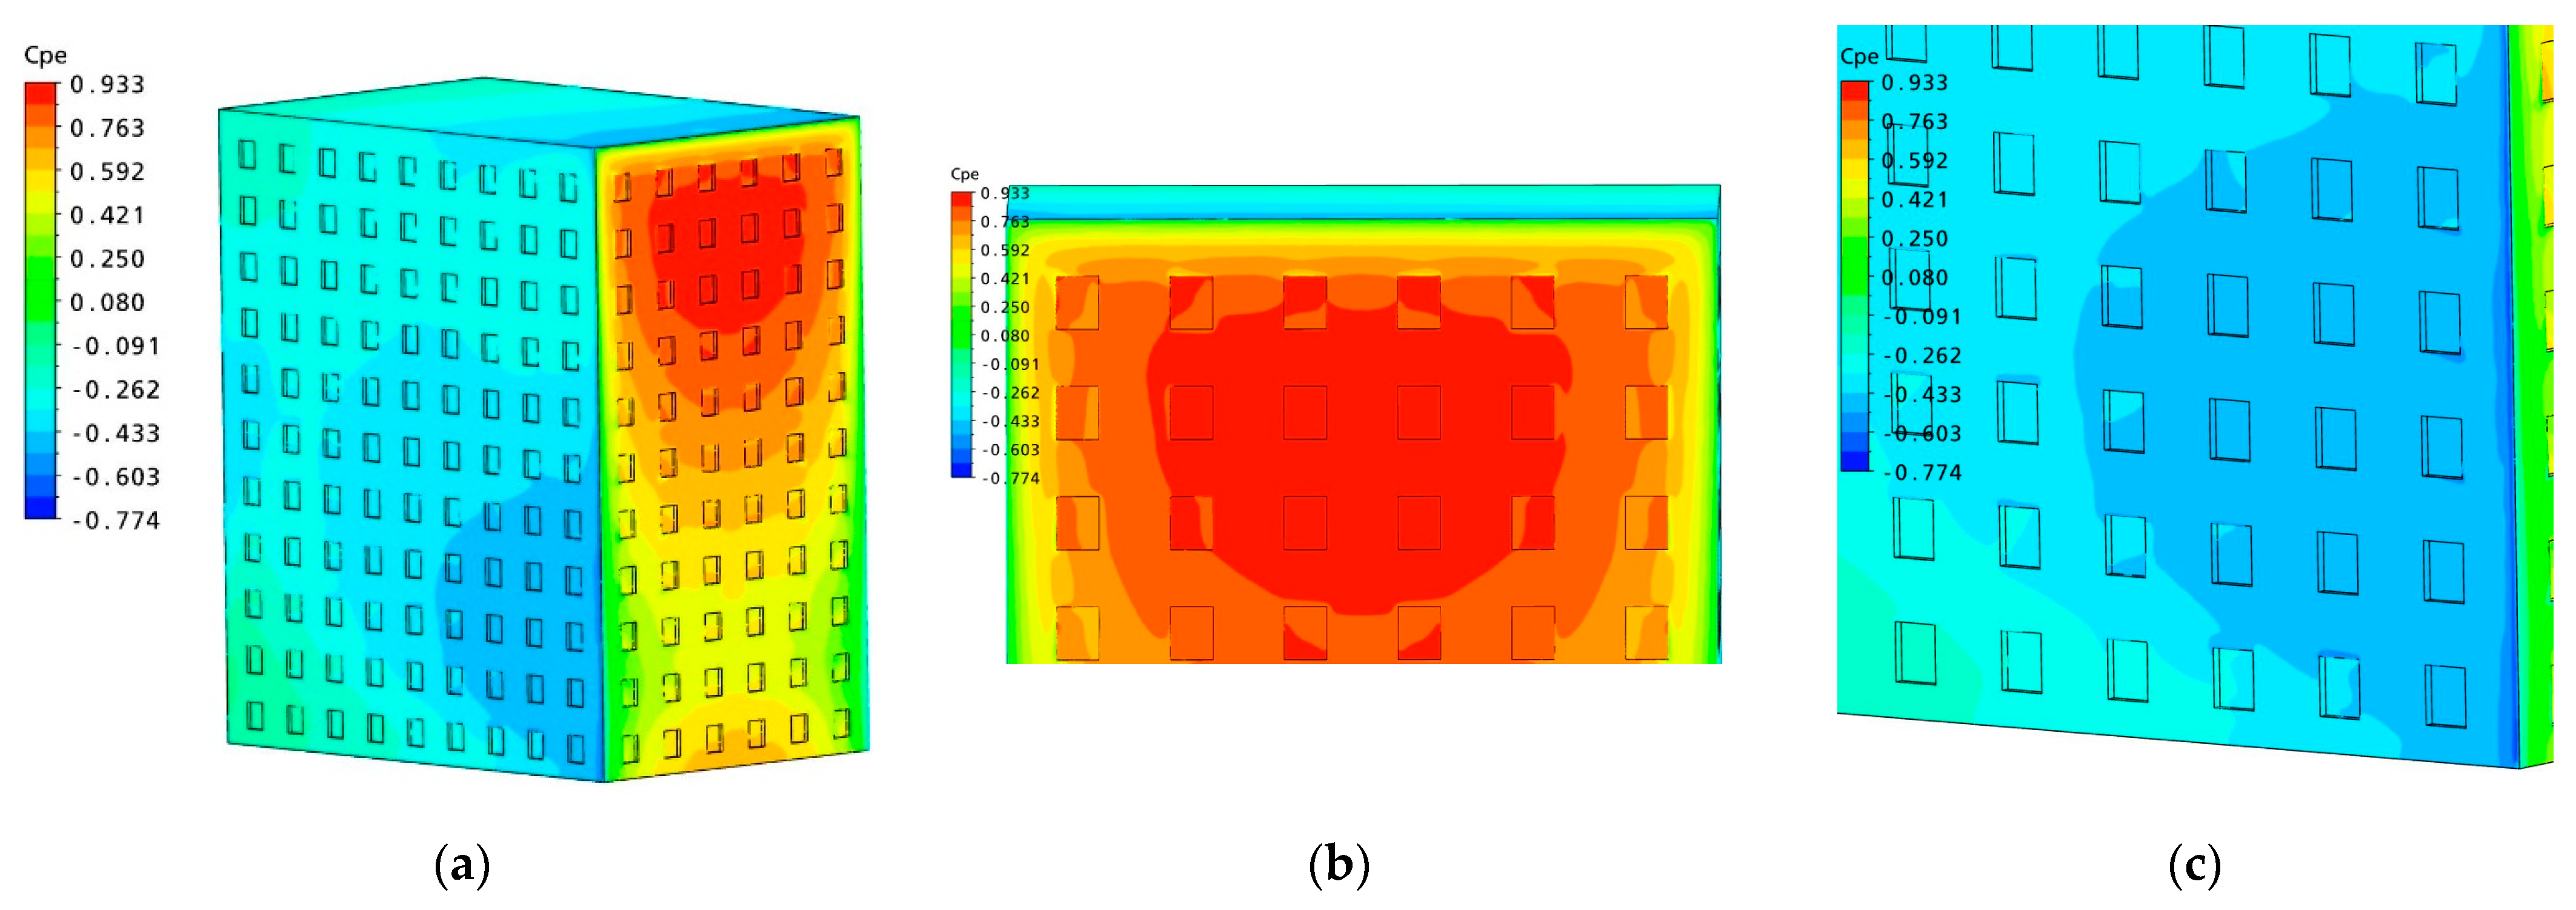
Façades A and B are almost totally in the positive pressure zone. The extreme values are in the windward corner cpe = 0.87. From the point of view of passive ventilation, we do not recommend the installation of these units in the extreme positive zone of pressure. The optimal position is in the site according to the labels from the green to yellow area (Figure 14a). Zones where the pressure distribution on the window does not copy the façade pattern must be specially treated (Figure 14a,c). Negative values occur only in façades B and D. The extreme values are near the corners, where the acceleration and separation of the flow occur cpe = −0.55 (Figure 14c). We recommend replacing passive ventilation in these zones with forced ventilation.

6.4. Wind Direction 67.5°

Façade C is almost completely in the positive pressure zone. The extreme values are in the upper left part cpe = 0.89. From the point of view of passive ventilation, we do not recommend the installation of these units in the extreme positive zone of pressure. The optimal position is at the site according to the labels from the green to the yellow area (Figure 15a). Zones where the pressure distribution on the window does not copy the façade pattern must be specially treated (Figure 15a,c). Negative values occur only near the upper part of the corner. The other three façades A, B, and D, are in the negative pressure zone. Extreme values are in the corners, where the acceleration and separation of the flow occur cpe = −1.04 (Figure 15c). We recommend replacing passive ventilation in these zones with forced ventilation.

6.5. Wind Direction 90°

Façade C is almost completely in the positive pressure zone. The extreme values are in the upper part cpe = 0.89. From the point of view of passive ventilation, we do not recommend the installation of these units in the extreme positive zone of pressure. The optimal position is at the site according to the labels from green to yellow (Figure 16a). Zones must be specially treated where the pressure distribution on the window does not copy the façade pattern (Figure 16a,c). Minimum negative values occur only in close proximity to the lower part of the corner (Figure 16c). The other three façades A, B, and D, are in the negative pressure zone. Extreme values are in the corners, where the flow acceleration and separation occur cpe = −0.65 (Figure 12c). We recommend replacing passive ventilation in these zones with forced ventilation.
The results are summarized in Table 1. The table includes maximum positive and minimum negative cpe for the façade compared with the window sill, lining and lintel. The pressure values also include the name of the façade, where the extreme occurs. Windows are partially protected from minimum negative pressure, which follows from Table 1. Because they are not located on the corners of the building. The distribution of positive pressure in the windows is similar to the façade. The window sill, lining, and lintel have the same extremes for the same wind directions. The same applies to the position on the façade. However, there are zones where the negative and positive pressure distribution on the window does not copy the façade pattern (Figure 12b,c, Figure 13b,c, Figure 14b,c, Figure 15b,c and Figure 16b,c). These zones must be specially treated.

7. Conclusions and Discussions

Nondimensional values of external pressure coefficients are essential for calculating wind pressures. If these values are multiplied by the mean value of the wind pressure in height equal to the total size of the structure, the typical values of the wind pressures in the system are calculated. However, if the values of pressure coefficients are multiplied by peak values of wind pressure (also in the total height of the structure), extreme values of wind pressures on the system are obtained. These values occur on the structure during strong wind storms. In our case, the total height of the structure was z = 35 m. For the calculation of shared values of wind pressures, wind velocity in the range of 4.25 to 6 m/s should be used (this value is determined for the height 10 m above the terrain in the city). For calculating extreme values of wind pressures, wind velocity should be considered according to [18,19]. For Bratislava, the value of wind velocity is equal to 26 m/s.
To determine the suitable placement of the air conditioning, it is recommended to choose the places on the windowsills where optimum values of the wind pressures are. Sites with extreme values of wind pressures should be problematic. Regarding the total area of the window sills and the wind pressure distribution, the best wind direction was 45°. In such cases, two walls were in the pressure zones of the building. However, extreme local wind effects occurred on the roof for this wind direction.
Each structure is particular because of its design, its location in a specific terrain, and wind flow affected by other surrounding objects. The dominant wind direction and terrain category can cause extreme local wind effects. Therefore, it is necessary to do a detailed analysis to determine the best places to install air conditioning devices.
In this study, the most suitable places for passive ventilation units were chosen for the dominant directions of wind flow determined from the wind direction of a given area.
The summary conclusions are as follows.
  • Wind direction 0°: the windward side A was in the positive pressures; the air-conditioning devices should be placed from the 2nd to the 6th floor. Only negative pressure occurred on the leeward side B and the side walls C and D.
  • Wind direction 22.5°: the windward side A was still in the zone of positive pressures. The side walls B and D, were in negative pressure zones. On wall C is where the low values of the forces were. The extreme values of the wind pressures were in the upper three floors.
  • Wind direction 45°: the windward sides were A and C. The higher values were in the corner of these walls from the 7th to the 11th floor. Walls B and D were in the negative pressure zones.
  • Wind direction 67.5°: the windward side was C. The maximum positive values of the wind pressures occurred in the upper left corner (in the upper three floors). Extreme negative values were in wall D from the 8th to the 11th floor.
  • Wind direction 90°: the windward side was C. The maximum values of positive wind pressures were from the 7th to the 11th floor in the middle of the wall. Walls A, B, and D were in negative pressure zones.
One of the objectives of this article is to add references to designers and show how they can use our research. The results and conclusions can serve as a solid basis for a static engineer to design the cladding system regarding an explicit window model. Further results can help determine the wind load on a window, and primarily create the construction of windows and sealing systems protected from wind-driven rain penetration. The effects are beneficial to the designers of the ventilation system. Engineers can determine the load and flow rate of the ventilation unit and save it before damage and deterioration. Subsequently, they can determine the optimal position of units and if it is necessary to use passive or forced ventilation with a ventilator. In some cases, it is a necessity. They can design the ventilator’s power. They can find a cost-effective solution for the ventilation system. And, in the first place, they can create a safe, optimal and effective ventilation system.
We realize that the results do not apply to all cases, but certain phenomena are repeated such as the corner effect, the flow separation zone, the windward and leeward zone. Therefore, we need to deal with this issue further. We can rely upon the integrated experimental/numerical approach, which can show us the behavior of the wind in quasi-real conditions. However, both methods have their limits. Future work should proceed by refining the results and the building model.

Author Contributions

Methodology and supervision, O.H. and O.I.; formal analysis, M.F.; writing—review and editing, L.B.K.; tests in BLWT in Bratislava, L.B.K. and P.L.; CFD visualization, M.M. All authors have read and agreed to the published version of the manuscript.

Funding

This research was funded by Grant Agency of Ministry of Education, Science, Research and Sport of the Slovak Republic, grant numbers: APVV-19-0460, VEGA 1/0453/20.

Data Availability Statement

Data available on request due to restrictions privacy.

Conflicts of Interest

The authors declare no conflict of interest.

Nomenclature

C1ε, C2constants[-]
cothe coefficient of orography[-]
cpeexternal pressure coefficient[-]
cr(z)coefficient of roughness[-]
Cμthe model constant[-]
Gbthe generation of turbulence kinetic energy due to buoyancy
Gkgeneration of turbulence kinetic energy due to the mean velocity gradients
hheightm
kturbulence kinetic energym2/s2
lv(ze)the turbulence intensity[-]
pCFDexternal static pressure at some pointPa
prefstatic pressure of free stream at the reference heightPa
qp(ze)the peak value velocity pressurePa
Sk, Sεthe user-defined source terms
ttimes
uwind velocitym/s
v*wind shear velocitym/s
vbbasic wind velocitym/s
vm(z)mean wind velocity at height zm/s
vrefreference wind velocitym/s
wethe wind pressurePa
YMthe contribution of the fluctuating dilatation in compressible turbulence to the overall dissipation rate
z0aerodynamic roughness lengthm
εdissipation ratem2/s3
κvon Kármán constant[-]
μtturbulence dynamic viscositykg/m·s
νkinematic viscosity m2/s
ρthe air densitykg/m3
σkPrandtl numbers for k[-]
σεPrandtl numbers for ε[-]

References

  1. Biler, A.; Tavil, A.U.; Su, Y.; Khan, N. A review of performance specifications and studies of trickle vents. Buildings 2018, 8, 152. [Google Scholar] [CrossRef] [Green Version]
  2. Izadyar, N.; Miller, W.; Rismanchi, B.; Garcia-Hansen, V. Impact of façade openings’ geometry on natural ventilation and occupants’ perception: A review. Build. Environ. 2020, 170, 106613. [Google Scholar] [CrossRef]
  3. Sacht, H.; Lukiantchuki, M.A. Windows size and the performance of natural ventilation. Procedia Eng 2017, 196, 972–979. [Google Scholar] [CrossRef]
  4. Sharpe, P.; Jones, B.; Wilson, R.; Iddon, C.V. What we think we know about the aerodynamic performance of windows. Energy Build. 2021, 231, 110556. [Google Scholar] [CrossRef]
  5. Schunemann, C.; Schiela, D.; Ortlepp, R. How window ventilation behavior affects the heat resilience in multi-residential buildings. Build. Environ. 2021, 202, 107987. [Google Scholar] [CrossRef]
  6. Kahsay, M.T.; Bitsuamlak, G.T.; Tariku, F. CFD simulation of external CHTC on a high-rise building with and without façade appurtenances. Build. Environ. 2019, 165, 106350. [Google Scholar] [CrossRef]
  7. Hu, G.; Song, J.; Hassanli, S.; Ong, R.; Kwok, K.C.S. The effects of a double-skin façade on the cladding pressure around a tall building. J. Wind Eng. Ind. 2019, 191, 239–5251. [Google Scholar] [CrossRef]
  8. Yuan, K.; Hui, Y.; Chen, Z. Effects of façade appurtenances on the local pressure of high-rise building. J. Wind Eng. Ind. 2018, 178, 26–37. [Google Scholar] [CrossRef]
  9. Liu, J.; Hui, Y.; Yang, Q.; Tamura, Y. Flow field investigation for aerodynamic effects of surface mounted ribs on square-sectioned high-rise buildings. J. Wind Eng. Ind. 2021, 211, 104551. [Google Scholar] [CrossRef]
  10. Jafari, M.; Alipour, A. Aerodynamic shape optimization of rectangular and elliptical double-skin façades to mitigate wind-induced effects on tall buildings. J. Wind Eng. Ind. 2021, 213, 104586. [Google Scholar] [CrossRef]
  11. Zheng, X.; Montazeri, H.; Blocken, B. CFD simulations of wind flow and mean surface pressure for buildings with balconies: Comparison of RANS and LES. Build. Environ. 2020, 173, 106747. [Google Scholar] [CrossRef]
  12. Jafari, M.; Alipour, A. Review of approaches, opportunities, and future directions for improving aerodynamics of tall buildings with smart façades. Sustain. Cities Soc. 2021, 72, 102979. [Google Scholar] [CrossRef]
  13. Guyot, G.; Sherman, M.H.; Walker, I.S. Smart ventilation energy and indoor air quality performance in residential buildings: A review. Energy Build. 2018, 165, 416–430. [Google Scholar] [CrossRef] [Green Version]
  14. Stamou, A.; Katsiris, I. Verification of a CFD model for indoor airflow and heat transfer. Build. Environ. 2006, 41, 1171–1181. [Google Scholar] [CrossRef]
  15. Franek, M.; Macák, M.; Hubová, O. Distribution of the external pressure coefficients on the elliptic tower: Experimental measurement compared with numerical modelling. MATEC Web Conf. 2020, 313, 00047. [Google Scholar] [CrossRef]
  16. Franek, M.; Macák, M.; Hubová, O.; Ivánková, O. Impact of Turbulence Models of Wind Pressure on two Buildings with Atypical Cross-Sections. Civ. Environ. Eng. 2021, 17, 409–419. [Google Scholar] [CrossRef]
  17. Ivánková, O.; Hubová, O.; Macák, M.; Vojteková, E.; Konečná, L.B. Wind Pressure Distribution on the Façade of Stand-Alone Atypically Shaped High-Rise Building Determined by CFD Simulation and Wind Tunnel Tests. Designs 2022, 6, 77. [Google Scholar] [CrossRef]
  18. STN EN 1991-1-4 Eurocode 1; Actions on Structures-Part 1–4: General Actions-Wind Actions. Slovak Office of Standards, Metrology and Testing: Bratislava, Slovak Republic, 2007.
  19. STN EN 1991-1-4/NA Eurocode 1; Actions on Structures-Part 1–4: General Actions-Wind Actions. National Annex. Slovak Office of Standards, Metrology and Testing: Bratislava, Slovak Republic, 2007. (In Slovak)
  20. Polcak, N.; Stastny, P. Influence of Terrain on Wind Effects in the Slovak Republic; SHMU and University of Matej Bel: Banská Bystrica, Slovakia, 2010. (In Slovak) [Google Scholar]
  21. ANSYS. 4.4.3 Realizable k-ε Model. Available online: https://www.afs.enea.it/project/neptunius/docs/fluent/html/th/node60.htm (accessed on 17 March 2022).
  22. Franke, J.; Baklanov, W. Best Practice Guideline for the CFD Simulation of Flows in the Urban Environment; COST Office: Brussels, Belgium, 2007. [Google Scholar]
  23. Blocken, B.; Stathopulos, T.; Carmeliet, J. CFD simulation of the atmospheric boundary layer–wall function problems. Atmos. Environ. 2007, 41, 238–252. [Google Scholar] [CrossRef]
  24. Chang, J.C.; Hanna, S.R. Air quality model performance evaluation. Meteorol Atmos Phys 2004, 87, 167–196. [Google Scholar] [CrossRef]
  25. Hubová, O.; Lobotka, P.; Konečná, L. Pressure coefficients on the model of SILSOE cube determined by tests in BLWT tunnels. Roczniki Inzynierii Budowlanej 2014, 14, 85–90. [Google Scholar]
  26. Richards, P.J.; Hoxey, R.P.; Short, L.J. Wind pressures on a 6 m cube. J. Wind Eng. Ind. 2001, 89, 1553–1564. [Google Scholar] [CrossRef]
  27. Richards, P.J.; Hoxey, R.P.; Connel, B.D.; Lander, D.P. Wind-tunnel modelling of the Silsoe cube. J. Wind Eng. Ind. 2007, 95, 1384–1399. [Google Scholar] [CrossRef]
  28. Richards, P.J.; Hoxey, R.P. Pressures on a cubic building—Part 1: Full scale results. J. Wind Eng. Ind. 2012, 102, 72–86. [Google Scholar] [CrossRef]
  29. Čeheľová, D.; Franek, M.; Bielek, B. Atmospheric Boundary Layer Wind Tunnel of Slovak University of Technology in Bratislava. Appl. Mech. Mater. 2019, 887, 419–427. [Google Scholar] [CrossRef]
  30. Hubová, O.; Lobotka, P. The Natural Wind Simulations in the BLWT STU Wind Tunnel. In Proceedings of the ATF 3rd Conference on Building Physics and Applied Technology in Architecture and Building Structures, Austria, Vienna, 6–7 May 2014; E-Book of reviewed papers. pp. 78–84, ISBN 978-3-200-03644-4. [Google Scholar]
  31. Siegenia. Available online: https://www.siegenia.com/en/products/comfort-systems/window-ventilators (accessed on 8 March 2022).
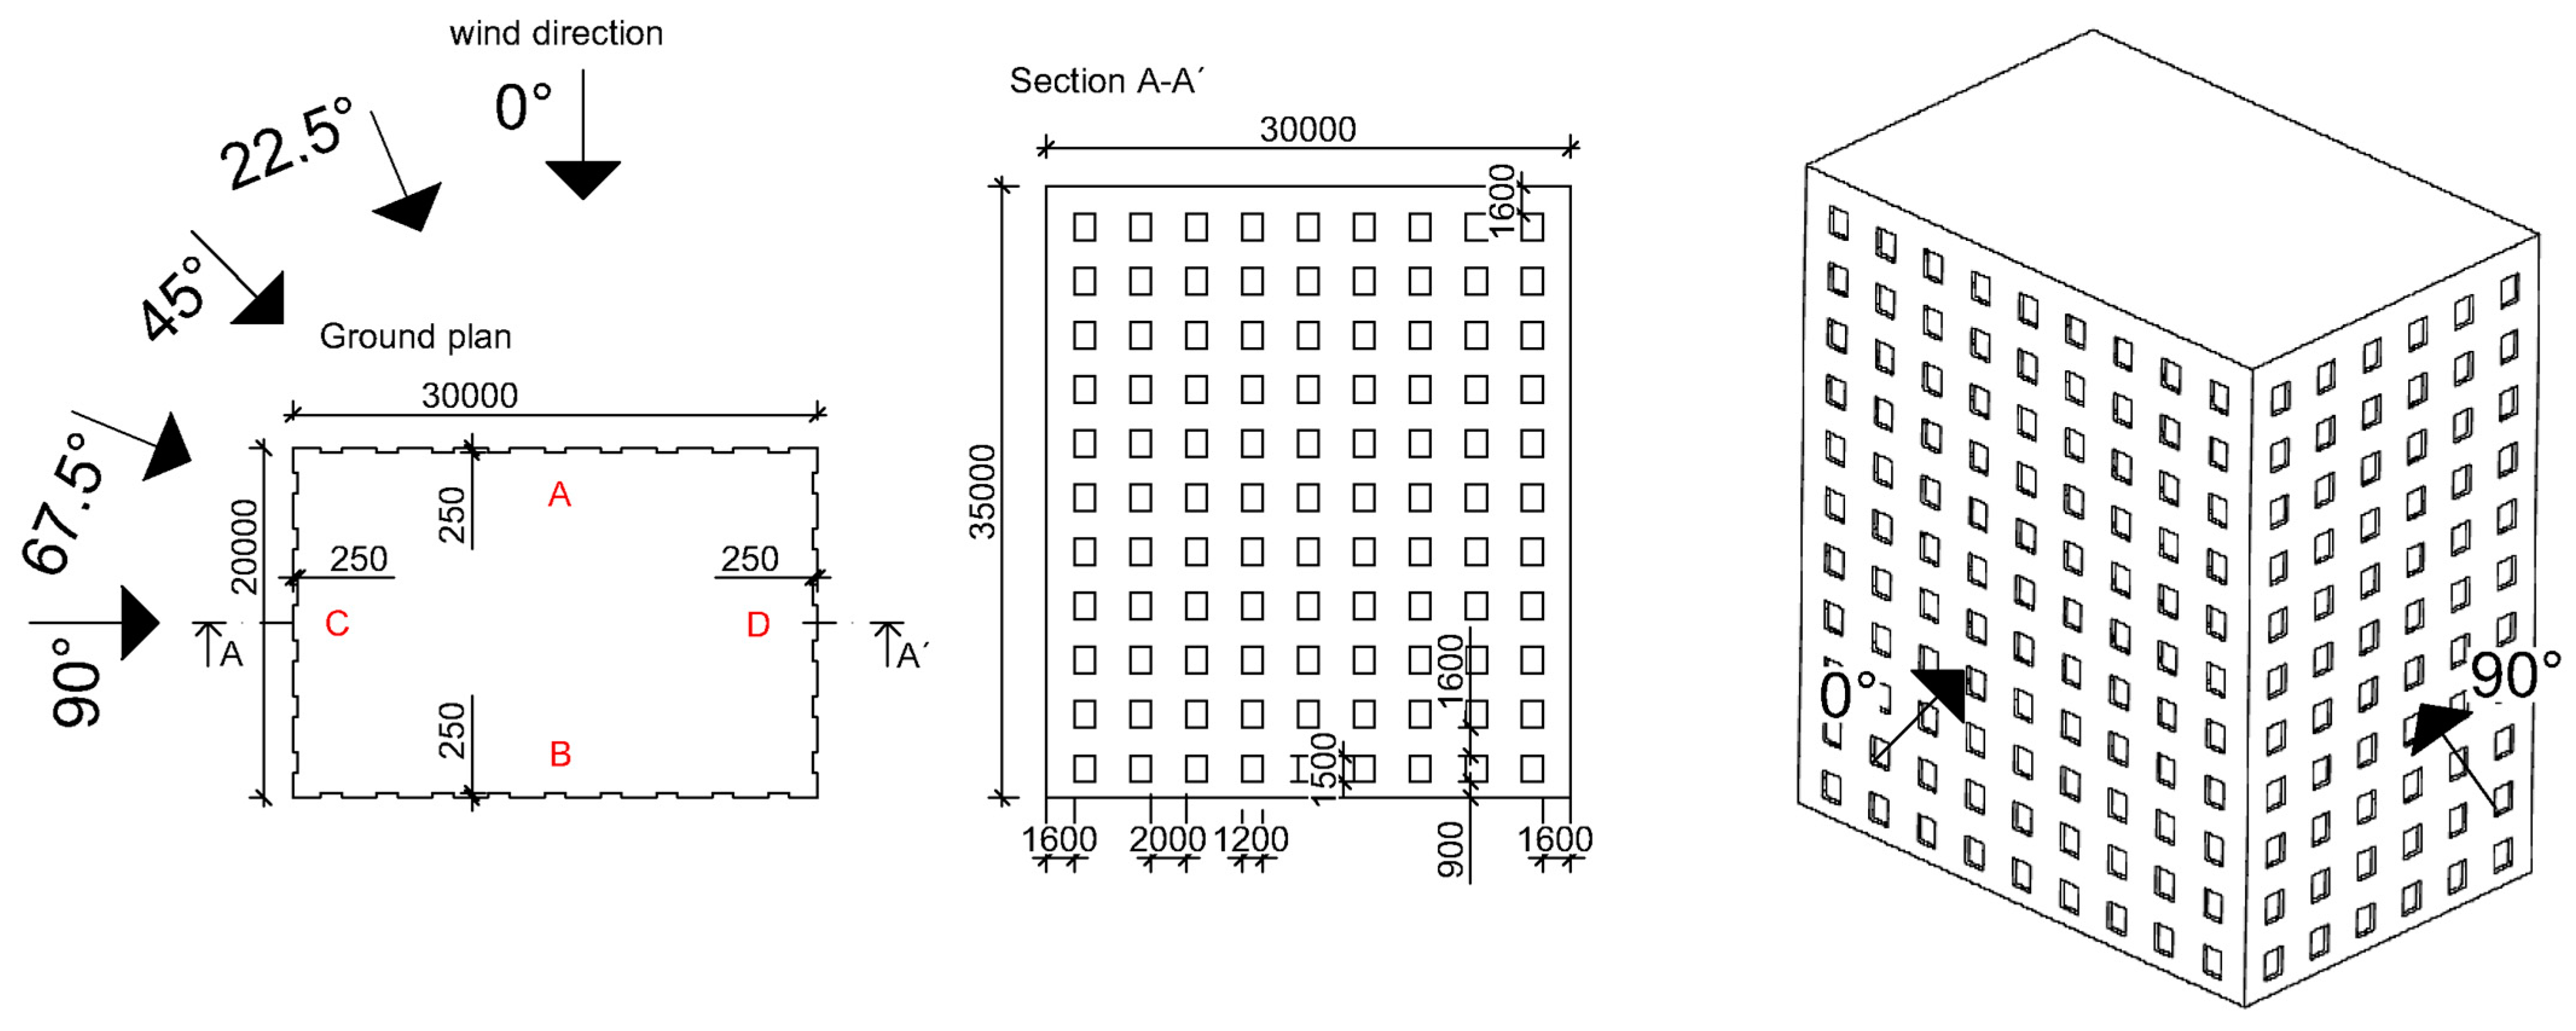
Figure 1. Dimensions of the residential building model with wind directions, ground plan, section plan, and 3D.
Buildings 13 00183 g001
Figure 2. Wind rose for Bratislava area (a) Average values of wind velocity [m/s] in Bratislava—Mlynská dolina; (b) Frequency of wind direction [‰] in Bratislava—Mlynská dolina; (c) Average values of wind velocity [m/s] in Bratislava—the airport; (d) Frequency of wind direction [‰] in Bratislava—the airport [20].
Buildings 13 00183 g002
Figure 3. (a) CFD calculation model, the density of meshing; (b) Selected windows in detail.
Buildings 13 00183 g003
Figure 4. CFD calculation model—computational domain with dimensions and boundary conditions.
Buildings 13 00183 g004
Figure 5. Atmospheric boundary layer properties (a) The profile of the mean value of the wind velocity; (b) The profile of the intensity of turbulence.
Buildings 13 00183 g005
Figure 6. SILSOE cube (a) Cube in scale 1:1 during the in situ test in England [28]; (b) Model of the SILSOE cube in scale of 1:30 in detail; (c) Model of the SILSOE cube during the wind tunnel testing.
Buildings 13 00183 g006
Figure 7. Comparison of the external pressure coefficients—45°—vertical profile—CFD model vs. SILSOE cube.
Buildings 13 00183 g007
Figure 8. Comparison of the external pressure coefficients—45°—horizontal profile—CFD model vs. SILSOE cube.
Buildings 13 00183 g008
Figure 9. The roof—cpe—wind direction 45°—(a) CFD model of the residential building; (b) SILSOE cube model tested in BLWT Bratislava (wind velocity 15 m/s).
Buildings 13 00183 g009
Figure 10. External pressure coefficients—(a) CFD—wind direction 0°; (b) CFD—wind direction 45°; (c) STN EN 1991-1-4—wind direction 0° (walls and roof).
Buildings 13 00183 g010
Figure 11. SIEGENIA passive ventilation units and examples of their placements (a) Linings; (b) Sills; (c) Lintel [31].
Buildings 13 00183 g011
Figure 12. Pressure distributions on the buildings for wind incidence 0° (a) General view; (b) Positive pressure; (c) Negative pressure.
Buildings 13 00183 g012
Figure 13. Pressure distributions on the buildings for wind incidence 22.5° (a) General view; (b) Positive pressure; (c) Negative pressure.
Buildings 13 00183 g013
Figure 14. Pressure distributions in the buildings for wind incidence 45° (a) General view; (b) Positive pressure; (c) Negative pressure.
Buildings 13 00183 g014
Figure 15. Building pressure distributions for wind incidence 67.5° (a) General view; (b) Positive pressure; (c) Negative pressure.
Buildings 13 00183 g015
Figure 16. Pressure distributions in the buildings for wind incidence 90° (a) General view; (b) Positive pressure; (c) Negative pressure.
Buildings 13 00183 g016
Table 1. Summarized table of the external pressure coefficient for various wind directions and the position of the passive ventilation units on the façades A, B, C or D according to the Figure 1.
Wind Direction [°]External Pressure Coefficient cpe [-]
FaçadeWindow SillLiningLintel
Pos.Neg.Pos.Neg.Pos.Neg.Pos.Neg.
00.89_A−0.53_C,D0.89_A−0.45_C,D0.89_A−0.45_C,D0.89_A−0.45_C,D
22.50.91_A−1.19_C0.91_A−0.64_C0.91_A−0.64_C0.91_A−0.64_C
450.87_A,C−0.55_B0.87_A−0.55_B0.87_A,C−0.55_B0.87_A,C−0.55_B
67.50.89_C−1.04_A0.89_C−0.40_B0.89_C−0.40_B0.89_C−0.40_B
900.89_C−0.65_A,B0.89_C−0.56_A,B0.89_C−0.56_A,B0.89_C−0.56_A,B
Disclaimer/Publisher’s Note: The statements, opinions and data contained in all publications are solely those of the individual author(s) and contributor(s) and not of MDPI and/or the editor(s). MDPI and/or the editor(s) disclaim responsibility for any injury to people or property resulting from any ideas, methods, instructions or products referred to in the content.