Article

Mechanical Properties on Various FRP-Reinforced Concrete in Cold Regions

College of Civil Engineering, Northeast Forestry University, Harbin 150040, China
*
Authors to whom correspondence should be addressed.
These authors contributed equally to this work.
Buildings 2023, 13(1), 138; https://doi.org/10.3390/buildings13010138
Submission received: 12 December 2022 / Revised: 29 December 2022 / Accepted: 1 January 2023 / Published: 5 January 2023
(This article belongs to the Special Issue State-of-the-Art Studies of Green and Sustainable Building Materials)

Abstract

:
The evaluation of frost resistance varies with different reinforcement methods, but it is a hot research topic for concrete reinforced with Fiber-Reinforced plastic (FRP). Freezing and thawing tests of FRP-reinforced concrete prisms and cylinders are presented to simulate beams and piers of buildings in cold climates. To evaluate the specimens’ frost resistance, tests with various reinforcement techniques, morphological analysis, weight tests, and relative dynamic modulus of elasticity tests were used. Examined also were the variations in stress–strain curves for axial compression tests and load–displacement curves for bending tests following various freeze–thaw cycles. The findings indicated that after 100 freeze–thaw cycles, the weight of unreinforced concrete cylinders decreased by 9.7%, and its compressive strength decreased by 27.6%. On the other hand, CFRP-reinforced concrete cylinders (Carbon-Fiber-Reinforced Plastics) and GFRP (Glass-Fiber-Reinforced Plastics) gained 1.1% and 1.58% in weight, respectively, while the compressive strength decreased by 7.4% and 8%. After 100 freeze–thaw cycles, the weights of concrete prisms with reinforcement, without reinforcement, and with CFRP reinforcement decreased by 12.13%, 8.7%, and 9.6%, respectively, and their bending strength was reduced by 20%, 42%, and 53%, respectively. The frost resistance of the two FRP-reinforced concrete types had significant differences under freeze–thaw cycles because the prismatic specimens were not fully wrapped with FRP materials. Finally, finite element software ABAQUS was used to simulate the freeze–thaw cycle test of the two specimens. Calculated values were compared to experimental results for the load–displacement curve and the axial stress–strain curve under bending load. The comparison of peak displacement produced a maximum error of 8.6%, and the FRP-reinforced concrete model validity was verified.

1. Introduction

The water molecules inside the concrete pores in cold regions are subjected to freeze–thaw cycles, which will occur in the transition from a liquid phase to a solid phase, causing damage to the internal structure of the concrete [1]. This damage seriously affects the structure’s durability and long-term use safety, reducing the load-bearing capacity of many old buildings [2]. In order to maintain safety standards, these buildings must be upgraded or rebuilt. Upgrading structures rather than rebuilding them can be economically and environmentally beneficial, especially with fast, effective, and simple reinforcement methods. External bonding techniques have proven to be a practical and effective method of strengthening building structures [3,4].
Reinforced concrete structures with FRP are one of the popular new methods of structural reinforcement that have emerged in recent years [5]. FRP’s physical, chemical, and mechanical properties have been studied to understand its performance further [6].
The common FRPs include CFRP and GFRP. CFRP is a composite material formed by the unidirectional arrangement of carbon fibers with resin as the matrix material and by a specific molding method. GFRP is a high-performance composite material formed by glass fiber and resin. They all have lightweight, high tensile strength, good durability, corrosion resistance, and easy construction [7]. The comprehensive performance of CFRP is better compared with other FRP materials. However, the price is relatively high, thus limiting the application and development of this material to a certain extent. CFRP is widely used in aviation, transportation, and civil construction because of its excellent performance. CFRP cloth is favored in reinforcement and repair works because of its light material, appearance, and mechanical properties. CFRP cloth is favored in reinforcement and repair works because of its light material, appearance, and mechanical properties. In the blast impact load, the CFRP configuration still improves concrete failure resistance [8]. GFRP has excellent overall performance compared with other fiber materials and has certain advantages in price. However, the thermal stability, high temperature, and alkali resistance of GFRP are relatively poor. The coefficient of linear expansion of GFRP is similar to that of concrete, and it works well in synergy with concrete when applied to concrete structures [9]. GFRP is also widely used to reinforce concrete beams and columns because of its excellent properties, which can improve the stiffness and ultimate bearing capacity of beams and columns.
The long-term durability of FRP itself plays an important role in strengthening concrete structures. Xian et al. [10] studied the prestress loss and tensile properties of CFRP in anchorage under humid and hot environment cycles. The results showed that the degradation rate of tensile strength was 5~10% at higher temperature and prestress levels. It was also predicted that the retention rate of residual tensile strength of CFRP plates at the maximum prestressed level (60%) was more than 50% during the service life of 30 years. CFRP and GFRP also show excellent durability in high- and low-temperature hydraulic and fatigue environments [11]. Zhong et al. [12] aged CFRP and GFRP by heating in water. After removing the moisture absorbed during the aging process, the strength of CFRP was increased to 95.75% of its original value, while the GFRP composite retained only 74.65% of its strength after the wet heat treatment.
The use of the external fiber cloth reinforcement of existing bridges as a new material and technology is being popularized in bridge systems at home and abroad, effectively improving the load-bearing capacity and service life of existing bridges. Li et al. [13] discussed the principal structure model of reinforced concrete. They investigated the ultimate bearing capacity, frost resistance, seismic resistance, and reinforcement mechanism of reinforced concrete structures, taking into account the progress of composite-reinforced concrete technology at home and abroad. Wang et al. [14] applied a constant current to seven reinforced concrete beams with different carbon fiber wrapping methods under a long-term chloride ion environment to accelerate their corrosion. The changes in physical and mechanical properties of each beam during corrosion were compared; the different effects of different carbon fiber wrapping methods on the frost resistance of reinforced concrete beams were analyzed. The tests showed that carbon fiber wrapping significantly improved the frost resistance of reinforced concrete beams, and the degree of improvement was related to the wrapping method of carbon fiber on reinforced concrete beams. Ji et al. [15] studied the durability performance of concrete in the presence of sulfuric acid. The presence of the CFRP layer partially hindered the entry of sulfuric acid and improved the integrity of the concrete. The CFRP improved the corrosion resistance of the concrete. Lu et al. [16] investigated the frost resistance of prestressed CFRP-reinforced concrete beams under chloride salt dry and wet cycles. Attari [17] used various FRPs to strengthen reinforced concrete beams. Finally, Xiong et al. [18] tested the performance of 10 beams reinforced with hybrid carbon-glass composites. The results showed that the load–displacement curves of the hybrid reinforced beams did not have bilinear properties; however, the maximum displacements of these beams were more significant than those of the carbon-fiber-reinforced beams.
In addition, bonding GFRP or aramid FRP fabrics or sheets on both sides of the beam can significantly improve the shear strength and ductility of the beam. All these studies have shown that reasonable FRP reinforcement methods have improved concrete in load-bearing capacity, shear resistance, and frost resistance. However, frost resistance is also only measured by a single load-bearing capacity. Therefore, this paper divides the frost resistance of FRP-reinforced concrete into three indicators: the axial pressure of FRP-reinforced concrete, the flexural strength of concrete beams, and the relative modulus of elasticity of FRP-reinforced concrete.
Numerical simulation can describe the internal structural characteristics of concrete more finely and, thus, analyze the frost resistance of concrete more rationally. Hasan et al. [19] studied the mechanical properties of concrete after freeze–thaw cycles and developed an intrinsic damage model for concrete after freeze–thaw cycles. Xing [20] studied the damage mechanism of concrete after freeze–thaw cycles, carried out a limit element simulation of concrete in a freeze–thaw environment, and tested its mechanical properties using ANSYS software. Huang [21] conducted a study on uniaxial compression micro-scale damage of freeze–thaw-damaged concrete and found that the interparticle contact forces and crack development corresponding to different stage points can reflect the degree of fine-scale damage of concrete. Zhang et al. [22] proposed a numerical simulation method for freeze–thaw RC columns considering the inhomogeneous distribution of concrete freeze–thaw damage inside the members. Accordingly, they investigated RC columns’ seismic performance under different freeze–thaw cycles. Zheng [23] used zero-length section units in the finite element analysis software OPENSEES and numerically simulated the damage process of RC beam specimens based on a fiber section model that can consider the freeze–thaw damage distribution. The analysis results showed that the hysteresis curves obtained by the numerical modeling and analysis method were consistent with the experimental data, and the errors of the eigenvalues of the skeleton curves were minor. However, more studies must be conducted on freeze–thaw numerical models and finite element simulations of externally reinforced concrete with CFRP and GFRP. In order to further promote the use of FRP-reinforced concrete in cold regions, considerable efforts are needed.
To sum up, this paper reinforces concrete cylinders and prisms by applying FRP. First, the freeze–thaw cycle simulates the freeze–thaw phenomenon in cold regions. Second, FRP-reinforced columns simulate the structure of piers and columns of buildings in cold regions. FRP-reinforced prefabricated cracked concrete prisms are used to simulate concrete beam structures in cold areas that have been damaged and cracked. To evaluate the specimens’ frost resistance tests with various reinforcement techniques, morphological analysis, weight tests, and relative dynamic modulus of elasticity tests are used. In addition, this paper studies the axial compressive stress–strain and load–displacement curves of FRP-reinforced concrete diagrams under bending loads in the cold zone environment. Two specimens are constructed using the finite element software ABAQUS, and a numerical model for predicting the frost resistance of FRP-reinforced concrete in cold regions is established. Under the action of different freeze–thaw cycles, the finite element analysis of two kinds of specimens is carried out. The axial stress–strain curve and the load–displacement curve under bending load are calculated and compared with the experimental values.

2. Experimental Methods and Procedures

2.1. Raw Materials

Concrete comprises several materials, such as natural gravel, river sand, cement, and water. P.O. 42.5 ordinary silicate cement is selected, and its indexes are shown in Table 1. The river sand is selected from local medium sand with a fineness modulus of 2.4. Natural gravel of 5–10 mm in particle size is 3:7 compared to natural gravel of 10–20 mm. A 30 MPa design-strength concrete is considered in the research work presented in this study.
In addition, GFRP and CFRP are bonded to the outer surface of the concrete by epoxy resin adhesive to improve the durability performance of concrete. The physical properties of the two FRP and epoxy adhesives are shown in Table 2. Figure 1 shows two types of fiber composites, GFRP and CFRP.

2.2. Specimen Preparation

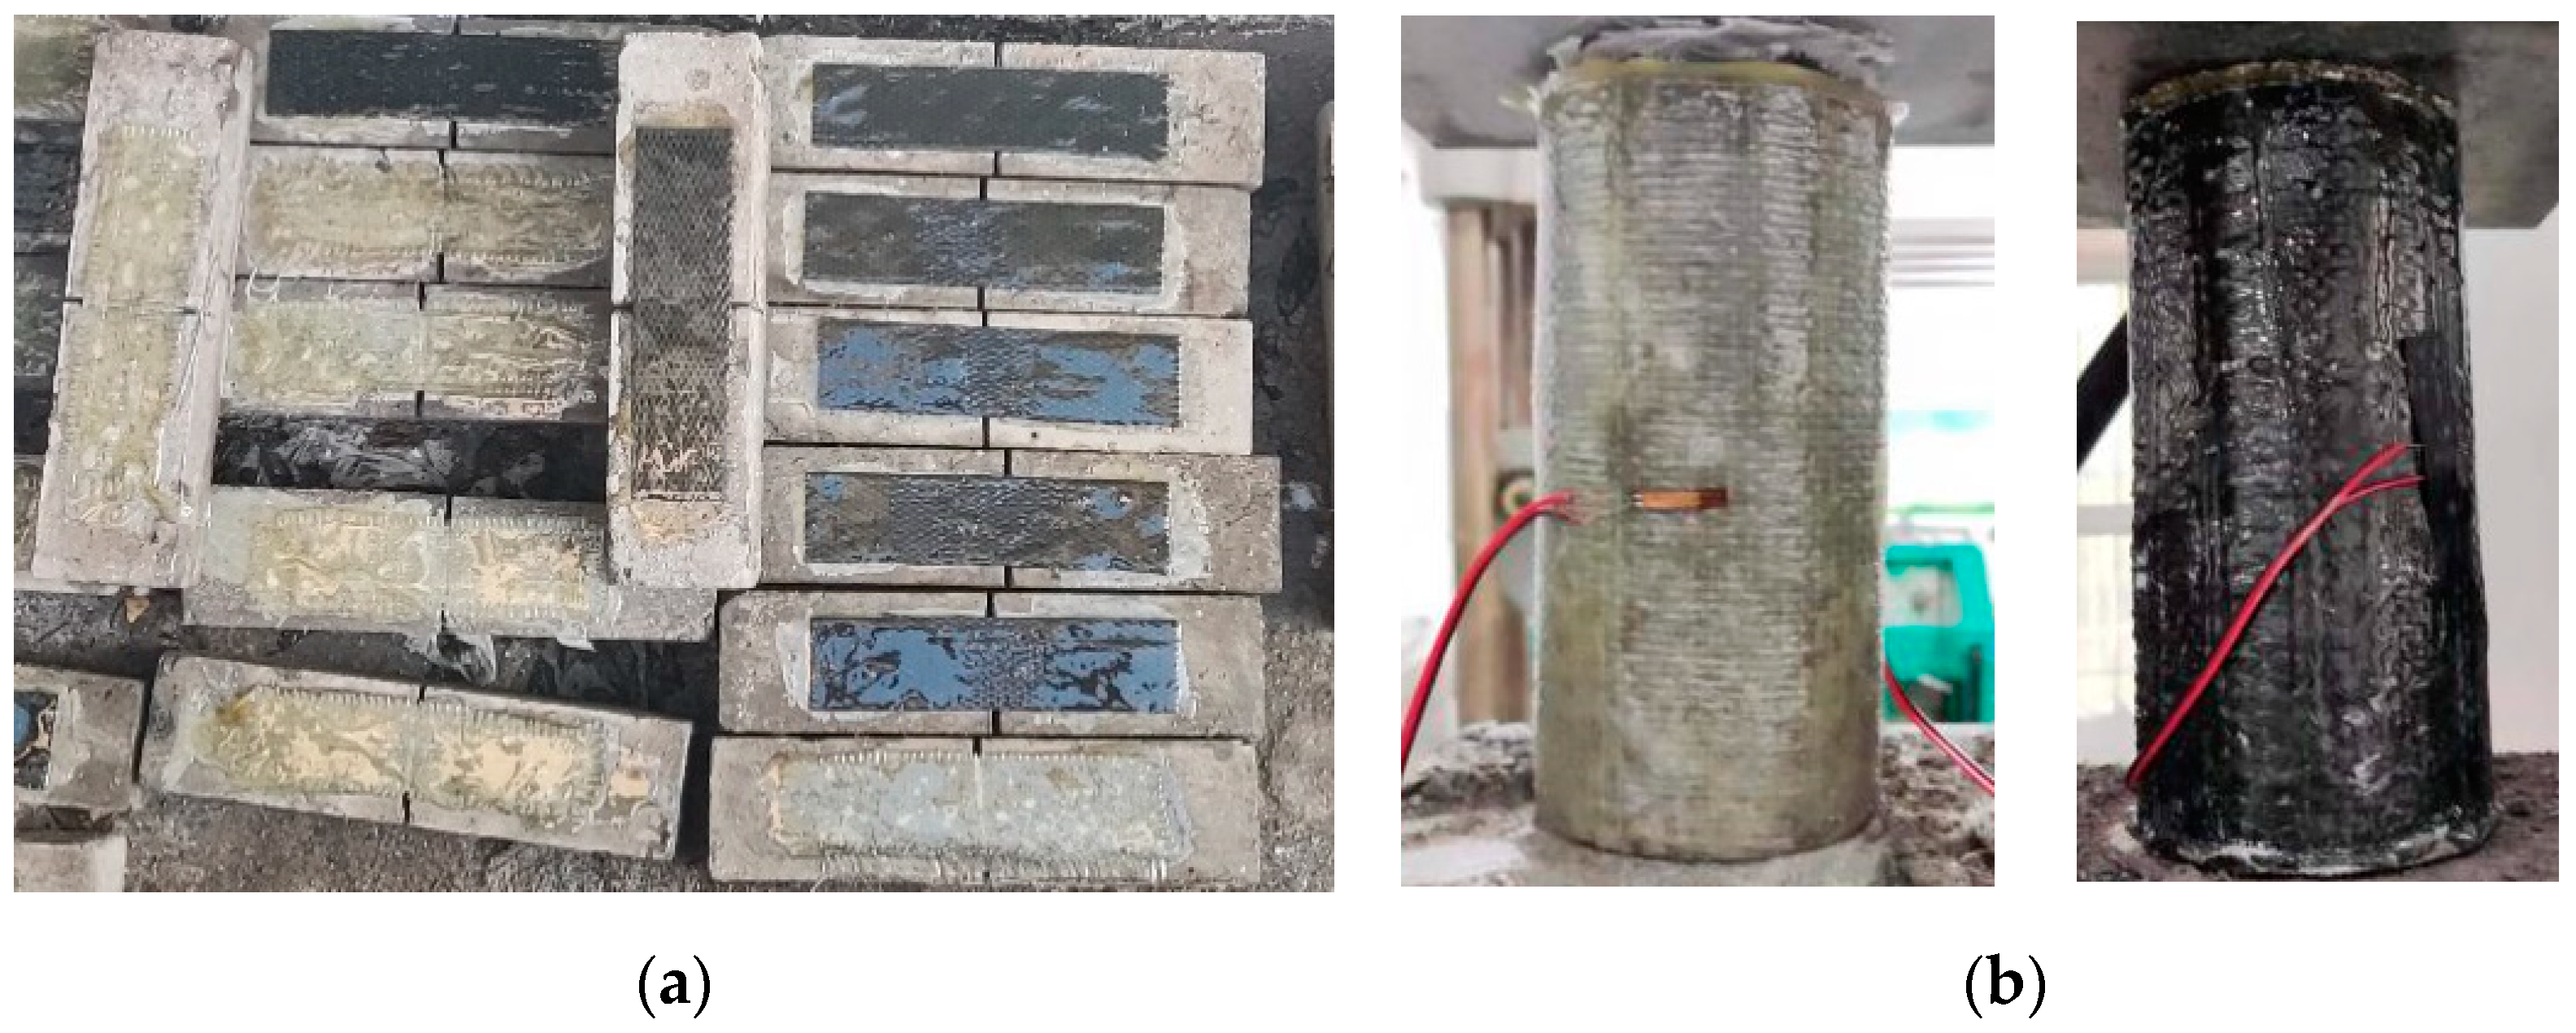
The specimens are grouped and numbered according to the FRP category, the type of reinforced specimens, and the number of freeze–thaws (Table 3). Next, the raw materials are mixed according to a specific ratio (Table 4). After mixing evenly, they are put into prismatic test molds of 100 mm in length, 100 mm in width, and 400 mm in height, and cylindrical test molds of 100 mm in diameter and 200 mm in size. They are vibrated evenly until a uniform cement paste forms, and no air bubbles appear on the surface after loading into the test mold. First, a specimen with 100 mm × 100 mm × 400 mm is selected, and a 40 mm depth slot is cut on the tensile side at the bottom of the specimen. Next, CFRP and GFRP of 100 mm in length and 300 mm in width are attached to the grooves (Figure 2a) for the bending test. Finally, cylindrical specimens are selected, and CFRP and GFRP are wrapped with the exterior of the cylinders using epoxy resin adhesive (Figure 2b) for conducting the compressive test.

2.3. Testing Method and Loading Process

2.3.1. Freeze–Thaw Cycle

The freeze–thaw test is carried out following GB/T 50082-2009, and the freeze–thaw cycle experiment is carried out by the quick freeze method. The testing equipment is shown in Figure 3a. The specimens are placed in water for 24 h before freezing and thawing. The freeze–thaw sets the freeze–thaw temperature for a high temperature of 6 °C and a low temperature of −16 °C to complete a freeze–thaw cycle test of 3 h. The CFRP- and GFRP-reinforced cylindrical and prismatic specimens are removed and analyzed after 0, 25, 50, and 100 freeze–thaw cycles.
These analyses include mass tests and relative dynamic modulus of elasticity tests.

2.3.2. Mechanical Tests

The flexural and compressive tests are performed on two types of specimens. The testing method is carried out according to the specification (GBT50081-2019). During the axial compression experiments of the cylinder, the load is applied at a rate of 0.5 MPa/s. The precast cracked concrete prisms are tested in four-point bending with a load applied at 0.05 MPa/s. The data on the load displacement of the specimen during compression are recorded. In the test, strain gauges are attached to the center of the bottom of the prismatic specimen and the side of the cylindrical specimen, and the strain is collected by a static strain instrument. Figure 4 shows the mechanical test of concrete.

3. Results and Discussion

3.1. Damage Morphology of 100 Freeze–Thaw Cycles

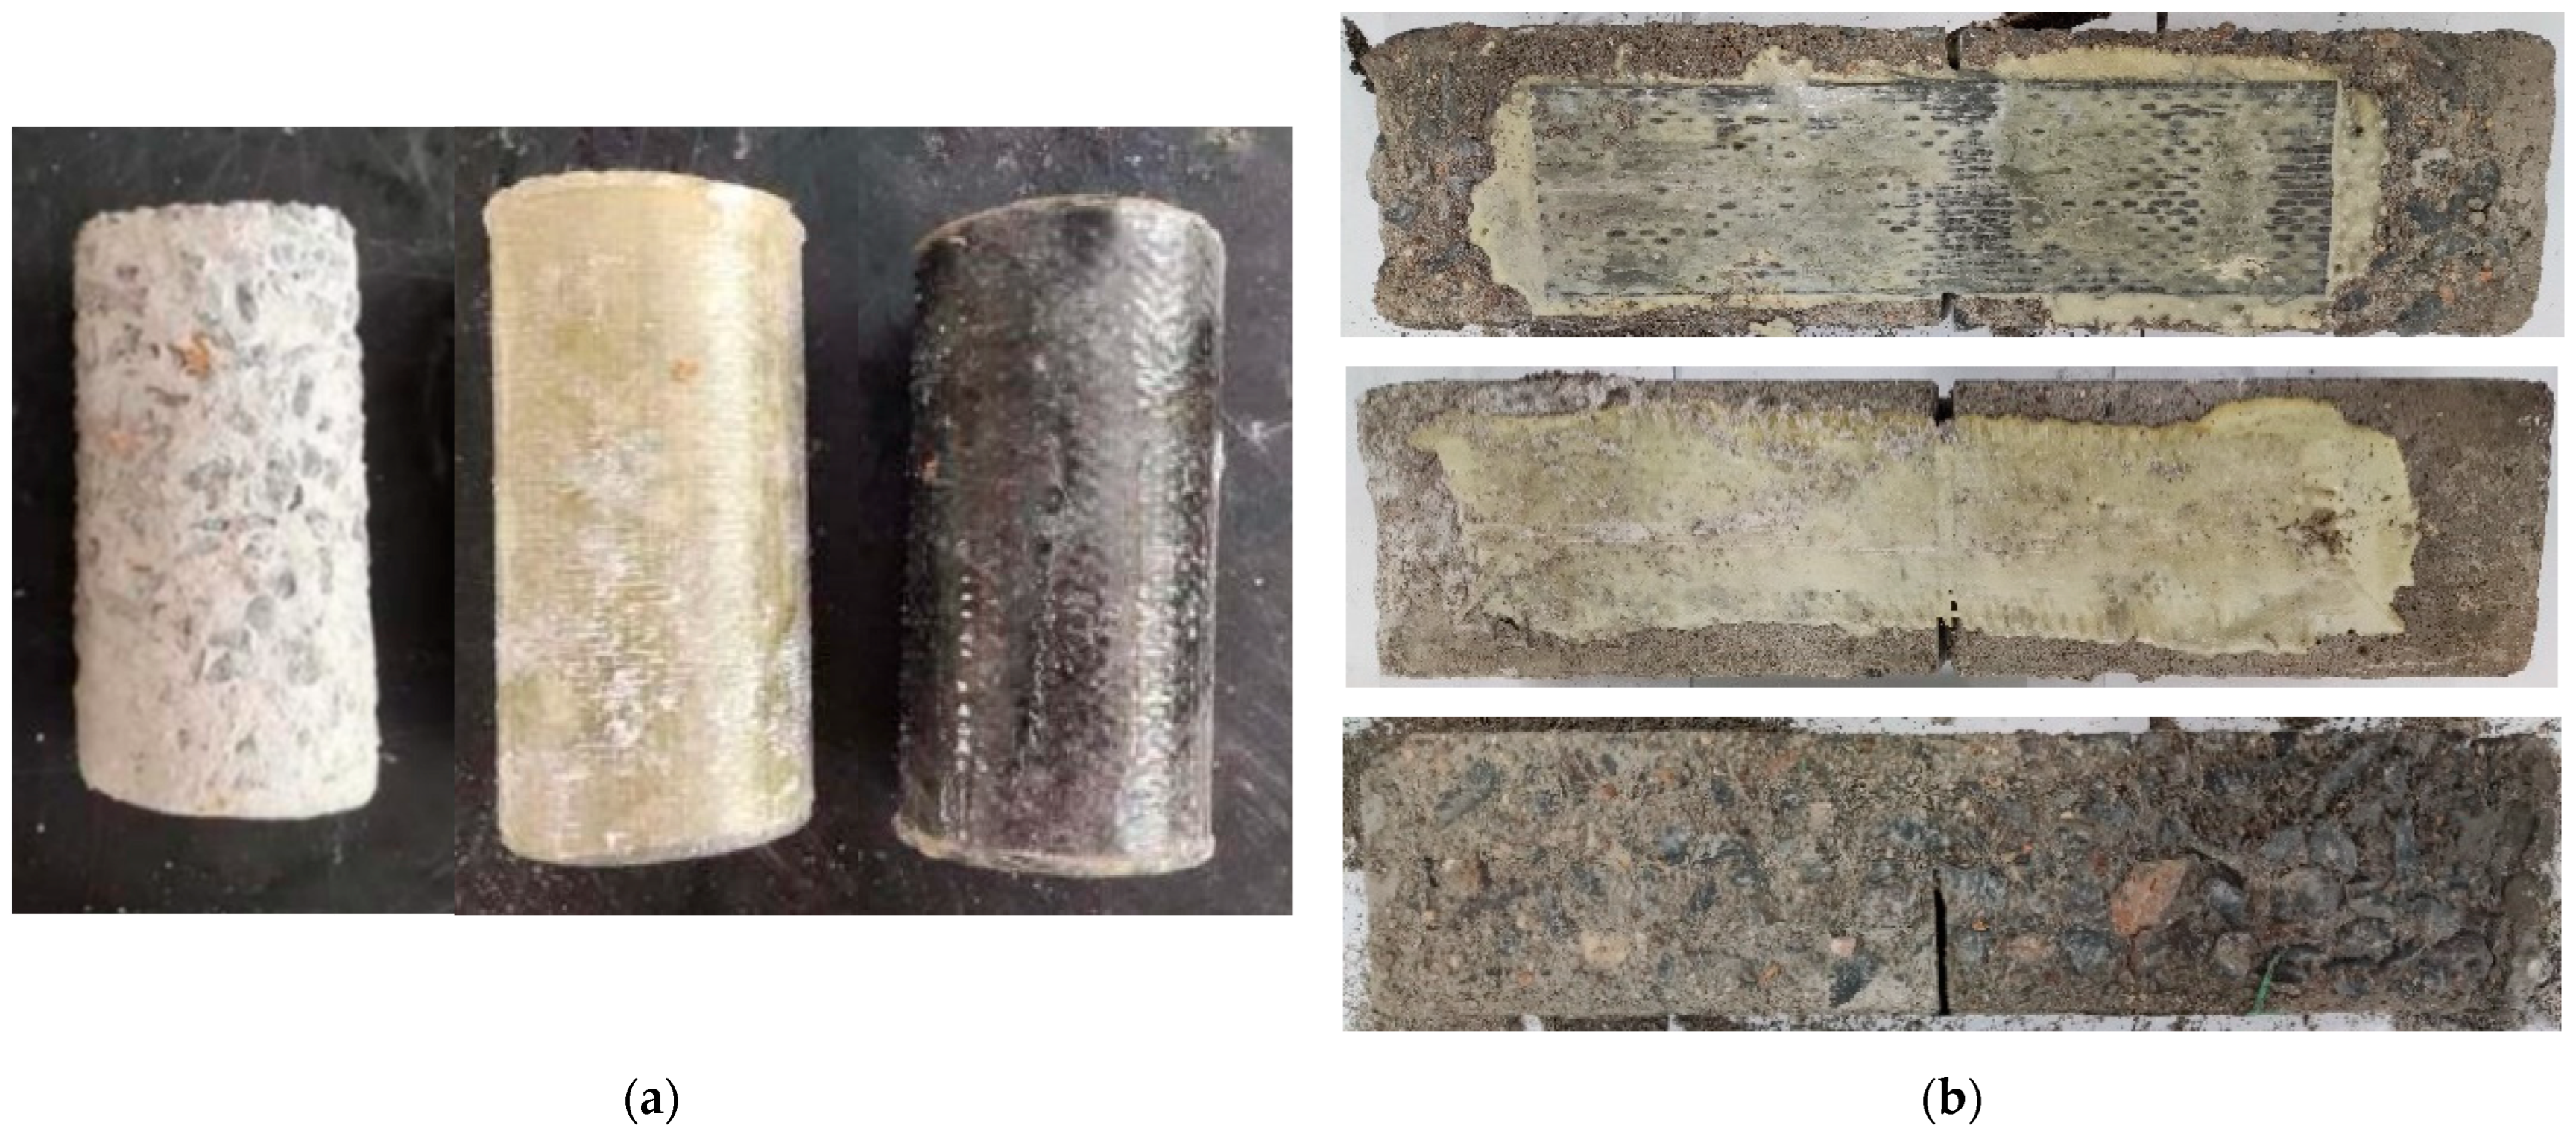
The appearance of unreinforced, CFRP-, and GFRP-reinforced concrete specimens after 100 freeze-thaw cycles is shown in Figure 5. The surface mortar of the unreinforced concrete column comes off, leaving only coarse aggregate adhering to the surface of the specimen. CFRP- and GFRP-reinforced concrete columns show almost no changes compared with unreinforced specimens (Figure 5a). It illustrates that FRP-wrapped concrete can protect concrete from freeze–thaw cycles in terms of appearance. However, the surface of the CFRP- and GFRP-reinforced concrete prisms can be clearly observed as the specimens are still severely damaged. Especially at the junction of FRP and concrete, the bonding failure and cracks at the interface can be clearly observed. This shows that different ways of strengthening concrete with FRP also have specific differences in the freezing resistance of specimens. Studies have yet to investigate the frost resistance of FRP-reinforced concrete for different reinforcement types.

3.2. Weight Variation

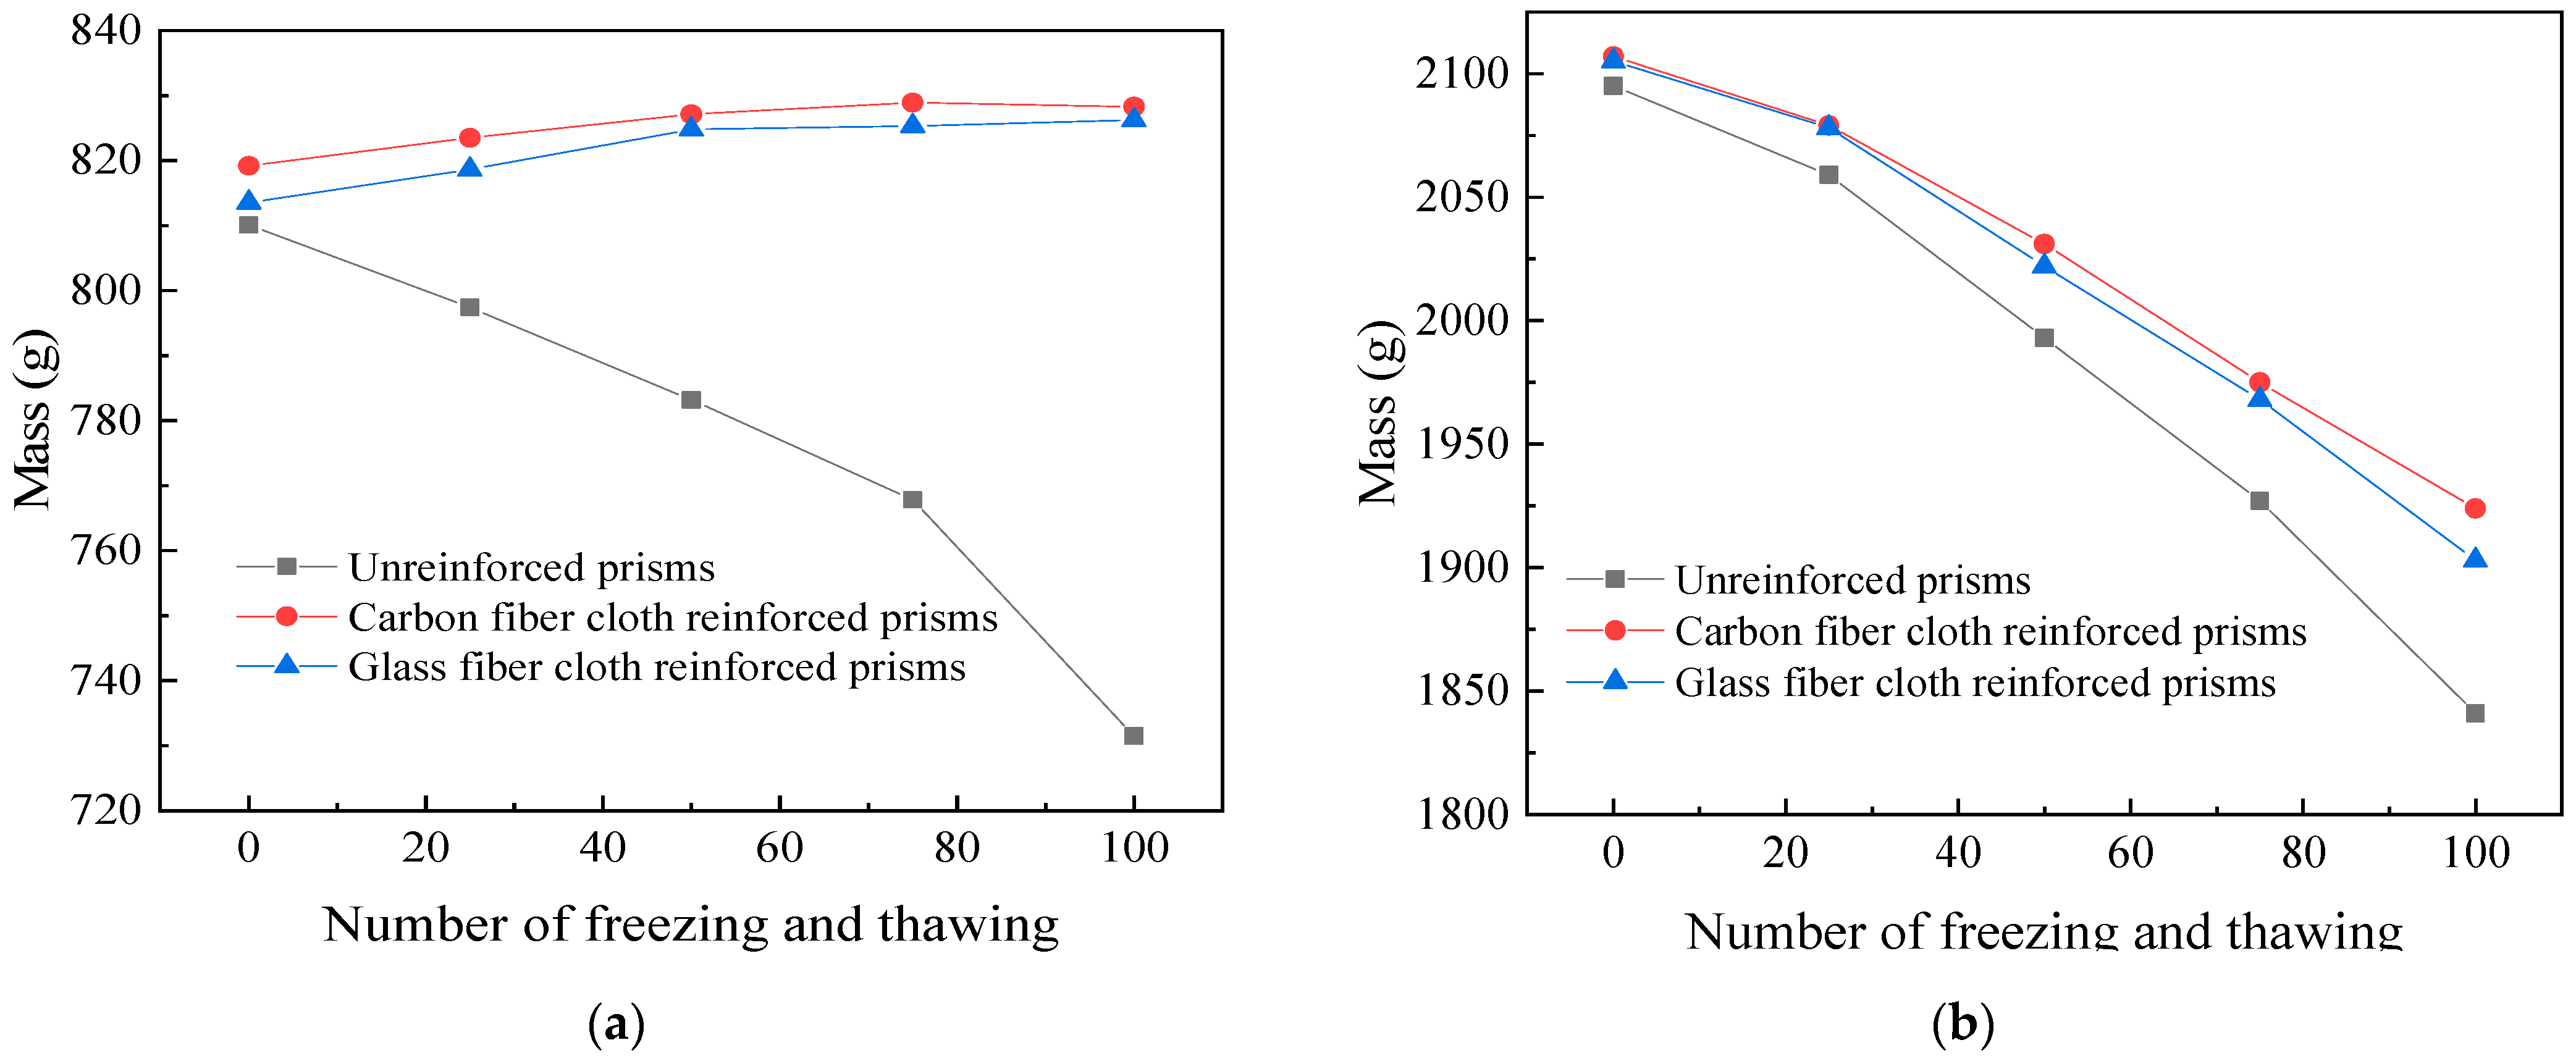
Table 5 shows the weight changes of unreinforced, CFRP-reinforced, and GFRP-reinforced concrete specimens after 0, 25, 50, 75, and 100 cycles. The weight of ordinary concrete cylinders decreases by 9.7% after 100 freeze–thaw cycles. On the other hand, the weight of CFRP- and GFRP-reinforced concrete cylinders increases by 1.1% and 1.58%, respectively. The FRP material category has almost no effect on the weight of FRP-reinforced concrete cylinders under freeze–thaw cycles. However, the wrapping effect of FRP can avoid not only the weight damage of concrete due to the freeze–thaw cycle effect but also a slight increase in weight. The FRP wrap prevents concrete mortar from falling due to freeze–thaw damage. Freeze–thaw cycles cause concrete to loosen and internal cracks to increase, promoting further moisture entry into the concrete. It ultimately leads to an increase in the weight of FRP-reinforced concrete cylinders.
However, the weight variation of FRP-reinforced concrete prisms differs from that of cylinders. The weight of concrete prisms without reinforcement, CFRP reinforcement, and GFRP reinforcement after 100 freeze–thaw cycles decreases by 12.13%, 8.7%, and 9.6%, respectively. Even if the concrete prism is reinforced with FRP, its weight still varies greatly. Because the prismatic specimen is not fully wrapped, the mortar on the surface will continuously drop due to the freeze–thaw cycle.
The weight is one of the crucial bases for measuring the frost resistance of the specimen. However, it can be obtained from the above that the frost resistance of FRP-reinforced specimens is sometimes different, even if the materials are the same.
The weight loss data are plotted to obtain Figure 6. Observe the weight variation of the FRP concrete cylinder in Figure 6a. Unreinforced concrete loses more and more weight as the number of freeze–thaws increases. On the other hand, the weight of FRP-reinforced concrete cylinders increased slightly in the first period and hardly changes in the later period. However, the weight of the concrete prisms in Figure 6b continues decreasing with or without FRP reinforcement. Therefore, the frost resistance must be more consistent for specimens with different FRP reinforcement types.

3.3. Changes in Elastic Modulus

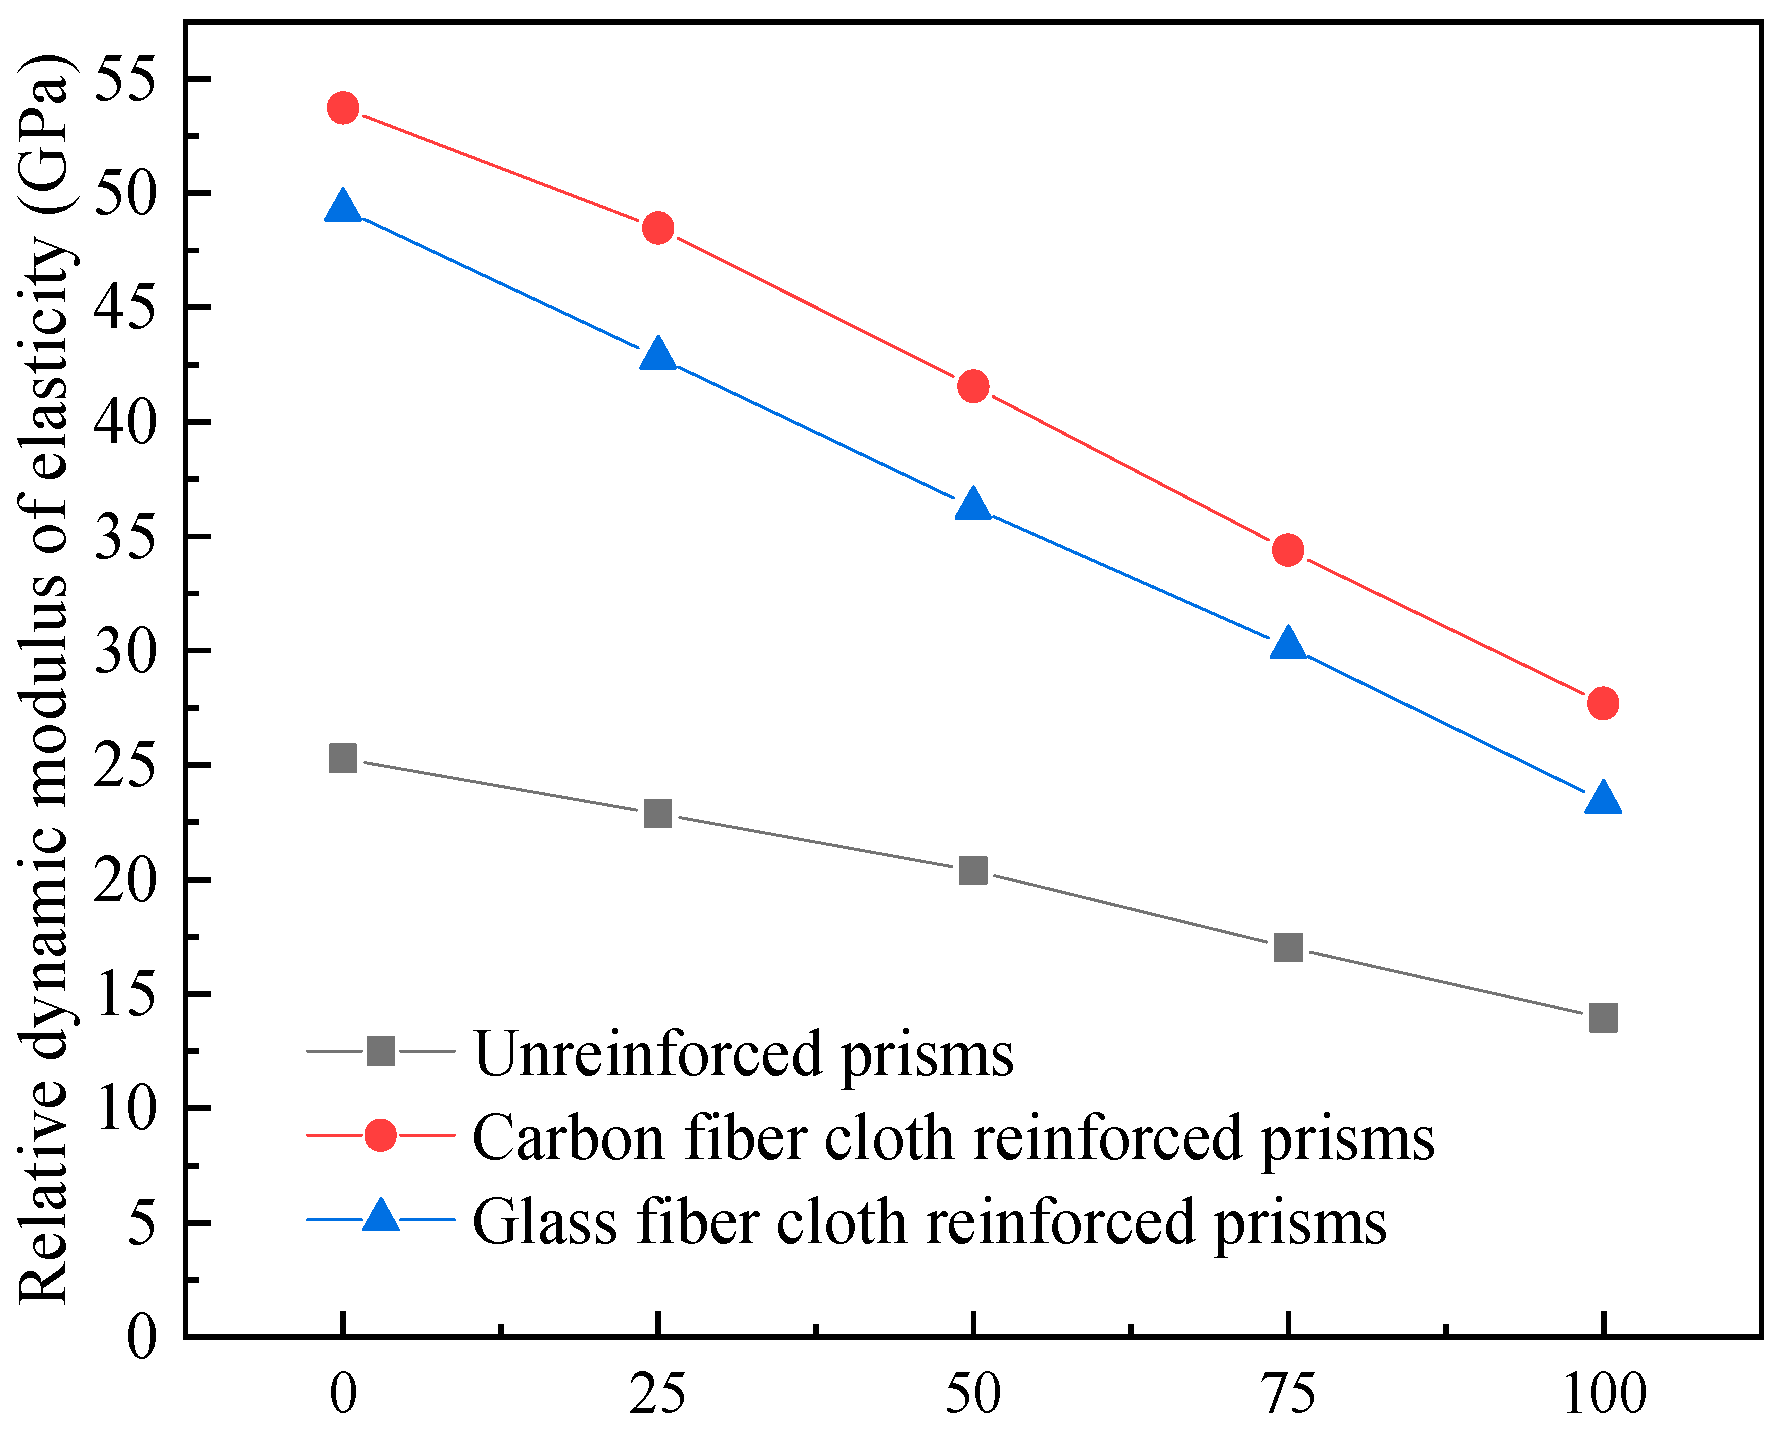
The relative dynamic modulus of elasticity results for unreinforced, CFRP-reinforced, and GFRP-reinforced concrete prisms are shown in Figure 7. The modulus of elasticity of all prismatic specimens decreased with an increasing number of freeze–thaws. The modulus of elasticity of unreinforced, CFRP-reinforced, and GFRP-reinforced concrete prisms decreases by 44.9%, 48.5, and 52.5% after 100 freeze–thaw cycles, respectively. The percentage of elastic modulus reduction is very similar to the three specimens. Figure 7 shows that the slope of descent of unreinforced concrete prisms is less than that of FRP-reinforced concrete prisms. It further shows that the effect of freeze–thaw cycles on the bonding between FRP and concrete is drastic, even more than the effect of freeze–thaw cycles on the concrete itself.
Freeze–thaw cycles affect the compactness and homogeneity of concrete and increase harmful porosity. Meanwhile, the interface cracks between FRP and concrete are aggravated by freeze–thaw cycles, affecting the FRP layer’s bonding effect.

3.4. Compressive and Flexural Strength

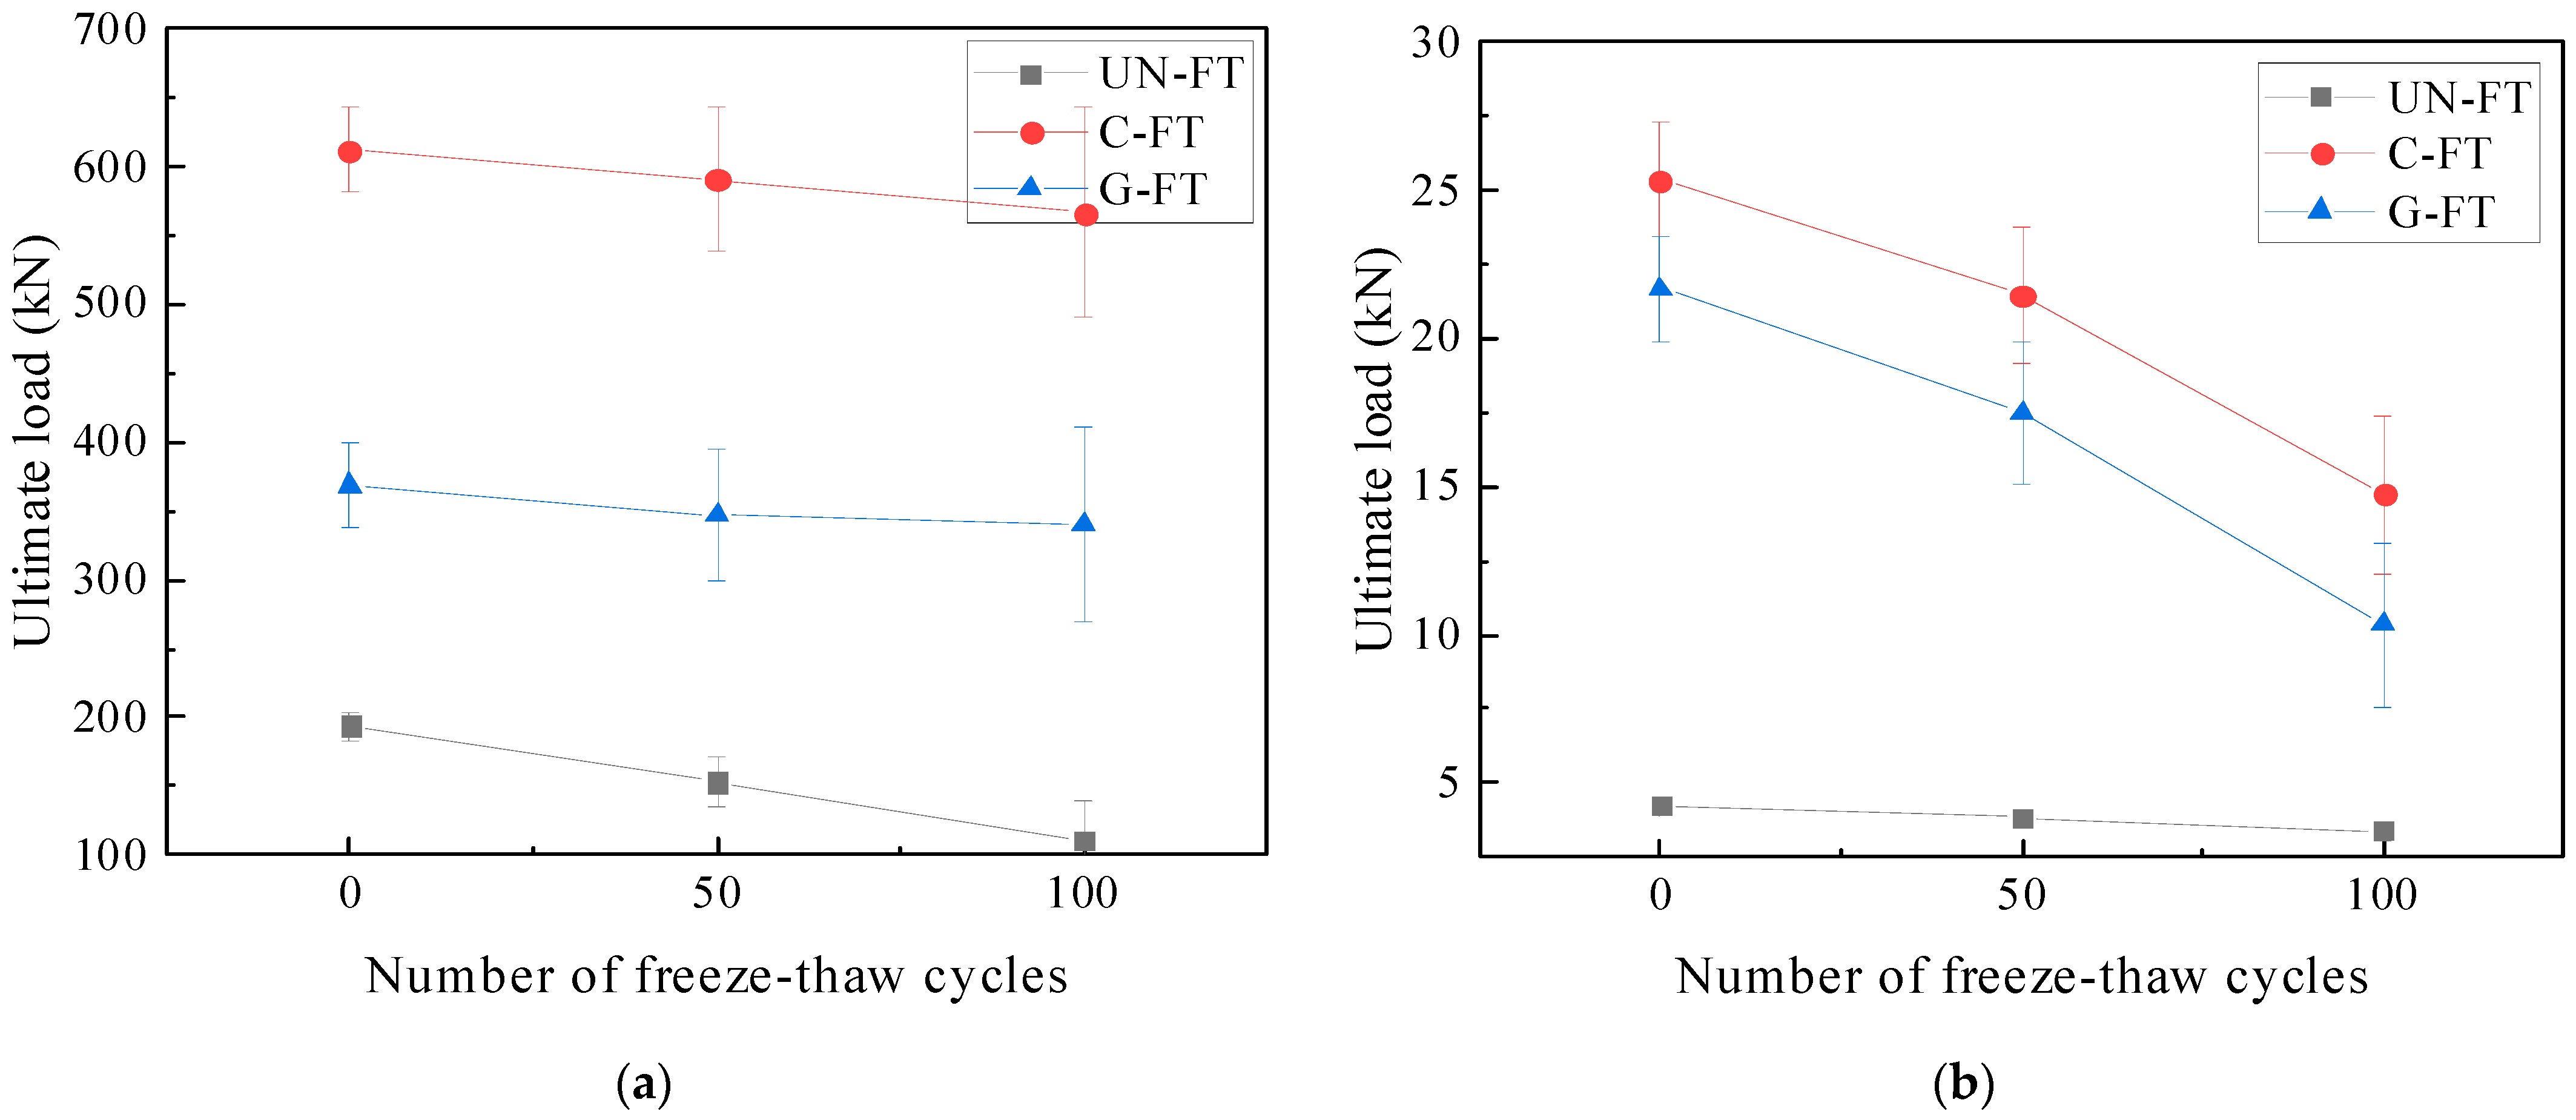
The compressive strength of GFRP-reinforced concrete cylinders is twice that of unreinforced concrete cylinders. The compressive strength of CFRP-reinforced concrete is three times that of unreinforced concrete cylinders. This indicates that different fiber materials have different reinforcing effects on concrete cylinders. The higher the modulus of elasticity, the more pronounced the compressive strength enhancement. The cylindrical and prismatic specimens with CFRP and GFRP adhered are subjected to 0, 50, and 100 freeze–thaw cycles. The specimens of three groups of different categories are obtained to ensure the test data’s stability. The ultimate loads for the compressive and flexural tests of the specimens are shown in Figure 8. The compressive strength of unreinforced, CFRP-reinforced, and GFRP-reinforced concrete cylinders decreases by 27.6%, 7.4%, and 8% after 100 freeze–thaw cycles, respectively. The FRP-wrapped concrete cylinders have high frost resistance and can effectively prevent them from freeze–thaw damage. Comparing the specimens loaded under bending tests, the bending strength of CFRP- and GFRP-reinforced concrete prisms is about four and three times higher than that of unreinforced concrete prisms. Although the tensile strength of CFRP is twice that of GFRP, the difference in the strength of the reinforced concrete prisms between the two is not significant. The bending strength of FRP-reinforced concrete prisms is related to the FRP material’s nature and the epoxy resin adhesive between the concrete and the FRP. The stronger the interfacial adhesion, the higher the flexural strength of the specimens. The flexural strengths of unreinforced, CFRP-reinforced, and GFRP-reinforced concrete prisms decrease by 20%, 42%, and 53%, respectively. The freeze–thaw cycles damage the FRP-reinforced concrete prisms much more than the concrete cylinders. It also confirms the drastic effect of freeze–thaw cycles on the adhesion between interfaces.
The wrapped fiber cloth reinforces the concrete specimens as the number of freezing and thawing increases, and the effect of carbon fiber cloth is better than that of glass fiber cloth. The flexural strength of the ordinary prismatic specimens also increases significantly after the fiber cloth is wrapped. However, the flexural strength of the concrete specimens wrapped with fiber cloth decreases more with increased freezing and thawing.

3.5. Load Displacement or Stress–Strain Analysis

3.5.1. Load Displacement Curve of Prismatic Specimen

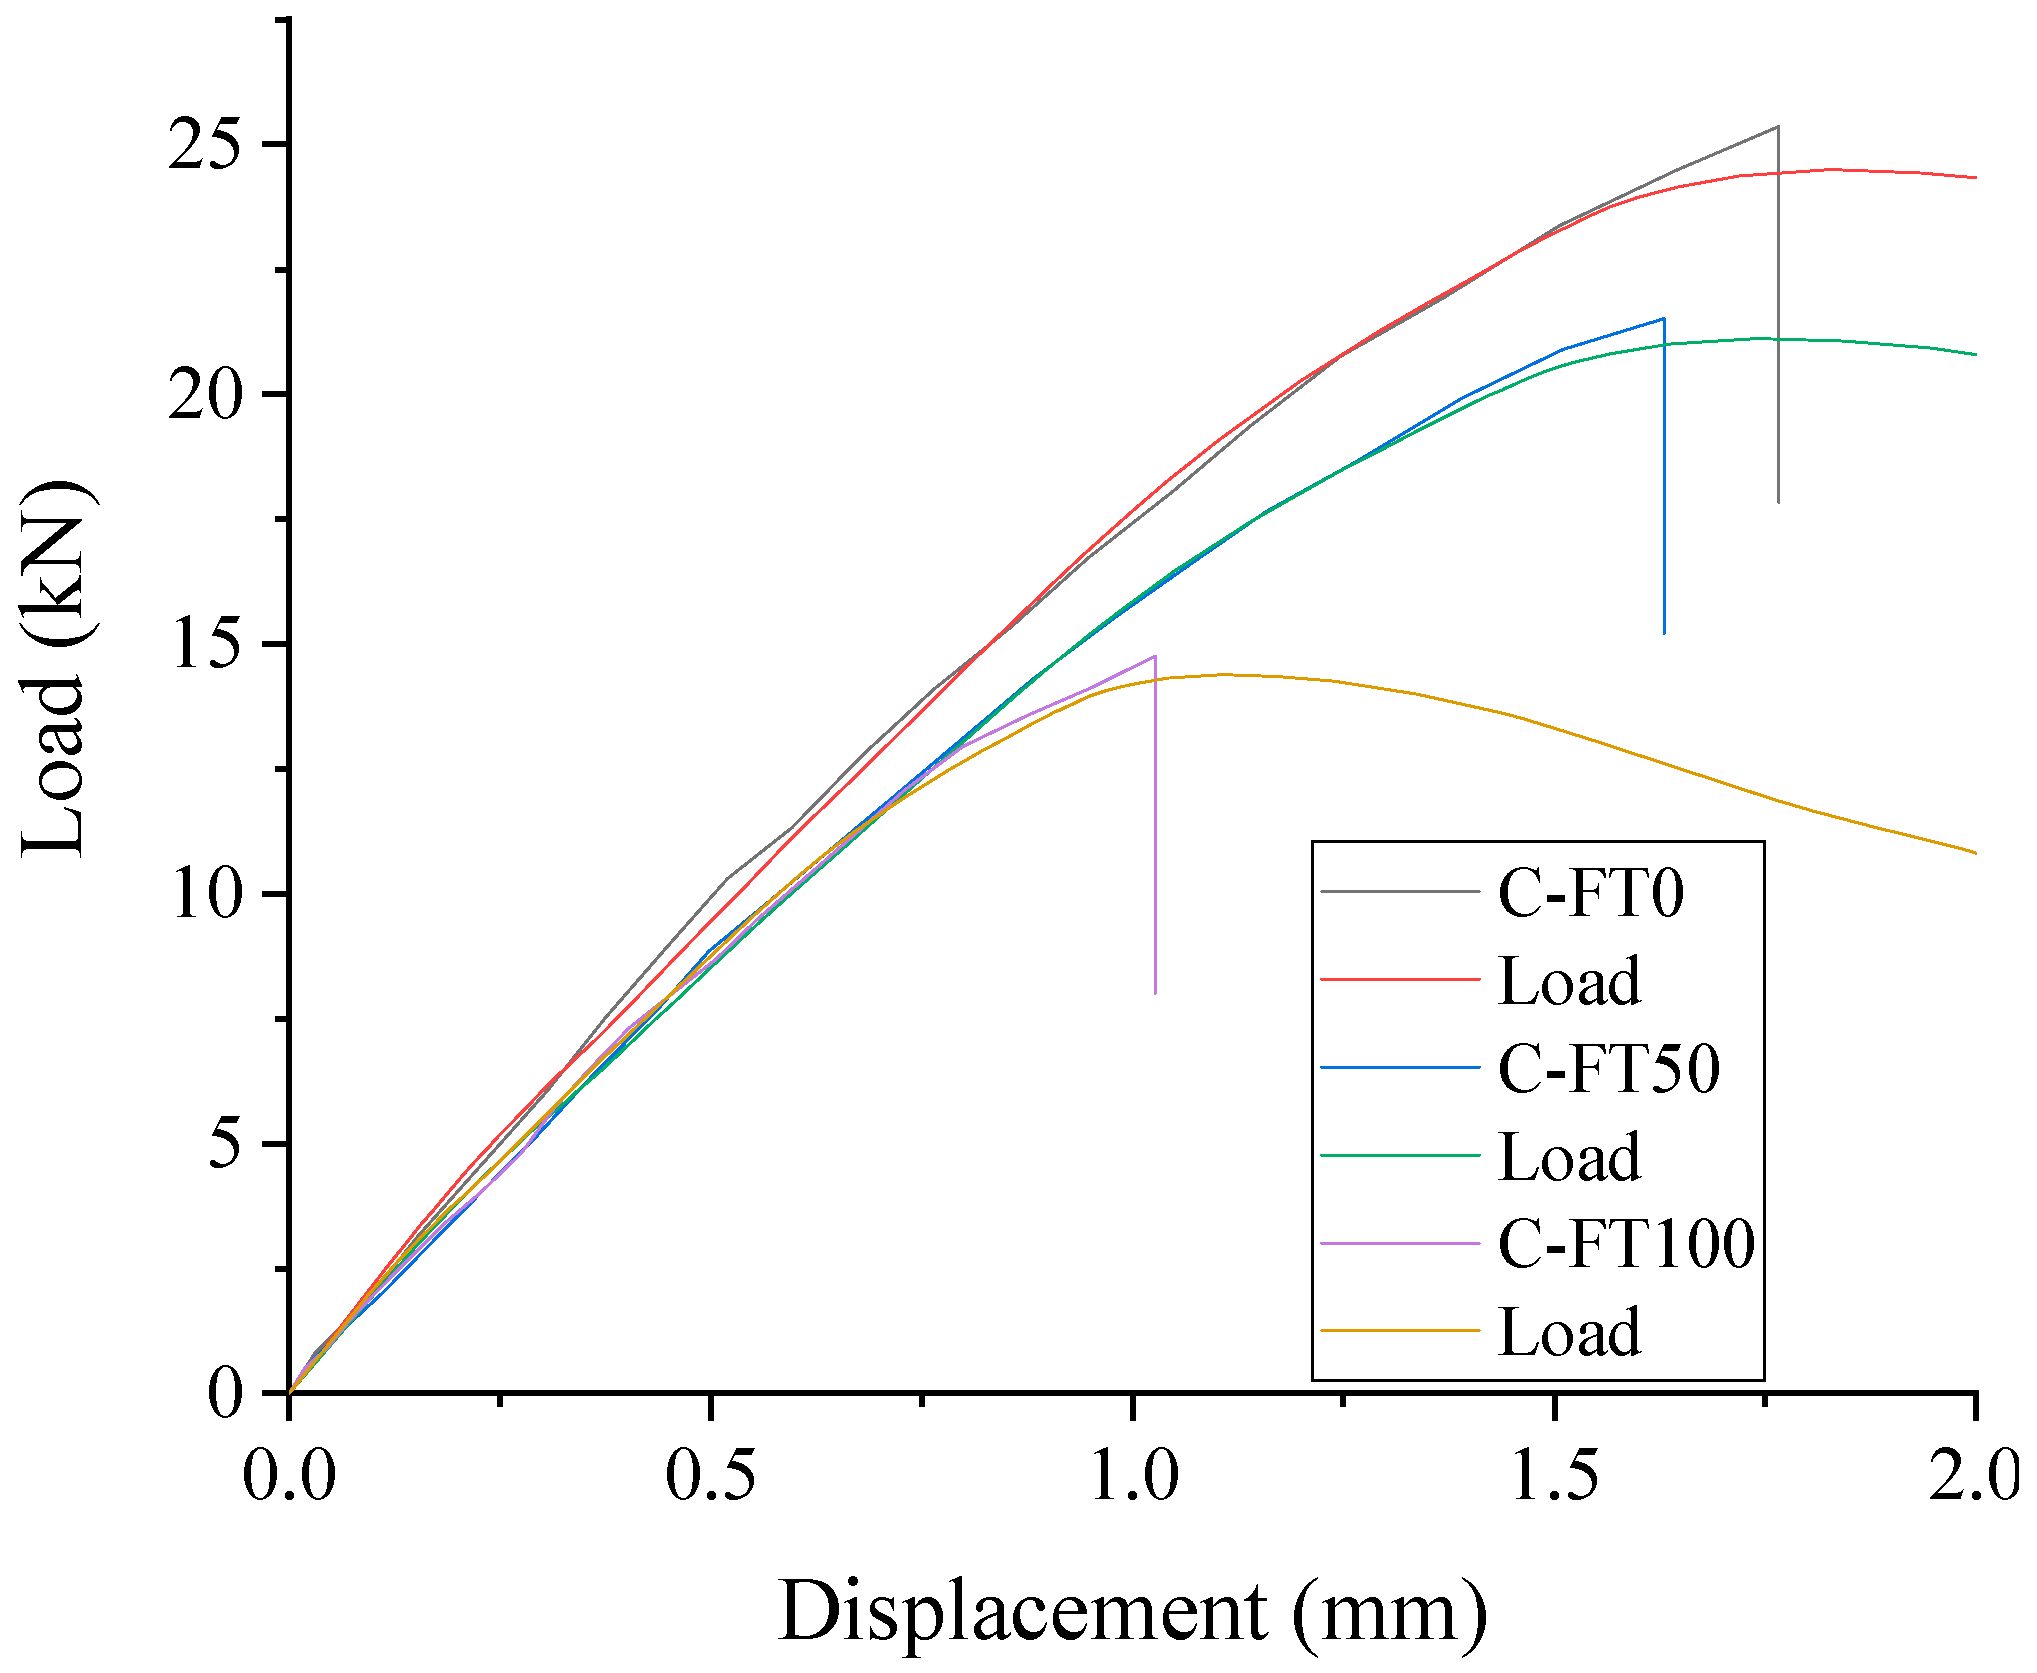
Concrete strain gauges are arranged on the side of the concrete to measure the strain response under load. Displacement sensors are arranged on the top of the specimen to measure the deformation of the member with the change in force, and the loading is measured using pressure sensors. The measured flexural load–displacement curves of each prismatic specimen are shown in Figure 9. The curve of the plain concrete specimen rises slowly and then drops abruptly, as shown in Figure 9a. The flexural test results show that the ultimate bearing capacity of the specimens with 0, 50, and 100 freeze–thaw cycles decrease sequentially. The curves of carbon and glass fiber fabric specimens also consist of rising and rapidly falling segments. The flexural performance of carbon fiber cloth specimens relative to plain concrete specimens increases by 21.15 kN, 17.65 kN, and 11.36 kN, respectively. The flexural performance of glass fiber specimens relative to plain concrete specimens increases by 17.47 kN, 13.67 kN, and 6.98 kN, respectively, at 0, 50, and 100 freeze–thaw cycles. The analysis of the combined test data shows that the ultimate load capacity of fiber and glass fiber specimens is significantly increased overall, and there is no significant difference. The increase in ultimate load-carrying capacity is mainly due to the fiber cloth limiting the lateral deformation of the plain concrete and acting as a reinforcement.

3.5.2. Stress–Strain Relationship for Cylindrical Specimens

The measured compressive load–displacement curves of each cylindrical specimen are shown in Figure 10. The curve of the plain concrete specimen has only a monotonic rising segment, as shown in Figure 10a. The axial compression test results show that the specimens’ ultimate bearing capacity with 0, 50, and 100 freeze–thaw cycles decreases sequentially. The curves of CFRP- and GFPR-reinforced specimens are shown in Figure 10b,c. The curves of both carbon fiber and glass fiber fabric specimens consist of rising segments. The compressive performance of carbon fiber cloth specimens relative to plain concrete specimens increases by 441.33 kN, 439.91 kN, and 430.34 kN, respectively. Compared to plain concrete specimens, the compressive performance of glass fiber cloth specimens increases by 199.62 kN, 201.20 kN, and 199.13 kN for 0, 50, and 100 freeze–thaw cycles, respectively. The analysis of the combined test data shows that the ultimate strain increases and the ultimate stress decrease as the number of freeze–thaw cycles increases in the specimens, regardless of whether FRP is used for concrete reinforcement. In addition, the difference between the specimens with different freeze–thaw times is mainly more apparent in the pre-loading period, and the concrete slope after freeze–thaw is low. The slope of FRP is almost constant in the late loading period. However, it is clearly observed that the slope of CFRP is greater than that of GFRP. The modulus of elasticity of the FRP material affects the modulus of elasticity of the FRP-reinforced concrete cylinder and, thus, the final ultimate strength.

4. Finite Element Simulation

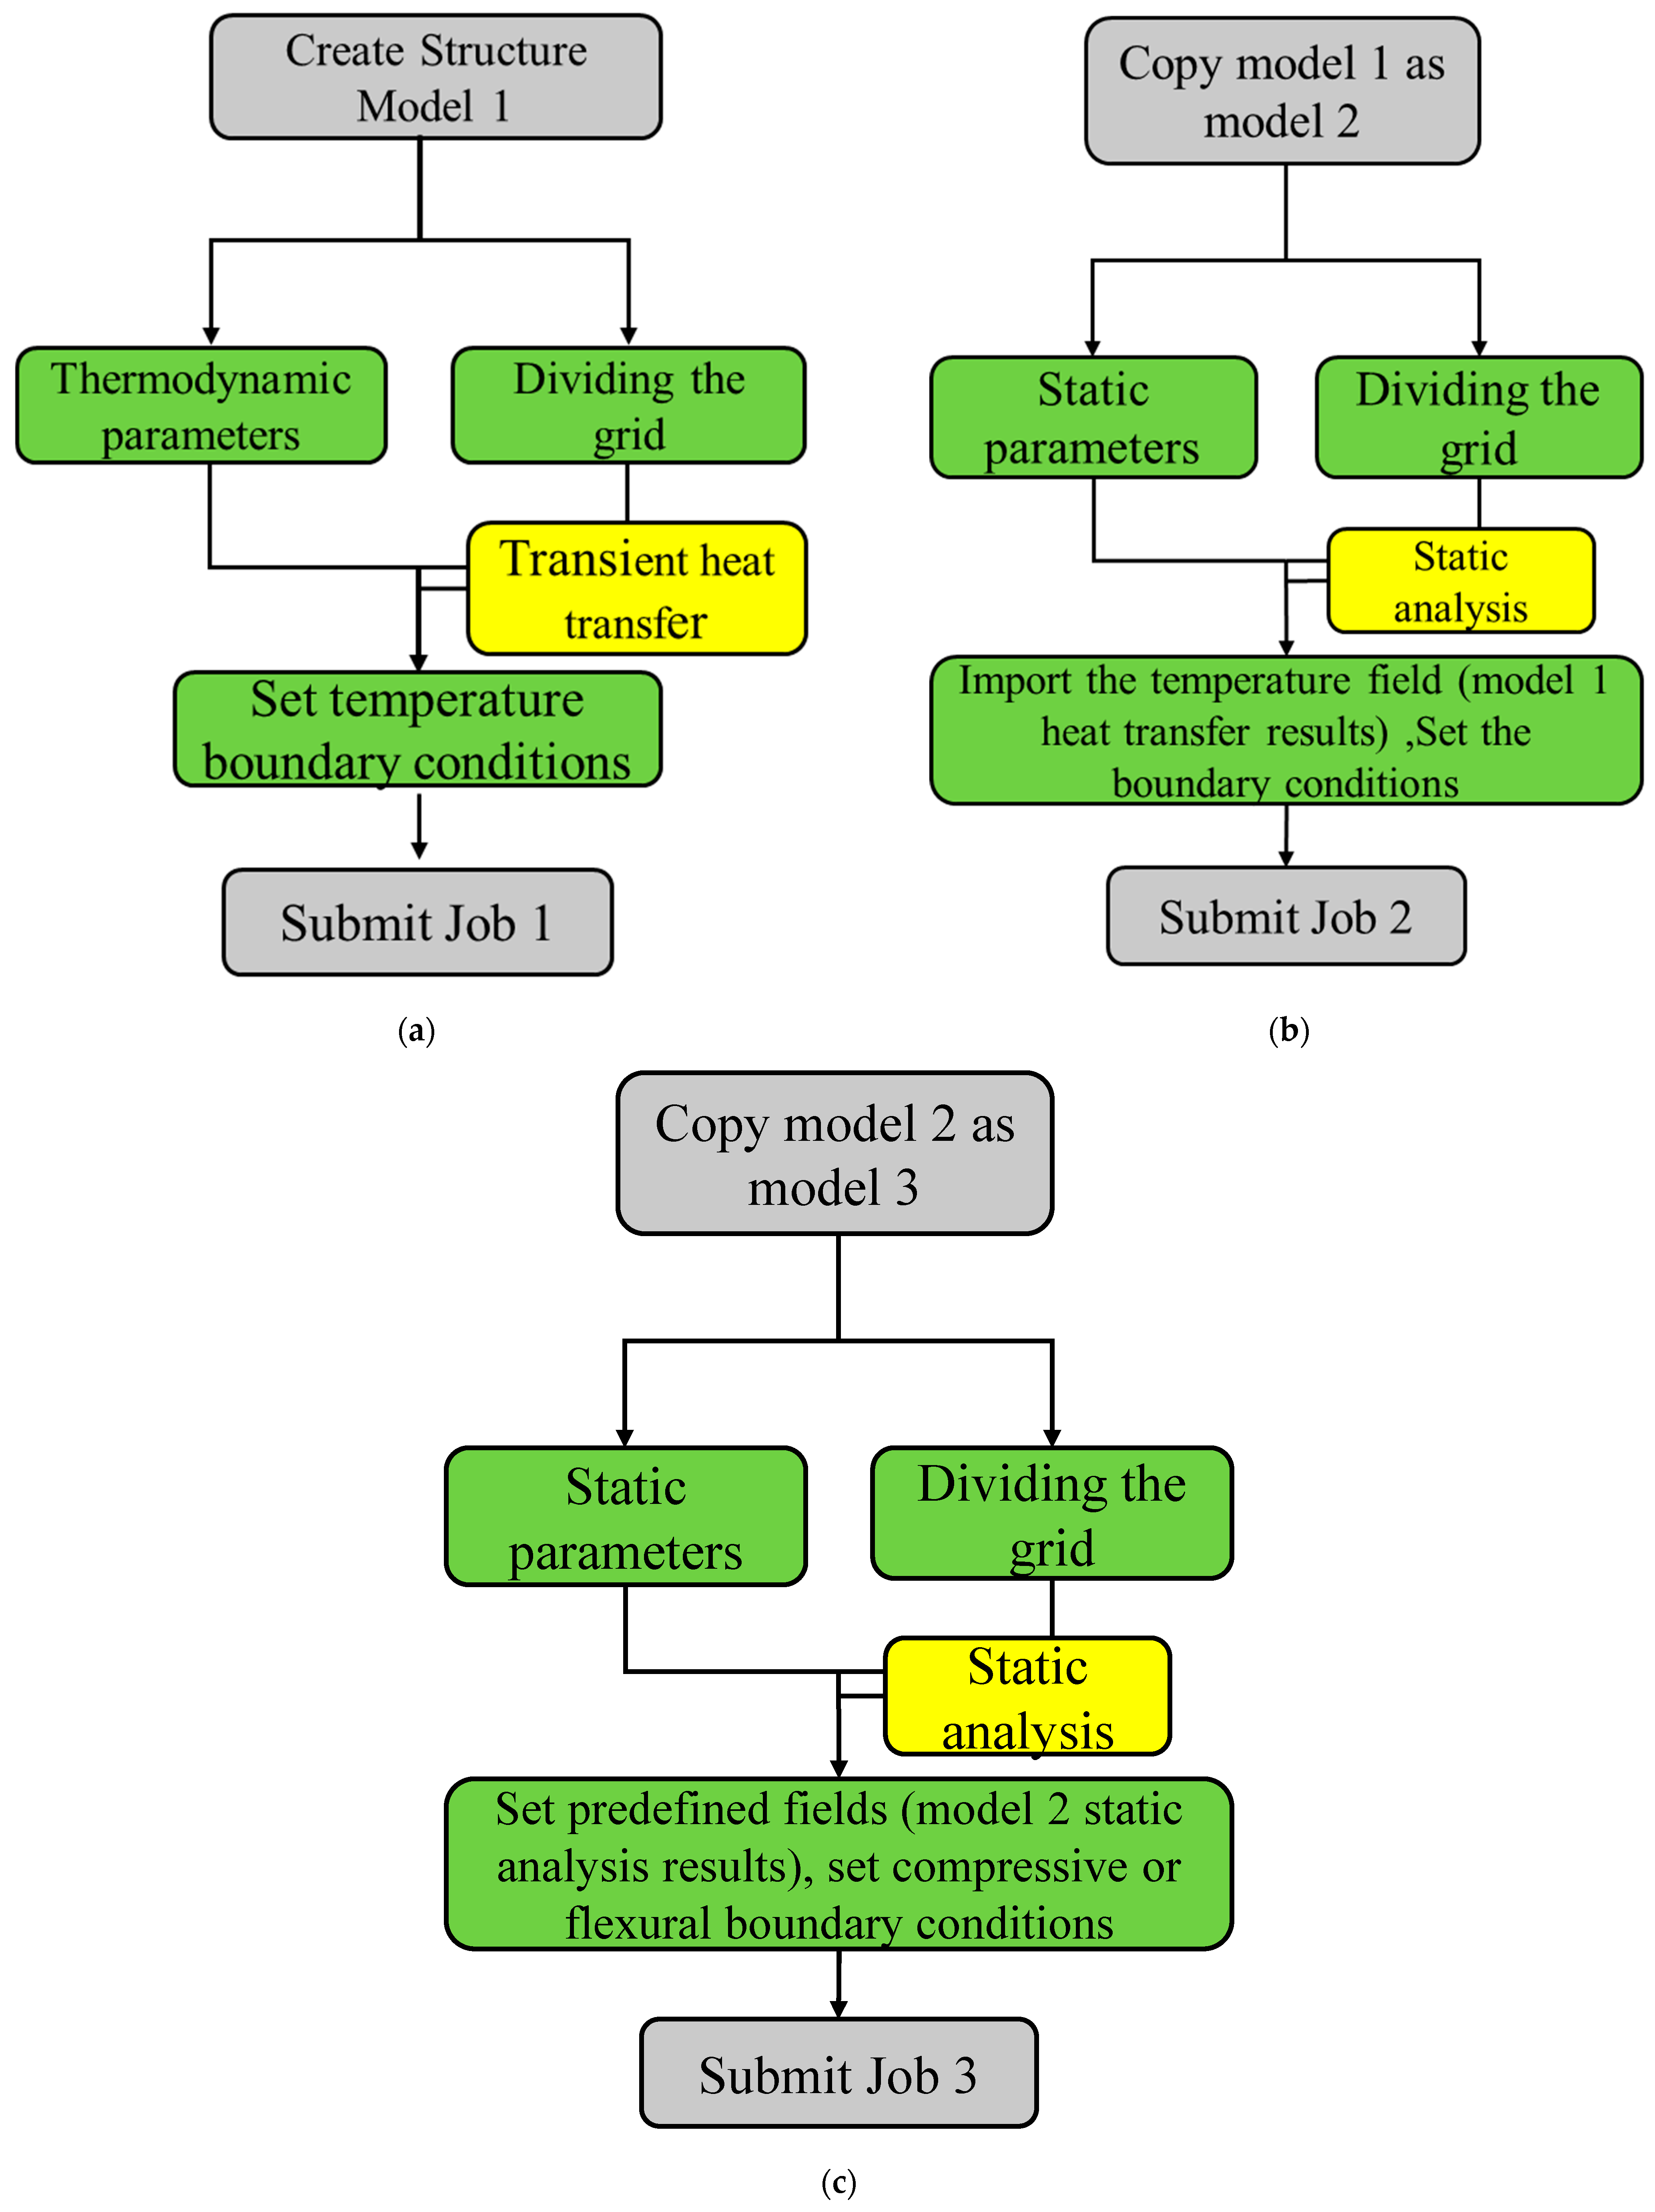
Concrete structures are exposed to alternating freeze–thaw environments. Due to the heat transfer methods, an uneven temperature field distribution inside the concrete is observed, resulting in an uneven distribution of its internal stresses, accelerating the deterioration of concrete materials and affecting its service life. Therefore, it is essential to carry out a numerical simulation analysis of the internal temperature field of concrete under the action of a freeze–thaw environment to analyze the internal temperature stress of concrete and to study the thermomechanical and degradation properties of materials. This study uses transient heat transfer analysis theory and sequential coupled heat stress analysis to numerically simulate concrete freeze–thaw cycles [27,28]. Therefore, the transient heat transfer analysis of concrete is performed first, and the “resultant output” of the heat transfer analysis is used as the freeze–thaw load of concrete (temperature field) to calculate the freeze–thaw damage of concrete. Then, the “resultant output” of freeze–thaw damage is used as the “initial input” condition for the analysis of concrete compressive and flexural behavior (Figure 11).

4.1. Thermodynamic Parameters

The distribution of the internal temperature field of concrete is mainly influenced by the external ambient temperature and its factors. Based on Fourier’s law, the heat transfer equation for concrete is known [29,30].
ρ c T x = x λ T x + Q
where T is the absolute temperature, K. ρ is the mass density of the material, kg/m3. c is the specific heat capacity of the material, J/(kg °C). λ is the effective thermal conductivity of the material, W/(m·K), mainly related to the coarse aggregate content and humidity conditions. Finally, Q is the heat source, mainly for the early-age concrete cement hydration exothermic and water evaporation heat loss formation. Thus, the heat of hydration is negligible for concrete under normal working conditions, i.e., Q = 0.
In the freeze–thaw machine, the test specimen is immersed in water and subjected to temperature action through the temperature change of the water. The freezing and thawing of the specimen are mainly influenced by λ, c, and ρ, as shown in Equation (1). Griffis et al. [24] conducted experimental tests on the thermal conductivity of CFRP materials for early applications in the aerospace industry. Their findings show that the thermal conductivity of the initial composites is 1.4 T/(m·K). The literature [25,31] shows that the mass density of CFRP material is constant up to 510 °C as 1600 kg/m3. The specific heat capacity of CFRP can be calculated according to the literature (Equation (2)). The thermodynamics of GFRP is referenced to that used in the literature [25].
C C F R P = 1.25 + 2.2 1.25 / 325 T C F R P , 0   ° C T C F R P 325   ° C 2.2 + 5 2.2 / 343 325 · T C F R P 325 , 325   ° C T C F R P 343   ° C 5 + 4.85 5 / 510 343 · T C F R P 343 , 343   ° C T C F R P 510   ° C 4.85 + 1.265 4.85 / 538 510 · T C F R P 510 , 510   ° C T C F R P 538   ° C 1.265 + 2.65 1.265 / 3316 538 · T C F R P 538 , 538   ° C T C F R P 3316   ° C
The temperature at room temperature is 20 °C. The material parameters are shown in Table 5.
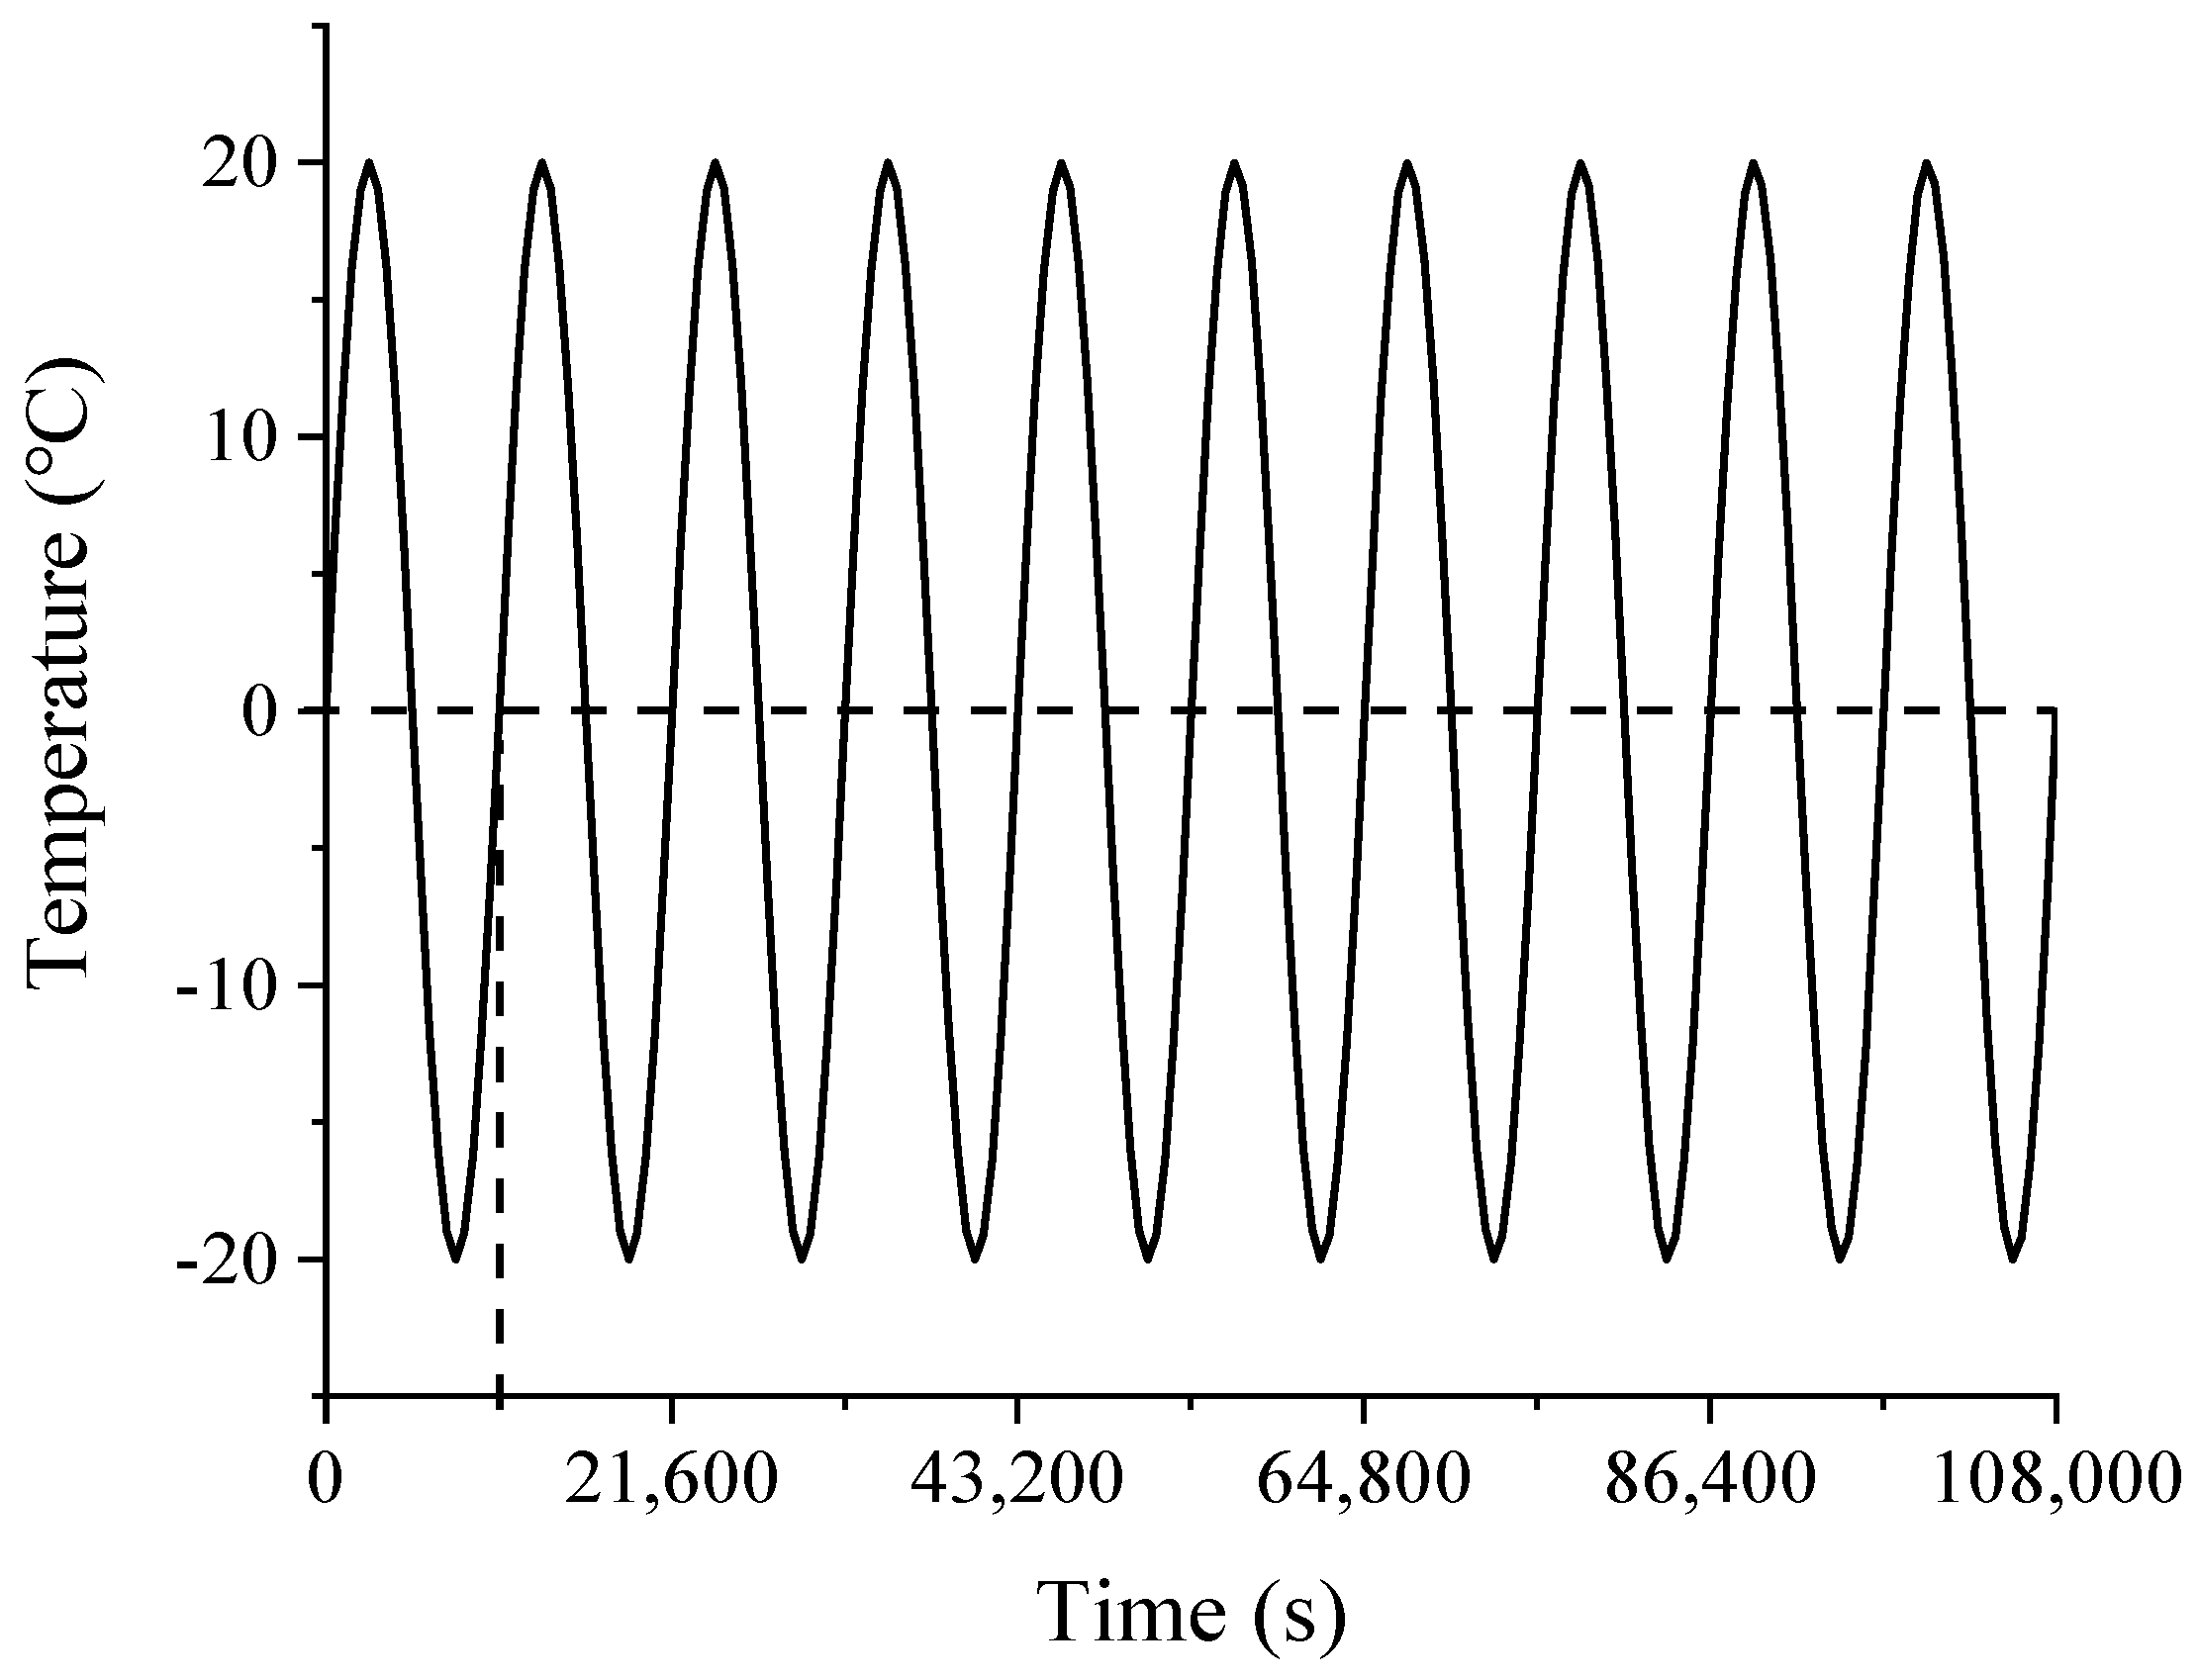
According to the actual temperature cycle time setting of the freeze–thaw tester, one simulated freeze–thaw cycle is set to 3 h, 50 freeze–thaw cycles are 540,000 s, and 100 freeze-thaw cycles correspond to 1,080,000 s, respectively. Therefore, the heat transfer analysis step is selected, the time lengths are set to 540,000 s and 1,080,000 s, respectively, and the load changes with time in a quick manner. Due to page limitations, only ten freeze–thaw cycle temperature variation curves are presented (Figure 12). The cell mesh class is an eight-node linear heat transfer hexahedral cell (DC3D8) with a cell type of heat transfer.
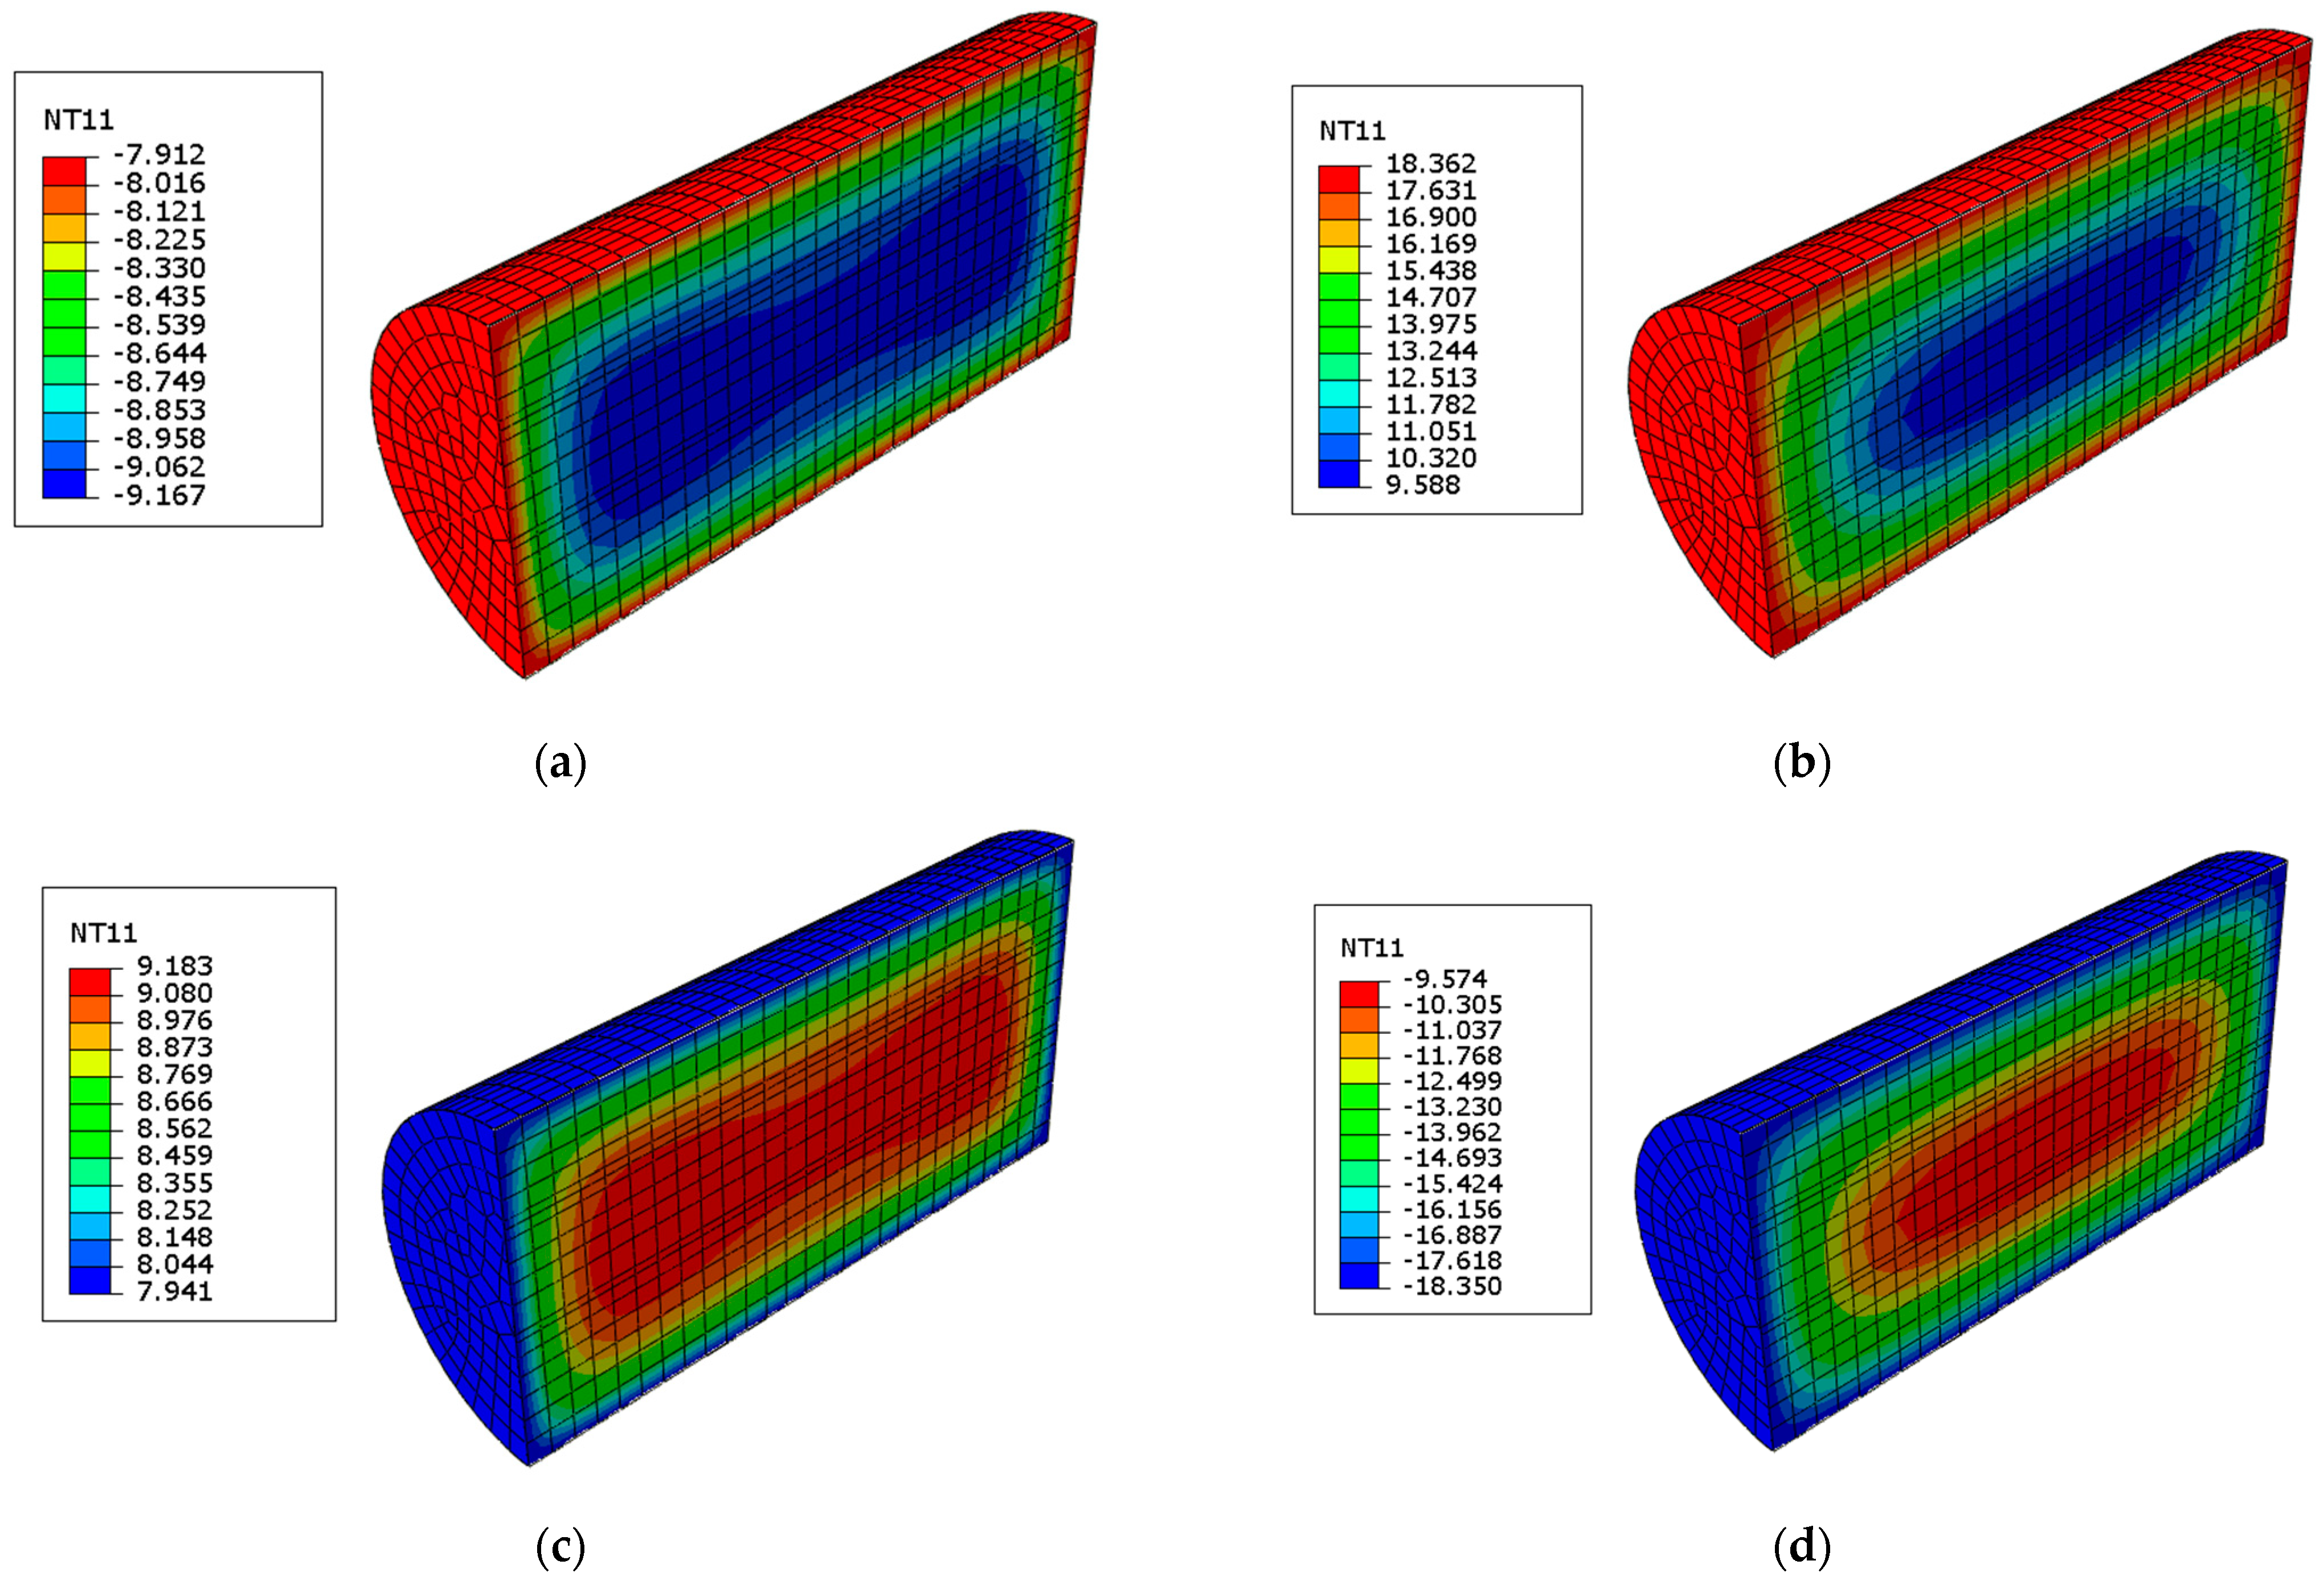
Figure 13 shows the nodal temperature clouds for the freeze–thaw simulation of the specimens. Figure 13a–d show the temperature clouds of the four adjacent frames. The change from Figure 13a to Figure 13b shows that the edge temperature increases from −8.0 °C to 18.4 °C. During this process, the temperature of the specimen gradually increases, and the surrounding water changes from a frozen state to a liquid state. In the change from Figure 13c to Figure 13d, the specimen edge temperature decreases from 18.4 °C to 7.9 °C, while the internal temperature decreases from 9.6 °C to 9.2 °C. This process is the freezing process of the freeze–thaw cycle.
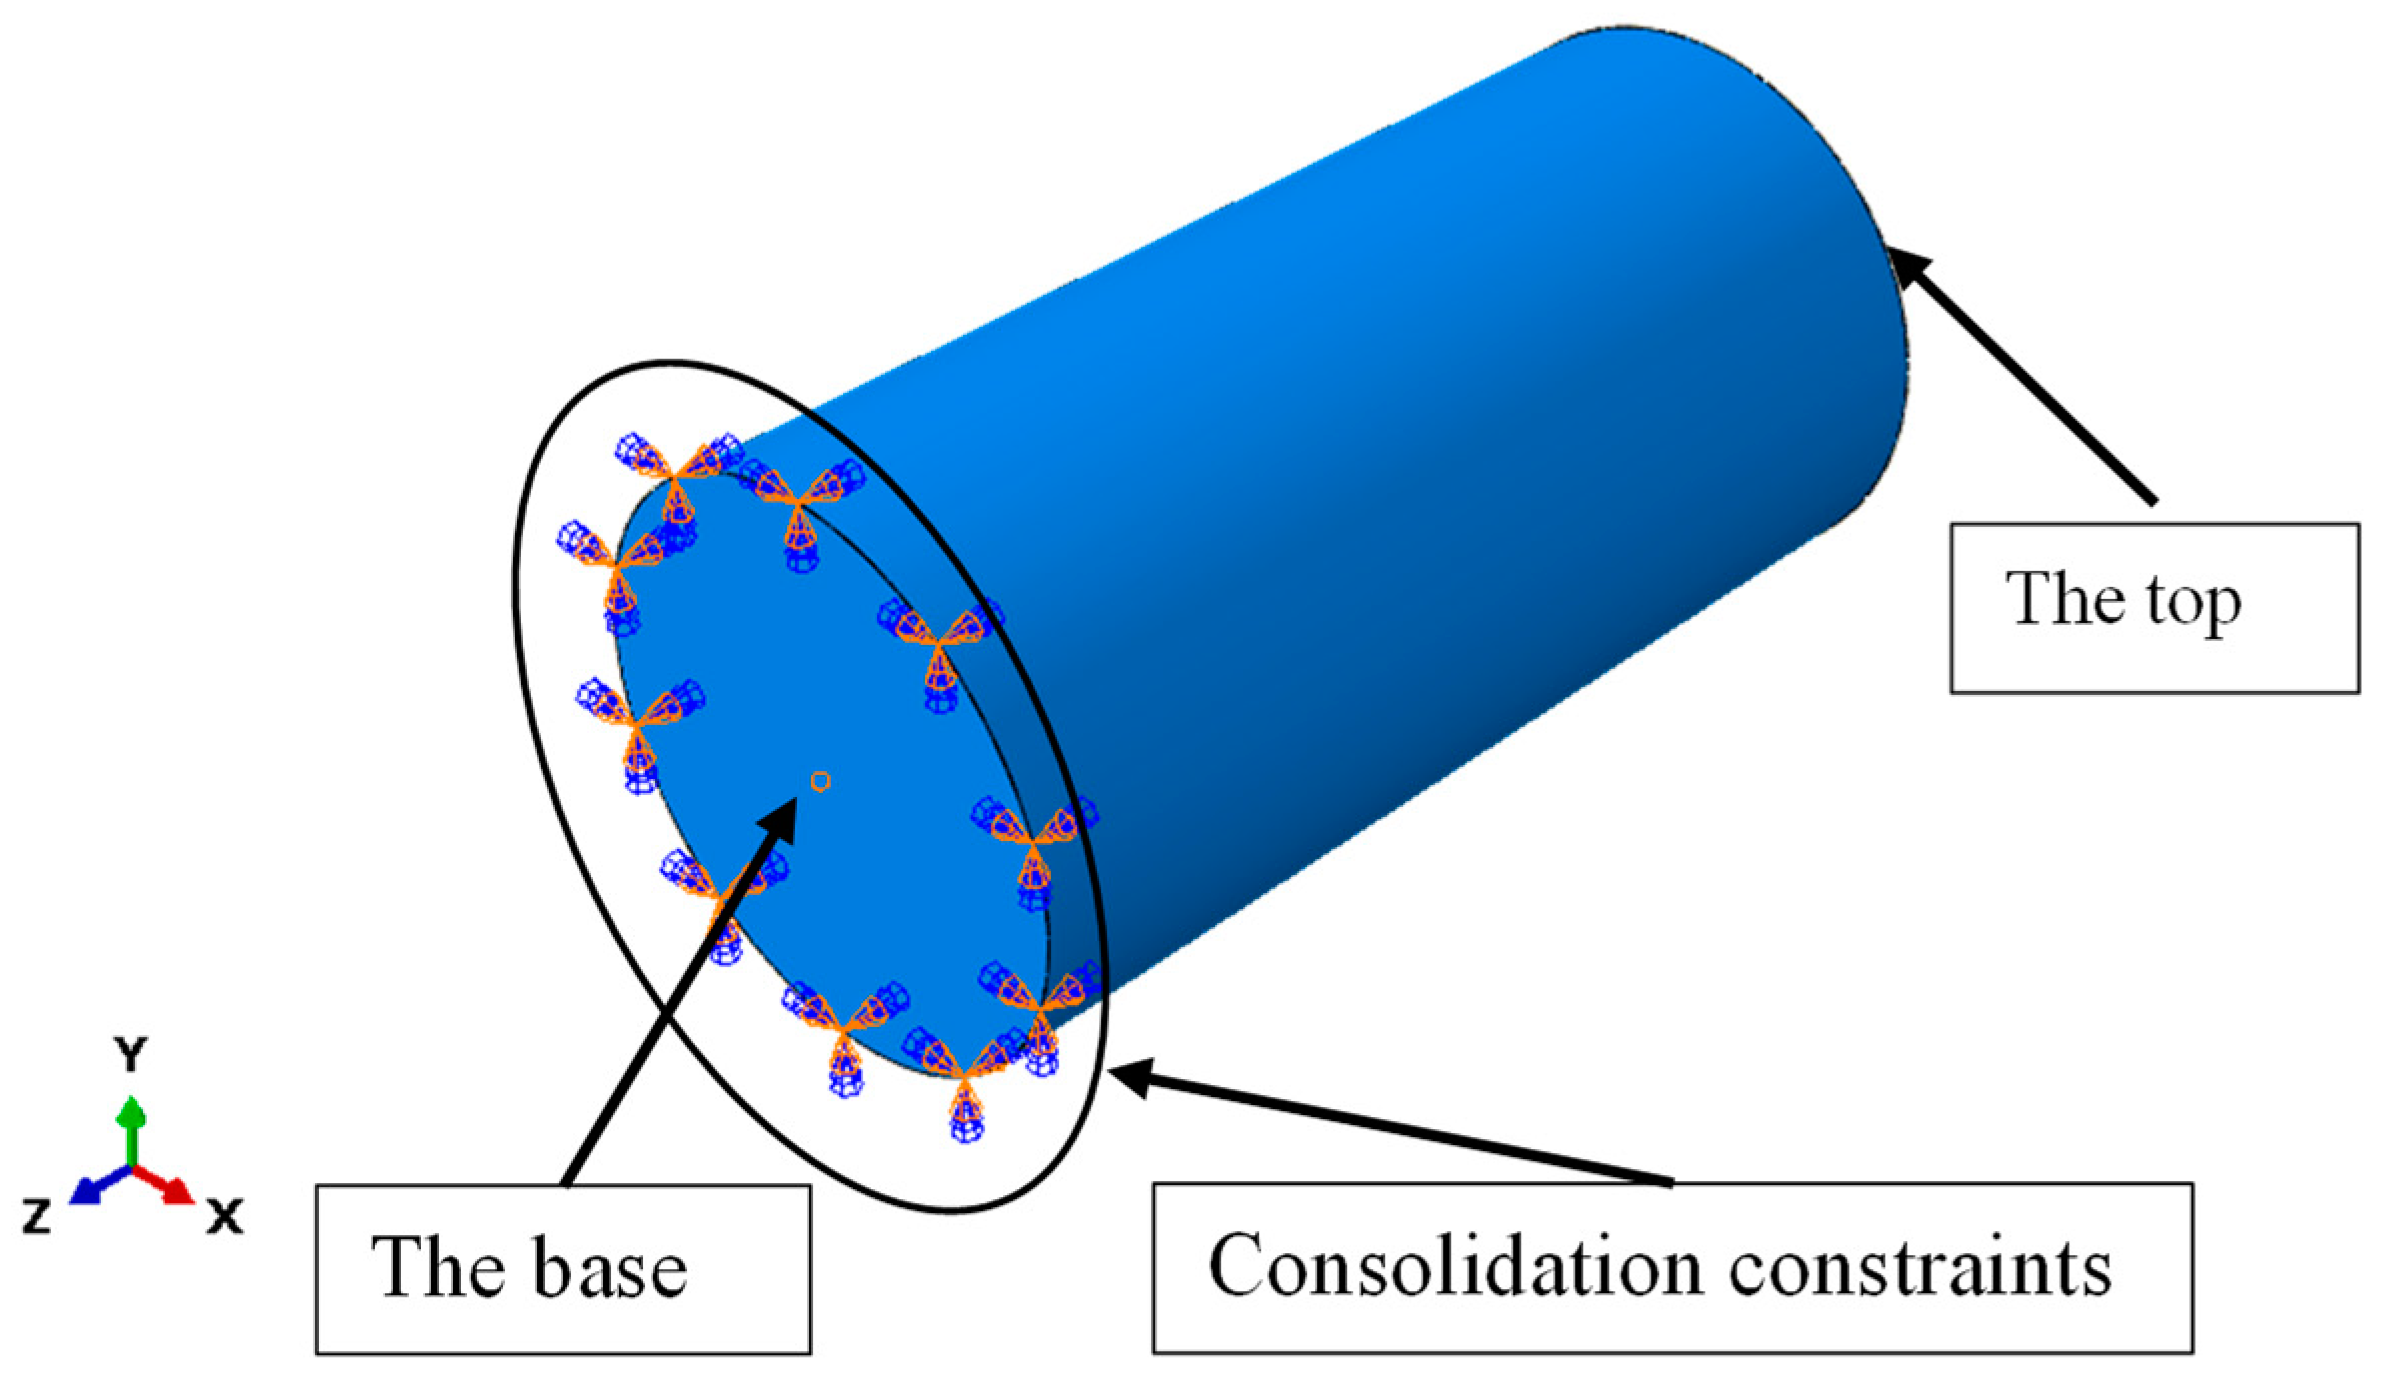
Model 1, which undergoes heat transfer analysis, is replicated as Model 2 for static analysis. Model 2 has a fixed constraint on the bottom and an eight-node linear hexahedral cell (C3D8R) for concrete. The mesh type is 3D Stress. The fiber cloth is made of a four-node curved thin-shell or thick-shell (S4R) grid with a shell type. Figure 14 shows the boundary conditions and directions of the finite element model.
Material parameters are shown in Table 6. According to the literature [32,33,34], the tensile strengths of CFRP and GFRP are 1859.1 MPa and 1507 MPa, respectively. The coefficient of expansion of fiber composites is −0.1 × 10⁻⁶ [35]. The plastic damage principal structure model of concrete proposed by Lee and Fenves [35] is used. The core of the model assumes that the damage to concrete materials is mainly in the form of cracking damage in tension and crushing damage in compression. The CDP model defines the concrete damage surface as determined by the equivalent plastic strain tensor εpl, and the specific stress–strain relationship can be expressed as:
σ = 1 D D 0 e l : ε ε p l
where parameter D represents the isotropic damage variable and the initial undamaged linear elastic tensor, and the following two equations can convert the effective stress tensor and the total stress:
σ ¯ = D 0 e l : ε ε p l
σ = 1 d σ ¯
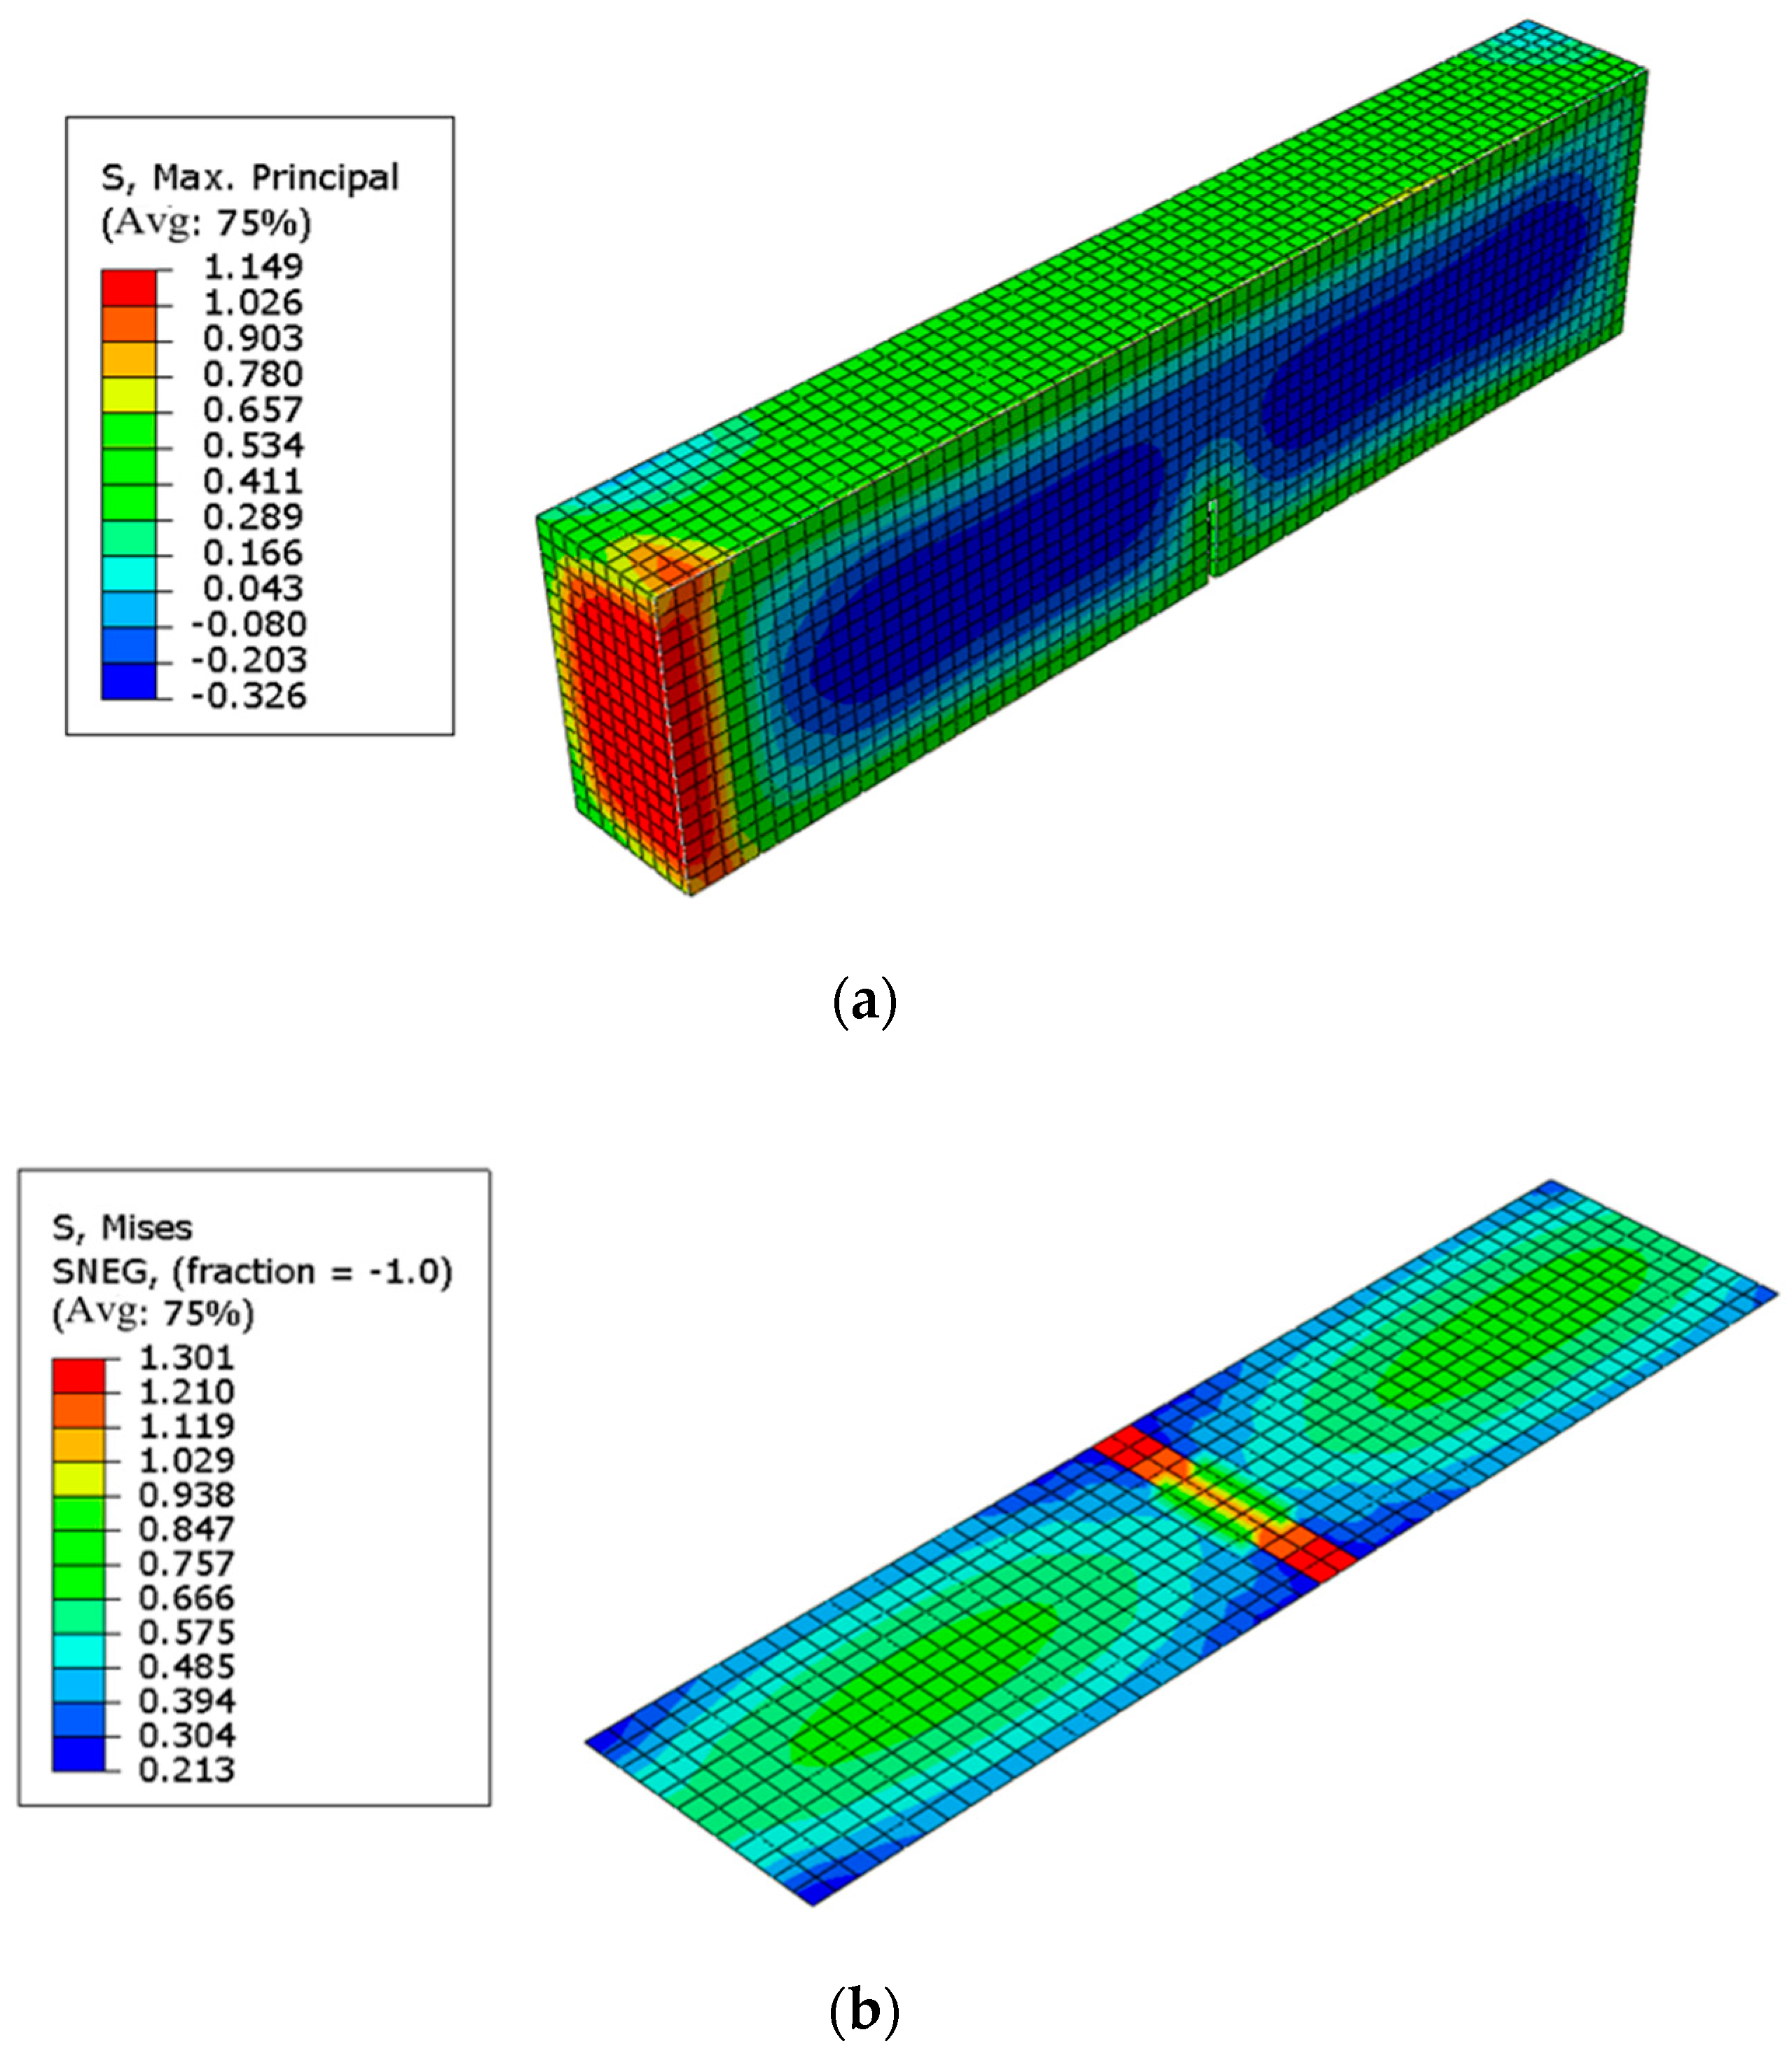
Figure 15 shows the stresses in the cylindrical model at 99–100 freeze–thaws. Figure 15a shows the red area at the bottom of the specimen with high tensile stress. The specimen deformation is limited by the fixed restraint applied at the bottom and the lateral restraint effect of CFRP. Figure 15b shows that the bottom of the fiber cloth is the blue area, and the top is the green area. The stress in the middle area is higher, with the maximum tensile stress down the middle, because the bottom of the specimen deformation is so limited that the middle and lower parts of the specimen produce large deformation and the maximum stress of the fiber cloth.
Figure 16 shows the stresses in the prismatic model at 99–100 freeze-thaws. Figure 16a has the same stress distribution pattern as Figure 15a. However, the higher stress in the middle of the fiber cloth can be seen in Figure 16b due to the freeze–thaw environment that causes the concrete to deform more at the gap.

4.2. Numerical Simulation of Axial Pressure

Based on Model 2, completed by freeze–thaw, the boundary setting of Model 3 is completed. A reference point is created at the top center of the model and the reference point is coupled to the top surface of the specimen. The computational output of model 2 is imported into the predefined field of model 3, and the final state of model 2 is used as the initial state of model 3.
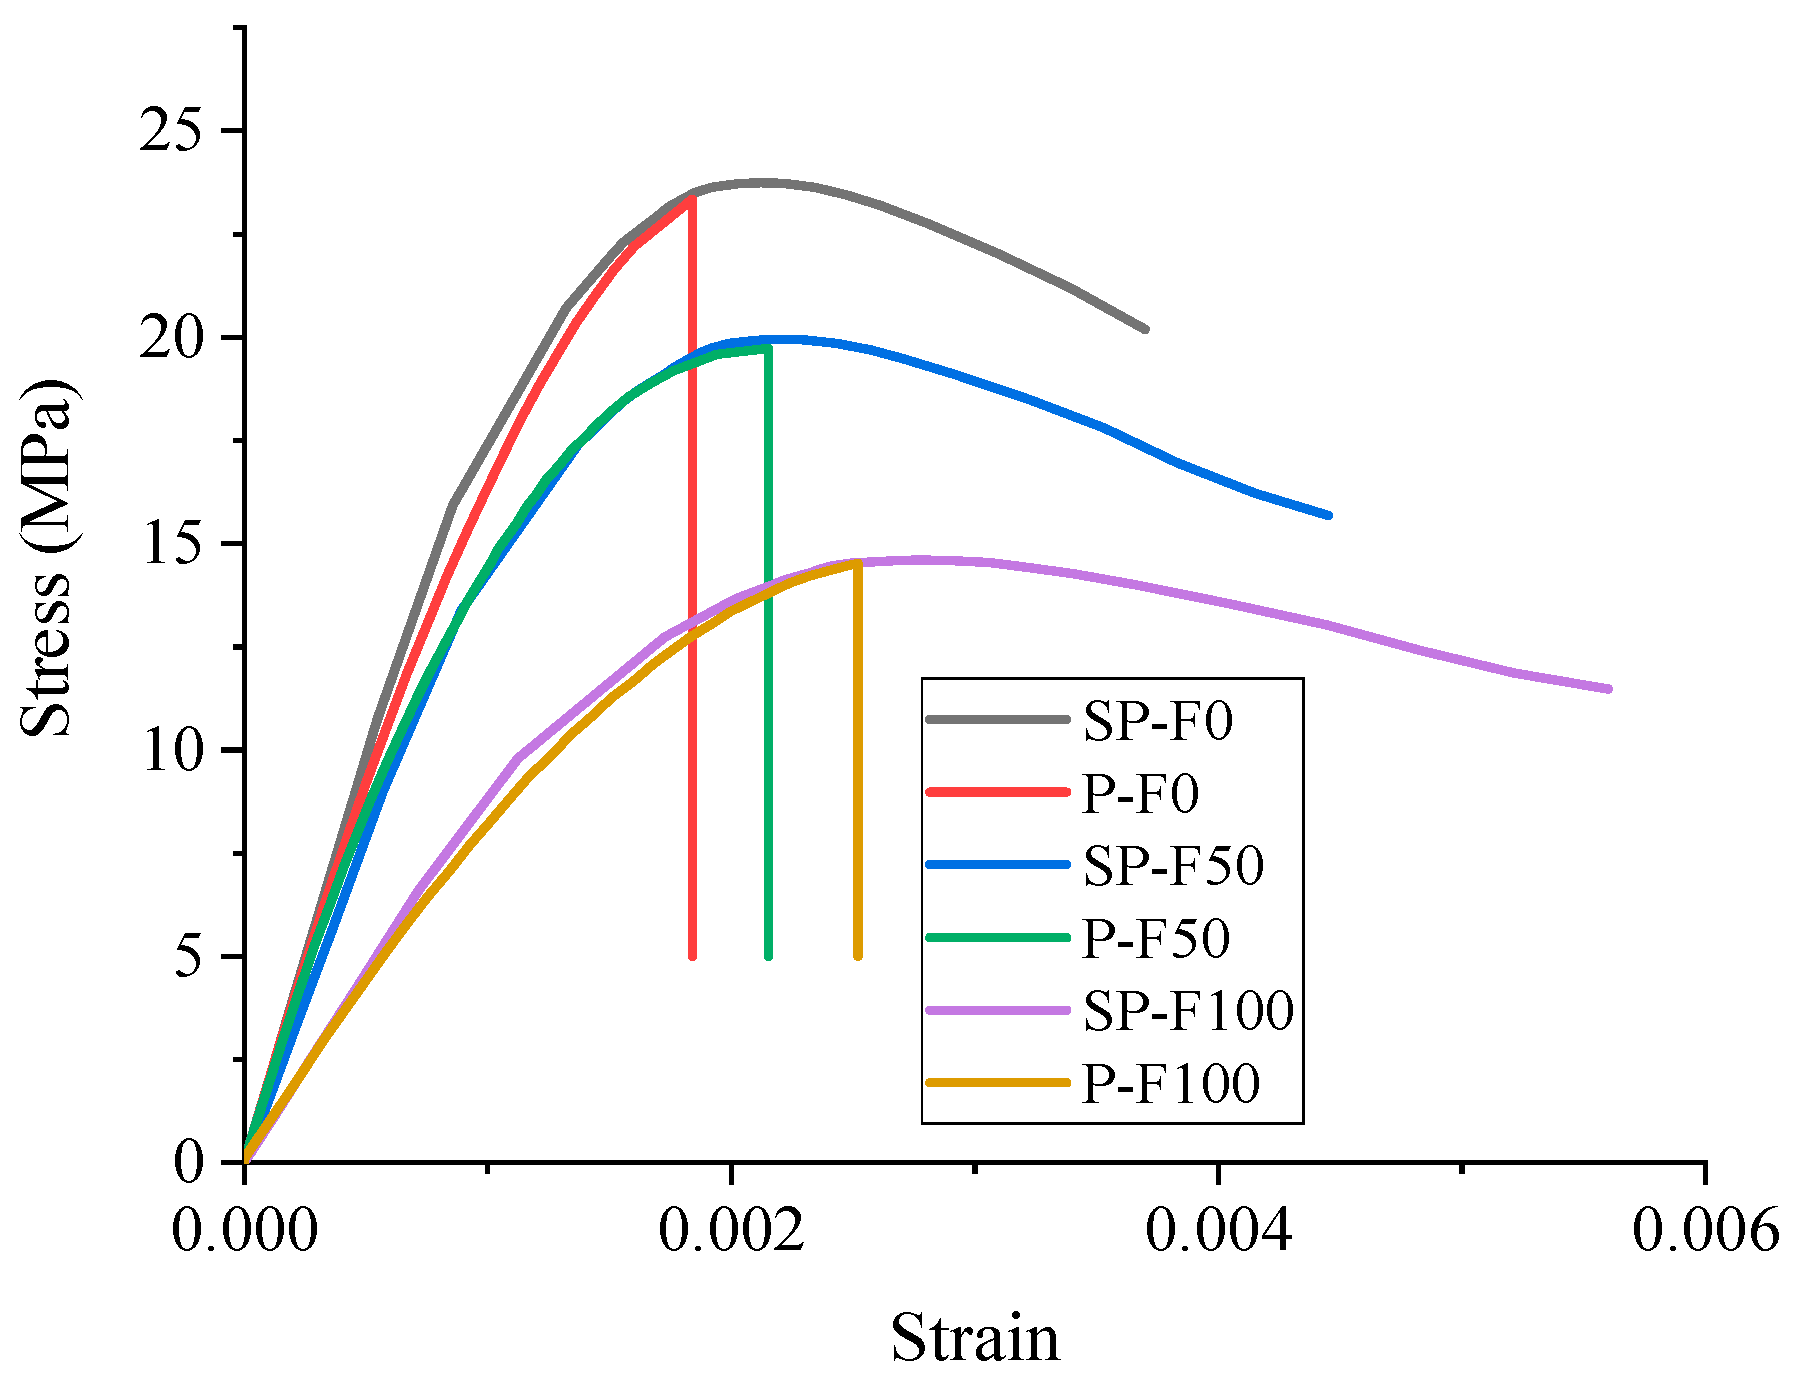
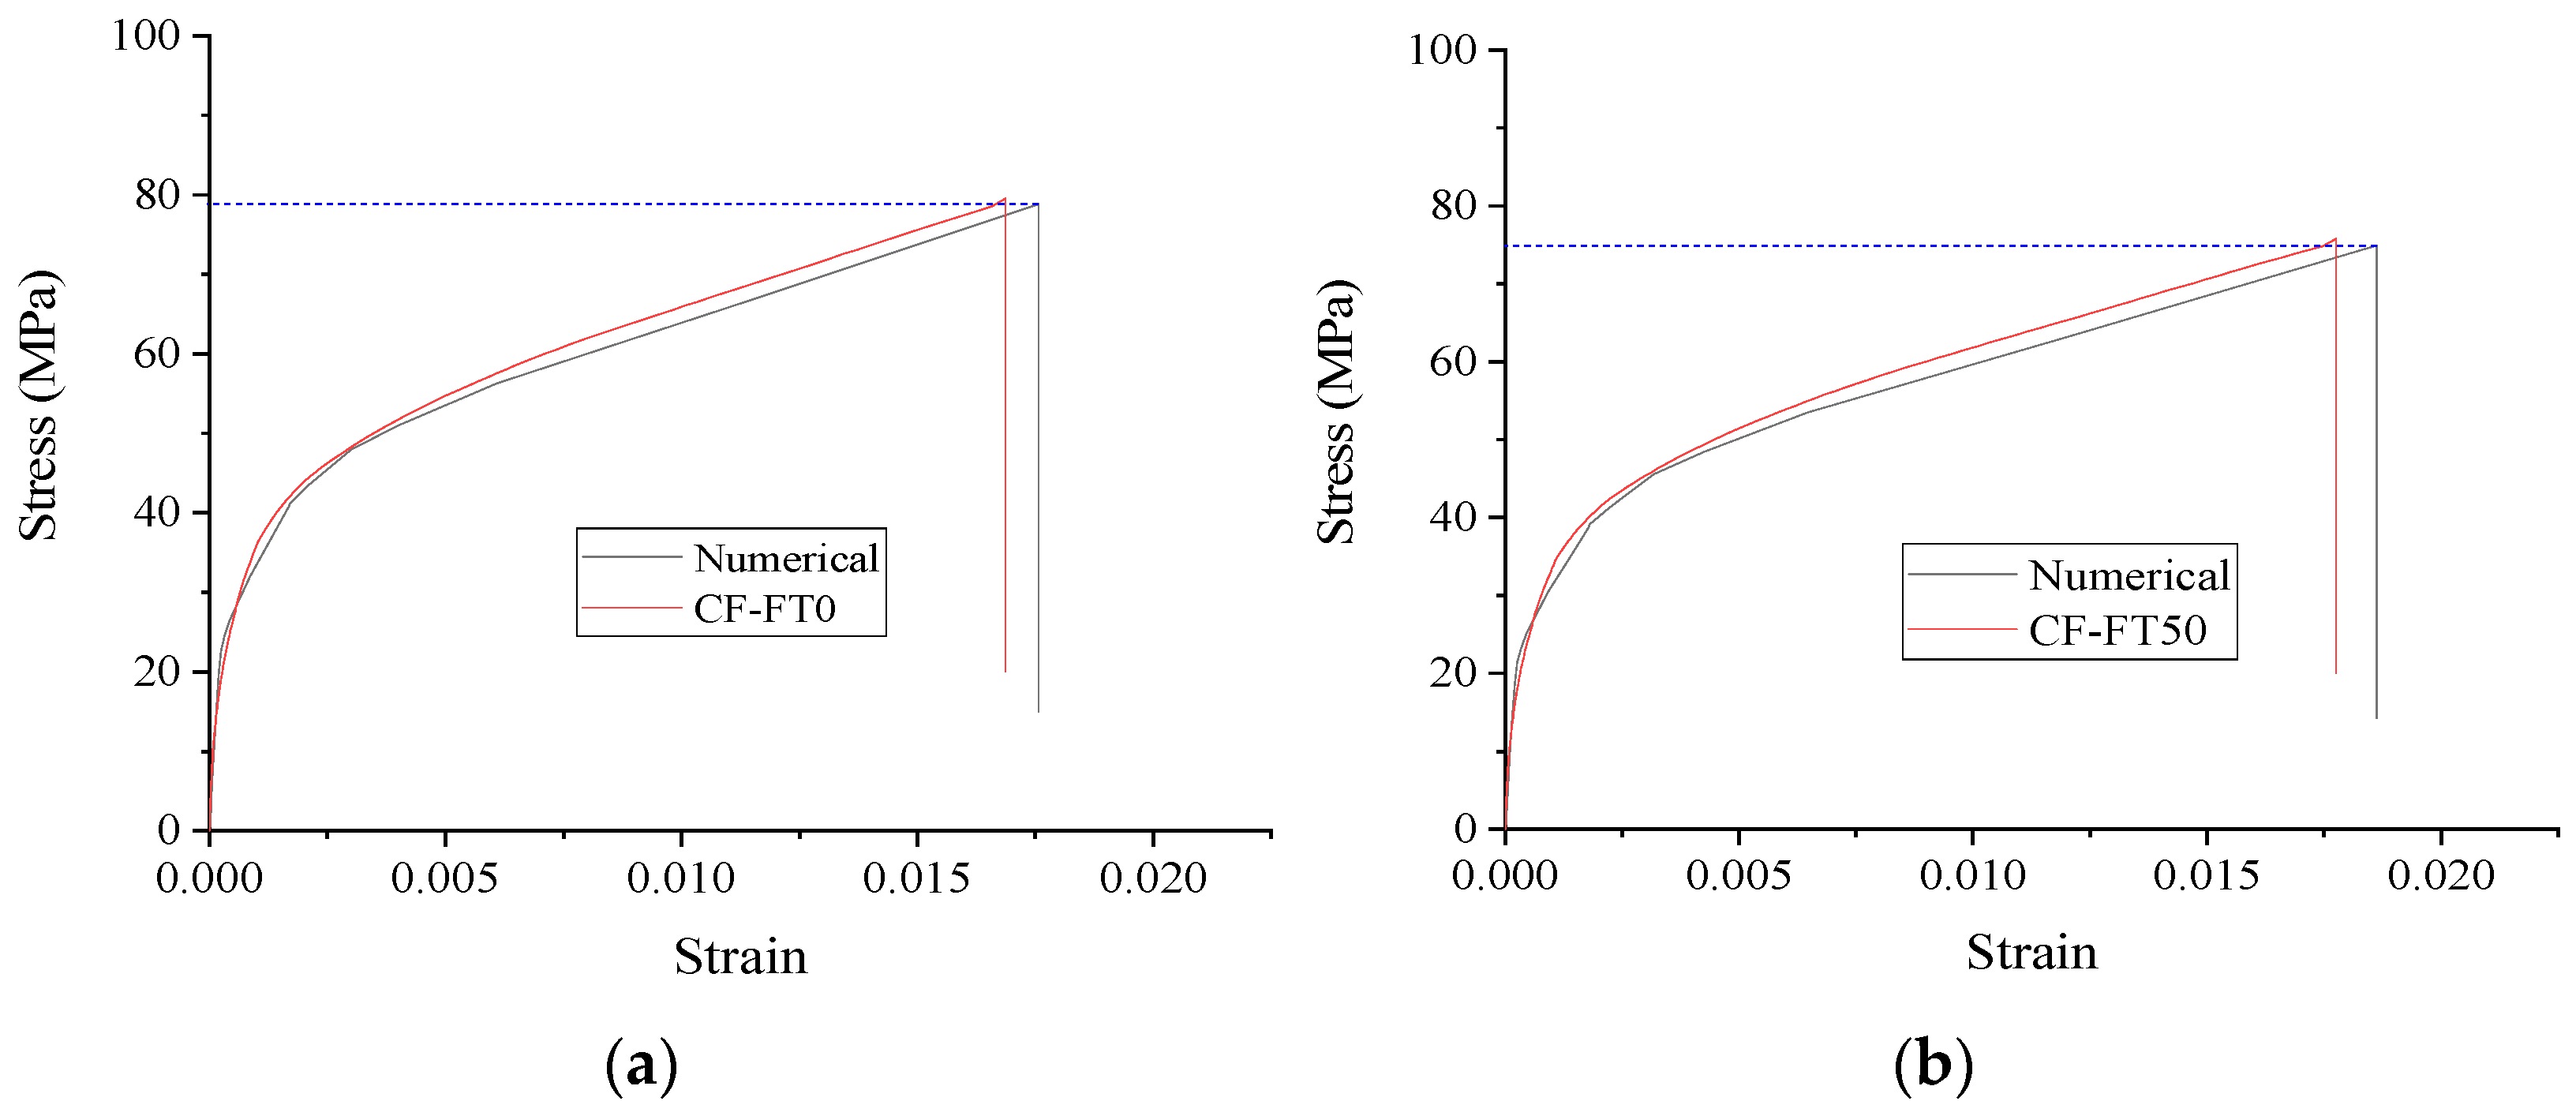
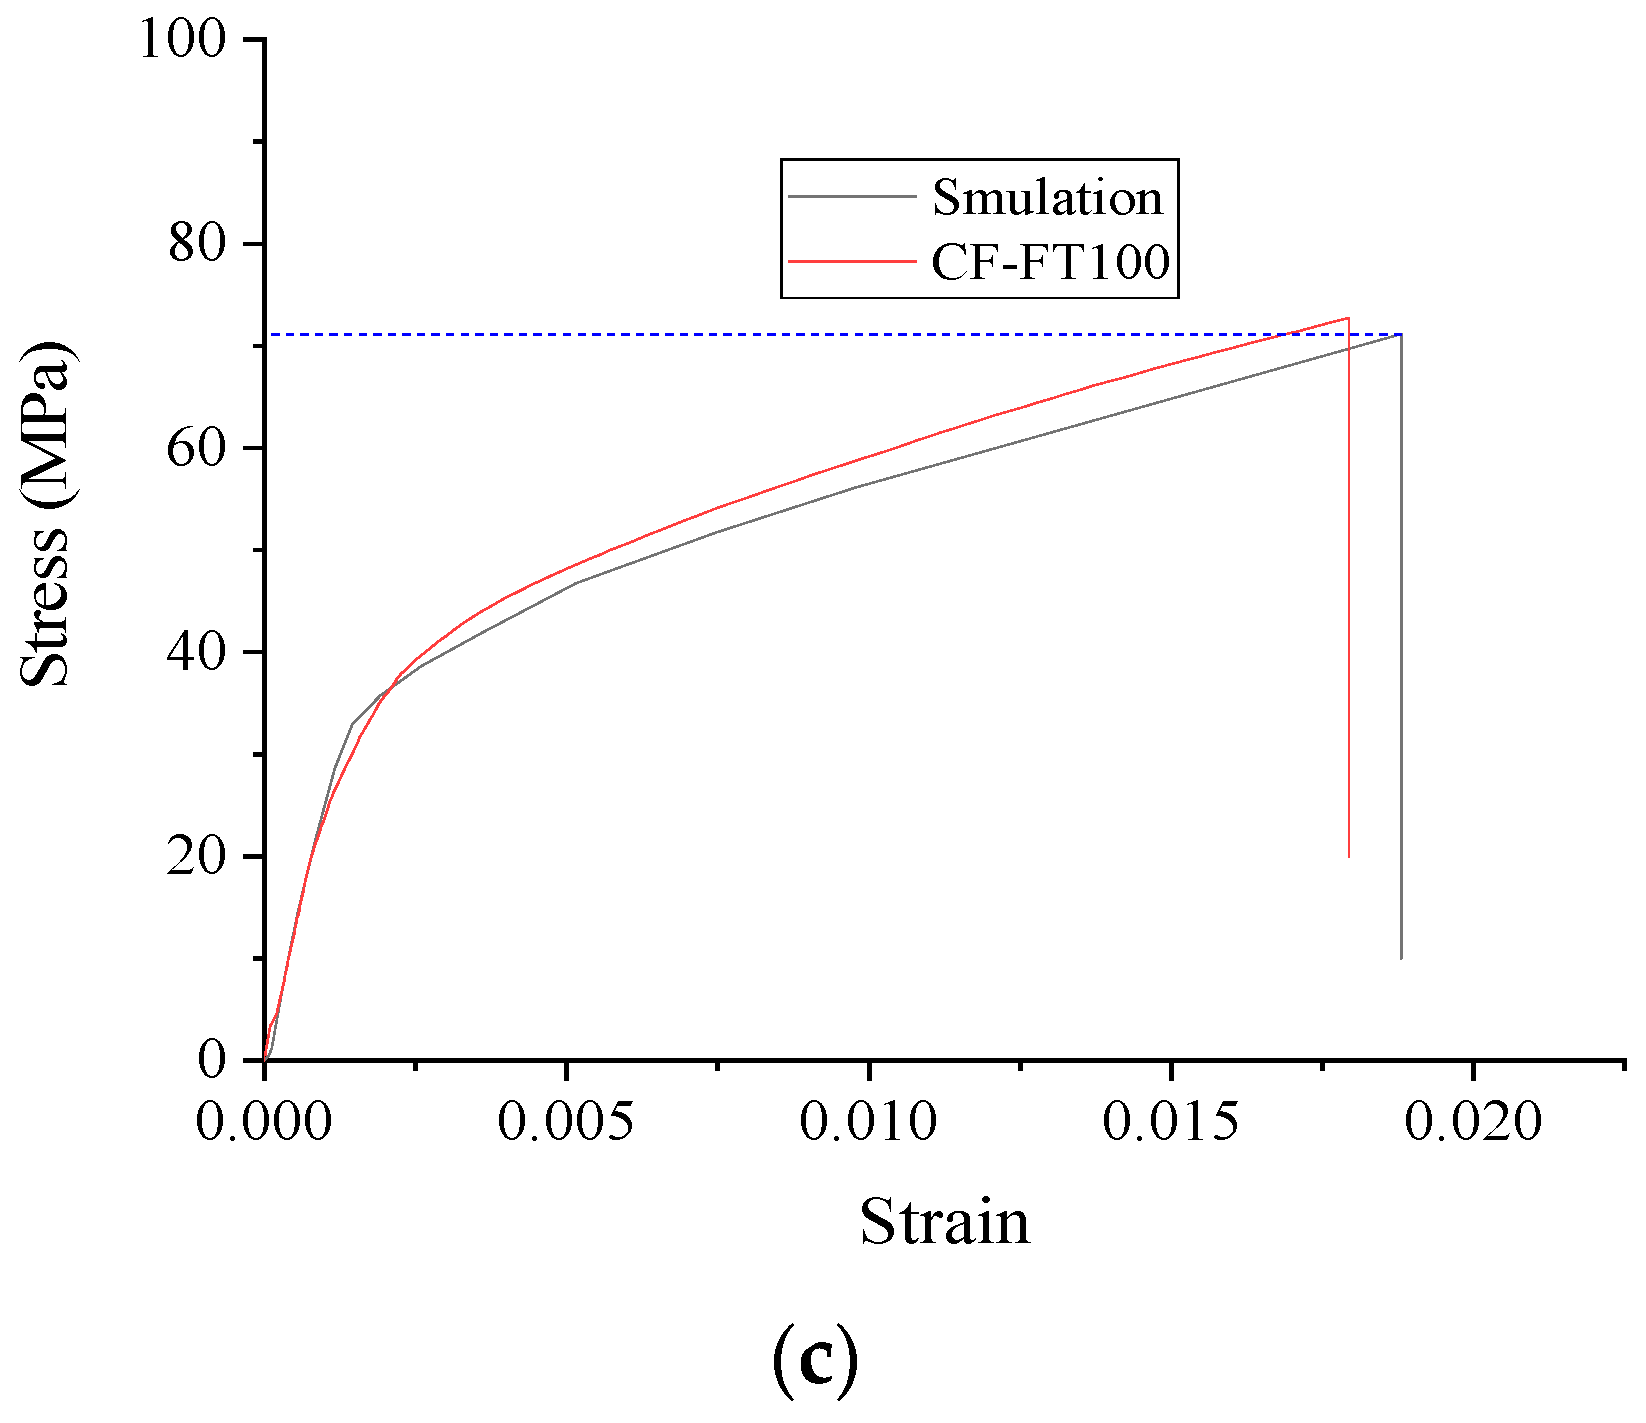
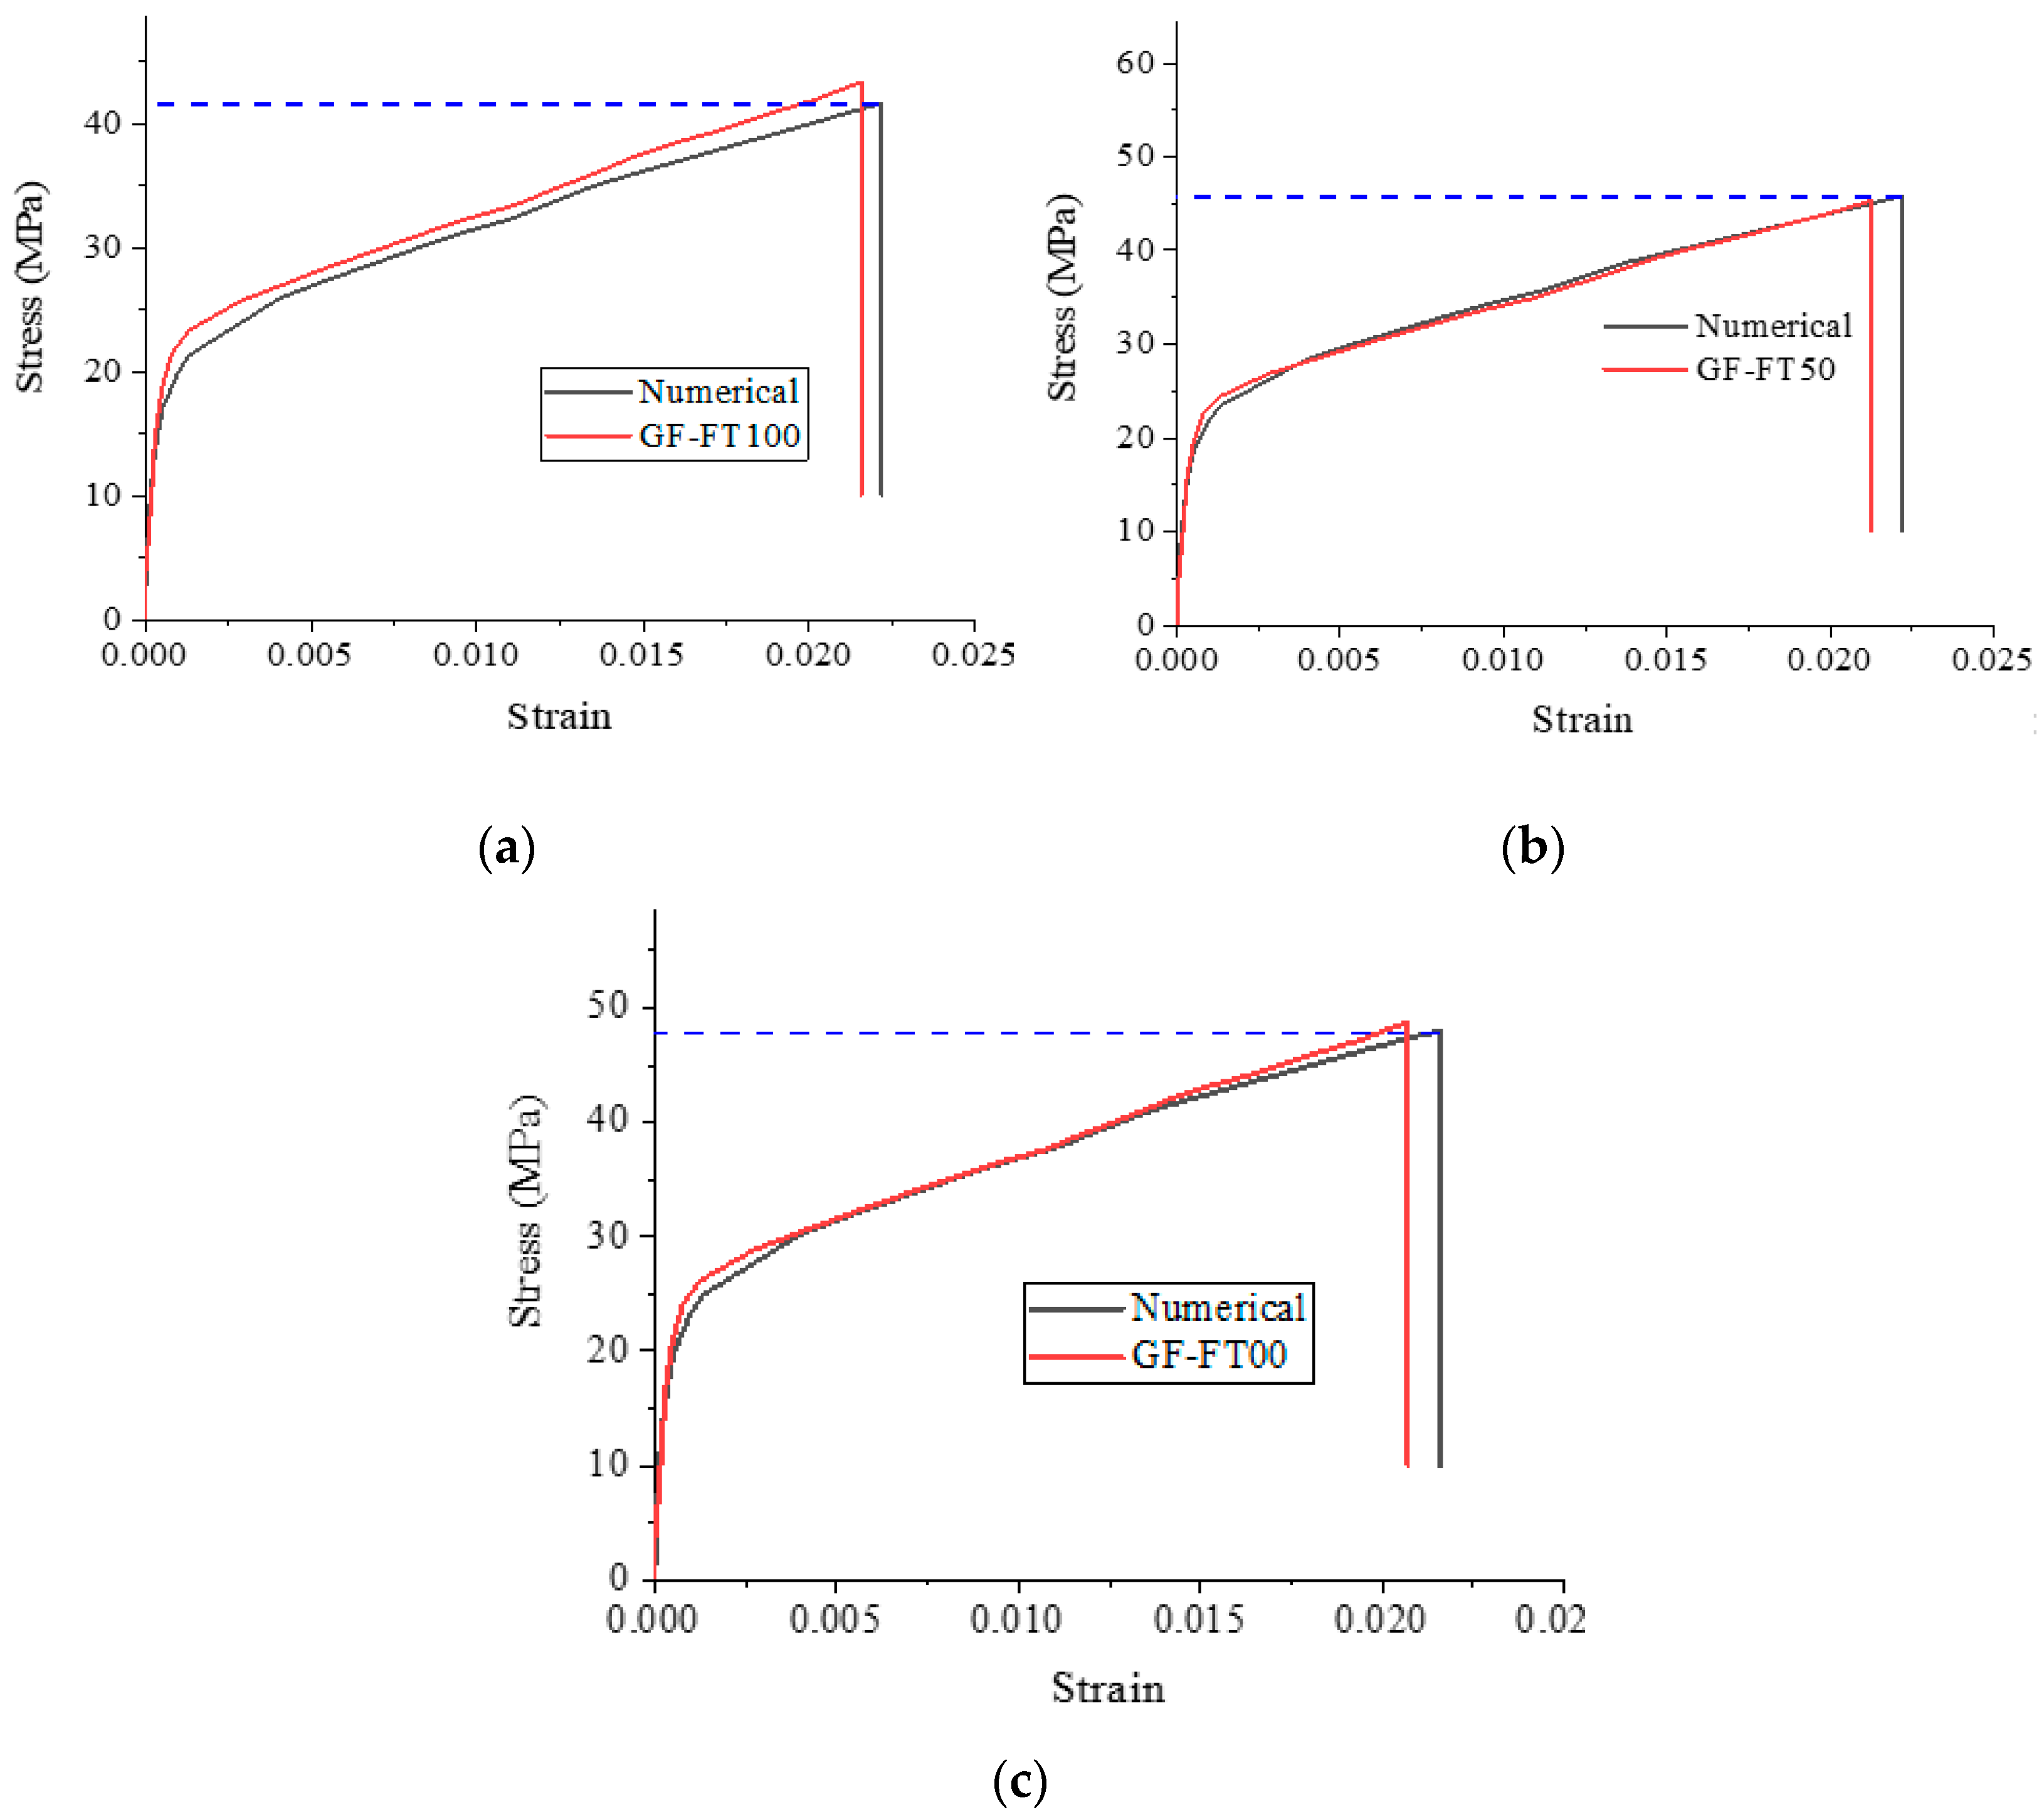
Figure 17, Figure 18 and Figure 19 compare compressive stress–strain relationships between the fiber-free fabric-wrapped, CFRP-wrapped, and GFRP-wrapped specimens under freeze–thaw action. The curve calculated by finite elements deviates somewhat concerning the experimental curve: the stiffness of the finite element calculation is more significant in the elastic phase. Because the finite element treats concrete as a homogeneous material, it is not easy to mix concrete to achieve a very homogeneous state. The maximum error between the experimental and numerical results for compressive strength is 4.0%, and the maximum error for peak strain is 6.6%, as shown in Table 7. The error is that microscopic numerical simulation can be performed for compressive strength evolution.
The compressive strength of the CFRP- and GFRP-reinforced specimens is greatly improved because the fiber cloth limits the lateral deformation to the specimen. In turn, the stress–strain curves of the reinforced specimens differ from those of ordinary specimens, and the compressive strength and peak strain are improved. The specimens are considered damaged when the GFRP and CFRP tensile stresses reach the maximum tensile strength of the material in the numerical simulation.

4.3. Numerical Simulation of Flexural Resistance

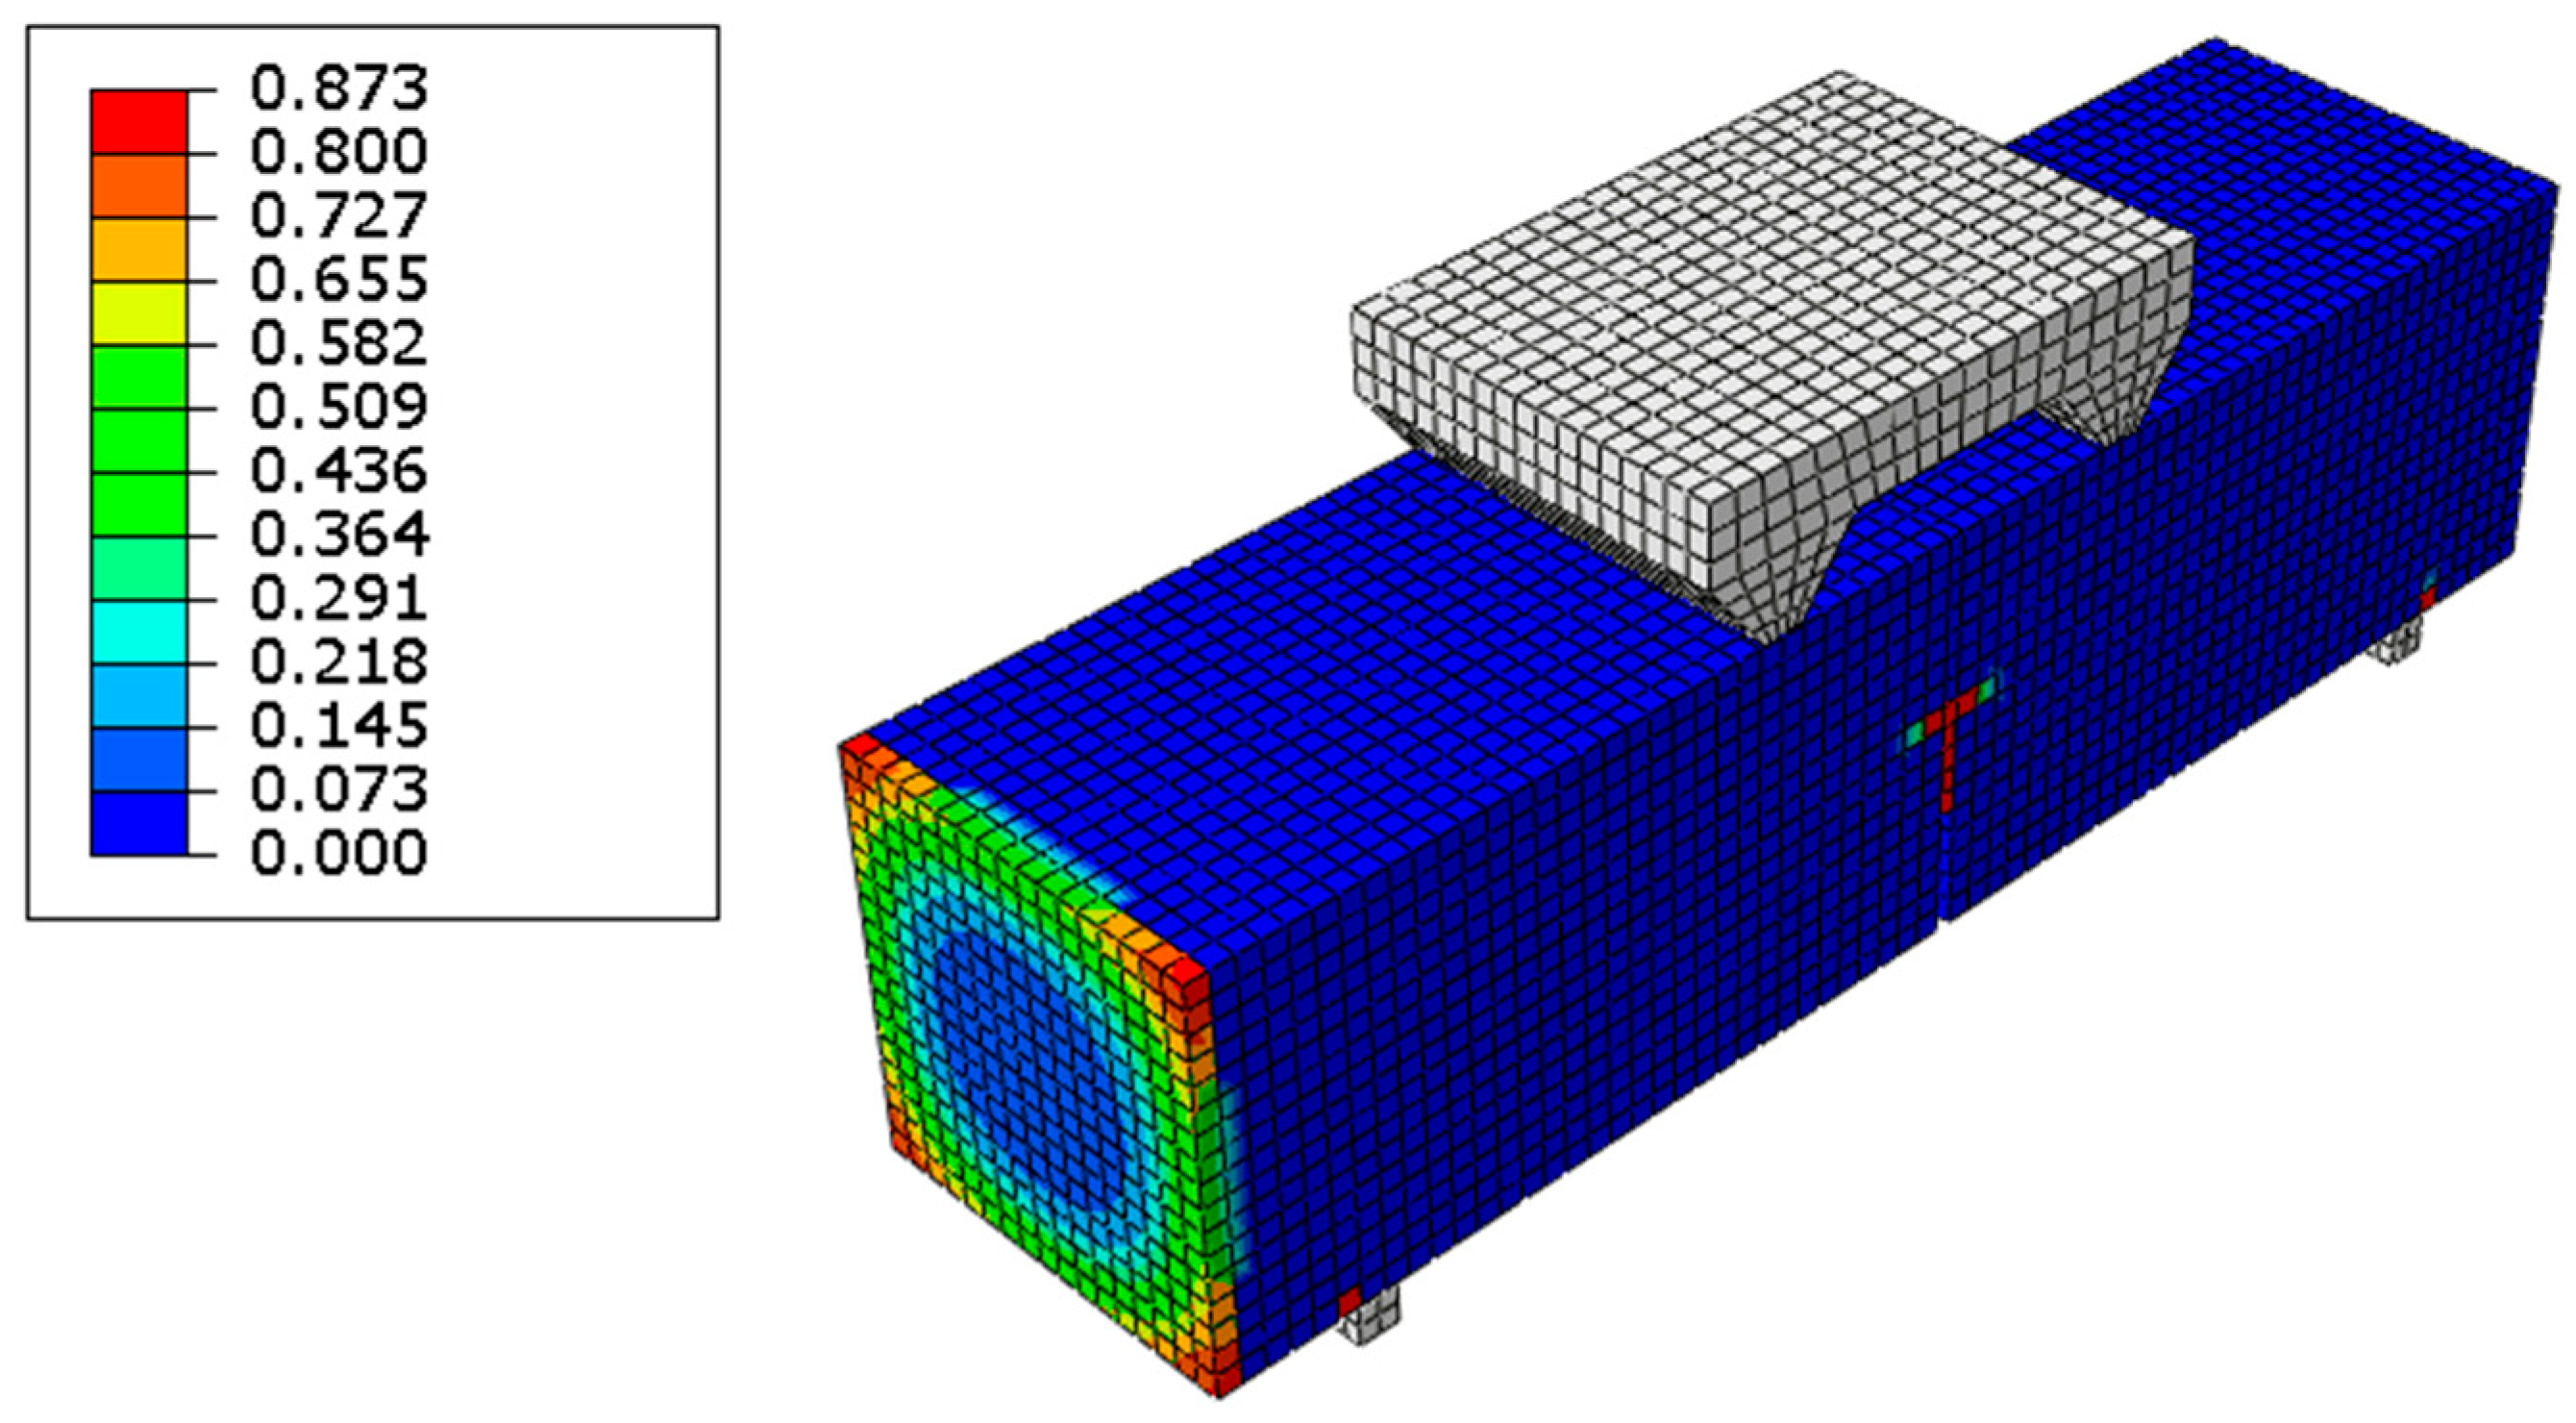
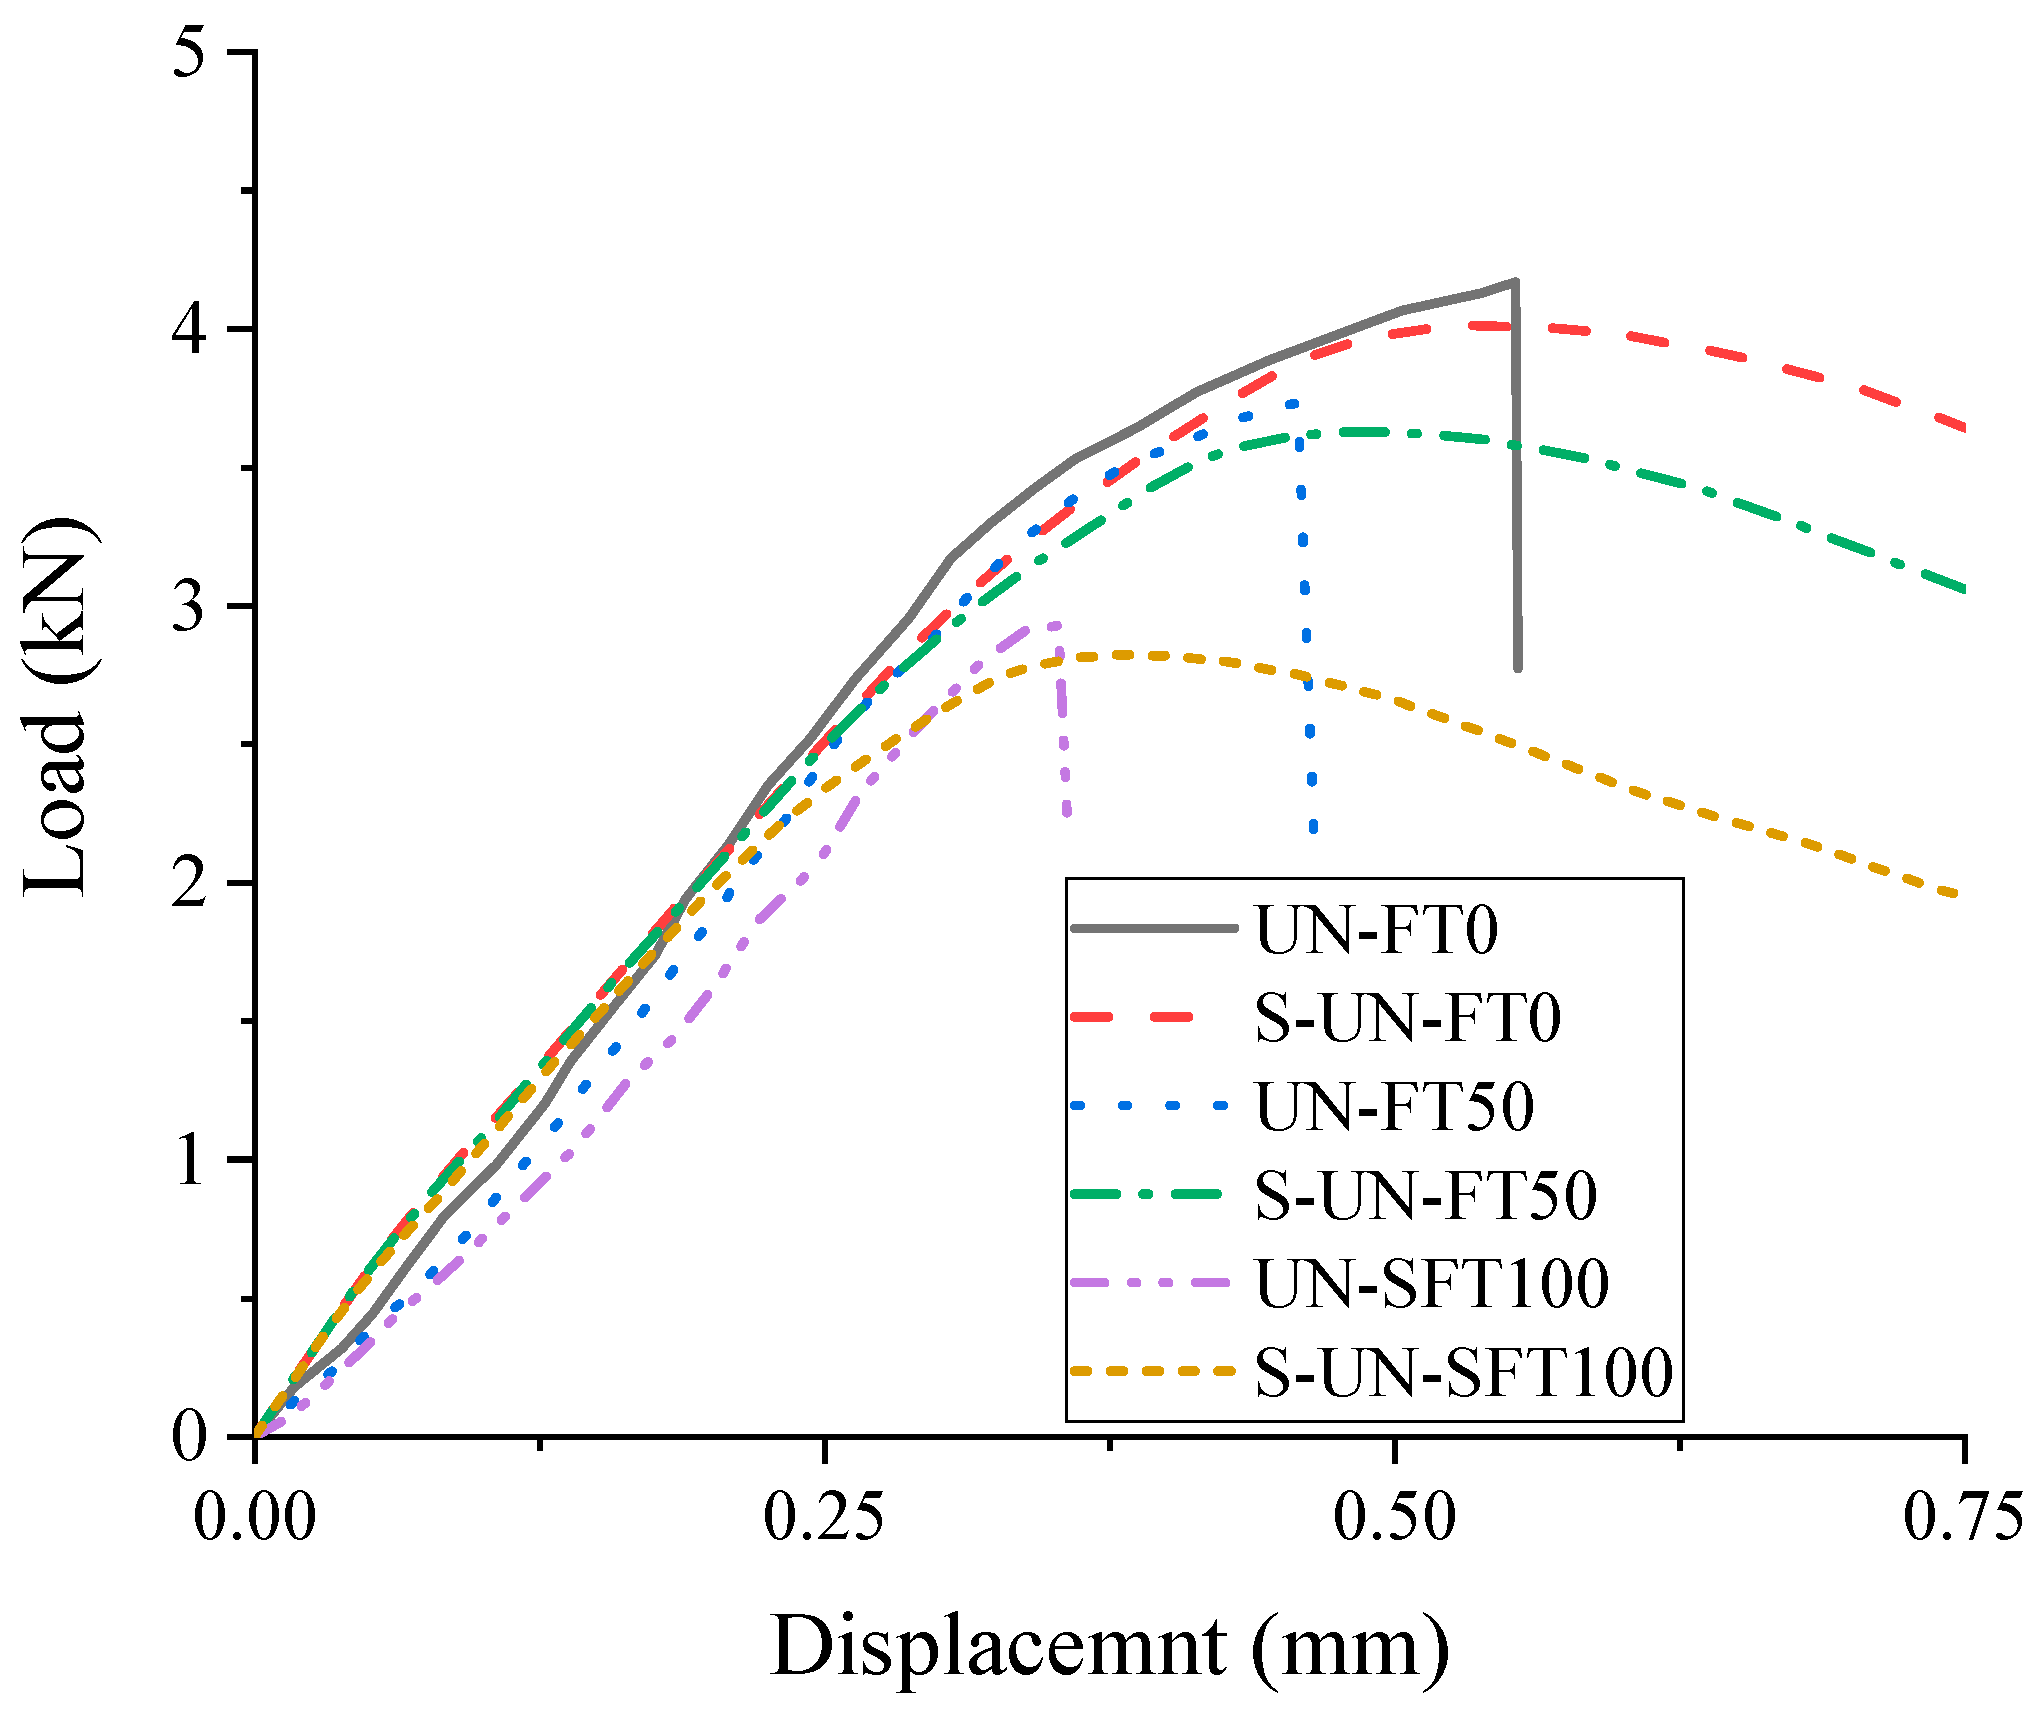
The specimen bending broken ring is shown in Figure 20, and the maximum damage value of the specimen is 0.873. The compressive test reflects the compressive properties of the material, while the flexural test reflects the tensile strength of the concrete. The flexural specimens in the actual test exhibit more serious brittle damage with rapid fracture relative to the numerical simulation. The present paper uses the concrete, plastic damage principle to simulate the damage of concrete, which cannot explain well the concrete after reaching the damage. The stress cannot be reduced rapidly after reaching the damage load, as can be found in Figure 21, Figure 22 and Figure 23. The maximum error in flexural strength between the two is 4.2%, and the maximum error in peak strain is 8.6% (Table 8). The error is small, so the numerical simulation replicates the flexural test affected by freeze–thaw.

5. Conclusions

This paper reinforces concrete cylinders and prisms by applying FRP. The freeze–thaw cycle is used to simulate the freeze–thaw phenomenon in cold regions. FRP-reinforced cylinders simulate the structure of piers and cylinders of buildings under cold zones. In addition, FRP strengthens prefabricated cracked concrete prisms to simulate concrete beam structures that have been damaged and cracked in cold areas.
  • The morphological analysis can observe the surface of the CFRP- and GFRP-reinforced concrete prisms, and the specimens are still severely damaged. Especially at the junction of FRP and concrete, the bonding fails, and cracks at the interface can be clearly observed. There is also a difference in the freezing resistance of the specimens by different reinforcement methods.
  • The weight test reveals that the weight of a standard concrete cylinder decreases by 9.7% after 100 freeze–thaw cycles. The weights of CFRP- and GFRP-reinforced concrete cylinders increase by 1.1% and 1.58%, respectively. The weights of concrete prisms without reinforcement, CFRP reinforcement, and GFRP reinforcement after 100 freeze–thaw cycles decrease by 12.13%, 8.7%, and 9.6%, respectively. This indicates that FRP materials differ significantly in the frost resistance of FRP-reinforced concrete types under freeze–thaw cycles.
  • The compressive and flexural strengths and relative dynamic modulus of elasticity of the two specimens are used to compare the frost resistance of concrete with different reinforcement methods in cold regions. The modulus of elasticity of unreinforced, CFRP-reinforced, and GFRP-reinforced concrete prisms decreases by 44.9%, 48.5%, and 52.5% after 100 freeze–thaw cycles, respectively. However, the percentage reduction in elastic modulus is very similar for the three specimens. The compressive strength of unreinforced, CFRP-reinforced, and GFRP-reinforced concrete cylinders is reduced by 27.6%, 7.4%, and 8% after 100 freeze–thaw cycles.
  • The axial compressive stress–strain curve and bending of the load–displacement curve of FRP-reinforced concrete are studied in a cold zone environment. Two FEA models are established utilizing finite elements under the action of different numbers of freeze–thaw cycles. The axial stress–strain curve and the load–displacement curve under bending load are calculated and compared with the experimental values. The results show that the modified finite element model can have a good prediction effect.
  • This paper evaluates the frost resistance of specimens under different reinforcement techniques in terms of bearing capacity and weight change. Future research can be conducted on the adhesive interface between FRP material and concrete, and finite elements can help to study the change in the adhesive interface in freeze–thaw and further analyze the mechanism of the FRP material’s influence on the frost resistance of concrete.

Author Contributions

Conceptualization, Y.J.; methodology, Y.J. and C.L.; validation, Z.X.; formal analysis, Y.Z.; data curation, Y.J., J.Z. and Y.T.; writing—original draft preparation, Y.J., C.L. and Y.Z.; writing—review and editing, Z.X.; funding acquisition, Y.J. All authors have read and agreed to the published version of the manuscript.

Funding

The authors would like to acknowledge support from the National College Students Innovation and Entrepreneurship Training Program.

Institutional Review Board Statement

Not applicable.

Informed Consent Statement

Not applicable.

Data Availability Statement

All data generated or analyzed during this study are included in this published article.

Conflicts of Interest

The authors declare no conflict of interest.

References

  1. Moghaddam, H.; Samadi, M.; Pilakoutas, K.; Mohebbi, S. Axial compressive behaviour of concrete actively confinedby metal strips, part A: Experimental study. Mater. Struct. 2010, 43, 1369–1381. [Google Scholar] [CrossRef]
  2. Yan, L.; Chouw, N. Behavior and analytical modeling of natural flax fibre reinforced polymer tube confined plain concrete and coir fibre reinforced concrete. J. Compos. Mater. 2013, 47, 2133–2148. [Google Scholar] [CrossRef]
  3. Orbanich, C.J.; Dominguez, P.N.; Ortega, N.F. Strength-ening and repair of concrete foundation beams with carbon fibre composite materials. Mater. Struct. 2012, 45, 1693–1704. [Google Scholar] [CrossRef]
  4. Yan, L.; Chouw, N. Dynamic and static properties of flax fibre reinforced polymer tube confined coir fibre rein-forced concrete. J. Compos. Mater 2014, 48, 1595–1610. [Google Scholar] [CrossRef]
  5. Yue, Q.; Yang, Y. Overview of durability research on fiber reinforced composite strengthened structures. J. Build. Struct. 2009, 30, 8–15. [Google Scholar]
  6. Ji, Y.; Kim, Y.J. Effects of sulfuric acid on durability characteristics of CFRP composite sheets. J. Mater. Civ. Eng. 2017, 29, 04017159. [Google Scholar] [CrossRef]
  7. Institute of Construction Research, Ministry of Metallurgical Industry. Proceedings of the First Academic Conference of China Academic Exchange Society on Fiber Reinforced Plastic Concrete Structures; Building Research Institute of the Ministry of Metallurgical Industry Press: Chengdu, China, 2000; pp. 5–13. [Google Scholar]
  8. Jahami, A.; Temsah, Y.; Khatib, J.; Baalbaki, O.; Kenai, S. The behavior of CFRP strengthened RC beams subjected to blast loading. Mag. Civ. Eng. 2021, 103, 10309. [Google Scholar] [CrossRef]
  9. Masmoudi, R.; Zaidi, A.; Gérard, P. Transverse thermal expansion of FRP bars embedded in concrete. J. Compos. Constr. 2005, 9, 377–387. [Google Scholar] [CrossRef]
  10. Li, C.; Guo, R.; Xian, G.; Li, H. Effects of elevated temperature, hydraulic pressure and fatigue loading on the property evolution of a carbon/glass fiber hybrid rod. Polym. Test. 2020, 90, 106761. [Google Scholar] [CrossRef]
  11. Xian, G.; Guo, R.; Li, C.; Wang, Y. Mechanical performance evolution and life prediction of prestressed cfrp plate exposed to hygrothermal and freeze-thaw environments. Compos. Struct. 2022, 293, 115719. [Google Scholar] [CrossRef]
  12. Zhong, Y.; Cheng, M.; Zhang, X.; Hu, H.; Cao, D.; Li, S. Hygrothermal durability of glass and carbon fiber reinforced composites–A comparative study. Compos. Struct. 2019, 211, 134–143. [Google Scholar] [CrossRef]
  13. Li, B.Q.; Zhou, Y.X. Research progress of fiber composite reinforced concrete structures. J. Water Resour. Constr. Eng. 2016, 14, 85–90. [Google Scholar]
  14. Wang, Q.; Lu, C. Experimental study on the frost resistance of CFRP-reinforced reinforced concrete beams under chloride ion attack. Sichuan Constr. Sci. Res. 2012, 38, 118–120+142. [Google Scholar]
  15. Ji, Y.; Kim, Y.J.; Jia, Y. Performance characterization of plain and CFRP-bonded concrete subjected to sulfuric acid. Mater. Des. 2021, 197, 109176. [Google Scholar] [CrossRef]
  16. Lu, Z.; Li, J.; Xie, J.; Huang, P.; Xue, L. Durability of flexurally strengthened RC beams with prestressed CFRP sheet under wet–dry cycling in a chloride-containing environment. Compos. Struct. 2021, 255, 112869. [Google Scholar] [CrossRef]
  17. Attari, N.; Youcef, Y.S.; Amziane, S. Seismic performance of reinforced concrete beam–column joint strengthening by frp sheets. Structures 2019, 20, 353–364. [Google Scholar] [CrossRef]
  18. Xiong, G.J.; Jiang, X.; Liu, J.W.; Chen, L. A way for preventing tension delamination of concrete cover in midspan of FRP strengthened beams. Constr. Build. Mater. 2007, 21, 402–408. [Google Scholar] [CrossRef]
  19. Triantafillou, T.C.; Pleveris, N. Strengthening of of RC beams with epoxy bonded fibre composite materials. Mater. Struct. 1992, 25, 201–211. [Google Scholar] [CrossRef]
  20. Hasan, M.; Okuyama, H.; Sato, Y.; Ueda, T. Stress-strain model of concrete damaged by freezing and thawing cycles. J. Adv. Concr. Technol. 2004, 2, 89–99. [Google Scholar] [CrossRef] [Green Version]
  21. Huang, L.; Ke, M.; Si, Z.; Du, X.; Wang, Z. Study on uniaxial compression fine view damage of freeze-thaw damaged concrete. J. Appl. Mech. 2021, 38, 1400–1407. [Google Scholar]
  22. Zhang, Y.; Zheng, S.; Pei, P. Freeze-thaw damage model for reinforced concrete columns. Eng. Mech. 2019, 36, 78–86. [Google Scholar]
  23. Zheng, S.; Yang, L.; Ji, J.; Pei, P.; Huang, Y.; Wang, B. Seismic performance of freeze-thaw RC beams with numerical simulation method. J. Vib. Eng. 2021, 34, 889–898. [Google Scholar] [CrossRef]
  24. Griffis, C.A.; Masumura, R.A.; Chang, C.I. Thermal response of graphite epoxy composite subjected to rapid heating. J. Compos. Mater. 1981, 15, 427–442. [Google Scholar] [CrossRef]
  25. Wang, X.; Cha, X.; Zhu, Y. Calculation method of fire resistance performance of GFRP reinforced concrete beams. J. Build. Struct. 2014, 35, 119–127. [Google Scholar] [CrossRef]
  26. Zhou, Y. Dynamic Numerical Simulation Analysis of Concrete under Freeze-Thaw Environment; Dalian University of Technology: Dalian, China, 2019. [Google Scholar] [CrossRef]
  27. Gandage, A.S.; Ram, V.V.; Vasan, A.; Sivakumar, M.V.N.; Yaswanth, A.B. Effect of perlite on thermal conductivity of self compacting concrete. In Proceedings of the 2nd Transportation Research Group of India Conference, Agra, India, 12–15 December 2013. [Google Scholar]
  28. Albostan, U. Implementation of Coupled Thermal and Structural Analysis Methods for Reinforced Concrete Structures; Middle East Technical University: Ankara, Turkey, 2013. [Google Scholar]
  29. Dong, S.; Liu, G.; Zhan, T.; Yao, Y.; Ni, L. A thermal conductivity prediction model of cement-based grouts for ground source heat pump. Int. Commun. Heat Mass Transf. 2022, 135, 106079. [Google Scholar] [CrossRef]
  30. Bai, Y.; Wang, Y.; Xi, Y. Modeling the effect of temperature gradient on moisture and ionic transport in concrete. Cem. Concr. Compos. 2020, 106, 103454. [Google Scholar] [CrossRef]
  31. Bisby, L.A. Fire Behavior of Fiber-Reinforced Polymers (FRP) Reinforced or Confined Concrete; Queen’s University: Kingston, ON, Canada, 2003. [Google Scholar]
  32. Xue, J.Y.; Zhang, F.L.; Zhao, H.T.; Xie, Q.F.; Sui, Y.; Wu, Z. Numerical simulation of the bonding performance of carbon fiber cloth with wood interface. J. Xi’an Univ. Archit. Technol. (Nat. Sci. Ed.) 2013, 45, 305–310. [Google Scholar] [CrossRef]
  33. Chen, Y.; Wang, Q.F.; Huang, Y.H.; Yang, Y.X.; Lin, J.H. Numerical simulation of bonding performance of GFRP composites with brick interface. Eng. Mech. 2007, 5, 119–124. [Google Scholar]
  34. Li, L.; Wang, B.; Hubler, M.H. Durability and mechanical property improvement of ultra-high performance concrete with carbon nanofibers. Cem. Concr. Compos. 2022, 131, 104592. [Google Scholar] [CrossRef]
  35. Jin, Y. Study on Temperature Field and Temperature Effect of CFRP Reinforced Concrete Box Girder under Solar Radiation; Lanzhou Jiaotong University: Lanzhou, China, 2015. [Google Scholar]
Figure 1. Fiber cloth: (a) glass fiber cloth; (b) carbon fiber cloth.
Buildings 13 00138 g001
Figure 2. Specimen preparation: (a) FRP-reinforced prism; (b) FRP-reinforced cylinder.
Buildings 13 00138 g002
Figure 3. Freeze–thaw cycle and test: (a) freeze–thaw cycle experimental diagram; (b) mass weight test; (c) dynamic modulus of elasticity.
Buildings 13 00138 g003
Figure 4. Mechanical test: (a) flexural test; (b) compressive test.
Buildings 13 00138 g004
Figure 5. Surface morphology of specimens after freeze–thawing: (a) cylindrical specimens after 100 freeze-thawing cycles; (b) prismatic specimens after 100 freeze-thawing cycles.
Buildings 13 00138 g005
Figure 6. Mass changes under freeze–thaw cycles: (a) FRP-reinforced concrete cylinder; (b) FRP-reinforced concrete prism.
Buildings 13 00138 g006
Figure 7. Variation in relative dynamic elastic modulus.
Buildings 13 00138 g007
Figure 8. Axial pressure and bending load variation: (a) the relationship between axial pressure and the number of freeze–thawing; (b) the relationship between bending load and the number of freeze–thawing.
Buildings 13 00138 g008
Figure 9. Load displacement curve of prismatic specimen: (a) unreinforced prism; (b) carbon-fiber-strengthened prism; (c) glass-fiber-strengthened prism; (d) stress variation with respect to freeze–thaw cycles.
Buildings 13 00138 g009
Figure 10. Compressive stress–strain curves of cylindrical specimens: (a) unreinforced cylinder; (b) carbon-fiber-strengthened cylinder; (c) glass-fiber-strengthened cylinder; (d) stress variation with respect to freeze–thaw cycles.
Buildings 13 00138 g010aBuildings 13 00138 g010b
Figure 11. Numerical simulation flow chart of freeze-thaw temperature conduction behavior and compressive and flexural mechanical behavior of FRP-reinforced concrete: (a) transient heat transfer analysis; (b) simulation of freeze–thaw process; (c) simulation of mechanical behavior.
Buildings 13 00138 g011
Figure 12. Temperature variation of 10 freeze–thaw cycles.
Buildings 13 00138 g012
Figure 13. Freeze–thaw cycles simulation: (a) the node temperature of concrete at 2700 s; (b) the node temperature of concrete at 5400 s; (c) the node temperature of concrete at 8100 s; (d) the node temperature of concrete at 10,800 s.
Buildings 13 00138 g013
Figure 14. Boundary conditions and orientation of the model.
Buildings 13 00138 g014
Figure 15. Stress in cylindrical model at 99–100 freeze–thaws. (a) Stress of concrete; (b) stress of fiber cloth.
Buildings 13 00138 g015
Figure 16. Stress in prismatic model at 99–100 freeze–thaws. (a) Stress of concrete; (b) stress of fiber cloth.
Buildings 13 00138 g016
Figure 17. Comparison of compressive stress–strain curves of unreinforced specimens under freeze–thaw action.
Buildings 13 00138 g017
Figure 18. Uniaxial compressive stress–strain relationship for CFRP-reinforced specimens: (a) 0 freeze–thaw cycles; (b) 50 freeze–thaw cycles; (c) 100 freeze–thaw cycles.
Buildings 13 00138 g018aBuildings 13 00138 g018b
Figure 19. Uniaxial compressive stress–strain relationship for GFRP-reinforced specimens: (a) 0 freeze–thaw cycles; (b) 50 freeze–thaw cycles; (c) 100 freeze–thaw cycles.
Buildings 13 00138 g019
Figure 20. Numerical simulation of flexural damage of the specimen.
Buildings 13 00138 g020
Figure 21. Comparison of flexural load curves of specimens without reinforcement under freeze–thaw action.
Buildings 13 00138 g021
Figure 22. Comparison of flexural load curves of CFRP-reinforced specimens under freeze–thaw action.
Buildings 13 00138 g022
Figure 23. Comparison of flexural load curves of GFRP-reinforced specimens under freeze–thaw action.
Buildings 13 00138 g023
Table 1. Physical and mechanical properties of cement index.
SO3
/%
Cl
/%
Desulfurization Gypsum/%Fly Coal Ash/%Loss of Ignition/%Setting Time/minFlexural Strength/MPaCompressive Strength/MPa
Initial CondensationFinal Condensation3 d28 d3 d28 d
2.80.0536.594.461852305.45.428.642.5
Table 2. Strength of FRP and epoxy resin adhesive.
MaterialsTensile Strength/MPaModulus of Elasticity/GPaElongation at Break/%
GFRP2450~255075~852.25~2.35
CFRP3470~3570250~2701.68~1.78
Epoxy resin adhesive52.3~56.32.5~2.92.20~2.30
Table 3. Prismatic specimens design.
Number of Freezing and ThawingUnreinforced Specimen NumberGlass-Fiber-Reinforced Specimen NumberCarbon-Fiber-Reinforced Specimen Number
PrismCylindricalPrismCylindricalPrismCylindrical
0 timesP-F0C-F0PG-F0CG-F0PC-F0CC-F0
50 timesP-F50C-F50PG-F50CG-F50PC-F50CC-F50
100 timesP-F100C-F100PG-F100CG-F100PC-F100CC-F100
Table 4. Concrete mix ratio.
MaterialsWaterCementMedium Sand5–10 mm Gravel10–20 mm Gravel
Content/(kg/m3)209.0387.0635.0350.7818.3
Table 5. Thermodynamic parameters of materials.
Materialsλ W/(m·K)ρ kg/m3c J/(kg·°C)
CFRP [24]1.416001250
GFRP [25]0.3520001100
Concrete [26]1.282500960
Table 6. Material parameters.
ParametersExpansion AngleEccentricityfc0/fb0kViscosity CoefficientModulus of ElasticityPoisson’s RatioExpansion Coefficient
Concrete [24]200.11.150.71 × 10−520,6800.11 × 10−5
CFRP [29]-----97,8000.28−0.1 × 10⁻⁶
GFRP [25]-----93,7500.3−0.1 × 10⁻⁶
Table 7. Experimental results and numerical simulation results of the compressive test.
NumberCompressive Strength (MPa)Peak Strain
Experimental ResultSimulation
Result
ErrorExperimental ResultSimulation
Result
Error
C-F023.3423.740.017 0.002120.00210.009
C-F5019.7319.940.011 0.002150.00220.023
C-F10014.5214.600.006 0.002620.002770.057
CC-F079.5678.830.009 0.016870.01760.043
CC-F5075.7774.890.012 0.017760.01860.047
CC-F10072.7271.150.022 0.017930.01880.049
CG-F048.7748.000.016 0.020690.02160.044
CG-F5045.3645.800.010 0.021280.02220.043
CG-F10043.3541.630.040 0.021570.02300.066
Table 8. Comparison of experimental results and numerical results of flexural tests.
NumberUltimate LoadPeak Displacement
Experimental ResultSimulation
Result
ErrorExperimental ResultSimulation
Result
Error
P-F04.1694.0140.0370.5530.5370.029
P-F503.7343.6320.0270.4580.4840.057
P-F1002.9282.8250.0350.3530.3810.079
PC-F025.3524.4850.0341.7661.8270.034
PC-F5021.50821.1070.0181.6301.7400.067
PC-F10014.75114.3880.0241.0271.1070.077
PG-F021.6021.540.0021.842.000.086
PG-F5017.4017.530.0071.521.630.072
PG-F10010.349.900.0420.920.970.054
Disclaimer/Publisher’s Note: The statements, opinions and data contained in all publications are solely those of the individual author(s) and contributor(s) and not of MDPI and/or the editor(s). MDPI and/or the editor(s) disclaim responsibility for any injury to people or property resulting from any ideas, methods, instructions or products referred to in the content.