Abstract
Given the prediction of global warming, there is a growing concern about overheating in the severe cold and cold regions of China. In the past decades, indoor thermal comfort has been neglected in building practice, while efficiency-oriented improvements have been developed, such as increased insulation of building envelope. An extensive literature review shows contradictory conclusions about whether increased insulation can alleviate overheating. The aim of this research is to conduct simulations based on measured data to reveal the influence of insulation on overheating in dwellings in these regions of China. An unoccupied residential flat was monitored to determine the extent of overheating while eliminating the effects of other contributors, such as natural ventilation. Validated building performance simulations were carried out with altered insulation layer thickness in Integrated Environmental Solutions-Virtual Environment IESVE software to examine its influence on overheating during summertime in five representative cities. The results showed clear evidence of summer overheating in these regions. In Yichun, Harbin, Shenyang, Dalian and Beijing, walls with increased insulation were found to exacerbate overheating in the bedrooms without natural ventilation by 22.5%, 16.6%, 20.3%, 11.8% and 6.9%, respectively, compared to the uninsulated walls. This study provides useful information for building regulations on energy efficiency and thermal comfort.
1. Introduction
The warming climate has highlighted the issue of energy demand [1]. It is expected that the energy demand for cooling in buildings will increase, while that for heating will decrease, due to rising ambient temperatures [2]. These changes highlight the importance of building adaption and energy systems. The International Energy Agency reported that energy use in the building and construction industry accounted for 36% of the total energy demand and 39% of energy-related CO2 emissions in 2018 [3]. It has also been predicted that, without additional measures, energy use in the industry will rise by around 50% by 2050, compared to 2013 [4]. The increased energy consumption and CO2 emissions from the industry should be the main focus in every national strategy to cope with global climate change.
With growing concern about energy consumption in the building sector, many countries have developed building standards to achieve energy-saving targets. Increased insulation and air tightness are important measures to enhance building performance, especially in the heating-dominated areas. However, several studies have pointed out that improved insulation can result in excessive indoor temperatures during the warmer seasons, whereas others have reached contradictory conclusions [5]. In severe cold and cold regions of China, the main principle of building design focuses on thermal retention in winter; protection from heat in the summer is neglected. As one of the major adaptions in newly built housing stock, increased thermal insulation and its relation to indoor overheating requires investigation.
1.1. Overheating
1.1.1. Impacts of Overheating
Overheating in residential buildings has attracted growing attention in recent years. Higher indoor temperatures can affect the occupant’s health and even lead to increased mortality, particularly in the elderly or vulnerable [6]. It has been pointed out that high temperatures have a negative effect on the quality of sleep [7] and can also result in diseases, such as respiratory diseases and cardiovascular diseases [8]. It has been shown, however, that these risks can be overlooked due to elderly people’s tendency to prefer warmer dwellings [9]. Additionally, exposure to an overheated environment affects occupants’ productivity [10] and learning ability [11]. As well as health issues, overheating leads to increased energy expenditure and carbon emission levels. In recent decades, energy consumption for cooling has increased due to rises in urban temperature, with a 0.094% increase of the per capita electricity demand in China [12]. By the end of the 21st century, energy consumption for cooling is predicted to increase by 20–35% in the United States and 37–41% in China [13]. Moreover, global carbon emissions may be increased due to the potential increase in energy for cooling. Thus, the potential impacts of overheating should be given serious attention.
1.1.2. Overheating in Residential Buildings
In Europe, overheating in dwellings has been established in a number of empirical and simulation-based studies. Of 122 monitored residential buildings in London, it was found that 37% and 49% of the occupied hours of the living room and bedroom, respectively, exceeded the standard comfort range by 1% during the summer of 2010 [14]. In 2018, it was estimated that 4.6 million English bedrooms (19% of the stock) and 3.6 million living rooms (15%) overheated based on datasets of 750 assessed English homes [15]. Gupta et al. [16] used both measurements and simulations to extend the period range, revealing the risk of overheating and predicting air conditioning as the most effective solution in the 2080s. Furthermore, overheating has drawn increasing attention in the temperate regions in recent years.
In the past, the dwellings in severe cold and cold regions of China were not considered to be overheated during the summer or warmer seasons. The efforts in these regions have mainly been to preserve heat during winter; no definite measures have been proposed to deal with heat prevention during summer. Since the middle of the 20th century, the rate of the rise in the surface temperature in China has been higher than the global average [17]. There is growing evidence of the increasing indoor temperature in these regions. Recent studies have begun to reveal the growing overheating risk in dwellings in these regions [18]. Moreover, a trade-off between energy efficiency and indoor overheating performance in cold regions of China has been pointed out [19].
1.2. Insulation and Overheating
As one of the major measures for improved building performance, increased thermal insulation for building envelopes has led to intense discussions about the influence on overheating, with contradictory conclusions or findings, as shown in Table 1. Several studies have revealed the adverse effects of insulation on the indoor thermal environment during summer. Monitoring campaigns in the UK have shown that newly constructed buildings are warmer than older ones and tend to be overheated [20,21]. Moreover, a number of studies involving building performance simulations have also revealed that more insulated buildings show a higher tendency to overheat [22,23]. Some scholars, however, have reached the opposite conclusion. During the European heat wave of 2003, it was found that high-temperature risks were more widespread in older houses that were poorly insulated [24]. Fosas et al. [25] found that the influence of increased insulation on indoor thermal environment is twofold: it can alleviate overheating in well-designed dwellings while exacerbating overheating in poorly designed ones.

Table 1.
Findings of selected studies on relationship between increased insulation and overheating performance.
With the coldest monthly average temperature below 0 °C and the hottest above 22 °C, the severe cold and cold regions of China are focused on heat retention during winter. The thermal insulation in walls can reach a thickness of over 100 mm. Thermal insulation is considered one of the most effective ways of building energy conservation in these regions [17]. With a warming climate, however, the enhancement of the thermal indoor environment and energy saving can come into conflict in regions of seasonally varied climate. This conflict requires resolving in these regions of China.
1.3. Other Parameters Influencing Overheating
As well as the thermal insulation of the envelope, a number of other parameters can influence indoor overheating, such as glazing [29] and thermal mass [30]. Solar gains are also one of the most important contributors to overheating. A modeling study in the Netherlands revealed that increased internal and solar heat led to an interior temperature 6 °C higher than the exterior temperature during summer [31]. It was also pointed out that the uppermost floors suffer a higher overheating risk than ground floors, especially when built with low insulation and weak solar protection. Chvatal and Corvacho [26] found that control of solar gains can be effective to reduce overheating during summer when the envelope is constructed with added insulation. The appropriate application of shading devices can reduce the influence of solar gains on the indoor thermal environment. Ventilation is another key factor to help mitigate overheating. It was found that residential buildings were less overheated when windows and doors were fully open during the early morning or evening hours [32]. Furthermore, ventilation factors, including window type, opening time and duration, play an important role in overheating in residential buildings [32]. Heracleous and Michael predicted that natural ventilation is an effective method to reduce overheating hours by 28–35% by the 2050s [33]. Night ventilation has been recommended as an effective strategy to mitigate overheating [33,34]. Moreover, several studies have noted that the coupled influence of parameters, such as solar shading and ventilation, can alleviate overheating [26,34].
1.4. Literature Gap
First, there are limited studies providing direct and explicit evidence of the occurrence of overheating in the severe cold and cold regions of China. Classified as Dwa or Dwb according to the Köppen climate classification, these regions are distinguished from the other extensively researched regions by their climatic characteristics. Predominantly, naturally ventilated dwellings are prevalent, and cooling methods such as air conditioning are not common. The warming climate raises concerns about indoor thermal comfort, especially in the absence of appropriate measures for heat protection. At present, the energy-saving target has been the major aim of the Chinese building design standards, with the U-value of walls reduced from 0.55 to 0.35 [35] and a possible 0.10 for nearly zero-energy buildings [36]. It is uncertain whether the increased insulation exacerbates or alleviates the risk of overheating in the severe cold and cold regions, with an extensive literature review revealing contradictory conclusions. It was pointed out that increasing insulation can be twofold on overheating performance when other parameters (including ventilation performance, climatic condition and shading) are involved. To determine the influence of insulation on overheating, it is important to eliminate the impact of such parameters.
The aim of this paper is to determine the influence of increased insulation on overheating in the residential buildings of severe cold and cold regions of China. The paper also seeks to clarify the following issues. First, it was determined whether overheating exists in the severe cold and cold regions, particularly in predominantly naturally ventilated dwellings. Second, it was ascertained whether increased insulation alleviates or exacerbates overheating in these regions and the extent of its impact on overheating. Finally, measures were proposed to alleviate overheating in these regions.
2. Method
Simulations based on a real monitored flat were used to determine whether increased insulation exacerbates or alleviates overheating in these regions of China. Hourly indoor temperatures of an unoccupied flat in Harbin city were measured from 1 May to 30 September 2021. The study was designed to examine overheating while eliminating the effects of other contributors, including natural ventilation and internal thermal gains. Validated building performance simulation was carried out with altered thermal thickness of the insulation layer in the Integrated Environmental Solutions Virtual Environment (IESVE), a commercial software developed by Integrated Environmental Solutions Ltd, to determine its contribution to overheating in five representative cities of the regions. The results were intended to provide useful information for policy making related to building efficiency design and thermal comfort improvement.
The study examined the indoor operative temperature and duration of overheating during summer (from May to September) in flats constructed with different thicknesses of thermal insulation. Based on measurement data of a newly built flat, groups of validated simulations were carried out to examine the influence of increased insulation on overheating in the regions. The framework of the study is shown in Figure 1.
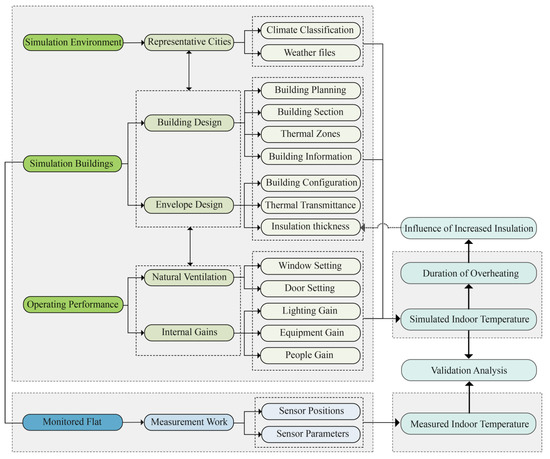
Figure 1.
Framework of the study.
2.1. Case Study Building and Measurement
A newly built 15-storey residential building located in Harbin (IIB sub-region city) was selected to study the influence of increased insulation on overheating. Following the building energy efficiency standards in the severe cold and cold regions, the building was constructed with double-glazed windows and well insulated with an extruded polystyrene layer of a thickness of 100 mm. As a typical newly built residential building in the regions, there are three units, namely, six flats on each floor. One unit consists of two flats on each floor with a similar plan, including a living room (facing south) and two bedrooms (one facing north, the other south). According to the field investigation, there was an unoccupied flat on the 7th floor; the other flats of the building were in normal use (either occupied or used for the building operation). There was no ventilation or internal thermal gains in the unoccupied flat during the summer (May to September) of 2021. The other flats were all predominantly naturally ventilated during this time, and air conditioning was not used. Layout and section of the case study building are shown in Figure 2. The detailed architectural design information of the building is presented in Table 2.
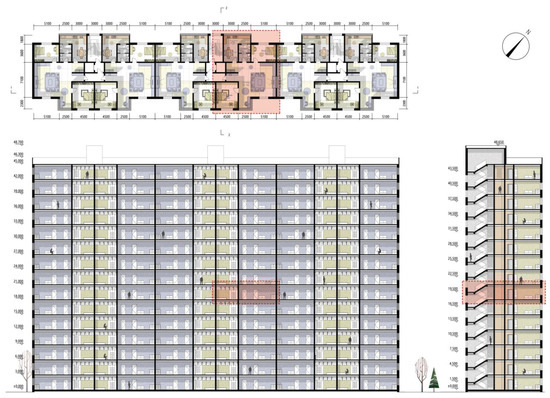
Figure 2.
Layout and section of the case study building (the unoccupied flat selected for measurement is denoted by the orange box whilst the other flats are in normal use; the orientation of the building is shown in the top right corner).
Table 2.
Details of the case study building.
In the field study, the unoccupied flat on the 7th floor of the residential building was monitored during the summer (from 1 May to 30 September) of 2021. The indoor dry bulb temperature of the flat was measured every hour in the living room and south-facing bedroom by Ubibot-DS18B20 sensors, with measuring capacity ranging from 10 °C to 55 °C and an accuracy of ±0.3 °C. The sensors were situated on the wall at a height of 1.1 m above the floor out of direct sunlight, as shown in Figure 3. In total, 3672 data points were collected of the hourly indoor operative temperature in each room of the flat.
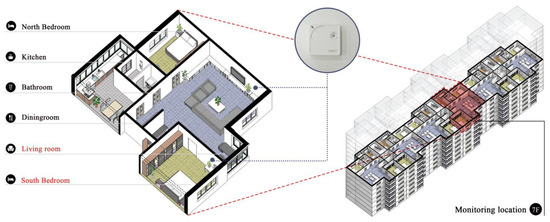
Figure 3.
Locations of sensors for indoor temperature measurement; photograph of the applied sensor shown in the circled portion.
2.2. Building Performance Simulation
The IESVE software was used to simulate the indoor temperature of the case study building under different scenarios. For the simulation environment, one representative city of each sub-region of severe cold and cold regions was selected to assess the impact of increased insulation on overheating: Yichun (IA sub-region), Harbin (IB sub-region), Shenyang (IC sub-region), Dalian (IIA sub-region) and Beijing (IIB sub-region) [37]. Weather files over a full year, which were recorded from local weather stations in 2021, were required in the software. The study concentrated on the overheating performance during the summertime period, namely from 1 May to 30 September (153 days). However, the heating dominated period of these regions including winter time was not considered. The climatic characteristics and locations of weather stations of these cities are presented in Table 3. It is important to note that there are two types of weather files applied in the IESVE, namely, locally recorded meteorological files of 2021 and typical meteorological year (TMY) weather files over recent 15 years (from 2004 to 2018). The locally recorded weather file of 2021 was used for validation work and examine the overheating circumstances during summertime of the single year. TMY weather files of each sub-regions constructed over long-term meteorological data can represent typical weather conditions of the regions [38], which were used to examine typical overheating performance over the 15 years.
Table 3.
Representative cities of the severe cold and cold regions.
2.2.1. Insulation
To examine the influence of increased insulation on overheating, the U-value of the wall was used as the main variable. The thermal transmittance of the wall was altered by adjusting the thickness of the insulation layer (extruded polystyrene). Thinsulation was used to represent the thickness of the thermal insulation, and Thcp was used to represent the thickness of the insulation applied in the current standards [37]. In each city, the range of thicknesses was different in the simulation settings, as shown in Figure 4. The highest value of Thinsulation (i.e., Thcp) in each city was used for consistency with the current standard value of the city, which has been widely applied in the newly built housing stock. The lowest Thinsulation (i.e., Thinsulation = 0) of each city was used to examine overheating when the model building was uninsulated. In the simulation of each city, the thickness of the insulation was increased in 10 mm steps until it reached Thcp. Each model building constructed with a different Thinsulation was created in a simulation file in IESVE for further comparisons of overheating with different levels of insulation. Table 4 shows the range of Thinsulation and the corresponding U-value of the walls in each city.
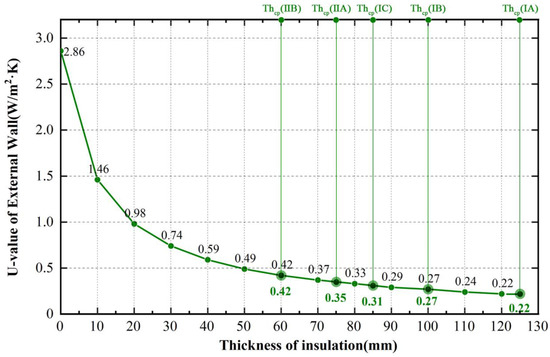
Figure 4.
Thinsulation and corresponding U-value of external wall (the values denoted by dark-green circles were applied in the simulation, while those denoted by light-green circles represent values in the current practice standards).
Table 4.
Range of Thinsulation in each city in the simulation settings.
In addition, the selected flats for further comparisons are all located in the middle levels of the dwellings to eliminate the influence of solar radiation on the roof portion and the effects of ground heat transfer at the bottom levels. The Thinsulation of external wall was the variable in the simulations, while the other construction layers, including roofs and ground floors were held constant in each city. The U-values of the windows were also not altered in the simulations. The values above are in accordance with local standards and actual circumstances. The detailed envelope configuration and U-values of these components are as shown in Figure 5 and Table 5.
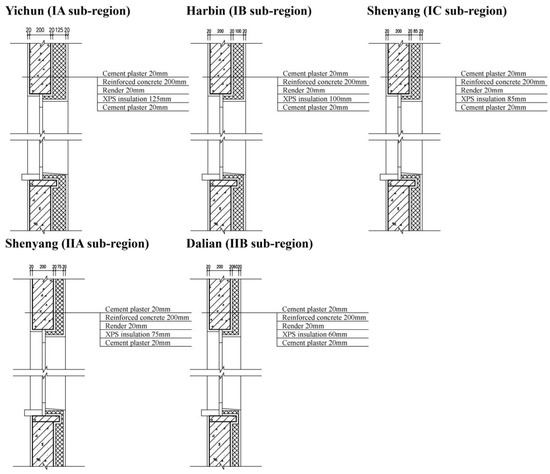
Figure 5.
Configuration of external wall in the five cities.
Table 5.
U-values of building envelope in the simulation settings.
2.2.2. Ventilation
There were no natural ventilation or internal gains in the actual flat located. The other flats of the residential building were all assumed to be predominantly naturally ventilated. This means that no air conditioning was considered in the simulations. Related parameters therefore mainly include the air exchange rate (ACH) of infiltration, ACH of natural ventilation, window opening time (natural ventilation period) and door opening time. The ACH of infiltration was set as 0.5 h in all the flats, according to the design value from Design Standard for Energy Efficiency of Residential Buildings in Severe Cold and Cold Zones (JGJ 26-2018). The ACH of natural ventilation was also adjusted to meet the requirements of JGJ 26-2018. The window and door openings were set according to the expected occupant behavior, as shown in Table 6 and Table 7. The window opening time in the living room or bedrooms (i.e., the natural ventilation period) is when the residents are assumed to be at home. The entrance door is assumed to be closed at all times, while the bedroom door is assumed to be open at all times. The kitchen door is closed for three periods during the day, in accordance with typical Chinese kitchen use.
Table 6.
Simulation parameters for ventilation.
Table 7.
Door open and closed times in the simulation.
2.2.3. Internal Gains
Internal heat gains from indoor occupancy, lighting and equipment were considered, as shown in Table 8. However, internal heat gains from hot water, elevators or small equipment, which have little impact, were not considered. The values were set according to the household composition and occupant behavior. It is important to note that, given a 30% reduction in internal gains during the sleep period, the internal gain values of the bedrooms were thus adjusted differently from those of the living room.
Table 8.
Internal gain settings in the simulation.
2.3. Validation
The Pearson correlation coefficient (Pearson’s r) was used to assess the accuracy of the modeling studies. Time series comparisons between hourly monitored data (Meas) and simulated indoor temperatures (Sim) over the 2021 summer period (May to September) were carried out. Pearson’s r is used to determine the dependence between Meas and Sim. As one of the most notable indicators to test the quality of goodness-of-fit metrics, Pearson correlation coefficient provides an opportunity to test the accuracy of modeling studies. When the value is closer to 1, the simulation accuracy is higher. RMeas, Sim can be calculated according to Equation (1). Furthermore, the regression equation can be given as Equation (2) according to the goodness-of-fit process.
In Equation (1), n represents the total number of hours in the summer (3672 h from May to September), and i represents each hour over the study period. In Equation (2), k represents the slope of the assumed linear equation, and int represents the intercept of the equation.
2.4. Overheating Evaluation
Chartered Institution of Building Services Engineers (CIBSE) has published overheating evaluation guidance including CIBSE Guide A [40], which is used to assess the overheating duration during the summertime in this paper. Hours of exceedance (HE) is used to indicate the number of hours during which the indoor temperature exceeded the static limit. Moreover, HE% is used to present HE as a percentage of the total number of hours. According to CIBSE Guide A, the static limit for bedrooms and living rooms are 26 °C and 28 °C, respectively [40]. In the criteria, HE% of 1% is the threshold to meet thermal comfort needs for both bedrooms and living rooms. HE% is calculated as in Equations (3) and (4):
3. Results
3.1. Simulation
According to the simulation results applied with TMY files over the 15 years (2004–2018), the buildings were overheated to varying degrees in the five cities. All the rooms were overheated significantly, with HE% significantly exceeding the threshold of 1%. Table 9 shows the overheating duration in the flats during summer (from May to September) when the thickness of the insulation was altered. For both living rooms and bedrooms, all the insulated flats were more overheated than the uninsulated ones (where Thinsulation = 0). The rooms of each flat tended to be more overheated when the insulation was thicker. Compared to flats constructed with the current standard value of insulation thickness, there were reductions in overheating hours of 245 h in Yichun (22.5%), 335 h in Harbin (13.0%), 399 h in Shenyang (20.3%), 269 h in Dalian (11.8%) and 214 h in Beijing (6.9%). For living rooms, overheating hours in the uninsulated flats decreased by 12 in Yichun (35.3%), 275 in Harbin (16.6%), 517 in Shenyang (60.0%), 289 in Dalian (22.3%), and 208 in Beijing (8.3%). The indoor operative temperatures of the flats constructed with Thcp and without insulation differed significantly according to the period (Figure 6). For a large portion of the period, the indoor temperatures in the flats constructed with the current standard value of insulation thickness were higher than those in the uninsulated ones, although they were lower in specific periods.
Table 9.
Overheating duration with Thinsulation as variable in the simulated flats (on the 7th floor) of each representative city during summertime over 15 years (2004 to 2018).
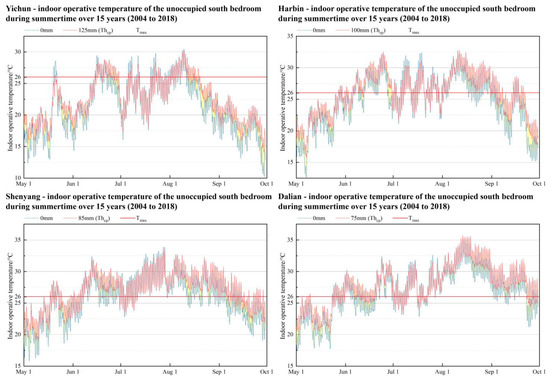
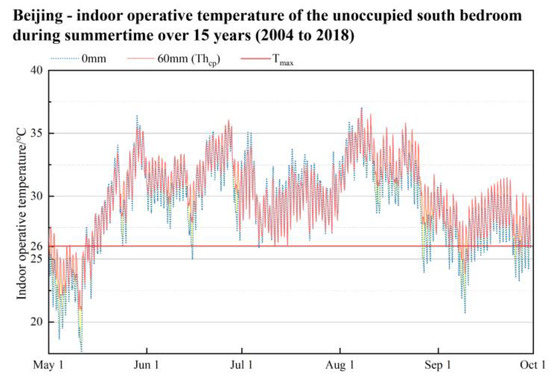
Figure 6.
Indoor temperature of the flats constructed with Thcp and uninsulated flats in each city during the summertime over 15 years (2004 to 2018) (Tmax: the static temperature threshold from CIBSE Guide A; the periods when the indoor temperatures of uninsulated flats were lower than those of flats constructed with Thcp are denoted in yellow).
3.2. Validation Results
The simulation applied with the local meteorological weather file of 2021 was carried out. The simulated overheating performance of the unoccupied flat in Harbin is shown in the Table 10, which was in accordance with the actual circumstance of the monitored flat of the city. The level and situation of the flat was selected on the basis of the actual circumstance to achieve corresponding simulation results, which was also used for validation against measured data. It can be found that increased insulation can exacerbate overheating performance in 2021 as well, which shows a similar trend as the simulated results applied with TMY files over the past 15 years (2004 to 2018).
Table 10.
Overheating duration with Thinsulation as variable in the simulated flats (on the 7th floor) of Harbin from May to September of 2021.
To enhance the reliability of the simulations, the simulated indoor temperatures from May to September of 2021 were validated against the measured data from the unoccupied flat in Harbin. Time series comparisons between the hourly monitored data and simulated indoor temperatures during summertime of 2021 were conducted. According to the regression results from the 3672 pairs of datasets, there was a moderate correlation between the measured data and the simulated results (Figure 7). In Figure 7, the grey line represents equation y = x, an ideal state, which indicates that the simulated and measured data are equal; the regression lines in the south-facing bedroom and living room show a moderate consistency. According to the calculated results from Equation (1), the values of Pearson’s r were uii0.8621 and 0.9355 in the living room and bedroom (facing south), respectively. The regression equations are given as Equations (5) and (6). According to the regression results, the simulated data were in great consistency with the real data. The simulations can therefore provide reliable prediction on the overheating performance when the thickness of thermal insulation is altered as an independent variable.
y = 0.9755 x + 0.4453
y = 1.0112 x + 0.5237
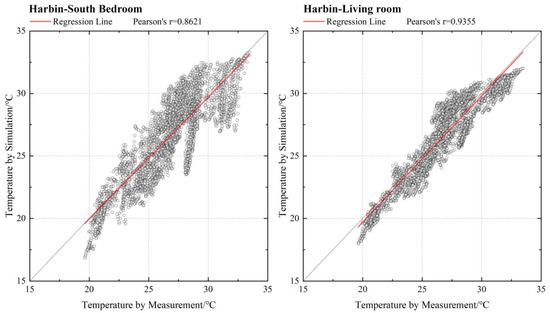
Figure 7.
Correlation between measured data and simulation results of south-facing bedroom and living room during summertime of 2021.
4. Discussion
4.1. Overheating in Dwellings in Severe Cold and Cold Regions
The simulation results over 15 years (2004 to 2018) reveal that overheating occurred in the five cities of the severe cold and cold regions to varying degrees. In all the cities, it was difficult for the rooms of both the occupied and the unoccupied flats to satisfy the overheating thresholds of CIBSE Guide A (namely 1%). Taking the occupied flats on the 9th floor as an example (Table 11), the period when the simulated indoor temperature exceeded 28 °C in the living rooms or 26 °C in the bedrooms lasted from 21 May to 19 August in Yichun, 28 May to 22 September in Harbin, 14 May to 29 September in Shenyang, 5 May to 30 September in Dalian and 1 May to 30 September in Beijing. The dwellings in Beijing saw the most pronounced overheating of all the cities, with HE% over 50% in the living rooms and 70% in the bedrooms from May to September, which significantly exceeded the overheating threshold of 1%. Overheating duration in the south-facing bedrooms and living rooms of Harbin, Shenyang and Dalian were also significant. In Yichun, overheating was observed; however, CIBSE Guide A were satisfied in the living room but not in the bedroom. In addition, the bedrooms tended to be more overheated in all the cities than the living rooms. The higher HE% in the bedrooms should be taken into consideration for the sake of the occupants’ quality of sleep and health issues [41].
Table 11.
Overheating duration of the simulated occupied flat (on the 9th floor) during summertime over 15 years (2004 to 2018).
Moreover, compared to the unoccupied flats, the HE% in flats under normal use was much lower. This can be explained by the fact that, though internal heat gains, including lighting and cooking, were produced, the natural ventilation helped dissipate the heat, making the room less overheated. Occupants can therefore take appropriate measures including ventilation and other cooling methods to reduce indoor temperatures [42]. Such measures could have a significant impact on indoor overheating [43]. Further policies and recommendations should be made to alleviate potential overheated indoor environments in these regions.
4.2. Influence of Increased Insulation on Overheating
The unoccupied flats in the simulation tended to be more overheated when constructed with thicker insulation (Figure 8). The current standard values of Thinsulation in the local standards can lead to more overheated indoor environments in the severe cold and cold regions. As the insulation increased, the overheating duration increased significantly in all the cities. However, its rate of increase tended to gradually decline. This can be explained by the relationship between the U-value of the envelope and Thinsulation, as shown in Figure 4: the decrease rate of the U-value declines as Thinsulation increases, before the U-value reaches a convergence. Additionally, an upward trend in overheating hours was observed as the latitude decreases from Yichun (IA sub-region) to Beijing (IIB sub-region).
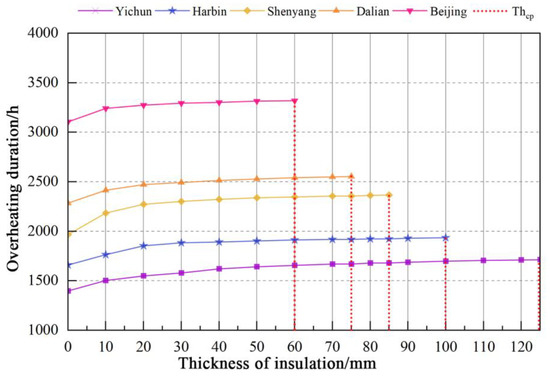
Figure 8.
Overheating duration of unoccupied south-facing bedrooms constructed with increased Thinsulation in the five cities during the summertime over 15 years (2004 to 2018) (the red dotted lines show the overheating hours of the flats constructed with Thcp, i.e., the current standard values of thermal insulation thickness).
The overheating duration was longer in flats constructed with increased insulation (as shown in Figure 9). For instance, in the south-facing bedroom in Shenyang city (IC sub-region), overheating lasted from 18 May to 14 September in the uninsulated flat, whereas it lasted from 18 May to 29 September in the Thcp-constructed flat; the living room was overheated from 11 June to 29 August in the uninsulated flat and 12 June to 4 September in the flat constructed with Thcp. This can be explained by the fact that indoor temperatures in the flats constructed with Thcp were mostly higher than those in the uninsulated ones, which resulted in longer overheating durations. Moreover, the percentage of hours when the indoor temperature exceeded the static limit (26 °C) in flats constructed with Thcp were higher than that in uninsulated flats; the percentage of hours when the indoor temperature was below 20 °C was much lower in the flats constructed with Thcp than that in uninsulated flats. Thus, the overall overheating performance in the Thcp-constructed flat was more significant than in the uninsulated ones.
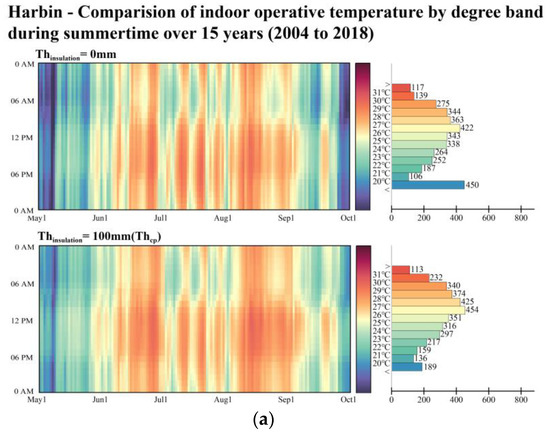
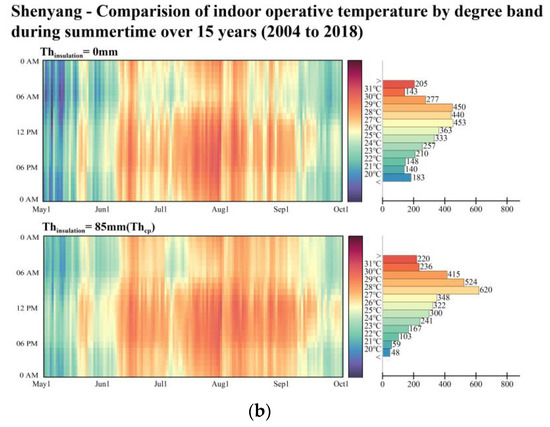
Figure 9.
Left-hand side shows indoor operative temperatures of the south-facing bedrooms in Harbin (a) and Shenyang (b) (divided into various temperature degree bands); right-hand side shows numbers of hours of each temperature band.
The period when the temperatures of the insulated flats were higher than those of the uninsulated ones and the period in the opposite state were staggered. In most of the summer period, the indoor temperature in the insulated flats was higher than in the uninsulated ones. Some of the time, however, the situation was reversed. The effect of increased insulation on indoor temperature depended on the exterior meteorological conditions (as shown in Figure 10). Taking the bedroom of the unoccupied flat in Shenyang as an example, the indoor temperature in September tended to be higher with increased insulation, and the temperature difference between the Thcp-constructed flat and the uninsulated flat reached 2.20 °C. In July, however, the situation was different: the indoor temperature decreased when the insulation layer decreased, but there was a relatively small difference in temperatures (0.76 °C was the largest difference). This can be explained by the larger fluctuations of the indoor temperature in the uninsulated dwelling; those of the insulated one tended to be smaller. This resulted in the indoor temperature of the uninsulated dwelling in the warmest period (July) being higher, while in the coldest period (September), it was lower. However, the difference in temperature between the two flats was smaller in the warmer month and larger in the colder period. Thus, although the overall overheating duration in the uninsulated flats was relatively low, the larger fluctuations in indoor temperature and lower heat resilience can be detrimental to the indoor environment. Insulation can help preserve the heat resilience and result in the indoor temperature fluctuating within a relatively narrow range, which can be instructive in the building envelope design in the severe cold and cold regions. In insulated dwellings, in the warmer months (such as June), the indoor temperature fluctuated less and was lower than that in the uninsulated ones when exposed to the highest exterior temperature; in the colder months (such as September), the warmer indoor environment of the insulated dwelling can be beneficial for heat retention.
Figure 10.
Relationship between increased insulation and indoor operative temperature (divided into various temperature bands) in the south-facing bedroom in Shenyang (IC sub-region).
The validated result is thus consistent with the previous finding that increased insulation can exacerbate overheating. This can result from the specific geographic environment of the severe cold and cold regions of China. Classified as Dwa or Dwb by the Köppen climate classification [44], the regions have a coldest monthly average temperature below 0 °C and hottest above 22 °C, which is different from the climatic situation in Europe (mostly classified as Cfa in the Köppen climate classification). The regions also feature a large diurnal temperature cycle and cold night-time temperature [45]. The monitored unoccupied flat was used to determine the impacts of increased insulation while eliminating the effects of ventilation and occupancy behavior. The results relating to the unoccupied flats suggested a severely overheated environment and revealed the adverse influence of insulation on overheating. This is consistent with the findings of previous studies that increased insulation can be a notable contributor to overheating in dwellings with poor ventilation [28]. In these regions, heat retention during winter is given priority in building design, while consideration of summer heat protection is lacking. It is therefore suggested that measures, such as natural ventilation and modified occupancy behavior, should be advised in the building regulations of these regions.
4.3. Suggestions for Measures to Alleviate Overheating
Except for IIB regions, no definite standards or building regulations have been established for heat protection in the severe cold and cold regions [35]. Nevertheless, measures are needed to alleviate overheating. In these regions of China, heat preservation is the main principle of building design, while the summer indoor environment has been neglected. At present, various newly updated standards have been issued to meet the carbon-neutral goal and the targets of the 14th Five-Year Plan schedules, including two versions of residential building design standards, namely JGJ26-2010 and JGJ26-2018, for the severe cold and cold regions. The U-value limits for both walls and windows have been improved to achieve the target of low energy consumption. Taking Harbin (IB sub-region) as an example, the U-value has been reduced from 0.55 in 2010 to 0.35 in 2018. However, there is a tendency to higher overheating performance (as shown in the Figure 11). The energy efficiency goals thus could come into conflict with the enhancement of the indoor thermal environment. Based on the simulation results, although enhanced insulation can exacerbate overheating during summer, insulated dwellings are necessary for heat retention during winter. Given this situation, building regulations are of paramount importance for energy saving and for comfortable indoor environments. A trade-off must be considered in the building design between summer heat protection and winter heating.
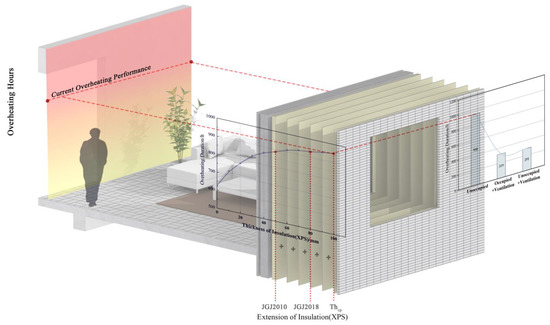
Figure 11.
Comparisons of overheating performance over recent 15 years of the flats constructed with different Thinsulation and under different types of scenarios in Harbin(IB sub-region) (the left-handed line graph indicates the overheating duration in flats whose external walls’ U-values are the limit values in two versions of residential building design standards and current practice value; the right-handed line shows the overheating duration in the unoccupied flat without natural ventilation, unoccupied flat with night ventilation and occupied flat with night ventilation).
Some measures should be taken into account by policy makers to retrofit buildings or adapt newly built housing stock. According to the simulation results, natural ventilation can help mitigate overheating. There was a significant reduction between the unoccupied flats on the 7th floor and the occupied flats with natural ventilation on the 9th floor (as shown in the Figure 11). This echoes with the conclusion that ventilation can be an effective measure to mitigate overheating during the day or night [32]. Shading devices could be another measure to alleviate overheating and have been recommended by some previous studies. Moreover, shading devices coupled with night ventilation can reduce overheating by over 50% [34]. However, the use of shading devices and natural ventilation to alleviate overheating is not recommended in the current standards of the regions [35]. These measures can be summarized as follows: (a) adaption of envelope configurations (e.g., application of phase change material in the envelope design); (b) appropriate ventilation operation during summer (e.g., the appropriate application of night ventilation and advice for residents); and (c) application of shading devices in the building design period.
5. Conclusions
Based on monitored data from an unoccupied flat in the severe cold and cold regions of China, several sets of simulations were designed to eliminate the influence of other factors such as ventilation and internal thermal gains, thus allowing the building performance to be examined based on current design standards in each of the five cities. The validated simulation results indicated that increased insulation significantly exacerbates overheating in these regions; however, insulation is of paramount importance in building design, especially given the country’s energy-saving ambitions. It is therefore suggested that the design standards and regulations of the regions strike a balance between retention of heat in winter and prevention of overheating in summer. The main findings can be summarized as follows:
- (1)
- The validated simulation results over recent 15 years (2004 to 2018) revealed significant overheating during summertime in both the unoccupied and occupied flats. The bedrooms insulated with Thcp in the unoccupied flats (no natural ventilation and internal gains), HE% was 38.0% in Yichun (IA sub-region), 52.7% in Harbin (IB sub-region), 53.6% in Shenyang (IC sub-region), 62.2% in Dalian (IIA sub-region) and 84.6% in Beijing (IIB sub-region). In the bedrooms insulated with Thcp of the flats under the condition of night ventilation, HE% was 9.9%, 28.6%, 39.3%, 55.4% and 78.5% in Yichun, Harbin, Shenyang, Dalian and Beijing, respectively. Although ventilation during the night can significantly reduce overheating hours in the occupied flats, it was difficult to satisfy CIBSE Guide A in all the cities, except Yichun (IA sub-region).
- (2)
- Based on the simulation results over recent 15 years, increased insulation significantly exacerbates overheating in these regions during summer. Under the condition of no natural ventilation, the overheating durations of the bedrooms constructed with current standard values of insulation (namely Thcp) were increased by 22.5% in Yichun, 16.6% in Harbin, 20.3% in Shenyang, 11.8% in Dalian and 6.9% in Beijing compared to the uninsulated ones; in the living rooms, overheating hours increased by 35.3%, 52.0%, 60.0%, 22.4% and 8.3%, respectively.
- (3)
- Although the overall overheating duration in the insulated flats was prolonged, thermal insulation can provide heat resilience and result in the indoor operative temperature fluctuating within a narrower range, compared to the uninsulated flats. In the insulated dwellings, the indoor temperature was lower than that in uninsulated ones when exposed to the highest exterior temperature (as in June), and an overall warmer indoor environment was achieved during the colder months (such as September). Furthermore, some building regulations or measures have been recommended for summer heat protection, such as ventilation and shading. It is suggested that a balance be struck in building design between summer heat protection and winter heating.
Author Contributions
Conceptualization, Y.S. and R.B.; methodology, R.B.; software, Y.X. and R.B.; validation, R.B.; formal analysis, Y.S. and R.B.; investigation, W.-S.C.; resources, H.G.; data curation, R.B.; writing—original draft preparation, R.B.; writing—review and editing, H.G. and R.B.; visualization, R.B. and Y.Y.; supervision, Y.S. and W.-S.C.; project administration, H.G. and W.-S.C.; funding/acquisition, H.G. All authors have read and agreed to the published version of the manuscript.
Funding
This research was funded by National Natural Science Foundation of China, grant number 52078153 and Heilongjiang Provincial Natural Science Foundation of China, grant number LH2019E110.
Institutional Review Board Statement
Not applicable.
Informed Consent Statement
Not applicable.
Data Availability Statement
Not applicable.
Conflicts of Interest
The authors declare no conflict of interest.
References
- Schaeffer, R.; Szklo, A.S.; de Lucena, A.F.P.; Borba, B.S.M.C.; Nogueira, L.P.P.; Fleming, F.P.; Troccoli, A.; Harrison, M.; Boulahya, M.S. Energy sector vulnerability to climate change: A review. Energy 2012, 38, 1–12. [Google Scholar] [CrossRef]
- Lucon, O.E.A. Buildings in Climate Change 2014: Mitigation of Climate Change. Contribution of Working Group III to the Fifth Assessment Report of the Intergovernmental Panel on Climate Change; Cambridge University Press: Cambridge, UK, 2014; pp. 1–68. [Google Scholar]
- IEA. Global Status Report for Buildings and Construction 2019. IEA: Paris, France, 2019. Available online: https://www.iea.org/reports/global-status-report-for-buildings-and-construction-2019 (accessed on 5 December 2019).
- IEA. Transition to Sustainable Buildings. IEA: Paris, France, 2013. Available online: https://www.iea.org/reports/transition-to-sustainable-buildings (accessed on 11 July 2013).
- Lomas, K.J.; Porritt, S.M. Overheating in buildings: Lessons from research. Build. Res. Inf. 2017, 45, 1–18. [Google Scholar] [CrossRef] [Green Version]
- Zanobetti, A.; O’Neill, M.S.; Gronlund, C.J.; Schwartz, J.D. Summer temperature variability and long-term survival among elderly people with chronic disease. Proc. Natl. Acad. Sci. USA 2012, 109, 6608–6613. [Google Scholar] [CrossRef] [Green Version]
- Zheng, G.Z.; Li, K.; Wang, Y.J. The Effects of High-Temperature Weather on Human Sleep Quality and Appetite. Int. J. Environ. Res. Public Health 2019, 16, 270. [Google Scholar] [CrossRef] [PubMed] [Green Version]
- Ban, J.; Xu, D.D.; He, M.Z.; Sun, Q.H.; Chen, C.; Wang, W.T.; Zhu, P.F.; Li, T.T. The effect of high temperature on cause-specific mortality: A multi-county analysis in China. Environ. Int. 2017, 106, 19–26. [Google Scholar] [CrossRef] [PubMed] [Green Version]
- Abrahamson, V.; Wolf, J.; Lorenzoni, I.; Fenn, B.; Kovats, S.; Wilkinson, P.; Adger, W.N.; Raine, R. Perceptions of heatwave risks to health: Interview-based study of older people in London and Norwich, UK. J. Public Health 2009, 31, 119–126. [Google Scholar] [CrossRef] [Green Version]
- Akimoto, T.; Tanabe, S.-I.; Yanai, T.; Sasaki, M. Thermal comfort and productivity-Evaluation of workplace environment in a task conditioned office. Build. Environ. 2010, 45, 45–50. [Google Scholar] [CrossRef]
- Mendell, M.J.; Heath, G.A. Do indoor pollutants and thermal conditions in schools influence student performance? A critical review of the literature. Indoor Air 2005, 15, 27–52. [Google Scholar] [CrossRef]
- Fan, J.L.; Hu, J.W.; Zhang, X. Impacts of climate change on electricity demand in China: An empirical estimation based on panel data. Energy 2019, 170, 880–888. [Google Scholar] [CrossRef]
- Zhou, Y.Y.; Eom, J.; Clarke, L. The effect of global climate change, population distribution, and climate mitigation on building energy use in the US and China. Clim. Chang. 2013, 119, 979–992. [Google Scholar] [CrossRef]
- Pathan, A.; Mavrogianni, A.; Summerfield, A.; Oreszczyn, T.; Davies, M. Monitoring summer indoor overheating in the London housing stock. Energy Build. 2017, 141, 361–378. [Google Scholar] [CrossRef]
- Lomas, K.J.; Watson, S.; Allinson, D.; Fateh, A.; Beaumont, A.; Allen, J.; Foster, H.; Garrett, H. Dwelling and household characteristics’ influence on reported and measured summertime overheating: A glimpse of a mild climate in the 2050’s. Build. Environ. 2021, 201, 107986. [Google Scholar] [CrossRef]
- Gupta, R.; Howard, A.; Davies, M.; Mavrogianni, A.; Tsoulou, I.; Jain, N.; Oikonomou, E.; Wilkinson, P. Monitoring and modelling the risk of summertime overheating and passive solutions to avoid active cooling in London care homes. Energy Build. 2021, 252, 111418. [Google Scholar] [CrossRef]
- Sun, Y.; Zhang, X.B.; Ding, Y.H.; Chen, D.L.; Qin, D.H.; Zhai, P.M. Understanding human influence on climate change in China. Natl. Sci. Rev. 2022, 9, nwab113. [Google Scholar] [CrossRef] [PubMed]
- Guo, H.B.; Huang, L.; Song, W.J.; Wang, X.Y.; Wang, H.N.; Zhao, X.N. Evaluation of the Summer Overheating Phenomenon in Reinforced Concrete and Cross Laminated Timber Residential Buildings in the Cold and Severe Cold Regions of China. Energies 2020, 13, 6305. [Google Scholar] [CrossRef]
- Wang, R.; Lu, S.L.; Feng, W.; Xu, B.W. Tradeoff between heating energy demand in winter and indoor overheating risk in summer constrained by building standards. Build. Simul. 2021, 14, 987–1003. [Google Scholar] [CrossRef]
- Dengel, A.; Swainson, M.; Staff, B.T.; Staff, N.F. Overheating in New Homes: A Review of the Evidence; Building Research Establishment: Waterford, UK, 2012. [Google Scholar]
- Lomas, K.J.; Kane, T. Summertime temperatures and thermal comfort in UK homes. Build. Res. Inf. 2013, 41, 259–280. [Google Scholar] [CrossRef] [Green Version]
- Van Hooff, T.; Blocken, B.; Hensen, J.L.M.; Timmermans, H.J.P. On the predicted effectiveness of climate adaptation measures for residential buildings. Build. Environ. 2014, 82, 300–316. [Google Scholar] [CrossRef]
- Mavrogianni, A.; Wilkinson, P.; Davies, M.; Biddulph, P.; Oikonomou, E. Building characteristics as determinants of propensity to high indoor summer temperatures in London dwellings. Build. Environ. 2012, 55, 117–130. [Google Scholar] [CrossRef] [Green Version]
- Vandentorren, S.; Bretin, P.; Zeghnoun, A.; Mandereau-Bruno, L.; Croisier, A.; Cochet, C.; Ribéron, J.; Siberan, I.; Declercq, B.; Ledrans, M. August 2003 Heat Wave in France: Risk Factors for Death of Elderly People Living at Home. Eur. J. Public Health 2006, 16, 583–591. [Google Scholar] [CrossRef] [Green Version]
- Fosas, D.; Coley, D.A.; Natarajan, S.; Herrera, M.; de Pando, M.F.; Ramaho-Gonzalez, A. Mitigation versus adaptation: Does insulating dwellings increase overheating risk? Build. Environ. 2018, 143, 740–759. [Google Scholar] [CrossRef]
- Chvatal, K.M.S.; Corvacho, H. The impact of increasing the building envelope insulation upon the risk of overheating in summer and an increased energy consumption. J. Build. Perform. Simul. 2009, 2, 267–282. [Google Scholar] [CrossRef]
- Makantasi, A.M.; Mavrogianni, A. Adaptation of London’s social housing to climate change through retrofit: A holistic evaluation approach. Adv. Build. Energy Res. 2016, 10, 99–124. [Google Scholar] [CrossRef]
- Elsharkawy, H.; Zahiri, S. The significance of occupancy profiles in determining post retrofit indoor thermal comfort, overheating risk and building energy performance. Build. Environ. 2020, 172, 106676. [Google Scholar] [CrossRef]
- McLeod, R.S.; Hopfe, C.J.; Kwan, A. An investigation into future performance and overheating risks in Passivhaus dwellings. Build. Environ. 2013, 70, 189–209. [Google Scholar] [CrossRef] [Green Version]
- Ameur, M.; Kharbouch, Y.; Mimet, A. Optimization of passive design features for a naturally ventilated residential building according to the bioclimatic architecture concept and considering the northern Morocco climate. Build. Simul. 2020, 13, 677–689. [Google Scholar] [CrossRef]
- Hamdy, M.; Carlucci, S.; Hoes, P.J.; Hensen, J.L.M. The impact of climate change on the overheating risk in dwellings-A Dutch case study. Build. Environ. 2017, 122, 307–323. [Google Scholar] [CrossRef]
- Schunemann, C.; Schiela, D.; Ortlepp, R. How window ventilation behaviour affects the heat resilience in multi-residential buildings. Build. Environ. 2021, 202, 16. [Google Scholar] [CrossRef]
- Heracleous, C.; Michael, A. Assessment of overheating risk and the impact of natural ventilation in educational buildings of Southern Europe under current and future climatic conditions. Energy 2018, 165, 1228–1239. [Google Scholar] [CrossRef]
- Jimenez-Bescos, C. An Evaluation of the Combined Effect of Window Shading and Thermal Mass to Reduce Overheating. In Proceedings of the 9th International Cold Climate Conference (HVAC), Kiruna, Sweden, 12–15 March 2018; pp. 637–644. [Google Scholar]
- JGJ 26-2018; Design Standard for Energy Efficiency of Residential Buildings in Severe Cold and Cold Zones. Ministry of Housing and Urban-Rural Development of the People’s Republic of China: Beijing, China, 2018.
- GB/T51350-2019; Technical Standard for Nearly Zero Energy Building. Ministry of Housing and Urban-Rural Development of the People’s Republic of China: Beijing, China, 2019.
- GB 50176-2016; Code for Thermal Design of Civil Buildings. Ministry of Housing and Urban-Rural Development of the People’s Republic of China: Beijing, China, 2016.
- Hall, I.J.; Laboratories, S.N. Generation of Typical Meteorological Years for 26 SOLMET Stations; Sandia Laboratories: Albuquerque, NM, USA, 1978.
- GB 50736-2012; Design Code for Heating, Ventilation and Air-Conditioning of Civil Buildings. Ministry of Housing and Urban-Rural Development of the People’s Republic of China: Beijing, China, 2012.
- CIBSE. Guide A Environmental Design, 2015 Edition. Available online: http://www.cibse.org/knowledge/cibse-guide/cibse-guide-a-environmental-design-new-2015 (accessed on 22 June 2016).
- Symonds, P.; Taylor, J.; Mavrogianni, A.; Davies, M.; Shrubsole, C.; Hamilton, I.; Chalabi, Z. Overheating in English dwellings: Comparing modelled and monitored large-scale datasets. Build. Res. Inf. 2017, 45, 195–208. [Google Scholar] [CrossRef]
- Baborska-Narożny, M.; Stevenson, F.; Grudzińska, M. Overheating in retrofitted flats: Occupant practices, learning and interventions. Build. Res. Inf. 2017, 45, 40–59. [Google Scholar] [CrossRef] [Green Version]
- Mavrogianni, A.; Davies, M.; Taylor, J.; Chalabi, Z.; Biddulph, P.; Oikonomou, E.; Das, P.; Jones, B. The impact of occupancy patterns, occupant-controlled ventilation and shading on indoor overheating risk in domestic environments. Build. Environ. 2014, 78, 183–198. [Google Scholar] [CrossRef]
- Peel, M.C.; Finlayson, B.L.; McMahon, T.A. Updated world map of the Koppen-Geiger climate classification. Hydrol. Earth Syst. Sci. 2007, 11, 1633–1644. [Google Scholar] [CrossRef] [Green Version]
- Zhou, M.; Wang, H.; Yang, S.; Fan, K. Influence of springtime North Atlantic Oscillation on crops yields in Northeast China. Clim. Dyn. 2013, 41, 3317–3324. [Google Scholar] [CrossRef]
Publisher’s Note: MDPI stays neutral with regard to jurisdictional claims in published maps and institutional affiliations. |
© 2022 by the authors. Licensee MDPI, Basel, Switzerland. This article is an open access article distributed under the terms and conditions of the Creative Commons Attribution (CC BY) license (https://creativecommons.org/licenses/by/4.0/).